PNCWA Webinar Computerized Maintenance Management Systems ... · PDF fileComputerized...
91
Computerized Maintenance Management Systems (CMMS) Benefits to Smaller Agencies PNCWA Webinar January, 2015
Transcript of PNCWA Webinar Computerized Maintenance Management Systems ... · PDF fileComputerized...
Computerized Maintenance Management Systems (CMMS) Benefits to Smaller Agencies
PNCWA Webinar
January, 2015
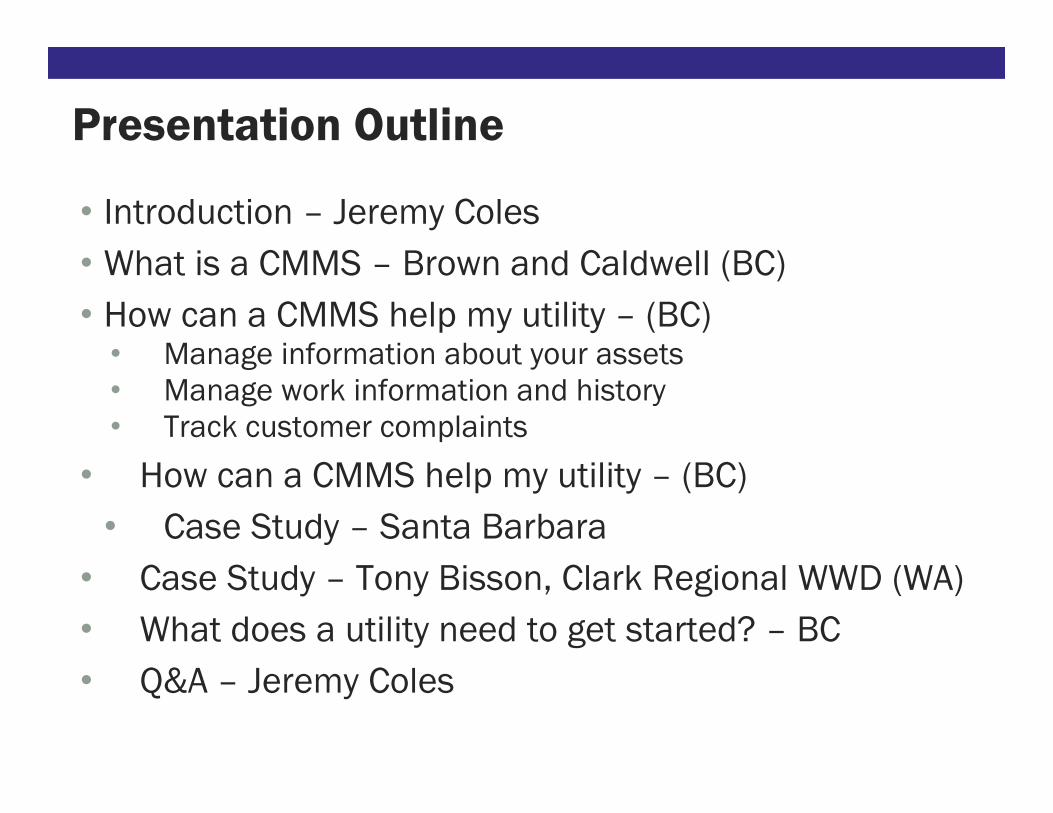
Presentation Outline
• Introduction – Jeremy Coles
• What is a CMMS – Brown and Caldwell (BC)
• How can a CMMS help my utility – (BC)• Manage information about your assets• Manage work information and history• Track customer complaints
• How can a CMMS help my utility – (BC)
• Case Study – Santa Barbara
• Case Study – Tony Bisson, Clark Regional WWD (WA)
• What does a utility need to get started? – BC
• Q&A – Jeremy Coles

Our assets – their ownership and care
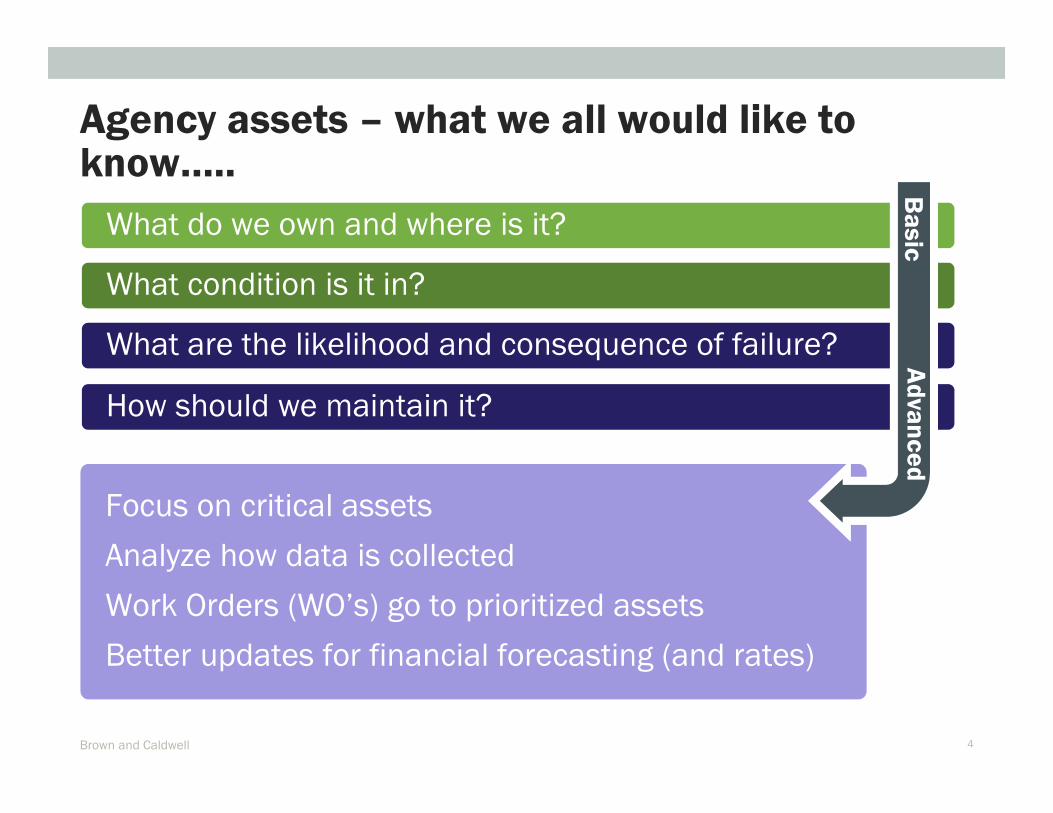
Agency assets – what we all would like to know…..
Brown and Caldwell 4
What are the likelihood and consequence of failure?
What condition is it in?
How should we maintain it?
What do we own and where is it?
Focus on critical assets
Analyze how data is collected
Work Orders (WO’s) go to prioritized assets
Better updates for financial forecasting (and rates)
Ba
sic
Ad
van
ce
d

Why is AM important?........without it the owner could be:
Brown and Caldwell 5
Over/under-charging rate-
payers
Not have enough $$ for replacements
Not saving enough $$ for maintenance
Putting level of service (LOS) at risk
(e.g. boil notice)
Operating inefficiently
Brown and Caldwell 6
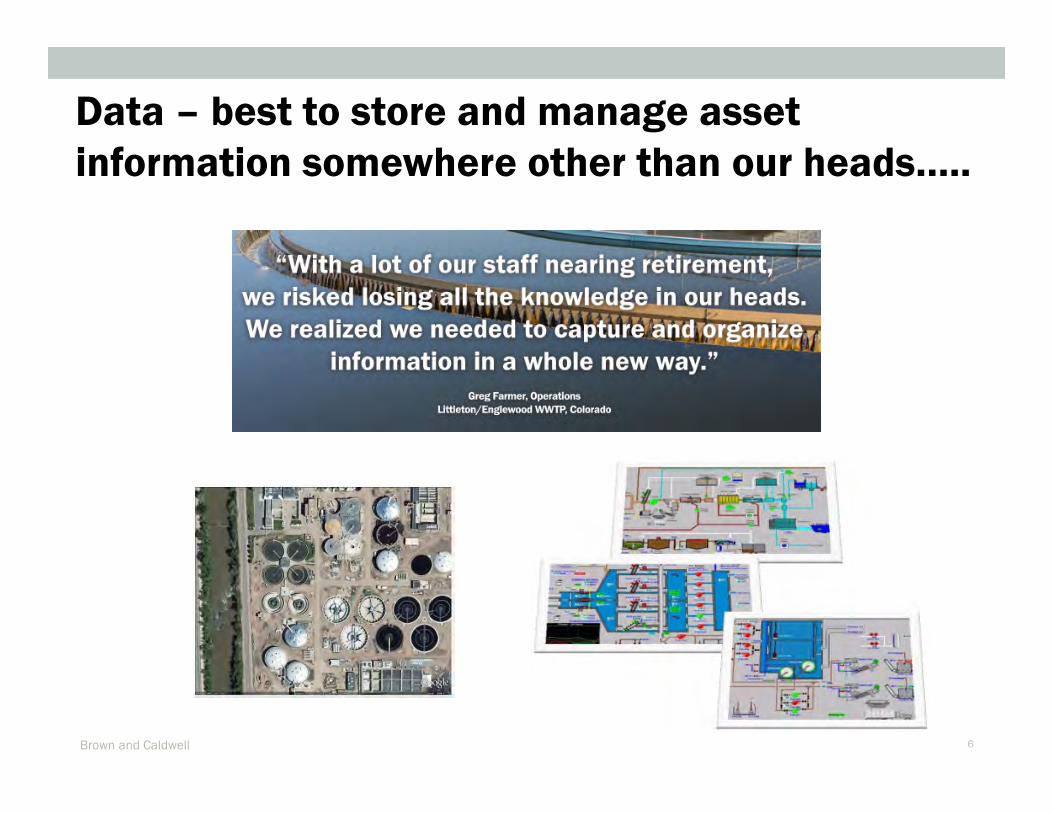
Data – best to store and manage asset
information somewhere other than our heads…..

• Operational optimization Operational optimization Operational optimization Operational optimization – timely, cost-effective, reliable operations (efficient work, right time)
• Infrastructure stability Infrastructure stability Infrastructure stability Infrastructure stability – High service level, low cost, reliable/low risk water delivery
• Measurement and continuous Measurement and continuous Measurement and continuous Measurement and continuous improvementimprovementimprovementimprovement
Goals (Purpose) for AM Program
Brown and Caldwell 7
From “Effective Utility Management, a Primer for Water and Wastewater Utilities”

A software package designed to manage manage manage manage high volumeshigh volumeshigh volumeshigh volumes of asset information
Brown and Caldwell 8
What is a CMMS system?
• Data Driven• Houses the asset register
• Detailed information Detailed information Detailed information Detailed information about an agencies assets (size, HP, condition etc.)
• Schedule and history of the work performed on those work performed on those work performed on those work performed on those assetsassetsassetsassets
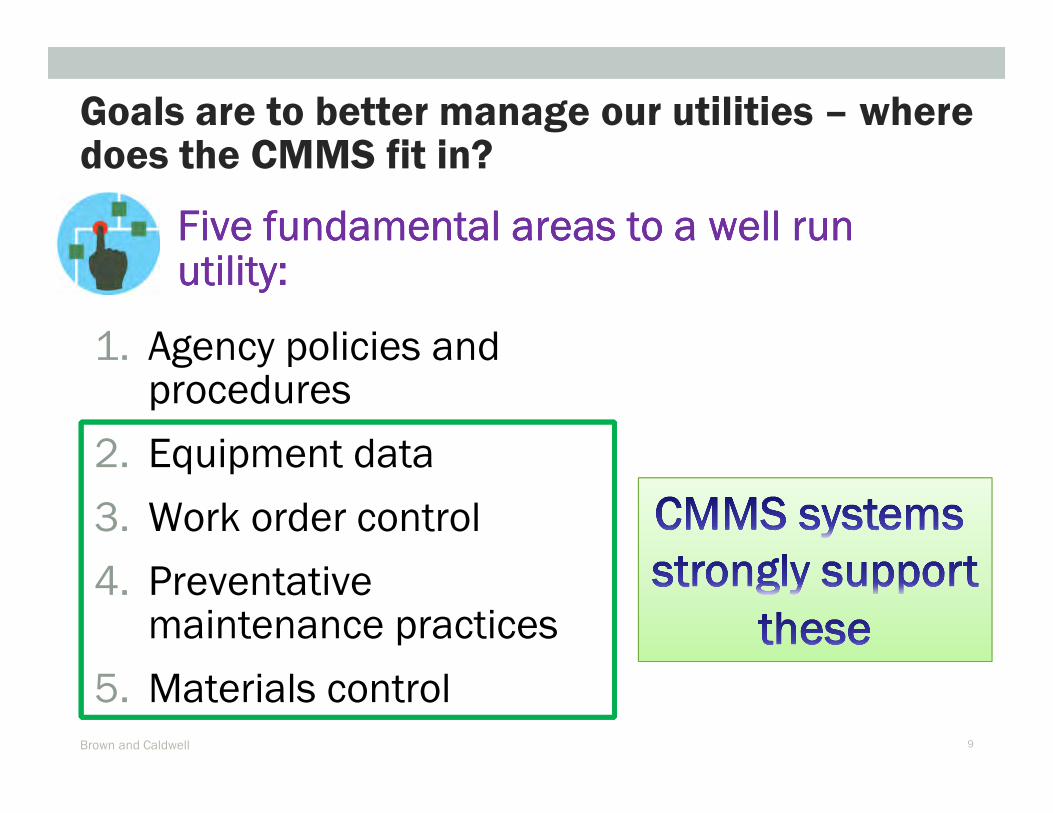
Five fundamental areas to a well run Five fundamental areas to a well run Five fundamental areas to a well run Five fundamental areas to a well run utility:utility:utility:utility:
Brown and Caldwell 9
Goals are to better manage our utilities – where does the CMMS fit in?
1. Agency policies and procedures
2. Equipment data
3. Work order control
4. Preventative maintenance practices
5. Materials control

The “What and When”The “What and When”The “What and When”The “What and When”
Brown and Caldwell 10
CMMS systems - manage the detail of both assets and the work performed
• Detailed asset inventoryDetailed asset inventoryDetailed asset inventoryDetailed asset inventory
• Maintenance history
• Maintenance and budget planning toolplanning toolplanning toolplanning tool
• Generates reports
• DynamicDynamicDynamicDynamic/transactional
• What you own, what you’ve done, What you own, what you’ve done, What you own, what you’ve done, What you own, what you’ve done, what you have to dowhat you have to dowhat you have to dowhat you have to do

How can a CMMS help my utility?

Even the smallest agencies can have thousands of assets worth hundreds of millions of $$$
Brown and Caldwell 12

Asset ID
Asset Name
Type
Description/Function
Design Type
Design Voltage
Phase
Rated AMPs
HP
Watt/KW
RPM
Service Factor
Efficiency
Power Factor
Thermal Protection
Y/N
Ambient Temperature (Max.)
Design Code
NEMA Insulation Class
Frame number
Drive End Bearing #
Non Drive End Bearing #
Serial number
Model number
Size
Frame number
Month/Year Manufactured
Failure Analysis
Included in Criticality Model?
Y/N
Drive End Bearing
Bearing manufacturer
Drive End Bearing
Bearing number
Opposite Drive End Bearing
Bearing manufacturer
Opposite Drive End Bearing
Bearing number
Owner
Installation Cost
Purchase Cost
Purchase date
Expected life (years)
Mean Time Between Failure - Hours
Average Monthly Use - Hours
Total Usage - Hours
Each individual asset has it’s own set of detailed information
WARRANTY INFORMATION
Shipping date
WARRANTY INFORMATION
Startup date
WARRANTY INFORMATION
Effective date
WARRANTY INFORMATION
Duration (months) 100%
WARRANTY INFORMATION
Expiration date
WARRANTY INFORMATION
Duration for reduced coverage
WARRANTY INFORMATION
Duration for reduced coverage #2
WARRANTY INFORMATION
(Warranty PDF)
WARRANTY INFORMATION
Comments
LOCATION INFORMATION
Address
LOCATION INFORMATION
City, ST, Zip
LOCATION INFORMATION
Location
LOCATION INFORMATION
Area #
LOCATION INFORMATION
Sub - Area
LOCATION INFORMATION
Room
LOCATION INFORMATION
Level
LOCATION INFORMATION
Direction
LOCATION INFORMATION
GPS - Latitude
LOCATION INFORMATION
GPS - Longitude
MANUFACTURER
MANUFACTURER
Address
MANUFACTURER
City, ST, Zip
MANUFACTURER
Phone #
MANUFACTURER
Fax #
MANUFACTURER
MANUFACTURER
Web site
VENDOR
VENDOR
Address
VENDOR
City, ST, Zip
VENDOR
Phone #
VENDOR
Fax #
VENDOR
VENDOR
Web site
Notes
Brown and Caldwell 13

All of that asset information can live in many different places…..(or not be captured at all)
Brown and Caldwell 14
Financial
Data
(Oracle)
Vertical Asset
Inventory
(Maximo)
Linear Asset
Inventory
(GIS)
Condition Data
(Historical
Evaluation)
Supplemental
Data
Sources
Institutional
memory (risky
data sources)
Senior staff
knowledge
Random
spreadsheets
Old paper sources
Ideal location
for detailed
asset data and
work history
Brown and Caldwell 15
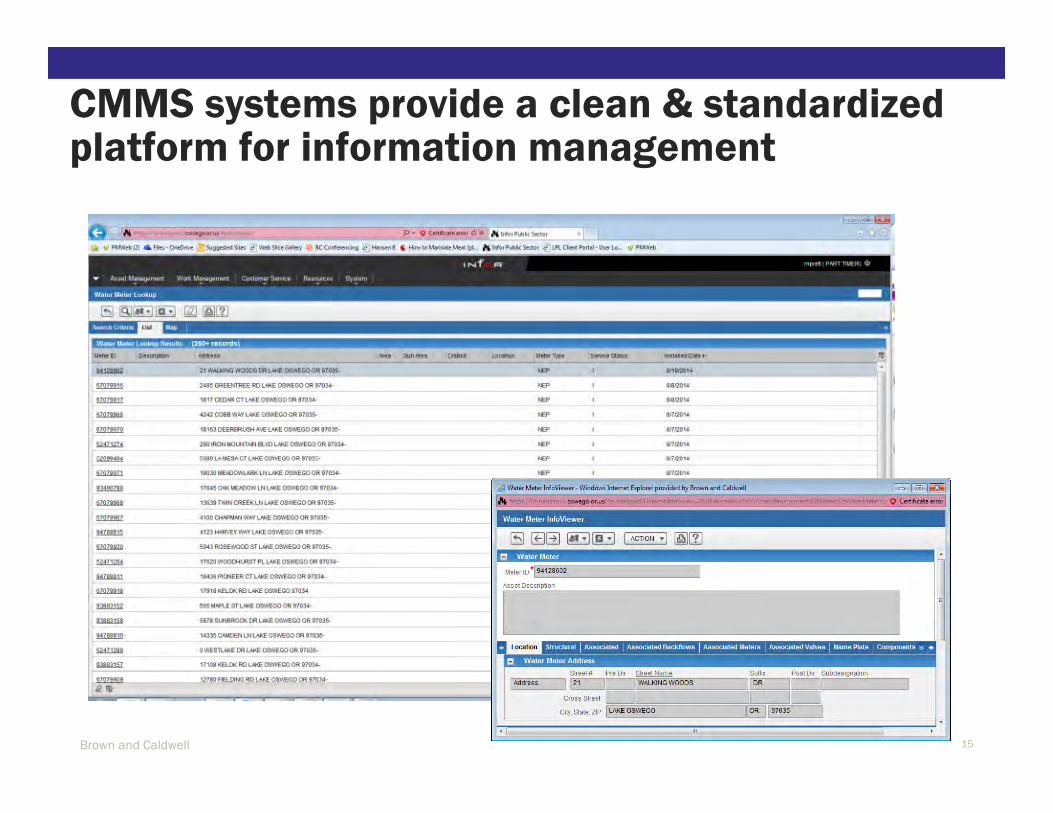
CMMS systems provide a clean & standardized platform for information management

Houses asset data
Scheduling & executing WO’s
Transaction history
Comparative reporting
R&R Planning
Replacement
CMMS can track the full life of each asset and report on it (and across all assets)

If my CMMS was fully populated with asset and work information benefits can include…
Brown and Caldwell 17
Easier to find information gaps
Can report across groups of assets
streamline and focus work management
systematically prioritize work and record work history
Good data to other systems
(e.g. financial or HR/staffing
Brown and Caldwell 18
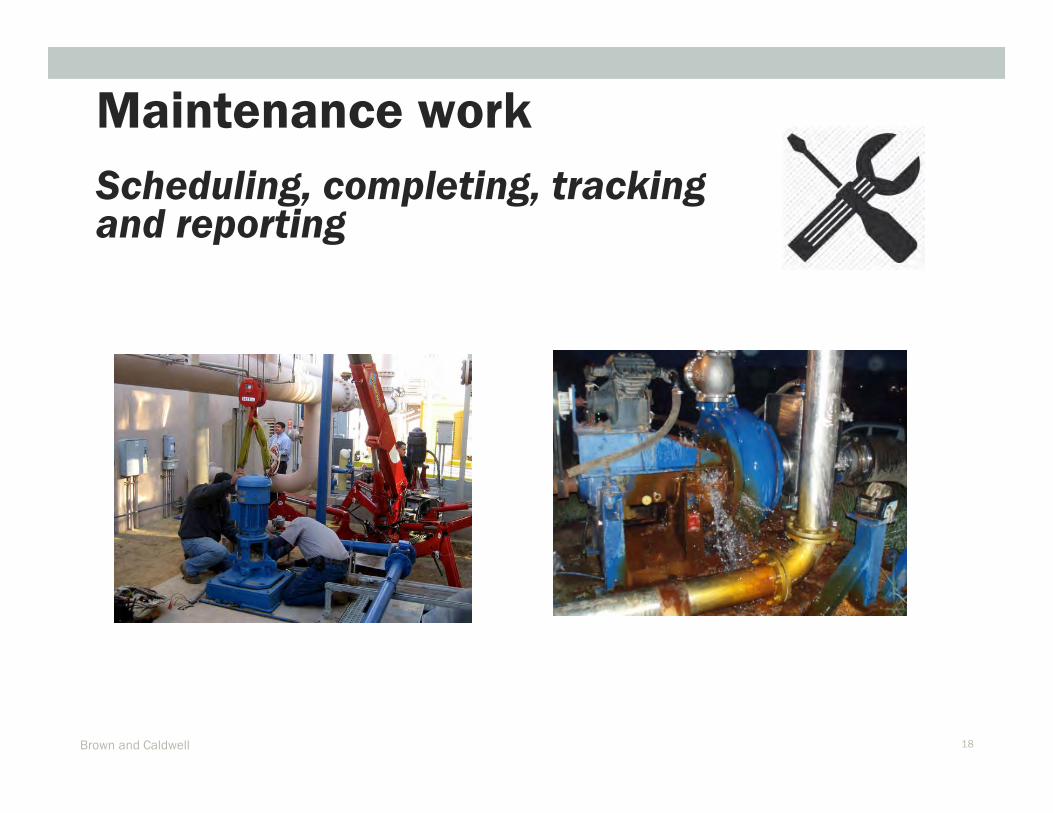
Maintenance work
Scheduling, completing, tracking and reporting
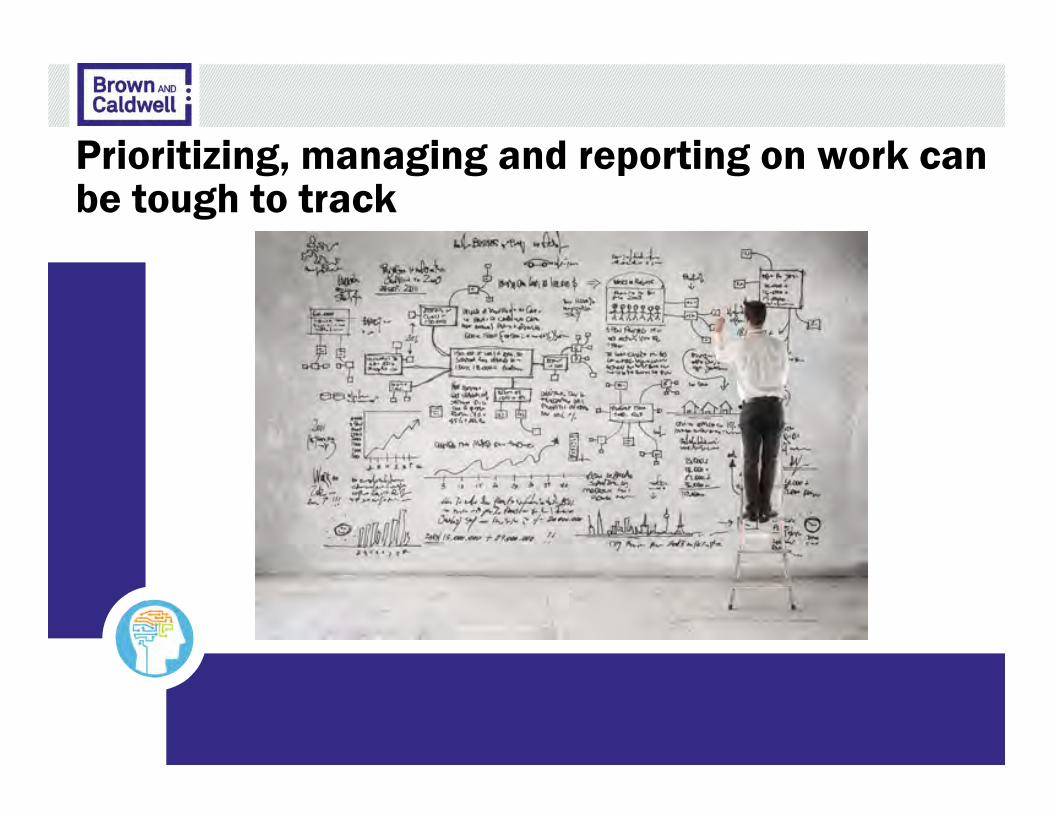
Prioritizing, managing and reporting on work can be tough to track

• Preventative Maintenance (PM’s)
• Corrective Maintenance (CM’s)
• Predictive Maintenance (PDM’s)
• Emergencies (out of service/shut-downs etc.)
• Want to comply with warranties and perform the RIGHT amount of maintenance over the asset life-cycle
CMMS systems help organize work management (and show trends)
Brown and Caldwell 20

CMMS - Planning, tracking and executing PM’s (warranty and beyond)
Brown and Caldwell 21

CMMS systems provide a vehicle for work structure including schedules, prompts etc.
R&
R P
rogr
am
Max
imo
Up
grad
e P
rogr
am
Ca
pit
al I
mp
rove
men
t
Pro
gra
ms
Op
erat
ions
and
Mai
nten
ance
Recommend asset
classes to collect
condition data
Database
automatically pulls
CA info from Maximo
Record data in
Maximo
Maximo pulls recs,
creates Work Orders
based on prioritized
Recs
Review Maximo Work
Order processes and
recommend
changes*
O&M work focuses
on improving data on
critical assets
Collect and review
existing data
Review existing
maintenance
business process
and recommend
changes*
Bundled rehab
projects
Perform fieldwork
* This is an ongoing process that will take several iterations before the process changes are made
Recs made for O&M
and CIP
Contractor performs
work, submits data
Identify critical
assets and
maintenance
strategies
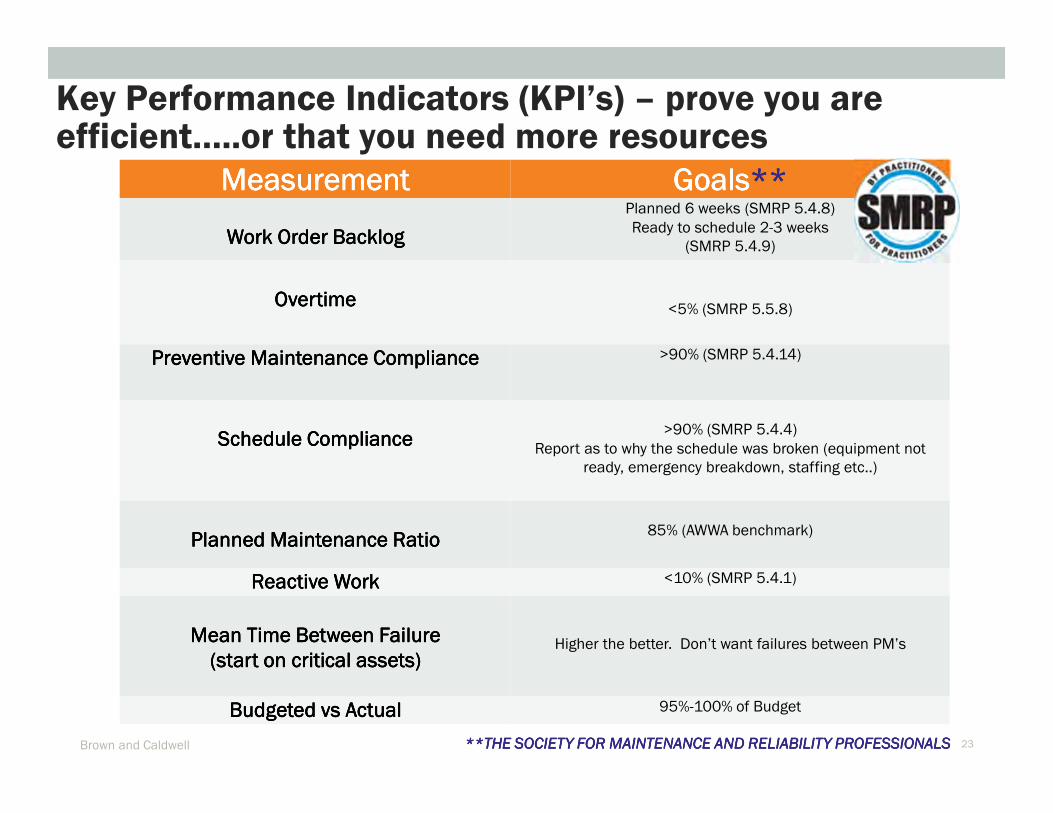
Key Performance Indicators (KPI’s) – prove you are efficient…..or that you need more resources
Brown and Caldwell 23
Measurement Measurement Measurement Measurement GoalsGoalsGoalsGoals********
Work Work Work Work Order BacklogOrder BacklogOrder BacklogOrder Backlog
Planned 6 weeks (SMRP 5.4.8)
Ready to schedule 2-3 weeks
(SMRP 5.4.9)
Overtime Overtime Overtime Overtime <5% (SMRP 5.5.8)
Preventive Maintenance CompliancePreventive Maintenance CompliancePreventive Maintenance CompliancePreventive Maintenance Compliance >90% (SMRP 5.4.14)
Schedule Schedule Schedule Schedule ComplianceComplianceComplianceCompliance>90% (SMRP 5.4.4)
Report as to why the schedule was broken (equipment not
ready, emergency breakdown, staffing etc..)
Planned Planned Planned Planned Maintenance RatioMaintenance RatioMaintenance RatioMaintenance Ratio85% (AWWA benchmark)
Reactive WorkReactive WorkReactive WorkReactive Work <10% (SMRP 5.4.1)
Mean Mean Mean Mean Time Between Failure Time Between Failure Time Between Failure Time Between Failure
(start on critical assets)(start on critical assets)(start on critical assets)(start on critical assets)Higher the better. Don’t want failures between PM’s
Budgeted vs ActualBudgeted vs ActualBudgeted vs ActualBudgeted vs Actual 95%-100% of Budget
**THE **THE **THE **THE SOCIETY FOR MAINTENANCE AND RELIABILITY PROFESSIONALSSOCIETY FOR MAINTENANCE AND RELIABILITY PROFESSIONALSSOCIETY FOR MAINTENANCE AND RELIABILITY PROFESSIONALSSOCIETY FOR MAINTENANCE AND RELIABILITY PROFESSIONALS
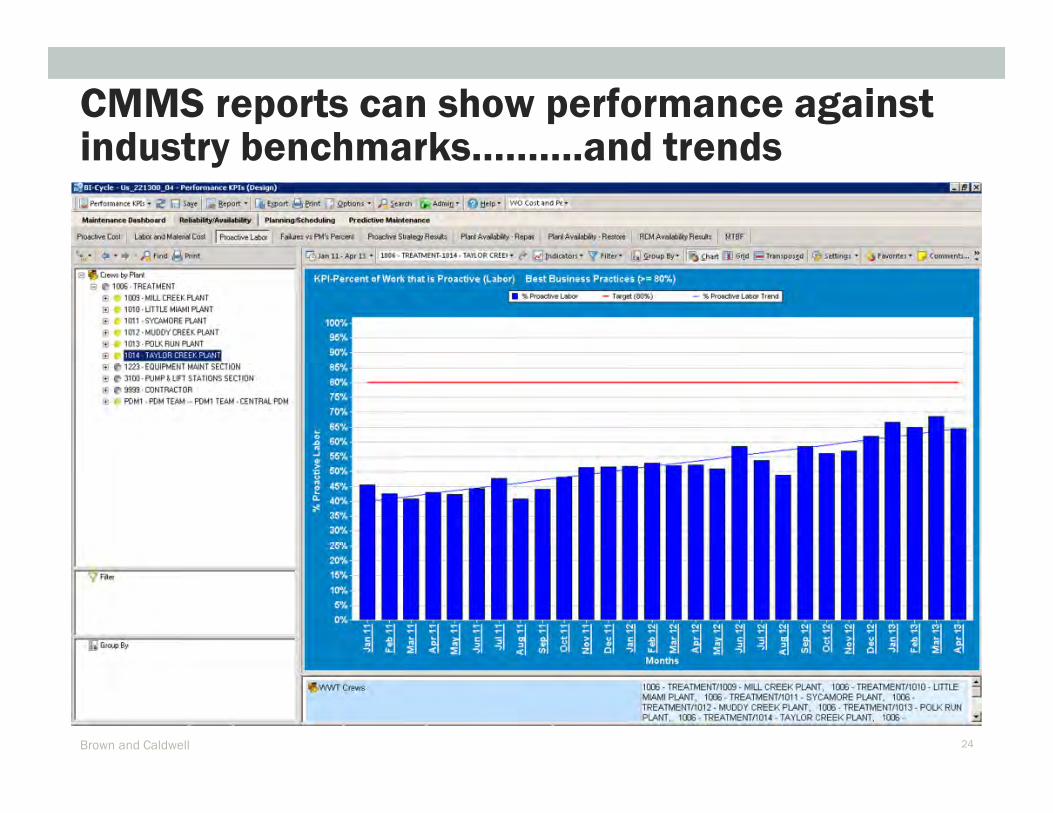
CMMS reports can show performance against industry benchmarks……….and trends
Brown and Caldwell 24
0%
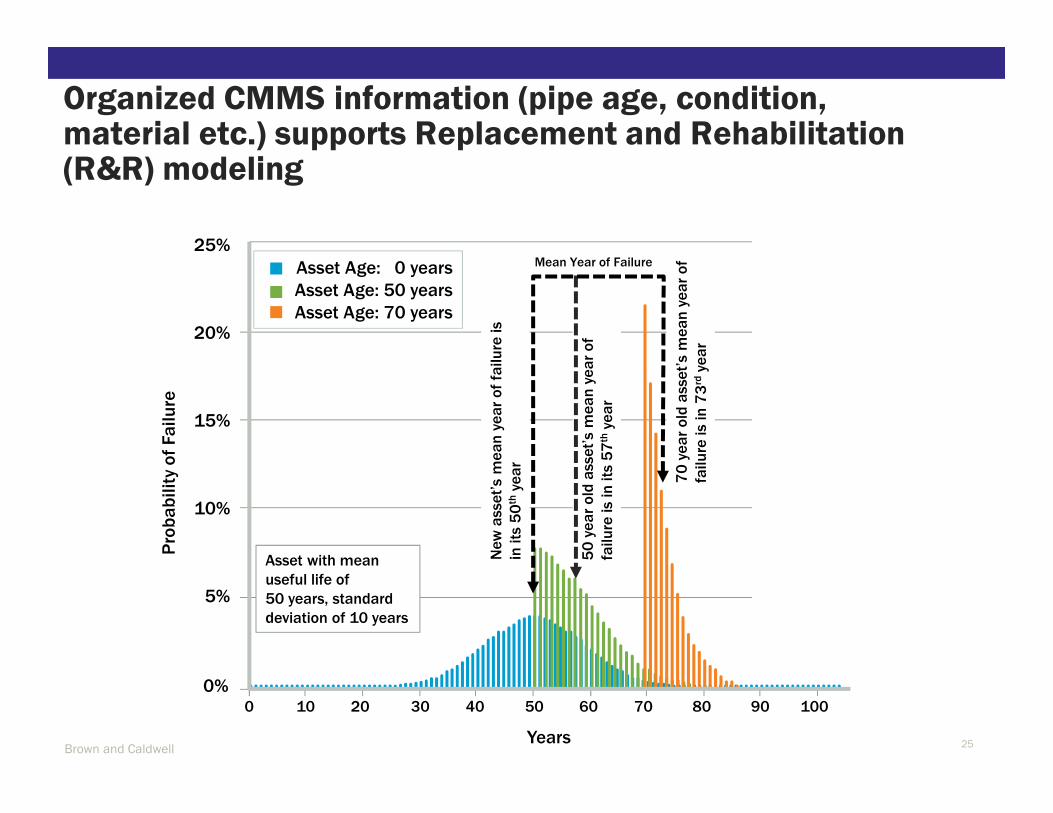
Organized CMMS information (pipe age, condition, material etc.) supports Replacement and Rehabilitation (R&R) modeling
Brown and Caldwell 25
Pro
ba
bilit
y o
f Fa
ilu
re
Years
5%
10%
15%
20%
25%
Asset Age: 0 years
Asset Age: 50 years
Asset Age: 70 years
Mean Year of Failure
Ne
w a
sse
t’s
me
an
ye
ar
of
failu
re is
in its
50
thye
ar
50
ye
ar
old
ass
et’
s m
ea
n y
ea
r o
f
failu
re is
in its
57
thye
ar
Asset with mean
useful life of
50 years, standard
deviation of 10 years
0 10 20 30 40 70 80 90 1006050
70
ye
ar
old
ass
et’
s m
ea
n y
ea
r o
f
failu
re is
in 7
3rd
yea
r
Brown and Caldwell 26
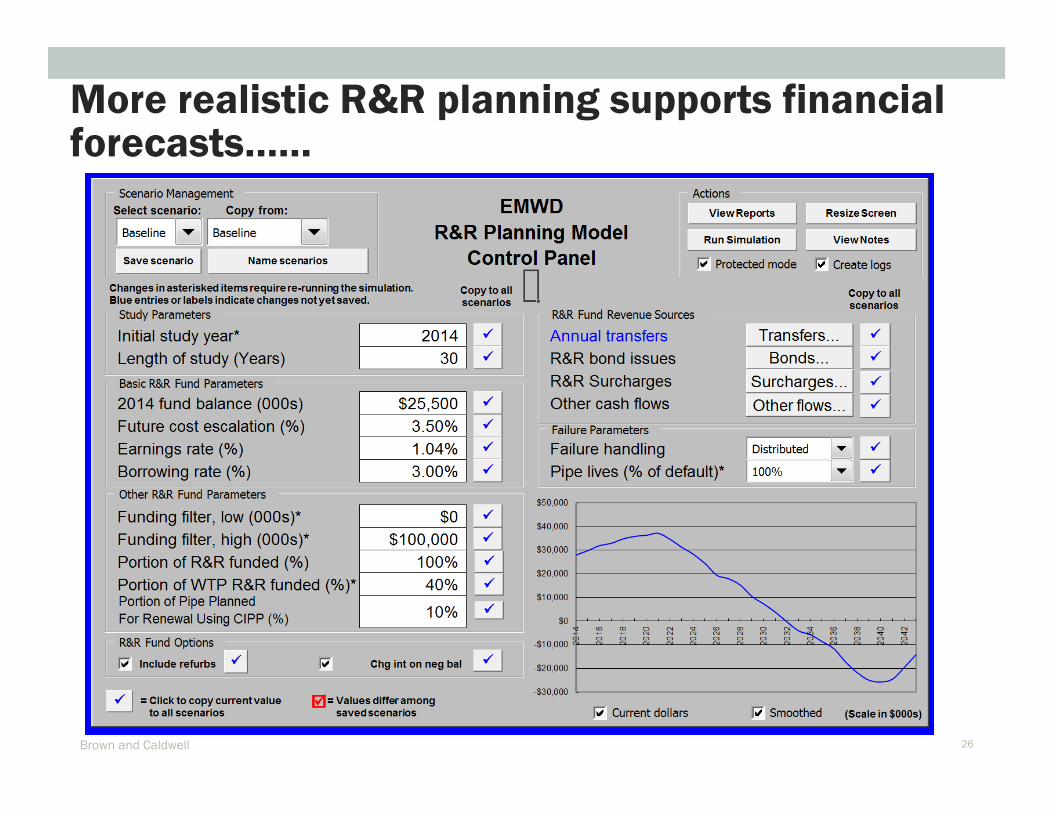
More realistic R&R planning supports financial forecasts……
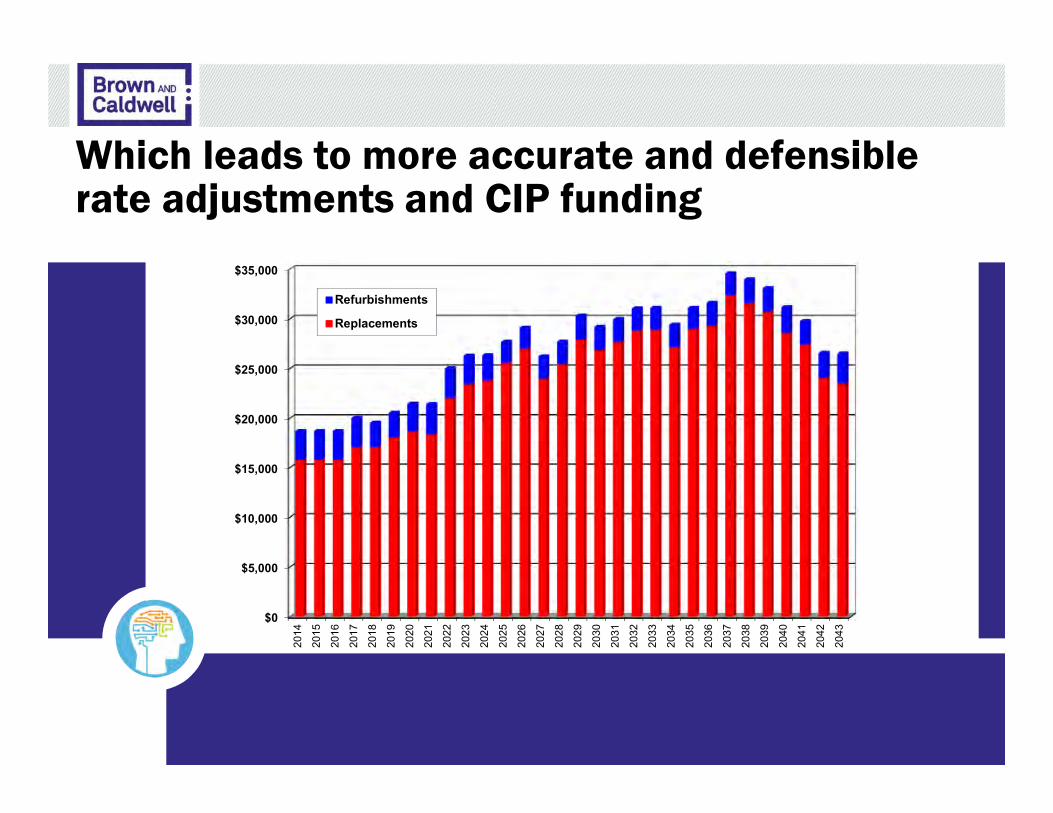
Which leads to more accurate and defensible rate adjustments and CIP funding
$0
$5,000
$10,000
$15,000
$20,000
$25,000
$30,000
$35,000
2014
2015
2016
2017
2018
2019
2020
2021
2022
2023
2024
2025
2026
2027
2028
2029
2030
2031
2032
2033
2034
2035
2036
2037
2038
2039
2040
2041
2042
2043
Refurbishments
Replacements

Opportunity to capitalize on (and quantify) savings
Brown and Caldwell 28
Cost of Service Per Customer
-40%
-35%
-30%
-25%
-20%
-15%
-10%
-5%
0%
5%1990/9
1
1991/9
2
1992/9
3
1993/9
4
1994/9
5
1995/9
6
1996/9
7
1997/9
8
1998/9
9
1999/2
000
2000/2
001
2001/2
002
Australia average:
Savings ~19%
Hunter Water
Savings ~39%

Case Study –Allan Scott –Santa Barbara
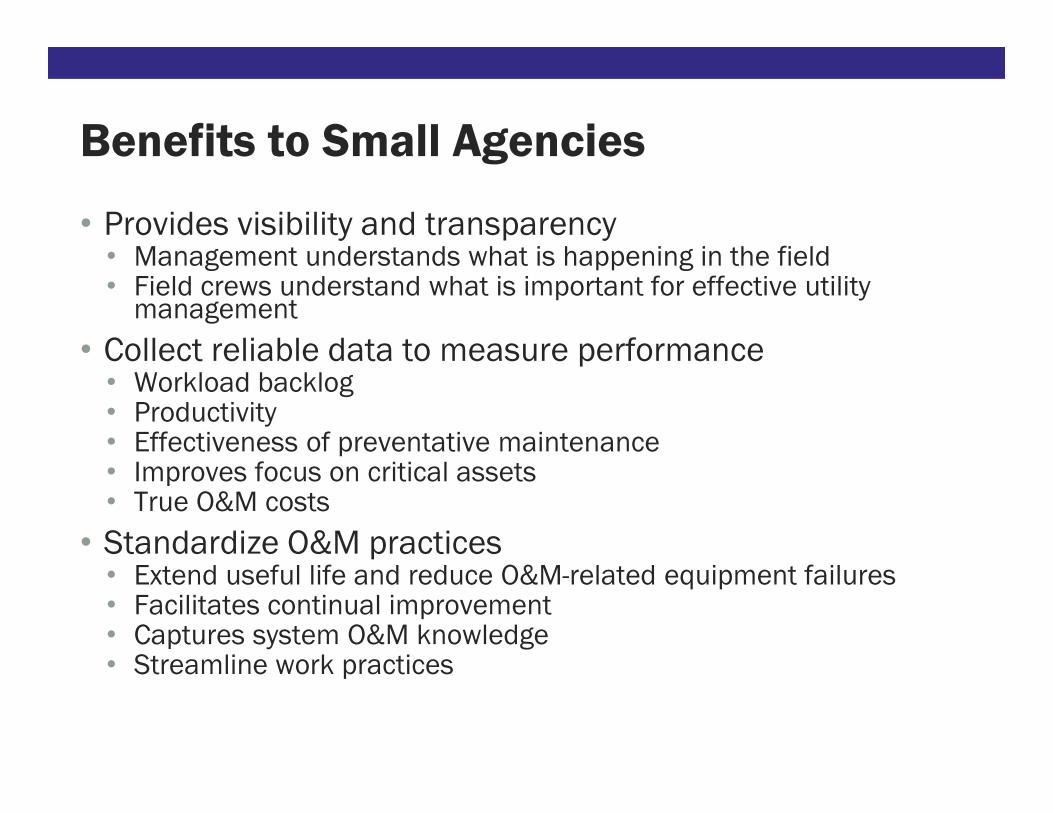
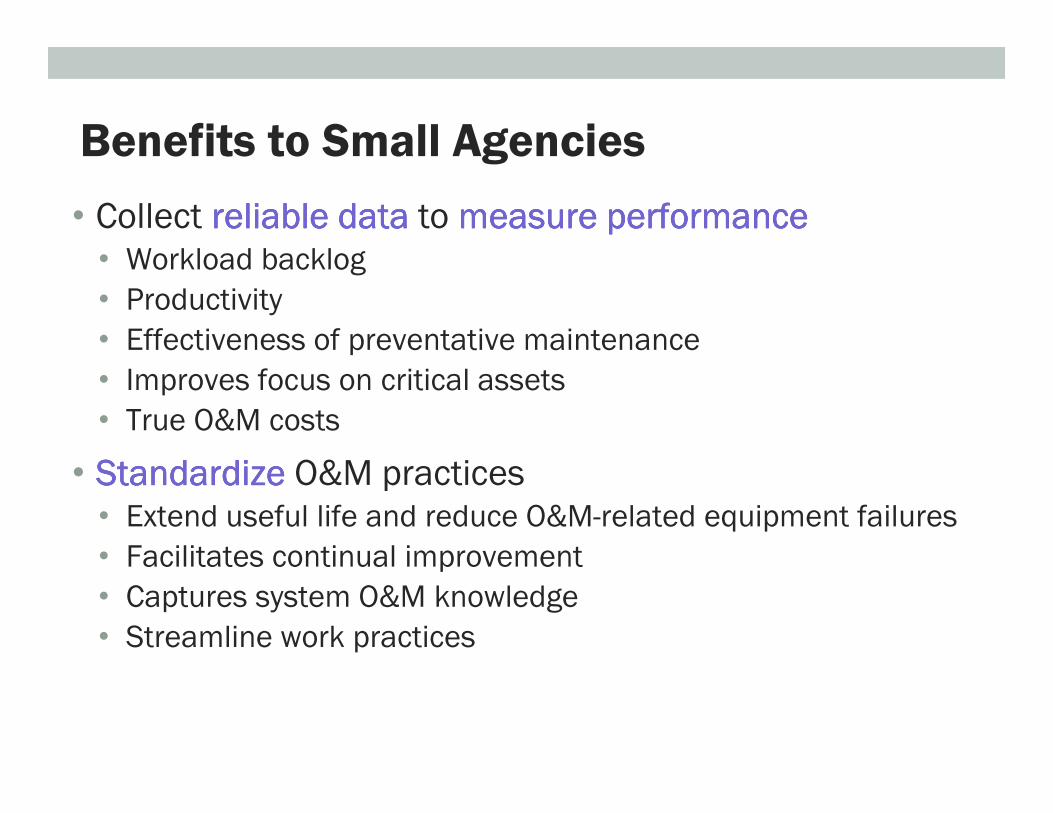
Benefits to Small Agencies
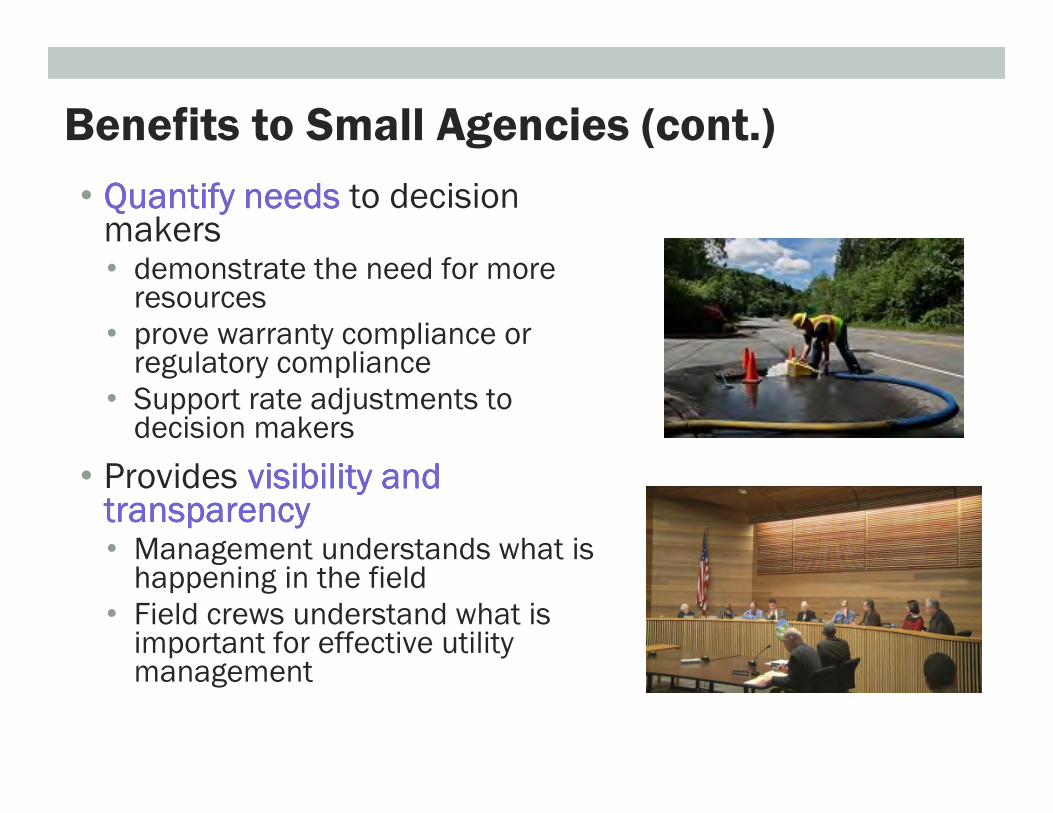
• Provides visibility and transparency• Management understands what is happening in the field• Field crews understand what is important for effective utility
management
• Collect reliable data to measure performance• Workload backlog• Productivity• Effectiveness of preventative maintenance• Improves focus on critical assets• True O&M costs
• Standardize O&M practices• Extend useful life and reduce O&M-related equipment failures• Facilitates continual improvement• Captures system O&M knowledge• Streamline work practices
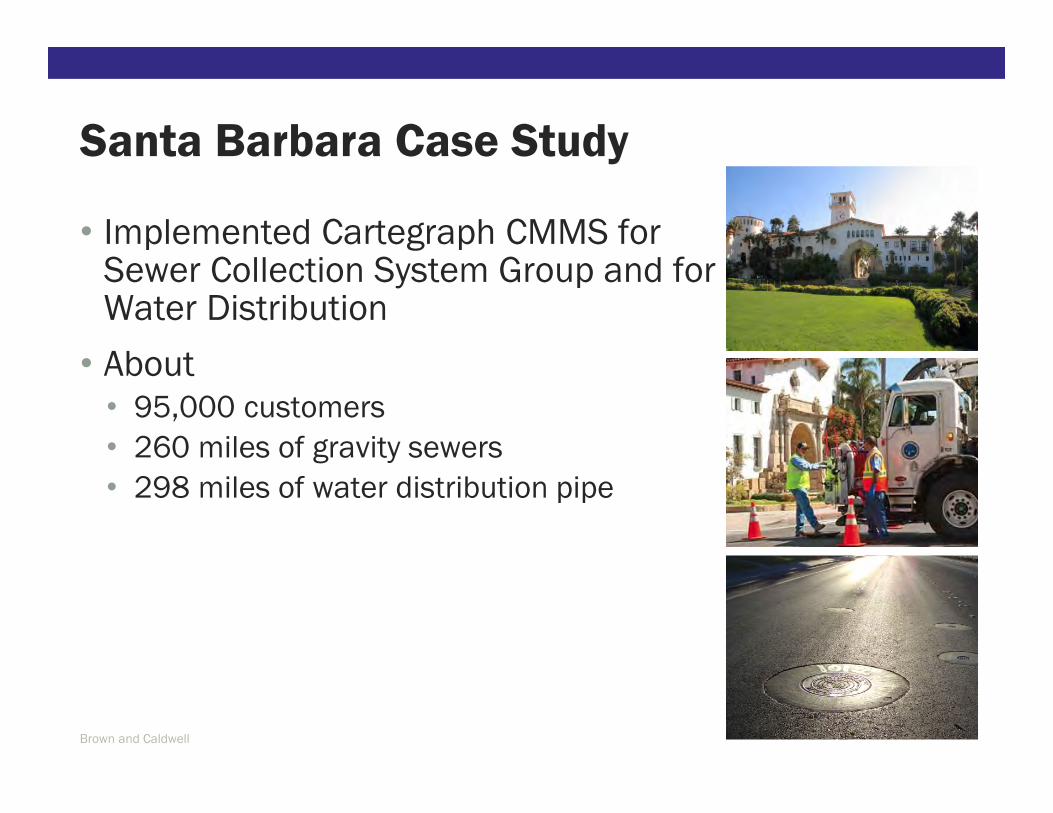
Santa Barbara Case Study
• Implemented Cartegraph CMMS for Sewer Collection System Group and for Water Distribution
• About • 95,000 customers
• 260 miles of gravity sewers
• 298 miles of water distribution pipe
Brown and Caldwell

Key Challenges
• Waste water SSO consent decree requiring increased performance for sewer pipe cleaning and inspection
• Aging water infrastructure and O&M resource limitations raised concerns over effectiveness of O&M program and identification of future needs.

Improve Management
and Operation of
WW Collection
System
Supported by CarteGraph and other technology
systems
Standard Workflows Supported by Technology Helped Santa Barbara Achieve its Goals
Inspection & Cleaning
R&R Planning
SSO Response
Flow Monitoring
FOG
RCM (FM/PS)
Updated SSMP
Aging Infrastructure
Regulatory Requirements
Limited Resources
33Brown and Caldwell

Streamlining Work Practices By Aligning Technology and Data With Efficient Work Processes
Assign basin
Develop map
Plan route
Clean pipes
Record results
Develop results packet
Daily sheet review
Enter Daily Sheet
Cartegraph
Maps
Daily
Sheets
Update schedule
Schedule problem areas
GIS
Manual updates
New work requests
34Brown and Caldwell
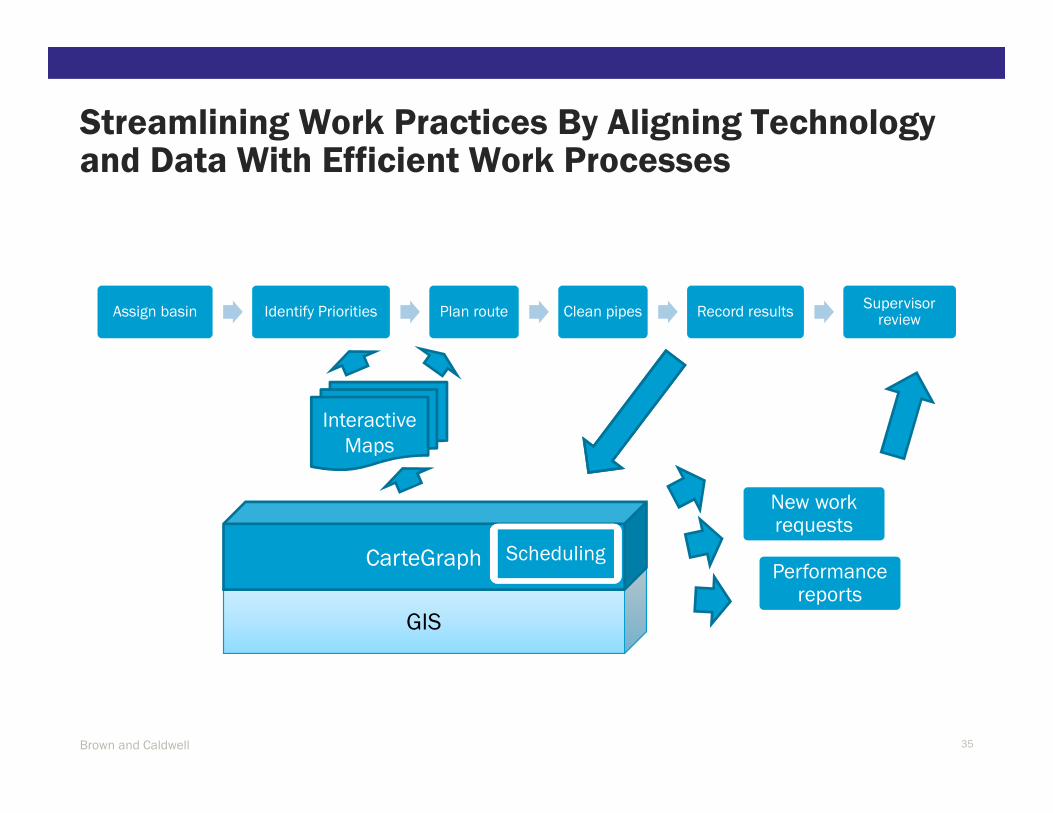
Streamlining Work Practices By Aligning Technology and Data With Efficient Work Processes
35Brown and Caldwell
GIS
CarteGraph Scheduling
New work requests
Performance reports
Assign basin Identify Priorities Plan route Clean pipes Record resultsSupervisor
review
Interactive
Maps

Preventative Maintenance Metrics
• PMs Planned: PMs Planned: PMs Planned: PMs Planned: The number of schedule PMs for the time period defines the overall
maintenance plan.
• PMs Completed: PMs Completed: PMs Completed: PMs Completed: How many of the planned PMs were actually completed?
• %PMs Completed: %PMs Completed: %PMs Completed: %PMs Completed: How well was the plan followed?
• Hours Estimated: Hours Estimated: Hours Estimated: Hours Estimated: Number of planned hours for preventative maintenance
• Actual Hours: Actual Hours: Actual Hours: Actual Hours: Number of hours spent on preventative maintenance
• Hour Actual vs. Estimated: Hour Actual vs. Estimated: Hour Actual vs. Estimated: Hour Actual vs. Estimated: How close is the plan to the actual execution?
• PMs total hours: PMs total hours: PMs total hours: PMs total hours: Same as Actual Hours.
• CMs Total Hours: CMs Total Hours: CMs Total Hours: CMs Total Hours: Number of hours spent on corrective maintenance.
• % CMs vs. PMs: % CMs vs. PMs: % CMs vs. PMs: % CMs vs. PMs: Helps identify high areas of unplanned maintenance.
• CM/PM vs PMs Completed: CM/PM vs PMs Completed: CM/PM vs PMs Completed: CM/PM vs PMs Completed: Compares areas of high unplanned maintenance with
how effective the planned preventative maintenance program is being executed.

Performance Analysis of Preventative and Corrective Maintenance
• Where are my highest failure rates and why?
• Where are my most expensive maintenance costs?
• Which assets are the most expensive to maintain?
• What changes can I make to reduce failure rates?
• What do I need to do to reduce costs of my problem assets?

Accomplishments for Collections
• Improved business processes (pipe cleaning, CCTV inspection, FOG Management, SSO Response, R&R planning)
• Improved use of GIS and CMMS• “Dynamic” cleaning schedules
• Risk-based CCTV inspections
• Streamlined SSO documentation
• Implemented Sewer Lateral Inspection Program
• Implementing R&R Program
Brown and Caldwell

Collections Results
• New processes and systems in use for 2 years
• Decreased annual SSOs over 40% (on average)
• Successfully meeting Consent Decree requirements
• On track to clean entire system over 5 years
• On track to inspect entire system over 10 years
• Developed new Sewer CIP process that is managed by Engineering instead of Collection Systems
• Formalized FOG Restaurant Inspection program
• Developed Sewer Lateral Inspection Program
• Updated and audited Sewer System Management Plan
Brown and Caldwell
Accomplishments for Water Distribution
• Early stages of implementation
• Developing visibility of what it really takes to maintain system
• Standardized work processes improves performance and versatility
• Starting to see and react to patterns, inefficiencies and costs
• Improved communication and visibility between work groups and management

Case Study – Tony Bisson, Clark Regional WW District

42
Today’s Topics
• Vision
• Program Development
• Buy In
• Existing Data
• Staff usage
• Engineering and Maintenance working together!
• Condition Assessment
• Asset Risk
• Project Scoring
• Next Steps

43
VisionVisionVisionVision

44
Vision
•10 Attributes of Effectively Managed Utilities
45
Vision
• Financial Viability• Understand full life-cycle cost of utility
• Establish & maintain effective balance between:
• Long-term debt
• Asset values
• Operations / maintenance expenditures
• Operating revenues
• Establish predictable rates (consistent with community expectations / acceptability) adequate to recover costs
• Provide for reserves
• Maintain support from bond rating agencies
• Plan / invest for future needs

46
Vision
• Infrastructure Stability• Understand condition of & costs associated with critical
infrastructure assets
• Maintain / enhance condition of all assets
• Over long-term at lowest possible life-cycle cost
• Acceptable risk consistent with customer, community & regulator-supported service levels
• Consistent with anticipated growth & system reliability goals
• Assure asset repair, rehabilitation & replacements are coordinated to minimize disruptions & other negative consequences
47
Vision
• Customer Focused• Meet customer expectations - public values survey
• Environmental Stewardship / Protecting Water Resources• Proactive management of the system minimizes backups, I&I and unexpected
pipe failures
• Financial Responsibility• Stable rates
• Staffing and workload planning
• Minimize the high cost of emergency repairs and overflows
• Prioritizing limited resources - Fix the Worst First!
• Responsible Management• Practicality of managing 9,500 main line pipes segments
• Supporting Economic Development• Reliable sewer system
• Targeted investments

48
Program DevelopmentProgram DevelopmentProgram DevelopmentProgram Development

49
• Develop a ground level record system capable of
Program Development
Work order and asset management
AND– Critical Sewers Analysis
– Condition Assessment
– Asset Risk
– Project Prioritization Process
– Program Level Project Scoping
– Documentation

50
Program Development
• Program Outline� Identify Existing Data
• GIS and CCTV Investments
• Historical data and “tribal Knowledge”
� Critical Sewer Analysis
• Consequence of Failure (GIS Analysis)
� Asset Condition
• Probability of Failure (CCTV Data)

51
Program Development
• Program Outline� Asset Risk
• Combining Condition and Criticality (GIS Analysis)
� Develop Prioritization Concept
� Define R&R Projects
� Prioritize R&R Projects
���� Project Priority Array

52
Existing DataExisting DataExisting DataExisting Data

Gaining Staff Buy In
53

Non Tech Savvy?
54

Giving Ownership
55
56
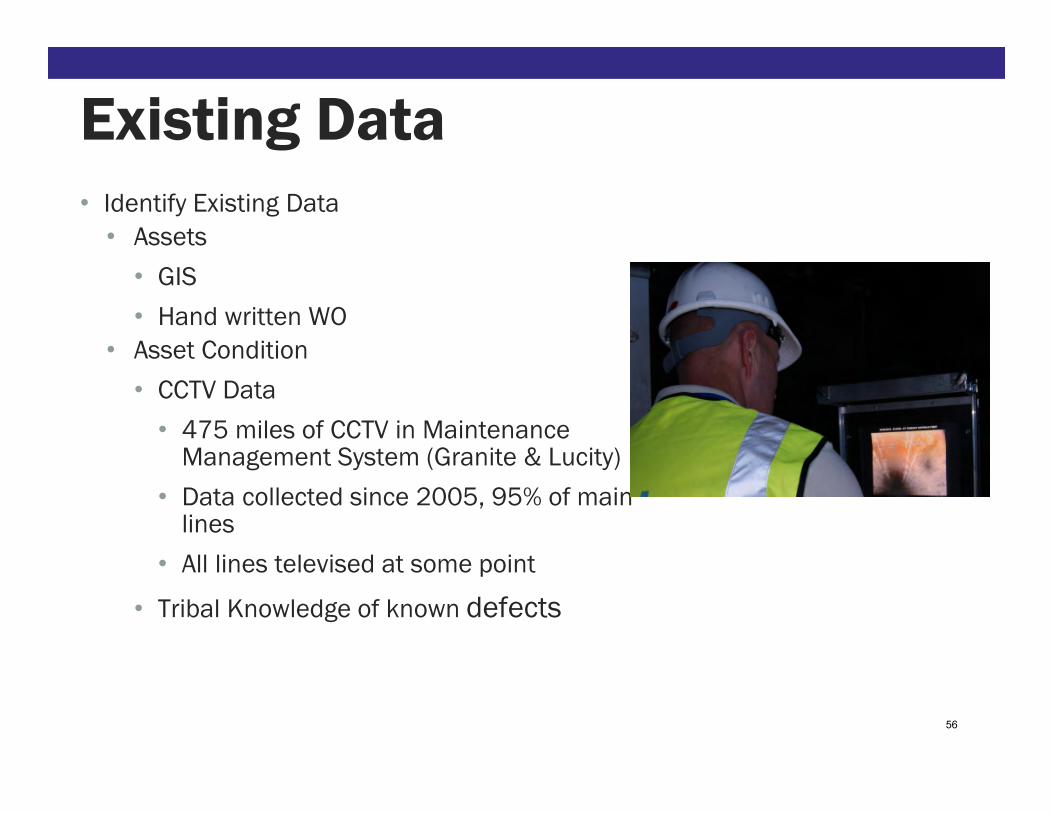
Existing Data• Identify Existing Data
• Assets
• GIS
• Hand written WO
• Asset Condition
• CCTV Data
• 475 miles of CCTV in Maintenance Management System (Granite & Lucity)
• Data collected since 2005, 95% of main lines
• All lines televised at some point
• Tribal Knowledge of known defects

57
Existing Data
Sewer Lines
Televised

58
An example of non Work Order An example of non Work Order An example of non Work Order An example of non Work Order usage:usage:usage:usage:
Critical Sewer AnalysisCritical Sewer AnalysisCritical Sewer AnalysisCritical Sewer Analysis

59
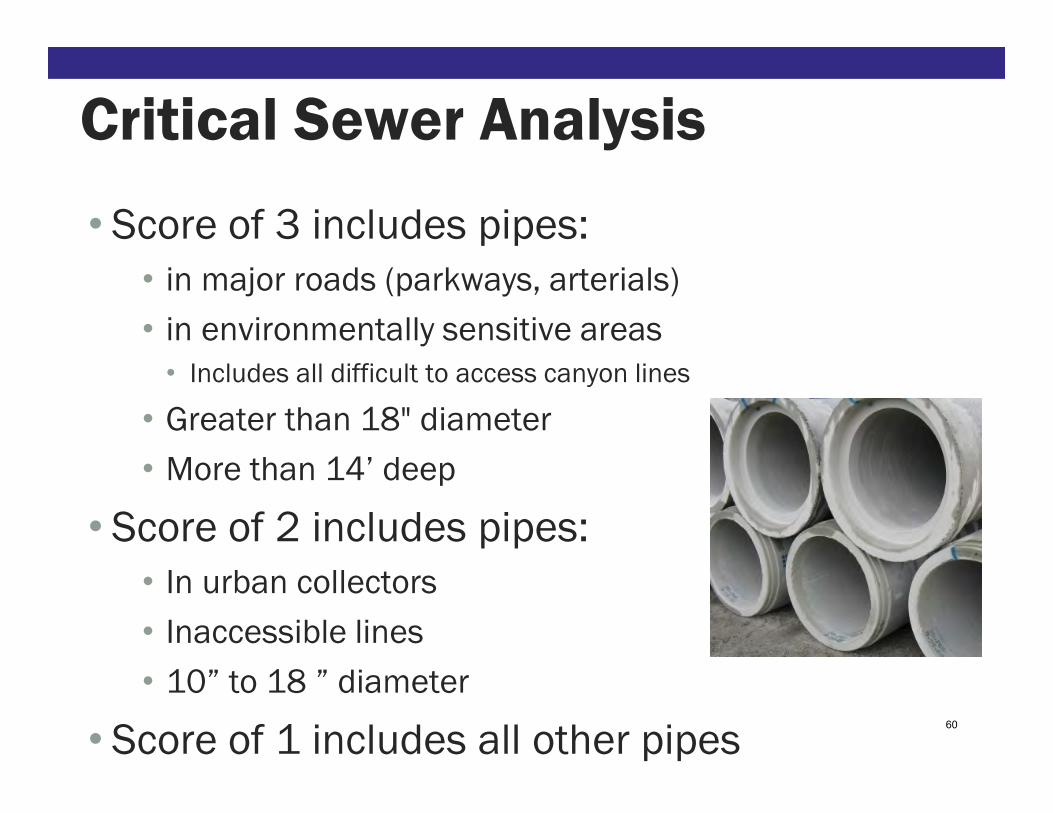
Critical Sewer Analysis
• Defining Criticality• 1 to 3 scoring scale based
on potential impact of asset failures or “consequence of failure”
60
Critical Sewer Analysis
• Score of 3 includes pipes:
• in major roads (parkways, arterials)
• in environmentally sensitive areas
• Includes all difficult to access canyon lines
• Greater than 18" diameter
• More than 14’ deep
• Score of 2 includes pipes:
• In urban collectors
• Inaccessible lines
• 10” to 18 ” diameter
• Score of 1 includes all other pipes
61
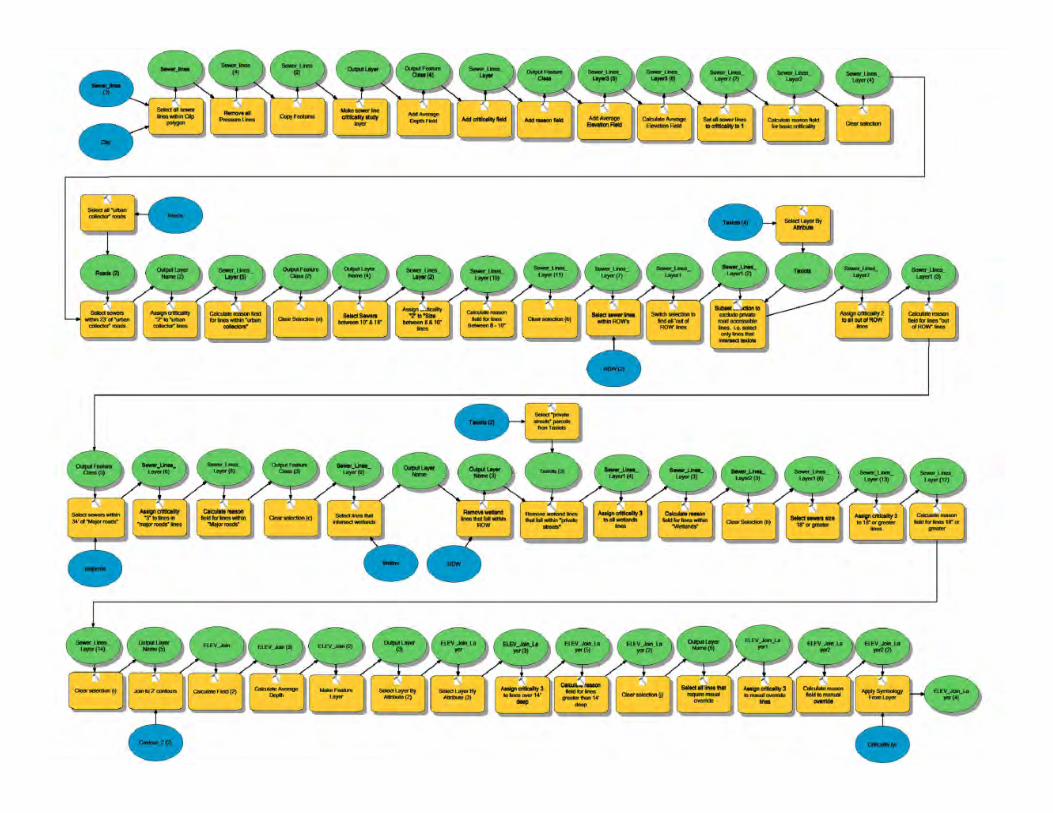
Critical Sewer Analysis -
GIS Working for Us

62
GIS Working
For Us
Critical Sewer Analysis
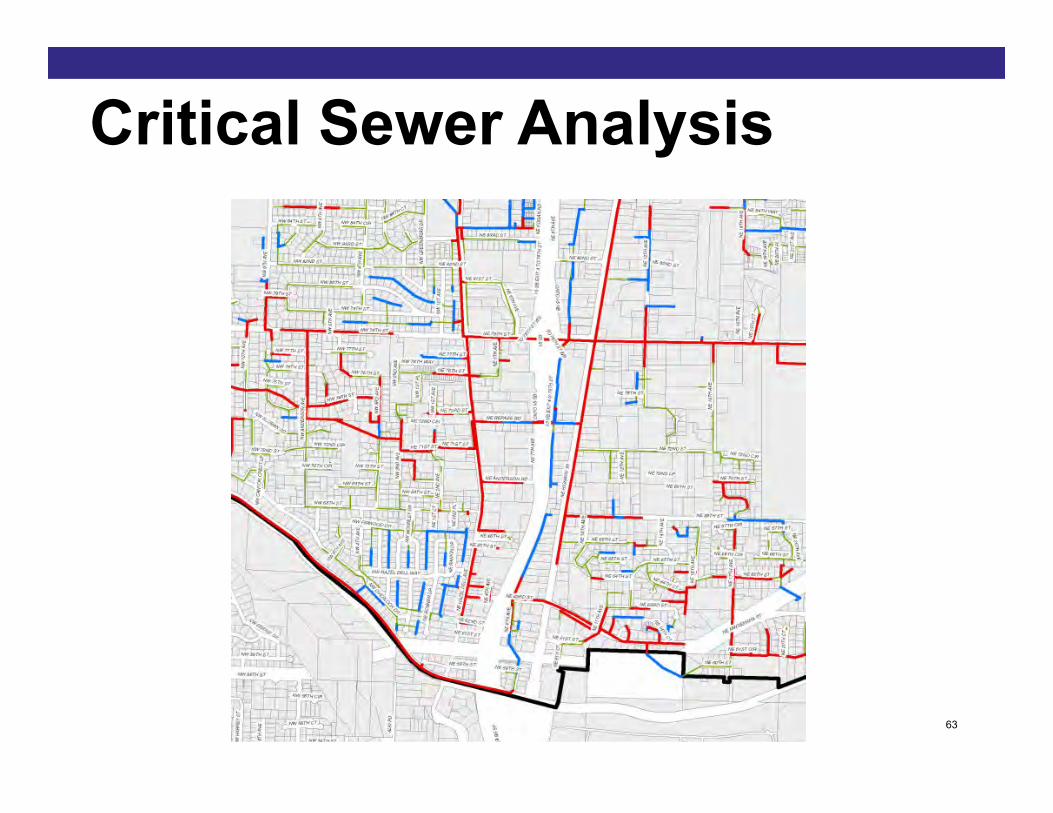
63
Critical Sewer Analysis
64
Condition AssessmentCondition AssessmentCondition AssessmentCondition Assessment
65
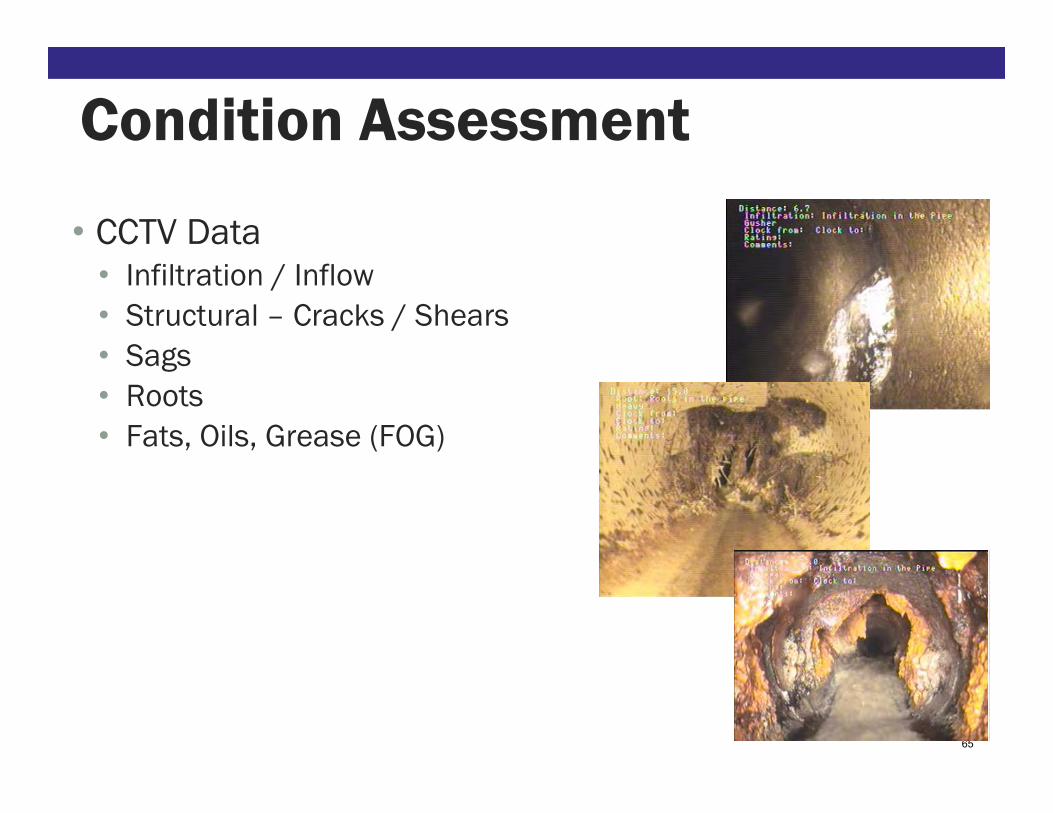
Condition Assessment
• CCTV Data• Infiltration / Inflow
• Structural – Cracks / Shears
• Sags
• Roots
• Fats, Oils, Grease (FOG)

66
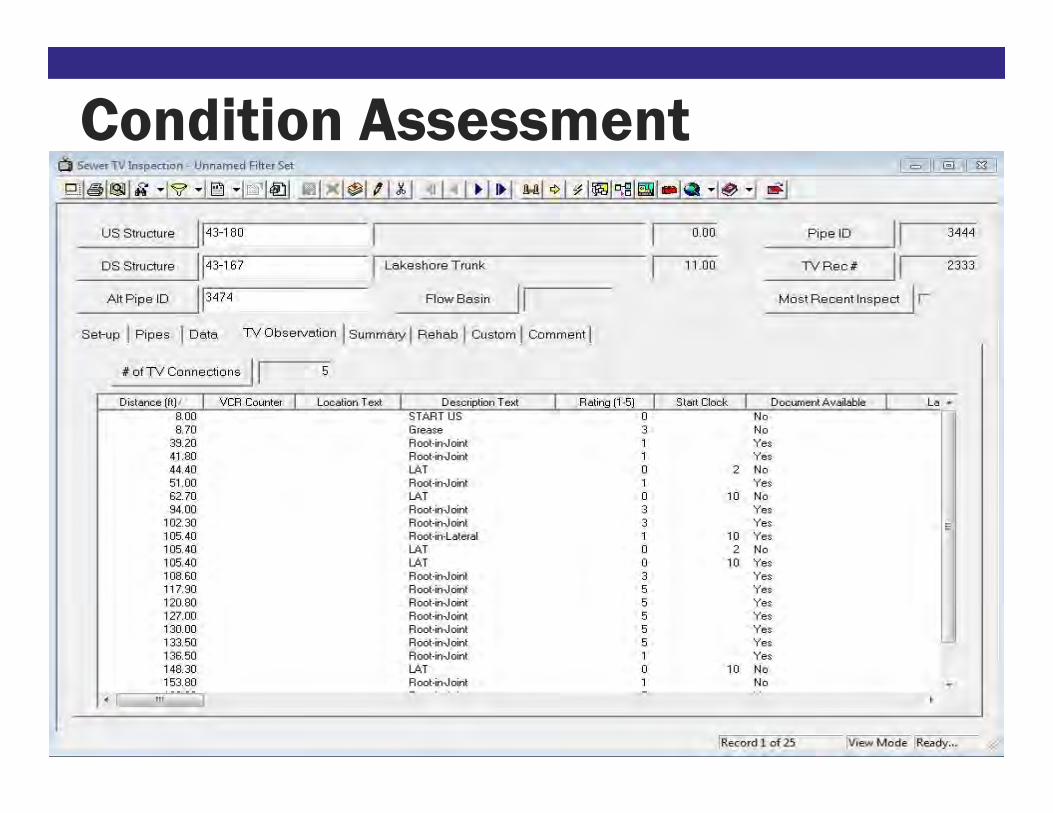
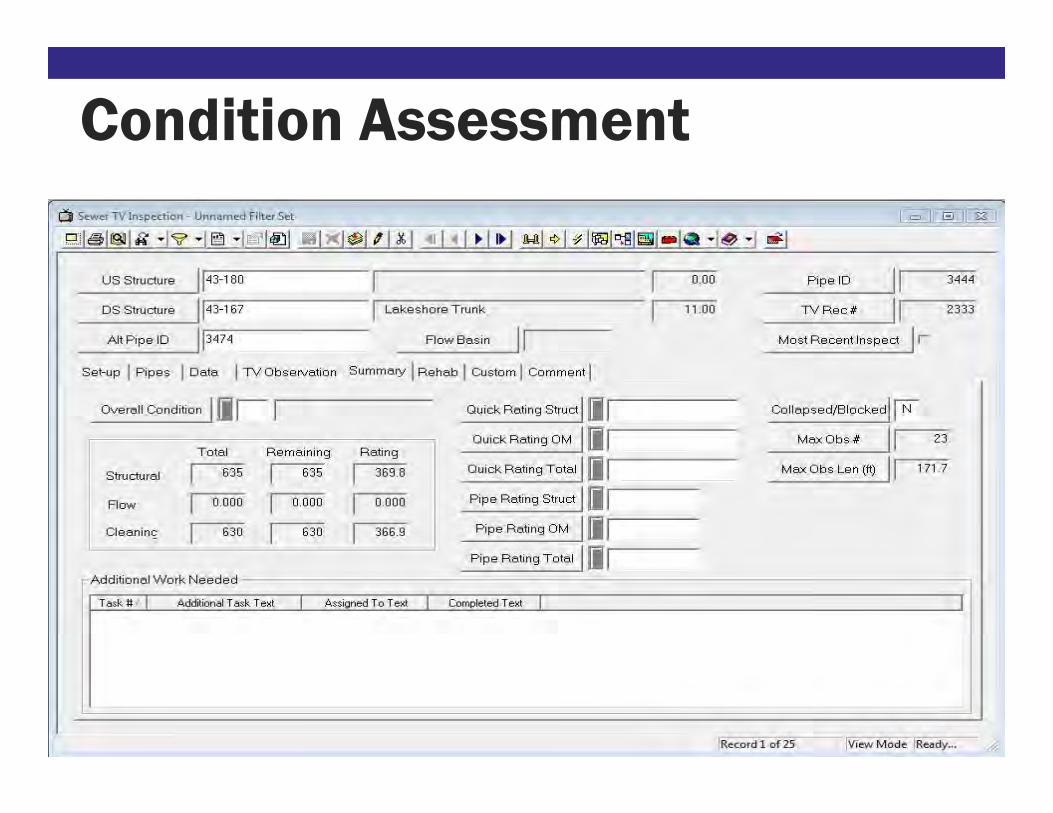
Condition Assessment
• CCTV Data Collected from Cues CCTV trucks.

67
Condition Assessment
• CCTV Data Scoring “Weight”
68
Condition Assessment
• CCTV Data
69
Condition Assessment

70
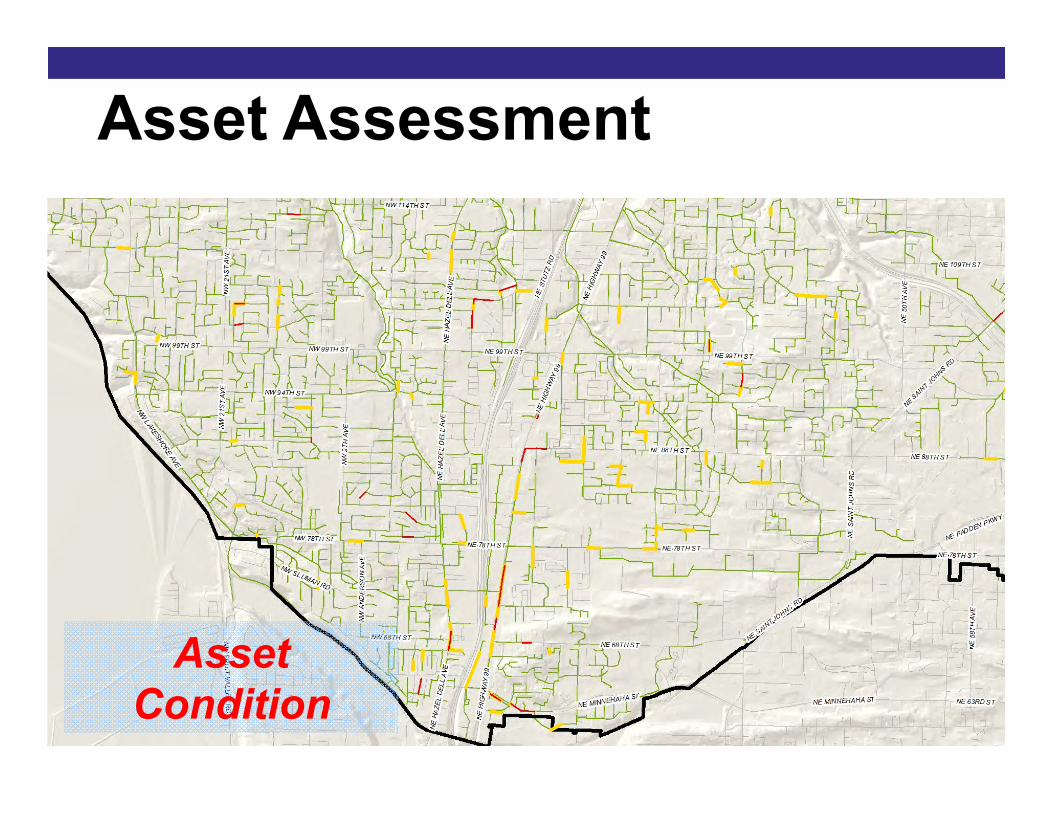
Condition Assessment
• CCTV Data Simplified Based on Score
= Failing: Imminent failure
= Poor: Monitor, proactive repairs
= Good: No concerns
71
Asset Assessment
Asset
Condition

72
Asset RiskAsset RiskAsset RiskAsset Risk

73
• Integrating Criticality & Condition• Criticality – Consequence of Failure
• Score 1, 2, or 3
• Condition – Risk of Failure
• Score Red, Yellow, Green
• Extra point, or fraction of a point added for hot spots.
Asset Risk = Criticality + ConditionAsset Risk = Criticality + ConditionAsset Risk = Criticality + ConditionAsset Risk = Criticality + Condition
Asset Risk
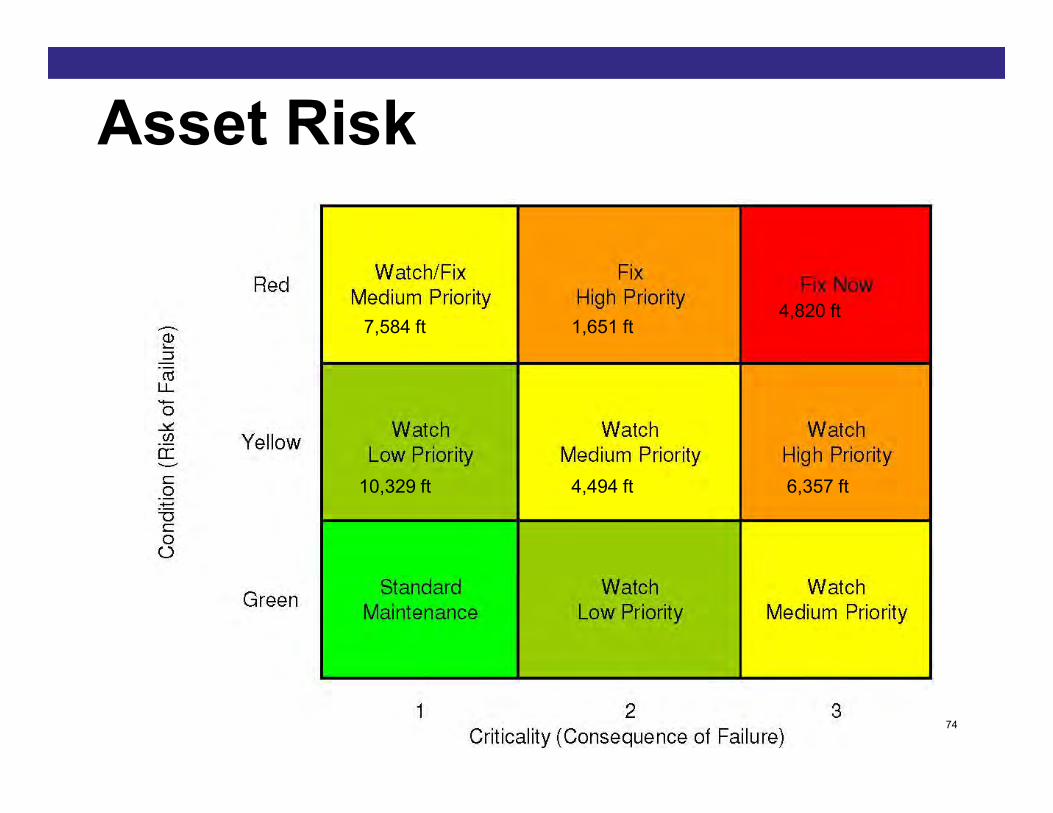
74
Asset Risk
4,820 ft7,584 ft
6,357 ft
1,651 ft
4,494 ft10,329 ft

75
Asset Risk
Sewer Lines
Identified

76
Asset Risk
Project Zones
Identified

77
Project ScoringProject ScoringProject ScoringProject Scoring

78
Project Scoring
Asset Risk = Criticality + Condition
Project Scores

79
Next StepsNext StepsNext StepsNext Steps
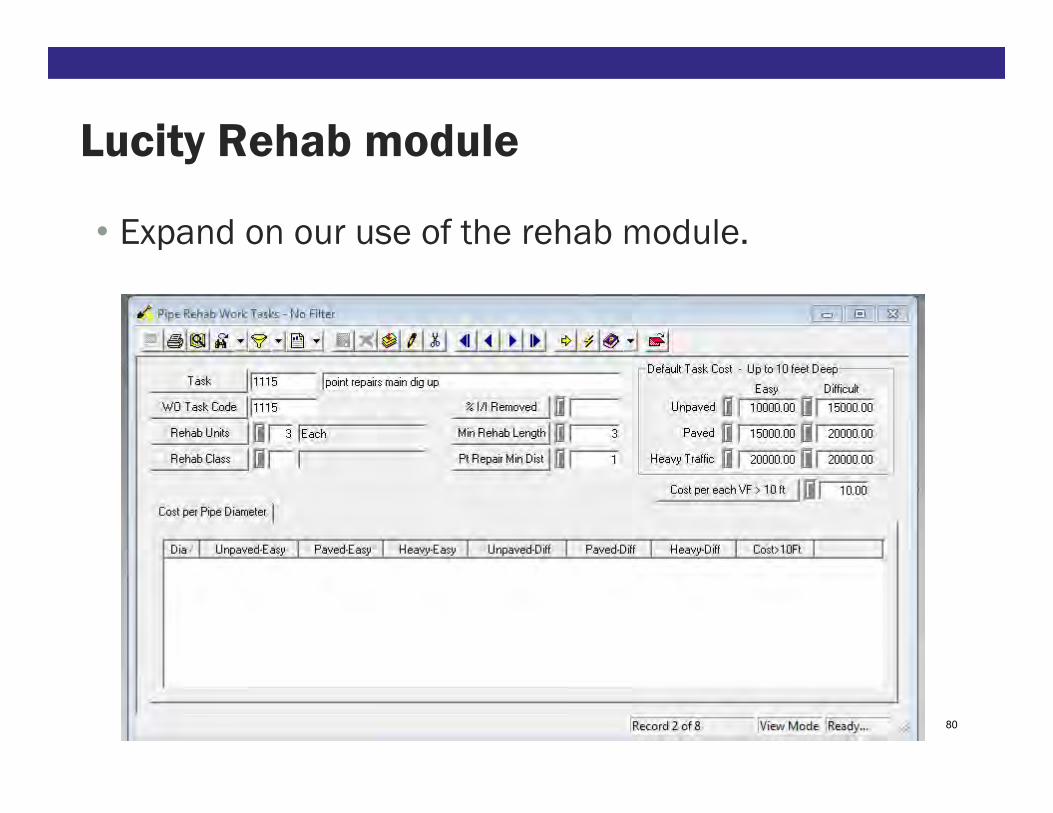
Lucity Rehab module
• Expand on our use of the rehab module.
80

81
• Project Priority Array
• Capital Project component
• Pump Stations
• Force Mains
• Rework codes/weights to work with PACP
Next Steps

Lessons Learned
• You have more data collected than you realize even before implementation
• Staff support and Management buy in is crucial to any systems success
• CMMS systems, once populated, save time, money.
• Adds quantifiable data to back rehab needs and cost allocation.
• Provides an easily searchable data base to provide history on work/assets, customer issues and inquires, and any other data you may want to “gather”
82

CMMS systems - What does a utility need to get started?

AM programs – agency specific, one size does not fit all – CMMS systems are just one component
Brown and Caldwell 84
Small Medium Large• Consequence of
Failure (COF) and
Probability of
Failure (POF)
• Focus on a
critical asset
class to collect
additional data
• Update CMMS
• Update financial
• COF and POF
• Asset Management
Program Evaluation
(AMPE)
• Business Process
Analysis (BPA)
• Collect additional
data
• Update CMMS
• Update financial
• COF+ and POF+
• BRE
• AMPE
• Teams
• BPA
• BCE
• SAMPs
• Resiliency
• ISO
• IIMM
• ISI
• CMMS
• Financial

Getting started – CMMS implementations are journeys………….not destinations
• Identify & EvaluateIdentify & EvaluateIdentify & EvaluateIdentify & Evaluate• Existing data sources and inventories
• Existing work practices
• Look for gaps (e.g. collections, vertical, work history etc.)
• How are you currently reporting (communicating with decision makers)?
• 1st round goals for system1st round goals for system1st round goals for system1st round goals for system• Consolidated asset database
• Basic work management
• Basic reporting
Starting slowly and simply is the key to success!Starting slowly and simply is the key to success!Starting slowly and simply is the key to success!Starting slowly and simply is the key to success!

Choose a CMMS system that meets your agencies needs/goals now……….but is expandable
• Evaluation Evaluation Evaluation Evaluation considerationsconsiderationsconsiderationsconsiderations• Flexible
reporting
• Modular (can add assets/users)
• Ease of use
• Vendor support
• Mobile applications
• Cost

Learn from others……..and find a champion
• BenchmarkBenchmarkBenchmarkBenchmark• What systems are neighboring/similar agencies using?
• How is it working for them?
• Information sharing/user group potential
• Identify an internal “champion(s)”Identify an internal “champion(s)”Identify an internal “champion(s)”Identify an internal “champion(s)”• Day jobs will continuously get in the way
• One or more individuals needs to be focused on the effort and own it
• Other departments (e.g. IT) will need to be on board
• Business processes needed to support the toolsBusiness processes needed to support the toolsBusiness processes needed to support the toolsBusiness processes needed to support the tools

CMMS systems – Benefits Recap
Benefits to Small Agencies
• Collect reliable data reliable data reliable data reliable data to measure performancemeasure performancemeasure performancemeasure performance• Workload backlog
• Productivity
• Effectiveness of preventative maintenance
• Improves focus on critical assets
• True O&M costs
• StandardizeStandardizeStandardizeStandardize O&M practices• Extend useful life and reduce O&M-related equipment failures
• Facilitates continual improvement
• Captures system O&M knowledge
• Streamline work practices
Benefits to Small Agencies (cont.)
• Quantify needsQuantify needsQuantify needsQuantify needs to decision makers• demonstrate the need for more
resources• prove warranty compliance or
regulatory compliance• Support rate adjustments to
decision makers
• Provides visibility and visibility and visibility and visibility and transparencytransparencytransparencytransparency• Management understands what is
happening in the field• Field crews understand what is
important for effective utility management

Questions