Pmch expression during early development is critical for ...
14
See discussions, stats, and author profiles for this publication at: http://www.researchgate.net/publication/40027751 Pmch expression during early development is critical for normal energy homeostasis ARTICLE in AJP ENDOCRINOLOGY AND METABOLISM · NOVEMBER 2009 Impact Factor: 4.09 · DOI: 10.1152/ajpendo.00154.2009 · Source: PubMed CITATIONS 17 DOWNLOADS 144 VIEWS 188 11 AUTHORS, INCLUDING: Chun-Xia Yi Academisch Medisch Centrum Universiteit v… 51 PUBLICATIONS 1,110 CITATIONS SEE PROFILE Pim Toonen Koninklijke Nederlandse Akademie van Wet… 20 PUBLICATIONS 250 CITATIONS SEE PROFILE Susanne la Fleur Academisch Medisch Centrum Universiteit v… 100 PUBLICATIONS 4,129 CITATIONS SEE PROFILE Edwin Cuppen Hubrecht Institute 191 PUBLICATIONS 7,386 CITATIONS SEE PROFILE Available from: Andries Kalsbeek Retrieved on: 10 August 2015
Transcript of Pmch expression during early development is critical for ...

Seediscussions,stats,andauthorprofilesforthispublicationat:http://www.researchgate.net/publication/40027751
Pmchexpressionduringearlydevelopmentiscriticalfornormalenergyhomeostasis
ARTICLEinAJPENDOCRINOLOGYANDMETABOLISM·NOVEMBER2009
ImpactFactor:4.09·DOI:10.1152/ajpendo.00154.2009·Source:PubMed
CITATIONS
17
DOWNLOADS
144
VIEWS
188
11AUTHORS,INCLUDING:
Chun-XiaYi
AcademischMedischCentrumUniversiteitv…
51PUBLICATIONS1,110CITATIONS
SEEPROFILE
PimToonen
KoninklijkeNederlandseAkademievanWet…
20PUBLICATIONS250CITATIONS
SEEPROFILE
SusannelaFleur
AcademischMedischCentrumUniversiteitv…
100PUBLICATIONS4,129CITATIONS
SEEPROFILE
EdwinCuppen
HubrechtInstitute
191PUBLICATIONS7,386CITATIONS
SEEPROFILE
Availablefrom:AndriesKalsbeek
Retrievedon:10August2015

doi:10.1152/ajpendo.00154.2009 298:477-488, 2010. First published Nov 24, 2009;Am J Physiol Endocrinol Metab
Kalsbeek, Susanne E. la Fleur and Edwin Cuppen Toonen, Martine C. J. van der Elst, Peter J. Voshol, Bart A. Ellenbroek, Andries Joram D. Mul, Chun-Xia Yi, Sjoerd A. A. van den Berg, Marieke Ruiter, Pim W.
You might find this additional information useful...
for this article can be found at: Supplemental material http://ajpendo.physiology.org/cgi/content/full/ajpendo.00154.2009/DC1
68 articles, 30 of which you can access free at: This article cites http://ajpendo.physiology.org/cgi/content/full/298/3/E477#BIBL
including high-resolution figures, can be found at: Updated information and services http://ajpendo.physiology.org/cgi/content/full/298/3/E477
can be found at: AJP - Endocrinology and Metabolismabout Additional material and information http://www.the-aps.org/publications/ajpendo
This information is current as of April 1, 2010 .
http://www.the-aps.org/.20814-3991. Copyright © 2005 by the American Physiological Society. ISSN: 0193-1849, ESSN: 1522-1555. Visit our website at organization. It is published 12 times a year (monthly) by the American Physiological Society, 9650 Rockville Pike, Bethesda MD
publishes results of original studies about endocrine and metabolic systems on any level ofAJP - Endocrinology and Metabolism
on April 1, 2010
ajpendo.physiology.orgD
ownloaded from

Pmch expression during early development is critical for normal energyhomeostasis
Joram D. Mul,1 Chun-Xia Yi,2 Sjoerd A. A. van den Berg,3 Marieke Ruiter,4 Pim W. Toonen,1
Martine C. J. van der Elst,5 Peter J. Voshol,4 Bart A. Ellenbroek,5 Andries Kalsbeek,2,6
Susanne E. la Fleur,6,7 and Edwin Cuppen1
1Hubrecht Institute-Koninklijke Nederlandse Akademie van Wetenschappen and University Medical Center Utrecht, Utrecht;2Department of Hypothalamic Integration Mechanisms, Netherlands Institute for Neuroscience, Amsterdam; 3Departmentof Human Genetics, 4Department of Endocrinology and Metabolic Diseases, Leiden University Medical Center, Leiden;5Department of Cognitive Neuroscience, Psychoneuropharmacology, Radboud University Nijmegen Medical Center,Nijmegen; 6Department of Endocrinology and Metabolism, Amsterdam Medical Center, University of Amsterdam, Amsterdam;and 7Department of Neuroscience and Pharmacology, Rudolf Magnus Institute of Neuroscience, University Medical CenterUtrecht, Utrecht, The Netherlands
Submitted 10 March 2009; accepted in final form 17 November 2009
Mul JD, Yi CX, van den Berg SAA, Ruiter M, Toonen PW,van der Elst MCJ, Voshol PJ, Ellenbroek BA, Kalsbeek A, laFleur SE, Cuppen E. Pmch expression during early development iscritical for normal energy homeostasis. Am J Physiol EndocrinolMetab 298: E477–E488, 2010. First published November 24, 2009;doi:10.1152/ajpendo.00154.2009.—Postnatal development and pu-berty are times of strong physical maturation and require largequantities of energy. The hypothalamic neuropeptide melanin-concen-trating hormone (MCH) regulates nutrient intake and energy ho-meostasis, but the underlying mechanisms are not completely under-stood. Here we use a novel rat knockout model in which the MCHprecursor Pmch has been inactivated to study the effects of loss ofMCH on energy regulation in more detail. Pmch�/� rats are lean,hypophagic, osteoporotic, and although endocrine parameters werechanged in pmch�/� rats, endocrine dynamics were normal, indicat-ing an adaptation to new homeostatic levels rather than disturbedmetabolic mechanisms. Detailed body weight growth and feedingbehavior analysis revealed that Pmch expression is particularly im-portant during early rat development and puberty, i.e., the first 8postnatal weeks. Loss of Pmch resulted in a 20% lower set point forbody weight that was determined solely during this period andremained unchanged during adulthood. Although the final bodyweight is diet dependent, the Pmch-deficiency effect was similar forall diets tested in this study. Loss of Pmch affected energy expenditurein both young and adult rats, although these effects seem secondary tothe observed hypophagia. Our findings show an important role forPmch in energy homeostasis determination during early developmentand indicate that the MCH receptor 1 system is a plausible target forchildhood obesity treatment, currently a major health issue in firstworld countries.
melanin-concentrating hormone; hypothalamus; childhood obesity;rat knockout model
CHILDHOOD OBESITY IS NOW WIDELY recognized as a severe publichealth issue (43). Treatment with drugs aimed at neural sys-tems involved in the determination of the energy balance couldpotentially result in a lower energy balance during puberty aswell as later in adulthood. Therefore, neuropeptides involved in
body weight regulation during early development and pubertyare attractive targets for anti-childhood obesity drugs.
The neuronal metabolic systems in humans and primatesdevelop prenatally, while in rodents these systems developduring the first 3 postnatal weeks (5, 21). This results in theactivation and optimization of neuronal systems during earlyrodent development. A second important metabolic period ispuberty, a period of major growth, hormonal changes, andsexual maturation. In the rat, puberty is characterized bydifferent responses of young-adolescent [postnatal day (PND)40] and young-adult (PND 60) male rats to environmental cueslike stress and cold (17, 18). In addition to these age-dependentbehavioral differences, the amount of food consumed duringearly rodent life plays an important role in determining subse-quent food intake in later life (44). Following this initialobservation, many studies have shown that postnatal nutritionis important for the regulation of appetite in adult rodents,suggesting that the energy balance is predominantly deter-mined during early development (40).
Melanin-concentrating hormone (MCH) has been shown tobe a critical mammalian hypothalamic effecter of energy ho-meostasis by various genetic and pharmacological studies (46).The MCH-precursor gene (Pmch) is expressed predominantlyin neurons of the lateral hypothalamic area and the incertohypothalamic area, which project throughout the brain (3, 60).Pmch is also expressed in some peripheral tissues, such as thetestes, although at lower levels than in the brain (25). Process-ing of Pmch results in the production of three neuropeptides:neuropeptide glycine-glutamic acid (N-GE), neuropeptide glu-tamic acid-isoleucine (N-EI), and MCH (41). Pmch mRNA isupregulated after fasting or leptin deficiency (32, 50); thirdventricle intracerebroventricular injections of MCH increasefood intake and body weight (11, 19, 22, 28, 53); Pmchknockout mice are lean due to a decreased food intake and anincreased metabolic rate (31, 59); and overexpression of MCHcauses obesity (35). In rodents MCH binds to melanin-concen-trating hormone receptor 1 (MCH1R), a G protein-coupledreceptor expressed throughout the brain (7, 33, 55, 56).MCH1R is particularly enriched in the nucleus accumbensshell (33, 47, 56), thus forming a potential hypothalamic-limbic circuit modulating the hedonic, or rewarding, aspects offeeding (16, 47). Recently, it was indeed shown that the MCH
Address for reprint requests and other correspondence: S. E. la Fleur, Dept.of Endocrinology and Metabolism, F5-165, Academic Medical Center, Univ.of Amsterdam, Meibergdreef 9, 1105AZ Amsterdam, The Netherlands (e-mail:[email protected]).
Am J Physiol Endocrinol Metab 298: E477–E488, 2010.First published November 24, 2009; doi:10.1152/ajpendo.00154.2009.
0193-1849/10 $8.00 Copyright © 2010 the American Physiological Societyhttp://www.ajpendo.org E477
on April 1, 2010
ajpendo.physiology.orgD
ownloaded from

system affects motivation for feeding or drugs of abuse (9, 42).Rodents only express MCH1R, whereas humans also express asecond MCH receptor, MCH2R (54). Recent studies (24, 36,39, 45, 58) have focused on MCH1R, demonstrating thatMCH1R antagonism decreases food intake and weight gain inadult rodents.
Most MCH-related studies using genetic models or MCHantagonists have primarily focused on the function of MCHduring adulthood. Therefore, the effect of loss of Pmch expres-sion on energy regulation during early development is largelyunexplored. To study nutrient intake during this period, weutilized a novel rat knockout model that was generated recentlyusing an N-ethyl-N-nitrosourea (ENU)-driven target-selectedmutagenesis approach (61). Preliminary studies in young-adultanimals showed that the caloric intake of pmch�/� rats wasunchanged compared with control littermates when nutrientintake data were normalized for body weight. Following thisinitial observation, we have analyzed the metabolic character-istics of the Pmch knockout rat model in three different diets[maintenance (M), semi-high-protein (SHP), and high-fat(HF)] by following body weight and food intake during devel-opment and adulthood, and by measuring endocrine values.Furthermore, the metabolic profile of pmch�/� rats was ana-lyzed using indirect calorimetry. Our results show that Pmchplays an important role in the energy balance determinationduring the first 8 postnatal weeks and that loss of Pmch resultsin a 20% decreased body weight during adulthood regardless ofdiet.
MATERIALS AND METHODS
Animals. The Animal Care Committee of the Royal Dutch Acad-emy of Science and the Leiden University Medical Center approvedall experiments according to the Dutch legal ethical guidelines. ThePmch knockout rat (Pmch1Hubr) was generated by target-selectedENU-driven mutagenesis (see Ref. 61). Briefly, high-throughput re-sequencing of genomic target sequences in progeny from mutagenizedrats revealed an ENU-induced premature stop codon in exon 1(K50X) of Pmch in a rat (Wistar/Crl background). The heterozygousmutant animal was backcrossed to wild-type Wistar background forsix generations to eliminate confounding effects from backgroundmutations induced by ENU. Assuming that the total amount of codingDNA in a male rat is �28.6 � 106 bp (10) and the used ENUtreatment resulted in a mutation frequency of 1 per 1.5 � 106 bp (61),�19 mutations can be expected in the protein-coding sequences of thefounder animal. Backcrossing six times would therefore decreasethe total number of random background mutations to 1. Furthermore,the maximal number of nonsense inducing mutations is much lowerthan 19, i.e., 3 (10). However, as part of the donor chromosomeharboring the Pmch mutation is still present after six backcrosses (29),we cannot fully exclude the presence of tightly linked confoundingmutations in our rat model. To further control for possible contribu-tions of confounding mutations, we repeated several measurements indifferent outcross generations and could replicate previous findings ineach generation. Additionally, we always generated experimentalpmch�/� and pmch�/� rats by crossing pmch�/� rats. Experimentalrats were obtained at the expected Mendelian frequency. Furthermore,littermates (with similar genetic backgrounds) were used as much aspossible for experiments. Pmch�/� rats were viable into adulthoodand fertile and appeared phenotypically normal despite their lowerbody weight. Two rats were housed together, unless noted otherwise,under controlled experimental conditions (12:12-h light-dark cycle,light period 0600–1800, 21 � 1°C, �60% relative humidity). Thestandard fed diet in our animal facility (semi-high-protein chow:
RM3, 26.9% crude protein, 11.5% fat, and 61.6% carbohydrates; 3.33kcal/g AFE; SDS, Witham, UK) was provided ad libitum togetherwith water, unless noted otherwise (maintenance chow: RM1, 17.5%crude protein, 7.4% fat, and 75.1% carbohydrates; 3.29 kcal/g AFE;SDS; high-fat chow: 45%-AFE, 20% crude protein, 45% fat, and 35%carbohydrates; 4.54 kcal/g AFE SDS). Only male rats were used in thepresent study.
Genotyping. Genotyping was done using the KASPar SNP Geno-typing System (KBiosciences, Hoddesdon, UK; as described in Ref.66) using gene-specific primers (forward common: TTAAT ACATTCAGGA TGGGG AAAGC CTTT; reverse wild type: GAAGGTGACC AAGTT CATGCT CGATC TTTCT GCGGT ATCTT CCTT;and reverse homozygous: GAAGG TCGGA GTCAA CGGAT TC-GAT CTTTC TGCGG TATCT TCCTA). All pups were genotyped at3 wk of age. Genotypes were reconfirmed when experimental proce-dures were completed.
Northern blot analysis. Northern blot analysis (as described in Ref.27) was done using a Pmch-specific radiolabeled PCR-derived probecovering the first exon of the gene. The following primers were usedfor probe generation: forward primer: ATTCT CCTTC GGCTTTACG; and reverse primer: TCCAG AGAAG GAGCA ACAAC.
Body weight and nutrient intake. Animals were housed individuallyat PND 21. Until weaning, animals had access to SHP diet in theirmaternal home cage. Body weight, water intake, and food intake wasmonitored biweekly for 18 wk. Food (M, SHP, or HF diet) and waterwere provided ad libitum. At 8 and 17 wk of age, nutrient intake wasmeasured for 6 consecutive days at 0600 (dark phase intake) and at1800 (light phase intake).
White adipose tissue and organ weight. A white adipose tissue(WAT) fat pad sample (containing the right side of the subcutaneousWAT pad, the whole epididymal WAT pad, the right side of theperirenal WAT pad, and the whole mesenteric WAT pad), liver,adrenals, and the thymus were isolated from 26-wk-old rats.
Jugular vein catheter. The 22-wk-old rats were anesthetized withisoflurane and equipped with a jugular vein catheter (headpiece:Connector Pedestal 20GA; Plastics One, Roanoke, VA). Before sur-gery, rats received one dose of Temgesic (0.05 mg/kg sc; Schering-Plough, Utrecht, the Netherlands). Rats were allowed to recover for 7days during which they were handled to minimize stress.
Indirect calorimetry. Indirect calorimetry was measured in an eight-cage combined, open circuit indirect calorimetry system (LabMasterSystem, TSE Systems, Bad Homburg, Germany). After a 20-h accli-matization period, parameters of indirect calorimetry [O2 uptake(V̇O2) and CO2 production (V̇CO2)] and caloric intake (SHP diet) weremeasured for 3 consecutive days. Carbohydrate and fat oxidation rateswere calculated from V̇O2 and V̇CO2 using the following formulas:carbohydrate oxidation (cal/h) � (4.585 � V̇CO2 � 3.226 � V̇O2) �4 and fat oxidation (cal/h) � (1.695 � V̇O2 � 1.701 � V̇CO2) � 9.Total energy expenditure (EE) was calculated from the sum ofcarbohydrate and fat oxidation. Physical activity was measured usinginfrared sensor frames. Interruptions of infrared sensor pairs weredetected by a control unit and registered by a computer with therelevant software (ActiMot2; TSE Systems). Body composition andbone mass density were measured by dual-energy X-ray absorptiom-etry (DEXA) using a Norland pDEXA Sabre scanner (NorlandStratec, Fort Atkinson, WI). Fecal samples were collected, freeze-dried, and analyzed for gross energy content using adiabatic bombcalorimetry (IKA Calorimeter System C4000; Heitersheim, Ger-many). The energetic ratio was calculated as the EE (kcal/day) dividedby the metabolizable energy (kcal/day; kcal ingested minus kcal lostin feces). All measurements were done at average PND 40 and 120. AtPND 130, an indirect calorimetric analysis was performed during 48-hcaloric starvation (no SHP diet; water freely available), followed by72 h of refeeding.
Statistical analysis. Data are expressed as means � SE. Longi-tudinal body weight, longitudinal endocrine (leptin, insulin, andglucose), intravenous insulin-tolerance tests (IVITT), intravenous
E478 MCH REGULATES ENERGY HOMEOSTASIS DURING EARLY DEVELOPMENT
AJP-Endocrinol Metab • VOL 298 • MARCH 2010 • www.ajpendo.org
on April 1, 2010
ajpendo.physiology.orgD
ownloaded from

glucose-tolerance tests (IVGTT), and longitudinal body core tem-perature data were analyzed using a repeated-measures ANOVAfollowed by a Tukey’s honestly significant difference post hocanalysis. The statistical analysis included the within-subjects fac-tors of time (days or hours) and genotype (pmch�/�, pmch�/�). Allother data were analyzed using Student’s t-test. All data wereanalyzed using a commercially available statistical program (SPSSfor Macintosh, version 16.0). The null hypothesis was rejected atthe 0.05 level.
Supplemental materials and methods. Additional materials andmethods for this article can be found in the Supplemental Materialsand Methods available online at the Am J Physiol Endocrinol Metabwebsite.
RESULTS
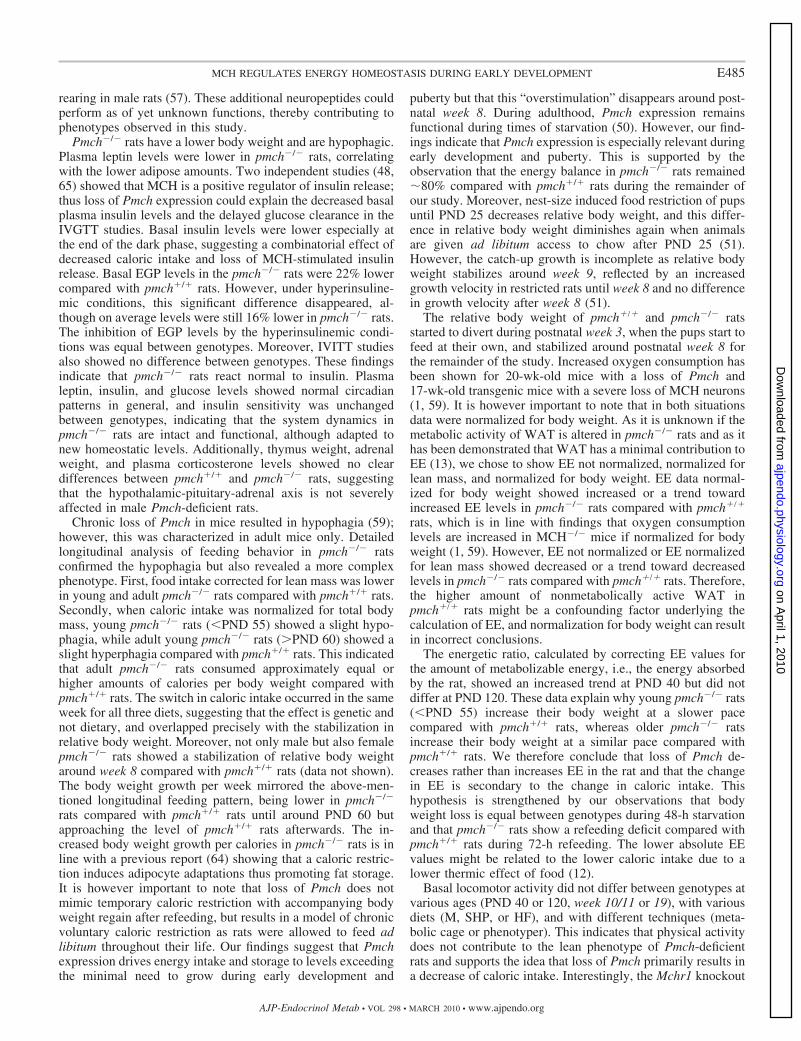
Generation of the Pmch knockout rat. In a large ENU-driventarget-selected mutagenesis screen, we identified a rat carryinga heterozygous mutation in Pmch (61). The mutation (K50X)resulted in a premature stop codon in exon 1 (Fig. 1A).Northern blot analysis showed that Pmch mRNA is almostcompletely absent in pmch�/� animals, most likely as a resultof nonsense-mediated decay (Fig. 1B). Furthermore, Pmch
expression is gene dose-dependent reduced in pmch�/� rats.The knockout phenotype was confirmed by immunohistochem-istry, which showed that all three neuropeptides derived fromPmch, N-GE, N-EI, and MCH, are absent in sections of thelateral hypothalamus of pmch�/� animals (Fig. 1C).
Pmch knockout rats are lean and hypophagic. The bodyweight of pmch�/� and pmch�/� rats was monitored on threedifferent diets (M, SHP, and HF) for 18 wk starting at PND 21.At the end of the study, pmch�/� animals showed a lower bodyweight compared with pmch�/� rats on all three diets (Fig. 2,A–C). Body weight did not differ between genotypes at birth,or between birth and the third postnatal week (data not shown),but started to diverge �3 wk after birth. Furthermore, pmch�/�
rats showed a reduction in naso-anal body length at 6 and 13wk (M and SHP diet) and 12 wk (HF diet) of age (Supplemen-tal Fig. S1), suggesting an impaired growth that could be asecondary effect of the decreased caloric intake. When thestudy was completed, relative body weight of pmch�/� ratswas 78% (M), 79% (SHP), and 82% (HF) compared withpmch�/� rats (Fig. 2, A–C). Pmch�/� as well as pmch�/� ratson the HF diet showed a higher body weight at the end of the
Fig. 1. Confirmation of the Pmch knockout rat. A: sequencing revealed an induced premature stop codon in the first exon (K50X) in the melanin-concentratinghormone (MCH) precursor gene (indicated in schematic overview). Light grey bar indicates the probe used for Northern blot analysis. B: Northern blot analysisof whole brain tissue demonstrated that the premature stopcodon results in almost complete loss of Pmch mRNA in animals homozygous (HOM) for the mutationand showed a gene dose-dependent reduction in Pmch expression in heterozygous (HET) rats [53% expression compared with wild type (WT)].C: immunohistochemistry (�250 enlargement) revealed that all 3 neuropeptides derived from the Pmch precursor, neuropeptide glycine-glutamic acid (N-GE),neuropeptide glutamic acid-isoleucine (N-EI), and MCH are absent in hypothalamic sections derived from pmch�/� animals. 3V, third ventricle; ic, internalcapsule; f, fornix; IHy, incerto hypothalamic area; LHA, lateral hypothalamic area.
E479MCH REGULATES ENERGY HOMEOSTASIS DURING EARLY DEVELOPMENT
AJP-Endocrinol Metab • VOL 298 • MARCH 2010 • www.ajpendo.org
on April 1, 2010
ajpendo.physiology.orgD
ownloaded from

study compared with the M or SHP diet (109 and 112%increase in pmch�/� rats and 114 and 117% in pmch�/� rats,respectively; Fig. 2, A–C). This indicates that pmch�/� animalsare capable of increasing their body weight when presentedwith a HF diet. Longitudinal analysis of caloric intake showedthat pmch�/� animals were hypophagic on the M diet (Fig.2D), SHP diet (Fig. 2E), and HF diet (Fig. 2F). Caloric intakemeasured during 6 consecutive days in 8- and 17-wk-old ratsconfirmed these observations (Supplemental Fig. S2A) andshowed the hypophagia occurred both during the light and darkphase (Supplemental Fig. S2C). Water intake was decreased in8-wk-old pmch�/� rats on all diets and unchanged (M diet),decreased (SHP diet), or increased (HF diet) in 17-wk-oldpmch�/� rats compared with pmch�/� rats (data not shown).
Body analysis and endocrine profile of Pmch knockout rats.Body analysis of 26-wk-old pmch�/� rats (M, SHP, and HFdiet) revealed a decrease in adipose tissue, even if adiposetissue was normalized for total body weight (Fig. 3A). Liverweights were lower but showed no difference when normalizedfor total body weight, indicating that liver weights were pro-portional to the body weights (Fig. 3A). Blood analysis in24-wk-old pmch�/� rats revealed lower plasma leptin concen-trations on all three diets compared with the pmch�/� rats (Fig.3B). Plasma glucose concentrations did not differ in rats on theM diet and tended to be higher in pmch�/� rats on the SHPdiet, while on the HF diet pmch�/� rats showed higher plasma
glucose concentrations compared with pmch�/� rats (Fig. 3C).Plasma insulin concentrations were lower in pmch�/� rats onthe M or SHP diet but did not differ between genotypes on HFdiet (Fig. 3D). Plasma insulin concentrations in pmch�/� ratsseemed lower during the end of the dark phase (0400) on allthree diets (Fig. 3D). A hyperinsulinemic euglycemic clampstudy in body weight-matched pmch�/� and pmch�/� ratsrevealed no difference in basal glucose levels (pmch�/�: 5.73 �0.09 mmol/l; pmch�/�: 5.50 � 0.12 mmol/l; P � 0.14 byStudent’s t-test) or insulin levels (pmch�/�: 1.23 � 0.15 ng/ml;pmch�/�: 1.00 � 0.18 ng/ml; P � 0.36 by Student’s t-test)during an equilibrium state in the early afternoon. However,pmch�/� rats showed a lower basal endogenous glucose pro-duction (EGP) compared with pmch�/� rats, reflecting a de-creased metabolic clearance rate (Fig. 3E). Under hyperinsu-linemia (pmch�/�: 2.16 � 0.08 ng/ml; pmch�/�: 2.24 � 0.09ng/ml; P � 0.25 by Student’s t-test), both pmch�/� andpmch�/� rats showed a reduction in EGP, but no differenceswere found between groups (Fig. 3E). When comparing hy-perinsulinemic to basal values, insulin-mediated suppressionon the EGP did not differ between genotypes (pmch�/�:�63.07 � 3.67%; pmch�/�: �62.13 � 2.86%; P � 0.84 byStudent’s t-test). In addition, glucose disappearance rate (Rd)did also not differ between genotypes (pmch�/�: 94.21 � 5.43�mol · kg�1 · min�1; pmch�/�: 99.01 � 5.74 �mol · kg�1 ·min�1; P � 0.56 by Student’s t-test). These data indicate that
Fig. 2. Pmch knockout rats show a lower body weight and decreased caloric intake on 3 different diets. A: body weight of pmch�/� rats was lower comparedwith pmch�/� rats on maintenance (M) diet [□ and �; F(1,20) � 72.2, P � 0.001]. B: body weight of pmch�/� rats was lower compared with pmch�/� ratson semi-high-protein (SHP) diet [□ and �; F(1,19) � 82.6, P � 0.001]. C: body weight of pmch�/� rats was lower compared with pmch�/� rats on high-fat(HF) diet [□ and �; F(1,29) � 101.6, P � 0.001]. Rats on HF diet increased their body weight compared with rats on M or SHP diet with both genotypes[pmch�/� HF vs. pmch�/� M: F(1,25) � 18.6, P � 0.001; pmch�/� HF vs. pmch�/� M: F(1,24) � 22.9, P � 0.001; pmch�/� HF vs. pmch�/� SHP: F(1,24) �26.9, P � 0.001; pmch�/� HF vs. pmch�/� SHP: F(1,24) � 51.7, P � 0.001]. Animals on M or SHP diet showed no difference in body weight within genotype[pmch�/� M vs. pmch�/� SHP: F(1,21) � 1.6, P � 0.23; pmch�/� M vs. pmch�/� SHP: F(1,18) � 1.2, P � 0.29]. Statistical analysis also revealed an effectfor time and a time � genotype interaction for all groups. Pmch�/� rats started showing a reduced body weight per individual measurement after 22 days ofage (SHP and HF diet) or 26 days of age (M diet). D: pmch�/� rats on M diet ingested fewer calories compared with pmch�/� rats (P � 0.001 for all individualmeasurements, Student’s t-test). E: pmch�/� rats on SHP diet ingested fewer calories compared with pmch�/� rats (P � 0.001 for all individual measurements,Student’s t-test). F: pmch�/� rats on HF diet ingested fewer calories compared with pmch�/� rats (P � 0.001 for all individual measurements, Student’s t-test).Data are means � SE (n � 10–16 per group).
E480 MCH REGULATES ENERGY HOMEOSTASIS DURING EARLY DEVELOPMENT
AJP-Endocrinol Metab • VOL 298 • MARCH 2010 • www.ajpendo.org
on April 1, 2010
ajpendo.physiology.orgD
ownloaded from

pmch�/� rats have a functional and dynamic insulin system formaintaining the basal glucose production and utilization. Inline with this, IVITT revealed no difference between genotypesin whole body insulin sensitivity (Supplemental Fig. S3A).Interestingly, IVGTT showed a trend toward a slightly delayedglucose removal in response to a glucose bolus in pmch�/� ratson the SHP or HF diet (Supplemental Fig. S3A). The hypotha-
lamic-pituitary-adrenal axis activity was also investigated inthe 26-wk-old pmch�/� rats, finding a decreased thymusweight in pmch�/� rats on SHP diet (pmch�/�: 0.351 � 0.018g, pmch�/�: 0.263 � 0.014 g; P � 0.05 by Student’s t-test;n � 3–4 per group) but no difference on the other two diets(data not shown). Weight of the adrenals did not differ on anydiet (data not shown). Plasma corticosterone levels at 0800 and
Fig. 3. Pmch knockout rats show a changed endocrineprofile on 3 different diets although dynamics are intact.A: pmch�/� rats showed decreased body, total whiteadipose tissue (WAT) fat pad, and liver weights comparedwith pmch�/� rats on 3 different diets (M, SHP, and HF;n � 3–6 per group). Relative body weight was 78% (M),80% (SHP), and 77% (HF). Relative total WAT weightwas 48% (M), 51% (SHP), 54% (HF), and 61% (M),63% (SHP), and 70% (HF) when normalized for bodyweight. Relative liver weight was 71% (M), 75% (SHP),and 74% (HF). However, if liver weights were normal-ized for body weight, no difference was found betweengenotypes. B: pmch�/� rats showed decreased plasmaleptin levels during 24 h on M, SHP, and HF diet com-pared with pmch�/� rats [F(1,17) � 7.4, F(1,20) � 12.6,F(1,15) � 7.0, respectively, §P � 0.05; n � 8–12 pergroup]. C: pmch�/� rats showed unchanged plasma glu-cose levels on M diet [F(1,21) � 0.0001, P � 0.98], anelevated trend on SHP diet [F(1, 23) � 3.9, P � 0.06],and elevated glucose levels on HF diet [F(1,16) � 7.0,§P � 0.05] compared with pmch�/� rats (n � 9–13 pergroup). D: pmch�/� rats showed decreased plasma insu-lin levels on M and SHP diet, [F(1,18) � 10.0 andF(1,20) � 13.1, respectively, §P � 0.05] but unchangedinsulin levels on HF diet [F(1,15) � 1.5, P � 0.24]compared with pmch�/� rats (n � 8–12 per group).E: pmch�/� rats body weight-matched to pmch�/� ratsshowed a decreased basal endogenous glucose production(EGP) and a decreased basal metabolic clearing rate(MCR) compared with pmch�/� rats during a hyperinsu-linemic euglycemic clamp analysis (n � 6 per group).EGP levels under hyperinsulinemic conditions did notdiffer significantly between genotypes (P � 0.33 byStudent’s t-test; n � 6 per group). *P � 0.05 by Student’st-test. Data are means � SE. Black bars on the x-axes inB, C, and D indicate dark phase.
E481MCH REGULATES ENERGY HOMEOSTASIS DURING EARLY DEVELOPMENT
AJP-Endocrinol Metab • VOL 298 • MARCH 2010 • www.ajpendo.org
on April 1, 2010
ajpendo.physiology.orgD
ownloaded from

2000 also showed no differences between pmch�/� andpmch�/� rats on the M diet (data not shown).
Basal physical activity and body core temperature. Basalphysical activity measured in 10-wk-old (M, SHP, and HF) or19-wk-old (HF) rats using a home-cage monitoring system didnot differ between pmch�/� and pmch�/� rats (SupplementalFig. S4A). Body core temperature measured using telemetryrevealed no significant difference between 25-wk-old pmch�/�
and pmch�/� rats on the SHP diet (Supplemental Fig. S4B).However, pmch�/� rats showed two small peaks in body coretemperature during the night phase compared with pmch�/�
rats (Supplemental Fig. S4B).Pmch knockout rats have an altered energy balance set
point. The relative body weight of pmch�/� rats on all dietsdecreased �20% during the first 7 wk compared with pmch�/�
rats, but this difference stabilized quite abruptly during wk 8(Fig. 4A). After this stabilization, the relative body weightdifference stayed stable during the remainder of the study andthe average remained �79, 79, and 83% (M, SHP, and HF,respectively) compared with pmch�/� rats (Fig. 4A). Theobserved stabilization occurred exactly during the same weekof age, postnatal week 8 (PND 50–56), with all three diets.These results indicate that the energy balance is set differentlyin pmch�/� rats when entering adulthood and is maintained ata lower level during adulthood. The observed deviation in bodyweight between pmch�/� and pmch�/� rats during the first 8wk is mirrored by the weekly body weight growth rate, whichis decreased in pmch�/� rats during the first 8 wk comparedwith pmch�/� rats on all three diets, but approaches the levelof pmch�/� rats during adulthood (Supplemental Fig. S5,A–C). This indicates that the body weight growth rate is onlydecreased in pmch�/� rats during the first 8 wk. Body weightgrowth per calories was increased in 7-wk-old pmch�/� ratscompared with pmch�/� rats, although not significantly on theM diet (Supplemental Fig. S5D). The same pattern was ob-served in 14-wk-old rats (Supplemental Fig. S5E), indicating
that although lean, the growth efficiency of pmch�/� rats isimproved compared with pmch�/� rats after ingesting the sameamount of calories.
Pmch knockout rats show relative hypophagia during earlydevelopment and relative hyperphagia during adulthood. Toinvestigate the sudden stabilization of relative body weight, wenormalized caloric intake for body weight. After normalizationfor body weight and shown as relative caloric intake, youngpmch�/� rats (�PND 55) showed slight hypophagia, whileadult pmch�/� rats (PND 60) showed slight hyperphagia onM diet (Fig. 4B), SHP diet (Fig. 4C), and HF diet (Fig. 4D)compared with pmch�/� rats. Caloric intake measured during 6consecutive days in 8- and 17-wk-old rats confirmed theseobservations (Supplemental Fig. S2, B and D). A same “bipha-sic” pattern was observed for relative water intake on all diets(data not shown).
Hypothalamic gene expression. Because the hypothalamusis an important brain region regulating energy balance, therelative expression of a subset of hypothalamic genes in young(PND 40) and adult (PND 100) rats was investigated. At bothPND 40 and 100, expression of Pmch was almost undetectablein pmch�/� rats compared with pmch�/� rats (Fig. 5, A and B).At PND 40, expression of Fatso (Fto) was decreased, whileexpression of Mchr1, pro-opiomelanocortin (Pomc), cocaine-and amphetamine-regulated transcript (Cartpt), neuropep-tide-Y (Npy), agouti-related peptide (Agrp), and hypocretin(Hcrt; also known as orexin) was unchanged in pmch�/� ratscompared with pmch�/� rats (Fig. 5A). At PND 100, expres-sion of Hcrt and Fto was increased, expression of Mchr1 andPomc was decreased, and expression of Cartpt, Npy, and Agrpwas unchanged in pmch�/� animals compared with pmch�/�
rats (Fig. 5B).EE in Pmch knockout rats. To investigate how loss of Pmch
affects EE, indirect calorimetric analysis was performed usingmetabolic cages at PND 40 and 120. Pmch�/� rats showed alower body weight gain over time, again characterized by a
Fig. 4. Pmch knockout rats show a switch incaloric intake and relative body weight stabiliza-tion during development. A: pmch�/� ratsshowed a stabilization of relative body weightdifference during week 8 [postnatal days (PND)50–56] on all 3 diets (M, SHP, and HF) com-pared with pmch�/� rats. B: pmch�/� ratsshowed a switch in relative caloric intake nor-malized for body weight compared withpmch�/� rats on M diet. Average relative caloricintake from day 40 to day 57 is 94%. However,average relative intake from day 61 to day 145 is103%. C: pmch�/� rats showed a switch inrelative caloric intake normalized for bodyweight compared with pmch�/� rats on SHPdiet. Average relative caloric intake from day 40to day 57 was 96%. However, average relativeintake from day 61 to day 145 was 104%. D:pmch�/� rats showed a switch in relative caloricintake normalized for body weight comparedwith pmch�/� rats on HF diet. Average relativecaloric intake from day 46 to day 57 was 97%.However, average relative intake from day 61 today 117 was 102%. *P � 0.05 by Student’st-test. Data are means � SE (n �10–16 pergroup).
E482 MCH REGULATES ENERGY HOMEOSTASIS DURING EARLY DEVELOPMENT
AJP-Endocrinol Metab • VOL 298 • MARCH 2010 • www.ajpendo.org
on April 1, 2010
ajpendo.physiology.orgD
ownloaded from

sudden stabilization of relative body weight difference (Fig. 6A).Lean mass did not differ between genotypes at PND 40 but wasdecreased at PND 120 (Fig. 6B). Fat mass was decreased inpmch�/� rats at both PNDs compared with pmch�/� rats (Fig.6C). Food intake was lower in pmch�/� rats at both PNDscompared with pmch�/� rats (Fig. 6D). After normalization forlean mass, food intake remained lower compared withpmch�/� rats (Fig. 6E). In contrast, if data were normalized fortotal body mass food intake did not differ between genotypes(Fig. 6F). Absolute EE in pmch�/� rats was decreased at PND40 and 120 compared with pmch�/� rats, both during the lightand dark phase (Fig. 6G). The decreased EE in pmch�/� ratswas characterized by a decreased carbohydrate oxidation,while fat oxidation was equal between genotypes (data notshown). EE normalized for lean mass in pmch�/� rats wasdecreased at PND 40 during the light and dark phase andshowed a decreased trend during the PND 120 light and darkphase compared with pmch�/� rats (Fig. 6H). EE normalizedfor total body mass was increased at PND 120 in pmch�/� ratsduring the dark phase and showed an increased trend during thePND 40 light and dark phase and the PND 120 light phasecompared with pmch�/� rats (Fig. 6I). Fecal output per dayand fecal energy content were decreased in pmch�/� rats atboth PNDs compared with pmch�/� rats (Fig. 6, J and K). Theenergetic ratio, i.e., the fraction of EE per kcal metabolizableenergy, showed an increased trend in pmch�/� rats at PND 40
compared with pmch�/� rats but did not differ between geno-types at PND 120 (Fig. 6L).
Caloric restriction. At PND 130, body weights of pmch�/�
and pmch�/� rats decreased equally during 48-h starvation(Supplemental Fig. S6A). If body weight loss was expressed asa percentage of the body weight at the start of the starvation,pmch�/� rats showed an increased trend compared withpmch�/� rats (P � 0.06; Supplemental Fig. S6B). During 72-hrefeeding, the body weight regain showed an increased trend inpmch�/� rats compared with pmch�/� rats (P � 0.11; Supple-mental Fig. S6C). However, this trend was not observed if thebody weight regain was expressed as a percentage of the bodyweight at the end of the starvation (Supplemental Fig. S6D).During the starvation, no difference in EE was observedbetween genotypes (Supplemental Fig. S6E). However, ap-proaching the end of the starvation, pmch�/� rats showedlower EE compared with pmch�/� rats (data not shown). Thedecreased body weight regain trend in pmch�/� rats wasreflected by an impaired refeeding response compared withpmch�/� rats (Supplemental Fig. S6F). Additionally, bothpmch�/� and pmch�/� rats showed hyperphagia comparedwith basal caloric intake levels at PND 120 (87.5 vs. 70.2 and73.2 vs. 60.9 kcal/day, respectively; Fig. 6D; SupplementalFig. S6F).
Testosterone does not induce the observed stabilization ofrelative body weight. As the observed stabilization of relativebody weight and “switch” in nutrient intake behavior appearedaround the end of rat puberty (approximately between PND 55and 65), we tested the hypothesis that changes in blood testos-terone levels induced our observed phenotype. Orchiectomyduring postnatal week 5 reduced the body weight of pmch�/�
and pmch�/� rats compared with sham-operated pmch�/� andpmch�/� rats (Supplemental Fig. S7A). Both orchiectomizedpmch�/� and pmch�/� rats showed a decrease in relative bodyweight compared with sham-operated rats, although no clearstabilization pattern was observed around week 8 (Supplemen-tal Fig. S7, B and C). Sham-operated pmch�/� rats showed aclear stabilization of relative body weight compared withsham-operated pmch�/� rats around week 8, confirming obser-vations from untreated animals (Fig. 4C; Supplemental Fig.S7D). However, orchiectomized pmch�/� rats also showed astabilization of relative body weight compared with orchiecto-mized pmch�/� rats around week 8 (Supplemental Fig. S7E).Serum free testosterone levels in pmch�/� rats showed nodifference on SHP diet around PND 40 and a decreased trendon PND 60, and levels were decreased on PND 120 comparedwith pmch�/� rats (Supplemental Fig. S7F). Orchiectomyresulted in almost undetectable levels in both genotypes (Sup-plemental Fig. S7F).
Pmch knockout rats develop osteoporosis. Bone mass den-sity was reduced in pmch�/� rats at both PND 40 and 120compared with pmch�/� rats (Supplemental Fig. S8).
DISCUSSION
The key findings of this work are the demonstration thatPmch expression during early development and puberty is ofcritical importance for a normal energy balance and that loss ofPmch results in a 20% decreased energy balance that ismaintained during adulthood.
Fig. 5. Hypothalamic gene expression in Pmch knockout rats. A: gene expres-sion of a selection of hypothalamic neuropeptides at PND 40. Relativeexpression of Pmch and Fto is decreased in pmch�/� rats compared withpmch�/� rats (*P � 0.05 by Student’s t-test). B: gene expression of a selectionof hypothalamic neuropeptides at PND 100. Relative expression of Pmch,Mchr1, and Pomc is decreased, while expression of Hcrt and Fto is increasedin pmch�/� rats compared with pmch�/� rats (*P � 0.05 by Student’s t-test).Data are means � SE (n � 9 per group). Mchr1, melanin-concentratinghormone receptor 1; Pomc, pro-opiomelanocortin; Cartpt, cocaine- and am-phetamine-regulated transcript; Npy, neuropeptide-Y; Agrp, agouti-relatedpeptide; Hcrt, hypocretin; Fto, Fatso.
E483MCH REGULATES ENERGY HOMEOSTASIS DURING EARLY DEVELOPMENT
AJP-Endocrinol Metab • VOL 298 • MARCH 2010 • www.ajpendo.org
on April 1, 2010
ajpendo.physiology.orgD
ownloaded from

While the role of MCH in energy regulation is well estab-lished, it should be noted that the entire Pmch gene is inacti-vated in our rat model and that the less well-characterizedneuropeptides N-GE and N-EI are not expressed. Although
N-GE so far does not seem to have a biological function, N-EIis implicated in modulatory action on anxiety- and sexual-related behavior in female rats (20), increases luteinizinghormone release (2), and stimulates grooming, locomotion, and
Fig. 6. Energy expenditure in Pmch knockout rats. A: body weight is decreased in pmch�/� rats compared with pmch�/� rats [F(1,18) � 36.3, P � 0.001].Relative body weight stabilizes during week 7 (inset). Metabolic measurements are indicated by a triangle. B: lean mass was decreased in pmch�/� rats at PND120 but not at PND 40 compared with pmch�/� rats (*P � 0.05 by Student’s t-test). C: fat mass was decreased in pmch�/� rats at PND 40 and 120 comparedwith pmch�/� rats (*P � 0.05 by Student’s t-test). D: food intake was decreased in pmch�/� rats at PND 40 and 120 compared with pmch�/� rats (*P � 0.05by Student’s t-test). E: food intake normalized for lean mass (LM) was decreased in pmch�/� rats at PND 40 and 120 compared with pmch�/� rats (*P � 0.05by Student’s t-test). F: food intake normalized for body weight (BW) was equal between genotypes at PND 40 and 120 (93 and 103%, respectively). G: energyexpenditure was decreased in pmch�/� rats at PND 40 and 120, both during the light (L) and dark (D) phase compared with pmch�/� rats (*P � 0.05 by Student’st-test). H: energy expenditure normalized for lean mass was decreased in pmch�/� rats during the PND 40 light and dark phase (*P � 0.05 by Student’s t-test)but showed no difference during the PND 120 dark phase compared with pmch�/� rats. I: energy expenditure normalized for body weight showed increasedtrends in pmch�/� rats during the PND 40 light and dark phase and the PND 120 light phase (P � 0.07, P � 0.09, and P � 0.051, respectively, by Student’st-test) and was increased during the PND 120 dark phase compared with pmch�/� rats (*P � 0.05 by Student’s t-test). J: fecal output (dry wt per day) wasdecreased in pmch�/� rats at PND 40 and 120 compared with pmch�/� rats (*P � 0.05 by Student’s t-test). K: fecal energy loss (kcal per day) was decreasedin pmch�/� rats at PND 40 and 120 compared with pmch�/� rats (*P � 0.05 by Student’s t-test). L: energetic ratio (EE per day divided by metabolizable energyper day) showed an increased trend in pmch�/� rats at PND 40 (116%; P � 0.058 by Student’s t-test) but was equal between genotypes at PND 120 comparedwith pmch�/� rats (105%; P � 0.32 by Student’s t-test). Data are means � SE (n � 8 per group).
E484 MCH REGULATES ENERGY HOMEOSTASIS DURING EARLY DEVELOPMENT
AJP-Endocrinol Metab • VOL 298 • MARCH 2010 • www.ajpendo.org
on April 1, 2010
ajpendo.physiology.orgD
ownloaded from
rearing in male rats (57). These additional neuropeptides couldperform as of yet unknown functions, thereby contributing tophenotypes observed in this study.
Pmch�/� rats have a lower body weight and are hypophagic.Plasma leptin levels were lower in pmch�/� rats, correlatingwith the lower adipose amounts. Two independent studies (48,65) showed that MCH is a positive regulator of insulin release;thus loss of Pmch expression could explain the decreased basalplasma insulin levels and the delayed glucose clearance in theIVGTT studies. Basal insulin levels were lower especially atthe end of the dark phase, suggesting a combinatorial effect ofdecreased caloric intake and loss of MCH-stimulated insulinrelease. Basal EGP levels in the pmch�/� rats were 22% lowercompared with pmch�/� rats. However, under hyperinsuline-mic conditions, this significant difference disappeared, al-though on average levels were still 16% lower in pmch�/� rats.The inhibition of EGP levels by the hyperinsulinemic condi-tions was equal between genotypes. Moreover, IVITT studiesalso showed no difference between genotypes. These findingsindicate that pmch�/� rats react normal to insulin. Plasmaleptin, insulin, and glucose levels showed normal circadianpatterns in general, and insulin sensitivity was unchangedbetween genotypes, indicating that the system dynamics inpmch�/� rats are intact and functional, although adapted tonew homeostatic levels. Additionally, thymus weight, adrenalweight, and plasma corticosterone levels showed no cleardifferences between pmch�/� and pmch�/� rats, suggestingthat the hypothalamic-pituitary-adrenal axis is not severelyaffected in male Pmch-deficient rats.
Chronic loss of Pmch in mice resulted in hypophagia (59);however, this was characterized in adult mice only. Detailedlongitudinal analysis of feeding behavior in pmch�/� ratsconfirmed the hypophagia but also revealed a more complexphenotype. First, food intake corrected for lean mass was lowerin young and adult pmch�/� rats compared with pmch�/� rats.Secondly, when caloric intake was normalized for total bodymass, young pmch�/� rats (�PND 55) showed a slight hypo-phagia, while adult young pmch�/� rats (PND 60) showed aslight hyperphagia compared with pmch�/� rats. This indicatedthat adult pmch�/� rats consumed approximately equal orhigher amounts of calories per body weight compared withpmch�/� rats. The switch in caloric intake occurred in the sameweek for all three diets, suggesting that the effect is genetic andnot dietary, and overlapped precisely with the stabilization inrelative body weight. Moreover, not only male but also femalepmch�/� rats showed a stabilization of relative body weightaround week 8 compared with pmch�/� rats (data not shown).The body weight growth per week mirrored the above-men-tioned longitudinal feeding pattern, being lower in pmch�/�
rats compared with pmch�/� rats until around PND 60 butapproaching the level of pmch�/� rats afterwards. The in-creased body weight growth per calories in pmch�/� rats is inline with a previous report (64) showing that a caloric restric-tion induces adipocyte adaptations thus promoting fat storage.It is however important to note that loss of Pmch does notmimic temporary caloric restriction with accompanying bodyweight regain after refeeding, but results in a model of chronicvoluntary caloric restriction as rats were allowed to feed adlibitum throughout their life. Our findings suggest that Pmchexpression drives energy intake and storage to levels exceedingthe minimal need to grow during early development and
puberty but that this “overstimulation” disappears around post-natal week 8. During adulthood, Pmch expression remainsfunctional during times of starvation (50). However, our find-ings indicate that Pmch expression is especially relevant duringearly development and puberty. This is supported by theobservation that the energy balance in pmch�/� rats remained�80% compared with pmch�/� rats during the remainder ofour study. Moreover, nest-size induced food restriction of pupsuntil PND 25 decreases relative body weight, and this differ-ence in relative body weight diminishes again when animalsare given ad libitum access to chow after PND 25 (51).However, the catch-up growth is incomplete as relative bodyweight stabilizes around week 9, reflected by an increasedgrowth velocity in restricted rats until week 8 and no differencein growth velocity after week 8 (51).
The relative body weight of pmch�/� and pmch�/� ratsstarted to divert during postnatal week 3, when the pups start tofeed at their own, and stabilized around postnatal week 8 forthe remainder of the study. Increased oxygen consumption hasbeen shown for 20-wk-old mice with a loss of Pmch and17-wk-old transgenic mice with a severe loss of MCH neurons(1, 59). It is however important to note that in both situationsdata were normalized for body weight. As it is unknown if themetabolic activity of WAT is altered in pmch�/� rats and as ithas been demonstrated that WAT has a minimal contribution toEE (13), we chose to show EE not normalized, normalized forlean mass, and normalized for body weight. EE data normal-ized for body weight showed increased or a trend towardincreased EE levels in pmch�/� rats compared with pmch�/�
rats, which is in line with findings that oxygen consumptionlevels are increased in MCH�/� mice if normalized for bodyweight (1, 59). However, EE not normalized or EE normalizedfor lean mass showed decreased or a trend toward decreasedlevels in pmch�/� rats compared with pmch�/� rats. Therefore,the higher amount of nonmetabolically active WAT inpmch�/� rats might be a confounding factor underlying thecalculation of EE, and normalization for body weight can resultin incorrect conclusions.
The energetic ratio, calculated by correcting EE values forthe amount of metabolizable energy, i.e., the energy absorbedby the rat, showed an increased trend at PND 40 but did notdiffer at PND 120. These data explain why young pmch�/� rats(�PND 55) increase their body weight at a slower pacecompared with pmch�/� rats, whereas older pmch�/� ratsincrease their body weight at a similar pace compared withpmch�/� rats. We therefore conclude that loss of Pmch de-creases rather than increases EE in the rat and that the changein EE is secondary to the change in caloric intake. Thishypothesis is strengthened by our observations that bodyweight loss is equal between genotypes during 48-h starvationand that pmch�/� rats show a refeeding deficit compared withpmch�/� rats during 72-h refeeding. The lower absolute EEvalues might be related to the lower caloric intake due to alower thermic effect of food (12).
Basal locomotor activity did not differ between genotypes atvarious ages (PND 40 or 120, week 10/11 or 19), with variousdiets (M, SHP, or HF), and with different techniques (meta-bolic cage or phenotyper). This indicates that physical activitydoes not contribute to the lean phenotype of Pmch-deficientrats and supports the idea that loss of Pmch primarily results ina decrease of caloric intake. Interestingly, the Mchr1 knockout
E485MCH REGULATES ENERGY HOMEOSTASIS DURING EARLY DEVELOPMENT
AJP-Endocrinol Metab • VOL 298 • MARCH 2010 • www.ajpendo.org
on April 1, 2010
ajpendo.physiology.orgD
ownloaded from

mice show hyperphagia and an increased physical activity (8,38). Although loss of Pmch or Mchr1 both produce a leanphenotype, the aberrant behavior resulting in leanness is dif-ferent (i.e., normal activity vs. hyperactivity, and hypophagiavs. hyperphagia), and no explaining mechanisms have beenproposed to date.
Hypothalamic Pmch mRNA expression increases slowlyduring early development, increasing more rapidly after wean-ing, and stabilizes in 8-wk-old rats (49). Pmch is also expressedin Sertoli cells in rat testis where expression increased stronglybetween PND 15 and adulthood (25). Relative hypothalamicPmch expression was almost undetectable in pmch�/� rats atPND 40 and PND 100 compared with pmch�/� rats, confirm-ing our Northern blot analysis. Relative Mchr1 expression didnot differ between genotypes at PND 40, while being de-creased at PND 100 compared with pmch�/� rats, suggesting afeedback system affecting Mchr1 expression during adulthood.Relative Fto expression in pmch�/� rats was decreased at PND40 and increased at PND 100 compared with pmch�/� rats,while relative expression of Pomc and Hcrt was normal at PND40 but was decreased and increased, respectively, in pmch�/�
rats compared with pmch�/� rats at PND 100. The expressionprofiles of Npy and Agrp in adult rats confirm findings in adultmice; however, the expression profiles of Pomc and Hcrt eitherpartially agree or disagree with findings in adult mice (1, 59).In summary, the time-related differences in expression profilesand a likely interaction between Pmch and the orexigenic andanorectic systems studied here could offer an explanation to thesudden stabilization of relative body weight but remain to bestudied in more detail.
The stabilization of relative body weight during the end ofpuberty suggested a functional interaction between Pmch andgonadal steroids, such as testosterone. However, free testoster-one levels on PND 40 did not differ between genotypes andorchiectomy during postnatal week 5 lowered the body weightof orchiectomized rats compared with sham-operated ratswithin genotypes but did not affect the observed stabilization inrelative body weight between pmch�/� and pmch�/� ratsaround week 8. This indicates that testosterone affects theenergy balance but is not essential to induce the observedstabilization of relative body weight. Moreover, free testoster-one levels were decreased in pmch�/� rats on PND 120,suggesting that the decreased energy balance level influencedfree testosterone levels.
The osteoporotic phenotype in pmch�/� rats was alreadyobserved at PND 40 and confirms the finding that MCHR1knockout mice develop high bone turnover osteoporosis (4).Energy restriction is known to decrease bone mass density inadult rats (37), indicating that the decreased energy balance inpmch�/� rats could result in osteoporosis. Hypogonadism isanother known inducer of osteoporosis (15, 63). However,pmch�/� rats were already osteoporotic, while serum-freetestosterone levels were indifferent compared with pmch�/�
rats at PND 40, suggesting that loss of MCH signaling leads toosteoporosis independently of androgen deficiency.
The body weight of adult humans is normally relativelystable, with only a very small variance over a long period oftime (30, 52). Classic studies in rodents have shown that stablebody weights are actively maintained when animals receivecaloric restriction or when the rat’s body weight is experimen-tally elevated; animals quickly restored their body weight to
the level appropriate for their age and gender when returned tostandard conditions (62). In humans, dieting strategies com-bining energy restriction and physical activity have shownmoderate success for the reduction of body weight (23, 26).However, many individuals who have lost weight using adieting strategy will regain a large proportion or all of theweight lost within 5 years from the end of the treatment (6, 14,67), although low-fat intake in combination with high activitycan successfully slow the regain of weight (34, 68). Eventhough “short-term” (�4 wk) MCH1R-antagonism studies aresuccessful in decreasing body weight in adult rats and mice(24, 36, 39, 45), it would be very interesting to see if “long-term” (4 wk) MCH1R antagonism can chronically alter theenergy balance of adult animals successfully. Because our dataindicate that loss of Pmch can lower the energy balance andthat Pmch expression is important during early developmentand puberty, it would be even more interesting to study theeffect of MCH1R antagonism on the determination of theenergy balance in young animals.
ACKNOWLEDGEMENTS
We thank Mark Verheul for help with genotyping, Ruud Bueters forpreliminary studies, Ies Nijman and Victor Guryev for computational help,Linda Verhagen for help with statistical analysis, and Judith Homberg forscientific discussion. Present address for M. C. J. van der Elst: Merz Pharma-ceuticals, Dept. of In Vivo Pharmacology, Preclinical Research and Develop-ment, Frankfurt am Main, Germany. Present address for B. A. Ellenbroek:Dept. of Neuropharmacology, Evotec, Hamburg, Germany.
GRANTS
Part of this work was supported by grants from the Dutch DiabetesFoundation (Grant 2004.00.027), the Nutrigenomics Consortium/Top InstituteFood and Nutrition, and the Center of Medical Systems Biology established byThe Netherlands Genomics Initiative/Netherlands Organization for ScientificResearch.
DISCLOSURES
No conflicts of interest are declared by the author(s).
REFERENCES
1. Alon T, Friedman JM. Late-onset leanness in mice with targeted ablationof melanin concentrating hormone neurons. J Neurosci 26: 389–397,2006.
2. Attademo AM, Sanchez-Borzone M, Lasaga M, Celis ME. Intracere-broventricular injection of neuropeptide EI increases serum LH in maleand female rats. Peptides 25: 1995–1999, 2004.
3. Bittencourt JC, Presse F, Arias C, Peto C, Vaughan J, Nahon JL, ValeW, Sawchenko PE. The melanin-concentrating hormone system of the ratbrain: an immuno- and hybridization histochemical characterization. JComp Neurol 319: 218–245, 1992.
4. Bohlooly YM, Mahlapuu M, Andersen H, Astrand A, Hjorth S,Svensson L, Tornell J, Snaith MR, Morgan DG, Ohlsson C. Osteopo-rosis in MCHR1-deficient mice. Biochem Biophys Res Commun 318:964–969, 2004.
5. Bouret SG, Simerly RB. Developmental programming of hypothalamicfeeding circuits. Clin Genet 70: 295–301, 2006.
6. Brownell KD, Wadden TA. Etiology and treatment of obesity: under-standing a serious, prevalent, and refractory disorder. J Consult ClinPsychol 60: 505–517, 1992.
7. Chambers J, Ames RS, Bergsma D, Muir A, Fitzgerald LR, HervieuG, Dytko GM, Foley JJ, Martin J, Liu WS, Park J, Ellis C, GangulyS, Konchar S, Cluderay J, Leslie R, Wilson S, Sarau HM. Melanin-concentrating hormone is the cognate ligand for the orphan G-protein-coupled receptor SLC-1. Nature 400: 261–265, 1999.
8. Chen Y, Hu C, Hsu CK, Zhang Q, Bi C, Asnicar M, Hsiung HM, FoxN, Slieker LJ, Yang DD, Heiman ML, Shi Y. Targeted disruption of themelanin-concentrating hormone receptor-1 results in hyperphagia andresistance to diet-induced obesity. Endocrinology 143: 2469–2477, 2002.
E486 MCH REGULATES ENERGY HOMEOSTASIS DURING EARLY DEVELOPMENT
AJP-Endocrinol Metab • VOL 298 • MARCH 2010 • www.ajpendo.org
on April 1, 2010
ajpendo.physiology.orgD
ownloaded from
9. Chung S, Hopf FW, Nagasaki H, Li CY, Belluzzi JD, Bonci A, CivelliO. The melanin-concentrating hormone system modulates cocaine reward.Proc Natl Acad Sci USA 106: 6772–6777, 2009.
10. Cuppen E, Gort E, Hazendonk E, Mudde J, van de Belt J, Nijman IJ,Guryev V, Plasterk RH. Efficient target-selected mutagenesis in Caeno-rhabditis elegans: toward a knockout for every gene. Genome Res 17:649–658, 2007.
11. Della-Zuana O, Presse F, Ortola C, Duhault J, Nahon JL, Levens N.Acute and chronic administration of melanin-concentrating hormone en-hances food intake and body weight in Wistar and Sprague-Dawley rats.Int J Obes Relat Metab Disord 26: 1289–1295, 2002.
12. Even PC, Mokhtarian A, Pele A. Practical aspects of indirect calorimetryin laboratory animals. Neurosci Biobehav Rev 18: 435–447, 1994.
13. Even PC, Rolland V, Roseau S, Bouthegourd JC, Tome D. Predictionof basal metabolism from organ size in the rat: relationship to strain,feeding, age, and obesity. Am J Physiol Regul Integr Comp Physiol 280:R1887–R1896, 2001.
14. Foreyt JP, Goodrick GK. Evidence for success of behavior modificationin weight loss and control. Ann Intern Med 119: 698–701, 1993.
15. Francis RM, Peacock M, Aaron JE, Selby PL, Taylor GA, ThompsonJ, Marshall DH, Horsman A. Osteoporosis in hypogonadal men: role ofdecreased plasma 1,25-dihydroxyvitamin D, calcium malabsorption, andlow bone formation. Bone 7: 261–268, 1986.
16. Georgescu D, Sears RM, Hommel JD, Barrot M, Bolanos CA, MarshDJ, Bednarek MA, Bibb JA, Maratos-Flier E, Nestler EJ, DiLeone RJ.The hypothalamic neuropeptide melanin-concentrating hormone acts inthe nucleus accumbens to modulate feeding behavior and forced-swimperformance. J Neurosci 25: 2933–2940, 2005.
17. Gomez F, Dallman MF. Manipulation of androgens causes differentenergetic responses to cold in 60- and 40-day-old male rats. Am J PhysiolRegul Integr Comp Physiol 280: R262–R273, 2001.
18. Gomez F, Houshyar H, Dallman MF. Marked regulatory shifts ingonadal, adrenal, and metabolic system responses to repeated restraintstress occur within a 3-week period in pubertal male rats. Endocrinology143: 2852–2862, 2002.
19. Gomori A, Ishihara A, Ito M, Mashiko S, Matsushita H, Yumoto M,Tanaka T, Tokita S, Moriya M, Iwaasa H, Kanatani A. Chronicintracerebroventricular infusion of MCH causes obesity in mice. Melanin-concentrating hormone. Am J Physiol Endocrinol Metab 284: E583–E588,2003.
20. Gonzalez MI, Baker BI, Hole DR, Wilson CA. Behavioral effects ofneuropeptide E-I (NEI) in the female rat: interactions with alpha-MSH,MCH and dopamine. Peptides 19: 1007–1016, 1998.
21. Grove KL, Grayson BE, Glavas MM, Xiao XQ, Smith MS. Develop-ment of metabolic systems. Physiol Behav 86: 646–660, 2005.
22. Guesdon B, Paradis E, Samson P, Richard D. Effects of intracerebro-ventricular and intra-accumbens melanin-concentrating hormone agonismon food intake and energy expenditure. Am J Physiol Regul Integr CompPhysiol 296: R469–R475, 2009.
23. Hammer RL, Barrier CA, Roundy ES, Bradford JM, Fisher AG.Calorie-restricted low-fat diet and exercise in obese women. Am J ClinNutr 49: 77–85, 1989.
24. Handlon AL, Zhou H. Melanin-concentrating hormone-1 receptor antag-onists for the treatment of obesity. J Med Chem 49: 4017–4022, 2006.
25. Hervieu G, Nahon JL. Pro-melanin concentrating hormone messengerribonucleic acid and peptides expression in peripheral tissues of the rat.Neuroendocrinology 61: 348–364, 1995.
26. Hill JO, Sparling PB, Shields TW, Heller PA. Effects of exercise andfood restriction on body composition and metabolic rate in obese women.Am J Clin Nutr 46: 622–630, 1987.
27. Homberg JR, Olivier JD, Smits BM, Mul JD, Mudde J, Verheul M,Nieuwenhuizen OF, Cools AR, Ronken E, Cremers T, SchoffelmeerAN, Ellenbroek BA, Cuppen E. Characterization of the serotonin trans-porter knockout rat: a selective change in the functioning of the seroto-nergic system. Neuroscience 146: 1662–1676, 2007.
28. Ito M, Gomori A, Ishihara A, Oda Z, Mashiko S, Matsushita H,Yumoto M, Sano H, Tokita S, Moriya M, Iwaasa H, Kanatani A.Characterization of MCH-mediated obesity in mice. Am J Physiol Endo-crinol Metab 284: E940–E945, 2003.
29. Keays DA, Clark TG, Flint J. Estimating the number of coding muta-tions in genotypic- and phenotypic-driven N-ethyl-N-nitrosourea (ENU)screens. Mamm Genome 17: 230–238, 2006.
30. Khosla T, Billewicz WZ. Measurement of change in body-weight. Br JNutr 18: 227–239, 1964.
31. Kokkotou E, Jeon JY, Wang X, Marino FE, Carlson M, Trombly DJ,Maratos-Flier E. Mice with MCH ablation resist diet-induced obesitythrough strain-specific mechanisms. Am J Physiol Regul Integr CompPhysiol 289: R117–R124, 2005.
32. Kokkotou EG, Tritos NA, Mastaitis JW, Slieker L, Maratos-Flier E.Melanin-concentrating hormone receptor is a target of leptin action in themouse brain. Endocrinology 142: 680–686, 2001.
33. Lembo PM, Grazzini E, Cao J, Hubatsch DA, Pelletier M, Hoffert C,St-Onge S, Pou C, Labrecque J, Groblewski T, O’Donnell D, Payza K,Ahmad S, Walker P. The receptor for the orexigenic peptide melanin-concentrating hormone is a G-protein-coupled receptor. Nat Cell Biol 1:267–271, 1999.
34. Leser MS, Yanovski SZ, Yanovski JA. A low-fat intake and greateractivity level are associated with lower weight regain 3 years aftercompleting a very-low-calorie diet. J Am Diet Assoc 102: 1252–1256,2002.
35. Ludwig DS, Tritos NA, Mastaitis JW, Kulkarni R, Kokkotou E,Elmquist J, Lowell B, Flier JS, Maratos-Flier E. Melanin-concentratinghormone overexpression in transgenic mice leads to obesity and insulinresistance. J Clin Invest 107: 379–386, 2001.
36. Luthin DR. Anti-obesity effects of small molecule melanin-concentratinghormone receptor 1 (MCHR1) antagonists. Life Sci 81: 423–440, 2007.
37. Mardon J, Zangarelli A, Walrand S, Davicco MJ, Lebecque P, Demi-gne C, Horcajada MN, Boirie Y, Coxam V. Impact of energy and caseinor whey protein intake on bone status in a rat model of age-related boneloss. Br J Nutr 99: 764–772, 2008.
38. Marsh DJ, Weingarth DT, Novi DE, Chen HY, Trumbauer ME, ChenAS, Guan XM, Jiang MM, Feng Y, Camacho RE, Shen Z, Frazier EG,Yu H, Metzger JM, Kuca SJ, Shearman LP, Gopal-Truter S, MacNeilDJ, Strack AM, MacIntyre DE, Van der Ploeg LH, Qian S. Melanin-concentrating hormone 1 receptor-deficient mice are lean, hyperactive, andhyperphagic and have altered metabolism. Proc Natl Acad Sci USA 99:3240–3245, 2002.
39. Mashiko S, Ishihara A, Gomori A, Moriya R, Ito M, Iwaasa H,Matsuda M, Feng Y, Shen Z, Marsh DJ, Bednarek MA, MacNeil DJ,Kanatani A. Antiobesity effect of a melanin-concentrating hormone 1receptor antagonist in diet-induced obese mice. Endocrinology 146: 3080–3086, 2005.
40. McMillen IC, Adam CL, Muhlhausler BS. Early origins of obesity:programming the appetite regulatory system. J Physiol 565: 9–17, 2005.
41. Nahon JL, Presse F, Bittencourt JC, Sawchenko PE, Vale W. The ratmelanin-concentrating hormone messenger ribonucleic acid encodes mul-tiple putative neuropeptides coexpressed in the dorsolateral hypothalamus.Endocrinology 125: 2056–2065, 1989.
42. Nair SG, Adams-Deutsch T, Pickens CL, Smith DG, Shaham Y.Effects of the MCH1 receptor antagonist SNAP 94847 on high-fat food-reinforced operant responding and reinstatement of food seeking in rats.Psychopharmacology (Berl) 205: 129–140. 2009.
43. Ogden CL, Carroll MD, Curtin LR, McDowell MA, Tabak CJ, FlegalKM. Prevalence of overweight and obesity in the United States, 1999–2004. JAMA 295: 1549–1555, 2006.
44. Oscai LB, McGarr JA. Evidence that the amount of food consumed inearly life fixes appetite in the rat. Am J Physiol Regul Integr Comp Physiol235: R141–R144, 1978.
45. Palani A, Shapiro S, McBriar MD, Clader JW, Greenlee WJ, Spar B,Kowalski TJ, Farley C, Cook J, van Heek M, Weig B, O’Neill K,Graziano M, Hawes B. Biaryl ureas as potent and orally efficaciousmelanin concentrating hormone receptor 1 antagonists for the treatment ofobesity. J Med Chem 48: 4746–4749, 2005.
46. Pissios P, Bradley RL, Maratos-Flier E. Expanding the scales: themultiple roles of MCH in regulating energy balance and other biologicalfunctions. Endocr Rev 27: 606–620, 2006.
47. Pissios P, Frank L, Kennedy AR, Porter DR, Marino FE, Liu FF,Pothos EN, Maratos-Flier E. Dysregulation of the mesolimbic dopaminesystem and reward in MCH�/� mice. Biol Psychiatry 64: 184–191, 2008.
48. Pissios P, Ozcan U, Kokkotou E, Okada T, Liew CW, Liu S, PetersJN, Dahlgren G, Karamchandani J, Kudva YC, Kurpad AJ, KennedyRT, Maratos-Flier E, Kulkarni RN. Melanin concentrating hormone isa novel regulator of islet function and growth. Diabetes 56: 311–319,2007.
49. Presse F, Hervieu G, Imaki T, Sawchenko PE, Vale W, Nahon JL. Ratmelanin-concentrating hormone messenger ribonucleic acid expression:marked changes during development and after stress and glucocorticoidstimuli. Endocrinology 131: 1241–1250, 1992.
E487MCH REGULATES ENERGY HOMEOSTASIS DURING EARLY DEVELOPMENT
AJP-Endocrinol Metab • VOL 298 • MARCH 2010 • www.ajpendo.org
on April 1, 2010
ajpendo.physiology.orgD
ownloaded from

50. Qu D, Ludwig DS, Gammeltoft S, Piper M, Pelleymounter MA,Cullen MJ, Mathes WF, Przypek R, Kanarek R, Maratos-Flier E. Arole for melanin-concentrating hormone in the central regulation of feed-ing behaviour. Nature 380: 243–247, 1996.
51. Remmers F, Fodor M, Delemarre-van de Waal HA. Neonatal foodrestriction permanently alters rat body dimensions and energy intake.Physiol Behav 95: 208–215, 2008.
52. Robinson MF, Watson PE. Day-to-day variations in body-weight ofyoung women. Br J Nutr 19: 225–235, 1965.
53. Rossi M, Choi SJ, O’Shea D, Miyoshi T, Ghatei MA, Bloom SR.Melanin-concentrating hormone acutely stimulates feeding, but chronicadministration has no effect on body weight. Endocrinology 138: 351–355, 1997.
54. Sailer AW, Sano H, Zeng Z, McDonald TP, Pan J, Pong SS, FeighnerSD, Tan CP, Fukami T, Iwaasa H, Hreniuk DL, Morin NR, SadowskiSJ, Ito M, Ito M, Bansal A, Ky B, Figueroa DJ, Jiang Q, Austin CP,MacNeil DJ, Ishihara A, Ihara M, Kanatani A, Van der Ploeg LH,Howard AD, Liu Q. Identification and characterization of a secondmelanin-concentrating hormone receptor, MCH-2R. Proc Natl Acad SciUSA 98: 7564–7569, 2001.
55. Saito Y, Cheng M, Leslie FM, Civelli O. Expression of the melanin-concentrating hormone (MCH) receptor mRNA in the rat brain. J CompNeurol 435: 26–40, 2001.
56. Saito Y, Nothacker HP, Wang Z, Lin SH, Leslie F, Civelli O. Molecularcharacterization of the melanin-concentrating-hormone receptor. Nature400: 265–269, 1999.
57. Sanchez M, Baker BI, Celis M. Melanin-concentrating hormone (MCH)antagonizes the effects of alpha-MSH and neuropeptide E-I on groomingand locomotor activities in the rat. Peptides 18: 393–396, 1997.
58. Shearman LP, Camacho RE, Sloan Stribling D, Zhou D, BednarekMA, Hreniuk DL, Feighner SD, Tan CP, Howard AD, Van der PloegLH, MacIntyre DE, Hickey GJ, Strack AM. Chronic MCH-1 receptormodulation alters appetite, body weight and adiposity in rats. Eur JPharmacol 475: 37–47, 2003.
59. Shimada M, Tritos NA, Lowell BB, Flier JS, Maratos-Flier E. Micelacking melanin-concentrating hormone are hypophagic and lean. Nature396: 670–674, 1998.
60. Sita LV, Elias CF, Bittencourt JC. Connectivity pattern suggests thatincerto-hypothalamic area belongs to the medial hypothalamic system.Neuroscience 148: 949–969, 2007.
61. Smits BM, Mudde JB, van de Belt J, Verheul M, Olivier J, HombergJ, Guryev V, Cools AR, Ellenbroek BA, Plasterk RH, Cuppen E.Generation of gene knockouts and mutant models in the laboratory rat byENU-driven target-selected mutagenesis. Pharmacogenet Genomics 16:159–169, 2006.
62. Steffens AB. Influence of reversible obesity on eating behavior, bloodglucose, and insulin in the rat. Am J Physiol 228: 1738–1744, 1975.
63. Stepan JJ, Lachman M, Zverina J, Pacovsky V, Baylink DJ.Castrated men exhibit bone loss: effect of calcitonin treatment onbiochemical indices of bone remodeling. J Clin Endocrinol Metab 69:523–527, 1989.
64. Sugden MC, Grimshaw RM, Holness MJ. Caloric restriction leads toregional specialisation of adipocyte function in the rat. Biochim BiophysActa 1437: 202–213, 1999.
65. Tadayyon M, Welters HJ, Haynes AC, Cluderay JE, Hervieu G.Expression of melanin-concentrating hormone receptors in insulin-pro-ducing cells: MCH stimulates insulin release in RINm5F and CRI-G1cell-lines. Biochem Biophys Res Commun 275: 709–712, 2000.
66. van Boxtel R, Toonen PW, van Roekel HS, Verheul M, Smits BM,Korving J, de Bruin A, Cuppen E. Lack of DNA mismatch repairprotein MSH6 in the rat results in hereditary non-polyposis colorectalcancer-like tumorigenesis. Carcinogenesis 29: 1290–1297, 2008.
67. van Dale D, Saris WH, ten Hoor F. Weight maintenance and restingmetabolic rate 18–40 months after a diet/exercise treatment. Int J Obes14: 347–359, 1990.
68. Wing RR, Hill JO. Successful weight loss maintenance. Annu Rev Nutr21: 323–341, 2001.
E488 MCH REGULATES ENERGY HOMEOSTASIS DURING EARLY DEVELOPMENT
AJP-Endocrinol Metab • VOL 298 • MARCH 2010 • www.ajpendo.org
on April 1, 2010
ajpendo.physiology.orgD
ownloaded from