Please see chapter errata Chapter 5 - NSF · Chapter 5 Academic Research and Development ... of...
65
Chapter 5 Academic Research and Development ♦ 5-1 Highlights..................................................................................................................................... 5-5 Spending for Academic R&D................................................................................................... 5-5 Infrastructure for Academic R&D ............................................................................................ 5-5 Cyberinfrastructure ................................................................................................................... 5-5 Doctoral Scientists and Engineers in Academia ....................................................................... 5-5 Outputs of Academic S&E Research: Articles and Patents...................................................... 5-6 Introduction .................................................................................................................................. 5-8 Chapter Overview ..................................................................................................................... 5-8 Chapter Organization ................................................................................................................ 5-8 Expenditures and Funding for Academic R&D ........................................................................... 5-8 National Academic R&D Expenditures.................................................................................... 5-8 Sources of Support for Academic S&E R&D .......................................................................... 5-9 Academic R&D Expenditures, by Field ................................................................................. 5-13 Academic R&D, by Institution Type ...................................................................................... 5-16 Infrastructure for Academic R&D ............................................................................................. 5-18 Research Facilities .................................................................................................................. 5-19 Research Equipment ............................................................................................................... 5-21 Cyberinfrastructure ................................................................................................................. 5-22 Doctoral Scientists and Engineers in Academia ........................................................................ 5-23 Trends in Academic Employment of Doctoral Scientists and Engineers ............................... 5-24 Academic Researchers ............................................................................................................ 5-29 Academic Employment in Postdoc Positions ......................................................................... 5-31 Federal Support of Doctoral Researchers in Academia .......................................................... 5-34 Outputs of S&E Research: Articles and Patents ........................................................................ 5-35 S&E Article Output ................................................................................................................ 5-35 Coauthorship and Collaboration in S&E Literature ............................................................... 5-40 Trends in Citation of S&E Articles ........................................................................................ 5-47 Citation of S&E Articles by USPTO Patents ......................................................................... 5-51 Academic Patenting ................................................................................................................ 5-53 Conclusion ................................................................................................................................. 5-57 Notes .......................................................................................................................................... 5-58 Glossary ..................................................................................................................................... 5-63 References .................................................................................................................................. 5-63 Please see chapter errata
Transcript of Please see chapter errata Chapter 5 - NSF · Chapter 5 Academic Research and Development ... of...

Chapter 5Academic Research
and Development
♦ 5-1
Highlights .....................................................................................................................................5-5Spending for Academic R&D ...................................................................................................5-5Infrastructure for Academic R&D ............................................................................................5-5Cyberinfrastructure ...................................................................................................................5-5Doctoral Scientists and Engineers in Academia .......................................................................5-5Outputs of Academic S&E Research: Articles and Patents ......................................................5-6
Introduction ..................................................................................................................................5-8Chapter Overview .....................................................................................................................5-8Chapter Organization ................................................................................................................5-8
Expenditures and Funding for Academic R&D ...........................................................................5-8National Academic R&D Expenditures ....................................................................................5-8Sources of Support for Academic S&E R&D ..........................................................................5-9Academic R&D Expenditures, by Field .................................................................................5-13Academic R&D, by Institution Type ......................................................................................5-16
Infrastructure for Academic R&D .............................................................................................5-18Research Facilities ..................................................................................................................5-19Research Equipment ...............................................................................................................5-21Cyberinfrastructure .................................................................................................................5-22
Doctoral Scientists and Engineers in Academia ........................................................................5-23Trends in Academic Employment of Doctoral Scientists and Engineers ...............................5-24Academic Researchers ............................................................................................................5-29Academic Employment in Postdoc Positions .........................................................................5-31Federal Support of Doctoral Researchers in Academia ..........................................................5-34
Outputs of S&E Research: Articles and Patents ........................................................................5-35S&E Article Output ................................................................................................................5-35Coauthorship and Collaboration in S&E Literature ...............................................................5-40Trends in Citation of S&E Articles ........................................................................................5-47Citation of S&E Articles by USPTO Patents .........................................................................5-51Academic Patenting ................................................................................................................5-53
Conclusion .................................................................................................................................5-57Notes ..........................................................................................................................................5-58Glossary .....................................................................................................................................5-63References ..................................................................................................................................5-63
Please see chapter errata

5-2 ♦ Chapter 5. Academic Research and Development
List of TablesTable 5-1. Federally financed higher education R&D expenditures funded by the
American Recovery and Reinvestment Act of 2009, by institution type and control: FYs 2010–12 .........................................................................................................................5-10
Table 5-2. Higher education R&D expenditures, by source, character of work, and institutional control: FYs 2010–12........................................................................................5-10
Table 5-3. R&D expenditures in non-S&E fields at universities and colleges: FYs 2010–12 .........................................................................................................................5-11
Table 5-4. Top six federal agencies’ shares of federally funded academic R&D expenditures: FYs 2003–12...................................................................................................5-13
Table 5-5. Total and federally financed higher education R&D expenditures passed through to subrecipients, by institutional control: FY 2012 .................................................5-18
Table 5-6. Total and federally financed higher education R&D expenditures received as a subrecipient, by institutional control: FY 2012 .............................................................5-18
Table 5-7. New construction of S&E research space in academic institutions, by field and time of construction: FYs 2002–11 ................................................................................5-20
Table 5-8. Bandwidth at academic institutions: FYs 2005–12 ..................................................5-22Table 5-9. Tenure status by field of doctorate: 1997 and 2010 .................................................5-25Table 5-10. Tenure status of academically employed SEH doctorate holders, by age:
1997 and 2010 .......................................................................................................................5-26Table 5-11. Women as percentage of SEH doctorate holders employed in academia,
by position: Selected years, 1973–2010 ................................................................................5-26Table 5-12. Foreign-trained SEH doctorate holders employed in academia, by degree
field and sex: 2010 ................................................................................................................5-27Table 5-13. Underrepresented minorities as percentage of SEH doctorate holders
employed in academia, by position: Selected years, 1973–2010 ..........................................5-28Table 5-14. Academically employed SEH doctorate holders, by age: 1995 and 2010 .............5-29Table 5-15. SEH faculty reporting research as primary work activity, by years since
doctorate and degree field: 2010 ...........................................................................................5-31Table 5-16. Full-time SEH graduate students and graduate research assistants at
universities and colleges, by degree field: Selected years, 1973–2011 ................................5-32Table 5-17. SEH doctorate holders with academic employment in postdoc position,
by demographic group: Selected years, 1973–2010 .............................................................5-33Table 5-18. SEH doctorate holders with academic employment in postdoc position,
by Carnegie institution type and years since doctorate: 2010 ...............................................5-34Table 5-19. Reasons for accepting postdoc position: 2008–10 .................................................5-34Table 5-20. S&E articles in all fields, by country/economy: 2001 and 2011 ............................5-38Table 5-21. S&E research portfolios of selected regions/countries, by field: 2011 ..................5-39Table 5-22. Share of U.S. S&E articles, by sector and field: 2012 ...........................................5-40Table 5-23. International coauthorship of S&E articles with the United States,
by selected country/economy: 2002 and 2012 ......................................................................5-43Table 5-24. Index of international collaboration on S&E articles, by selected country/
economy pair: 1997 and 2012 ...............................................................................................5-45
List of SidebarsData on the Financial and Infrastructure Resources for Academic R&D ....................................5-9National Research Council: Recommendations to Strengthen America’s Research Universities....5-12Experimental Program to Stimulate Competitive Research ......................................................5-14Postdoctoral Researchers ...........................................................................................................5-32Bibliometric Data and Terminology ..........................................................................................5-36Normalizing Coauthorship and Citation Data ............................................................................5-45Identifying Clean Energy and Pollution Control Patents ...........................................................5-54

Science and Engineering Indicators 2014 ♦ 5-3
List of FiguresFigure 5-1. Federal and nonfederal academic S&E R&D expenditures: FYs 1996–2012 ........5-13Figure 5-2. Academic S&E R&D expenditures, by source of funding: FYs 1972–2012 ..........5-13Figure 5-3. Academic R&D financed by business for selected countries: 1981–2011 .............5-15Figure 5-4. Academic R&D expenditures, by selected S&E field: FYs 1999–2012 .................5-15Figure 5-5. Federally financed academic R&D expenditures, by agency and S&E field:
FY 2012 .................................................................................................................................5-16Figure 5-6. Sources of S&E R&D funding for public and private academic institutions:
FY 2012 .................................................................................................................................5-16Figure 5-7. Share of academic S&E R&D, by institution rank in R&D expenditures:
FYs 1989–2012 .....................................................................................................................5-17Figure 5-8. Total and federally funded academic S&E R&D pass-throughs:
FYs 2000–09 .........................................................................................................................5-17Figure 5-9. Change in S&E research space in academic institutions, by 2-year period:
FYs 1988–2011 .....................................................................................................................5-19Figure 5-10. S&E research space at academic institutions, by field: FYs 2001 and 2011 ........5-19Figure 5-11. Current fund expenditures for S&E research equipment at academic
institutions, by field: FYs 2002–12 .......................................................................................5-21Figure 5-12. SEH doctorate holders employed in academia, by type of position:
1973–2010 .............................................................................................................................5-24Figure 5-13. SEH doctorate holders employed in academia, by degree field:
1973–2010 .............................................................................................................................5-25Figure 5-14. Women as percentage of SEH doctorate holders with full-time employment
in academia, by academic rank: Selected years, 1973–2010 ................................................5-27Figure 5-15. SEH doctorate holders employed in academia, by birthplace: 1973–2010 ..........5-28Figure 5-16. Full-time faculty ages 65–75 at research universities and other higher
education institutions: 1973–2010 ........................................................................................5-30Figure 5-17. Primary work activity of full-time doctoral SEH faculty: 1973–2010 .................5-30Figure 5-18. SEH doctorate holders with academic employment in postdoc position,
by degree field: Selected years, 1973–2010 ..........................................................................5-33Figure 5-19. S&E articles, by global share of selected region/country: 2001–11 .....................5-37Figure 5-20. U.S. academic and non-academic S&E articles: 1997–2012 ................................5-39Figure 5-21. Share of world articles in all fields authored by multiple authors,
institutions, and nations: 1997 and 2012 ...............................................................................5-40Figure 5-22. Share of world’s S&E articles with international collaboration,
by S&E field: 1997 and 2012 ................................................................................................5-41Figure 5-23. Share of S&E articles internationally coauthored, by selected country:
2002 and 2012 .......................................................................................................................5-42Figure 5-24. Selected country share of U.S. internationally coauthored articles:
1997 and 2012 .......................................................................................................................5-44Figure 5-25. Share of U.S. sector articles coauthored with foreign institutions, academia,
and other U.S. sectors: 2010 .................................................................................................5-47Figure 5-26. Average citations per S&E article, by country of author: 1992–2012 ..................5-48Figure 5-27. Share of selected region/country citations that are international:
1992–2012 .............................................................................................................................5-48Figure 5-28. Relative citation index to the United States, by scientific field: 2012 ..................5-49Figure 5-29. Share of U.S., EU, and China S&E articles that are in the world’s top
1% of cited articles: 2002–12 ................................................................................................5-50
Table 5-25. U.S. sector articles coauthored with other U.S. sectors and foreign institutions: 2002 and 2012 .......................................................................................................................5-46
Table 5-26. Relative citation index, by selected country/economy pair: 2012 ..........................5-49Table 5-27. Patent citations to S&E articles, by selected patent technology area and
article field: 2003–12 ...............................................................................................................5-55Table 5-A. EPSCoR and EPSCoR-like program budgets, by agency: FYs 2001–12 ................5-14
5-4 ♦ Chapter 5. Academic Research and Development
Figure 5-30. Index of highly cited articles, by selected S&E field and region/country: 2002 and 2012 .......................................................................................................................5-51
Figure 5-31. Within-U.S. article citations: Relative citation index, 1992–2012 .......................5-52Figure 5-32. Citations of U.S. S&E articles in U.S. patents, by selected S&E article
field and technology area: 2012 ............................................................................................5-52Figure 5-33. Citation of U.S. S&E articles in U.S. patents, by selected S&E field and
article author sector: 2012 .....................................................................................................5-53Figure 5-34. USPTO patents granted to U.S. and non-U.S. academic institutions:
1992–2012 .............................................................................................................................5-55Figure 5-35. EPO patents granted to U.S. and non-U.S. academic institutions:
1992–2012 .............................................................................................................................5-56Figure 5-36. U.S. academic patents, by technology area: Selected 5-year averages,
1993–2012 .............................................................................................................................5-56Figure 5-37. U.S. university patenting activities: 2002–11 .......................................................5-57
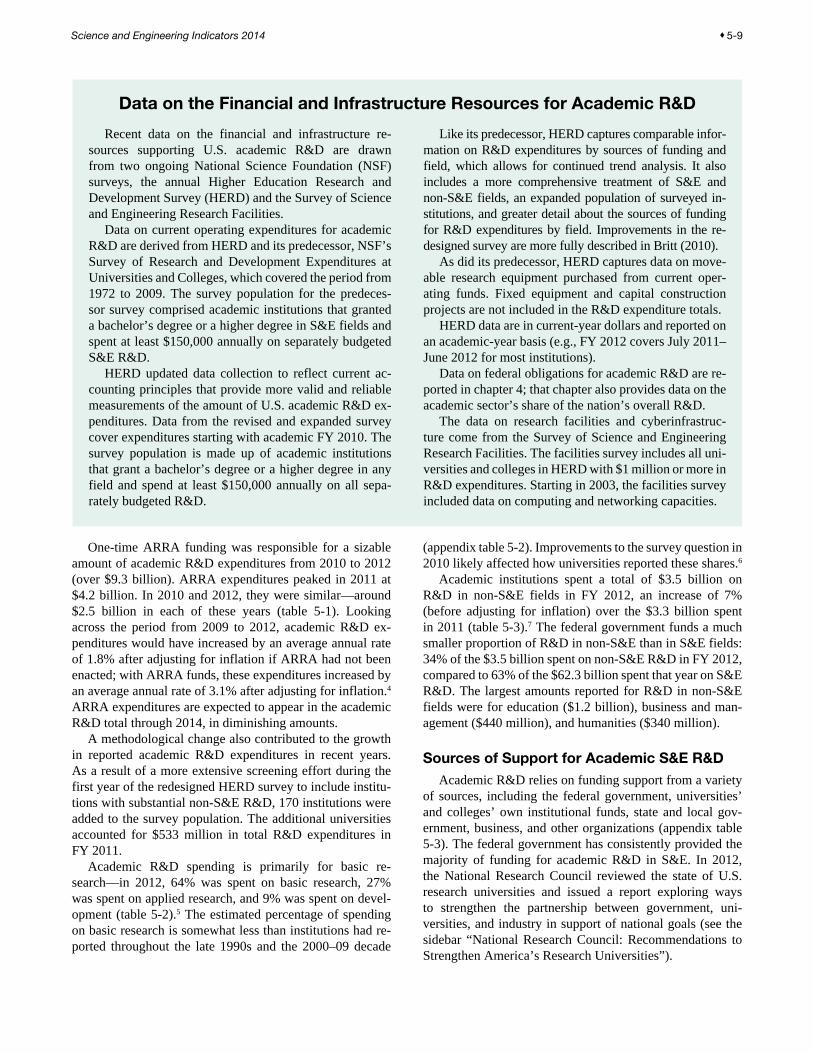
Spending for Academic R&DIn 2012, U.S. academic institutions spent $65.8 billion on research and development in all fields, including $62.3 billion on S&E R&D and an additional $3.5 billion in non-S&E fields.
♦ Academic R&D expenditures rose by almost 14% from 2009–11, with the American Recovery and Reinvestment Act of 2009 (ARRA) providing almost $7 billion during these years.
♦ In 2012, ARRA expenditures dropped to $2.5 billion. Total academic R&D expenditures increased by less than 1% from the 2011 level (and decreased by 1% after adjusting for inflation).
♦ In 2012 and throughout the past four decades, expenditures were concentrated in a relatively small number of public and private research-intensive universities.
♦ The federal government provided about 60% of total aca-demic R&D in FY 2012 (over $40 billion), a share that has remained relatively constant since the late 1980s. Six agencies provide over 90% of federal support for academic R&D in S&E—the Department of Health and Human Services (mainly through the National Institutes of Health), the National Science Foundation (NSF), the Department of Defense, the National Aeronautics and Space Administration, the Department of Energy, and the Department of Agriculture.
Institutions’ own funds provided nearly 20% of S&E R&D in FY 2012 ($12.1 billion), while state and local governments, nonprofit organizations, and businesses funded smaller shares.
♦ State and local governments funded $3.4 billion of S&E R&D in FY 2012 (5.5%).
♦ Nonprofit organizations funded $3.7 billion of S&E aca-demic R&D in FY 2012 (just under 6%).
♦ Businesses funded $3.2 billion of S&E academic R&D in FY 2012 (just over 5%).
Over the last 20 years, the distribution of academic R&D expenditures across the broad S&E fields shifted in favor of life sciences and away from physical sciences.
♦ In 2012, life sciences continued to receive the largest share (60%) of funding in academic S&E R&D.
♦ Over the last 20 years, life sciences was the only broad S&E field to experience a sizable increase in share—6 per-centage points—of total academic S&E R&D.
Infrastructure for Academic R&DResearch space at academic institutions has continued to grow annually over the last two decades, although the pace of growth has slowed in the last few years.
♦ Total research space at research-performing universities and colleges was 3.5% greater at the end of FY 2011 than it was in FY 2009.
♦ Research space for the biological and biomedical scienc-es accounted for 26.8% of all S&E research space in FY 2011, making it the largest of all the major fields.
In FY 2012, about $2.0 billion was spent for academic re-search equipment (i.e., movable items such as computers or microscopes), an 11.6% decrease from FY 2011 after adjusting for inflation.
♦ Equipment spending as a share of total R&D expenditures fell from 4.6% in FY 2001 to a three-decade low of 3.2% in FY 2012.
♦ Three S&E fields accounted for 86% of equipment ex-penditures in FY 2012: life sciences (41%), engineering (28%), and physical sciences (17%).
♦ In FY 2012, the federal share of support for all academic research equipment funding was 57%, which was below the average (58.7%) for the FY 2000–09 decade preceding the full impact of ARRA.
CyberinfrastructureAcademic networking infrastructure is rapidly expand-ing in capability and coverage.
♦ Research-performing institutions have gained greater ac-cess to high-performance networks since FY 2005, when NSF began collecting these data.
♦ Due to their research demands, doctorate-granting insti-tutions have significantly higher bandwidth access and high-performance computing resources than non-doctor-ate-granting institutions.
Doctoral Scientists and Engineers in AcademiaThe doctoral academic S&E workforce numbered about 360,000 in 2010.
♦ The U.S.-trained portion of the workforce numbered about 295,000, while the foreign-trained portion numbered about 64,000.
♦ The growth from 2008–10 in the doctoral academic S&E workforce reflects an increase in the overall population of doctoral scientists and engineers across the various sectors of the economy.
Highlights
Science and Engineering Indicators 2014 ♦ 5-5

♦ The share of all U.S.-trained S&E doctorate holders em-ployed in academia dropped from 55% in 1973 to 44% in 2010.
Among U.S.-trained S&E doctorate holders employed full-time in academia, faculty positions remained the predominant type of employment in 2010. However, the number of nonfaculty positions, including postdoctor-ates (postdocs), grew more rapidly than the number of faculty, particularly in recent years.
♦ The percentage of S&E doctorate holders employed in aca-demia who held full-time faculty positions declined from about 90% in the early 1970s to less than 75% in 2010.
♦ Compared to 1997, a smaller share of the doctoral aca-demic S&E workforce had achieved tenure in 2010. In 1997, tenured positions accounted for an estimated 53% of doctoral academic employment; this decreased to 48% in 2010.
The demographic profile of the U.S.-trained academic doctoral workforce has shifted substantially over time.
♦ The number of women in academia grew substantially between 1997 and 2010, from about 60,000 to 105,000. Women as a share of full-time senior doctoral S&E faculty also increased.
♦ In 2010, underrepresented minorities (blacks, Hispanics, and American Indians or Alaska Natives) constituted 8.3% of total U.S.-trained academic S&E doctoral employment and of full-time faculty positions, up from about 2% in 1973 and 7%–8% of these positions in 2003.
♦ The foreign-born share of U.S.-trained S&E doctorate holders in academia increased from about 12% in 1973 to 26% in 2010.
♦ In 2010, about one-half of all U.S.-trained postdocs and almost three-fourths of total academically employed post-docs were born outside of the United States.
♦ The U.S.-trained doctoral academic S&E workforce has aged substantially since 1995. In 2010, 20% of this work-force was between 60 and 75 years of age.
Since 1997, there have been modest increases in the share of full-time faculty who identify research as their prima-ry work activity.
♦ The share of full-time faculty with S&E degrees who iden-tified research as their primary work activity rose from 33% in 1997 to 36% in 2010, while the share identifying teaching as their primary activity fell from 54% to 47%.
♦ In 2010, 37% of recently degreed S&E doctoral faculty identified research as their primary work activity.
A substantial pool of academic researchers exists outside the ranks of tenure-track faculty.
♦ Approximately 40,000 S&E doctorate holders were em-ployed in academic postdoc positions in 2011. Of these, about 23,000 were trained in the United States.
♦ In 2010, 41% of recently degreed U.S.-trained S&E doc-torate holders in academia (less than 4 years beyond the doctorate) held postdoc positions, exceeding the share (35%) employed in full-time faculty positions. Among U.S.-trained S&E doctorate holders 4–7 years beyond their doctorate degrees, 13% held postdoc positions.
♦ Almost 500,000 graduate research assistants worked in academia in 2011.
For S&E as a whole and for many fields, the share of U.S.-trained academic S&E doctorate holders receiving federal support declined since the early 1990s.
♦ In 2010, about the same percentage of S&E doctorate hold-ers received federal support as had received support in the early 1970s (about 45%).
♦ During the late 1980s and very early 1990s, a somewhat higher share of S&E doctorate holders received federal support (49%).
♦ Among full-time faculty, recent doctorate recipients were less likely to receive federal support than their more estab-lished colleagues.
Outputs of Academic S&E Research: Articles and PatentsGlobal shares of S&E article output of the United States, the European Union (EU), and Japan have declined. China’s global share has risen sharply.
♦ The United States, the world’s second-largest producer, ac-counted for 26% of the world’s total S&E articles in 2011, down from 30% in 2001. The share for the EU, the world’s largest producer, also declined, from 35% in 2001 to 31% in 2011. Japan’s share fell from 9% to 6%.
♦ China grew the fastest among larger developing econo-mies, with its share rising from 3% to 11%. China has become the world’s third-largest producer of scientific ar-ticles, after the EU and the United States.
♦ Brazil and India also grew rapidly, with their global shares reaching 2% and 3%, respectively. Iran, a developing na-tion with a much smaller publication base in 2001, grew to a 1% global share by 2011.
5-6 ♦ Chapter 5. Academic Research and Development

More than two-thirds of global S&E articles had au-thors from different institutions or different countries in 2012, compared with just over half of such articles 15 years earlier.
♦ Coauthored articles with only domestic institutional au-thors increased from 36% of all articles in 1997 to 44% in 2012. Internationally coauthored articles grew from 16% to 25% over the same period.
♦ In the United States, 35% of its articles were coauthored with institutions in other countries in 2012, compared with 16% in 1997. The center of U.S. collaboration is the U.S. academic sector, which coauthored 53% of its articles with other U.S. sectors or foreign institutions in 2012.
Citation data suggest that the influence of U.S.-authored articles remains quite high but has dropped some over the past 10 years.
♦ In 2012, articles with U.S. authors were among the top 1% most-cited articles about 74% more often than expected, based on the U.S. share of all articles, compared with 85% in 2002.
♦ Between 2002 and 2012, EU-authored articles, on average, became more influential. In 2002, they were cited 21% less often than expected among the top 1% most-cited ar-ticles; in 2012, the EU improved to 6% less often. In 2012, China’s share of highly cited articles was 37% less than expected.
U.S. academic patents rose sharply from 3,300 in 2009 to 5,100 in 2012.
♦ Patents granted by the U.S. Patent and Trademark Office (USPTO) to U.S. academic institutions increased by more than 50% from 2009 to 2012, mirroring strong growth of all USTPO patents.
♦ Biotechnology patents made up 1% of all USPTO patents but 25% of U.S. university patents in 2012.
Science and Engineering Indicators 2014 ♦ 5-7

5-8 ♦ Chapter 5. Academic Research and Development
IntroductionChapter Overview
U.S. academic institutions prepare the next generation of science, engineering, and mathematics professionals and conduct about half of the nation’s basic research, giving them a central position in the nation’s research and develop-ment system.
This chapter reports trends in academic R&D inputs—funding, infrastructure, and personnel—and academic R&D outputs—journal articles, citations to these articles, and var-ious patent-based measures. (An additional major output of academic R&D, educated and trained personnel, is discussed in chapter 2.) Throughout the chapter, two key trends are explored: a generally stable distribution of academic R&D resources across different types of institutions, and a con-tinuous increase in collaboration in research and research outputs. The consistent distribution of academic resources is evident in the relatively stable pattern of R&D expendi-tures over time among the major categories of colleges and universities as well as the primacy of certain fields and agen-cies in the funding for research and research infrastructure. Growing research collaboration is seen in increases in the amount of funds that universities pass through to others and in articles that are authored by more than one department, institution, sector, or country.
Chapter OrganizationThe first section of this chapter examines trends in spend-
ing and funding for academic R&D, identifies key funders of academic R&D, and describes the allocation of funds across academic institutions and S&E fields. Because the federal government has been the primary source of funding for academic R&D for more than half a century, the section highlights the importance of federal-agency support both historically and more recently, as universities have spent American Recovery and Reinvestment Act of 2009 (ARRA) funds. This section highlights new data from the Higher Education Research and Development Survey (HERD) cov-ering 2010–12, including improved information on the dis-tribution of academic R&D among basic research, applied research, and development. This section also includes new data on R&D collaboration, as evidenced by the growth of pass-through funding arrangements.
The chapter’s second section summarizes data on infra-structure for academic R&D. The section reports on current trends in academic research facilities, research equipment, and cyberinfrastructure. These trends include changes, by field, in research space and equipment as well as data on universities’ access to high-performance computing (HPC) and networking resources.
The third section discusses trends in the employment of doctoral scientists and engineers working in academia. Major trends examined include the numbers of doctoral sci-entists and engineers who are academically employed, their
changing demographic composition, and the types of posi-tions they hold. The section further examines employment patterns in the different segments of the academic workforce that are engaged in research, especially full-time faculty, postdoctorates (postdocs), and graduate research assistants. In addition, the section reports data on academic scientists and engineers receiving research support from the federal government. A central theme in this section is that whether looking across 15–20 years or across four decades, the aca-demically employed S&E workforce, like the S&E work-force throughout the economy, has changed substantially.
The fourth and final section of this chapter analyzes trends in two types of research outputs: S&E articles, which are largely (but not exclusively) produced by the academic sec-tor, and patents issued to U.S. universities. This section first compares the volume of S&E articles for selected regions, countries, and economies, focusing (when appropriate) on patterns and trends in articles by U.S. academic researchers. Trends in coauthored articles, both across U.S. sectors and internationally, are indicators of increasing collaboration in S&E research. Trends in production of influential articles, as measured by the frequency with which articles are cited, are examined, with emphasis on international comparisons. The analysis of academic patenting activities examines patents, licenses, and income from these as forms of academic R&D output. Patent citations to the S&E literature are also exam-ined, with emphasis on citations in awarded patents for clean energy and related technologies.
Expenditures and Funding for Academic R&D
Academic R&D is a key component of the overall U.S. R&D enterprise.1 Academic scientists and engineers conduct the bulk of the nation’s basic research and are especially im-portant as a source of the new knowledge that basic research produces. Indicators tracking the status of the financial re-sources, research facilities, and instrumentation that are used in this work are discussed in this and the next section of the chapter (for an overview of the sources of data used, see sidebar, “Data on the Financial and Infrastructure Resources for Academic R&D”).
National Academic R&D ExpendituresExpenditures by U.S. colleges and universities on R&D
in all fields totaled $65.8 billion in 2012 (appendix table 5-1).2 When adjusted for inflation, academic R&D fell by 1% from 2011 to 2012.3 Expenditures in life sciences, physical sciences, and social sciences dropped by between 2% and 3% after adjusting for inflation. Expenditures in computer sciences and mathematical sciences increased by around 3% after adjusting for inflation; in other broad fields of science, expenditures remained relatively constant. Engineering expenditures increased by just below 1% after adjusting for inflation.
Science and Engineering Indicators 2014 ♦ 5-9
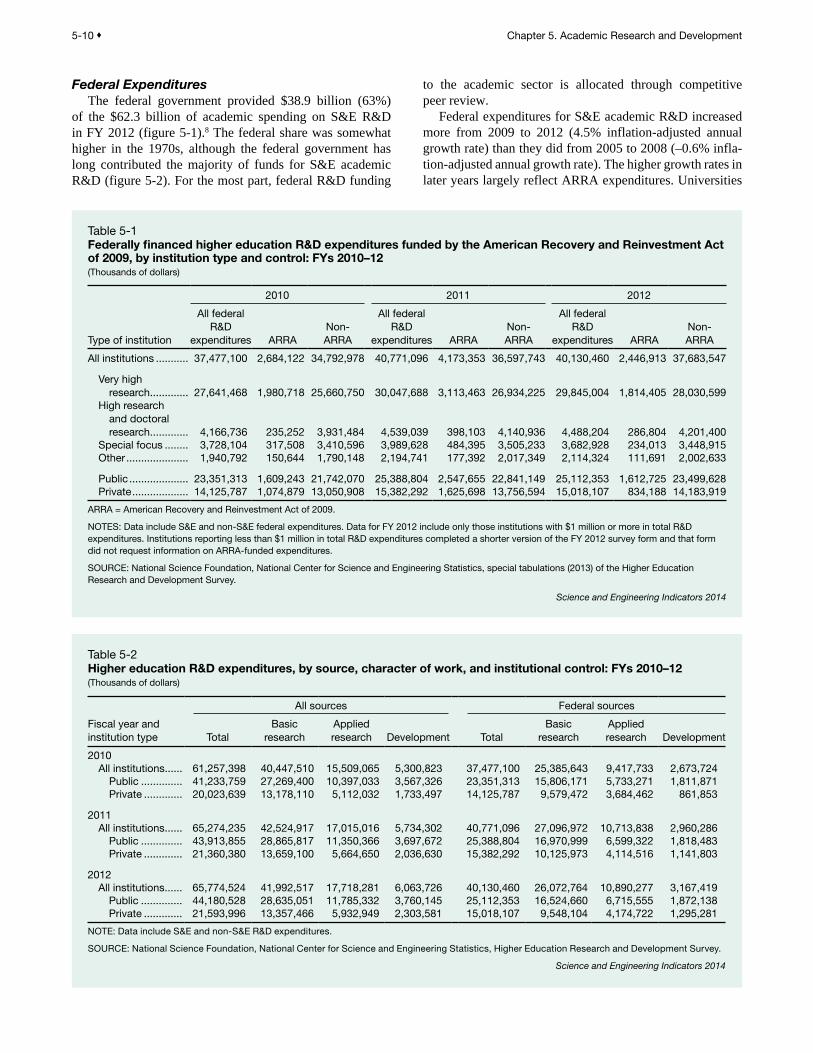
One-time ARRA funding was responsible for a sizable amount of academic R&D expenditures from 2010 to 2012 (over $9.3 billion). ARRA expenditures peaked in 2011 at $4.2 billion. In 2010 and 2012, they were similar—around $2.5 billion in each of these years (table 5-1). Looking across the period from 2009 to 2012, academic R&D ex-penditures would have increased by an average annual rate of 1.8% after adjusting for inflation if ARRA had not been enacted; with ARRA funds, these expenditures increased by an average annual rate of 3.1% after adjusting for inflation.4 ARRA expenditures are expected to appear in the academic R&D total through 2014, in diminishing amounts.
A methodological change also contributed to the growth in reported academic R&D expenditures in recent years. As a result of a more extensive screening effort during the first year of the redesigned HERD survey to include institu-tions with substantial non-S&E R&D, 170 institutions were added to the survey population. The additional universities accounted for $533 million in total R&D expenditures in FY 2011.
Academic R&D spending is primarily for basic re-search—in 2012, 64% was spent on basic research, 27% was spent on applied research, and 9% was spent on devel-opment (table 5-2).5 The estimated percentage of spending on basic research is somewhat less than institutions had re-ported throughout the late 1990s and the 2000–09 decade
(appendix table 5-2). Improvements to the survey question in 2010 likely affected how universities reported these shares.6
Academic institutions spent a total of $3.5 billion on R&D in non-S&E fields in FY 2012, an increase of 7% (before adjusting for inflation) over the $3.3 billion spent in 2011 (table 5-3).7 The federal government funds a much smaller proportion of R&D in non-S&E than in S&E fields: 34% of the $3.5 billion spent on non-S&E R&D in FY 2012, compared to 63% of the $62.3 billion spent that year on S&E R&D. The largest amounts reported for R&D in non-S&E fields were for education ($1.2 billion), business and man-agement ($440 million), and humanities ($340 million).
Sources of Support for Academic S&E R&DAcademic R&D relies on funding support from a variety
of sources, including the federal government, universities’ and colleges’ own institutional funds, state and local gov-ernment, business, and other organizations (appendix table 5-3). The federal government has consistently provided the majority of funding for academic R&D in S&E. In 2012, the National Research Council reviewed the state of U.S. research universities and issued a report exploring ways to strengthen the partnership between government, uni-versities, and industry in support of national goals (see the sidebar “National Research Council: Recommendations to Strengthen America’s Research Universities”).
Recent data on the financial and infrastructure re-sources supporting U.S. academic R&D are drawn from two ongoing National Science Foundation (NSF) surveys, the annual Higher Education Research and Development Survey (HERD) and the Survey of Science and Engineering Research Facilities.
Data on current operating expenditures for academic R&D are derived from HERD and its predecessor, NSF’s Survey of Research and Development Expenditures at Universities and Colleges, which covered the period from 1972 to 2009. The survey population for the predeces-sor survey comprised academic institutions that granted a bachelor’s degree or a higher degree in S&E fields and spent at least $150,000 annually on separately budgeted S&E R&D.
HERD updated data collection to reflect current ac-counting principles that provide more valid and reliable measurements of the amount of U.S. academic R&D ex-penditures. Data from the revised and expanded survey cover expenditures starting with academic FY 2010. The survey population is made up of academic institutions that grant a bachelor’s degree or a higher degree in any field and spend at least $150,000 annually on all sepa-rately budgeted R&D.
Like its predecessor, HERD captures comparable infor-mation on R&D expenditures by sources of funding and field, which allows for continued trend analysis. It also includes a more comprehensive treatment of S&E and non-S&E fields, an expanded population of surveyed in-stitutions, and greater detail about the sources of funding for R&D expenditures by field. Improvements in the re-designed survey are more fully described in Britt (2010).
As did its predecessor, HERD captures data on move-able research equipment purchased from current oper-ating funds. Fixed equipment and capital construction projects are not included in the R&D expenditure totals.
HERD data are in current-year dollars and reported on an academic-year basis (e.g., FY 2012 covers July 2011–June 2012 for most institutions).
Data on federal obligations for academic R&D are re-ported in chapter 4; that chapter also provides data on the academic sector’s share of the nation’s overall R&D.
The data on research facilities and cyberinfrastruc-ture come from the Survey of Science and Engineering Research Facilities. The facilities survey includes all uni-versities and colleges in HERD with $1 million or more in R&D expenditures. Starting in 2003, the facilities survey included data on computing and networking capacities.
Data on the Financial and Infrastructure Resources for Academic R&D
5-10 ♦ Chapter 5. Academic Research and Development
Table 5-1Federally financed higher education R&D expenditures funded by the American Recovery and Reinvestment Act of 2009, by institution type and control: FYs 2010–12(Thousands of dollars)
2010 2011 2012
Type of institution
All federal R&D
expenditures ARRANon- ARRA
All federal R&D
expenditures ARRANon- ARRA
All federal R&D
expenditures ARRANon- ARRA
All institutions ........... 37,477,100 2,684,122 34,792,978 40,771,096 4,173,353 36,597,743 40,130,460 2,446,913 37,683,547
Very high research ............. 27,641,468 1,980,718 25,660,750 30,047,688 3,113,463 26,934,225 29,845,004 1,814,405 28,030,599
High research and doctoral research ............. 4,166,736 235,252 3,931,484 4,539,039 398,103 4,140,936 4,488,204 286,804 4,201,400
Special focus ........ 3,728,104 317,508 3,410,596 3,989,628 484,395 3,505,233 3,682,928 234,013 3,448,915Other ..................... 1,940,792 150,644 1,790,148 2,194,741 177,392 2,017,349 2,114,324 111,691 2,002,633
Public .................... 23,351,313 1,609,243 21,742,070 25,388,804 2,547,655 22,841,149 25,112,353 1,612,725 23,499,628Private ................... 14,125,787 1,074,879 13,050,908 15,382,292 1,625,698 13,756,594 15,018,107 834,188 14,183,919
ARRA = American Recovery and Reinvestment Act of 2009.
NOTES: Data include S&E and non-S&E federal expenditures. Data for FY 2012 include only those institutions with $1 million or more in total R&D expenditures. Institutions reporting less than $1 million in total R&D expenditures completed a shorter version of the FY 2012 survey form and that form did not request information on ARRA-funded expenditures.
SOURCE: National Science Foundation, National Center for Science and Engineering Statistics, special tabulations (2013) of the Higher Education Research and Development Survey.
Science and Engineering Indicators 2014
Table 5-2Higher education R&D expenditures, by source, character of work, and institutional control: FYs 2010–12(Thousands of dollars)
All sources Federal sources
Fiscal year and institution type Total
Basic research
Applied research Development Total
Basic research
Applied research Development
2010All institutions ...... 61,257,398 40,447,510 15,509,065 5,300,823 37,477,100 25,385,643 9,417,733 2,673,724
Public .............. 41,233,759 27,269,400 10,397,033 3,567,326 23,351,313 15,806,171 5,733,271 1,811,871Private ............. 20,023,639 13,178,110 5,112,032 1,733,497 14,125,787 9,579,472 3,684,462 861,853
2011All institutions ...... 65,274,235 42,524,917 17,015,016 5,734,302 40,771,096 27,096,972 10,713,838 2,960,286
Public .............. 43,913,855 28,865,817 11,350,366 3,697,672 25,388,804 16,970,999 6,599,322 1,818,483Private ............. 21,360,380 13,659,100 5,664,650 2,036,630 15,382,292 10,125,973 4,114,516 1,141,803
2012All institutions ...... 65,774,524 41,992,517 17,718,281 6,063,726 40,130,460 26,072,764 10,890,277 3,167,419
Public .............. 44,180,528 28,635,051 11,785,332 3,760,145 25,112,353 16,524,660 6,715,555 1,872,138Private ............. 21,593,996 13,357,466 5,932,949 2,303,581 15,018,107 9,548,104 4,174,722 1,295,281
NOTE: Data include S&E and non-S&E R&D expenditures.
SOURCE: National Science Foundation, National Center for Science and Engineering Statistics, Higher Education Research and Development Survey.
Science and Engineering Indicators 2014
Federal ExpendituresThe federal government provided $38.9 billion (63%)
of the $62.3 billion of academic spending on S&E R&D in FY 2012 (figure 5-1).8 The federal share was somewhat higher in the 1970s, although the federal government has long contributed the majority of funds for S&E academic R&D (figure 5-2). For the most part, federal R&D funding
to the academic sector is allocated through competitive peer review.
Federal expenditures for S&E academic R&D increased more from 2009 to 2012 (4.5% inflation-adjusted annual growth rate) than they did from 2005 to 2008 (–0.6% infla-tion-adjusted annual growth rate). The higher growth rates in later years largely reflect ARRA expenditures. Universities

Science and Engineering Indicators 2014 ♦ 5-11
reported $4.2 billion in expenditures funded by ARRA in FY 2011 and an additional $2.4 billion in ARRA expenditures in FY 2012 (table 5-1). The distribution of ARRA funds across institutions—with just under three-quarters of these funds spent at the nation’s most research-intensive schools—gen-erally mirrored the overall federal distribution of funds for academic R&D discussed below.
Basic research activities represented 65% of federal expenditures for academic R&D in FY 2012 (table 5-2).9 Applied research represented 27%, and development activi-ties accounted for the remaining 8%. The distribution in FY 2011 was very similar. Chapter 4 provides further detail on federal obligations for academic R&D, by character of work.
Top Federal Agency SupportersSix agencies are responsible for the vast majority of annu-
al federal expenditures for academic R&D: the Department of Health and Human Services (HHS), in particular, the National Institutes of Health (NIH); the National Science Foundation (NSF); the Department of Defense (DOD); the Department of Energy (DOE); the National Aeronautics and Space Administration (NASA); and the Department of Agriculture (USDA). In federal FY 2012, these six agencies represented over 92% of the estimated $38.9 billion federal expenditures for academic S&E R&D (appendix table 5-4; chapter 4 provides data on these agencies’ obligations for academic R&D).10
Among these six agencies, HHS is by far the largest funder, providing about 56% of total federal academic S&E R&D expenditures in FY 2012. NSF and DOD follow HHS, each providing between 12% and 13%; DOE, NASA, and USDA provided smaller shares of between 3% and 5% of total federal academic S&E R&D expenditures in FY 2012. From 2003 to 2012, the relative ranking of the top six funding agencies in
terms of academic S&E R&D expenditures has remained rela-tively stable (table 5-4).
The federal government’s overall support for academic R&D is the combined result of numerous discrete funding decisions made by the R&D-supporting federal agencies, with input from the White House and Congress. Varying missions, priorities, and objectives affect the level of funds that universities and colleges receive as well as how they are spent. Broad geographic distribution of academic re-search capability and federal funding of academic R&D is one such objective. The Experimental Program to Stimulate Competitive Research (EPSCoR) is a long-standing, multia-gency federal program that seeks to increase the geographi-cal dispersion of federal support for academic R&D. An overview of the program and recent statistics on its activi-ties are presented in the sidebar “Experimental Program to Stimulate Competitive Research.”
Other Sources of FundingNotwithstanding the continuing dominant federal role in
academic S&E R&D funding, nonfederal funding sources have also grown steadily over the past 15 years (figure 5-1). Adjusted for inflation, annual growth in nonfederal funding for academic R&D averaged almost 4% from 1996 to 2012.
♦ University and college institutional funds. In FY 2012, institutional funds from universities and colleges com-prised the second-largest source of funding for academic S&E R&D, accounting for over 19% ($12.1 billion) of the total (appendix table 5-5). The share of support represented by institutional funds has remained near 20% since 1990 (appendix table 5-3). In addition to internal funding from general revenues, institutionally financed R&D includes unrecovered indirect costs and committed cost sharing.11
Table 5-3R&D expenditures in non-S&E fields at universities and colleges: FYs 2010–12(Millions of current dollars)
2010 2011 2012
FieldTotal
expendituresFederal
expendituresTotal
expendituresFederal
expendituresTotal
expendituresFederal
expenditures
All non-S&E fields .............................................. 2,897 967 3,278 1,118 3,508 1,195Business and management ........................... 368 86 400 100 442 96Communication, journalism, and
library science ............................................ 130 41 153 53 159 53Education ....................................................... 995 536 1,115 630 1,229 686Humanities ..................................................... 263 58 313 61 341 68Law ................................................................ 98 19 125 27 132 25Social work .................................................... 177 94 194 105 199 109Visual and performing arts ............................. 66 5 77 7 85 10Other non-S&E fields ..................................... 800 127 901 134 922 148
NOTE: Detail may not add to total because some respondents reporting non-S&E R&D expenditures did not break out total and federal funds by non-S&E fields.
SOURCE: National Science Foundation, National Center for Science and Engineering Statistics, Higher Education Research and Development Survey.
Science and Engineering Indicators 2014
5-12 ♦ Chapter 5. Academic Research and Development
♦ State and local government funds. State and local gov-ernments provided 5.5% ($3.4 billion) of academic S&E R&D funding in FY 2012. The state and local government funding share has declined from a peak of 10% in the early 1970s to below 6% in recent years. However, these figures are likely to understate the actual contribution of state and local governments to academic R&D, particularly for pub-lic institutions, because they reflect only funds that these governments directly target to academic R&D activities.12 They exclude any general-purpose, state government, or
local government appropriations that academic institu-tions designate and use to fund separately budgeted re-search or to pay for unrecovered indirect costs; such funds are categorized as institutional funds. (See chapter 8, “State Indicators,” for some indicators of academic R&D by state.)
♦ Nonprofit funds. Nonprofit organizations provided 5.9% ($3.7 billion) of academic S&E R&D funding in FY 2012, a slightly higher share than that provided by state and lo-cal governments. A relatively large share of S&E nonprofit
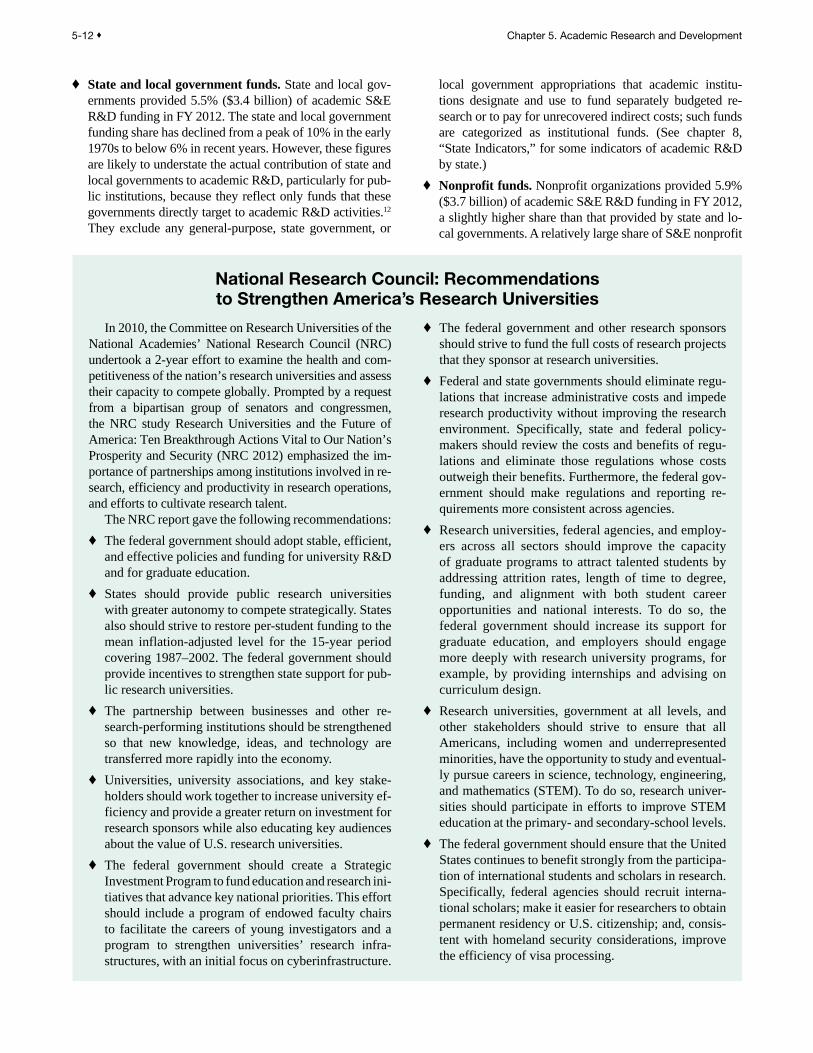
In 2010, the Committee on Research Universities of the National Academies’ National Research Council (NRC) undertook a 2-year effort to examine the health and com-petitiveness of the nation’s research universities and assess their capacity to compete globally. Prompted by a request from a bipartisan group of senators and congressmen, the NRC study Research Universities and the Future of America: Ten Breakthrough Actions Vital to Our Nation’s Prosperity and Security (NRC 2012) emphasized the im-portance of partnerships among institutions involved in re-search, efficiency and productivity in research operations, and efforts to cultivate research talent.
The NRC report gave the following recommendations: ♦ The federal government should adopt stable, efficient,
and effective policies and funding for university R&D and for graduate education.
♦ States should provide public research universities with greater autonomy to compete strategically. States also should strive to restore per-student funding to the mean inflation-adjusted level for the 15-year period covering 1987–2002. The federal government should provide incentives to strengthen state support for pub-lic research universities.
♦ The partnership between businesses and other re-search-performing institutions should be strengthened so that new knowledge, ideas, and technology are transferred more rapidly into the economy.
♦ Universities, university associations, and key stake-holders should work together to increase university ef-ficiency and provide a greater return on investment for research sponsors while also educating key audiences about the value of U.S. research universities.
♦ The federal government should create a Strategic Investment Program to fund education and research ini-tiatives that advance key national priorities. This effort should include a program of endowed faculty chairs to facilitate the careers of young investigators and a program to strengthen universities’ research infra-structures, with an initial focus on cyberinfrastructure.
♦ The federal government and other research sponsors should strive to fund the full costs of research projects that they sponsor at research universities.
♦ Federal and state governments should eliminate regu-lations that increase administrative costs and impede research productivity without improving the research environment. Specifically, state and federal policy-makers should review the costs and benefits of regu-lations and eliminate those regulations whose costs outweigh their benefits. Furthermore, the federal gov-ernment should make regulations and reporting re-quirements more consistent across agencies.
♦ Research universities, federal agencies, and employ-ers across all sectors should improve the capacity of graduate programs to attract talented students by addressing attrition rates, length of time to degree, funding, and alignment with both student career opportunities and national interests. To do so, the federal government should increase its support for graduate education, and employers should engage more deeply with research university programs, for example, by providing internships and advising on curriculum design.
♦ Research universities, government at all levels, and other stakeholders should strive to ensure that all Americans, including women and underrepresented minorities, have the opportunity to study and eventual-ly pursue careers in science, technology, engineering, and mathematics (STEM). To do so, research univer-sities should participate in efforts to improve STEM education at the primary- and secondary-school levels.
♦ The federal government should ensure that the United States continues to benefit strongly from the participa-tion of international students and scholars in research. Specifically, federal agencies should recruit interna-tional scholars; make it easier for researchers to obtain permanent residency or U.S. citizenship; and, consis-tent with homeland security considerations, improve the efficiency of visa processing.
National Research Council: Recommendations to Strengthen America’s Research Universities

Science and Engineering Indicators 2014 ♦ 5-13
funding (73%) is directed toward R&D in life sciences. Life sciences comprise somewhat less (60%) of total fed-eral funding for S&E academic R&D (appendix table 5-5).
♦ Business funds. At $3.2 billion in FY 2012, support from the business sector accounts for the smallest share of aca-demic S&E R&D funding (5.1%). Support for academia has never been a major component of business-funded R&D in the United States, although it is in some other countries (figure 5-3).
♦ Other sources of funds. In FY 2012, all other sources of support, such as foreign-government funding or gifts
designated for research, accounted for less than 2% (just under $1 billion) of academic S&E R&D funding.
Academic R&D Expenditures, by FieldInvestment in academic S&E R&D is distributed across
eight broad fields, including life sciences, engineering, physical sciences, environmental sciences, social sciences, computer sciences, psychology, and mathematical sciences (appendix table 5-5). Expenditures have long been concen-trated in life sciences, which have received more than half of
Figure 5-1Federal and nonfederal academic S&E R&D expenditures: FYs 1996–2012Billions of dollars
NOTES: Data include expenditures for S&E R&D. Gross domestic product implicit price de�ators were used to convert current dollars to constant 2005 dollars.
SOURCE: National Science Foundation, National Center for Science and Engineering Statistics, Higher Education Research and Development Survey. See appendix table 5-2.
Science and Engineering Indicators 2014
1996 1998 2000 2002 2004 2006 2008 2010 20120
5
10
15
20
25
30
35
40
45
Federal (constant2005 dollars)
Federal (current dollars)
Nonfederal(constant2005 dollars)
Nonfederal(current dollars)
Figure 5-2Academic S&E R&D expenditures, by source of funding: FYs 1972–2012Percent
SOURCE: National Science Foundation, National Center for Science and Engineering Statistics, Higher Education Research and Development Survey.
Science and Engineering Indicators 2014
1972 1976 1980 1984 1988 1992 1996 2000 2004 2008 20120
10
20
30
40
50
60
70
80
Federal government
State/local government
Business
Academic institutions
All other sources
Table 5-4Top six federal agencies’ shares of federally funded academic R&D expenditures: FYs 2003–12(Percent)
Agency 2003 2004 2005 2006 2007 2008 2009 2010 2011 2012
Health and Human Services ............ 44.3 51.8 55.8 56.7 56.1 56.0 55.4 57.3 57.4 55.6National Science Foundation .......... 9.9 11.7 12.1 11.9 11.7 12.1 12.1 12.5 12.5 13.0Department of Defense ................... 8.2 9.0 8.9 9.2 9.1 9.8 10.4 12.1 12.0 12.4Department of Energy ..................... 3.3 3.4 3.6 3.7 3.7 3.6 3.8 4.2 4.7 5.0National Aeronautics and
Space Administration................... 3.8 4.0 3.9 3.5 3.5 3.4 3.4 4.0 3.6 3.4Department of Agriculture ............... 2.6 2.8 2.8 2.9 3.0 2.9 2.8 2.6 2.5 2.8
NOTE: Health and Human Services includes primarily the National Institutes of Health.
SOURCE: National Science Foundation, National Center for Science and Engineering Statistics, special tabulations (2013) of the Higher Education Research and Development Survey.
Science and Engineering Indicators 2014

5-14 ♦ Chapter 5. Academic Research and Development
all academic R&D expenditures for more than three decades. Life sciences consist primarily of medical sciences, biologi-cal sciences, and agricultural sciences. In FY 2012, academ-ic R&D in life sciences accounted for $37.2 billion (60%) of the $62.3 billion academic S&E R&D total. R&D projects in life sciences constituted a slightly smaller share—58%—of federally supported academic S&E R&D that year.
Within life sciences, medical sciences accounted for 55% of the total academic R&D; biological sciences accounted for another 31%. Adjusted for inflation, academic R&D expenditures in medical sciences almost doubled from FY
1999 to FY 2011 (figure 5-4) and then dropped slightly in FY 2012. The sizeable increase from FY 1999 to FY 2011 resulted, in part, from a near-doubling of NIH’s budget from 1998 to 2003. Academic R&D expenditures in biological sciences (and in life sciences as a whole) increased by about 80% from FY 1999 to FY 2011 after adjusting for inflation. As with medical sciences, academic R&D expenditures in biological sciences dipped slightly in FY 2012. Meanwhile, expenditures in agricultural sciences rose slightly from FY 2011 to FY 2012.
The Experimental Program to Stimulate Competitive Research (EPSCoR) is based on the premise that univer-sities and their S&E faculty and students are valuable resources that potentially can influence a state’s devel-opment in the 21st century in much the same way that agricultural, industrial, and natural resources did in the 20th century.
EPSCoR’s purposes and early history are rooted in the early history of the National Science Foundation (NSF) and federal support of R&D. In 1978, Congress authorized NSF to initiate EPSCoR in response to broad public concerns about the extent of geographical con-centration of federal funding for R&D. Eligibility for EPSCoR participation was limited to those jurisdictions that historically have received lesser amounts of federal R&D funding and have demonstrated a commitment to develop their research bases and improve the quality of S&E research conducted at their universities and col-leges. EPSCoR sought to increase the R&D competi-tiveness of eligible states through the development and utilization of the science and technology (S&T) resources residing in their most research-oriented universities. The
program sought to achieve this objective by (1) stimulat-ing sustainable S&T infrastructure improvements at the state and institutional levels that would significantly in-crease the ability of EPSCoR researchers to compete for federal and private sector R&D funding, and (2) accel-erating the movement of EPSCoR researchers and insti-tutions into the mainstream of federal and private-sector R&D support.
The experience of the NSF EPSCoR program during the 1980s prompted Congress to authorize the creation of EPSCoR and EPSCoR-like programs in six other federal agencies: the Departments of Energy, Defense (DOD), and Agriculture; the National Aeronautics and Space Administration; the National Institutes of Health; and the Environmental Protection Agency (EPA). Two of these, EPA and DOD, discontinued issuing sepa-rate EPSCoR program solicitations in FY 2006 and FY 2010, respectively.
In FY 2012, the five remaining agencies spent a to-tal of $483.8 million on EPSCoR and EPSCoR-like pro-grams, up from $225.3 million in 2001 (table 5-A).
Experimental Program to Stimulate Competitive Research
Table 5-AEPSCoR and EPSCoR-like program budgets, by agency: FYs 2001–12(Millions of dollars)
Agency 2001 2002 2003 2004 2005 2006 2007 2008 2009 2010 2011 2012
All agencies ....... 225.3 288.9 358.0 353.3 367.4 367.1 363.1 418.9 437.2 460.1 436.0 483.8DOD ............... 18.7 15.7 15.7 8.4 11.4 11.5 9.5 17.0 14.1 0.0 0.0 0.0DOE ............... 7.7 7.7 11.7 7.7 7.6 7.3 7.3 14.7 16.8 21.6 8.5 8.5EPA ................ 2.5 2.5 2.5 2.5 2.4 0.0 0.0 0.0 0.0 0.0 0.0 0.0NASA ............. 10.0 10.0 10.0 10.0 12.0 12.5 12.8 15.5 20.0 25.0 25.0 18.4NIH ................. 100.0 160.0 210.0 214.0 222.0 220.0 218.0 223.6 224.3 228.8 226.5 276.5NSF ................ 74.8 79.3 88.8 93.7 93.4 97.8 101.5 120.0 133.0 147.1 146.8 150.9USDA ............. 11.6 13.7 19.3 17.0 18.6 18.0 14.0 28.1 29.0 37.6 29.2 29.5
DOD = Department of Defense; DOE = Department of Energy; EPA = Environmental Protection Agency; EPSCoR = Experimental Program to Stimulate Competitive Research; NASA = National Aeronautics and Space Administration; NIH = National Institutes of Health; NSF = National Science Foundation; USDA = U.S. Department of Agriculture.
NOTES: EPA and DOD discontinued issuing separate EPSCoR program solicitations in FY 2006 and FY 2010, respectively. USDA reported budget in FY 2012 includes $6.8 million in unobligated funds.
SOURCE: Data are provided by agency EPSCoR representatives and are collected by the NSF Office of Integrative Activities, Office of EPSCoR, January 2013.
Science and Engineering Indicators 2014

Science and Engineering Indicators 2014 ♦ 5-15
The other broad fields of S&E experienced different rates of growth in recent years. Growth in inflation-adjusted aca-demic R&D expenditures from FY 1999 to FY 2012 was greater in engineering (82%) than in environmental sciences (35%), physical sciences (37%), or social sciences (29%). Inflation-adjusted expenditures for computer sciences and mathematical sciences increased by from 50% to 60% from FY 1999 to FY 2012, and expenditures for psychol-ogy doubled, although the growth in these fields started at lower bases than the other broad fields of S&E (figure 5-4). Certain smaller fields within the broad fields have experi-enced steady growth in recent years. For example, academic R&D expenditures for astronomy, a field within physical sciences, although small relative to other fields, have in-creased steadily in recent years (appendix table 5-1). Even after adjusting for inflation, academic expenditures for as-tronomy grew by 34% from 2005 to 2012. Similarly, within the social sciences, sociology has also seen steady growth in recent years; from 2005 to 2012, expenditures increased by 24% after adjusting for inflation.
Agencies differ in the extent to which they focus funds on various fields of S&E (figure 5-5). HHS—primarily NIH—supports the vast majority of federal funding in life sciences (84%) and is also the lead funding agency in psychology and the social sciences. By contrast, and while their shares of total academic R&D funding are much smaller, DOD, DOE, NASA, and NSF have more diversified funding patterns. In FY 2012, NSF was the lead federal funding agency for aca-demic research in physical sciences, mathematics, computer sciences, and environmental sciences. DOD was the lead funding agency in engineering.
Federal funding has played a larger role in overall support for some fields than others (appendix table 5-5). The federal government is the dominant funder in S&E fields such as atmospheric sciences (82% in FY 2012), physics (77%), and aeronautical and astronautical engineering (76%). It plays a smaller role in other S&E fields, such as agricultural sci-ences (34%).
The federally financed proportion of R&D spending in all of the broad S&E fields has generally been stable or has increased since 1990.13 This reverses the trend between 1975 and 1990, when the federal share had declined in all the broad fields.
Figure 5-3Academic R&D financed by business for selected countries: 1981–2011Percent
NOTES: Data are from the top seven R&D performing countries. Data are not available for all countries for all years. Data for Japan for 1996 onward may not be consistent with earlier data due to changes in methodology. Data for China for 2001 and 2002 are estimated by the National Science Foundation. Data for the United States are collected as part of National Patterns of R&D Resources and differ from Higher Education Research and Development expenditures data; pass-through funds are removed.
SOURCE: Organisation for Economic Co-operation and Development, Main Science and Technology Indicators (2012/2).
Science and Engineering Indicators 2014
1981 1987 1991 1995 1999 2003 2007 2011
0
5
10
15
20
25
30
35
40
United States
Germany
France
United Kingdom
Japan
China
South Korea
Figure 5-4Academic R&D expenditures, by selected S&E field: FYs 1999–2012Billions of constant 2005 dollars
NOTE: See appendix table 4-1 for the gross domestic product implicit price de�ators used to convert current dollars to constant 2005 dollars.
SOURCE: National Science Foundation, National Center for Science and Engineering Statistics, Higher Education Research and Development Survey. See appendix table 5-1.
Science and Engineering Indicators 2014
1999 2002 2004 2006 2008 2010 20120
2
4
6
8
10
12
14
16
18
20Medical sciencesBiological sciencesEngineeringPhysical sciencesEnvironmental sciencesSocial sciences
Computer sciencesPsychologyMathematical sciences

5-16 ♦ Chapter 5. Academic Research and Development
Academic R&D, by Institution TypeThe prior discussion examined R&D for the academic
sector as a whole. This section discusses some of the differ-ences in S&E R&D conducted by public and private univer-sities and colleges. Although public and private universities rely on the same major sources of S&E R&D funding, the importance of the different sources varies substantially (figure 5-6). For example, endowments generally provide a larger share of total revenue at private universities than at public universities, while state appropriations provide a larger share of total revenue at public universities. (See the section “Trends in Higher Education Expenditures and Revenues” in chapter 2 for a discussion of average univer-sity revenue and expenditures per student at different types of institutions.)
R&D Expenditures at Public and Private Universities and Colleges
In FY 2012, public institutions spent $41.6 billion in aca-demic S&E R&D, and private institutions spent $20.6 billion, about one-half as much (appendix table 5-3). Similarly, of the top 100 academic institutions in academic R&D expenditures in 2012, two-thirds were public universities and colleges, and one-third were private schools (appendix table 5-6).
The federal government provided the majority of the S&E R&D funds that public and private institutions spent on R&D in FY 2012 (just under 60% and just over 70%, respectively). Public institutions received around 7% of their S&E R&D funds from state and local governments, while private institutions received a little less than 2%.
At both public and private academic universities, institu-tions’ own funds were a significant source of support for S&E R&D expenditures. Public academic institutions sup-ported a larger portion of their S&E R&D from their own sources—22%, compared to 13% at private institutions. This larger proportion of institutional R&D funds in public institutions may reflect the general-purpose state and local government funds that public institutions directed toward R&D. Private institutions, in contrast, reported a larger pro-portion of unrecovered indirect costs (43% of their institu-tional total in FY 2012 versus 31% for public institutions).14 Private institutions also reported a larger proportion of cost sharing (14% of their institutional total in FY 2012 versus 8% for public institutions).
Public and private institutions both received 5%–6% of their R&D support from business in FY 2012. Nonprofit organizations funded 5.5% of total R&D expenditures in public institutions and 7.4% in private institutions. Funding from all other sources was less than 2% in both public and private institutions.
DOD = Department of Defense; DOE = Department of Energy; HHS = Department of Health and Human Services; NASA = National Aeronautics and Space Administration; NSF = National Science Foundation; USDA = U.S. Department of Agriculture.
SOURCE: National Science Foundation, National Center for Science and Engineering Statistics, Higher Education Research and Development Survey, FY 2012. See appendix table 5-4.
Science and Engineering Indicators 2014
Billions
Figure 5-5Federally financed academic R&D expenditures, by agency and S&E field: FY 2012
DOD DOE HHS NASA NSF USDA0
5
10
15
20
25
Computer sciences
Environmental sciences
Life sciences
Mathematical sciences
Physical sciences
Psychology
Social sciences
Engineering
SOURCE: National Science Foundation, National Center for Science and Engineering Statistics, Higher Education Research and Development Survey, FY 2012. See appendix table 5-3.
Science and Engineering Indicators 2014
Figure 5-6Sources of S&E R&D funding for public and private academic institutions: FY 2012Percent
Federalgovernment
State/localgovernment
Business Academicinstitutions
Other0
10
20
30
40
50
60
70
80
Public Private

Science and Engineering Indicators 2014 ♦ 5-17
Distribution of R&D Funds across Academic Institutions
Academic R&D expenditures are concentrated in a rela-tively small number of institutions. In FY 2012, 907 out of a total of approximately 2,250 baccalaureate-, master’s-, and doctorate-granting institutions reported spending at least $150,000 on R&D. Of these, the top-spending 20 institutions accounted for 31% of total academic S&E R&D spending, and the top-spending 100 institutions accounted for 79% of this spending. Although there were slight shifts in the share of academic S&E R&D expenditures accounted for by the top 20 and top 100 institutions in recent years, the relative shares have been remarkably stable over the past two decades (figure 5-7). Even so, the identities of the universities in each of these groups have varied over time. The top 100 institutions in S&E R&D are listed in appendix table 5-6.
R&D Collaboration between Academic InstitutionsResearch collaboration involving multiple institutions
is a growing trend. Contributing to this growth are federal initiatives to encourage collaborative research and also tech-nological advances that facilitate communication and pro-vide opportunities to mobilize specialized skills beyond the capacity of an individual institution. Opportunities to share risk and increase research credibility have also contributed to the growth of collaborative R&D (Cummings and Kiesler 2007). Academic R&D collaboration is notably evident in the growth of jointly authored research articles (for de-tails, see the section “Outputs of Academic S&E Research: Articles and Patents” in this chapter).
This trend is also evident in flows of funds among institu-tions to support collaborative research activities. One measure of this research collaboration is the amount of total expendi-tures for R&D that universities pass through to others, includ-ing academic institutions and other entities. Available data on pass-through funding encompass S&E R&D from 2000 to 2009 and total R&D (including non-S&E as well as S&E funds) from 2010 to 2012. As with overall academic R&D funding, pass-through funding arrangements are heavily con-centrated in the most research-intensive institutions.
Between FY 2000 and FY 2009, pass-through funding for collaborative projects among universities and colleges grew more rapidly (although from a much lower base) than the decade’s growth in overall academic R&D expenditures (appendix table 5-7; see also Hale [2012]). In FY 2000, total academic S&E R&D expenditures stood at $30.1 billion; this grew to $54.9 billion in FY 2009, an increase of 47% after adjusting for inflation. In contrast, the pass-through funds that universities provided to other universities from FY 2000 to FY 2009 more than doubled over this period of time, rising from $700 million in FY 2000 to $1.9 billion in FY 2009.15
The federal government contributed extensively to the growth in pass-through funding from FY 2000 to FY 2009. Almost 90% of all pass-through funds that universities pro-vided to other universities came from federal funds during this decade (figure 5-8), a larger share than the federal gov-ernment’s share of total academic R&D expenditures.
Figure 5-7Share of academic S&E R&D, by institution rank in R&D expenditures: FYs 1989–2012Percent
SOURCE: National Science Foundation, National Center for Science and Engineering Statistics, special tabulations (2013) of the Higher Education Research and Development Survey. See appendix table 5-6.
Science and Engineering Indicators 2014
1989 1992 1994 1996 1998 2000 2002 2004 2006 2008 2010 20120
20
40
60
80
100
Top 10 institutions
Top 20 institutions
Top 100 institutions
Figure 5-8Total and federally funded academic S&E R&D pass-throughs: FYs 2000–09Millions of dollars
SOURCE: National Science Foundation, National Center for Science and Engineering Statistics, Survey of Research and Development Expenditures at Universities and Colleges.
Science and Engineering Indicators 2014
2000 2001 2002 2003 2004 2005 2006 2007 2008 20090
200
400
600
800
1,000
1,200
1,400
1,600
1,800
2,000
All academic R&D passedthrough to other universities
Federal academic R&D passed through to other universities
All academic R&Dreceived from otheruniversities
Federal academic R&D receivedfrom other universities
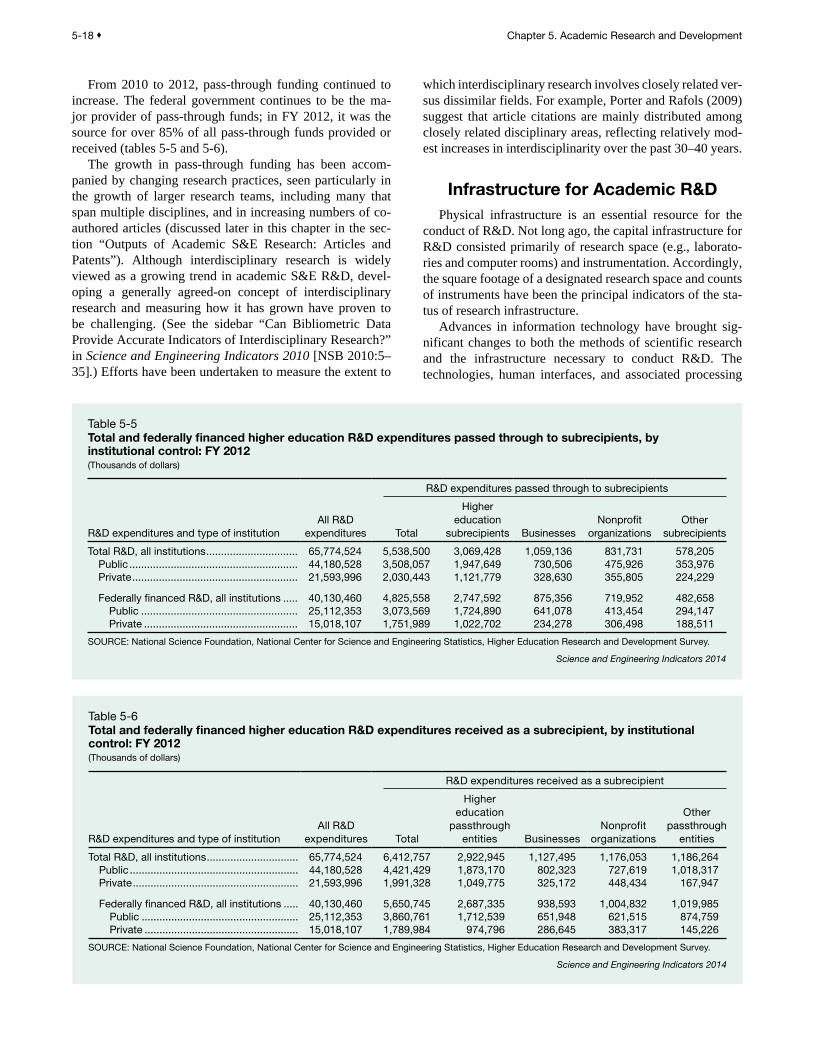
5-18 ♦ Chapter 5. Academic Research and Development
From 2010 to 2012, pass-through funding continued to increase. The federal government continues to be the ma-jor provider of pass-through funds; in FY 2012, it was the source for over 85% of all pass-through funds provided or received (tables 5-5 and 5-6).
The growth in pass-through funding has been accom-panied by changing research practices, seen particularly in the growth of larger research teams, including many that span multiple disciplines, and in increasing numbers of co-authored articles (discussed later in this chapter in the sec-tion “Outputs of Academic S&E Research: Articles and Patents”). Although interdisciplinary research is widely viewed as a growing trend in academic S&E R&D, devel-oping a generally agreed-on concept of interdisciplinary research and measuring how it has grown have proven to be challenging. (See the sidebar “Can Bibliometric Data Provide Accurate Indicators of Interdisciplinary Research?” in Science and Engineering Indicators 2010 [NSB 2010:5–35].) Efforts have been undertaken to measure the extent to
which interdisciplinary research involves closely related ver-sus dissimilar fields. For example, Porter and Rafols (2009) suggest that article citations are mainly distributed among closely related disciplinary areas, reflecting relatively mod-est increases in interdisciplinarity over the past 30–40 years.
Infrastructure for Academic R&DPhysical infrastructure is an essential resource for the
conduct of R&D. Not long ago, the capital infrastructure for R&D consisted primarily of research space (e.g., laborato-ries and computer rooms) and instrumentation. Accordingly, the square footage of a designated research space and counts of instruments have been the principal indicators of the sta-tus of research infrastructure.
Advances in information technology have brought sig-nificant changes to both the methods of scientific research and the infrastructure necessary to conduct R&D. The technologies, human interfaces, and associated processing
Table 5-5Total and federally financed higher education R&D expenditures passed through to subrecipients, by institutional control: FY 2012(Thousands of dollars)
R&D expenditures passed through to subrecipients
R&D expenditures and type of institutionAll R&D
expenditures Total
Higher education
subrecipients BusinessesNonprofit
organizationsOther
subrecipients
Total R&D, all institutions ............................... 65,774,524 5,538,500 3,069,428 1,059,136 831,731 578,205Public ......................................................... 44,180,528 3,508,057 1,947,649 730,506 475,926 353,976Private ........................................................ 21,593,996 2,030,443 1,121,779 328,630 355,805 224,229
Federally financed R&D, all institutions ..... 40,130,460 4,825,558 2,747,592 875,356 719,952 482,658Public ..................................................... 25,112,353 3,073,569 1,724,890 641,078 413,454 294,147Private .................................................... 15,018,107 1,751,989 1,022,702 234,278 306,498 188,511
SOURCE: National Science Foundation, National Center for Science and Engineering Statistics, Higher Education Research and Development Survey.
Science and Engineering Indicators 2014
Table 5-6Total and federally financed higher education R&D expenditures received as a subrecipient, by institutional control: FY 2012(Thousands of dollars)
R&D expenditures received as a subrecipient
R&D expenditures and type of institutionAll R&D
expenditures Total
Higher education
passthrough entities Businesses
Nonprofit organizations
Other passthrough
entities
Total R&D, all institutions ............................... 65,774,524 6,412,757 2,922,945 1,127,495 1,176,053 1,186,264Public ......................................................... 44,180,528 4,421,429 1,873,170 802,323 727,619 1,018,317Private ........................................................ 21,593,996 1,991,328 1,049,775 325,172 448,434 167,947
Federally financed R&D, all institutions ..... 40,130,460 5,650,745 2,687,335 938,593 1,004,832 1,019,985Public ..................................................... 25,112,353 3,860,761 1,712,539 651,948 621,515 874,759Private .................................................... 15,018,107 1,789,984 974,796 286,645 383,317 145,226
SOURCE: National Science Foundation, National Center for Science and Engineering Statistics, Higher Education Research and Development Survey.
Science and Engineering Indicators 2014

Science and Engineering Indicators 2014 ♦ 5-19
capabilities resulting from these innovations are often called cyberinfrastructure.
Cyberinfrastructure has become an essential resource for science. It helps researchers process, transfer, manage, and store large quantities of data. Cyberinfrastructure includes resources such as high-capacity networks, which are used to transfer information, and data storage systems, which are used for short-term access or long-term curation. It may also involve HPC systems used to analyze data, create vi-sualization environments, or facilitate remote use of scien-tific instrumentation (NSF 2012). Indicators for research facilities, research equipment, and cyberinfrastructure are highlighted below.
Research FacilitiesResearch Space
The nation’s research-performing colleges and universi-ties had 202.9 million net assignable square feet (NASF) of research space available at the end of FY 2011 (appendix table 5-8).16 This was 3.5% above the net assignable square footage at the end of FY 2009 and continued more than two decades of expansion. However, this increase was less than the median growth (4.7%) for all biennial periods measured from FY 1988 to FY 2011 (figure 5-9).
Biological and biomedical sciences continued to account for the bulk of growth, increasing by 8.0% during the FY 2009–11 period (appendix table 5-8). This field accounted for the largest portion of research space (26.8%), which totaled 54.3 million NASF.17 From FY 2001 to FY 2011, research space in biological and biomedical sciences grew
64.5% (figure 5-10). The related field of health and clinical sciences was the second largest in FY 2011, accounting for 36.7 million NASF and 18.1% of the total. Still sizable are engineering (31.7 million NASF, 15.6%); physical sciences (29.6 million NASF, 14.6%); and agricultural and natural resources (27.6 million NASF, 13.6%). Excluding biologi-cal and biomedical sciences, total S&E research space has grown only 1.4% since FY 2005. The growth rates have varied across the S&E fields (appendix table 5-8). The com-puter and information sciences, engineering, and psychol-ogy have all increased research space by at least 10%, while
NOTES: Space is measured in net assignable square feet. The biennial survey cycle ran on even years from FYs 1988–98 and, subsequently, on odd years from FYs 1999–2011.
SOURCE: National Science Foundation, National Center for Science and Engineering Statistics, Survey of Science and Engineering Research Facilities.
Science and Engineering Indicators 2014
Figure 5-9Change in S&E research space in academic institutions, by 2-year period: FYs 1988–2011Percent
1988–90
1990–92
1992–94
1994–96
1996–98
1999–2001
2001–03
2003–05
2005–07
2007–09
2009–11
0
2
4
6
8
10
12
Figure 5-10S&E research space at academic institutions, by field: FYs 2001 and 2011
Net assignable millions of square feet
NOTES: Research animal space was not collected in FY 2001. S&E �elds are those used in the National Center for Education Statistics (NCES) Classi�cation of Instructional Programs (CIP). NCES updates the CIP every 10 years. S&E �elds here re�ect the NCES 2010 CIP update.
SOURCES: National Science Foundation, National Center for Science and Engineering Statistics, Survey of Science and Engineering Research Facilities. See appendix table 5-8.
Science and Engineering Indicators 2014
Researchanimal space
Other �eld of S&E
Social sciences
Psychology
Physical sciences
Mathematicsand statistics
Health andclinical sciences
Engineering
Computer andinformation sciences
Biological andbiomedical sciences
Agricultural andnatural resources
FY 2011
FY 2001
0 10 20 30 40 50 60

5-20 ♦ Chapter 5. Academic Research and Development
space devoted to the other broad science fields has declined or remained the same.18
New ConstructionNew research space is added each year through new
construction projects and the repurposing of existing space. Along similar lines, some space is withdrawn from use. The
net result has been an increase in research space for more than two decades. As part of this process, academic institutions broke ground on 8.1 million NASF of new S&E research space construction projects in FYs 2010–11. This total is 50% lower than NASF constructed in FYs 2002–03 (table 5-7). Although the growth rate of new construction projects has declined over the past decade, institutions initiated new
Table 5-7New construction of S&E research space in academic institutions, by field and time of construction: FYs 2002–11
FieldStarted in FY 2002
or FY 2003Started in FY 2004
or FY 2005Started in FY 2006
or FY 2007Started in FY 2008
or FY 2009Started in FY 2010
or FY 2011
Net assignable square feet (millions)
All fields ........................................ 16.2 10.1 8.8 9.9 8.1Agricultural and natural
resources ............................... 0.8 0.4 0.5 0.4 0.4Biological and biomedical
sciences ................................ 4.0 3.2 2.9 3.5 2.0Computer and information
sciences ................................ 1.0 0.3 0.6 0.3 0.1Engineering ............................... 2.2 1.5 1.3 2.1 1.3Health and clinical sciences ..... 5.0 3.3 1.7 1.9 2.8Mathematics and statistics ....... * * * * *Physical sciences ..................... 2.1 0.8 1.0 1.0 0.9
Earth, atmospheric, and ocean sciences ........... 0.6 0.3 0.3 0.1 0.3
Astronomy, chemistry, and physics ....................... 1.5 0.5 0.7 0.9 0.6
Psychology ............................... 0.2 0.2 0.1 0.3 0.1Social sciences ......................... 0.2 0.1 0.1 0.2 0.1Other sciences .......................... 0.7 0.3 0.7 0.3 0.3
Research animal spacea ........... 1.4 1.2 1.0 0.8 0.6
Share of total new construction square feet (%)
All fields ....................................... 100.0 100.0 100.0 100.0 100.0Agricultural and natural
resources ............................... 4.9 3.9 5.7 4.0 4.9Biological and biomedical
sciences ................................ 24.7 31.4 33.0 35.4 24.7Computer and information
sciences ................................ 6.2 2.9 6.8 3.0 1.2Engineering ............................... 13.6 14.7 14.8 21.2 16.0Health and clinical sciences ..... 30.9 32.4 19.3 19.2 34.6Mathematics and statistics ....... * * * * *Physical sciences ..................... 13.0 7.8 11.4 10.1 11.1
Earth, atmospheric, and ocean sciences ........... 3.7 2.9 3.4 1.0 3.7
Astronomy, chemistry, and physics ....................... 9.3 4.9 8.0 9.1 7.4
Psychology ............................... 1.2 2.0 1.1 3.0 1.2Social sciences ......................... 1.2 1.0 1.1 2.0 1.2Other sciences .......................... 4.3 2.9 8.0 3.0 3.7
Research animal spacea ........... 8.6 11.8 11.4 8.1 7.4
* = > 0 but < 50,000 net assignable square feet.
a Figures for research animal space are listed separately and are also included in individual field totals.
NOTES: Detail may not add to total because of rounding. S&E fields are those used in the National Center for Education Statistics (NCES) Classification of Instructional Programs (CIP). NCES updates the CIP every 10 years; S&E fields here reflect the NCES 2010 CIP update. For comparison of subfields in the FY 2005 and FY 2007 surveys, see S&E Research Facilities: FY 2007, detailed statistical tables.
SOURCE: National Science Foundation, National Center for Science and Engineering Statistics, Survey of Science and Engineering Research Facilities.
Science and Engineering Indicators 2014

Science and Engineering Indicators 2014 ♦ 5-21
construction in all fields in this latest period. The health and clinical sciences and the biological and biomedical sciences fields both saw 2.0 million NASF or more of new construc-tion initiated. Engineering research space construction ac-counted for 1.3 million NASF. No other fields added more than 0.9 million NASF through new construction during this time.
Academic institutions draw on various sources to fund their capital projects, including the institutions’ own funds, state or local governments, and the federal government (ap-pendix table 5-9). Institutions provide the majority of funds for construction of new research space, typically accounting for over 60.0% of the cost. For the construction of new re-search space initiated in FYs 2010–11, 61.9% of the funding came from institutions’ internal sources, 30.5% from state and local governments, and the remaining 7.6% from the federal government. The percentage of this funding from in-stitutional sources has remained the same since FYs 2006–07.19 The federal portion of funding has been under 10.0% in recent years but declined to 3.2% in FYs 2008–09 before this recent bounce.
Repair and RenovationAcademic institutions expended $3.5 billion on ma-
jor repairs and renovations of S&E research space in FYs 2010–11 (appendix table 5-10).20 They anticipated $3.1 bil-lion in costs for planned repair and renovation of research space with start dates in FYs 2012–13. Nearly $1.0 billion was planned to improve space in biological and biomedical sciences as well as close to $1.0 billion for improvements to health and clinical sciences space. In addition to these slated improvements, academic institutions reported $4.8 billion in repair and renovation projects from their institutional plans that were not yet funded or scheduled to start in FYs 2012–13. An additional $2.6 billion in needed improvements were identified that lay beyond institutional plans. The total back-log of deferred improvements was greater than all projects started or planned for the FY 2010–13 period. The costs for deferred repairs and renovations have consistently been greater than those started or planned for similar cycles in the past.
Research EquipmentIn FY 2012, about $2.0 billion in current funds were
spent for movable S&E academic research equipment nec-essary for the conduct of organized research projects (ap-pendix table 5-11).21 This spending accounted for 3.2% of the $62.3 billion of total academic S&E R&D expenditures. Spending decreased 11.6% from FY 2011 to FY 2012 when adjusted for inflation. Expenditures for academic research equipment reached the highest mark in several decades in FY 2004. Due in part to ARRA funding, research equipment expenditures approached this level again in FYs 2010–11. After this temporary increase, the FY 2012 expenditures fell to the lowest level measured in constant dollars since FY 2001.
Research equipment expenditures continue to be concen-trated in just a few S&E fields. In FY 2012, three fields ac-counted for 85.8% of the annual total: life sciences (41.0%), engineering (28.1%), and physical sciences (16.7%). The shares for these three fields have remained similarly pre-dominant for many years (appendix table 5-11). Even so, when adjusted for inflation, the annual level of equipment spending in engineering, physical sciences, and the largest life sciences subfields of biological sciences and medical sciences declined from FY 2011 to FY 2012 to pre–FY 2010 levels (figure 5-11).
Some academic research equipment funding comes from the federal government. These federal funds are generally received as part of research grants or as separate equipment grants. In FY 2012, the federal government supported 57.0% of total academic S&E research equipment funding, which marked a 6 percentage point decline from the 25-year high reached in FY 2011 (appendix table 5-12). The federal share of funding varies significantly by S&E field, ranging from 34% to 84% in FY 2012. Atmospheric sciences had the larg-est proportion of federally funded R&D equipment (83.6%), with astronomy (83.4%) and physics (80.8%) ranking just behind. Agricultural sciences (34.1%) received the smallest
Figure 5-11Current fund expenditures for S&E research equipment at academic institutions, by field: FYs 2002–12Millions of constant 2005 dollars
NOTE: See appendix table 4-1 for gross domestic product implicit price de�ators used to convert current dollars to constant 2005 dollars.
SOURCES: National Science Foundation, National Center for Science and Engineering Statistics, Survey of Research and Development Expenditures at Universities and Colleges, and Higher Education Research and Development Survey. See appendix table 5-11.
Science and Engineering Indicators 2014
2002 2003 2004 2005 2006 2007 2008 2009 2010 2011 20120
100
200
300
400
500
600
Engineering
Medical sciences
Physical sciences
Biological sciences
Environmental sciences
Computer sciences

5-22 ♦ Chapter 5. Academic Research and Development
share of federal research equipment funding, followed by civil engineering (37.2%).
CyberinfrastructureAcademic institutions continue to enhance their cyber-
infrastructure, which is an essential component to both re-search and instruction. The cyberinfrastructure indicators noted here include access to high-speed/high-capacity band-width, dark fiber, HPC, and the ability to store large amounts of data for immediate access or long-term curation.
NetworkingNetworking is an essential component of cyberinfra-
structure. It facilitates research-related activities such as communication, data transfer, HPC, and remote use of in-strumentation.22 Universities may have networks that are available to the entire campus community for both research and nonresearch activities. The traffic on these campus net-works cannot be differentiated between administrative, in-structional, research, and general student purposes. Thus, total bandwidth capacity cannot be treated as an indicator solely of research capacity, and changes in research uses cannot be inferred from changes in bandwidth capacity.
Some cyberinfrastructure is dedicated primarily to re-search activities. For example, research-performing univer-sities may have access to high-performance networks such as Internet2, an organization established in 1997 that is composed of research, academic, industry and government partners, and National LambdaRail, a university-owned or-ganization established in 2003 that manages a 12,000-mile high-speed network.23 The Energy Sciences Network, a
DOE-funded network supporting 30 major DOE sites as well as researchers at universities and other research institutions, serves a similar purpose. Regional networks or gigapops (gigabit points of presence) facilitate access by providing networking resources and supplemental bandwidth to the national networks, which are often referred to as the net-work backbone. These resources are provided to universities as well as government agencies, federally funded research and development centers (FFRDCs), and other entities. The regional networks not only serve as network access points, they also provide advanced network services to ensure reli-able and efficient data transfer.
By FY 2012, access to high-performance networks had become widespread at research universities, which is evi-denced by the 63% of institutions reporting bandwidth of at least 1 gigabit per second (Gbps) (table 5-8). Thirty percent of academic institutions anticipated network connections of 10 Gbps or greater in FY 2012, compared with 15% of insti-tutions with such access in 2009.
Doctorate-granting institutions have significantly higher bandwidth capacity than non-doctorate-granting institutions due to their research demands. In FY 2011, the percentage of doctorate-granting institutions with bandwidth of at least 2.5 Gbps (43%) was more than 10 times greater than that of non-doctorate-granting institutions (4%). Furthermore, in FY 2012, 53% of doctorate-granting institutions estimated that they would have bandwidth of 2.5 Gbps or greater, com-pared to 5% of non-doctorate-granting institutions.
Dark fiber is fiber-optic cable that has already been laid but is not yet being used. The amount of dark fiber con-trolled by institutions indicates the ability to expand existing
Table 5-8Bandwidth at academic institutions: FYs 2005–12(Percent distribution)
Bandwidth FY 2005 FY 2007 FY 2009 FY 2011 FY 2012a
All bandwidth .............................................................................. 100 100 100 100 100No bandwidth ......................................................................... 0 0 0 0 010 Mbps or less ...................................................................... 6 3 1 1 *11 Mbps–100 Mbps ................................................................ 42 33 19 9 8101 Mbps–999 Mbps .............................................................. 30 31 35 31 271 Gbps–2.4 Gbps .................................................................... 15 23 25 28 262.5 Gbps–9 Gbps .................................................................... 4 4 5 6 710 Gbps .................................................................................. * 2 4 7 10More than 10 Gbps ................................................................. 2 4 11 18 20
More than 20 Gbpsb ............................................................ na na na 6 8
Number of institutions ................................................................ 449 448 495 539 538
* = > 0 but < 0.5%. na = not applicable; category was added to FY 2011 survey.
Gbps = gigabits/second; Mbps = megabits/second.
a Figures for 2012 are estimated.b More than 20 Gbps is a subset of more than 10 Gbps.
NOTES: Detail may not add to total because of rounding. FYs 2009, 2011, and 2012 include bandwidth to Internet1 (also termed “commodity Internet”), Internet2, and National LambdaRail. Data for FY 2005 and FY 2007 are limited to Internet1 and Internet2. The response categories in the FY 2005 survey varied slightly from those in the FYs 2007–11 surveys; in the FY 2005 survey, the categories included “1–2.5 Gbps” and “2.6–9 Gbps.”
SOURCE: National Science Foundation, National Center for Science and Engineering Statistics, Survey of Science and Engineering Research Facilities.
Science and Engineering Indicators 2014

Science and Engineering Indicators 2014 ♦ 5-23
network capabilities, either between existing campus build-ings or from the campus to an external network. The per-centage of academic institutions with these unused cables has increased steadily in recent years. The percentage of in-stitutions with dark fiber to their Internet service provider has grown from 29% in FY 2005 to 47% in FY 2011. The percentage of institutions with dark fiber between their own buildings remained high throughout this period, increasing slightly from 86% in FY 2005 to 90% in FY 2011.
High-Performance ComputingMany academic research institutions manage their HPC
resources through a distinct organizational unit within the institution that has a separate staff and budget. A total of 192 academic institutions reported ownership of centrally admin-istered HPC resources in FY 2011.24 This approach enables faculty to focus on their primary responsibilities instead of being diverted by administration and fundraising to support their own HPC. Central HPC administration can decrease overall operating expenses and create wider availability of computing resources.25 However, many HPC resources, not included here, reside beyond direct institutional administra-tion because they are supported by external funding sources.
Forty-seven percent of doctorate-granting institutions provided centrally administered HPC resources, compared to less than 9% of non-doctorate-granting institutions. Similar percentages of public doctorate-granting (48%) and private doctorate-granting (45%) institutions provided these resources. Clusters are the most common centrally admin-istered HPC architecture used by academic institutions be-cause they provide the most flexibility and cost efficiency for scaling in addition to their generally lower administra-tive costs. Over 97% of HPC-providing institutions employ cluster architectures (appendix table 5-13). HPC-providing institutions also use architectures such as massively parallel processors (11% of institutions), symmetric multiprocessors (19%), or other types of architectures (20%), all of which can be used in conjunction with or as an alternative to clusters.26
Colleges and universities often share their HPC resources with external organizations. In FY 2011, these partnerships most often involved other colleges or universities (72%). Sharing of HPC resources with other external users was fairly evenly distributed among government (21%), industry (18%), and nonprofit organizational (17%) partners. Public institutions were more likely to have external users of their HPC than were private institutions.
Data StorageAs the collection of massive data sets has increased in
recent years, data storage and curation have become an in-creasingly critical issue. Data management plans are often required in funding proposals where large data sets will be used. Of the academic institutions with centrally adminis-tered HPC in FY 2011, 56% reported usable online storage greater than 100 terabytes.27 A smaller share of public (21%)
and private institutions (18%) provided greater than 500 terabytes of online storage.
As of FY 2011, 45% of institutions with centrally admin-istered HPC reported no archival storage. Archival storage includes online and offline storage for files and data that do not support immediate access from HPC resources. This per-centage changed little from FY 2009 (43%), yet it stands much higher than FY 2007 (29%).
Doctoral Scientists and Engineers in Academia
S&E doctorate holders employed at U.S. universities and colleges hold a central role in the nation’s academic R&D enterprise. Through the R&D they undertake, S&E doctor-ate holders produce new knowledge and contribute to mar-ketplace innovation. They also teach and provide training opportunities for young people who may then go on to earn S&E doctorates and themselves train the next generation of scientists and engineers.
This section examines trends in the demographic compo-sition of the doctoral S&E academic workforce and its de-ployment across institutions, positions, and fields. Particular attention is paid to the component of the academic work-force that is more focused on research, including graduate assistants, those employed in postdoctoral positions, and researchers receiving federal support. A central message of this section is that, whether looking across 15–20 years or across four decades, the demographic composition of the academically employed S&E workforce, like the S&E work-force throughout the economy, has changed substantially. There have also been changes, although not as substantial, in how this workforce has been deployed across institu-tions, positions, and fields. Longer-term comparisons from 1973 to 2010 are made to illustrate fluctuations over mul-tiple decades and trends that, once started, have not stopped. Shorter-term comparisons (from the early to mid-1990s to 2010) are made to illustrate what the past 15–20 years have brought forth.28 Comparisons over the 7-year period from 2003 to 2010 are used in the discussion of minorities in the academically employed workforce because data prior to the early years of the 2000–09 decade are not directly compa-rable to data from 2003 to 2010.
Unless specifically noted, estimates of S&E doctorate holders in this section come from the Survey of Doctorate Recipients (SDR), a biennial NSF survey that is limited to in-dividuals, including foreign-born individuals, who received their research doctorate in science, engineering, or health at a U.S. institution. Since foreign-trained doctorate holders are also an important component of the academic doctoral workforce, this section also draws from the National Survey of College Graduates (NSCG) to provide estimates of for-eign-trained, academically employed doctorate holders, by gender and field of degree.
The SDR substantially undercounts academically em-ployed postdocs, many of whom were trained outside the

5-24 ♦ Chapter 5. Academic Research and Development
United States. To provide more complete postdoc counts, this section supplements SDR data on postdocs with data on postdocs from the Survey of Graduate Students and Postdoctorates in Science and Engineering (GSS), an annual survey jointly conducted by NSF and NIH. Data on graduate assistants are also provided from this survey. (See chapter 3 for more information on foreign-born doctorate holders working in the United States.)
Owing to the complex interrelationships among faculty and nonfaculty positions that jointly produce R&D out-comes, much of the discussion addresses the overall aca-demic employment of U.S.-trained S&E doctorate holders, regardless of position or rank. However, at various points, full-time faculty and those who work outside of the full-time faculty population are discussed separately.
Trends in Academic Employment of Doctoral Scientists and Engineers
Academic employment of doctoral scientists and en-gineers grew over the past three decades and reached an estimated 359,000 in 2010. Of this total, the large major-ity—almost 295,000—were U.S. trained. Among these, there was a substantial increase over the employment num-bers estimated in 2008 (appendix table 5-14). The change from 2008 reflects an increase in the overall population of doctoral scientists and engineers across the various sectors of the economy rather than a shift toward a higher proportion of doctoral scientists and engineers finding employment in the academic sector.
The United States is unlike many other countries in terms of the fraction of doctorate holders employed in academia. A comparison of 1990–2006 doctorate recipients in 14 countries for which data are available found that, in most of these countries, more than half of the doctorate holders were employed in academia, compared with 47% for the United States. Only the United States, Austria, and Belgium had substantial fractions of doctorate holders employed in the business sector, and the United States had one of the small-est fractions employed in government (Auriol 2010). In re-cent decades, growth in the number of doctoral scientists and engineers in the academic sector has been slower than the rate of growth in the business and government sectors, re-sulting in a decline in the academic sector’s share of all S&E doctorates from 55% in the early 1970s to just under 50% in the mid-1990s to about 44% in 2010.
Academic Employment of S&E Doctorate HoldersThe doctoral academic S&E workforce includes doctor-
ate holders in S&E who are employed at 2-year or 4-year colleges or universities, including medical schools and uni-versity research institutes. This workforce is employed in the following positions: full and associate professors (senior faculty); assistant professors (junior faculty); postdoctoral researchers (postdocs); other full-time positions, such as in-structors, lecturers, adjunct faculty, research associates, and administrators; and part-time positions of all kinds.
Full-time faculty positions as either senior or junior fac-ulty continue to be the norm in academic employment, but S&E doctorate holders are increasingly employed in other full-time positions, as postdocs, and in part-time positions (figure 5-12). Over the past 40 years, and especially since the mid-1990s, average annual growth rates have been much higher for nonfaculty and part-time positions than for full-time faculty positions. The share of full-time faculty among all U.S.-trained, academically employed S&E doctorate holders fell from almost 90% in the early 1970s to about 80% by the mid-1990s and then dropped further, to about 70% in 2010 (appendix table 5-14). From the early 1970s to 2010, the share of other full-time positions rose from 6% to 16%, the share of postdocs increased from 4% to 8%, and the share of part-time positions increased from 2% to 6% of all academic S&E doctorate holders. There has also been a
Figure 5-12SEH doctorate holders employed in academia, by type of position: 1973–2010Percent
SEH = science, engineering, and health.
NOTES: Full-time faculty includes full, associate, and assistant professors plus instructors for 1973–95; for 1997–2010, full-time faculty includes full, associate, and assistant professors. Other full-time positions include such positions as research associates, adjunct appointments, lecturers, and administrative positions for all years plus instructors for 1997–2010. Academic employment is limited to U.S. doctorate holders employed at 2- or 4-year colleges or universities, medical schools, and university research institutes. Data beginning with 2008 include all U.S.-trained doctorate recipients who lived or worked in the United States on the survey date. These data correct for a slight undercount in prior years, when some U.S.-trained doctorate recipients who either planned to live abroad or were living abroad were excluded.
SOURCE: National Science Foundation, National Center for Science and Engineering Statistics, special tabulations (2013) of the 1973–2010 Survey of Doctorate Recipients.
Science and Engineering Indicators 2014
20102006200119971993198919851981197719730
20
40
60
80
100
Full-time faculty
Other full-time positions
Postdocs
Part-time positions

Science and Engineering Indicators 2014 ♦ 5-25
decrease in the percentage of U.S.-trained doctorate holders in tenured positions (discussed below).
The proportion of full-time faculty among S&E doctorate holders in higher education gradually declined in all fields between 1973 and 2010. Growth in postdoc positions and other full-time and part-time positions helped to account for the declining share of full-time faculty positions (appendix table 5-14).
From the early 1980s through 2010, growth in the number of life scientists and psychologists with academic employ-ment was consistently stronger than for doctorate holders in other S&E fields (figure 5-13). Growth in academic employ-ment slowed in the early 1990s for social sciences, physical sciences, and mathematics but has increased since then in social sciences and mathematics (appendix table 5-14).
Trends in Tenure StatusAmong U.S.-trained S&E doctorate holders working full-
time in academia, the proportion that has achieved tenure has diminished since 1997, although the proportion in tenure-track positions has not. In 1997, tenured positions accounted for an estimated 53% of positions held by U.S.-trained S&E
doctorate holders in academic employment; this decreased to 48% in 2010 as other positions grew as a share of over-all doctoral academic employment.29 The same percentage of positions in 1997 as in 2010 (just over 16%) was unten-ured but on a tenure track. Analysis of U.S. Department of Education data at all degree-granting institutions indicates larger decreases of about 10 percentage points over the past 15–20 years in tenured positions’ share of academic em-ployment (AAUP 2010). In addition, it is likely that a higher proportion of foreign-trained doctorate holders than U.S.-trained doctorate holders working in academia are in non-tenured and non-tenure-track positions. If so, the tenured proportion of the academic doctoral workforce (regardless of degree location) would be somewhat less than the 48% found among those who were trained in the United States (Stephan and Levin 2003).
In both 1997 and 2010, the distribution of tenure status across the fields of S&E varied (table 5-9). For those with doctoral degrees in life sciences, mathematical sciences, so-cial sciences, psychology, and engineering, the percentage of tenured positions by field decreased from 1997 to 2010 by 4–9 percentage points, depending on the field. For those with a doctoral degree in physical sciences, there was less change between 1997 and 2010—about 50% were tenured in each year. For those with a degree in computer and informa-tion sciences, a larger percentage held tenured positions in 2010 (53%) than in 1997 (46%).
Tenure status also varied by age in 1997 and 2010 (table 5-10). In 2010, lower percentages of doctorate holders at each age group were tenured.30 For example, 38% of those 40–44 years of age held tenured positions in 2010, compared with 47% in 1997. For those 50–64 years of age, there were even larger differences between 1997 and 2010 in tenure sta-tus by age. For example, 70% of those 60–64 years of age held tenured positions in 2010, while 85% of those in this age range held tenured positions in 1997. There was a much larger presence in the doctoral academic workforce of those ages 65–75 years in 2010 (25,100; 9%) than in 1997 (8,500;
SEH = science, engineering, and health.
NOTES: Data for computer sciences are not available before 1981. Academic employment is limited to U.S. doctorate holders employed at 2- or 4-year colleges or universities, excluding those employed part time who are students or retired. Physical sciences include earth, atmospheric, and ocean sciences; life sciences include biological, agricultural, environmental, and health sciences. Data beginning with 2008 include all U.S.-trained doctorate recipients who lived or worked in the United States on the survey date. These data correct for a slight undercount in prior years, when some U.S.-trained doctorate recipients who either planned to live abroad or were living abroad were excluded.
SOURCE: National Science Foundation, National Center for Science and Engineering Statistics, special tabulations (2013) of the 1973–2010 Survey of Doctorate Recipients.
Science and Engineering Indicators 2014
Figure 5-13SEH doctorate holders employed in academia, by degree field: 1973–2010Thousands
1973 1981 1985 1989 1993 1997 2001 2006 20100
50
100
150
200
250
300
350
Life sciences
Social sciences
Physical sciences
Psychology
Engineering
Mathematics
Computer sciences
Table 5-9Tenure status by field of doctorate: 1997 and 2010(Percent)
Field of doctorate 1997 2010
Mathematical sciences .......................... 70.3 64.2Social sciences ...................................... 63.0 58.5Computer and information sciences ..... 45.5 53.4Engineering ............................................ 58.6 49.7Physical and related sciences ............... 50.7 48.7Psychology ............................................ 50.4 42.4Life sciences .......................................... 43.6 39.5
NOTES: Academic employment is limited to U.S. doctorate holders employed at 2- or 4-year colleges or universities, including medical schools and university research institutes.
SOURCE: National Science Foundation, National Center for Science and Engineering Statistics, special tabulations (2013), of the Survey of Doctorate Recipients.
Science and Engineering Indicators 2014

5-26 ♦ Chapter 5. Academic Research and Development
4%), making it difficult to compare changes in tenure status in this age range over time.
The reduction from 1997 to 2010 in tenured positions’ share of total positions occurred across most (but not all) Carnegie classifications (see the chapter 2 sidebar “Carnegie Classification of Academic Institutions” for a discussion of Carnegie classifications). In 1997, 47% of academically em-ployed S&E doctorate holders at the most research-intensive institutions held tenured positions; this percentage decreased to just over 40% in 2010. Similar reductions occurred at less
research-intensive doctorate-granting institutions and at master’s-granting institutions. However, at medical schools, similar percentages of academically employed doctorate holders held tenured positions in 1997 (31%) and 2010 (29%). At baccalaureate institutions, a slightly higher share of academically employed doctorate holders held tenured positions in 2010 (60%) than in 1997 (58%).
Women in the Academic S&E WorkforceThe past 40 years have seen tremendous growth in the par-
ticipation of women in the academic doctoral S&E workforce. In 1973, only about 11,000 U.S.-trained women were employed at this level. In 2010, by contrast, about 105,000 U.S.-trained women with S&E doctorates were employed in academia, nearly a 10-fold increase.31 The number of U.S.-trained women with S&E doctorates employed in academia almost doubled over the past 15 years, rising from about 60,000 in 1997 to over 105,000 in 2010. In comparison, the number of U.S.-trained male S&E doctorate holders grew by just less than 10% over the same period and by about 80% over the four-decade pe-riod, from about 110,000 in 1973 to just under 200,000 in 2010 (appendix table 5-15).32 An estimated 19,000 women were em-ployed in academia as foreign-trained doctorate holders in S&E in 2010, along with an estimated 45,000 foreign-trained men.33
These differential rates of increase are reflected in the steadily rising share of women in the academic S&E workforce. Women constituted 36% of all U.S.-trained, academic S&E doctoral employment and 32% of full-time faculty in 2010, up from 9% and 7%, respectively, in 1973 (appendix table 5-15). Women’s share of academic S&E employment increased markedly over time in all position categories, though to a lesser degree in part-time positions (table 5-11). Women have held a larger share of junior faculty positions than positions at either the associate or full professor rank. However, as a result of the
Table 5-10Tenure status of academically employed SEH doctorate holders, by age: 1997 and 2010(Percent)
Age 1997 2010
All ages .................................................. 52.6 47.8< 30 .................................................... D D30–34 ................................................. 4.9 2.735–39 ................................................. 24.9 20.740–44 ................................................. 46.9 38.045–49 ................................................. 63.0 56.150–54 ................................................. 72.0 63.555–59 ................................................. 78.3 67.660–64 ................................................. 84.6 69.665–75 ................................................. 80.0 76.1
D = suppressed to avoid disclosure of confidential information.
SEH = science, engineering, and health.
NOTE: Academic employment is limited to U.S. doctorate holders employed at 2- or 4-year colleges or universities, medical schools, and university research institutes.
SOURCE: National Science Foundation, National Center for Science and Engineering Statistics, special tabulations (2013) of the Survey of Doctorate Recipients.
Science and Engineering Indicators 2014
Table 5-11Women as percentage of SEH doctorate holders employed in academia, by position: Selected years, 1973–2010(Percent)
Position 1973 1983 1993 2003 2010a
All positions ................................................................................ 9.1 15.0 21.9 30.3 35.7Full-time senior faculty............................................................ 5.8 9.3 14.2 22.8 28.0Full-time junior faculty ............................................................ 11.3 23.5 32.2 39.7 44.2Other full-time positions ......................................................... 14.5 23.1 30.2 34.8 41.7Postdocs ................................................................................. 14.3 30.1 30.8 38.0 39.0Part-time positions ................................................................. 48.3 41.7 61.0 54.5 55.3
SEH = science, engineering, and health.
a Data for 2010 include all U.S.-trained doctorate recipients who lived or worked in the United States on the survey date. These data correct for a slight undercount in prior years, when some U.S.-trained doctorate recipients who either planned to live abroad or were living abroad were excluded.
NOTES: Academic employment is limited to U.S. doctorate holders employed at 2- or 4-year colleges or universities, medical schools, and university research institutes. Senior faculty includes full and associate professors; junior faculty includes assistant professors and instructors in 1973, 1983, and 1993; in 2003 and 2010, junior faculty includes assistant professors. Other full-time positions include positions such as research associates, adjunct appointments, instructors (in 2003 and 2010), lecturers, and administrative positions. Part-time positions exclude those employed part time who are students or retired.
SOURCE: National Science Foundation, National Center for Science and Engineering Statistics, special tabulations (2013) of the 2003 and 2010 Survey of Doctorate Recipients.
Science and Engineering Indicators 2014

Science and Engineering Indicators 2014 ♦ 5-27
decades-long trend in the rising proportion of women earning doctoral degrees, coupled with their slightly greater propensity to enter academic employment, the share of women in all fac-ulty ranks rose significantly between 1973 and 2010. In 2010, women constituted 22% of full professors, 37% of associate professors, and 44% of assistant professors (figure 5-14).
Compared with their male counterparts in the U.S.-trained academic doctoral S&E workforce, women were more heavily concentrated in the fields of life sciences, social sciences, and psychology, with correspondingly lower shares in engineer-ing, physical sciences, mathematics, and computer sciences. Women’s share of doctorate holders in each of these fields, however, grew during the 1973–2010 period (appendix table 5-15). The field distribution of foreign-trained female doctor-ate holders largely mirrored this distribution (table 5-12).
Minorities in the Academic S&E WorkforceAlthough the number of U.S.-trained, academically em-
ployed S&E doctorate holders who are members of under-represented minority groups (i.e., blacks, Hispanics, and American Indians or Alaska Natives) has increased over time, they remain a small percentage of the total (appendix table 5-16).34 These groups constituted 8.3% of total aca-demic employment and about the same percentage of full-time faculty positions in 2010, up from about 2% in 1973 and up from 7% (of full-time faculty positions) and 7.9% (of all positions) in 2003 (table 5-13). Underrepresented minor-ity groups have a higher share of employment in other posi-tions, which include part-time positions, than in the full-time faculty and postdoc employment categories. Compared to white S&E doctorate holders employed in academia, under-represented minorities were concentrated in social sciences and less represented in physical sciences and life sciences (appendix table 5-16).
In both 2003 and 2010, a slightly higher percentage of women than men who are underrepresented minorities held faculty positions.35 Female blacks held about 4.6% of faculty positions held by women in 2003 and about 5.1% of these positions in 2010. Male blacks were in about 2.9% of fac-ulty positions held by men in 2003 and about 3.4% in 2010. Similarly, female Hispanics occupied about 4.3% of faculty positions held by women in 2003 and about 4.8% in 2010. Male Hispanics were in about 3.2% of faculty positions oc-cupied by men in 2003 and about 3.9% in 2010. Male and female American Indians and Alaska Natives held about the same percentage of faculty positions in 2003 and 2010 (less than 1%).
The share of Asians or Pacific Islanders employed in the S&E academic doctoral workforce grew dramatically over the past three decades, rising from 4% in 1973 to 16% in
SEH = science, engineering, and health.
NOTES: Academic employment is limited to U.S. doctorate holders employed at 2- or 4-year colleges or universities, medical schools, and university research institutes, excluding those employed part time who are students or retired. Junior faculty includes assistant professors and instructors in 1973, 1983, and 1993; in 2003 and 2010, junior faculty includes assistant professors. Data for 2010 include all U.S.-trained doctorate recipients who lived or worked in the United States on the survey date. These data correct for a slight undercount in prior years,when some U.S.-trained doctorate recipients who either planned to live abroad or were living abroad were excluded.
SOURCE: National Science Foundation, National Center for Science and Engineering Statistics, special tabulations (2013) of 2003 and 2010 Survey of Doctorate Recipients.
Science and Engineering Indicators 2014
Figure 5-14Women as percentage of SEH doctorate holders with full-time employment in academia, by academic rank: Selected years, 1973–2010Percent
1973 1983 1993 2003 20100
10
20
30
40
50
Full professor Associate professor Junior faculty
Table 5-12Foreign-trained SEH doctorate holders employed in academia, by degree field and sex: 2010
Field Total Male Female
Full-time positionsAll fields ............................. 61,000 43,000 18,000Physical sciences .............. 15,000 13,000 2,000Computer and
mathematical sciences ... 3,000 3,000 SLife sciences ...................... 34,000 20,000 14,000Social sciences and
psychology ..................... 4,000 3,000 1,000Engineering ........................ 5,000 4,000 1,000
Part-time positionsAll fields ............................. 3,000 2,000 1,000
S = suppressed for reasons of confidentiality and/or reliability.
SEH = science, engineering, and health.
SOURCE: National Science Foundation, National Center for Science and Engineering Statistics, special tabulations (2013) of the National Survey of College Graduates.
Science and Engineering Indicators 2014
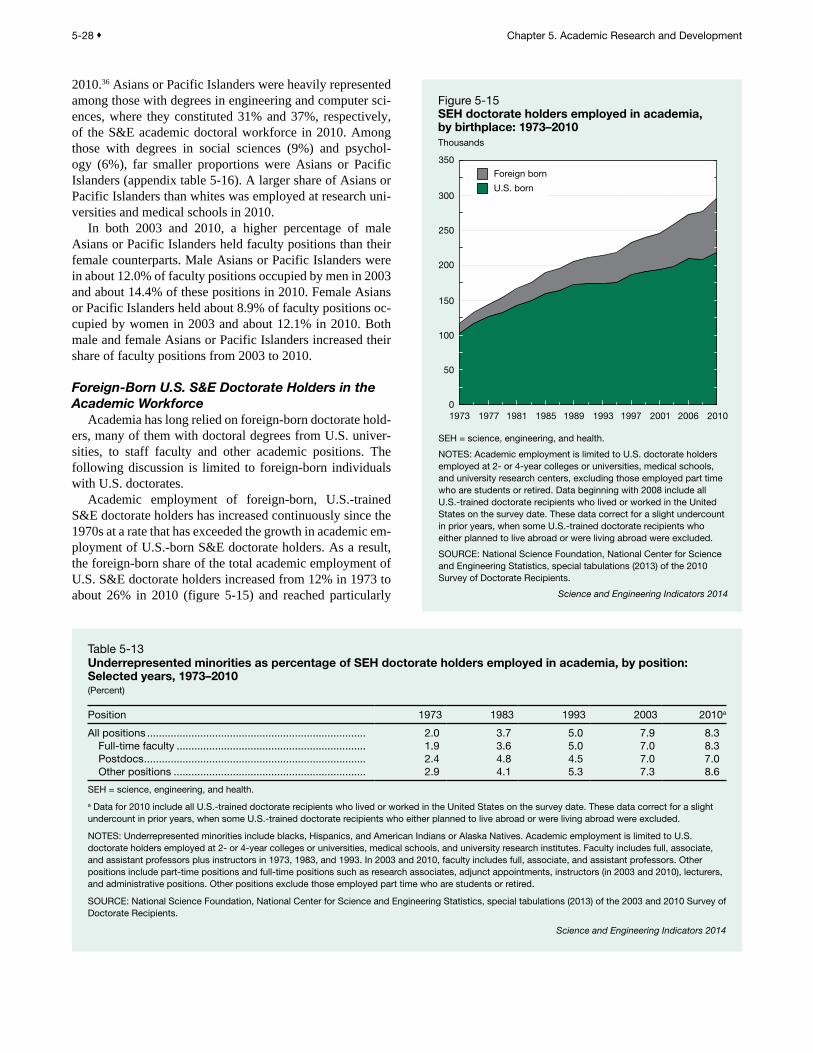
5-28 ♦ Chapter 5. Academic Research and Development
2010.36 Asians or Pacific Islanders were heavily represented among those with degrees in engineering and computer sci-ences, where they constituted 31% and 37%, respectively, of the S&E academic doctoral workforce in 2010. Among those with degrees in social sciences (9%) and psychol-ogy (6%), far smaller proportions were Asians or Pacific Islanders (appendix table 5-16). A larger share of Asians or Pacific Islanders than whites was employed at research uni-versities and medical schools in 2010.
In both 2003 and 2010, a higher percentage of male Asians or Pacific Islanders held faculty positions than their female counterparts. Male Asians or Pacific Islanders were in about 12.0% of faculty positions occupied by men in 2003 and about 14.4% of these positions in 2010. Female Asians or Pacific Islanders held about 8.9% of faculty positions oc-cupied by women in 2003 and about 12.1% in 2010. Both male and female Asians or Pacific Islanders increased their share of faculty positions from 2003 to 2010.
Foreign-Born U.S. S&E Doctorate Holders in the Academic Workforce
Academia has long relied on foreign-born doctorate hold-ers, many of them with doctoral degrees from U.S. univer-sities, to staff faculty and other academic positions. The following discussion is limited to foreign-born individuals with U.S. doctorates.
Academic employment of foreign-born, U.S.-trained S&E doctorate holders has increased continuously since the 1970s at a rate that has exceeded the growth in academic em-ployment of U.S.-born S&E doctorate holders. As a result, the foreign-born share of the total academic employment of U.S. S&E doctorate holders increased from 12% in 1973 to about 26% in 2010 (figure 5-15) and reached particularly
Table 5-13Underrepresented minorities as percentage of SEH doctorate holders employed in academia, by position: Selected years, 1973–2010(Percent)
Position 1973 1983 1993 2003 2010a
All positions .......................................................................... 2.0 3.7 5.0 7.9 8.3Full-time faculty ................................................................ 1.9 3.6 5.0 7.0 8.3Postdocs ........................................................................... 2.4 4.8 4.5 7.0 7.0Other positions ................................................................. 2.9 4.1 5.3 7.3 8.6
SEH = science, engineering, and health.
a Data for 2010 include all U.S.-trained doctorate recipients who lived or worked in the United States on the survey date. These data correct for a slight undercount in prior years, when some U.S.-trained doctorate recipients who either planned to live abroad or were living abroad were excluded.
NOTES: Underrepresented minorities include blacks, Hispanics, and American Indians or Alaska Natives. Academic employment is limited to U.S. doctorate holders employed at 2- or 4-year colleges or universities, medical schools, and university research institutes. Faculty includes full, associate, and assistant professors plus instructors in 1973, 1983, and 1993. In 2003 and 2010, faculty includes full, associate, and assistant professors. Other positions include part-time positions and full-time positions such as research associates, adjunct appointments, instructors (in 2003 and 2010), lecturers, and administrative positions. Other positions exclude those employed part time who are students or retired.
SOURCE: National Science Foundation, National Center for Science and Engineering Statistics, special tabulations (2013) of the 2003 and 2010 Survey of Doctorate Recipients.
Science and Engineering Indicators 2014
SEH = science, engineering, and health.
NOTES: Academic employment is limited to U.S. doctorate holders employed at 2- or 4-year colleges or universities, medical schools, and university research centers, excluding those employed part time who are students or retired. Data beginning with 2008 include all U.S.-trained doctorate recipients who lived or worked in the United States on the survey date. These data correct for a slight undercount in prior years, when some U.S.-trained doctorate recipients who either planned to live abroad or were living abroad were excluded.
SOURCE: National Science Foundation, National Center for Science and Engineering Statistics, special tabulations (2013) of the 2010 Survey of Doctorate Recipients.
Science and Engineering Indicators 2014
Figure 5-15SEH doctorate holders employed in academia, by birthplace: 1973–2010Thousands
1973 1977 1981 1985 1989 1993 1997 2001 2006 20100
50
100
150
200
250
300
350
U.S. born
Foreign born

Science and Engineering Indicators 2014 ♦ 5-29
high proportions in engineering (49%) and computer scienc-es (51%) (appendix table 5-17). In all fields, foreign-born doctorate holders were a larger share of postdoc employment than of full-time faculty employment. Overall, 49% of post-doc positions were held by foreign-born U.S. S&E doctorate holders, compared to 24% of full-time faculty positions.
Of the 46,000 U.S.-trained Asian or Pacific Islander S&E doctorate holders employed in academia in 2010, 10% were native-born U.S. citizens, 39% were naturalized U.S. citi-zens, and 51% were noncitizens. In 2010, Asians or Pacific Islanders represented 52% of the foreign-born S&E faculty employed full-time in the United States and nearly 70% of the foreign-born S&E doctorate holders with postdoc ap-pointments. In contrast, only about 2% of native-born, full-time faculty and 5% of native-born postdocs were Asians or Pacific Islanders. (See chapter 3 for a discussion of foreign-born individuals in the S&E workforce.)
Age Composition of the Academic Doctoral Workforce
The trend toward relatively fewer full-time faculty po-sitions and relatively more postdoc and other full-time and part-time positions is especially noteworthy because of the steady increase over the past 15–20 years in the share of full-time faculty positions that are held by those over 65 years of age.
In 1994, the Age Discrimination in Employment Act of 1967 (ADEA) became fully applicable to universities and colleges, prohibiting the forced retirement of faculty at any age. From this point through 2010, as more individuals born during the period of high birth rates from 1946 to 1964 (the “Baby Boomers”) began to move through middle age into their 50s and 60s, the proportion of academically employed doctorate holders in the oldest age groups increased (table 5-14). In 2010, 20% of U.S.-trained, academically employed doctorate holders in S&E were between 60 and 75 years of age, double the percentage (10%) of those in this age range
in 1995.37 In 1995, full-time faculty ages 60–75 years held less than 2% of doctoral academic positions; this percentage increased to 7% in 2010. (See chapter 3 for a discussion of the age profile and retirement patterns of the S&E doctoral workforce in other institutional sectors.)
Many of the older U.S.-trained, academically employed doctorate holders work at research-intensive universities. The percentage of doctorate holders working at the most research-intensive institutions who were between 60 and 75 years of age increased by 8 percentage points between 1995 and 2010, rising from just under 10% in 1995 to just under 18% in 2010. Meanwhile, the percentage of doctorate hold-ers working at the most research-intensive institutions who were between 30 and 44 years of age decreased by 6 per-centage points between 1995 and 2010. In 1995, over 50% of doctorate holders working at the most research-intensive institutions were between 30 and 44 years of age; in 2010, this percentage had fallen to less than 44%.
A comparison of the age distribution of full-time faculty positions at research universities and other universities and colleges shows that there has been a relatively sharp increase since the mid-1990s—when ADEA became applicable to the professoriate—in the percentage of these positions held by those ages 65–75 years. The data show that the share of those ages 65–75 years was rising well before the act be-came mandatory, dipped in the early 1990s at research uni-versities (and leveled off at other institutions), and then rose steeply in most years from 1995 to 2010, particularly at the most research-intensive universities (figure 5-16; appendix table 5-18).
Academic ResearchersThe interconnectedness of research, teaching, and pub-
lic service activities in academia makes it difficult to assess the precise size and characteristics of the academic research workforce by examining the employment trends in academic positions. Individuals with the same academic job titles may be involved in research activities to differing degrees or not be involved in research. Therefore, self-reported research involvement is a better measure than position title for gaug-ing research activity.38 This section limits the analysis to academic S&E doctorate holders who reported that research is either their primary or secondary work activity (i.e., the activity that occupies the most or second-most hours of their work time during a typical work week).
Doctoral S&E ResearchersSince 1973, the number of U.S.-trained, academically
employed S&E researchers grew from just over 80,000 to almost 200,000 (appendix table 5-19). In 2010, of those identified as such researchers, over 140,000 were employed in full-time faculty positions.39
Looking across all doctoral academic positions and across the past four decades, the proportion of academically employed S&E doctorate holders who identified research as their primary or secondary activity has fluctuated between
Table 5-14Academically employed SEH doctorate holders, by age: 1995 and 2010(Percent)
Age 1995 2010a
20–39 ..................................................... 29.2 26.640–59 ..................................................... 61.0 53.260–75 ..................................................... 9.8 20.1
SEH = science, engineering, and health.a Data for 2010 include all U.S.-trained doctorate recipients who lived or worked in the United States on the survey date. These data correct for a slight undercount in prior years, when some U.S.-trained doctorate recipients who either planned to live abroad or were living abroad were excluded.
SOURCE: National Science Foundation, National Center for Science and Engineering Statistics, special tabulations (2013) of the Survey of Doctorate Recipients.
Science and Engineering Indicators 2014

5-30 ♦ Chapter 5. Academic Research and Development
about 60% and 75%. A similar pattern of fluctuation oc-curred for full-time faculty. In 2010, 67% of S&E doctorate holders in academia classified research as their primary or secondary activity.40
Looking across fields, the proportions of researchers among all academic S&E doctorate holders and all full-time faculty were higher in life sciences, engineering, and computer sciences than in social sciences and psychology (appendix table 5-19). In most fields, the share of academic S&E doctorate holders who reported research as their pri-mary or secondary responsibility declined slightly between 1993 and 2010.
A different picture emerges when considering those who report research as their primary work activity. In contrast to the declining share of academic employees who reported re-search as their primary or secondary work activity, the share who reported research as their primary work activity gener-ally increased throughout the period from 1973 to 2010.
Among full-time doctoral S&E faculty, the increased share of doctorate holders reporting research as their prima-ry work activity reflects a shift in priority from teaching to research. Over the last four decades, the proportion of full-time faculty identifying research as their primary work ac-tivity climbed from 19% to 36%, while the share of faculty
with teaching as their primary activity fell from 68% to 47% (figure 5-17).
The balance of emphasis between teaching and research varied across the disciplines. A higher share of faculty with doctorate degrees in life sciences identified research as their primary work activity, and a higher share of faculty with doctorate degrees in mathematics and social sciences report-ed teaching as their primary activity. Since 1991, the propor-tion of doctorate holders who reported research as a primary work activity declined among computer scientists and life scientists but grew among mathematicians, psychologists, engineers, and social scientists (appendix table 5-19).
S&E Full-Time FacultyIn 2010, 37% of the S&E doctoral faculty who had earned
their degree since 2007 identified research as their primary work activity, a slightly lower share than that reported by faculty who had earned S&E doctorate degrees 4–7 years earlier or 8–11 years earlier (both 41%) (table 5-15). The
Figure 5-16Full-time faculty ages 65–75 at research universities and other higher education institutions: 1973–2010Percent
NOTES: Faculty positions include full, associate, and assistant professors and instructors from 1973 to 1995; from 1997 to 2010, faculty positions include full, associate, and assistant professors. Data beginning with 2008 include all U.S.-trained doctorate recipients who lived or worked in the United States on the survey date. These data correct for a slight undercount in prior years, when some U.S.-trained doctorate recipients who either planned to live abroad or were living abroad were excluded.
SOURCES: National Science Foundation, National Center for Science and Engineering Statistics, 1973–95 Survey of Doctorate Recipients, and special tabulations (2013) of the 1997–2010 Survey of Doctorate Recipients. See appendix table 5-18.
Science and Engineering Indicators 2014
1973 1977 1981 1985 1989 1993 1997 2001 2006 20100
2
4
6
8
10
12
Research universities
Other higher education institutions
SEH = science, engineering, and health.
NOTES: Academic employment is limited to U.S. doctorate holders employed at 2- or 4-year colleges or universities, medical schools, and university research institutes, excluding those employed part time who are students or retired. Full-time faculty includes full, associate, and assistant professors plus instructors for 1973, 1983, and 1993; for 2003 and 2010, full-time faculty includes full, associate, and assistant professors. Research includes basic or applied research, development, or design. “Other” includes a wide range of activities. Data for 2010 include all U.S.-trained doctorate recipients who lived or worked in the United States on the survey date. These data correct for a slight undercount in prior years, when some U.S.-trained doctorate recipients who either planned to live abroad or were living abroad were excluded.
SOURCE: National Science Foundation, National Center for Science and Engineering Statistics, special tabulations (2013) of the 2003 and 2010 Survey of Doctorate Recipients.
Science and Engineering Indicators 2014
Figure 5-17Primary work activity of full-time doctoral SEH faculty: 1973–2010Percent
1973 1983 1993 2003 20100
10
20
30
40
50
60
70
80
Research Teaching Other

Science and Engineering Indicators 2014 ♦ 5-31
comparable percentage for faculty 12 or more years from receipt of their degree is somewhat lower (34%). The higher share of primary researchers within the second and third cohorts, 4–11 years since receiving their doctorate, coin-cides with the period during which many faculty would be preparing to apply for tenure at their university and would have heightened motivation to complete research projects and publish results. For faculty members who received their doctoral degree 12 or more years ago, other responsibili-ties—such as mentoring younger faculty, advising doctoral students, and accepting major committee assignments or fac-ulty leadership roles—may become primary work activities.
A similar pattern across career stages prevailed in most degree fields. Research was more frequently a primary work activity for faculty in engineering than for faculty in other fields.
Graduate Research AssistantsThe close coupling of advanced training with hands-on
research experience is a key feature of U.S. graduate edu-cation. Many of the nearly one-half million full-time S&E graduate students in 2011 conduct research as part of their academic studies (table 5-16).
The number of research assistants—full-time graduate students whose primary mechanism of financial support is a research assistantship—has grown faster than graduate en-rollment, both overall and in most fields. Graduate research assistantships were the primary means of support for 27% of graduate students in 2011, up from 22% in the early 1970s.
Academic Employment in Postdoc PositionsAbout 44,000 S&E doctorate holders were employed
in academic postdoc positions in 2011 (see sidebar, “Postdoctoral Researchers”). The estimate comes from the GSS, which reported a total of about 63,000 postdocs in
2011, with about two-thirds (over 44,000) holding doctorates in S&E and about one-third holding doctorates in non-S&E fields. SDR data indicate that the U.S.-trained component of academically employed postdocs with S&E degrees climbed from 4,000 in the early 1970s to 22,800 in 2010 (appendix table 5-14). During that time period, the share of postdocs increased from 4% to 8% of all U.S.-trained, academically employed S&E doctorate holders. Postdocs were much more prevalent in life sciences, physical sciences, and engineering than in social sciences, although there were increases across all fields in 2010. Growth from 2003 to 2010 was greatest in the proportion of U.S.-trained postdocs in physical sciences and engineering (figure 5-18; appendix table 5-14).
The demographic profile of U.S.-trained individuals em-ployed in academic postdoc positions has changed dramati-cally over the past 40 years. In particular, the proportions of postdocs held by women, racial and ethnic minorities, and foreign-born individuals have climbed (table 5-17).
A temporary postdoc appointment is a common stop along the career path of S&E doctorate holders, particularly during their early career stages. In 2010, 41% of recently de-greed, U.S.-trained S&E doctorate holders in academia were employed in postdoc positions, while 35% were employed in full-time faculty positions (appendix table 5-20). Recently degreed refers to those who received their doctorate within 1–3 years prior to the 2010 SDR. Early career refers to those who received their doctorate within 1–7 years prior to the 2010 SDR. A lower share (13%) of U.S.-trained, academi-cally employed S&E doctorate holders 4–7 years beyond their doctoral degree was employed in academic postdoc positions; 60% held full-time faculty positions (appendix table 5-20).
In 2010, over three-fourths (78%) of recently degreed, U.S.-trained academic postdocs were employed at the most research-intensive universities (table 5-18). The postdoc
Table 5-15SEH faculty reporting research as primary work activity, by years since doctorate and degree field: 2010(Percent)
Years since doctorate All fields
Computer and information sciences Life sciences
Mathematics and statistics
Physical sciences Psychology
Social sciences Engineering
All years since doctorate ................ 36.1 35.0 42.6 29.8 33.4 33.0 29.2 40.51–3 .......................... 37.2 12.5 37.8 38.5 27.3 33.3 39.0 50.04–7 .......................... 41.2 50.0 43.3 40.9 35.1 35.9 34.9 52.68–11 ........................ 40.5 25.0 45.3 25.0 42.1 37.1 34.4 51.9≥ 12 ......................... 34.1 35.5 42.4 26.2 31.8 31.4 25.8 34.8
SEH = science, engineering, and health.
NOTES: Academic employment is limited to U.S. doctorate holders employed at 2- or 4-year colleges or universities, medical schools, and university research institutes, excluding those employed part time who are students or retired. Faculty includes full, associate, and assistant professors. Research includes basic or applied research, development, and design. Physical sciences include earth, atmospheric, and ocean sciences; life sciences include biological, agricultural, environmental, and health sciences.
SOURCE: National Science Foundation, National Center for Science and Engineering Statistics, special tabulations (2013) of the Survey of Doctorate Recipients.
Science and Engineering Indicators 2014

5-32 ♦ Chapter 5. Academic Research and Development
populations employed at medical schools and other universi-ties and colleges included a larger pool of doctorate holders who had not recently earned their doctoral degree. The fields of life sciences and physical sciences have had the highest incidence of postdocs over the years (figure 5-18).
Recent data indicate that the economic downturn of the late 2000s may have influenced some early career doctorate
holders to take academic postdoc positions when they would have preferred other employment. The percentages of post-docs citing “other employment not available” as a reason for accepting a postdoc position increased between 2008 and 2010, while most other reasons for obtaining a postdoc de-creased (table 5-19). (The percentage of postdocs citing “ob-taining training outside the PhD field” also increased.)
Table 5-16Full-time SEH graduate students and graduate research assistants at universities and colleges, by degree field: Selected years, 1973–2011
1973 1983 1993 2003 2011a
Group and degree field Thousands Percent Thousands Percent Thousands Percent Thousands Percent Thousands Percent
Graduate students .............. 161.6 100 252.0 100 329.6 100 398.0 100 457.3 100Computer sciences ......... 2.9 2 10.6 4 17.4 5 30.9 8 33.8 7Life sciences ................... 40.6 25 69.2 28 91.6 28 123.2 31 124.4 27Mathematics ................... 10.3 6 11.0 4 14.5 4 14.6 4 18.7 4Physical sciences ........... 28.9 18 37.2 15 41.9 13 41.9 11 49.3 11Psychology ..................... 15.2 9 26.6 11 34.8 11 35.8 9 39.3 9Social sciences ............... 32.4 20 43.5 17 55.6 17 61.3 15 74.2 16Engineering ..................... 31.3 19 53.9 21 73.8 22 90.4 23 107.2 23
Graduate research assistants ...................... 35.9 100 54.9 100 90.2 100 114.3 100 122.5 100
Computer sciences ......... 0.7 2 1.4 3 3.8 4 7.5 7 8.3 7Life sciences ................... 9.4 26 16.5 30 28.0 31 35.5 31 37.7 31Mathematics ................... 0.7 2 0.8 2 1.4 2 1.8 2 2.1 2Physical sciences ........... 8.9 25 12.6 23 17.0 19 18.1 16 19.6 16Psychology ..................... 1.9 5 3.0 5 4.6 5 5.6 5 5.6 5Social sciences ............... 4.0 11 5.0 9 7.4 8 8.4 7 7.6 6Engineering ..................... 10.4 29 15.6 28 28.0 31 37.4 33 40.1 33
SEH = science, engineering, and health.
a Total includes fields not shown separately that were added or reclassified in the 2007 survey.
NOTES: Detail may not add to total because of rounding. Graduate research assistants are full-time graduate students with research assistantships as their primary mechanism of support. Physical sciences include earth, atmospheric, and ocean sciences; life sciences include biological, agricultural, environmental, and health sciences.
SOURCE: National Science Foundation, National Center for Science and Engineering Statistics, special tabulations (2013) of the Survey of Graduate Students and Postdoctorates in Science and Engineering.
Science and Engineering Indicators 2014
A postdoctorate (postdoc) is a temporary position in ac-ademia, industry, a nonprofit organization, or government that is taken after the completion of a doctorate. It serves as a period of apprenticeship for the purpose of gaining scientific, technical, and professional skills. Ideally, the in-dividual employed in a postdoc position gains these skills under the guidance of an adviser, with the administrative and infrastructural support of a host institution, and with the financial support of a funding organization. However, the conditions of postdoc employment vary widely be-tween academic and non-academic settings, across disci-plines, and even within institutions, and formal job titles are an unreliable guide to actual work roles.
Postdoctoral researchers have become indispensable to the S&E enterprise and perform a substantial por-tion of the nation’s research. Most have recently earned their doctoral degree, and so they bring a new set of techniques and perspectives that broadens their research teams’ experience and makes them more competitive for additional research funding. In addition to conduct-ing research, postdoctoral researchers also educate, train, and supervise undergraduate students engaged in research; help write grant proposals and papers; and present research results at professional society meetings (COSEPUP 2000).
Postdoctoral Researchers
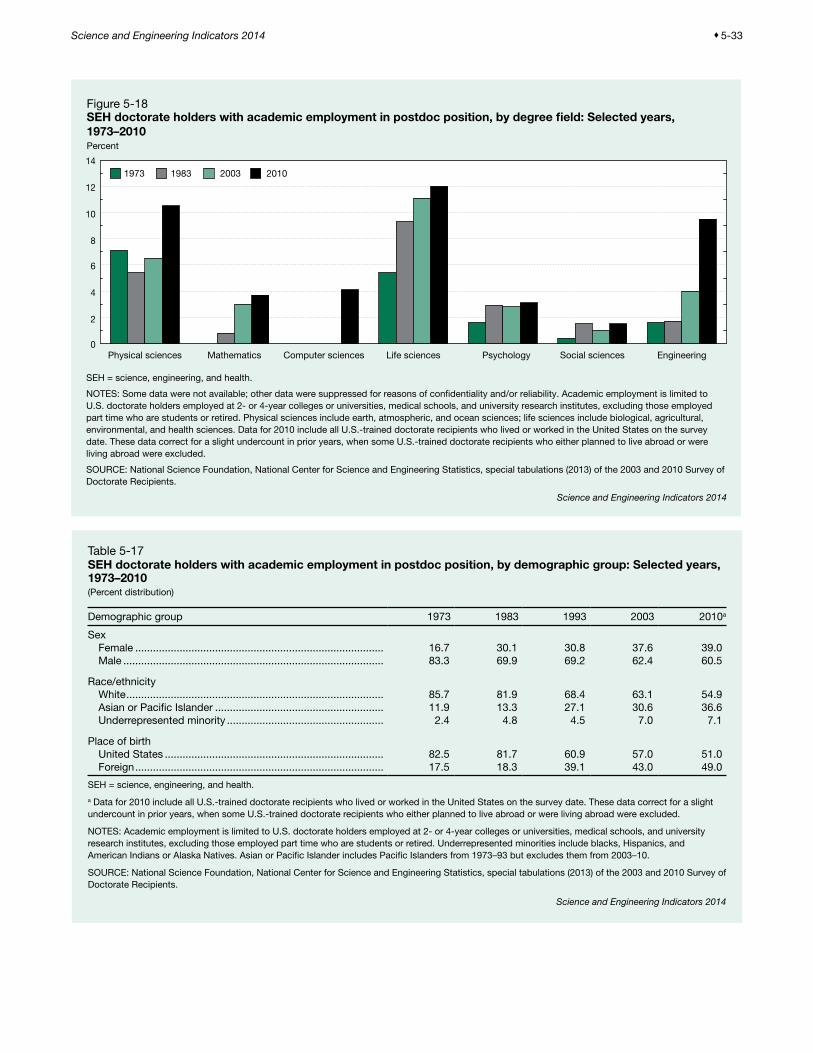
Science and Engineering Indicators 2014 ♦ 5-33
Figure 5-18SEH doctorate holders with academic employment in postdoc position, by degree field: Selected years, 1973–2010Percent
SEH = science, engineering, and health.
NOTES: Some data were not available; other data were suppressed for reasons of con�dentiality and/or reliability. Academic employment is limited to U.S. doctorate holders employed at 2- or 4-year colleges or universities, medical schools, and university research institutes, excluding those employed part time who are students or retired. Physical sciences include earth, atmospheric, and ocean sciences; life sciences include biological, agricultural, environmental, and health sciences. Data for 2010 include all U.S.-trained doctorate recipients who lived or worked in the United States on the survey date. These data correct for a slight undercount in prior years, when some U.S.-trained doctorate recipients who either planned to live abroad or were living abroad were excluded.
SOURCE: National Science Foundation, National Center for Science and Engineering Statistics, special tabulations (2013) of the 2003 and 2010 Survey of Doctorate Recipients.
Science and Engineering Indicators 2014
Physical sciences Mathematics Computer sciences Life sciences Psychology Social sciences Engineering0
2
4
6
8
10
12
141973 1983 2003 2010
Table 5-17SEH doctorate holders with academic employment in postdoc position, by demographic group: Selected years, 1973–2010(Percent distribution)
Demographic group 1973 1983 1993 2003 2010a
SexFemale .................................................................................... 16.7 30.1 30.8 37.6 39.0Male ........................................................................................ 83.3 69.9 69.2 62.4 60.5
Race/ethnicityWhite ....................................................................................... 85.7 81.9 68.4 63.1 54.9Asian or Pacific Islander ......................................................... 11.9 13.3 27.1 30.6 36.6Underrepresented minority ..................................................... 2.4 4.8 4.5 7.0 7.1
Place of birthUnited States .......................................................................... 82.5 81.7 60.9 57.0 51.0Foreign .................................................................................... 17.5 18.3 39.1 43.0 49.0
SEH = science, engineering, and health.
a Data for 2010 include all U.S.-trained doctorate recipients who lived or worked in the United States on the survey date. These data correct for a slight undercount in prior years, when some U.S.-trained doctorate recipients who either planned to live abroad or were living abroad were excluded.
NOTES: Academic employment is limited to U.S. doctorate holders employed at 2- or 4-year colleges or universities, medical schools, and university research institutes, excluding those employed part time who are students or retired. Underrepresented minorities include blacks, Hispanics, and American Indians or Alaska Natives. Asian or Pacific Islander includes Pacific Islanders from 1973–93 but excludes them from 2003–10.
SOURCE: National Science Foundation, National Center for Science and Engineering Statistics, special tabulations (2013) of the 2003 and 2010 Survey of Doctorate Recipients.
Science and Engineering Indicators 2014

5-34 ♦ Chapter 5. Academic Research and Development
Federal Support of Doctoral Researchers in Academia
The federal government provides academic researchers with a substantial portion of overall research support. This support may include assistance in the form of fellowships, traineeships, and research grants. For example, faculty members often receive research grants while postdocs often are funded through fellowships. This section presents data from S&E doctorate holders in academia who reported on the presence or absence (but not magnitude or type) of fed-eral support for their work. Comparisons are made over the
approximately 40-year period between the early 1970s and 2010 and between the roughly two-decade-long period be-tween the late 1980s or very early 1990s and 2010.41
Academic Scientists and Engineers Who Receive Federal Support
The share of S&E doctorate holders and researchers in academia who receive federal support has varied over time according to the level of research activity and the type of academic position held (appendix table 5-21). In general, a larger share of doctorate holders and researchers received federal support in the late 1980s and very early 1990s than
Table 5-18SEH doctorate holders with academic employment in postdoc position, by Carnegie institution type and years since doctorate: 2010(Percent distribution)
Institution typePostdocs
(thousands)
Years since doctorate
1–3 4–7 ≥ 8
All institutions ................................................. 22.8 100.0 100.0 100.0Doctorate-granting, very high research ...... 17.0 77.9 69.7 61.8Other doctorate-granting institutions ......... 2.4 9.4 13.8 7.7Medical schools/medical centers ............... 2.1 7.4 10.7 23.3Other universities and colleges ................... 1.3 5.3 5.8 7.2
SEH = science, engineering, and health.
NOTES: Academic employment is limited to U.S. doctorate holders employed at 2- or 4-year colleges or universities, medical schools, and university research institutes, excluding those employed part time who are students or retired. Institutions are designated by the 2005 Carnegie classification code. For information on these institutional categories, see The Carnegie Classification of Institutions of Higher Education, http://classifications.carnegiefoundation.org/index.php.
SOURCE: National Science Foundation, National Center for Science and Engineering Statistics, special tabulations (2013) of the Survey of Doctorate Recipients.
Science and Engineering Indicators 2014
Table 5-19Reasons for accepting postdoc position: 2008–10
2008–10
Population change (%)
Distribution change (%)Reason
2008 2010
Total Percent Total Percent
All reasonsAdditional training in PhD field....................... 12,200 67.6 14,800 65.2 21.3 -3.6Training outside of PhD field .......................... 8,100 44.9 11,000 48.2 35.8 7.3Work with person/at place ............................. 11,300 62.9 12,900 56.8 14.2 -9.7Other employment not available .................... 3,900 21.7 7,000 30.7 79.5 41.5Postdoc expected in this field ....................... 13,900 76.9 17,000 75.1 22.3 -2.3Some other reason ........................................ 1,500 8.3 1,900 8.4 26.7 1.2
Most important reasonAdditional training in PhD field ................... 4,000 22.3 4,300 19.0 7.5 -14.8Training outside of PhD field ...................... 2,600 14.6 4,000 17.6 53.8 20.5Work with person/at place ......................... 2,900 16.3 3,500 15.6 20.7 -4.3Other employment not available ................ 1,800 9.8 3,100 13.5 72.2 37.8Postdoc expected in this field .................... 5,800 32.0 6,800 29.8 17.2 -6.9Some other reason ..................................... 900 5.0 1,100 4.7 22.2 -6.0
NOTES: Data are for academically employed, U.S. trained postdocs. Numbers are rounded to the nearest 100. Detail may not add to total because of rounding.
SOURCE: National Science Foundation, National Center for Science and Engineering Statistics with National Opinion Research Center, special tabulations (2013) of the Survey of Doctorate Recipients.
Science and Engineering Indicators 2014

Science and Engineering Indicators 2014 ♦ 5-35
in either the early 1970s or in 2010. In 2010, 45% of all U.S.-trained S&E doctorate holders in academia and 56% of those for whom research was a primary or secondary ac-tivity reported federal government support for their work.42 Looking across all fields, about the same percentage (45%) of U.S.-trained, academically employed doctorate holders received federal support in the early 1970s as in 2010. In the very early 1990s, however, a somewhat higher percentage (49%) received federal support. A somewhat smaller share of those for whom research was a primary or secondary re-sponsibility received federal support in 1973 (52%) than in 1991 (58%) or 2010 (56%). The share of full-time faculty who received federal support from 1973 to 2010 fluctuated, rising from 42% in 1973 to 48% in 1991 and then dipping to 45% in 2010. A larger share of academic doctorate holders employed in nonfaculty positions received federal support in 1973 (60%) and in the very early 1990s (59%) than in 2010 (42%).
Federal support varied by the field in which the academi-cally employed held their doctoral degree. Over the past 40 years, U.S.-trained doctorate holders in engineering, life sci-ences, and physical sciences have been more likely to report receiving federal support than doctoral degree holders in mathematics, psychology, or social sciences (appendix table 5-21). In mathematics, gradually larger shares of doctorate holders received federal support (27% in 1973; just over 34% in the very early 1990s and in 2010). In psychology and social sciences, by contrast, gradually smaller shares received federal support. For example, in 1973, 38% of doc-torate holders in psychology and 26% of doctorate holders in the social sciences reported federal support. This decreased to 33% and 20%, respectively, in 2010.
Federal support is more prevalent in medical schools and in the most research-intensive universities (very high re-search activity institutions according to Carnegie classifica-tion) (appendix table 5-22). About 65% of S&E doctorate holders and full-time faculty employed in these institutions received federal support in 2010. The percentage with fed-eral support was about 50% at high research activity institu-tions; at other universities and colleges, it ranged from about 15%–30%.
Federal Support of Early Career S&E Doctorate Holders
Federal support has been less available to early career S&E doctoral faculty than to more established faculty, and the percentage of early career S&E faculty with federal sup-port has declined (appendix table 5-23). In 2010, less than 28% of recent doctorate recipients in full-time faculty po-sitions received federal support, down from 38% two de-cades earlier. Of recent S&E doctorate recipients employed in postdoc positions in 2010, 72% received federal support, which was a substantial decline from the early 1990s (84%).
S&E doctorate holders employed as full-time faculty who had received their doctorate 4–7 years earlier were more likely to receive federal support than those with more
recently earned doctorates, and the same was true of those employed in postdoc positions. As with recent doctorate recipients, the share of full-time faculty and postdocs 4–7 years beyond their doctorate who received federal support also declined from the early 1990s. The shares of early ca-reer full-time faculty and postdocs with federal support were generally higher in some fields (life sciences, physical sci-ences, and engineering) than in others (mathematics and so-cial sciences).
Outputs of S&E Research: Articles and Patents
Chapter 2 of this volume discusses the human capital out-puts of higher education in S&E. This section of the current chapter continues that theme by examining the intellectual output of S&E research. The section presents indicators de-rived from both published research articles and U.S. patents.
Researchers have traditionally published the results of their work in the world’s peer-reviewed S&E journals. These bibliometric data (see sidebar, “Bibliometric Data and Terminology”) are indicators of national and global scien-tific activity. For example, a count of the coauthorships on U.S. articles is an indicator of the partnerships involved in the U.S. scientific effort. Likewise, measures involving cita-tions and patents can be indicators of international patterns of influence and of invention based on scientific research. Bibliometric indicators are calculated for different countries and—within the United States alone—for different sectors.
Overall, the indicators provide insight into five broad areas. The first section, “S&E Article Output,” examines the quantity and national origin of S&E publications. The second section, “Coauthorship and Collaboration in S&E Literature,” examines the national partnerships in these publications. The third section, “Trends in Citation of S&E Articles,” examines various patterns of national scientific sharing and influence. The fourth section, “Citation of S&E Articles by USPTO Patents,” examines the utilization of S&E literature by inventors. And, finally, the fifth section, “Academic Patenting,” examines patenting and related ac-tivities in academia.
Discussions of regional and country indicators will exam-ine patterns and trends in developed and developing coun-tries, as classified by the World Bank. Countries classified by the World Bank as high income are considered devel-oped; those classified as upper- and lower-middle income and as low income are considered developing.43
S&E Article OutputThis section begins by describing and comparing the S&E
article output of the United States to other regions, countries, and economies in the world. The article output of China and other developing countries has increased much more rapidly than that of the United States and other developed countries over the last 15 years. Although the United States remains

5-36 ♦ Chapter 5. Academic Research and Development
a major producer of S&E articles, its global share of article production has declined. This section then examines U.S. article output in academia, the largest producer of U.S. ar-ticles, and other institutional sectors.
Article Output by CountryA growing number of countries produce S&E articles.
Over the period from 1988 to 2012, a total of 199 coun-tries were authors on at least one S&E article (appendix table 5-24).44
The four major producers of the world’s S&E articles in 2011 were the European Union (EU; see “Glossary” for member countries) (31%), the United States (26%), China (11%), and Japan (6%).45 Together, they accounted for 73% of the world’s S&E publications in 2011 (figure 5-19; ap-pendix table 5-26). The EU, the United States, and Japan have been major producers for several decades. China emerged as a major producer in the mid-2000s. Overall,
47 countries—less than a quarter of those that produced S&E articles in 2011 (see appendix table 5-24)—accounted for 98% of global output (table 5-20).
Between 2001 and 2011, the total world S&E article out-put grew at an average annual rate of 2.8% (table 5-20). The total for developing countries grew more than three times faster (9.9% average annual) than the world total. China pro-pelled growth of developing countries (15.6%), resulting in its global share climbing from 3% to 11% (figure 5-19). The fifth-largest S&E article producer in 2001, China surpassed Japan in 2007 to become the third-largest S&E article pro-ducer, behind the EU and the United States (appendix table 5-26). China’s growth in S&E publication is concurrent with its enormous growth in GDP over the last decade, which is consistent with findings by many researchers that there is a high correlation between these two measures (Price 1969; Narin, Stevens, and Whitlow 1991).
The article counts, coauthorships, and citations dis-cussed in this section are derived from S&E articles, notes, and reviews published in a set of scientific and technical journals tracked by the Science Unit of Thomson Reuters in the Science Citation Index (SCI) and Social Sciences Citation Index (SSCI) (http://www.thomsonreuters.com/business_units/scientific/). Journal items excluded are letters to the editor, news stories, editorials, and other material whose purpose is not the presentation or dis-cussion of scientific data, theory, methods, apparatus, or experiments.
Journal selection. This section uses a changing set of journals that reflects the current mix of journals and ar-ticles in the world. Thomson Reuters selects journals each year as described at http://www.thomsonreuters.com/products_services/science/free/essays/journal_selection_process/, and the selected journals become part of SCI and SSCI. The journals selected are notable for their relatively high citation rank within their S&E subfields; journals of only regional interest are excluded.
The number of journals analyzed by the National Science Foundation from SCI and SSCI was 4,093 in 1988 and 5,087 in 2012, an annual growth rate slightly less than 1.0%. These journals give good coverage of a core set of internationally recognized, peer-reviewed sci-entific journals. The coverage includes electronic-only journals and print journals with electronic versions. In the period 1988–2012, the database contained 16 million S&E articles, notes, and reviews. Over the same period, the average number of articles, notes, and reviews per journal per year increased from about 111 to 168, an an-nual growth rate of about 1.7%.
Article data. Except where noted, author means de-partmental or institutional author. Articles are attributed to countries or sectors by the country or sector of the in-stitutional address(es) given in the articles, not by the na-tional origins or the citizenship of the authoring scientists or engineers. If no institutional affiliation is listed, the article is excluded from the counts in this chapter.
Likewise, coauthorship refers to institutional coau-thorship. An article is considered coauthored only if it shows different institutional affiliations or different de-partments of the same institution; multiple listings of the same department of an institution are considered one in-stitutional author. The same logic applies to cross-sector and international collaboration.
Two methods of counting articles are used: fractional and whole counts. Fractional counting is used for article and citation counts. In fractional counting, credit for co-authored articles is divided among the collaborating in-stitutions or countries based on the proportion of their participating departments or institutions. Whole counting is used for coauthorship data. In whole counting, each institution or country receives one credit for its participa-tion in the article.
Data in the section “Article Output by Country” are reported by publication year through 2011 as record-ed in the SCI and SSCI data files through late January 2013. These data are noted as “by year of publication.” Publication data in the remaining bibliometrics sections are reported through 2012. These data are noted as “by data file year.”
The region/country/economy breakouts are reported in appendix table 5-24. Data reported in this section are grouped into 13 broad S&E fields and 125 subfields (ap-pendix table 5-25).
Bibliometric Data and Terminology
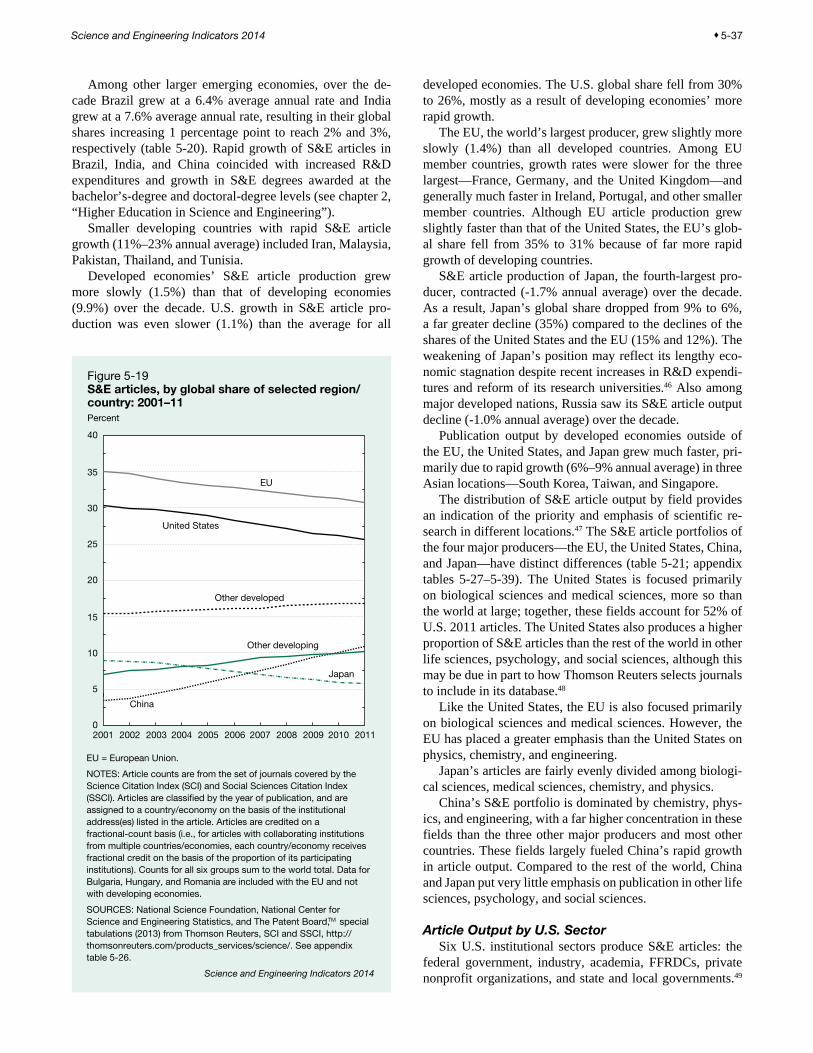
Science and Engineering Indicators 2014 ♦ 5-37
Among other larger emerging economies, over the de-cade Brazil grew at a 6.4% average annual rate and India grew at a 7.6% average annual rate, resulting in their global shares increasing 1 percentage point to reach 2% and 3%, respectively (table 5-20). Rapid growth of S&E articles in Brazil, India, and China coincided with increased R&D expenditures and growth in S&E degrees awarded at the bachelor’s-degree and doctoral-degree levels (see chapter 2, “Higher Education in Science and Engineering”).
Smaller developing countries with rapid S&E article growth (11%–23% annual average) included Iran, Malaysia, Pakistan, Thailand, and Tunisia.
Developed economies’ S&E article production grew more slowly (1.5%) than that of developing economies (9.9%) over the decade. U.S. growth in S&E article pro-duction was even slower (1.1%) than the average for all
developed economies. The U.S. global share fell from 30% to 26%, mostly as a result of developing economies’ more rapid growth.
The EU, the world’s largest producer, grew slightly more slowly (1.4%) than all developed countries. Among EU member countries, growth rates were slower for the three largest—France, Germany, and the United Kingdom—and generally much faster in Ireland, Portugal, and other smaller member countries. Although EU article production grew slightly faster than that of the United States, the EU’s glob-al share fell from 35% to 31% because of far more rapid growth of developing countries.
S&E article production of Japan, the fourth-largest pro-ducer, contracted (-1.7% annual average) over the decade. As a result, Japan’s global share dropped from 9% to 6%, a far greater decline (35%) compared to the declines of the shares of the United States and the EU (15% and 12%). The weakening of Japan’s position may reflect its lengthy eco-nomic stagnation despite recent increases in R&D expendi-tures and reform of its research universities.46 Also among major developed nations, Russia saw its S&E article output decline (-1.0% annual average) over the decade.
Publication output by developed economies outside of the EU, the United States, and Japan grew much faster, pri-marily due to rapid growth (6%–9% annual average) in three Asian locations—South Korea, Taiwan, and Singapore.
The distribution of S&E article output by field provides an indication of the priority and emphasis of scientific re-search in different locations.47 The S&E article portfolios of the four major producers—the EU, the United States, China, and Japan—have distinct differences (table 5-21; appendix tables 5-27–5-39). The United States is focused primarily on biological sciences and medical sciences, more so than the world at large; together, these fields account for 52% of U.S. 2011 articles. The United States also produces a higher proportion of S&E articles than the rest of the world in other life sciences, psychology, and social sciences, although this may be due in part to how Thomson Reuters selects journals to include in its database.48
Like the United States, the EU is also focused primarily on biological sciences and medical sciences. However, the EU has placed a greater emphasis than the United States on physics, chemistry, and engineering.
Japan’s articles are fairly evenly divided among biologi-cal sciences, medical sciences, chemistry, and physics.
China’s S&E portfolio is dominated by chemistry, phys-ics, and engineering, with a far higher concentration in these fields than the three other major producers and most other countries. These fields largely fueled China’s rapid growth in article output. Compared to the rest of the world, China and Japan put very little emphasis on publication in other life sciences, psychology, and social sciences.
Article Output by U.S. SectorSix U.S. institutional sectors produce S&E articles: the
federal government, industry, academia, FFRDCs, private nonprofit organizations, and state and local governments.49
Figure 5-19S&E articles, by global share of selected region/country: 2001–11Percent
EU = European Union.
NOTES: Article counts are from the set of journals covered by the Science Citation Index (SCI) and Social Sciences Citation Index (SSCI). Articles are classi�ed by the year of publication, and are assigned to a country/economy on the basis of the institutional address(es) listed in the article. Articles are credited on a fractional-count basis (i.e., for articles with collaborating institutions from multiple countries/economies, each country/economy receives fractional credit on the basis of the proportion of its participating institutions). Counts for all six groups sum to the world total. Data for Bulgaria, Hungary, and Romania are included with the EU and not with developing economies.
SOURCES: National Science Foundation, National Center for Science and Engineering Statistics, and The Patent Board,TM special tabulations (2013) from Thomson Reuters, SCI and SSCI, http:// thomsonreuters.com/products_services/science/. See appendix table 5-26.
Science and Engineering Indicators 2014
2001 2002 2003 2004 2005 2006 2007 2008 2009 2010 20110
5
10
15
20
25
30
35
40
United States
EU
Japan
Other developed
China
Other developing

5-38 ♦ Chapter 5. Academic Research and Development
Table 5-20S&E articles in all fields, by country/economy: 2001 and 2011
Rank Country/economy 2001 2011Average annual
change (%)2011 world
total (%)2011 cumulative world total (%)
- World ..................................... 629,386 827,705 2.8 na na1 United States ......................... 190,597 212,394 1.1 25.7 25.72 China ..................................... 21,134 89,894 15.6 10.9 36.53 Japan ..................................... 56,082 47,106 -1.7 5.7 42.24 Germany ................................ 42,678 46,259 0.8 5.6 47.85 United Kingdom .................... 45,588 46,035 0.1 5.6 53.46 France ................................... 30,602 31,685 0.3 3.8 57.27 Canada .................................. 21,945 29,114 2.9 3.5 60.78 Italy ........................................ 22,093 26,503 1.8 3.2 63.99 South Korea ........................... 11,008 25,593 8.8 3.1 67.0
10 Spain ..................................... 15,324 22,910 4.1 2.8 69.811 India ....................................... 10,801 22,480 7.6 2.7 72.512 Australia ................................. 14,484 20,603 3.6 2.5 75.013 Netherlands ........................... 12,117 15,508 2.5 1.9 76.814 Taiwan ................................... 7,912 14,809 6.5 1.8 78.615 Russia .................................... 15,658 14,151 -1.0 1.7 80.316 Brazil ...................................... 7,052 13,148 6.4 1.6 81.917 Switzerland ............................ 7,950 10,019 2.3 1.2 83.118 Sweden ................................. 10,022 9,473 -0.6 1.1 84.319 Turkey .................................... 4,151 8,328 7.2 1.0 85.320 Iran ........................................ 1,035 8,176 23.0 1.0 86.321 Poland ................................... 5,629 7,564 3.0 0.9 87.222 Belgium ................................. 5,827 7,484 2.5 0.9 88.123 Israel ...................................... 6,235 6,096 -0.2 0.7 88.824 Denmark ................................ 4,917 6,071 2.1 0.7 89.625 Austria ................................... 4,480 5,102 1.3 0.6 90.226 Finland ................................... 4,930 4,878 -0.1 0.6 90.827 Norway .................................. 3,215 4,777 4.0 0.6 91.428 Portugal ................................. 2,081 4,621 8.3 0.6 91.929 Singapore .............................. 2,434 4,543 6.4 0.5 92.530 Greece ................................... 3,204 4,534 3.5 0.5 93.031 Mexico ................................... 3,204 4,173 2.7 0.5 93.532 Czech Republic ..................... 2,571 4,127 4.8 0.5 94.033 Argentina ............................... 2,931 3,863 2.8 0.5 94.534 New Zealand ......................... 2,851 3,472 2.0 0.4 94.935 Ireland .................................... 1,588 3,186 7.2 0.4 95.336 South Africa ........................... 2,291 3,125 3.2 0.4 95.737 Egypt ..................................... 1,463 2,515 5.6 0.3 96.038 Thailand ................................. 727 2,304 12.2 0.3 96.239 Hungary ................................. 2,398 2,289 -0.5 0.3 96.540 Malaysia ................................ 472 2,092 16.0 0.3 96.841 Chile ...................................... 1,159 1,979 5.5 0.2 97.042 Ukraine .................................. 2,239 1,727 -2.6 0.2 97.243 Romania ................................ 927 1,626 5.8 0.2 97.444 Saudi Arabia .......................... 565 1,491 10.2 0.2 97.645 Croatia ................................... 696 1,289 6.3 0.2 97.846 Serbia .................................... NA 1,269 na 0.2 97.947 Pakistan ................................. 279 1,268 16.3 0.2 98.148 Slovenia ................................. 851 1,239 3.8 0.1 98.249 Slovakia ................................. 924 1,099 1.8 0.1 98.350 Tunisia ................................... 352 1,016 11.2 0.1 98.5
na = not applicable; NA = not available.
NOTES: Countries/economies shown produced 1,000 articles or more in 2011. Countries/economies are ranked based on the 2011 total. Article counts are from the set of journals covered by the Science Citation Index (SCI) and Social Sciences Citation Index (SSCI). Articles are classified by their year of publication and are assigned to a country/economy on the basis of the institutional address(es) listed in the article. Articles are credited on a fractional-count basis (i.e., for articles with collaborating institutions from multiple countries/economies, each country/economy receives fractional credit on the basis of the proportion of its participating institutions). Detail does not add to total because of countries/economies not shown.
SOURCES: National Science Foundation, National Center for Science and Engineering Statistics, and The Patent Board,™ special tabulations (2013) from Thomson Reuters, SCI and SSCI, http://thomsonreuters.com/products_services/science/. See appendix table 5-26.
Science and Engineering Indicators 2014

Science and Engineering Indicators 2014 ♦ 5-39
This section describes patterns and trends in the sector dis-tributions of U.S. article output.
The U.S. academic sector is the largest producer of S&E articles, accounting for three-fourths of U.S. S&E article output. This sector was largely responsible for the slight growth of U.S. S&E article output over the last 15 years. The number of academic S&E articles rose from 138,000 to 163,000 between 1997 and 2012. As a result, academia’s share of all U.S. articles rose from 73% to 76% (figure 5-20).
S&E publications in the non-academic sectors decreased slightly from 52,000 to 51,000 during this period. These sec-tors had divergent trends:
♦ Articles in the private nonprofit sector grew from 15,000 to 18,000 and at an even greater pace than the academic sector between 1997 and 2012 (appendix table 5-40). However, this sector’s much smaller size resulted in a lesser impact on total U.S. growth.
♦ Articles in FFRDCs fluctuated between 5,000 and 6,000.50
♦ Industry and the federal government exhibited similar trends, starting the period at 14,000 articles and then de-clining, especially over the past 10 years. However, in-dustry articles dropped further than federal government articles to end the period at 12,000, compared with 13,000 for the federal government.Except for the FFRDCs, the research portfolios of the
U.S. sectors are dominated by life sciences (biological sci-ences and medical sciences), with nearly half or more of all articles in these fields (table 5-22). The dominance of life
Table 5-21S&E research portfolios of selected regions/countries, by field: 2011(Percent)
Field World United States EU China Japan
All articles (n) ........................................................ 827,705 212,394 254,482 89,894 47,106Engineering ....................................................... 10.7 7.1 9.0 16.9 11.0Agricultural sciences ......................................... 2.3 1.6 2.4 2.1 2.4Astronomy ......................................................... 1.3 1.4 1.6 0.6 1.0Biological sciences ........................................... 19.5 23.3 19.3 14.8 20.7Chemistry .......................................................... 13.9 8.2 12.8 24.9 17.3Computer sciences ........................................... 1.1 1.1 1.1 1.7 0.3Geosciences ..................................................... 5.6 5.5 5.7 4.8 4.2Mathematics ..................................................... 2.2 1.9 2.6 2.6 1.5Medical sciences .............................................. 22.1 28.3 24.0 10.6 21.3Other life sciences ............................................ 1.2 2.2 1.0 0.2 0.2Physics ............................................................. 13.1 8.6 12.6 19.4 18.2Psychology ....................................................... 2.8 4.8 2.9 0.4 0.8Social sciences ................................................. 4.1 6.0 4.9 0.9 1.0
EU = European Union.
NOTES: Article counts are from the set of journals covered by the Science Citation Index (SCI) and Social Sciences Citation Index (SSCI). Articles are classified by their year of publication and are assigned to the country on the basis of the institutional address(es) listed in the article. Articles are credited on a fractional-count basis (i.e., for articles with collaborating institutions from multiple countries, each country receives fractional credit on the basis of the proportion of its participating institutions). See appendix table 5-24 for countries/economies included in the EU. Percentages may not add to 100% because of rounding.
SOURCES: National Science Foundation, National Center for Science and Engineering Statistics, and The Patent Board,™ special tabulations (2013) from Thomson Reuters, SCI and SSCI, http://thomsonreuters.com/products_services/science/. See appendix tables 5-27—5-39.
Science and Engineering Indicators 2014
NOTES: Article counts are from the set of journals covered by the Science Citation Index (SCI) and Social Sciences Citation Index (SSCI). Articles are classi�ed by the year they entered the database and are assigned to U.S. institution(s) based on the institutional address(es) listed in the article. Articles are credited on a fractional count basis; for articles with institutional addresses from multiple countries/U.S. institutions, each country/U.S. institution receives fractional credit on the basis of the proportion of its participating institutions.
SOURCES: National Science Foundation, National Center for Science and Engineering Statistics, and The Patent Board,TM special tabulations (2013) from Thomson Reuters, SCI and SSCI, http://thomsonreuters. com/products_services/science/. See appendix table 5-40.
Science and Engineering Indicators 2014
Figure 5-20U.S. academic and non-academic S&E articles: 1997–2012Thousands of articles
1997 2000 2002 2004 2006 2008 2010 20120
50
100
150
200
250U.S. academic institutionU.S. non-academic institution

5-40 ♦ Chapter 5. Academic Research and Development
sciences is especially pronounced in the nonprofit sector, where 79% of the articles are in the biological sciences and medical sciences. With a much larger number of articles, ac-ademia has 49% of its S&E literature in life sciences. The re-search portfolio of FFRDCs is dominated by physics (36%), chemistry (19%), and engineering (16%), with far less con-centration in life sciences (11%). This reflects the FFRDCs’ more specialized and mission-oriented research programs in these and other physical sciences.
Coauthorship and Collaboration in S&E Literature
Collaborative S&E research facilitates knowledge trans-fer and sharing among individuals, institutions, and nations. It can be an indicator of interconnections among researchers in different institutional settings and the growing capacity of researchers to address complex problems by drawing on diverse skills and perspectives. Collaboration on S&E re-search publications over the last 15 years has been increas-ing, with higher shares of scientific articles with more than one named author and a higher proportion of articles with institutional and international coauthorships (figure 5-21). The largest increase was in international collaboration; the percentage of articles with authors from different countries rose from 16% to 25% between 1997 and 2012.
The following two sections explore the growth of collab-orative publication.51 The first section looks at international collaboration. The second section examines collaboration across institutional sectors—including academia, the federal
Table 5-22Share of U.S. S&E articles, by sector and field: 2012(Percent)
SectorFederal
government Industry Academic FFRDCsPrivate
nonprofitState/local
government
All fields combined (n) ............................. 13,075 11,779 163,137 5,690 18,322 1,728 Engineering .......................................... 6.0 13.8 7.0 15.9 1.2 3.8Agricultural sciences ............................ 4.6 2.0 1.5 0.3 0.4 1.1Astronomy ............................................ 1.8 0.6 1.4 5.4 2.4 0.0Biological sciences .............................. 29.7 22.7 22.7 8.9 24.6 24.9Chemistry ............................................. 4.7 12.4 8.4 18.7 2.0 0.9Computer sciences .............................. 0.3 2.6 1.2 0.7 0.1 0.2Geosciences ........................................ 12.3 5.3 5.2 10.3 2.9 13.7Mathematics ........................................ 0.4 0.7 2.4 1.0 0.2 0.0Medical sciences ................................. 26.3 24.5 25.8 2.5 54.3 43.5Other life sciences ............................... 1.5 2.1 2.1 0.0 3.6 4.5Physics ................................................ 6.4 10.0 8.8 35.5 1.3 0.3Psychology .......................................... 2.6 1.5 6.0 0.0 2.7 4.0Social sciences .................................... 3.5 1.7 7.4 0.6 4.2 3.2
NOTES: Article counts are from the set of journals covered by the Science Citation Index (SCI) and Social Sciences Citation Index (SSCI). Articles are classified by the year they entered the database, rather than their year of publication, and are assigned to a sector on the basis of the institutional address(es) listed in the article. Articles are credited on a fractional-count basis (i.e., for articles with collaborating institutions from multiple sectors, each sector receives fractional credit on the basis of the proportion of its participating institutions).
SOURCES: National Science Foundation, National Center for Science and Engineering Statistics, and The Patent Board,™ special tabulations (2013) from Thomson Reuters, SCI and SSCI, http://thomsonreuters.com/products_services/science/. See appendix table 5-40.
Science and Engineering Indicators 2014
NOTES: Article counts are from the set of journals covered by the Science Citation Index (SCI) and Social Sciences Citation Index (SSCI). Articles are classi�ed by the year they entered the database. Articles by multiple authors are those with multiple persons authoring the article; articles by multiple domestic institutions and multiple nations have multiple institutional addresses listed on the article. Authors from different departments within the same institution are considered to be from different institutions.
SOURCES: National Science Foundation, National Center for Science and Engineering Statistics, and The Patent Board,TM special tabulations (2013) from Thomson Reuters, SCI and SSCI, http://thomsonreuters. com/products_services/science/. See appendix table 5-41.
Science and Engineering Indicators 2014
Figure 5-21Share of world articles in all fields authored by multiple authors, institutions, and nations: 1997 and 2012Percent
Multipleauthors
Multipledomestic institutions
Multiplenations
0
20
40
60
80
100
1997 2012

Science and Engineering Indicators 2014 ♦ 5-41
government, and industry—within the United States. (Data on sectors for other countries are not available.)
International CollaborationInternational scientific collaborations reflect wider pat-
terns of relationships among countries. Linguistic and historical factors (Narin, Stevens, and Whitlow 1991), ge-ography, and cultural relations (Glänzel and Schubert 2005) play a role in these relationships. In recent years, coauthor-ships in Europe have risen in response to EU policies active-ly encouraging intra-European, cross-border collaboration. Strong ties among science establishments in Asia, though without the formal framework that characterizes Europe, have led to similar collaboration.
Rates of international collaboration by field. Inter-national collaboration on scientific articles, as measured by the shares of articles coauthored by institutional authors in different countries, has increased markedly over the last 15 years. S&E articles with coauthors from more than one country have grown to nearly one-fourth of the world’s S&E articles, rising from 16% in 1997 to 25% in 2012. This is a slightly larger increase than the increase in purely domestic coauthorships during the same period (from 36% to 44%) (figure 5-21).
Researchers in different fields have different tendencies to collaborate internationally. Astronomy is the most inter-national field, with over half of its articles internationally coauthored (56%) (figure 5-22). Geosciences, computer sci-ences, mathematics, physics, and biological sciences have relatively high rates of international collaboration, with
shares in the range of 27%–34%. Fields with low rates of collaboration (17%–21%) include psychology, chemistry, social sciences, and other life sciences. Possible factors in-fluencing variations among fields include the existence of formal international collaborative programs, expensive in-frastructure (e.g., atomic colliders and telescopes) that re-sults in cost sharing and collaboration among countries, the geographic scope (local versus international) of research fields, and path dependencies from earlier, relatively local ways of doing research.
International collaboration has risen across all scientific fields over the last 15 years. The two fields with the highest rates of international collaboration—astronomy and geosci-ences—had increases of 17 and 14 percentage points, re-spectively, in their shares between 1997 and 2012. Physics and chemistry had far lower gains of just 5 and 7 percentage points, respectively. Psychology and other life sciences had strong gains yet remain among the four fields with the least amount of international collaboration.
Rates of international collaboration by country/re-gion. Countries vary widely in the proportion of their S&E articles that are internationally coauthored, ranging from 25% (Iran) to as much as 80% (Saudi Arabia) for articles in 2012 (appendix table 5-41; see also appendix tables 5-42–5-54 for individual fields). The shares of larger countries are gen-erally lower (from 25% to 60%) than smaller countries (from 50% to 80%). The difference is likely because the bigger and more diversified scientific establishments in larger countries al-low opportunities for collaborative scientific teams within their
Figure 5-22Share of world’s S&E articles with international collaboration, by S&E field: 1997 and 2012Percent
NOTES: Data are from the set of journals covered by the Science Citation Index (SCI) and Social Sciences Citation Index (SSCI). Articles are classi�ed by the year they entered the database, rather than their year of publication, and are assigned to a country/economy on the basis of the institutional address(es) listed in the article. Articles are credited on a whole-count basis (i.e., each collaborating institution or country is credited one count). Internationally coauthored articles may also have multiple domestic coauthors.
SOURCES: National Science Foundation, National Center for Science and Engineering Statistics, and The Patent Board,TM special tabulations (2013) from Thomson Reuters, SCI and SSCI, http://thomsonreuters.com/products_services/science/. See appendix tables 5-42–5-54.
Science and Engineering Indicators 2014
Astronomy Geo-sciences
Computersciences
Mathe-matics
Physics Biologicalsciences
Agriculturalsciences
Medicalsciences
Engineer-ing
Psychol-ogy
Chemistry Socialsciences
Other lifesciences
0
10
20
30
40
50
60
701997 2012

5-42 ♦ Chapter 5. Academic Research and Development
borders, whereas smaller countries do not have the research in-frastructure or personnel to support such collaboration.
The U.S. international collaboration rate was 35% in 2012, significantly lower than France, Germany, and the United Kingdom (figure 5-23). However, because the United States has a higher share of articles with domestic coauthors, its overall proportion of coauthored articles is similar to that of the three EU countries.
The higher international collaboration rates of large EU member countries relative to the United States are likely due to their smaller science establishments, which increase the need for collaboration teams with international participation. In ad-dition, the EU’s Framework Programmes for Research and Technological Development and other programs designed to increase collaboration among EU member countries and with other countries likely boost their international collaboration.
Japan and China have even lower international collabora-tion shares than the United States (figure 5-23). One factor that may explain their low shares is that Asia does not have a formal framework like the EU to facilitate international collaboration. Another possible factor is that some Chinese and Japanese sci-entists may not speak English or publish their research in that language, which could limit their visibility in the international scientific community, where English is commonly used.
Rates of international collaboration have generally risen over the last decade, though to varying degrees (figure 5-23). The U.S. rate rose 10 percentage points to reach 35% between 2002 and 2012. Canada had a similar increase (from 40% to 50%) over the same period.
The increase has been even more dramatic for EU mem-bers and other European countries. The shares of France,
Germany, and the United Kingdom increased by 12–16 percentage points to reach over 50%. The EU’s Framework Programmes for Research and Technological Development, now in their seventh year, have likely been a major factor in these countries’ increases.
China is an exception to the general trend of increasing inter-national collaboration. China’s rate of international collabora-tion (27%) remained stable over the last decade during China’s period of very rapid article growth. In contrast, Chinese domes-tic collaboration increased in this period: the proportion of its articles that had multiple domestic institutional authors rose by 11 percentage points, reaching 44% (appendix table 5-41).
Preferred collaboration partners. Different countries have different preferred partners for international scientific collaboration. The remainder of this section describes global partnership patterns, with particular emphasis on patterns of U.S. involvement in international collaboration.
The nation that most often coauthors with the United States is China, a collaborator on 16% of U.S. internation-ally coauthored articles (table 5-23). 52 As shown in figure 5-24, other countries that are important partners for the United States are the United Kingdom (14%), Germany (13%), Canada (11%), France (9%), Italy (7%), and Japan (7%). Canada and China are notable among these countries for having unusually high rates of U.S. participation in their own internationally coauthored articles (49% and 48%, re-spectively). For the other five countries, the comparable rates range from 29% to 37%.
For most countries, the percentage of U.S. internation-ally coauthored papers on which they are coauthors has
Figure 5-23Share of S&E articles internationally coauthored, by selected country: 2002 and 2012Percent
NOTES: Article counts are from the set of journals covered by the Science Citation Index (SCI) and Social Sciences Citation Index (SSCI). Articles are classi�ed by the year they entered the database, rather than their year of publication, and are assigned to a country/economy on the basis of the institutional address(es) listed in the article. Articles are credited on a whole-count basis (i.e., each collaborating institution or country is credited one count). Internationally coauthored articles may also have multiple domestic coauthors.
SOURCES: National Science Foundation, National Center for Science and Engineering Statistics, and The Patent Board,TM special tabulations (2013) from Thomson Reuters, SCI and SSCI, http://thomsonreuters.com/products_services/science/. See appendix table 5-41.
Science and Engineering Indicators 2014
United States Canada GermanyUnited Kingdom France China Japan Australia0
10
20
30
40
50
60
702002 2012
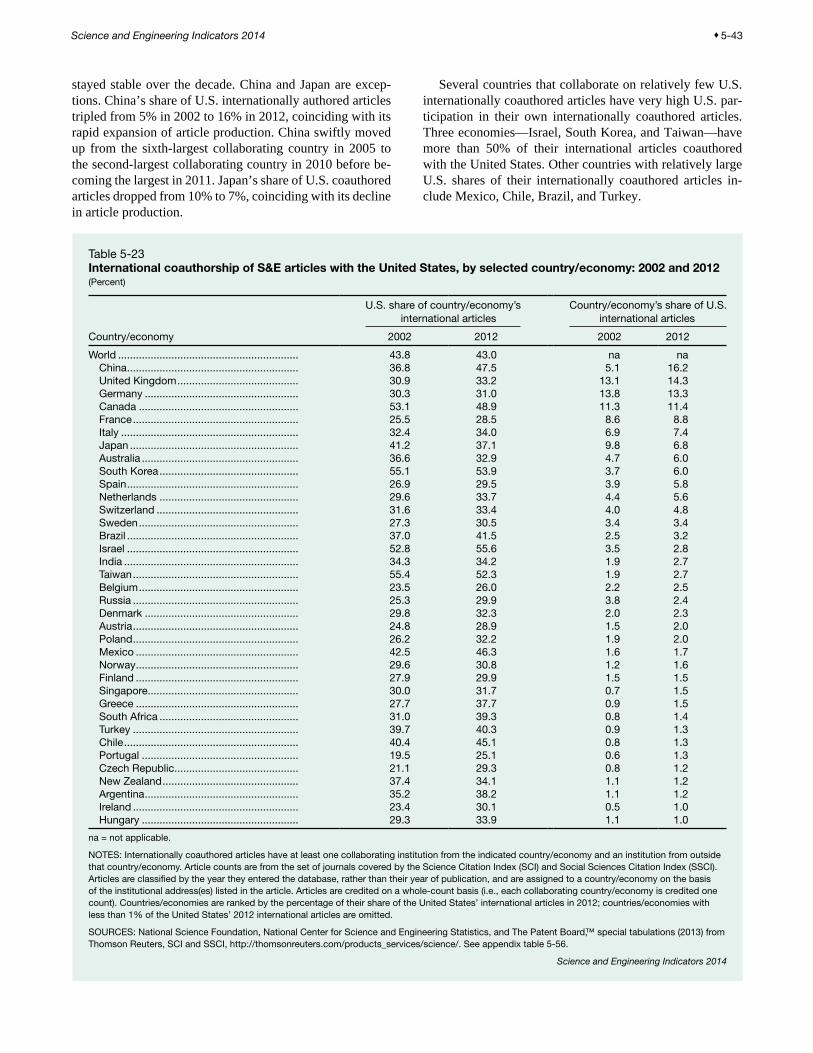
Science and Engineering Indicators 2014 ♦ 5-43
stayed stable over the decade. China and Japan are excep-tions. China’s share of U.S. internationally authored articles tripled from 5% in 2002 to 16% in 2012, coinciding with its rapid expansion of article production. China swiftly moved up from the sixth-largest collaborating country in 2005 to the second-largest collaborating country in 2010 before be-coming the largest in 2011. Japan’s share of U.S. coauthored articles dropped from 10% to 7%, coinciding with its decline in article production.
Several countries that collaborate on relatively few U.S. internationally coauthored articles have very high U.S. par-ticipation in their own internationally coauthored articles. Three economies—Israel, South Korea, and Taiwan—have more than 50% of their international articles coauthored with the United States. Other countries with relatively large U.S. shares of their internationally coauthored articles in-clude Mexico, Chile, Brazil, and Turkey.
Table 5-23International coauthorship of S&E articles with the United States, by selected country/economy: 2002 and 2012(Percent)
U.S. share of country/economy’s international articles
Country/economy’s share of U.S. international articles
Country/economy 2002 2012 2002 2012
World ............................................................. 43.8 43.0 na naChina .......................................................... 36.8 47.5 5.1 16.2United Kingdom ......................................... 30.9 33.2 13.1 14.3Germany .................................................... 30.3 31.0 13.8 13.3Canada ...................................................... 53.1 48.9 11.3 11.4France ........................................................ 25.5 28.5 8.6 8.8Italy ............................................................ 32.4 34.0 6.9 7.4Japan ......................................................... 41.2 37.1 9.8 6.8Australia ..................................................... 36.6 32.9 4.7 6.0South Korea ............................................... 55.1 53.9 3.7 6.0Spain .......................................................... 26.9 29.5 3.9 5.8Netherlands ............................................... 29.6 33.7 4.4 5.6Switzerland ................................................ 31.6 33.4 4.0 4.8Sweden ...................................................... 27.3 30.5 3.4 3.4Brazil .......................................................... 37.0 41.5 2.5 3.2Israel .......................................................... 52.8 55.6 3.5 2.8India ........................................................... 34.3 34.2 1.9 2.7Taiwan ........................................................ 55.4 52.3 1.9 2.7Belgium ...................................................... 23.5 26.0 2.2 2.5Russia ........................................................ 25.3 29.9 3.8 2.4Denmark .................................................... 29.8 32.3 2.0 2.3Austria ........................................................ 24.8 28.9 1.5 2.0Poland ........................................................ 26.2 32.2 1.9 2.0Mexico ....................................................... 42.5 46.3 1.6 1.7Norway ....................................................... 29.6 30.8 1.2 1.6Finland ....................................................... 27.9 29.9 1.5 1.5Singapore ................................................... 30.0 31.7 0.7 1.5Greece ....................................................... 27.7 37.7 0.9 1.5South Africa ............................................... 31.0 39.3 0.8 1.4Turkey ........................................................ 39.7 40.3 0.9 1.3Chile ........................................................... 40.4 45.1 0.8 1.3Portugal ..................................................... 19.5 25.1 0.6 1.3Czech Republic .......................................... 21.1 29.3 0.8 1.2New Zealand .............................................. 37.4 34.1 1.1 1.2Argentina .................................................... 35.2 38.2 1.1 1.2Ireland ........................................................ 23.4 30.1 0.5 1.0Hungary ..................................................... 29.3 33.9 1.1 1.0
na = not applicable.
NOTES: Internationally coauthored articles have at least one collaborating institution from the indicated country/economy and an institution from outside that country/economy. Article counts are from the set of journals covered by the Science Citation Index (SCI) and Social Sciences Citation Index (SSCI). Articles are classified by the year they entered the database, rather than their year of publication, and are assigned to a country/economy on the basis of the institutional address(es) listed in the article. Articles are credited on a whole-count basis (i.e., each collaborating country/economy is credited one count). Countries/economies are ranked by the percentage of their share of the United States’ international articles in 2012; countries/economies with less than 1% of the United States’ 2012 international articles are omitted.
SOURCES: National Science Foundation, National Center for Science and Engineering Statistics, and The Patent Board,™ special tabulations (2013) from Thomson Reuters, SCI and SSCI, http://thomsonreuters.com/products_services/science/. See appendix table 5-56.
Science and Engineering Indicators 2014

5-44 ♦ Chapter 5. Academic Research and Development
An index of international collaboration is useful for high-lighting rates of international scientific collaboration that differ substantially from chance (see sidebar, “Normalizing Coauthorship and Citation Data”). When collaborative au-thorship between two countries is exactly proportional to their overall rates of international collaborative authorship, the index value is 1; a higher index value means that a coun-try pair has a stronger-than-expected tendency to collabo-rate, and a lower index value means the opposite.
U.S. collaboration with countries as measured by the in-dex of international collaboration shows variable trends (ta-ble 5-24; appendix tables 5-55 and 5-56). In North America, the Canada-U.S. index shows a rate of collaboration that is slightly greater than would be expected, and the index has not changed much over the past 15 years. The U.S.-Mexico index is just about as would be expected and has been stable.
In scientific collaboration with EU member countries, the United States has a weaker-than-expected tendency to collaborate with the United Kingdom, Germany, and France despite a comparatively high volume of internationally co-authored articles. U.S. collaboration with these countries be-came slightly stronger between 1997 and 2012.
In contrast to EU member countries, U.S. collaboration with Asia has generally been stronger than expected. U.S. collaboration is relatively strong with China, South Korea, and Taiwan. However, U.S. collaboration with Japan is slightly weaker than expected despite a high volume of coau-thored papers. Between 1997 and 2012, U.S.-Japan collabo-ration has shifted from as expected to weaker than expected.
Collaborations between Latin American countries are notably stronger than expected. The collaboration index of Mexico-Argentina is 3.88, far above expected levels. The collaboration index of Argentina-Brazil is even higher, at 5.81, one of the highest in the world, and was high, at 4.94, even 15 years ago.
Among European countries, collaboration patterns are mixed, but most have increased between 1997 and 2012. Among the large publishing countries (Germany, the United Kingdom, and France), collaboration was less than expected in 1997 but grew to just about what would be expected in 2012. A particularly strong collaboration network has devel-oped between scientists in Poland and the Czech Republic, with the index for their countries standing at 5.97 in 2012.
The Scandinavian countries increased their collaboration indexes with many countries elsewhere in Europe over the last 15 years (appendix table 5-55).53 Within Scandinavia, the indexes are among the highest in the world (table 5-24).
Collaboration indexes within Asia and across the South Pacific between the large article producers are generally higher than expected, but some have declined between 1997 and 2012. The collaboration index of China-Japan declined from 1.61 to 1.23; the South Korea–Japan index fell from 2.20 to 1.93. The Australia–New Zealand collaboration index, although much higher than expected, fell from 4.33 to 3.65. Other partnerships strengthened during this period. The Australia-China collabora-tion shifted from slightly weaker to slightly stronger than ex-pected. India’s collaborations with both South Korea and Japan grew stronger between 1997 and 2012.
Figure 5-24Selected country share of U.S. internationally coauthored articles: 1997 and 2012Percent
NOTES: Article counts are from the set of journals covered by the Science Citation Index (SCI) and Social Sciences Citation Index (SSCI). Articles are classi�ed by the year they entered the database rather than their year of publication, and are assigned to a country/economy on the basis of the institutional address(es) listed in the article. Articles are credited on a whole-count basis (i.e., each collaborating institution or country is credited one count). Internationally coauthored articles may also have multiple domestic coauthors.
SOURCES: National Science Foundation, National Center for Science and Engineering Statistics, and The Patent Board,TM special tabulations (2013) from Thomson Reuters, SCI and SSCI, http://thomsonreuters.com/products_services/science/.
Science and Engineering Indicators 2014
China United Kingdom Germany Canada France Italy Japan0
5
10
15
201997 2012
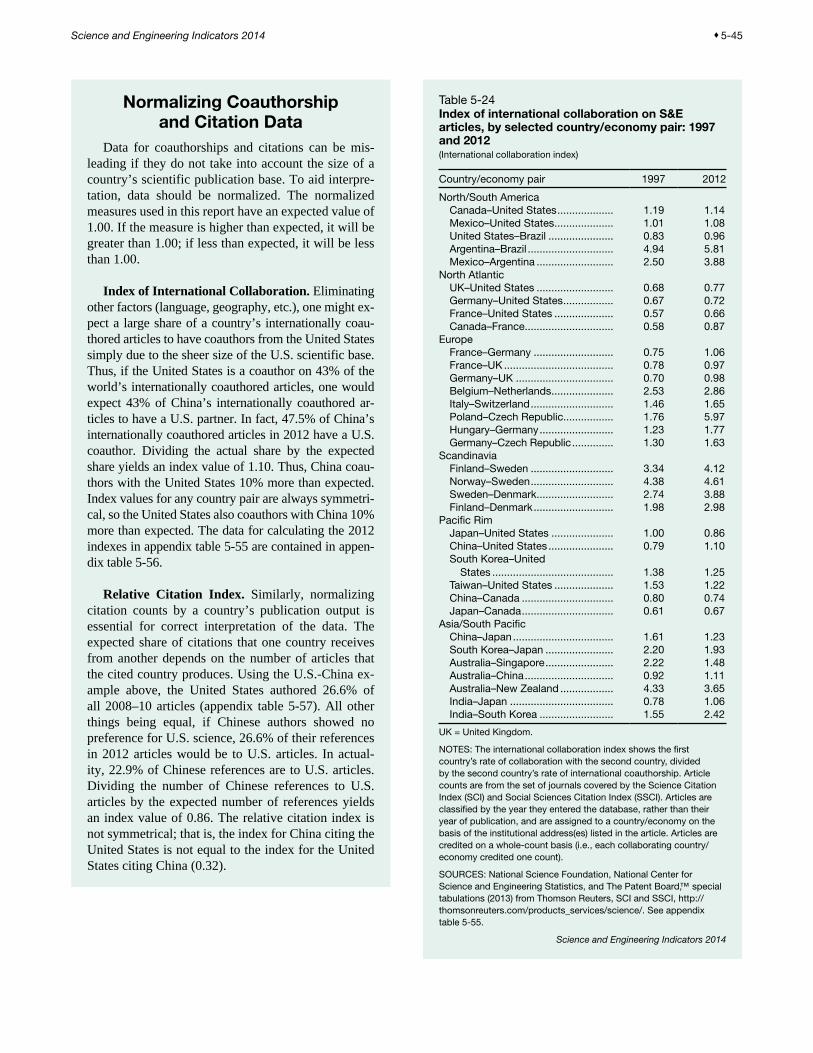
Science and Engineering Indicators 2014 ♦ 5-45
Table 5-24Index of international collaboration on S&E articles, by selected country/economy pair: 1997 and 2012(International collaboration index)
Country/economy pair 1997 2012
North/South AmericaCanada–United States ................... 1.19 1.14Mexico–United States .................... 1.01 1.08United States–Brazil ...................... 0.83 0.96Argentina–Brazil ............................. 4.94 5.81Mexico–Argentina .......................... 2.50 3.88
North AtlanticUK–United States .......................... 0.68 0.77Germany–United States ................. 0.67 0.72France–United States .................... 0.57 0.66Canada–France .............................. 0.58 0.87
EuropeFrance–Germany ........................... 0.75 1.06France–UK ..................................... 0.78 0.97Germany–UK ................................. 0.70 0.98Belgium–Netherlands ..................... 2.53 2.86Italy–Switzerland ............................ 1.46 1.65Poland–Czech Republic................. 1.76 5.97Hungary–Germany ......................... 1.23 1.77Germany–Czech Republic .............. 1.30 1.63
ScandinaviaFinland–Sweden ............................ 3.34 4.12Norway–Sweden ............................ 4.38 4.61Sweden–Denmark .......................... 2.74 3.88Finland–Denmark ........................... 1.98 2.98
Pacific RimJapan–United States ..................... 1.00 0.86China–United States ...................... 0.79 1.10South Korea–United
States ......................................... 1.38 1.25Taiwan–United States .................... 1.53 1.22China–Canada ............................... 0.80 0.74Japan–Canada ............................... 0.61 0.67
Asia/South PacificChina–Japan .................................. 1.61 1.23South Korea–Japan ....................... 2.20 1.93Australia–Singapore ....................... 2.22 1.48Australia–China .............................. 0.92 1.11Australia–New Zealand .................. 4.33 3.65India–Japan ................................... 0.78 1.06India–South Korea ......................... 1.55 2.42
UK = United Kingdom.
NOTES: The international collaboration index shows the first country’s rate of collaboration with the second country, divided by the second country’s rate of international coauthorship. Article counts are from the set of journals covered by the Science Citation Index (SCI) and Social Sciences Citation Index (SSCI). Articles are classified by the year they entered the database, rather than their year of publication, and are assigned to a country/economy on the basis of the institutional address(es) listed in the article. Articles are credited on a whole-count basis (i.e., each collaborating country/economy credited one count).
SOURCES: National Science Foundation, National Center for Science and Engineering Statistics, and The Patent Board,™ special tabulations (2013) from Thomson Reuters, SCI and SSCI, http://thomsonreuters.com/products_services/science/. See appendix table 5-55.
Science and Engineering Indicators 2014
Normalizing Coauthorship and Citation Data
Data for coauthorships and citations can be mis-leading if they do not take into account the size of a country’s scientific publication base. To aid interpre-tation, data should be normalized. The normalized measures used in this report have an expected value of 1.00. If the measure is higher than expected, it will be greater than 1.00; if less than expected, it will be less than 1.00.
Index of International Collaboration. Eliminating other factors (language, geography, etc.), one might ex-pect a large share of a country’s internationally coau-thored articles to have coauthors from the United States simply due to the sheer size of the U.S. scientific base. Thus, if the United States is a coauthor on 43% of the world’s internationally coauthored articles, one would expect 43% of China’s internationally coauthored ar-ticles to have a U.S. partner. In fact, 47.5% of China’s internationally coauthored articles in 2012 have a U.S. coauthor. Dividing the actual share by the expected share yields an index value of 1.10. Thus, China coau-thors with the United States 10% more than expected. Index values for any country pair are always symmetri-cal, so the United States also coauthors with China 10% more than expected. The data for calculating the 2012 indexes in appendix table 5-55 are contained in appen-dix table 5-56.
Relative Citation Index. Similarly, normalizing citation counts by a country’s publication output is essential for correct interpretation of the data. The expected share of citations that one country receives from another depends on the number of articles that the cited country produces. Using the U.S.-China ex-ample above, the United States authored 26.6% of all 2008–10 articles (appendix table 5-57). All other things being equal, if Chinese authors showed no preference for U.S. science, 26.6% of their references in 2012 articles would be to U.S. articles. In actual-ity, 22.9% of Chinese references are to U.S. articles. Dividing the number of Chinese references to U.S. articles by the expected number of references yields an index value of 0.86. The relative citation index is not symmetrical; that is, the index for China citing the United States is not equal to the index for the United States citing China (0.32).
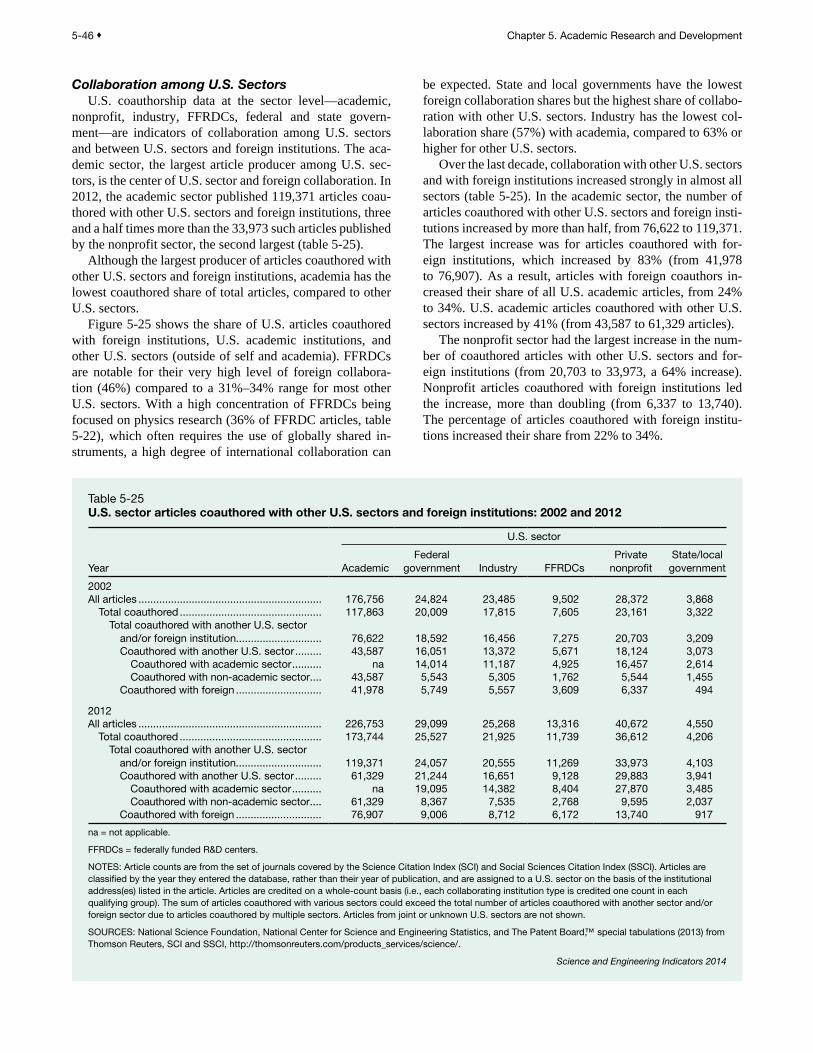
5-46 ♦ Chapter 5. Academic Research and Development
Collaboration among U.S. SectorsU.S. coauthorship data at the sector level—academic,
nonprofit, industry, FFRDCs, federal and state govern-ment—are indicators of collaboration among U.S. sectors and between U.S. sectors and foreign institutions. The aca-demic sector, the largest article producer among U.S. sec-tors, is the center of U.S. sector and foreign collaboration. In 2012, the academic sector published 119,371 articles coau-thored with other U.S. sectors and foreign institutions, three and a half times more than the 33,973 such articles published by the nonprofit sector, the second largest (table 5-25).
Although the largest producer of articles coauthored with other U.S. sectors and foreign institutions, academia has the lowest coauthored share of total articles, compared to other U.S. sectors.
Figure 5-25 shows the share of U.S. articles coauthored with foreign institutions, U.S. academic institutions, and other U.S. sectors (outside of self and academia). FFRDCs are notable for their very high level of foreign collabora-tion (46%) compared to a 31%–34% range for most other U.S. sectors. With a high concentration of FFRDCs being focused on physics research (36% of FFRDC articles, table 5-22), which often requires the use of globally shared in-struments, a high degree of international collaboration can
be expected. State and local governments have the lowest foreign collaboration shares but the highest share of collabo-ration with other U.S. sectors. Industry has the lowest col-laboration share (57%) with academia, compared to 63% or higher for other U.S. sectors.
Over the last decade, collaboration with other U.S. sectors and with foreign institutions increased strongly in almost all sectors (table 5-25). In the academic sector, the number of articles coauthored with other U.S. sectors and foreign insti-tutions increased by more than half, from 76,622 to 119,371. The largest increase was for articles coauthored with for-eign institutions, which increased by 83% (from 41,978 to 76,907). As a result, articles with foreign coauthors in-creased their share of all U.S. academic articles, from 24% to 34%. U.S. academic articles coauthored with other U.S. sectors increased by 41% (from 43,587 to 61,329 articles).
The nonprofit sector had the largest increase in the num-ber of coauthored articles with other U.S. sectors and for-eign institutions (from 20,703 to 33,973, a 64% increase). Nonprofit articles coauthored with foreign institutions led the increase, more than doubling (from 6,337 to 13,740). The percentage of articles coauthored with foreign institu-tions increased their share from 22% to 34%.
Table 5-25U.S. sector articles coauthored with other U.S. sectors and foreign institutions: 2002 and 2012
U.S. sector
Year AcademicFederal
government Industry FFRDCsPrivate
nonprofitState/local
government
2002All articles .............................................................. 176,756 24,824 23,485 9,502 28,372 3,868
Total coauthored ................................................ 117,863 20,009 17,815 7,605 23,161 3,322Total coauthored with another U.S. sector
and/or foreign institution............................. 76,622 18,592 16,456 7,275 20,703 3,209Coauthored with another U.S. sector ......... 43,587 16,051 13,372 5,671 18,124 3,073
Coauthored with academic sector .......... na 14,014 11,187 4,925 16,457 2,614Coauthored with non-academic sector .... 43,587 5,543 5,305 1,762 5,544 1,455
Coauthored with foreign ............................. 41,978 5,749 5,557 3,609 6,337 494
2012All articles .............................................................. 226,753 29,099 25,268 13,316 40,672 4,550
Total coauthored ................................................ 173,744 25,527 21,925 11,739 36,612 4,206Total coauthored with another U.S. sector
and/or foreign institution............................. 119,371 24,057 20,555 11,269 33,973 4,103Coauthored with another U.S. sector ......... 61,329 21,244 16,651 9,128 29,883 3,941
Coauthored with academic sector .......... na 19,095 14,382 8,404 27,870 3,485Coauthored with non-academic sector .... 61,329 8,367 7,535 2,768 9,595 2,037
Coauthored with foreign ............................. 76,907 9,006 8,712 6,172 13,740 917
na = not applicable.
FFRDCs = federally funded R&D centers.
NOTES: Article counts are from the set of journals covered by the Science Citation Index (SCI) and Social Sciences Citation Index (SSCI). Articles are classified by the year they entered the database, rather than their year of publication, and are assigned to a U.S. sector on the basis of the institutional address(es) listed in the article. Articles are credited on a whole-count basis (i.e., each collaborating institution type is credited one count in each qualifying group). The sum of articles coauthored with various sectors could exceed the total number of articles coauthored with another sector and/or foreign sector due to articles coauthored by multiple sectors. Articles from joint or unknown U.S. sectors are not shown.
SOURCES: National Science Foundation, National Center for Science and Engineering Statistics, and The Patent Board,™ special tabulations (2013) from Thomson Reuters, SCI and SSCI, http://thomsonreuters.com/products_services/science/.
Science and Engineering Indicators 2014

Science and Engineering Indicators 2014 ♦ 5-47
Articles with at least one author from industry grew the least over the time period, less than 8%, and in turn had the smallest increase in articles coauthored with other U.S. sec-tors and foreign institutions (25%).
Much of the growth of industry-coauthored articles was with foreign institutions; foreign coauthorships increased by 57%. Articles coauthored with the academic sector rose by only 29%, the smallest increase among sectors coauthoring with academia.
Trends in Citation of S&E ArticlesCitations indicate influence, and they are increasingly
international in scope.54 When scientists and engineers cite the published papers resulting from prior S&E research, they are formally crediting the influence of that research on their own work.
Citations are generally increasing with the volume of S&E articles. (For the analysis of citations from articles to articles, citation counts are limited to a fixed 3-year cita-tion window that begins 4 years and ends 2 years prior to the year of the citing article.55) As cited by 1992 articles, an earlier S&E article received, on average, 1.85 citations. In contrast, an S&E article cited by 2012 articles received, on average, 2.47 citations (figure 5-26). Articles with U.S. authors tended to receive more citations than others, but that gap has narrowed slightly in the most recent 4 years.
The next sections examine two aspects of article citations in a global context: the overall rate of citation of a country’s scientific publications, and the share of the world’s most
highly cited literature authored by different countries. The discussion of article citations will conclude with an exami-nation of citations to articles authored by researchers at U.S. academic institutions and in other U.S. sectors.
International Citation PatternsLike the indicators of international coauthorship dis-
cussed earlier, cross-national citations are evidence that S&E research is increasingly international in scope. Citations to a country’s articles that come from articles authored out-side that country are referred to as international citations. Between 1992 and 2012, the international share of citations increased in all but one of the world’s major S&E article–producing countries.
China is the exception. In 1992, 69% of citations to Chinese S&E articles came from outside China; by 2012, the proportion had dropped to 49% (figure 5-27). This suggests that China’s expanding S&E article output is being used mostly within China. However, changes in the composition of the Thomson Reuters database probably also play a role in accounting for this trend.56 The trend toward domestic cita-tions is also related to the unusually large role of domestic articles in Chinese output growth; the lack of international coauthors may explain, in part, the relatively low rate of in-ternational citations.
The relative citation index normalizes cross-national citation data for variations in publication output, much like the collaboration index (see sidebar, “Normalizing Coauthorship and Citation Data”). The expected value is 1.0, but unlike the collaboration index, citation indexes are
Figure 5-25Share of U.S. sector articles coauthored with foreign institutions, academia, and other U.S. sectors: 2010Percent
FFRDC = federally funded R&D center.
NOTES: Article counts are from the set of journals covered by the Science Citation Index (SCI) and Social Sciences Citation Index (SSCI). Articles are classi�ed by the year they entered the database, rather than their year of publication, and are assigned to a sector on the basis of the institutional address(es) listed in the article. Articles are credited on a whole-count basis (i.e., each collaborating institution type is credited one count in each qualifying group). The sum of shares may exceed 100 due to articles coauthored by multiple sectors. Articles from joint or unknown sectors are not shown. Articles with authors from a single sector are omitted.
SOURCES: National Science Foundation, National Center for Science and Engineering Statistics, and The Patent Board,™ special tabulations (2013) from Thomson Reuters, SCI and SSCI, http://thomsonreuters.com/products_services/science/.
Science and Engineering Indicators 2014
Foreign coauthor Academic coauthor Other sector coauthor, excluding academia0
20
40
60
80
100
Academic Private nonpro�t Federal government Industry FFRDC State/local government

5-48 ♦ Chapter 5. Academic Research and Development
not symmetric. When country A cites an article by country B, this does not mean that country B is also citing an article by country A. Table 5-26 shows the relative citation index for the year 2012 for major publishing locations in four re-gions: North America, the EU, Asia, and South America. These data show the following:
♦ U.S. articles are most highly cited by articles from Canada (1.29) and the United Kingdom (1.15).
♦ U.S. authors cite Chinese articles much less than expected (0.32).
♦ Mexico is heavily cited by South American countries, ranging from 22% to 44% more than expected (index values from 1.22 to 1.44); likewise, Mexican authors cite South American articles more than they cite articles from other areas of the world.
♦ Inter-European influence is strong, with most country pairs exhibiting index values greater than 1.0. Asian au-thors show similar interconnectedness, with the exception of Japan.
These data indicate the strong influence that geographic, cultural, and language ties have on citation patterns.
U.S. articles are more influential than those produced by the world’s other major publishing regions or countries. They receive 31% more citations than expected. U.S. index values for physics and chemistry are especially high, at 1.49 and 1.43, respectively, but in every field, U.S. articles are disproportionately cited (see figure 5-28).57
Trends in Highly Cited S&E Literature by CountryAnother indicator of the performance of a national or re-
gional S&E system is the share of its articles that are highly cited. High citation rates generally indicate that an article has a relatively great impact on subsequent research.
World citations to U.S. research articles show that, in all broad fields of S&E, U.S. articles continue to have the highest citation rates. In both 2002 and 2012, as displayed in appendix table 5-58, the U.S. share of articles in the 99th citation percentile was higher than its share in the 95th percentile, and these were higher than its share in the 90th
Figure 5-26Average citations per S&E article, by country of author: 1992–2012Number
NOTES: Article/citation counts are from the set of journals covered by the Science Citation Index (SCI) and Social Sciences Citation Index (SSCI). Articles are classi�ed by the year they entered the database, rather than year their of publication, and are assigned to a country/economy on the basis of the institutional address(es) listed in the article. Articles are credited on a fractional-count basis (i.e., for articles with collaborating institutions from multiple countries/ economies, each country/economy receives fractional credit on the basis of the proportion of its participating institutions). Citation counts are based on a 3-year period with a 2-year lag (e.g., citations for 2012 are references made in articles in the 2012 data tape to articles in the 2008–10 data tapes).
SOURCES: National Science Foundation, National Center for Science and Engineering Statistics, and The Patent Board,TM special tabulations (2011) from Thomson Reuters, SCI and SSCI, http:// thomsonreuters.com/products_services/science/.
Science and Engineering Indicators 2014
1992 1994 1996 1998 2000 2002 2004 2006 2008 2010 20120
0.5
1.0
1.5
2.0
2.5
3.0
3.5
4.0
All countries
United States
Not United States
Figure 5-27Share of selected region/country citations that are international: 1992–2012Percent
EU = European Union.
NOTES: Article/citation counts are from the set of journals covered by the Science Citation Index (SCI) and Social Sciences Citation Index (SSCI). Articles are classi�ed by the year they entered the database rather than their year of publication, and are assigned to a country/region on the basis of the institutional address(es) listed in the article. Articles are credited on a fractional-count basis (i.e., for articles with collaborating institutions from multiple countries/ regions, each country/region receives fractional credit on the basis of the proportion of its participating institutions). See appendix table 5-24 for countries included in the EU, which in this �gure is treated as a single country. Citation counts are based on a 3-year period with a 2-year lag (e.g., citations for 2012 are references made in articles in the 2012 data tape to articles in the 2008–10 data tapes).
SOURCES: National Science Foundation, National Center for Science and Engineering Statistics, and The Patent Board,TM special tabulations (2013) from Thomson Reuters, SCI and SSCI, http:// thomsonreuters.com/products_services/science/.
Science and Engineering Indicators 2014
1992 1994 1996 1998 2000 2002 2004 2006 2008 2010 2012
40
0
45
50
55
60
65
70
75
United States
EU
China
Japan

Science and Engineering Indicators 2014 ♦ 5-49
Table 5-26Relative citation index, by selected country/economy pair: 2012
Cited country/economy
North America European Union Asia South America
Citing country/economy
United States Canada Mexico France Germany UK China Japan
South Korea Taiwan Argentina Brazil Chile
North AmericaUnited States ... 2.15 0.96 0.35 0.72 0.84 0.97 0.32 0.53 0.40 0.34 0.36 0.31 0.46Canada ............ 1.29 5.57 0.46 0.86 0.87 1.16 0.39 0.50 0.41 0.39 0.46 0.38 0.59Mexico ............. 0.99 0.90 27.04 0.96 0.84 0.95 0.62 0.52 0.54 0.59 1.37 1.17 1.52
European UnionFrance .............. 1.02 0.87 0.45 5.35 1.15 1.13 0.39 0.63 0.41 0.35 0.58 0.40 0.70Germany .......... 1.08 0.82 0.34 1.05 4.24 1.14 0.36 0.64 0.39 0.30 0.43 0.31 0.55UK .................... 1.15 1.00 0.36 0.94 1.06 4.17 0.30 0.51 0.33 0.29 0.37 0.32 0.50
AsiaChina ................ 0.86 0.65 0.46 0.71 0.78 0.64 3.43 0.83 1.11 1.06 0.43 0.44 0.37Japan ............... 0.99 0.65 0.31 0.81 0.95 0.79 0.56 5.16 0.74 0.56 0.31 0.27 0.31South Korea ..... 1.04 0.64 0.34 0.64 0.74 0.68 1.03 1.02 7.45 1.29 0.36 0.37 0.45Taiwan .............. 0.95 0.71 0.43 0.65 0.73 0.68 1.12 0.90 1.51 11.37 0.41 0.40 0.41
South AmericaArgentina .......... 0.91 0.87 1.44 1.03 0.93 0.87 0.44 0.48 0.40 0.40 39.73 1.68 2.98Brazil ................ 0.84 0.79 1.22 0.87 0.75 0.83 0.53 0.50 0.49 0.53 1.92 13.93 1.07Chile ................. 1.02 0.90 1.31 1.13 1.05 1.06 0.42 0.46 0.41 0.37 2.74 1.19 55.46
World ................... 1.31 1.01 0.56 1.03 1.13 1.15 0.84 0.82 0.75 0.68 0.65 0.60 0.67
UK = United Kingdom.
NOTES: Article/citation counts are from the set of journals covered by the Science Citation Index (SCI) and Social Sciences Citation Index (SSCI). Articles are classified by the year they entered database, rather than their year of publication, and are assigned to a country/economy on the basis of the institutional address(es) listed in the article. Articles are credited on a fractional-count basis (i.e., for articles with collaborating institutions from multiple countries/economies, each country/economy receives fractional credit on the basis of the proportion of its participating institutions). Citation counts are based on a 3-year period with a 2-year lag (e.g., citations for 2012 are references made in articles in the 2012 data tape to articles in the 2008–10 data tapes).
SOURCES: National Science Foundation, National Center for Science and Engineering Statistics, and The Patent Board,TM special tabulations (2013) from Thomson Reuters, SCI and SSCI, http://thomsonreuters.com/products_services/science/.
Science and Engineering Indicators 2014
Figure 5-28Relative citation index to the United States, by scientific field: 2012Index
NOTES: Article/citation counts are from the set of journals covered by the Science Citation Index (SCI) and Social Sciences Citation Index (SSCI). Articles are classi�ed by the year they entered the database rather than their year of publication. Citation counts are based on a 3-year period with a 2-year lag (e.g., citations for 2012 are references made in articles in the 2012 data tape to articles in the 2008–10 data tapes).
SOURCES: National Science Foundation, National Center for Science and Engineering Statistics, and The Patent Board,TM special tabulations (2013) from Thomson Reuters, SCI and SSCI, http://thomsonreuters.com/products_services/science/.
Science and Engineering Indicators 2014
Physics Chemistry Mathe-matics
Biologicalsciences
Engineer-ing
Astro-nomy
Medicalsciences
Geo-sciences
Computersciences
Socialsciences
Psychology Other lifesciences
Agriculturalsciences
0
0.2
0.4
0.6
0.8
1.0
1.2
1.4
1.6

5-50 ♦ Chapter 5. Academic Research and Development
percentile.58 In 2012, although the United States authored 27% of the world’s total of 2.4 million articles in the cited period shown, the United States authored 46% of the articles in the 99th citation percentile.
U.S. publications uniquely display the preferred citation pattern: the higher the citation percentile, the higher the share of U.S. articles in the citation percentile. In contrast, EU articles are found disproportionately in the middle ci-tation percentiles, while Chinese and Japanese articles are found disproportionately in the lower citation percentiles (see appendix table 5-58). Nevertheless, as the U.S. share of all articles produced declined between 2002 and 2012, its share of articles in the 99th percentile (i.e., the top 1%) of cited articles also declined, particularly in some fields. Shares in the top percentile increased for the EU and China but dropped slightly for Japan.
Between 2002 and 2012, 1.6%–1.8% of U.S.-authored S&E articles have appeared in the world’s top 1% of cited articles, compared with 0.7%–0.9% of articles from the EU (figure 5-29). The share of China’s articles in the top 1%
remained behind the United States and the EU but increased from 0.1% to 0.6% over the period.
The high citation of U.S. articles has changed little over the past 10 years, remaining much higher than expected when compared to the overall U.S. share of world articles (figure 5-30; appendix table 5-57). Between 2002 and 2012, the EU index of highly cited articles for all fields combined rose slightly, to almost 1.0. The Japanese index remained the same and well below the expected value. China’s index rose substantially from 0.1 in 2002 to 0.6 in 2012, the same as Japan’s index.
U.S. articles are highly cited across all broad scientific fields, with indexes ranging from 1.3 to 2.2. The U.S. in-dexes across all these fields showed little change between 2002 and 2012. The greatest gain in the index of highly cited articles was in engineering, which grew from 1.7 to 2.0. The indexes for two fields—chemistry and social sciences—de-clined slightly (appendix table 5-57).
The EU’s articles are more highly cited than expected in two fields, agriculture (1.2) and physics (1.2) for 2012. The EU’s index values are what would be expected in two fields—astronomy and chemistry.
China is less highly cited than expected in all science fields except computer sciences, chemistry, and geoscienc-es. Impressively, China’s index in computer sciences leaped from 0.2 in 2002 to 1.3 in 2012. Chinese geosciences articles experienced a similar rise from 0.2 to 1.1, while the index for chemistry has now just reached the expected value of 1.0.
Japan’s production of highly cited articles is lower than expected across all fields, although its index increased sub-stantially in astronomy.
U.S. Cross-Sector Citation TrendsThe relative citation index (described in the section on
“International Citation Patterns”) can also be used to exam-ine the influence that each U.S. sector has on U.S. S&E lit-erature. Figure 5-31 shows the relative citation index values for each of the six sectors of U.S. institutions and how they have changed over the past 20 years. U.S. academic articles are at the citation level that would be expected and have maintained this level over the entire time period. State and local governments, industry, and FFRDCs historically have produced the U.S. articles with the lowest citation rates. Index values for industry articles have gradually declined over time. In contrast, articles authored at FFRDCs have shown a marked improvement since 2008, rising above the expected value of 1.0 by 2011 and finally ending the period as the second most highly cited U.S. sector.
Articles authored at federal government institutions al-ways have been cited within the United States more than expected. Although the index value declined almost to 1.0 in the 1990s, it has since risen to 1.09. The U.S. articles with the relative greatest impact are those by nonprofit organiza-tions. Counter to the federal government trend, index values rose over the 1990s to 1.29 but have been in decline in the past 10 years, dropping to 1.14 by 2012.
Figure 5-29Share of U.S., EU, and China S&E articles that are in the world’s top 1% of cited articles: 2002–12Percent
EU = European Union.
NOTES: Article/citation counts are from the set of journals covered by the Science Citation Index (SCI) and Social Sciences Citation Index (SSCI). Articles are classi�ed by the year they entered the database, rather than their year of publication, and are assigned to a country/economy on the basis of the institutional address(es) listed in the article. Articles are credited on a fractional-count basis (i.e., for articles with collaborating institutions from multiple countries/ regions, each country/region receives fractional credit on the basis of the proportion of its participating institutions). See appendix table 5-24 for countries included in the EU, which in this �gure is treated as a single country. Citation counts are based on a 3-year period with a 2-year lag (e.g., citations for 2012 are references made in articles in the 2012 data tape to articles in the 2008–10 data tapes).
SOURCES: National Science Foundation, National Center for Science and Engineering Statistics, and The Patent Board,TM special tabulations (2013) from Thomson Reuters, SCI and SSCI, http:// thomsonreuters.com/products_services/science/. See appendix table 5-57.
Science and Engineering Indicators 2014
2002 2004 2006 2008 2010 20120
0.2
0.4
0.6
0.8
1.0
1.2
1.4
1.6
1.8
2.0United States
EU
China
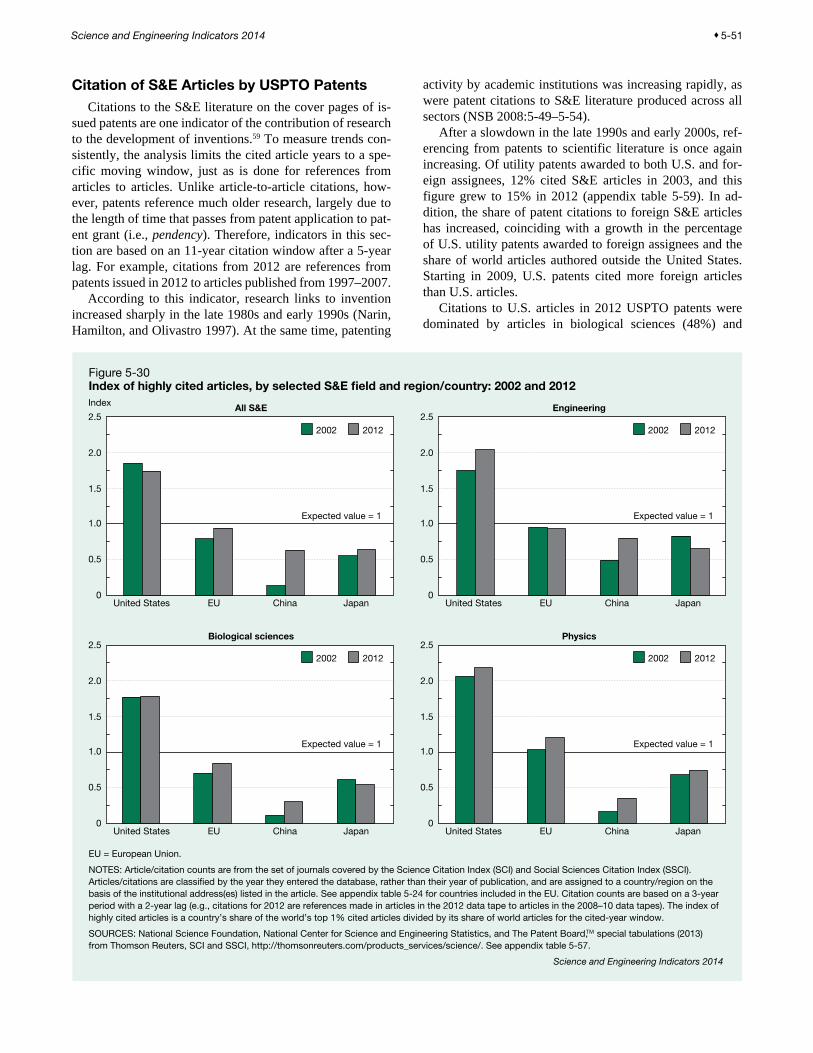
Science and Engineering Indicators 2014 ♦ 5-51
Citation of S&E Articles by USPTO PatentsCitations to the S&E literature on the cover pages of is-
sued patents are one indicator of the contribution of research to the development of inventions.59 To measure trends con-sistently, the analysis limits the cited article years to a spe-cific moving window, just as is done for references from articles to articles. Unlike article-to-article citations, how-ever, patents reference much older research, largely due to the length of time that passes from patent application to pat-ent grant (i.e., pendency). Therefore, indicators in this sec-tion are based on an 11-year citation window after a 5-year lag. For example, citations from 2012 are references from patents issued in 2012 to articles published from 1997–2007.
According to this indicator, research links to invention increased sharply in the late 1980s and early 1990s (Narin, Hamilton, and Olivastro 1997). At the same time, patenting
activity by academic institutions was increasing rapidly, as were patent citations to S&E literature produced across all sectors (NSB 2008:5-49–5-54).
After a slowdown in the late 1990s and early 2000s, ref-erencing from patents to scientific literature is once again increasing. Of utility patents awarded to both U.S. and for-eign assignees, 12% cited S&E articles in 2003, and this figure grew to 15% in 2012 (appendix table 5-59). In ad-dition, the share of patent citations to foreign S&E articles has increased, coinciding with a growth in the percentage of U.S. utility patents awarded to foreign assignees and the share of world articles authored outside the United States. Starting in 2009, U.S. patents cited more foreign articles than U.S. articles.
Citations to U.S. articles in 2012 USPTO patents were dominated by articles in biological sciences (48%) and
Figure 5-30Index of highly cited articles, by selected S&E field and region/country: 2002 and 2012
EU = European Union.
NOTES: Article/citation counts are from the set of journals covered by the Science Citation Index (SCI) and Social Sciences Citation Index (SSCI). Articles/citations are classi�ed by the year they entered the database, rather than their year of publication, and are assigned to a country/region on the basis of the institutional address(es) listed in the article. See appendix table 5-24 for countries included in the EU. Citation counts are based on a 3-year period with a 2-year lag (e.g., citations for 2012 are references made in articles in the 2012 data tape to articles in the 2008–10 data tapes). The index of highly cited articles is a country’s share of the world’s top 1% cited articles divided by its share of world articles for the cited-year window.
SOURCES: National Science Foundation, National Center for Science and Engineering Statistics, and The Patent Board,TM special tabulations (2013) from Thomson Reuters, SCI and SSCI, http://thomsonreuters.com/products_services/science/. See appendix table 5-57.
Science and Engineering Indicators 2014
All S&EIndex Engineering
Biological sciences Physics
United States EU China Japan0
0.5
1.0
1.5
2.0
2.52002 2012
Expected value = 1
United States EU China Japan0
0.5
1.0
1.5
2.0
2.52002 2012
Expected value = 1
United States EU China Japan0
0.5
1.0
1.5
2.0
2.52002 2012
Expected value = 1
United States EU China Japan0
0.5
1.0
1.5
2.0
2.52002 2012
Expected value = 1

5-52 ♦ Chapter 5. Academic Research and Development
medical sciences (23%), along with chemistry (11%), engi-neering (7%), and physics (7%). These five fields account for 96% of the total (figure 5-32; appendix table 5-60). The patents citing U.S. articles are concentrated in three tech-nology areas—pharmaceuticals, chemicals, and biotechnol-ogy—that together make up 63% of the total (figure 5-32).
The proportion of U.S. articles cited in U.S. patents that were authored by industry and federal government dropped between 2003 and 2012, largely because citations to aca-demic articles increased (appendix table 5-59). Citations to academia grew from 59% to 65% of total citations to U.S. articles in that time period. This trend was stronger in some fields than in others. It was especially pronounced in en-gineering (from 50% to 68%), mathematics (from 71% to 89%), physics (from 51% to 68%), and psychology (from 67% to 83%). Despite the increasing proportion of citations to academic articles overall, citations to academic agricul-tural science articles actually decreased (from 67% to 63%) (appendix table 5-60).
Articles from other sectors receive far fewer citations in patents, but this varied by field (figure 5-33). After academia,
industry articles capture the next-largest share of citations in every major field except medical sciences, ranging from 12% (medical sciences) to 22% (engineering). In medical sciences, nonprofit articles garner 16% of patent citations.
Energy and Environment–Related Patent CitationsClean energy and energy conservation and related tech-
nologies—including biofuels, solar, wind, nuclear, energy efficiency, pollution prevention, smart grid, and carbon sequestration—are closely linked to scientific R&D and have become a policy focus in the United States and other countries. NSF developed a method for identifying patents
Figure 5-31Within-U.S. article citations: Relative citation index, 1992–2012Index
FFRDC = federally funded R&D center.
NOTES: Article/citation counts are from the set of journals covered by the Science Citation Index (SCI) and Social Sciences Citation Index (SSCI). Articles are classi�ed by the year they entered the database, rather than their year of publication, and are assigned to a sector on the basis of the institutional address(es) listed in the article. Articles/citations are credited on a fractional-count basis (i.e., for articles with collaborating institutions from multiple countries/ sectors, each country/sector receives fractional credit on the basis of the proportion of its participating institutions). Citation counts are based on a 3-year period with a 2-year lag (e.g., citations for 2012 are references made in articles in the 2012 data tape to articles in the 2008–10 data tapes).
SOURCES: National Science Foundation, National Center for Science and Engineering Statistics, and The Patent Board,TM special tabulations (2013) from Thomson Reuters SCI and SSCI, http:// thomsonreuters.com/products_services/science/.
Science and Engineering Indicators 2014
1992 1994 1996 1998 2000 2002 2004 2006 2008 2010 20120
0.7
0.8
0.9
1.0
1.1
1.2
1.3
1.4
Academic
FFRDC
Federal government
Industry
Private nonpro�t
State/local government
Figure 5-32Citations of U.S. S&E articles in U.S. patents, by selected S&E article field and technology area: 2012
NOTES: Citations are references to S&E articles in journals covered by the Science Citation Index (SCI) and Social Sciences Citation Index (SSCI). Citation counts are based on an 11-year window with a 5-year lag (e.g., citations for 2012 are references in U.S. patents issued in 2012 to articles published in 1997–2007).
SOURCES: National Science Foundation, National Center for Science and Engineering Statistics, and The Patent Board,TM special tabulations (2013) from U.S. Patent and Trademark Of�ce (USPTO), Patent Grant Bibliographic Data, and Thomson Reuters, SCI and SSCI, http://www.thomsonreuters.com/products_services/science/. See appendix table 5-60.
Science and Engineering Indicators 2014
Biologicalsciences48.2%
Medicalsciences 22.9%
Chemistry11.4%
Physics7.0%
Engineering 6.7%All others 3.9%
Cited article field
Technology area of citing patent
Pharmaceuticals25.7%
Chemicals19.9%
Biotechnology17.4%
Semiconductorsand electronics
5.2%
Computersand peripherals
5.1%
Agriculture4.7%
All others18.0%
Medicalelectronics
4.0%

Science and Engineering Indicators 2014 ♦ 5-53
with potential application in these technologies. (See sidebar “Identifying Clean Energy and Pollution Control Patents” for details on the filters.)
Chapter 6 of this volume presents extensive data on the patents in four technology areas related to clean energy—alternative energy, pollution mitigation, smart grid, and energy storage—including the nationality of their inven-tors. (See chapter 6, “Industry, Technology, and the Global Marketplace,” section “Patenting of Clean Energy and Pollution Control Technologies.”) This section reports on the citations in those patents to the S&E literature, using those citations to indicate the linkages between S&E R&D and the potential for practical use of the results of those R&D proj-ects in new inventions and technologies.60 The citation data are based on patents issued between 2003 and 2012.
U.S. patents in these four areas of clean energy technolo-gy cite more foreign literature than U.S. literature (appendix table 5-61). In contrast, patents in all technology areas have consistently cited more U.S. literature than foreign literature (appendix table 5-59).
Within citations to U.S. literature, articles authored by the academic sector accounted for the most citations (70%) among U.S. sectors in 2012. Industry and FRRDCs were the next largest, accounting for 12% and 10% of citations, respectively. Between 2003 and 2012, academia’s share of citations to U.S. literature increased from 59% to 70%. Industry’s share fell from 22% to 12%.
Four broad S&E fields dominate the citations to S&E literature in these four patent areas: chemistry, physics,
engineering, and biological sciences. The range of S&E fields cited indicates that these developing technologies rely on a wide base of S&E knowledge.
The S&E fields cited by these patents are shown in table 5-27. These four categories of energy and environment–re-lated patents show somewhat different patterns of reliance on S&E literature. In both energy storage and smart grid, ref-erencing is concentrated in a single field. For energy storage patents, over half of all citations are to chemistry articles; for smart grid patents, engineering is similarly dominant. Alternative energy and pollution mitigation citations are more evenly distributed across the four fields; for both of these technologies, however, chemistry is the most heavily cited field, receiving roughly one-third of all citations.
Using patent citations as an indicator, the data show that chemistry research contributes heavily to invention in all ar-eas of green technology with the exception of smart grid, where engineering dominates. Geoscience articles, which in this taxonomy include environmental sciences, are promi-nent as well, but only in pollution mitigation.
Academic PatentingAcademic institutions whose research leads to intellec-
tual property attempt to protect and benefit from the fruits of their labor through patents and associated activities. The majority of U.S. universities did not become actively in-volved in managing their own intellectual property until late in the 20th century, when the Bayh-Dole Act of 1980 gave
Figure 5-33Citation of U.S. S&E articles in U.S. patents, by selected S&E field and article author sector: 2012Percent
All �elds Engineering Chemistry Physics Biological sciences Medical sciences0
10
20
30
40
50
60
70
80
FFRDC = federally funded R&D center.
NOTES: Citations are references to U.S. S&E articles in journals covered by the Science Citation Index (SCI) and Social Sciences Citation Index (SSCI). Citations are classi�ed on a fractional-count basis (i.e., for cited articles with collaborating institutions from more than one sector, each sector receives fractional credit on the basis of the proportion of its participating institutions). Citation counts are based on an 11-year window with a 5-year lag (e.g., citations for 2012 are references in U.S. patents issued in 2012 to articles published in 1997–2007). Fields with less than 5% of 2012 citations to U.S. articles are omitted. Joint and unknown sectors are not shown.
SOURCES: National Science Foundation, National Center for Science and Engineering Statistics, and The Patent Board,TM special tabulations (2013) from U.S. Patent and Trademark Of�ce (USPTO), Patent Grant Bibliographic Data, and Thomson Reuters, SCI and SSCI, http://www.thomsonreuters.com/products_ services/science/. See appendix table 5-60.
Science and Engineering Indicators 2014
Academic Nonpro�tFederal government Industry FFRDC

5-54 ♦ Chapter 5. Academic Research and Development
colleges and universities a common legal framework for claiming ownership of income streams from patented dis-coveries that resulted from their federally funded research. Other countries implemented policies similar to the Bayh-Dole Act by the early 2000s, giving their academic institu-tions (rather than inventors or the government) ownership of patents resulting from government-funded research (Geuna and Rossi 2011). To facilitate the conversion of new knowl-edge produced in their laboratories to patent-protected pub-lic knowledge that potentially can be licensed by others or form the basis for a startup firm, many U.S. research insti-tutions established technology management/transfer offices (AUTM 2009).
The following sections discuss overall trends in univer-sity patenting and related indicators through 2011 and 2012.
Trends and Patterns in Academic PatentingUSPTO granted 8,700 patents to U.S. and foreign univer-
sities and colleges in 2012, 3.4% of USPTO patents granted to all U.S. and foreign inventors (figure 5-34). U.S. universi-ties and colleges were granted 5,100 USPTO patents, with foreign universities receiving 3,600.
Patenting by academic institutions has increased mark-edly over the last two decades—from 1,800 in 1992 to 8,700 in 2012—resulting in their share of all USPTO patents dou-bling from 1.8% to 3.4%. Patenting by U.S. institutions outpaced overall growth of USPTO patents in the 1990s, resulting in their share of all patents increasing from 1.6% in 1992 to 2.4% in 1999. Although the number of U.S. academ-ic patents continued to grow from 2000 to 2012, the U.S.
university and college share of all USPTO patents declined slightly (appendix table 5-62). In contrast, USPTO patents granted to foreign universities and colleges grew much more rapidly than those granted to U.S. universities and colleges in the 2000–12 period. U.S. patents to foreign universities and colleges grew sixfold to reach 3,600 patents; their share of all USPTO patents rose from 0.4% in 2000 to 1.4% in 2012 (figure 5-34).61
Patenting by U.S. and foreign universities and colleges in another major patent office, the European Patent Office (EPO), shows a similar trend of increasing activity (figure 5-35). The academic share of all patents granted by EPO increased from 0.9% in 1992 to 2.4% in 2012. After steadily increasing in the 1990s and early 2000s, the number of EPO patents granted to U.S. universities and colleges has re-mained flat at approximately 500–600 patents since 2003. In contrast, patenting by foreign universities and colleges grew more rapidly in the 2000s, and they surpassed U.S. universi-ties in 2007.
The top 200 R&D-performing institutions dominate among U.S. universities and university systems receiving patent protection, with 98% of the total patents granted to U.S. universities between 1997 and 2012 (appendix table 5-62).62 Among these institutions, 19 accounted for more than 50% of all patents granted to the top 200 (some of these were multicampus systems, like the University of California and the University of Texas). The University of California system received 11.3% of all U.S. patents granted to U.S. universities over the period, followed by the Massachusetts Institute of Technology, with 4.2%.
Using a combination of U.S. Patent Classification and International Patent Classification codes and text strings, the National Science Foundation developed algorithms to identify U.S. Patent and Trademark Office–issued patents with potential application in four broad, green technology areas. The four technology areas and their main subcategories are listed below. The search codes used to locate relevant patents are available at http://www.patentboard.com/OurResearch/PatentFilters/tabid/115/Default.aspx, which documents the process used in identifying relevant patents.
Alternative energy production Energy storage
Energy management (smart grid) Pollution mitigation
Bioenergy Batteries Advanced components Recycling
Geothermal Flywheels Sensing and measurement Air
Hydropower Superconducting magnetic energy systems
Advanced control methods Solid waste
Nuclear Ultracapacitors Improved interfaces and decision support
Water
Solar Hydrogen production and storage
Integrated communication Environmental remediation
Wave/tidal/ocean Thermal energy storage Cleaner coal
Wind Compressed air Carbon and greenhouse gas capture and storage
Electric/hybrid vehicles
Fuel cells
Identifying Clean Energy and Pollution Control Patents

Science and Engineering Indicators 2014 ♦ 5-55
Biotechnology patents accounted for the largest share (25%) of U.S. university patents in 2012 (appendix table 5-63). Biotechnology has been the largest technology area for U.S. academic patenting since 1991. Pharmaceuticals, the next-largest technology area, has had a declining number of patents over the past decade, dropping from an average of 491 a year in 1998–2002 to 369 a year in 2008–12 (figure 5-36). Medical equipment shows a similar, but much small-er, decline. The other major technology areas have been increasing. Patents for semiconductors have made the great-est increase, from around 90 patents per year in 1993–97 to around 210 in 2008–12.
Commercialization of U.S. Academic PatentsUniversities commercialize their intellectual property by
granting licenses to commercial firms and supporting start-up firms formed by their faculty. Data from the Association of University Technology Managers (AUTM) indicate con-tinuing growth in a number of such patent-related activities. Invention disclosures filed with university technology man-agement/transfer offices describe prospective inventions and are submitted before a patent application is filed. These grew from 12,600 in 2002 to 19,700 in 2011 (notwithstand-ing small shifts in the number of institutions responding
Table 5-27Patent citations to S&E articles, by selected patent technology area and article field: 2003–12
Technology/field Citations (n) Percent
Alternative energy .................. 24,800 100.0Chemistry ........................... 7,611 30.7Physics .............................. 6,004 24.2Engineering ........................ 5,285 21.3Biological sciences ............ 5,017 20.2Geosciences ...................... 400 1.6Agricultural sciences .......... 365 1.5All others ............................ 118 0.5
Energy storage ...................... 7,278 100.0Chemistry ........................... 3,771 51.8Engineering ........................ 1,555 21.4Physics .............................. 1,164 16.0Biological sciences ............ 685 9.4All others ............................ 103 1.4
Smart grid .............................. 1,695 100.0Engineering ........................ 900 53.1Physics .............................. 595 35.1Computer sciences ............ 85 5.0Biological sciences ............ 37 2.2Geosciences ...................... 31 1.8All others ............................ 47 2.8
Pollution mitigation ................ 8,578 100.0Chemistry ........................... 2,943 34.3Engineering ........................ 1,817 21.2Geosciences ...................... 1,605 18.7Biological sciences ............ 1,500 17.5Physics .............................. 326 3.8Agricultural sciences .......... 243 2.8All others ............................ 144 1.7
NOTES: Citations are references to S&E articles in journals covered by the Science Citation Index (SCI) and Social Sciences Citation Index (SSCI). Citation counts are based on an 11-year window with a 5-year lag (e.g., citations for 2012 are references in U.S. patents issued in 2012 to articles published in 1997–2007). Patents may appear in more than one technology area; thus, citation counts may overlap slightly. See sidebar “Identifying Clean Energy and Pollution Control Patents” for details on these technology areas.
SOURCES: National Science Foundation, National Center for Science and Engineering Statistics, and The Patent Board,TM special tabulations (2013) from U.S. Patent and Trademark Office (USPTO), Patent Grant Bibliographic Data, and Thomson Reuters, SCI and SSCI, http://www.thomsonreuters.com/products_services/science/.
Science and Engineering Indicators 2014
Figure 5-34 USPTO patents granted to U.S. and non-U.S. academic institutions: 1992–2012
USPTO = U.S. Patent and Trademark Of�ce.
SOURCE: The Patent Board,™ special tabulations (2013) of Proprietary Patent database. See appendix table 5-62.
Science and Engineering Indicators 2014
1992 1994 1996 1998 2000
Share of all USPTO patent grants
Number of USPTO patent grants
2002 2004 2006 2008 2010 2012
0
1,000
2,000
3,000
4,000
5,000
6,000
USPTO patents grantedto non-U.S. universities
USPTO patents grantedto U.S. universities
1992 1994 1996 1998 2000 2002 2004 2006 2008 2010 20120
0.5
1.0
1.5
2.0
2.5
3.0
3.5
4.0
USPTO patents granted to U.S. universities
USPTO patents granted to non-U.S. universities

5-56 ♦ Chapter 5. Academic Research and Development
Figure 5-36U.S. academic patents, by technology area: Selected 5-year averages, 1993–2012Number
NOTES: Data include institutions af�liated with academic institutions (e.g., university and alumni organizations, foundations, and university associations). Universities vary in how patents are assigned (e.g., to boards of regents, individual campuses, or entities with or without af�liation with the university). The Patent BoardTM technology areas constitute an application-oriented classi�cation system that maps the thousands of International Patent Classes (IPCs) at the main group level into 1 of 35 technology areas. If a patent has more than one IPC, only the primary IPC is considered in mapping.
SOURCES: National Science Foundation, National Center for Science and Engineering Statistics, and The Patent Board,TM special tabulations (2013) from U.S. Patent and Trademark Of�ce (USPTO), Patent Grant Bibliographic Data. See appendix table 5-63.
Science and Engineering Indicators 2014
Biotechnology Pharmaceuticals Measurementtechniques andinstrumentation
Materials Medicalequipment
Semiconductors Optics0
200
400
600
800
1,000
1,200
1,400
1993–97 1998–2002 2003–07 2008–12
0
0.5
1.0
1.5
2.0
2.5
Figure 5-35 EPO patents granted to U.S. and non-U.S. academic institutions: 1992–2012
EPO = European Patent Of�ce.
SOURCE: The Patent Board,™ special tabulations (2013) of Proprietary Patent database.
Science and Engineering Indicators 2014
Share of all EPO patent grantsNumber of EPO patent grants
1992 1994 1996 1998 2000 2002 2004 2006 2008 2010 2012
EPO patents granted to non-U.S. universities
EPO patents granted to U.S. universities
1992 1994 1996 1998 2000 2002 2004 2006 2008 2010 20120
200
400
600
800
1,000
1,200
EPO patents grantedto non-U.S. universities
EPO patents grantedto U.S. universities

Science and Engineering Indicators 2014 ♦ 5-57
to the AUTM survey over the same period) (figure 5-37). Likewise, new U.S. patent applications filed by AUTM uni-versity respondents also increased, nearly doubling from 6,500 in 2002 to 12,100 in 2011. However, U.S. patents awarded to AUTM respondents stayed flat over the period, rising only in the last 2 years and reflecting a similar rise in the number of patents granted to all assignees (see appendix table 5-62).63
Despite the economic slowdown of the past 5 years, the number of new startup companies formed continued to rise, as did the number of past startups still operating; AUTM survey respondents reported a low of 348 startup companies formed in 2003 and a maximum of 617 in 2011, with a total of extant startup companies in 2011 of 3,573 (appendix table 5-64). Licenses and options that generated revenues also in-creased over the period. Active licenses increased steadily from 18,800 in 2001 to 33,300 in 2011.
Most royalties from licensing agreements accrue for rela-tively few patents and the universities that own them, and many of the AUTM respondent offices report no income. (Thursby and colleagues [2001] report that maximizing royalty income is not the dominant objective of university technology management offices.) At the same time, large one-time payments to a university can affect the overall trend in university licensing income. In 2011, the 157 institutions that responded to the AUTM survey reported a total of $1.5 billion in net royalties from their patent holdings. This is essentially the same amount reported for the last 3 years. Perhaps as a result of the nation’s economic downturn, this number is down sharply from the high value of $2.1 billion reported in 2008 (appendix table 5-64).
ConclusionThe nation’s universities and colleges play a key role in
U.S. R&D by providing the following services: ♦ Educating and training S&E students in research practices
and other advanced skills ♦ Performing a large share of the nation’s basic research ♦ Building and operating world-class research facilities and
supporting the national research cyberinfrastructure ♦ Producing intellectual output through published research
articles and patentsOver the past several decades, academic spending on R&D
has continued to increase, with funding from ARRA being a major source of support since 2009. The federal government has long provided the majority of funding for academic S&E R&D. Other important sources of academic R&D funding are universities and colleges themselves, state and local gov-ernments, businesses, and nonprofit organizations.
Academic R&D expenditures have long been concen-trated within a relatively small number of universities and colleges. For over 20 years, less than 12 schools each year have received about one-fifth of total academic R&D fund-ing, about 20 schools have received close to one-third of this funding, and about 100 have received four-fifths of the total. (The identities of the universities in each group have varied over time.)
For decades, more than half of all academic R&D spend-ing has been in the broad field of life sciences. Since the mid-1990s, about one-third of all U.S.-trained, academically employed S&E doctorate holders received their degree in life sciences (in 2010, over 50% of their foreign-trained counterparts had doctorates in life sciences). The domi-nance of life sciences is also seen in physical infrastructure, where two subfields of life sciences—biological sciences and biomedical sciences—account for the bulk of growth in research space and where the largest share of new univer-sity research construction has been undertaken to advance health and clinical sciences. Life sciences are also heavily featured in academic R&D output: biological sciences and medical sciences accounted for over 50% of U.S. S&E ar-ticles in 2011.
Academic R&D is increasingly collaborative. More ar-ticles are authored by researchers from different university departments, from multiple universities, or from universi-ties in different countries. Similarly, academic collaboration with researchers in other sectors of the U.S. economy—such as federal, state, or local government; business; or FFRDCs—has been increasing. Three-quarters of all U.S. articles, many of them authored by U.S. universities and colleges, now have coauthors from multiple institutions and countries. Collaboration rates between the United States and Canada are higher than would be expected, based on pub-lishing output, thus suggesting the importance of geograph-ic proximity and a common language. Collaboration rates are also relatively high between the United States and Asia
Figure 5-37U.S. university patenting activities: 2002–11Thousands
SOURCE: Association of University Technology Managers (AUTM), AUTM Licensing Surveys: 2002–11. See appendix table 5-64.
Science and Engineering Indicators 2014
2002 2003 2004 2005 2006 2007 2008 2009 2010 20110
5
10
15
20
25
Invention disclosures received
New U.S. patent applications �led
U.S. patents granted

5-58 ♦ Chapter 5. Academic Research and Development
(in particular, China, South Korea, and Taiwan), reflecting, in part, ties formed through large numbers of students from Asian locations having studied for advanced S&E degrees in the United States. In another indicator of growing research collaboration, R&D funds passed through universities to other universities or to non-academic institutions grew more rapidly over the last decade than total academic R&D funding.
Working conditions for S&E doctorate holders within the nation’s universities and colleges as well as access to fed-eral funds for research have undergone changes over the past 20–30 years. Although full-time faculty positions in the pro-fessoriate continue to be the norm in academic employment, S&E doctorate holders are increasingly employed in part-time and nontenured positions. Since 1995, despite an aging academic doctoral workforce, there has been a decrease in the percentage of doctorate holders with tenured positions. The share of academic researchers receiving federal support, including early career S&E faculty, has declined since 1991.
Higher education has also experienced notable changes in demographic diversity. In particular, the share of aca-demic doctoral positions held by white, male, native-born citizens has declined. Women represent a growing share of academic doctoral employment in S&E, as do the foreign born and foreign trained. The share of Asians employed in the S&E academic doctoral workforce has grown dramati-cally over the past three decades, while the shares held by blacks, Hispanics, and American Indians or Alaska Natives have grown much more slowly; these latter groups remain underrepresented in the academic doctoral workforce.
There have been further shifts in the degree to which the academic doctoral workforce is focused on research activi-ties versus teaching. Compared with the early 1990s, there has been an increase in the proportion of the academic doc-toral workforce, including full-time faculty, that reports research as its primary work activity. By contrast, there has been a decline since the early 1990s in the share of the workforce that reports teaching as its primary work activity. Of those in the academic doctoral workforce reporting re-search as their primary activity, two-thirds are employed at the nation’s most research-intensive academic institutions. Those who primarily teach are more evenly dispersed across academia.
The United States has a strong position in the global academic R&D enterprise. With major input from the aca-demic sector, the United States is the largest single-coun-try producer of S&E articles, not far behind the entire EU. The global shares of the United States, the EU, and other developed countries have declined as China has become the world’s third-largest producer of S&E articles over the last decade. However, the United States continues to have a disproportionately high global share of the most-cited S&E articles, indicating that U.S. academic R&D continues to be highly influential for subsequent research around the globe.
Academic R&D increasingly advances marketplace technologies. U.S. universities continue to commercialize their research, as evidenced in the growth in the number
of U.S. patent applications and invention disclosures and in the formation of startup companies. This growing com-mercialization of U.S. science is particularly important in biological sciences, which have spawned new discoveries in pharmaceuticals, chemicals, and biotechnology. In addition, U.S. patents most frequently cite academic-authored articles within all U.S. articles, underscoring the important linkage of academic R&D to invention.
Notes1. The academic R&D totals presented here exclude ex-
penditures at the federally funded research and development centers (FFRDCs) associated with universities. Those ex-penditures are tallied separately and discussed in chapter 4. Nevertheless, the FFRDCs and other national laboratories (including federal intramural laboratories) play an impor-tant role in academic research and education, providing research opportunities for students and faculty at academic institutions, often by providing highly specialized, shared research facilities.
2. For this discussion, the terms universities and col-leges, higher education, and academic institutions are used interchangeably.
3. Gross domestic product implicit price deflators were used to convert current dollars to constant 2005 dollars.
4. From 2005 to 2008, prior to the enactment of the American Recovery and Reinvestment Act of 2009, aca-demic R&D expenditures increased by an annual average rate of 1.5% after adjusting for inflation.
5. For a more complete discussion of these concepts, see the chapter 4 “Glossary.”
6. Starting in 2010, the Higher Education Research and Development Survey asked institutions to categorize their R&D expenditures as either basic research, applied research, or development; prior surveys had asked how much total S&E R&D the institution performed and requested an esti-mate of the percentage of their R&D expenditures devoted to basic research. By only mentioning basic research, the survey question may have caused some respondents to clas-sify a greater proportion of their activities in this category. The 2010 question provided definitions and examples of the three R&D categories to aid institutions in making more ac-curate assignments. In debriefing interviews, institutional representatives cited the changes in the survey question as the most important factor affecting their somewhat lower estimates of the amount of basic research institutions per-formed. The explicit inclusion of clinical trials and research training grants and the addition of non-S&E R&D may also have contributed.
7. Data on non-S&E R&D expenditures have been col-lected by the National Science Foundation since FY 2003. However, the response rates on these items for the years prior to 2006 make trend analysis unreliable.
8. The academic R&D reported here includes separately budgeted R&D and related recovered indirect costs and also

Science and Engineering Indicators 2014 ♦ 5-59
institutional estimates of unrecovered indirect costs associ-ated with externally funded R&D projects, including com-mitted cost sharing. Indirect costs are general expenses that cannot be associated with specific research projects but pay for things that are used collectively by many research proj-ects at an academic institution. Two major components of indirect costs exist: (1) facilities-related costs, such as the construction, maintenance, and operation of facilities used for research; and (2) administrative costs, including expenses associated with financial management, institutional review boards, and environment, health, and safety management. Some indirect costs are recovered as a result of indirect-cost proposals that universities submit based on their actual costs from the previous year. Unrecovered indirect costs are cal-culated as the difference between an institution’s negotiated indirect cost rate on a sponsored project and the amount it re-covers from the sponsor. Committed cost sharing is the sum of the institutional contributions required by the sponsor for specific projects (mandatory cost sharing) and the institu-tional resources made available to a specific project at the discretion of the grantee institution (voluntary cost sharing).
9. The Higher Education Research and Development Survey collects aggregate data not separated by field on universities’ estimates of basic research, applied research, and development.
10. Statistics on R&D performance can differ depend-ing on whether the reporting is by R&D performers—in this case, academic institutions—or R&D funders. Reasons for this difference are discussed in the chapter 4 sidebar, “Tracking R&D: The Gap between Performer- and Source-Reported Expenditures.”
11. Institutionally financed research includes both orga-nized research projects fully supported with internal funding and all other separately accounted-for funds for research. This category does not include funds spent on research that are not separately accounted for, such as estimates of faculty time budgeted for instruction that is spent on research. Funds for institutionally financed R&D may also derive from general-purpose state or local government appropriations; general-purpose awards from industry, foundations, or other outside sources; endowment income; and gifts. Universities may also use income from patents and licenses or revenue from patient care to support R&D. (See this chapter’s sec-tion “Commercialization of U.S. Academic Patents” for a discussion of patent and licensing income.)
12. Federal grants, contracts, and awards from other sources that are passed through state and local governments to academic institutions are credited to the original provider of the funds.
13. The federally financed share of academic S&E R&D expenditures dipped slightly in 2012; in part, this is because universities and colleges spent more American Recovery and Reinvestment Act of 2009 funds in 2011 (about $4.2 billion) than in 2012 (about $2.4 billion).
14. In 1991, the Office of Management and Budget capped reimbursement of administrative costs at 26% of total direct
costs. As a result, actual unrecovered indirect costs at both public and private universities may be somewhat higher than the amounts reported on the Higher Education Research and Development Survey.
15. During the early years of the 2000 decade, survey questions on pass-through funding were voluntary, with rel-atively high nonresponse (11% in 2000 versus 4% in 2009).
16. Research space here is defined as the space used for sponsored R&D activities at academic institutions and for which there is separate budgeting and accounteing. Research space is measured in net assignable square feet (NASF). This is the sum of all areas on all floors of a building assigned to, or available to be assigned to, an occupant for a specific use, such as research or instruction. NASF is measured from the inside faces of walls. Multipurpose space that is partially used for research is prorated to reflect the proportion of time and use devoted to research.
17. The S&E fields used in the National Science Foundation Survey of Science and Engineering Research Facilities are based on the National Center for Education Statistics Classification of Instructional Programs (CIP)—which is updated every 10 years (the current version is dat-ed 2010). The S&E fields used in the FY 2011 Survey of Science and Engineering Research Facilities reflect the 2010 CIP update. Both the FY 2007 and FY 2009 surveys reflect the 2000 CIP standard. For a comparison of the subfields in the FY 2005 and FY 2007 surveys, see the detailed statisti-cal tables for S&E Research Facilities: FY 2007. No major impacts on these data resulted from the CIP 2010 update.
18. The science and technology field and subfield defini-tions were updated to the 2000 Classification of Instructional Programs starting with the FY 2007 Survey of Science and Engineering Research Facilities. Some of the observed de-clines in research space for health and clinical sciences and for physical sciences between FY 2005 and FY 2007 could reflect definition changes.
19. Institutional sources includes an institution’s oper-ating funds, endowments, private donations, tax-exempt bonds and other debt financing, and indirect costs recovered from federal and nonfederal sources.
20. Only projects whose prorated cost was estimated to be $250,000 or more for at least one field of S&E were included.
21. Because of rising capitalization thresholds, the dol-lar threshold for inclusion in the equipment category has changed over time. Generally, university equipment that costs less than $5,000 would be classified under the cost cat-egory of “supplies.”
22. The “bricks and mortar” section of the Survey of Science and Engineering Research Facilities asks institu-tions to report their research space only. Therefore, the re-ported figures do not include space used for other purposes, such as instruction or administration. In the “Computing and Networking Capacity” section of the survey, respondents are asked to identify all of their cyberinfrastructure resources,

5-60 ♦ Chapter 5. Academic Research and Development
regardless of whether these resources were used for research or other functions.
23. Research-performing academic institutions are de-fined as colleges and universities that grant degrees in S&E and expend at least $1 million in R&D funds. Each institution’s R&D expenditures are determined through the National Science Foundation Higher Education Research and Development Survey.
24. Academic institutions provided data on all comput-ing systems with peak theoretical performance of 1 teraflop or faster. This defined the threshold for high-performance computing in the “Computing and Networking Capacity” section of the Survey of Science and Engineering Research Facilities. A teraflop is a measure of computing speed equal to 1 trillion floating point operations per second (FLOPS). FLOPS reflect the number of multiplications that a computer processor can perform within 1 second.
25. These points have been cited as rationales for central-izing cyberinfrastructure and high-performance computing at several institutions (University of Arizona 2013; UCSD 2009; Bose et al. 2010).
26. Clusters use multiple commodity systems, each run-ning its own operating system with a high-performance in-terconnect network to perform as a single system. Massively parallel processors use multiple processors within a single system with a specialized high-performance interconnect network. Each processor uses its own memory and operating system. Symmetric multiprocessors use multiple processors sharing the same memory and operating system to work si-multaneously on individual pieces of a program.
27. Usable storage is the amount of space for data storage that is available for use after the space overhead required by file systems and applicable redundant array of independent disks configurations is removed. Online storage includes all storage providing immediate access for files and data from high-performance computing systems of at least 1 teraflop. Storage can be either locally available or made available via a network.
28. In the discussion covering the age composition of the academic doctoral workforce, comparisons are made between 1995 and 2010 because the Age Discrimination in Employment Act of 1967 applied to the professoriate start-ing in 1994. In the section on federal support of doctoral researchers, comparisons are made between 1973, the very early 1990s, and 2010 because of the availability of rela-tively comparable data for these years. In all discussions of full-time faculty, comparisons are made between 1997 and 2010 because comparable data on senior and junior faculty groupings are available for these years.
29. These other positions included positions at universi-ties and colleges where no tenure system exists and there are various non-tenure-track positions.
30. In addition, individuals ages 70–75 years grew as a share of the total doctoral academic workforce from 1995 to 2010. In 1995, less than 1% of the doctoral academic
workforce was between 70 and 75 years of age; this increased to 2.4% in 2010.
31. Despite these gains, the number of academically em-ployed, U.S.-trained female S&E doctorate holders in 2010 (105,000) was nearly identical to the number of their male counterparts four decades earlier (107,000).
32. Because a larger share of foreign-trained doctorate holders working in U.S. universities and colleges are men (70% in 2010 versus 64% of the U.S.-trained doctorate hold-ers), using the Survey of Doctorate Recipients as a measure of female participation in the doctoral academic workforce results in a slight overcount of women’s presence.
33. For some fields—in particular, life sciences and psychology—the National Survey of College Graduates (NSCG) estimates are somewhat higher than the Survey of Doctorate Recipients (SDR) estimates because SDR em-ploys a more restrictive definition of research doctorate. As a result, some complications exist in comparing NSCG es-timates of foreign-trained S&E doctorate holders with SDR estimates of the U.S.-trained S&E doctorate holders.
34. Analysis of trends in minority and underrepresented minority representation in the U.S.-trained academic doc-toral workforce is complicated by changes in the Survey of Doctorate Recipients question about race and ethnicity starting in 2001. Specifically, since 2001, respondents have been allowed to report more than one race. Because of this change, data from 2001 to 2010 are not directly comparable to earlier years’ data (Milan 2012).
35. Estimates of the percentage of underrepresented mi-norities by gender in the U.S.-trained academic doctoral workforce are based on small samples and are particularly sensitive to sampling error.
36. Asians or Pacific Islanders include Native Hawaiians and Other Pacific Islanders.
37. Some academically employed S&E doctorate holders were older than 75 years of age in 1995 and in 2010, but the Survey of Doctorate Recipients does not report on this because it drops respondents from the survey sample after they have reached 75 years of age. It is generally believed that individuals over age 75 years hold a small but growing share of doctoral academic employment.
38. The Survey of Doctorate Recipients presents respon-dents with a list of work activities and asks them to iden-tify the activities that occupied the most hours and second most hours during their typical work week. This measure was constructed slightly differently prior to 1993, and the data are not strictly comparable across the two periods. Prior to 1993, the survey question asked the respondent to select their primary and secondary work activity from a list of ac-tivities. Beginning in 1993, respondents were given the same list and asked on which activity they spent the most hours and on which they spent the second most hours.
39. University-reported data from the Higher Education Research and Development Survey indicate that approxi-mately 154,000 personnel paid from R&D salaries and

Science and Engineering Indicators 2014 ♦ 5-61
wages were designated as principal investigators in academ-ic FY 2012.
40. A higher share (just under 90%) of the nation’s for-eign-trained academic doctoral personnel classified research as their primary or secondary work activity in 2010.
41. Data on federal support of academic researchers for 1985 and 1993–97 cannot be compared with results for the earlier years or with those from 1999 to 2010 because of changes in the survey question. In 1985, the question fo-cused on 1 month and, from 1993 to 1997, on 1 week. In most other survey years, the reference was to the entire pre-ceding year. Since the volume of academic research activity is not uniform over the entire academic year, a 1-week (or 1-month) reference period seriously understates the number of researchers supported at some time during an entire year.
42. A somewhat larger share of the nation’s foreign-trained academic doctoral personnel working full-time (66%) received federal support in 2010.
43. For more information on the World Bank economic classification of countries, see http://data.worldbank.org/about/country-classifications/country-and-lending-groups.
44. Countries with indexed S&E articles can change their borders over time. Data on Hong Kong, for example, were formerly reported separately but are now included in totals for China. See appendix table 5-24 for a list of the locations represented in the data.
45. Statements that a country “authors” a certain num-ber of articles are somewhat imprecise, especially given the growing rates of international collaboration discussed later in this chapter. See the sidebar “Bibliometric Data and Terminology” for more information on how S&E article production and collaboration are measured.
46. See Eades et al. (2005) for a discussion of recent reforms in Japan’s higher education system. Japan’s R&D expenditures increased by 14% to reach 17.4 trillion yen between 2000 and 2008, according to the Organisation for Economic Co-operation and Development (http://www.oecd.org/sti/inno/researchanddevelopmentstatisticsrds.htm).
47. Publication traditions in broad S&E fields differ somewhat. For example, although all fields publish journal articles, computer scientists often publish their findings in conference proceedings, and social scientists often write books and also publish in journals. Proceedings and books are poorly covered in the data currently used in this chapter.
48. Social science journals tend to focus on local issues, have less international author diversity, and publish in a lan-guage other than English more often than natural sciences journals—all criteria for exclusion from the Thomson Reuters databases. The lower concentration of articles in social sci-ences, other life sciences, and psychology in foreign coun-tries may be partially attributed, then, to journal coverage. For further details on Thomson’s journal selection process, see http://www.thomsonreuters.com/products_services/science/free/essays/journal_selection_process/.
49. The U.S. sector identification in this chapter is quite precise; to date, sector identification has not been possible for other countries.
50. The 16 federally funded research and develop-ment centers (FFRDCs) sponsored by the Department of Energy (DOE) dominated S&E publishing by this sector. Across all fields of S&E, DOE-sponsored labs accounted for 83% of the total for the sector in 2005 (NSB 2008). Scientists and engineers at DOE-sponsored FFRDCs pub-lished 96% of the sector’s articles in chemistry, 95% in physics, and 90% in engineering (see “S&E Articles From Federally Funded Research and Development Centers” [NSB 2008:5-47]). Nine other federal agencies (including the Departments of Defense, Energy, Health and Human Services, Homeland Security, Transportation, and Treasury; the National Aeronautics and Space Administration; the Nuclear Regulatory Commission; and the National Science Foundation) also sponsor another 23 FFRDCs (NSF/SRS 2009).
51. Coauthorship is a broad, though limited, indica-tor of collaboration among scientists. Previous editions of Indicators discussed possible underlying drivers for in-creased collaboration, including scientific advantages of knowledge sharing and instrument sharing, decreased costs of travel and communication, and national policies (NSB 2006). Katz and Martin (1997), Bordons and Gómez (2000), and Laudel (2002) analyze limitations of coauthorship as an indicator of research collaboration. Despite these limitations, other authors have continued to use coauthorship as a col-laboration indicator (Adams et al. 2005; Gómez, Fernández, and Sebastián 1999; Lundberg et al. 2006; Wuchty, Jones, and Uzzi 2007; Zitt, Bassecoulard, and Okubo 2000).
52. Readers are reminded that the number of coauthored articles between any pair of countries is the same; each country is counted once per article in these data. However, countries other than the pairs discussed here may also appear on the article.
53. Finland is included here as one of the Scandinavian countries; Iceland is not.
54. “Influence” is used here broadly; even citations that criticize or correct previous research indicate the influence of that previous research on the citing article.
55. For example, 2012 citation rates are from refer-ences in articles in the 2012 data file to articles contained in the 2008–10 data files of the Thomson Reuters Science Citation Index and Social Sciences Citation Index data-bases. Analysis of the citation data shows that, in general, the 2-year citing lag captures the 3 peak citation years for most fields, with the following exceptions: in astronomy and physics, the peak citation years are generally captured with a 1-year lag; in computer sciences, psychology, and the social sciences, the peak citation years are generally captured with a 3-year lag.

5-62 ♦ Chapter 5. Academic Research and Development
56. Some part of this percentage decrease may reflect the increase in Chinese journals in the Science Citation Index and Social Sciences Citation Index databases used in this chapter. Since more Chinese authors in these journals are available to cite their Chinese coauthors, international cita-tions to Chinese-authored articles are declining as a share of total citations. However, accounting for the “nationality” of a journal is not straightforward, and the data file used by the National Science Foundation (NSF) excludes jour-nals that are primarily of regional interest. NSF’s estimate of “Chinese” journals shows an increase of 75% over the past decade, compared to an increase of 334% for Chinese-authored articles.
57. Because different S&E fields have different citation behaviors, these indicators should be used with caution. For example, articles in life sciences tend to list more ref-erences than, for example, articles in engineering or math-ematics. Thus, a country’s research portfolio that is heavily weighted toward life sciences (e.g., the United States) may receive proportionately more citations than a country whose portfolio is more heavily weighted toward engineering or mathematics.
58. Percentiles are specified percentages below which the remainder of the articles fall. Thus, the 99th percentile identifies the number of citations 99% of the articles failed to receive. Across all fields of science, 99% of articles from 2008 to 2010 failed to receive at least 21 citations in 2012. Matching numbers of citations with a citation percentile is not precise because all articles with a specified number of citations must be counted the same. Therefore, the citation percentiles discussed in this section and used in appendix ta-bles 5-57 and 5-58 have all been counted conservatively, and the identified percentile is in every case higher than specified (i.e., the 99th percentile is always greater than 99%, the 95th percentile is always greater than 95%, and so forth). Actual citations/percentiles per field vary widely because counts were cut off to remain within the identified percentile. For example, using this method of counting, the 75th percentile for engineering contained 2008 to 2010 articles with 3–4 ci-tations from 2012 articles, whereas the 75th percentile for astronomy contained articles with 6–10 citations. A country whose research influence was high would have greater pro-portions of articles in the higher-citation percentiles, where-as a country whose influence was low would have greater proportions of articles in lower-citation percentiles.
59. Patent citations to S&E research discussed in this sec-tion are limited to the citations found on the cover pages of successful patent applications. These citations are entered by the patent examiner and may or may not reflect citations given by the applicant in the body of the application. Patent cover pages also contain references to scientific and techni-cal materials not contained in the article data used in this chapter (e.g., other patents, conference proceedings, indus-try standards). Analyses of the data referred to in this sec-tion found that nonjournal references on patent cover pages accounted for 19% of total references in 2008. The journals/articles in the Science Citation Index and Social Sciences Citation Index databases used in this chapter—a set of rela-tively high-impact journals—accounted for 83% of the jour-nal references, or 67% of the total science references, on the patent covers.
60. In this discussion, patent data are patents granted by the U.S. Patent and Trademark Office to all assignees, not just U.S. assignees. S&E publication data are for all publica-tions in all U.S. sectors and for all country authors.
61. Patent-based data must be interpreted with caution. Year-to-year changes in the data may reflect changes in U.S. Patent and Trademark Office processing times (so-called “patent pendency” rates) and attempts to reduce the back-log of patent applications that build up from time to time. Likewise, industries and companies have different tactics and strategies for pursuing patents and otherwise protecting intellectual property, and these also may change over time.
62. The institutions listed in appendix table 5-62 are slightly different from those listed in past volumes, and data for individual institutions may be different. In appendix ta-ble 5-62, an institution is credited with a patent even if it is not the first assignee, and therefore some patents may be double counted. Several university systems are counted as one institution, and medical schools may be counted with their home institution. Universities also vary in how they as-sign patents (e.g., to boards of regents, individual campuses, or entities with or without affiliation with the university).
63. Other than for general trends, the patent counts re-ported by Association of University Technology Managers respondents in figure 5-37 and appendix table 5-64 cannot be compared with the patent counts developed from U.S. Patent and Trademark Office data as in appendix tables 5-62 and 5-63.

Science and Engineering Indicators 2014 ♦ 5-63
GlossaryDoctoral academic S&E workforce: Includes those
with a research doctorate in science, engineering, or health who are employed in 2- or 4-year colleges or universities, including medical schools and university research institutes, in the following positions: full and associate professors (re-ferred to as senior faculty); assistant professors (referred to as junior faculty); postdoctorates (postdocs); other full-time positions, such as instructors, lecturers, adjunct faculty, re-search associates, and administrators; and part-time posi-tions of all kinds.
European Union (EU): As of June 2013, the EU com-prised 27 member nations: Austria, Belgium, Bulgaria, Cyprus, Czech Republic, Denmark, Estonia, Finland, France, Germany, Greece, Hungary, Ireland, Italy, Latvia, Lithuania, Luxembourg, Malta, the Netherlands, Poland, Portugal, Romania, Slovakia, Slovenia, Spain, Sweden, and the United Kingdom. Croatia joined the EU in July 2013. Unless otherwise noted, Organisation for Economic Co-operation and Development data on the EU include all 28 members; data on the EU from other sources are limited to the 27 nations that were members as of June 2013.
Federally funded research and development center (FFRDC): R&D organization exclusively or substantially financed by the federal government, either to meet particu-lar R&D objectives or, in some instances, to provide major facilities at universities for research and associated training purposes. Each FFRDC is administered either by an indus-trial firm, a university, or a nonprofit institution.
File year: Year in which an S&E article entered Thomson Reuters’ S&E publication database, which may be later than the year in which the S&E article was published.
Fractional counting: Method of counting S&E pub-lications in which credit for coauthored articles is divided among the collaborating institutions or countries based on the proportion of their participating departments or institu-tions. For example, the United States and China would each be credited half of a count for an article with a U.S. coauthor and a Chinese coauthor.
Index of highly cited articles: A country’s share of the top 1% most-cited S&E articles divided by the country’s share of all cited S&E articles. An index greater than 1 means that a country has a disproportionately higher share in highly cited articles; an index less than 1 means the opposite.
Index of international collaboration: A country’s share of another country’s internationally coauthored articles divided by the other country’s share of all internationally coauthored articles. An index greater than 1 means that a country pair has a stronger-than-expected tendency to col-laborate; an index less than 1 means the opposite.
Net assignable square feet (NASF): Unit for measuring research space. NASF is the sum of all areas on all floors of a building assigned to, or available to be assigned to, an occupant for a specific use, such as research or instruction. NASF is measured from the inside face of walls.
Relative citation index: A country’s share of another country’s cited S&E articles divided by the other country’s share of all cited S&E articles. An index of greater than 1 means that the country has a higher-than-expected tendency to cite the other country’s S&E literature; an index less than 1 means the opposite.
Research space: The budgeted and accounted for space used for sponsored R&D activities at academic institutions. Research space is the net assignable square feet of space in buildings within which research activities take place. Research facilities are located within buildings. A building is a roofed structure for permanent or temporary shelter of persons, animals, plants, materials, or equipment. Structures are included as research space if they are (1) attached to a foundation; (2) roofed; (3) serviced by a utility, exclusive of lighting; and (4) a source of significant maintenance and repair activities.
Underrepresented minority: Demographic category in-cluding blacks, Hispanics, and American Indians or Alaska Natives, groups considered to be underrepresented in aca-demic institutions.
Whole counting: Method of counting S&E publications in which each institution or country receives one credit for its participation in the article. Whole counting is used for coauthorship data. For example, the United States and China would each be credited one count for an article with a U.S. and Chinese coauthor.
ReferencesAdams J, Black G, Clemmons R, Stephan P. 2005. Scientific
teams and institutional collaborations: Evidence from U.S. universities, 1981–1999. Research Policy 34:259–85.
American Association of University Professors (AAUP). 2010. Trends in Faculty Status, 1975–2007.
Association of University Technology Managers (AUTM). 2009. AUTM Licensing Activity Survey Full Report, FY 2007. Tieckelmann R, Kordal R, Flanigan S, Glavicic-Théberge T, Bostrom D, editors. http://www.autm.net/AM/Template.cfm?Section=Licensing_Surveys_AUTM. Accessed 18 May 2009.
Auriol, L. 2010. Careers of Doctorate Holders: Employment and Mobility Patterns. STI Working Paper 2010/4. Paris: Organisation for Economic Co-operation and Development.
Bordons M, Gómez I. 2000. Collaboration networks in science. In Cronin B, Atkins HB, editors. The Web of Knowledge: A Festschrift in Honor of Eugene Garfield, pp. 197–213. Medford, NJ: Information Today, Inc.
Bose R, Crosswell A, Hamilton V, Mesa N. 2010. Piloting Sustainable HPC for Research at Columbia. Position paper for the Workshop on Sustainable Funding and Business Models for Academic Cyberinfrastructure (CI) Facilities. Ithaca, NY: Cornell University.

5-64 ♦ Chapter 5. Academic Research and Development
Britt, R. 2010. Universities Report $55 Billion in Science and Engineering R&D Spending for FY 2009; Redesigned Survey to Launch in 2010. InfoBrief NSF 10-329. Arlington, VA: National Science Foundation, Division of Science Resources Statistics. Available at http://www.nsf.gov/statistics/infbrief/nsf10329/.
Committee on Science, Engineering, and Public Policy (COSEPUP). 2000. Enhancing the Postdoctoral Experience for Scientists and Engineers. Washington, DC: National Academies Press. http://books.nap.edu/cat-alog.php?record.id=9831#toc. Accessed 15 May 2011.
Cummings J, Kiesler S. 2007. Coordination costs and proj-ect outcomes in multi-university collaborations. Research Policy 36:1620–34.
Eades JJ, Goodman R, Hada Y, editors. 2005. The ‘Big Bang’ in Japanese Higher Education: The 2004 Reforms and the Dynamics of Change. Victoria, Australia: Trans Pacific Press.
Geuna A, Rossi F. (2011). Changes to university IPR regu-lations in Europe and the impact on academic patenting. Research Policy 40(8):1068–76.
Glänzel W, Schubert A. 2005. Domesticity and interna-tionality in co-authorship, references and citations. Scientometrics 65(3):323–42.
Gómez I, Fernández MT, Sebastián J. 1999. Analysis of the structure of international scientific cooperation net-works through bibliometric indicators. Scientometrics 44(3):441–57.
Hale K. 2012. Collaboration in Academic R&D: A Decade of Growth in Pass-Through Funding. InfoBrief NSF 12-325. Arlington, VA: National Science Foundation, National Center for Science and Engineering Statistics. Available at http://www.nsf.gov/statistics/infbrief/nsf12325/.
Katz J, Martin B. 1997. What is research collaboration? Research Policy 26:1–18.
Laudel G. 2002. Collaboration and reward. What do we mea-sure by co-authorships? Research Evaluation 11(1):3–15.
Lundberg J, Tomson G, Lundkvist I, Skår J, Brommels M. 2006. Collaboration uncovered: Exploring the adequacy of measuring university-industry collaboration through co-authorship and funding. Scientometrics 69(3):575–89.
Milan L. 2012. Racial and Ethnic Diversity among U.S.-Educated Science, Engineering, and Health Doctorate Recipients: Methods of Reporting Diversity. InfoBrief NSF 12-304. Arlington, VA: National Science Foundation, National Center for Science and Engineering Statistics. Available at http://www.nsf.gov/statistics/infbrief/nsf12304/.
Narin F, Hamilton K, Olivastro D. 1997. The increasing linkage between U.S. technology and public science. Research Policy 26:317–30.
Narin F, Stevens K, Whitlow E. 1991. Scientific co-oper-ation in Europe and the citation of multinationally au-thored papers. Scientometrics 21(3):313–23.
National Research Council (NRC). 2012. Research Universities and the Future of America: Ten Breakthrough Actions Vital to Our Nation’s Prosperity and Security. Washington, DC: National Academies Press.
National Science Board (NSB). 2006. Science and Engineering Indicators 2006. Vol. 1. NSB 06-01. Vol. 2. NSB 08-01A. Arlington, VA: National Science Foundation. Available at http://www.nsf.gov/statistics/seind06/.
National Science Board (NSB). 2008. Science and Engineering Indicators 2008. Vol. 1. NSB 06-01. Vol. 2. NSB 08-01A. Arlington, VA: National Science Foundation. Available at http://www.nsf.gov/statistics/seind08/.
National Science Board (NSB). 2010. Science and Engineering Indicators 2010. NSB 10-01. Arlington, VA: National Science Foundation. Available at http://nsf.gov/statistics/seind10/.
National Science Foundation (NSF). 2012. Cyberinfrastructure for 21st Century Science and Engineering, Advanced Computing Infrastructure: Vision and Strategic Plan. NSF 12-051. Available at http://www.nsf.gov/pubs/2012/nsf12051/nsf12051.pdf.
National Science Foundation, Division of Science Resources Statistics (NSF/SRS). 2009. Federally Funded R&D Centers. Master Government List. http://www.nsf.gov/statistics/ffrdc. Accessed 14 August 2009.
Porter AL, Rafols I. 2009. Is science becoming more inter-disciplinary? Measuring and mapping six research fields over time. Scientometrics 81(3):719–45.
Price DJ de Solla. 1969. Measuring the size of science. Proceedings of the Israel Academy of Science and Humanities 6:10–1.
Stephan PE, Levin, SG. 2003. Foreign scholars in U.S. sci-ence: Contributions and costs. Paper presented at Cornell Higher Education Research Institute conference Science and the University, 20–21 May, Ithaca, NY.
Thursby J, Jensen R, Thursby M. 2001. Objectives, char-acteristics and outcomes of university licensing: A sur-vey of major U.S. universities. Journal of Technology Transfer 26:59–72.
University of Arizona, University Information Technology Services. 2013. Program Benefits to Researchers and Campus. Available at http://rc.arizona.edu/node/117.
University of California, San Diego (UCSD), UCSD Research Cyberinfrastructure Design Team. 2009. Blueprint for the Digital University: UCSD Research Cyberinfrastructure. Available at http://rci.ucsd.edu/_files/Blueprint.pdf.
Wuchty S, Jones B, Uzzi B. 2007. The increasing domi-nance of teams in production of knowledge. Science 316:1036–9.
Zitt M, Bassecoulard E, Okubo Y. 2000. Shadows of the past in international collaboration: Collaboration pro-files of the top five producers of science. Scientometrics 47(3):627–57.

Errata
The following errors were discovered after publication of the print and PDF versions of Science
and Engineering Indicators 2014. These errors have been corrected in the online version of the volume.
Updated 21 April 2014
Science and Engineering Indicators 2014
Chapter 5
Appendix table 5-18. Data reported in thousands for universities and colleges in 1995–2010 were incorrect. This table has been replaced with a corrected version. Percentage distributions were not affected.