PLANTING FOR THE FUTURE: FINANCIALLY SUSTAINABLE ... · PLANTING FOR THE FUTURE: FINANCIALLY...
81
PROJECT DESCRIPTION: VCS Version 3 v3.1 1 PLANTING FOR THE FUTURE: FINANCIALLY SUSTAINABLE AGROFORESTRY SYSTEMS AND PAYMENTS FOR ECOSYSTEM SERVICES Document Prepared by Plant your Future www.plantyourfuture.org.uk Project Title Planting for the Future: Financially sustainable agroforestry systems and payments for ecosystem services Version Version 1 Date of Issue 18 th June 2014 Prepared By Plant your Future Contact Jenny Henman, 33a Wadeson Street, London, E2 9DR +44 (0) 7828 608711 [email protected]. www.plantyourfuture.org.uk We would like to express our gratitude to the Ministry of External Affairs of the Finnish Government, as well as the Inter-American Institute for Cooperation on Agriculture (IICA) through their “Programa de Manejo Forestal Sostenible en la Región Andina” (MFS) for their financial contribution and support for the development of this document.
Transcript of PLANTING FOR THE FUTURE: FINANCIALLY SUSTAINABLE ... · PLANTING FOR THE FUTURE: FINANCIALLY...
PROJECT DESCRIPTION: VCS Version 3
v3.1 1
PLANTING FOR THE FUTURE: FINANCIALLY SUSTAINABLE AGROFORESTRY SYSTEMS AND
PAYMENTS FOR ECOSYSTEM SERVICES
Document Prepared by Plant your Future
www.plantyourfuture.org.uk
Project Title Planting for the Future: Financially sustainable agroforestry systems and payments for ecosystem services
Version Version 1
Date of Issue 18th June 2014
Prepared By Plant your Future
Contact Jenny Henman, 33a Wadeson Street, London, E2 9DR +44 (0) 7828 608711
[email protected]. www.plantyourfuture.org.uk
We would like to express our gratitude to the Ministry of External Affairs of the Finnish Government, as well as the Inter-American Institute for Cooperation on Agriculture (IICA) through their “Programa de Manejo Forestal Sostenible en la Región Andina” (MFS) for their financial contribution and support for the development of this document.
PROJECT DESCRIPTION: VCS Version 3
v3.1 2
Table of Contents
Project Details ................................................................................................................................. 31.1 Summary Description of the Project .................................................................................. 31.2 Sectoral Scope and Project Type ....................................................................................... 51.3 Project Proponent ............................................................................................................... 51.4 Other Entities Involved in the Project ................................................................................ 51.5 Project Start Date ............................................................................................................... 61.6 Project Crediting Period ..................................................................................................... 61.7 Project Scale and Estimated GHG Emission Reductions or Removals ............................. 61.8 Description of the Project Activity .................................................................................... 71.9 Project Location ............................................................................................................... 141.10 Conditions Prior to Project Initiation ............................................................................. 191.11 Compliance with Laws, Statutes and Other Regulatory Frameworks ........................... 241.12 Ownership and Other Programs ..................................................................................... 24
1.12.1 Right of Use ............................................................................................................ 241.12.2 Emissions Trading Programs and Other Binding Limits ........................................ 251.12.3 Participation under Other GHG Programs .............................................................. 251.12.4 Other Forms of Environmental Credit .................................................................... 261.12.5 Projects Rejected by Other GHG Programs ............................................................ 26
1.13 Additional Information Relevant to the Project ............................................................. 262 Application of Methodology ................................................................................................... 28
2.1 Title and Reference of Methodology ............................................................................... 282.2 Applicability of Methodology.......................................................................................... 282.3 Project Boundary ............................................................................................................. 302.4 Baseline Scenario ............................................................................................................. 312.5 Additionality .................................................................................................................... 342.6 Methodology Deviations .................................................................................................. 48
3 Quantification of GHG Emission Reductions and Removals ................................................. 483.1 Baseline Emissions .......................................................................................................... 483.2 Project Emissions ............................................................................................................. 553.3 Leakage ............................................................................................................................ 553.4 Summary of GHG Emission Reductions and Removals ................................................. 56
4 Monitoring .............................................................................................................................. 634.1 Data and Parameters Available at Validation .................................................................. 634.2 Data and Parameters Monitored ....................................................................................... 674.3 Description of the Monitoring Plan ................................................................................. 73
5 Environmental Impact ............................................................................................................. 756 Stakeholder Comments ........................................................................................................... 77
PROJECT DESCRIPTION: VCS Version 3
v3.1 3
PROJECT DETAILS
1.1 Summary Description of the Project
Deforestation of 7.9 million hectares was recorded in Peru from 2000-2009 (MINAM1). This has caused substantial biodiversity loss, has contributed to climate change, and perpetuated poverty amongst local communities. Unsustainable smallholder agriculture is the principle driver of this deforestation in Peru. Our project aims to address the problem of unsustainable smallholder agriculture by developing a viable and sustainable long-term future for Peruvian farmers. This VCS Grouped Project sets out to create a model for smallholder farmers in Peru, who have deforested their land, to be able to access carbon finance to help them restore and reforest their land. The VCS Grouped project is designed to be applicable to smallholder farmers across Peru who have degraded their smallholding through two baseline scenarios: ‘slash and burn’ shifting cultivation agriculture or ranching resulting in degraded pastures. The project will reforest deforested areas with financially sustainable agroforestry systems using native species; this will help farmers improve livelihoods whilst simultaneously protecting biodiversity and achieving low carbon development. Our project will work with Peruvian farmers who have been driven to deforest their land through unsustainable shifting cultivation agriculture or ranching because of a lack of viable alternatives. We aim to address this problem, and develop sustainable agroforestry systems, which will not only restore ecosystem function, but will improve their livelihoods. We are focusing on reforestation systems designed with a long-term outlook which is attractive to farmers because of their multiple revenues streams. A core element of the strategy is developing and implementing a business plan to commercialize tropical fruits grown on trees in our agroforestry systems and develop a marketing strategy to add value to these fruits. This, coupled with a sustainable timber harvesting plan, and the income from the sale of carbon offsets, offers an attractive and viable alternative to their existing practises.
1 MINISTERIO DEL AMBIENTE (MINAM), 2011, El Perú de los Bosques,
http://cdam.minam.gob.pe/novedades/elperudelosbosques2011.pdf
PROJECT DESCRIPTION: VCS Version 3
v3.1 4
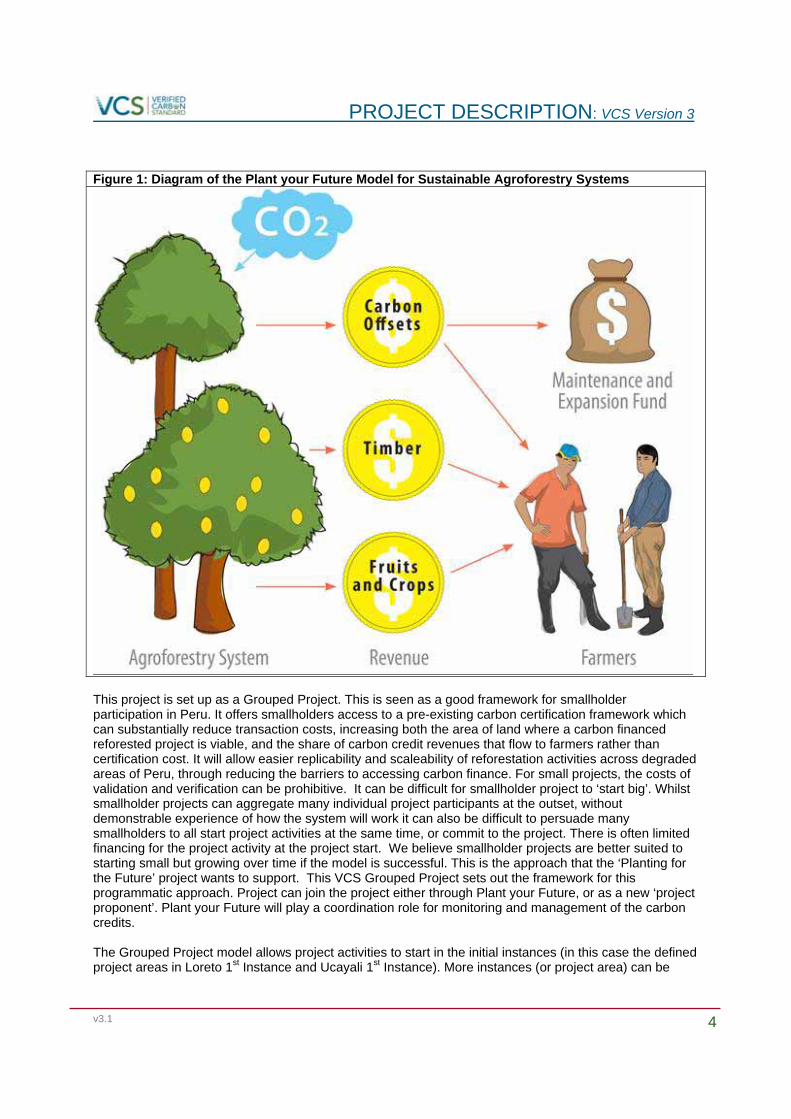
Figure 1: Diagram of the Plant your Future Model for Sustainable Agroforestry Systems
This project is set up as a Grouped Project. This is seen as a good framework for smallholder participation in Peru. It offers smallholders access to a pre-existing carbon certification framework which can substantially reduce transaction costs, increasing both the area of land where a carbon financed reforested project is viable, and the share of carbon credit revenues that flow to farmers rather than certification cost. It will allow easier replicability and scaleability of reforestation activities across degraded areas of Peru, through reducing the barriers to accessing carbon finance. For small projects, the costs of validation and verification can be prohibitive. It can be difficult for smallholder project to ‘start big’. Whilst smallholder projects can aggregate many individual project participants at the outset, without demonstrable experience of how the system will work it can also be difficult to persuade many smallholders to all start project activities at the same time, or commit to the project. There is often limited financing for the project activity at the project start. We believe smallholder projects are better suited to starting small but growing over time if the model is successful. This is the approach that the ‘Planting for the Future’ project wants to support. This VCS Grouped Project sets out the framework for this programmatic approach. Project can join the project either through Plant your Future, or as a new ‘project proponent’. Plant your Future will play a coordination role for monitoring and management of the carbon credits. The Grouped Project model allows project activities to start in the initial instances (in this case the defined project areas in Loreto 1st Instance and Ucayali 1st Instance). More instances (or project area) can be
PROJECT DESCRIPTION: VCS Version 3
v3.1 5
added in over time as long as they are located in the geographical area, and meet the eligibility criteria defined herein. Project monitoring is done through one central information system, and the Project Crediting Period starts on the date the first (installed) system begins reducing GHG emissions. New reforestation systems installed after the initial validation only earn credits for the remainder of the Project Crediting Period, and will have their eligibility reviewed at the forthcoming schedule verification. Plant your Future will remain responsible for monitoring oversight, and the compilation and review of monitoring report, as well as for the management of the VCU’s and the distribution of revenues. Plant your Future has defined as inclusive a Geographical Area as possible, to allow maximum opportunity for smallholder participation across Peru. Much of the eligible geographic area defined in this project description, where project activities can take place, are located in important internationally recognised biodiversity hotspots or ecoregions, including the mega-biodiverse humid tropical forests in the Peruvian Amazon and the tropical dry forests of Northern Peru. Across the geographic region habitat loss from unsustainable agricultural expansion by smallholder farmers has lead to species loss and degradation of the natural environment. Our project aims to restore forest cover in degraded areas, as well as reduce deforestation pressure through the promotion of sustainable tree-based ‘agroforestry’ systems. This project description describes two initial project instances – one which corresponds to smallholding land in the ‘slash and burn’ shifting cultivation baseline scenario and, is 19.64 hectares in total and is located in Loreto. The other instance is located in Ucayali, corresponds to landholding land in the ‘degraded pasture’ baseline scenario and is 5.57 hectare in total.
1.2 Sectoral Scope and Project Type
Sectoral Scope: AFOLU
Activity Type: Afforestation, Reforestation and Restoration (ARR).
The project is a grouped project.
1.3 Project Proponent
The project proponent is Plant your Future. Plant your Future is a registered charity in England and Wales No. 1134720
Contact: Jenny Henman, 33a Wadeson Street, London. E2 9DR. [email protected] Phone: +44 (0) 7828 608711
Role/responsibility: Plant your Future (PyF) has developed this Grouped Project PD. PyF is responsible for the carbon certification of the project as well as the overall management of the project, and is responsible for the implementation and monitoring of project activities in the project instances described in this PD.
1.4 Other Entities Involved in the Project
Associacion Civil Planta tu Futuro: Peruvian registered civil association with the same mission as Plant your Future. Planta tu Futuro will manage the commercialisation of the carbon credits and the fund. It will be responsible for the distribution of revenues to farmers.

PROJECT DESCRIPTION: VCS Version 3
v3.1 6
ProNaturaleza: Fundación Peruana Para La Conservacion de la Naturaleza: Peruvian conservation NGO established in 1984 with offices across Peru including in the city of Iquitos at a close proximity to the Loreto project instance. ProNaturaleza has been responsible for the technical supervision of the installation of the 20.2 hectares of agroforestry systems in Loreto. Their roles has included the setting up of nurseries, procurement of seedlings and planting out in the field during 2012 and 2013. Bosques Amazonicos (BAM): Peruvian private company established in 2004 working in reforestation and forest conservation in the Amazon Provinces of Peru. Assisting with technical supervision for the installation of the agroforestry systems, and provider of baseline information for the degraded pasture baseline.
1.5 Project Start Date
January 16th 2012 – this corresponds to the first day that trees were planted out in Loreto
1.6 Project Crediting Period
The crediting period will run for 30 years from January 16th 2012 until January15th 2042
1.7 Project Scale and Estimated GHG Emission Reductions or Removals
Project x
Large project
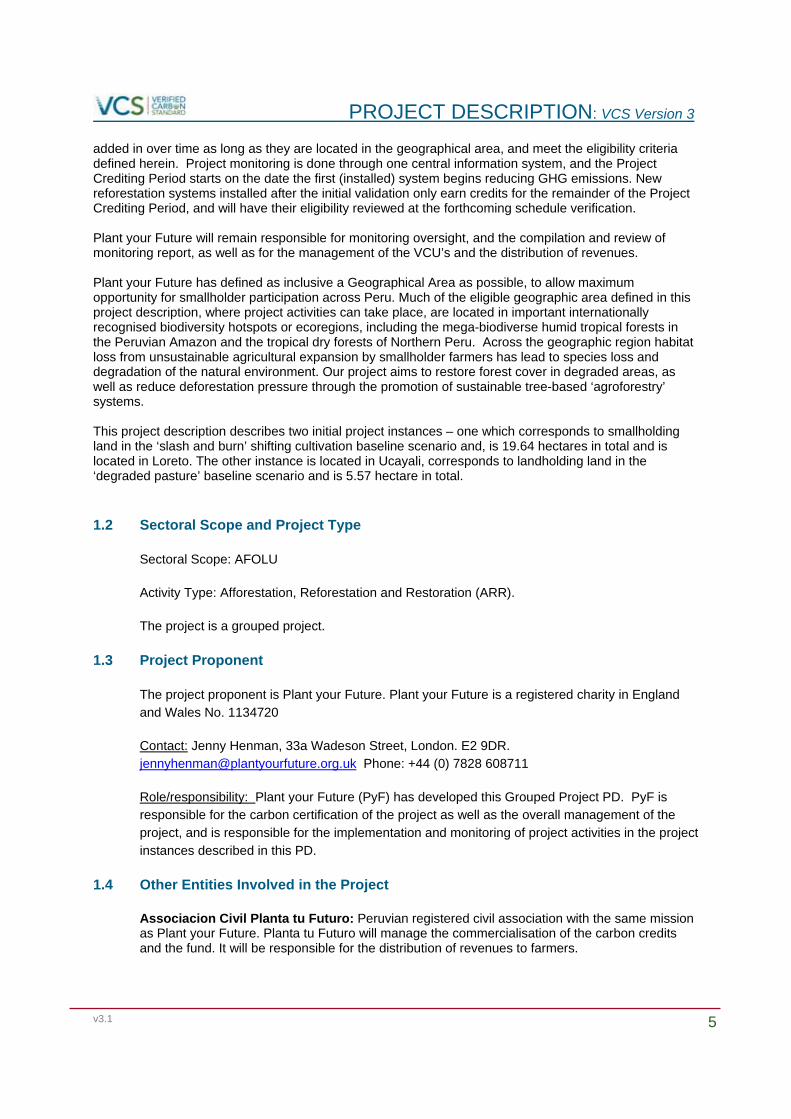
Table 1: Estimated GHG emission reductions or removals (tCO2e) from the first project instances
Year
Estimated GHG emission reductions or removals (tCO2e)
2012 -309.192013 -1,480.392014 -1,494.572015 -1,437.622016 -1,377.342017 -1,304.902018 -1,176.372019 -853.302020 -249.592021 638.452022 1,797.492023 3,047.702024 4,597.882025 6,360.762026 8,117.902027 9,629.03
PROJECT DESCRIPTION: VCS Version 3
v3.1 7
2028 11,267.552029 12,936.572030 14,506.332031 15,957.532032 17,094.522033 17,567.302034 18,332.142035 19,221.642036 20,004.382037 20,460.182038 20,177.552039 20,358.122040 20,777.752041 21,139.51
Total estimated ERs 21,139.51Total number of crediting years 30 yearsAverage annual ERs 9,143.57
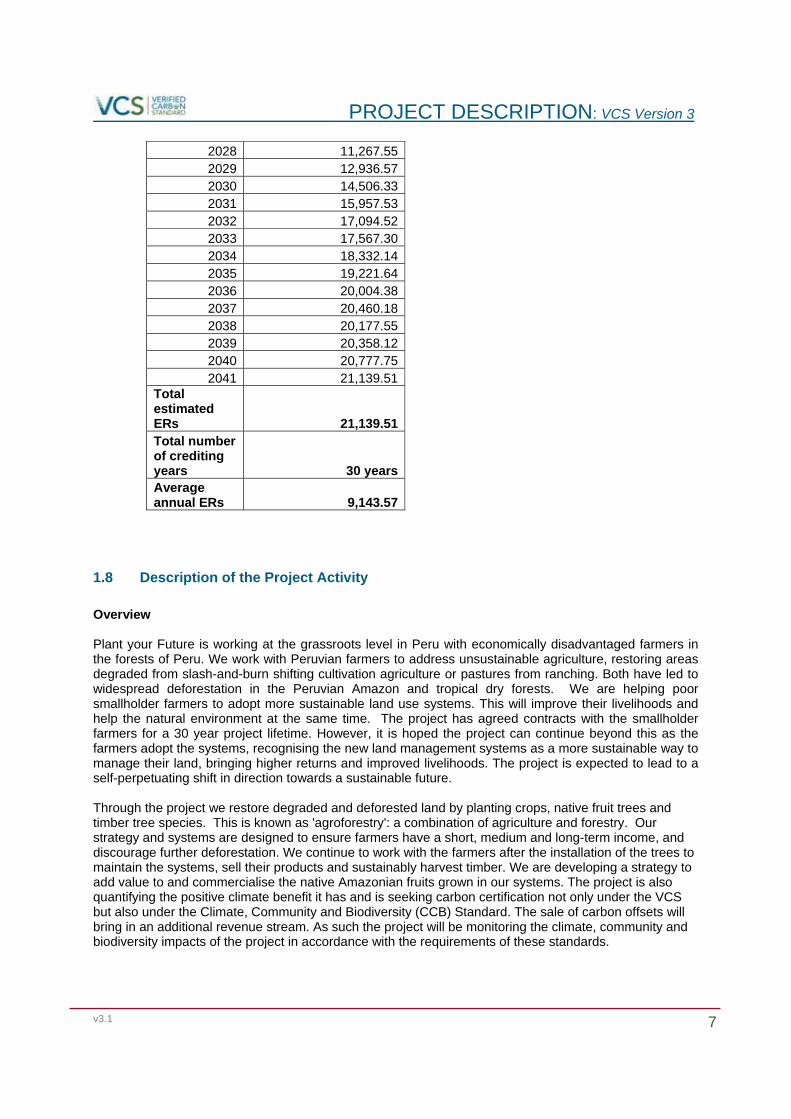
1.8 Description of the Project Activity
Overview Plant your Future is working at the grassroots level in Peru with economically disadvantaged farmers in the forests of Peru. We work with Peruvian farmers to address unsustainable agriculture, restoring areas degraded from slash-and-burn shifting cultivation agriculture or pastures from ranching. Both have led to widespread deforestation in the Peruvian Amazon and tropical dry forests. We are helping poor smallholder farmers to adopt more sustainable land use systems. This will improve their livelihoods and help the natural environment at the same time. The project has agreed contracts with the smallholder farmers for a 30 year project lifetime. However, it is hoped the project can continue beyond this as the farmers adopt the systems, recognising the new land management systems as a more sustainable way to manage their land, bringing higher returns and improved livelihoods. The project is expected to lead to a self-perpetuating shift in direction towards a sustainable future. Through the project we restore degraded and deforested land by planting crops, native fruit trees and timber tree species. This is known as 'agroforestry': a combination of agriculture and forestry. Our strategy and systems are designed to ensure farmers have a short, medium and long-term income, and discourage further deforestation. We continue to work with the farmers after the installation of the trees to maintain the systems, sell their products and sustainably harvest timber. We are developing a strategy to add value to and commercialise the native Amazonian fruits grown in our systems. The project is also quantifying the positive climate benefit it has and is seeking carbon certification not only under the VCS but also under the Climate, Community and Biodiversity (CCB) Standard. The sale of carbon offsets will bring in an additional revenue stream. As such the project will be monitoring the climate, community and biodiversity impacts of the project in accordance with the requirements of these standards.

PROJECT DESCRIPTION: VCS Version 3
v3.1 8
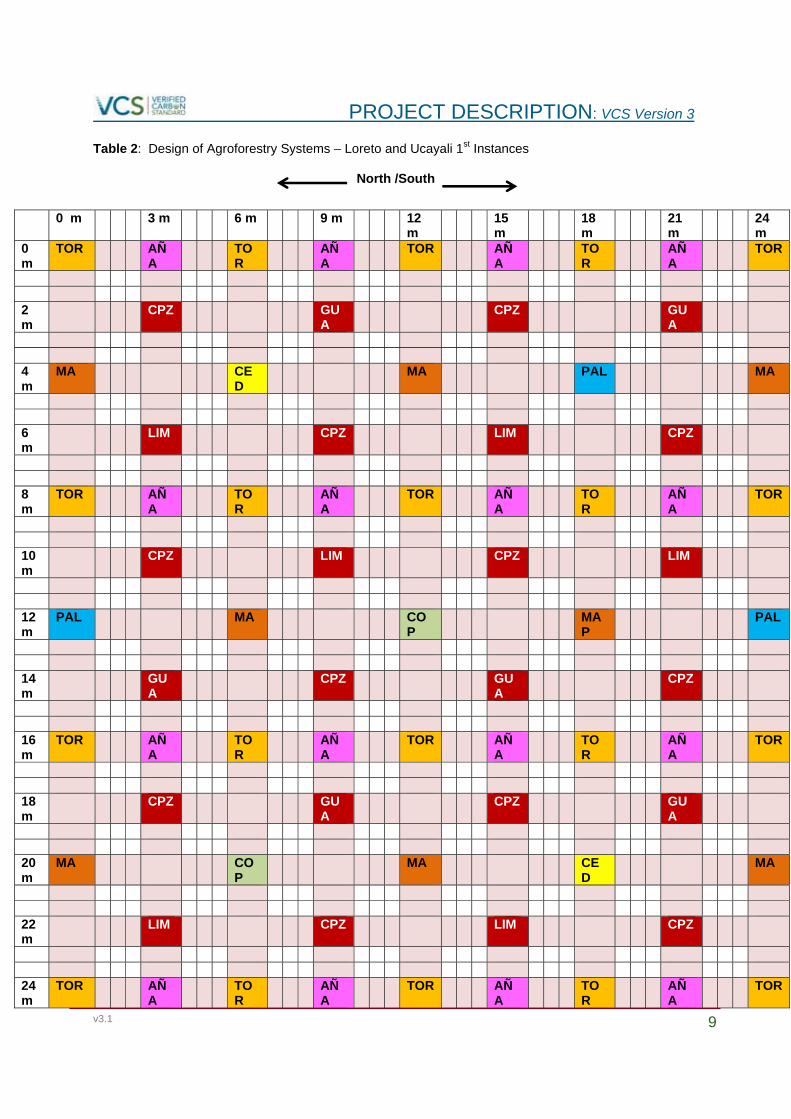
Plantation ModelWe present here an overview of the plantation model for the agroforestry systems we will plant in the Loreto and Ucayali 1st project instances. Species and density of planting will be subject to small variations between land parcels, but follow this general design. It should be noted that the planting model of new project instances will vary depending on the preferences of the smallholder farmers, the project proponent, the ecological conditions and the market conditions. Planting models in new instances could include similar agroforestry models as presented below, but also models with pure timber or pure fruit tree stands. The importance of other crops which are intercropped with the trees may and can also vary in new instances. New project instances will be responsible for clearly documenting their plantation model as well as presenting an ex-ante growth model in accordance with the methods described in this PD and following the approved methodology. The plantation model presented below is for clayey and sandy soils in the Loreto and Ucayali 1st instances. However, for sandy soils the species Añallucaspi (Cordia bicolor/allidora) will be replaced by Capirona (Calycophyllum spruceanum), maintaining the same quantify and spacing.
PROJECT DESCRIPTION: VCS Version 3
v3.1 9
Table 2: Design of Agroforestry Systems – Loreto and Ucayali 1st Instances
North /South
0 m 3 m 6 m 9 m 12 m
15 m
18 m
21 m
24 m
0 m
TOR AÑA
TOR
AÑA
TOR AÑA
TOR
AÑA
TOR
2 m
CPZ GUA
CPZ GUA
4 m
MA CED
MA PAL MA
6 m
LIM CPZ LIM CPZ
8 m
TOR AÑA
TOR
AÑA
TOR AÑA
TOR
AÑA
TOR
10 m
CPZ LIM CPZ LIM
12 m
PAL MA COP
MAP
PAL
14 m
GUA
CPZ GUA
CPZ
16 m
TOR AÑA
TOR
AÑA
TOR AÑA
TOR
AÑA
TOR
18 m
CPZ GUA
CPZ GUA
20 m
MA COP
MA CED
MA
22 m
LIM CPZ LIM CPZ
24 m
TOR AÑA
TOR
AÑA
TOR AÑA
TOR
AÑA
TOR
PROJECT DESCRIPTION: VCS Version 3
v3.1 10
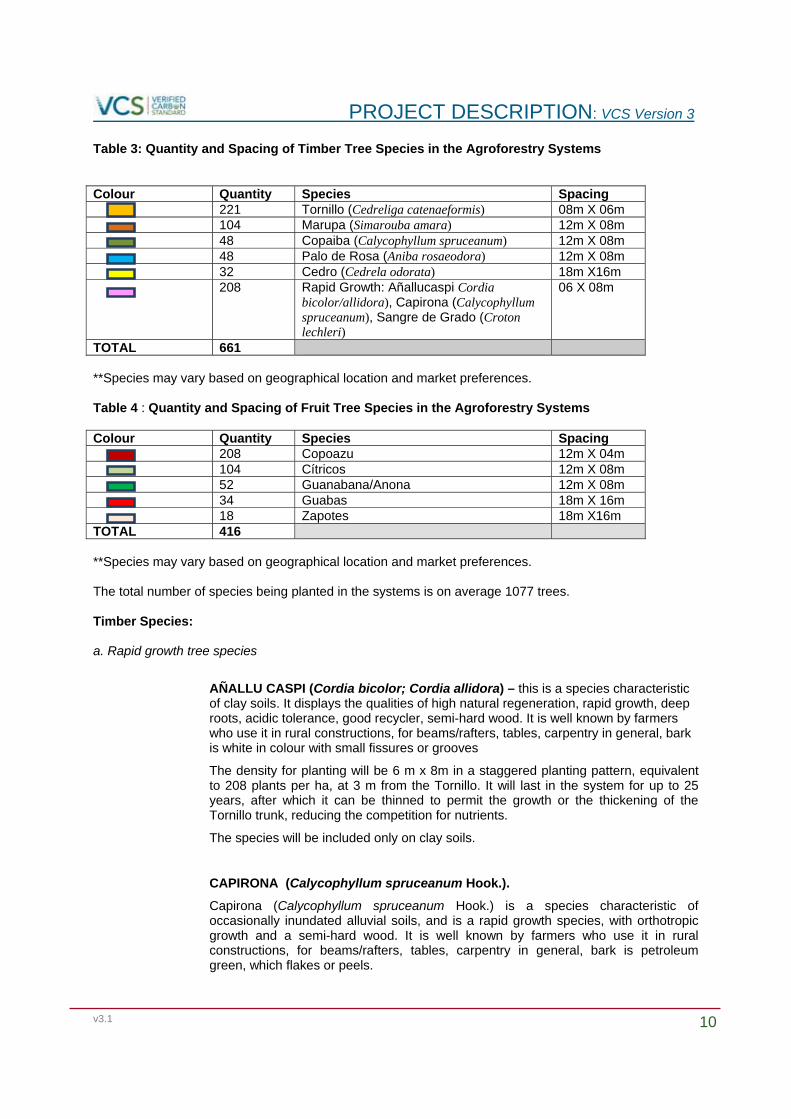
Table 3: Quantity and Spacing of Timber Tree Species in the Agroforestry Systems
Colour Quantity Species Spacing 221 Tornillo (Cedreliga catenaeformis) 08m X 06m 104 Marupa (Simarouba amara) 12m X 08m 48 Copaiba (Calycophyllum spruceanum) 12m X 08m 48 Palo de Rosa (Aniba rosaeodora) 12m X 08m 32 Cedro (Cedrela odorata) 18m X16m 208 Rapid Growth: Añallucaspi Cordia
bicolor/allidora), Capirona (Calycophyllum spruceanum), Sangre de Grado (Croton lechleri)
06 X 08m
TOTAL 661 **Species may vary based on geographical location and market preferences. Table 4 : Quantity and Spacing of Fruit Tree Species in the Agroforestry Systems
Colour Quantity Species Spacing 208 Copoazu 12m X 04m 104 Cítricos 12m X 08m 52 Guanabana/Anona 12m X 08m 34 Guabas 18m X 16m 18 Zapotes 18m X16m TOTAL 416 **Species may vary based on geographical location and market preferences. The total number of species being planted in the systems is on average 1077 trees. Timber Species: a. Rapid growth tree species
AÑALLU CASPI (Cordia bicolor; Cordia allidora) – this is a species characteristic of clay soils. It displays the qualities of high natural regeneration, rapid growth, deep roots, acidic tolerance, good recycler, semi-hard wood. It is well known by farmers who use it in rural constructions, for beams/rafters, tables, carpentry in general, bark is white in colour with small fissures or grooves
The density for planting will be 6 m x 8m in a staggered planting pattern, equivalent to 208 plants per ha, at 3 m from the Tornillo. It will last in the system for up to 25 years, after which it can be thinned to permit the growth or the thickening of the Tornillo trunk, reducing the competition for nutrients.
The species will be included only on clay soils.
CAPIRONA (Calycophyllum spruceanum Hook.).
Capirona (Calycophyllum spruceanum Hook.) is a species characteristic of occasionally inundated alluvial soils, and is a rapid growth species, with orthotropic growth and a semi-hard wood. It is well known by farmers who use it in rural constructions, for beams/rafters, tables, carpentry in general, bark is petroleum green, which flakes or peels.
PROJECT DESCRIPTION: VCS Version 3
v3.1 11
The density of planting will be 6 m x 8 m in staggered pattern, equivalent to 208 plants per ha, at 3 to 4 m from the Tornillo.
The species can be included in the Agroforestry Systems (SAF) with clay soils and sandy soils with a pH greater than 4.5.
b. Tree species of intermediate growth
TORNILLO (Cedreliga catenaeformis Ducke). It is a gregarious , fast growing species that thrives in open sun. The density of planting will be 221 plants / ha; the planting pattern will be 6 x 8 m, aiming to avoid the overlapping of crowns and competition for light.
One disadvantage of the species, when cultivated in a plantation setting, it its tendency to form a crown which starts to dominate the canopy, which due to its rapid orthotropic or columned growth is achieved in the fourth year when its shaft reaches a height of less than 10 m. This can result in the production of poor saw timber.
One method of inducing and maintaining orthotropic (straight) growth of the trunk is to generate competition for light within the plantation with other species of rapid growth, equal or superior to the Tornillo. Such species include Añallu caspi (Cordia Bicolor) in clay soils, which is characterised by rapid growth and a straight shaft. Other species which can play this role include Huamansamana, Bolaina, Brea caspi, Shaina and Capirona.
MARUPA (Simarouba amara Aubl).- It is a heliophyte species which grows rapidly initially, is well adapted to sandy soils and to clay soils In the SAF it fills the role of a second stratum. It can be replaced partially or totally by other tree species at the preference of the farmer, such as Palo de Rosa, Copaiba, Sangre de Grado, whose purpose is to obtain different wood products.
The density of planting will be 104 plants per ha; planting will be 12 x 8 metres in a staggered pattern, so as to avoid the overlapping of crowns and competition for light between rows.
One method to induce and maintain orthotropic (straight) growth of the trunk is to generate competition for light within the rows in the same manner as described above with Tornillo.
c. Slow growth forest species
COPAIBA (Copaifera officinalis; Copaifera paupera) is a common species in sandy and clayey soils. It has a globular crown, leathery leaves, low nutritional requirements, heliophyte, tolerant to shade, although this decreases its growth. It is valued for its production of resin or oil, which has medicinal properties.
PALO DE ROSA (Aniba rosaeodora). Because of the value of the essential oils for perfume it has been exploited in the past to the point of putting it in danger of extinction, currently it is cultivated to harvest the leaves which contain 2 – 2.5 % Linolol. It is a heliophytic species which does not tolerate shade well.
CEDAR (Cedrela odorata) - a typical species of acidic sandy soils with high contents of calcium. Its trunk is straight, cylindrical, tapering toward the top. Its crown is an elongated globe, dense, excellent recycler of nutrients. In open fields it requires competition to avoid early branching. Its principal constraint is its susceptibility to attack from the caterpillar of the butterfly Hypsipilla grandella. Timely pruning controls the development of larvae, as well as the application of biological controls and ensuring planting density is kept low. This disease is only a problem until the tree

PROJECT DESCRIPTION: VCS Version 3
v3.1 12
reaches a height of 8 m, after which point it is above the level of flight of the butterfly.
Cedar is valued for its wood which is soft and light, used for fine furniture, woodwork, carvings, musical instruments, doors and windows.
In the SAF on clay soils it can partially replace Marupa in the intermediate stratum for up to 5% (20 plants) of the plantation. It should not be planted in high density, because of Hypsipilla.
SANGRE DE GRADO (Croton lechleri M.).- it develops very well in clay and sandy soils, has low nutritional requirements, tolerates poor drainage. It is cultivated for its medicinal properties of the red wine coloured latex which is extracted from its trunk, which has healing properties and contains the alkaloid Taaspina.
Fruit tree species Perennial fruit species
CITRICOS: LIMON TAHITI, MANDARINA SAN MARTIN.- These citrus fruits can grow in any type of soil and don’t have limitations provided that they don’t have deficiencies of oxygen in the root zone. Soils with poor drainage limit their growth, clayish soils with an effective depth less than 90 cm are not recommended; they grow in sandy soils provided that they are supplemented with the essential elements they require.
There are differences in nutritional requirements between the different species and varieties of citrus, which permits their cultivation in degraded soils with a good selection of species and variety.
The preferences of producers for the cultivation of citrus is due to the attractive prices in the market in times of production shortages in the coastal plantations (June to Nov) where the Limón Sutil is replaced by the production of Limón Tahití at prices greater than 4 soles per kilo.
In the SAF the installation of no more than 100 citrus plants should be considered per hectare, given that the quality of the soil does not support higher densities.
ANONACEAS: GUANABANA and ANONA – the family of Anonáceas covers more than 130 genera and more than 200 species, of which 17 genera are distributed in tropical climates, however only four genera produce edible fruit (Annonas, Rollinia, Uvaria and Ansimine)
Guanabana (Annona muricata L.) - this is a native fruit tree widely appreciated for the quality of its fruit which can weigh up to 7kg, prized by agroindustry for manufacture of concentrates, juices and ice cream.
Its principal limitation is the incidence of pests such as fruit borer Cerconota annonella, the fruit fly Ceratitis capitata which attacks the fruit and the stem borer Cratosomus bombina.
THEOBROMAS: COPOAZU, MACAMBO. CACAO - the American genus Theobroma belongs to the family Sterculacea and comprises of 22 species all developed naturally in the wet tropics. In the Peruvian amazon traditionally Cacao (T. Cacao), Copoazú ( T. grandiflorum), Macambo (T. Bicolor), and Cacaotillo (T. Subincanum) are cultivated.
PROJECT DESCRIPTION: VCS Version 3
v3.1 13
Copoazu (Theobroma grandiflorum) - is a fruit which is not restricted by soil quality, thrives in extremely acidic soils of low fertility of sandy and clay texture; from the oxisols of Brazil to the acidic incepticols of Loreto, on high land that does not flood.
It tolerates shaded environment well and is ideal for forming the intermediate stratum, is valued for the pulp of the fruit, which is used in the preparation of juices. In Brazil the extraction of the pulp is processed at the level of small farms for the hotel and restaurant market, the seed is used for producing chocolate which is the same as cacao, obtaining white chocolate.
Its principal restriction for cultivation is the fruit borer Cronotracherus humeropticus which attacks the seeds and provokes the decay of the fruit. This occurs when the infected fruits are left abandoned in the plantations enabling the insect population to grow.
In the SAF it will be planted with 208 plants at a density of 12 x 4 m in a staggered pattern, in order to slow the growth of pest infestations.
Species planted for fertilization properties in the agroforestry systems
GUABAS (Inga edulis) - is native to the Amazon forests and adapts well to all types of terrain, thriving in both sandy and clay soils, with low natural fertility. The wide open crown provides a temporary shade in the SAF for ombrophile species to use.
Inga species grow rapidly and recycle nutrients well; as with all legumes they fix nitrogen in their roots, and incorporate this nitrogen into the soil through through constant defoliation. Its leaves have high concentrations of polyphenols, decomposing slowly, over time forming a layer of leaf litter which gradually improves the physical properties of the soil.
Its density of planting will be 18 m x 16 m. Its main purpose in the SAFs is to improve soil fertility, but farmers may use fruits for personal consumption or sale into local markets.
ZAPOTE (Matisia cordata) This is a species which thrives in extremely acidic sandy soils, is found in Pevas formation soils, is an efficient recycler of nutrients producing abundant foliage which it loses in summer. It is highly appreciated for its high production of fruits, consumed in a fresh state, used in the production of juices, marmalades, jellies, and has high contents of cartenoids, is exported internationally as flour.
The density of planting will be 18 m x 16 m and forms the intermediate stratum, its function being to recycle nutrients and produce fruit.
Short cycle crops
Banana/plantain (Musa paradisiacal) – serves to provide shade during the growth of perennial species for the first three years.
Species widely cultivated in the region. The density of planting will be 400 plants per hectare in a pattern of 6 x 4 metres
Cocona (Solanum sessiliflorum Dunal). Is a native fruit of the Amazonwhich grows as a shrub. It is widely cultivated and consumed in the Loreto region, is used fresh in salads, hot sauce, as a medicinal extract for diabetes, with high potential for agroindustry in marmalade, pickles, jellies, juices. The local market demand is unsatisfied.
PROJECT DESCRIPTION: VCS Version 3
v3.1 14
The Density of plantation in the system will be 5000 plants per hectare, in a pattern of 2 x 1 m. It begins its production 6 months after planting.
Pineapple (Ananas comosus) serves to control surface runoff in plots with slopes greater than 25%, being planted following contours after establishing the plantation. This plant grows well in clay and sandy soils and has no major restriction or limitation. It begins to produce between 12 and 14 months.
Yuca – is the principal crop cultivated in the Loreto region, it forms part of the food security of the rural population.
The species grows well in acidity sandy and clay soils.
Maize – not recommended for cultivation in soils with less than 35% base saturation. The farmer can only includes this in clayish soils with high calcium content.
1.9 Project Location
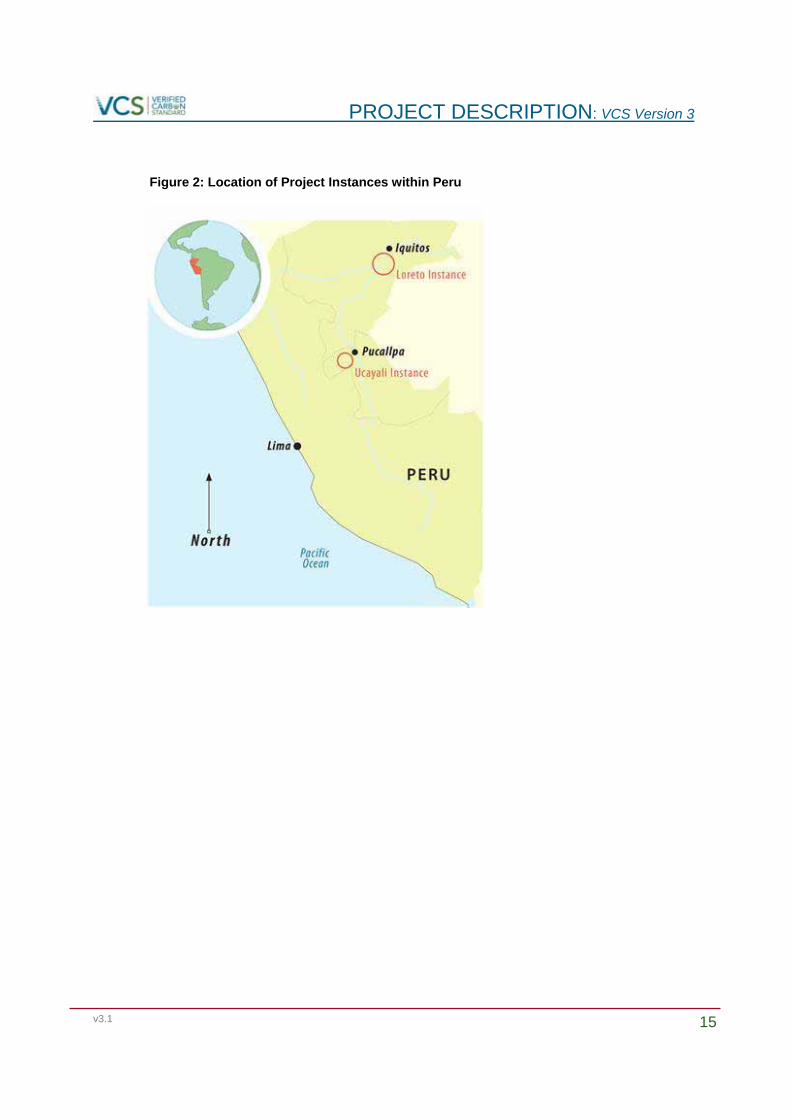
In this Project Description (PD) we present two initial project instances for the Grouped Project – one in Loreto and the other in Ucayali. Both are located in the Peruvian Amazon.
PROJECT DESCRIPTION: VCS Version 3
v3.1 15
Figure 2: Location of Project Instances within Peru
PROJECT DESCRIPTION: VCS Version 3
v3.1 16
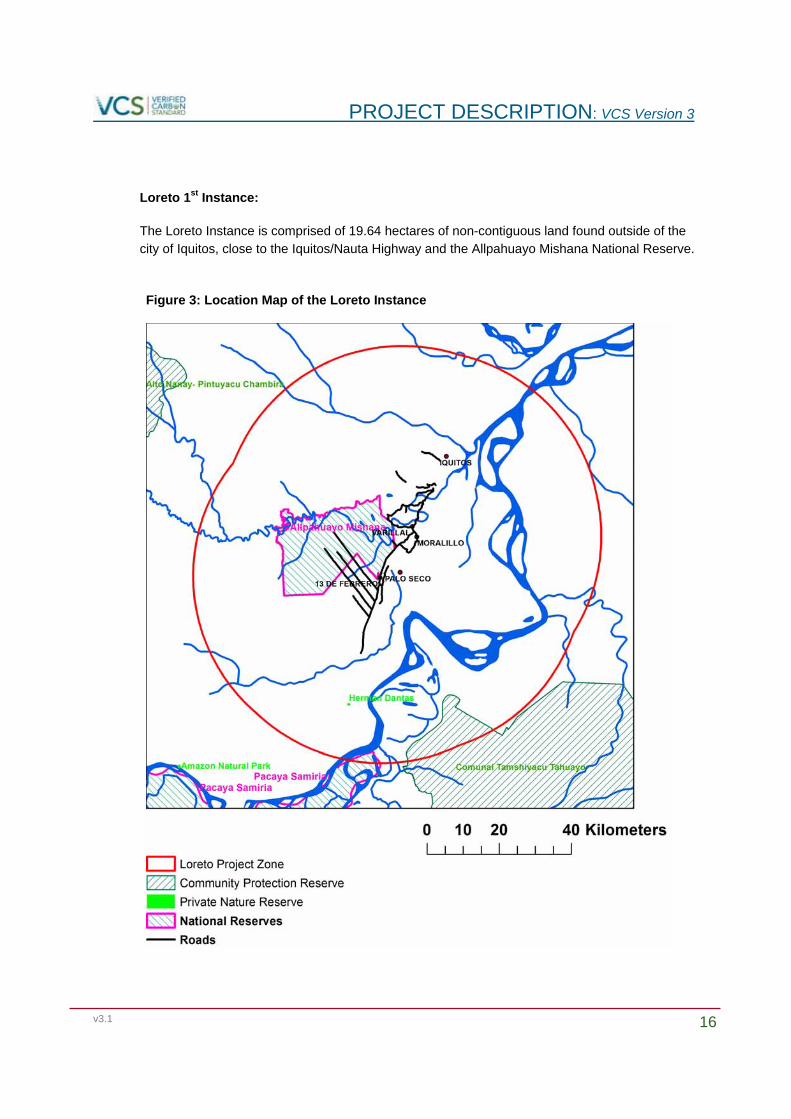
Loreto 1st Instance:
The Loreto Instance is comprised of 19.64 hectares of non-contiguous land found outside of the city of Iquitos, close to the Iquitos/Nauta Highway and the Allpahuayo Mishana National Reserve.
Figure 3: Location Map of the Loreto Instance
PROJECT DESCRIPTION: VCS Version 3
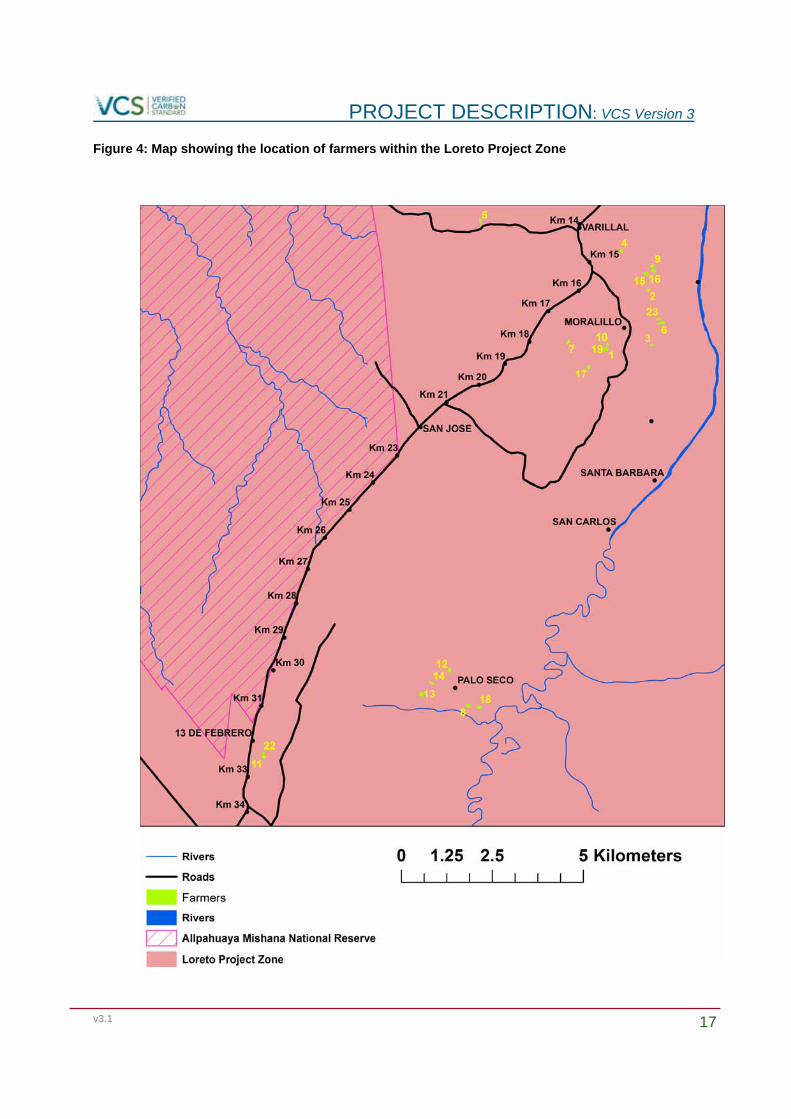
v3.1 17
Figure 4: Map showing the location of farmers within the Loreto Project Zone
PROJECT DESCRIPTION: VCS Version 3
v3.1 18
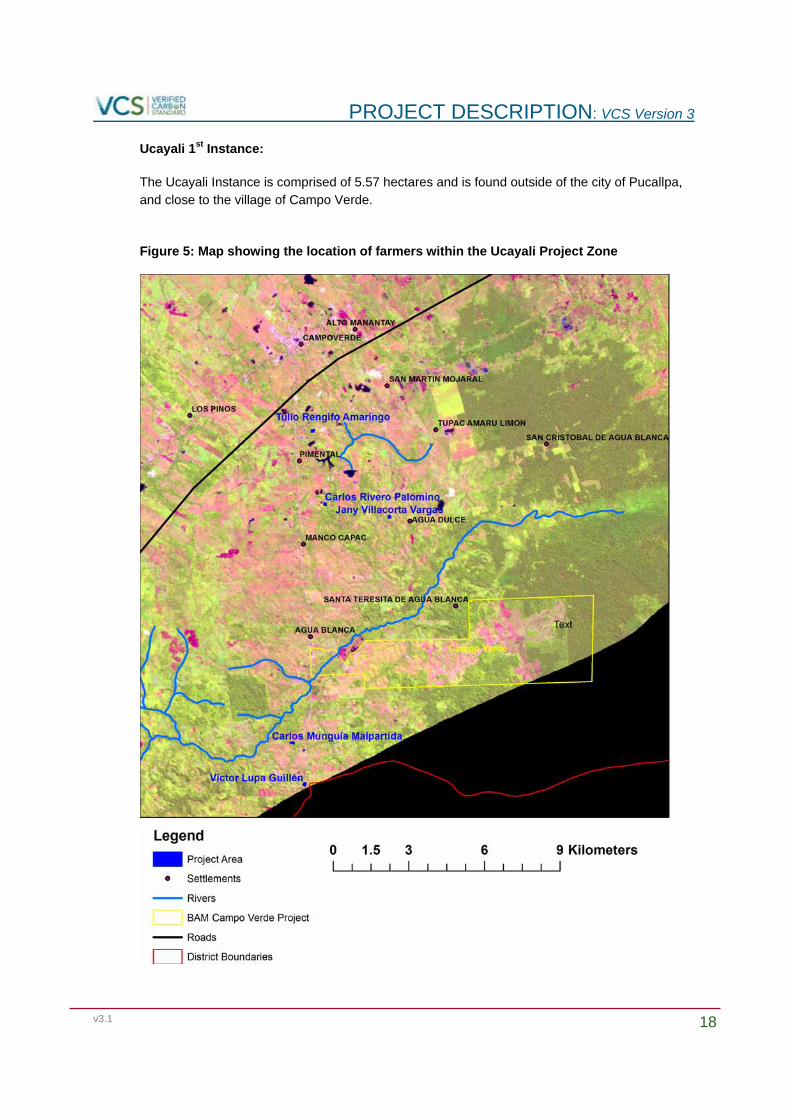
Ucayali 1st Instance:
The Ucayali Instance is comprised of 5.57 hectares and is found outside of the city of Pucallpa, and close to the village of Campo Verde.
Figure 5: Map showing the location of farmers within the Ucayali Project Zone

PROJECT DESCRIPTION: VCS Version 3
v3.1 19
1.10 Conditions Prior to Project Initiation Loreto 1st Instance
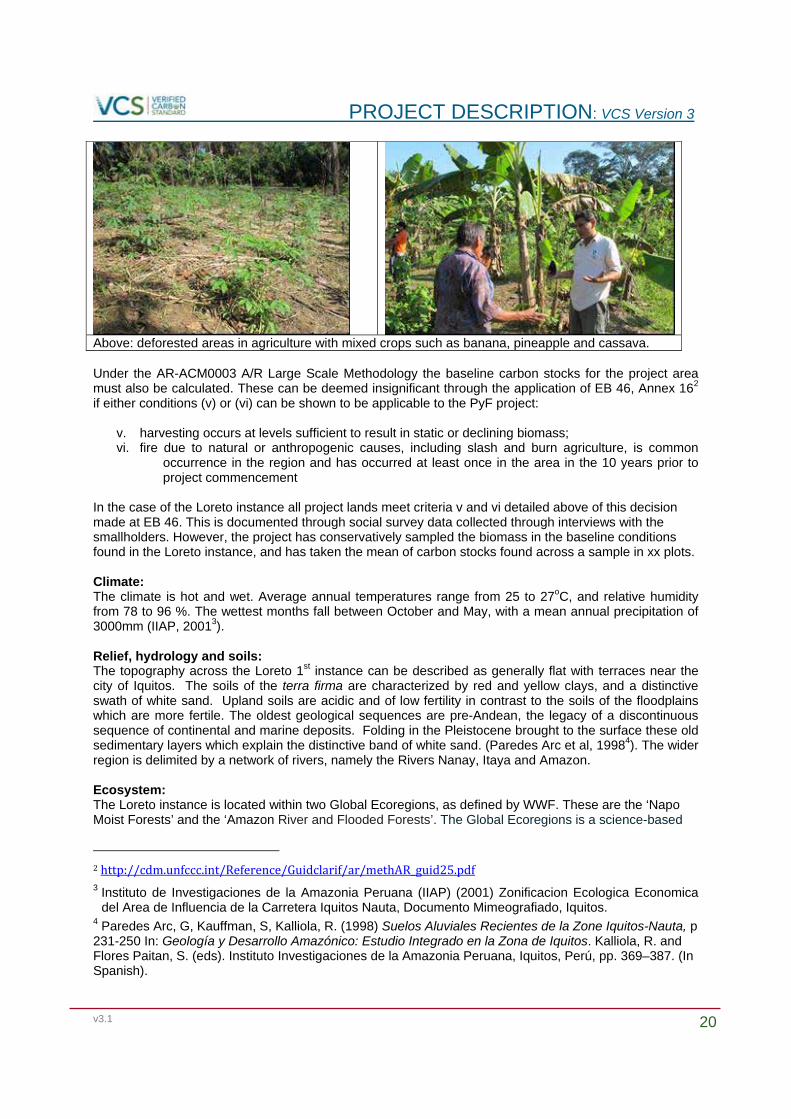
Land use: The land in the Loreto 1st Instance is in a shifting agriculture cycle. All the project land has been in a shifting cultivation cycle for over 10 years, with the native and natural ecosystem, of tropical rainforest being removed prior to 2002 (confirmed by remote sensing analysis). This land was cleared by farmers using “slash and burn” techniques. This involves the farmer initially clearing forest by cutting down the trees, shrubs and other vegetation on the land. This is subsequently left to dry, and is later burnt to reduce the biomass on the land and leave it clear for crop planting. Following this, farmers plant annual crops. They usually plant crops such as banana, rice, corn or manioc, which can only we supported on the same piece of land for approximately 2 years in succession before the area has to be abandoned for arable cropping, and is fallowed. The land has to be fallowed because the soils lose fertility and are no longer able to support productive agriculture. Amazonian soils quickly lose fertility once tree cover is removed, as the quality of the soils are poor and their nutrient storage capacity very low. Without trees and their associated fungi to break down dead vegetation and recycle the nutrients, and without much protection for the soils from heavy rains, the nutrients are rapidly leached away. At this point the farmer moves to a new area of either mature forest or fallow and repeats the cycle again – clearing the forest, burning the vegetation and planting crops for a short period of time, before the land is once again abandoned and left to fallow. A farmer usually returns to a fallow area within 15 years. The fallow age can depend on land pressure, and also ecological conditions of the site, but interviews with farmers and evaluation of patterns from the satellite imagery show that fallows are not left for more than 15 years in this region of high population pressure. All land planted in the Loreto instance has been cleared using burning for agriculture purposes within the last 10 years as part of a slash and burn system. Figure 6: Photos of baseline conditions
Above: deforested areas cleared by slash-and-burn agriculture
PROJECT DESCRIPTION: VCS Version 3
v3.1 20
Above: deforested areas in agriculture with mixed crops such as banana, pineapple and cassava. Under the AR-ACM0003 A/R Large Scale Methodology the baseline carbon stocks for the project area must also be calculated. These can be deemed insignificant through the application of EB 46, Annex 162 if either conditions (v) or (vi) can be shown to be applicable to the PyF project:
v. harvesting occurs at levels sufficient to result in static or declining biomass; vi. fire due to natural or anthropogenic causes, including slash and burn agriculture, is common
occurrence in the region and has occurred at least once in the area in the 10 years prior to project commencement
In the case of the Loreto instance all project lands meet criteria v and vi detailed above of this decision made at EB 46. This is documented through social survey data collected through interviews with the smallholders. However, the project has conservatively sampled the biomass in the baseline conditions found in the Loreto instance, and has taken the mean of carbon stocks found across a sample in xx plots. Climate: The climate is hot and wet. Average annual temperatures range from 25 to 27oC, and relative humidity from 78 to 96 %. The wettest months fall between October and May, with a mean annual precipitation of 3000mm (IIAP, 20013). Relief, hydrology and soils: The topography across the Loreto 1st instance can be described as generally flat with terraces near the city of Iquitos. The soils of the terra firma are characterized by red and yellow clays, and a distinctive swath of white sand. Upland soils are acidic and of low fertility in contrast to the soils of the floodplains which are more fertile. The oldest geological sequences are pre-Andean, the legacy of a discontinuous sequence of continental and marine deposits. Folding in the Pleistocene brought to the surface these old sedimentary layers which explain the distinctive band of white sand. (Paredes Arc et al, 19984). The wider region is delimited by a network of rivers, namely the Rivers Nanay, Itaya and Amazon. Ecosystem: The Loreto instance is located within two Global Ecoregions, as defined by WWF. These are the ‘Napo Moist Forests’ and the ‘Amazon River and Flooded Forests’. The Global Ecoregions is a science-based
2http://cdm.unfccc.int/Reference/Guidclarif/ar/methAR_guid25.pdf 3 Instituto de Investigaciones de la Amazonia Peruana (IIAP) (2001) Zonificacion Ecologica Economica
del Area de Influencia de la Carretera Iquitos Nauta, Documento Mimeografiado, Iquitos. 4 Paredes Arc, G, Kauffman, S, Kalliola, R. (1998) Suelos Aluviales Recientes de la Zone Iquitos-Nauta, p 231-250 In: Geología y Desarrollo Amazónico: Estudio Integrado en la Zona de Iquitos. Kalliola, R. and Flores Paitan, S. (eds). Instituto Investigaciones de la Amazonia Peruana, Iquitos, Perú, pp. 369–387. (In Spanish).
PROJECT DESCRIPTION: VCS Version 3
v3.1 21
global ranking of the Earth's most biologically outstanding terrestrial, freshwater and marine habitats.(WWF, 2013) The natural vegetation of the region is rainforest; which is highly variable in terms of species composition, varying within small distances depending on geology, soil type and topography. In the area includes sections of white sand geology upon which a distinctive rainforest type called Varillal is found, characterised by thin trees and an unusually high species diversity, including many endemics. The Allpuayo Mishana National Reserve, adjacent to the Loreto Instance has been designated in an area which is principally Varillal. On the clayey uplands the largest number of valuable timber species grow. (IIAP, 20015, Flores Paitain, 19986) Vegetation: Within the productive agricultural areas common crops include banana, manioc (yucca), corn, pineapple, heart of palm and sugar cane. The area of the project instances themselves are either in productive agriculture or are in fallow. Common species found in the fallows include common early stage successional tree species such as topa (Ochroma pyramidale), pashaco (Schizolobium excelsum), Shimbillo (Inga spp), Rifari (Miconia spp) and Atadijo (Trema micrantha). Biodiversity: The forests of the Western Arc of the Amazon Rainforest, which include Loreto are amongst the richest in the world, both in terms of biological diversity and natural resources (WWF, 2013). The Loreto project instance falls within two ecoregions, as described by WWF – namely Napo Moist Forest and Amazon River and Flooded Forests. The amazing diversity of the region stems from the high and relatively seasonal rainfall in parts of the ecoregion. The complex topography and soils and vast river systems create a dynamic mosaic of habitats. This leads to an amazing growth of flora and endemism. More than 310 tree species have been found to exist in a one hectare area in the Napo Moist Forests. The area is internationally celebrated as being among the most species-rich forests known on our planet but is threatened by accelerating deforestation. This Loreto 1st instance is located in a region of High Conservation Value Forest with high levels of endemism and endangered species. It is adjacent to the species-rich Allpahuayo Mishana National Reserve which is home to Iquitos Gnatcatcher (Polioptila Clementsi), classified as ‘critically endangered’ by the IUCN Red List. Across the region habitat loss from unsustainable agricultural expansion by smallholder farmers threatens other endangered species such as the White Bellied Spider Monkey (Ateles belzebuth), the Black Faced Spider Monkey (Ateles Chamek), and the Giant Brazilian Otter (Pteronura brasiliensis) – all of these are classified as endangered on the IUCN Red List7. On the deforested agricultural lands biodiversity has dramatically diminished. (IIAP, 2013) Ucayali 1st Instance Land use: The project lands were converted from forest into pastures in the early 1970’s. The land has continued as pasture since that time. The pressure of cattle on the land, the inherent low fertility of Amazonian soils, the heavy rain and the natural undulation of the land led to its degradation over time. Climate:
5 Instituto de Investigaciones de la Amazonia Peruana (IIAP) (2001) Zonificacion Ecologica Economica
del Area de Influencia de la Carretera Iquitos Nauta, Documento Mimeografiado, Iquitos. 6 Flores Paitan, S, Gomez Romero, E, Kalliola, R. (1998) Caracteristicas Generales de la zone de Iquitos,
p17-31 In: Geología y Desarrollo Amazónico: Estudio Integrado en la Zona de Iquitos. Kalliola, R. and Flores Paitan, S. (eds). Instituto Investigaciones de la Amazonia Peruana, Iquitos, Perú, pp. 369–387. (In Spanish).
7 http://www.iucnredlist.org/ Accessed 31st Jan 2014
PROJECT DESCRIPTION: VCS Version 3
v3.1 22
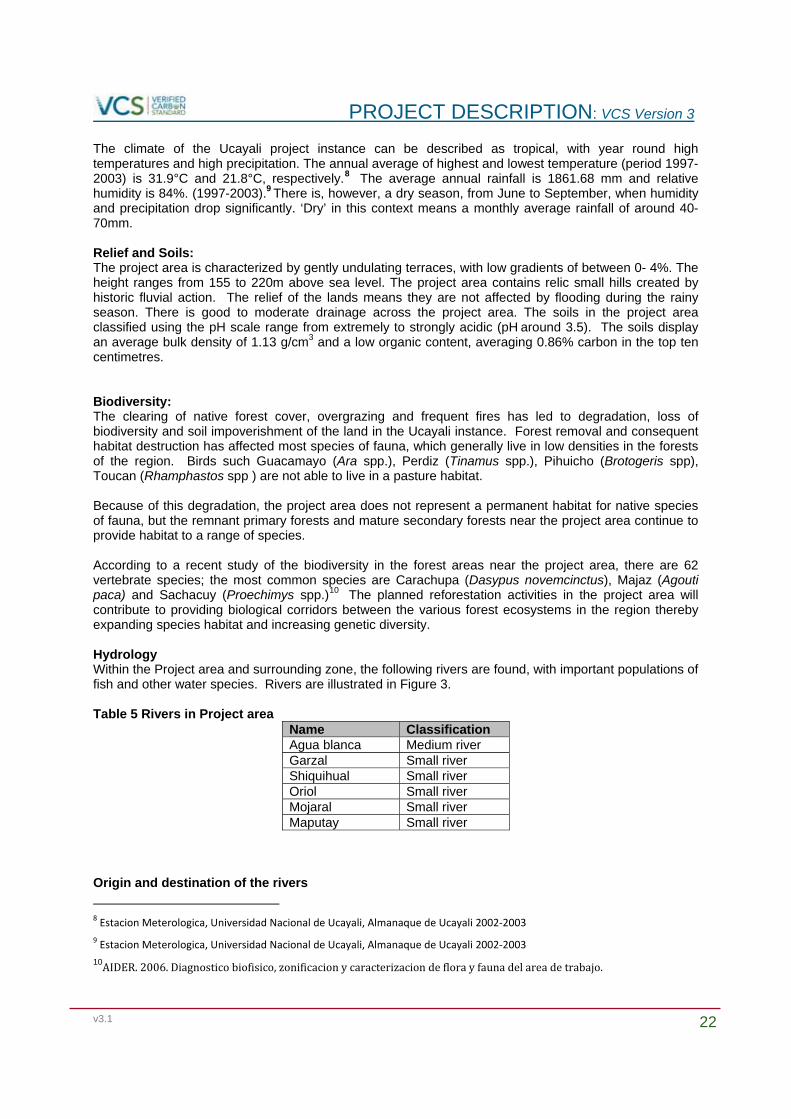
The climate of the Ucayali project instance can be described as tropical, with year round high temperatures and high precipitation. The annual average of highest and lowest temperature (period 1997-2003) is 31.9°C and 21.8°C, respectively.8 The average annual rainfall is 1861.68 mm and relative humidity is 84%. (1997-2003).9 There is, however, a dry season, from June to September, when humidity and precipitation drop significantly. ‘Dry’ in this context means a monthly average rainfall of around 40-70mm. Relief and Soils: The project area is characterized by gently undulating terraces, with low gradients of between 0- 4%. The height ranges from 155 to 220m above sea level. The project area contains relic small hills created by historic fluvial action. The relief of the lands means they are not affected by flooding during the rainy season. There is good to moderate drainage across the project area. The soils in the project area classified using the pH scale range from extremely to strongly acidic (pH around 3.5). The soils display an average bulk density of 1.13 g/cm3 and a low organic content, averaging 0.86% carbon in the top ten centimetres. Biodiversity: The clearing of native forest cover, overgrazing and frequent fires has led to degradation, loss of biodiversity and soil impoverishment of the land in the Ucayali instance. Forest removal and consequent habitat destruction has affected most species of fauna, which generally live in low densities in the forests of the region. Birds such Guacamayo (Ara spp.), Perdiz (Tinamus spp.), Pihuicho (Brotogeris spp), Toucan (Rhamphastos spp ) are not able to live in a pasture habitat. Because of this degradation, the project area does not represent a permanent habitat for native species of fauna, but the remnant primary forests and mature secondary forests near the project area continue to provide habitat to a range of species. According to a recent study of the biodiversity in the forest areas near the project area, there are 62 vertebrate species; the most common species are Carachupa (Dasypus novemcinctus), Majaz (Agouti paca) and Sachacuy (Proechimys spp.)10 The planned reforestation activities in the project area will contribute to providing biological corridors between the various forest ecosystems in the region thereby expanding species habitat and increasing genetic diversity. Hydrology Within the Project area and surrounding zone, the following rivers are found, with important populations of fish and other water species. Rivers are illustrated in Figure 3. Table 5 Rivers in Project area
Name Classification Agua blanca Medium river Garzal Small river Shiquihual Small river Oriol Small river Mojaral Small river Maputay Small river
Origin and destination of the rivers
8 Estacion Meterologica, Universidad Nacional de Ucayali, Almanaque de Ucayali 2002‐2003 9 Estacion Meterologica, Universidad Nacional de Ucayali, Almanaque de Ucayali 2002‐2003
10AIDER.2006.Diagnosticobiofisico,zonificacionycaracterizaciondeflorayfaunadelareadetrabajo.

PROJECT DESCRIPTION: VCS Version 3
v3.1 23
The rivers in the project area are generated by the high level of rainfall and from underground springs. The rivers are part of Amazon Basin and feed into the Ucayali River, one of the most important tributaries of the Amazon river, the largest river in the world. Ecosystem The Ucayali instance is located in the Subtropical Amazon bio-geographic province and the native forest cover is classified as pre-mountain tropical humid forest in transition to tropical humid forest. 11 Vegetation: In the Ucayali instance, the dominant vegetation is the invasive grass Braquiaria decumbes with a few shrubs, isolated trees or clumps of trees. This grass species is also associated with hard stem grass (8.8% of cover) and Cashaucsha grass (Imperata brasiliensis) (7.8%). These grasses are invasive and have a high fuel load, leading to regular fires that then prevent natural regeneration in the pasture areas.
11 According to the life zones classification developed by Holdridge in Holdrige, L.R. (1947) Determination of world plant formations from simple climatic data. Science, 105: 367‐368.
PROJECT DESCRIPTION: VCS Version 3
v3.1 24
1.11 Compliance with Laws, Statutes and Other Regulatory Frameworks The key part of Peruvian Law that relates to right of use of environmental services, and hence carbon offsets through reforestation, falls under the Forestry and Wildlife Law (FWL), the requirements of
which are detailed below. As a framework of the FWL, “The National Constitution” (La Constitucion Politica del Peru) provides that natural resources are patrimony of the nation, stating that by Institutional Law it would be determined mechanisms through which private owners can be granted with natural resources’ rights of use.. “The Institutional Law for the Sustainable Use of Resources” (Ley Orgánica para el Aprovechamiento Sostenible de los Recursos Naturales, Ley No. 26821) states in Article 4 that “the fruits and products of natural resources ... are owned by the holders of the right of use of such fruits and products” .” This right of use is included in a number of legal instruments, depending on the natural resource the private owner wants to use. The applicable Law for the use of forestry and wildlife resources is the Forestry and Wildlife Law (Ley Forestal y de Fauna Silvestre) – Law 27308. Under this law, and its regulation, forestry plantations
located in private property which contain natural resources (i.e. timber-related and non timber-related resources, such as environmental services) can be used by the owner of such private property. Under this law, there are two procedural conditions required by the owner to start using its forestry resources: the registry of their land as a forest plantation, and the acquisition of a forestry permit (the later requires the submission of the land ownership/title documentation to a governmental agency). However, Peru has seen the development of the New Forestry and Wildlife Law (Nueva Ley Forestal y de Fauna Silvestre – NLFFS) – Ley 29763. This new law will come into force when its Regulation is
promulgated, and at that stage the NLFFS will supersede the current Law no. 27308. The NLFFS changes the requirements slightly on forestry plantations located on private lands, providing the constituent right of the owner to use all natural resources that his plantations contains. This mean that the only obligation that remains under this law for private-owned forestry plantations is the registration before the government agency. There is also now a precedent in Peru established by other reforestation projects certified by the VCS and other carbon standards, of recognising right of use of carbon offsets by owners of private lands.
1.12 Ownership and Other Programs
1.12.1 Right of Use Project Requirements Only farmers who have full title to their land (Derecho de Propiedad) can participate in this VCS Grouped Project, as only they would have the right to obtain a forestry permit under Peruvian Law, which is required to be able to obtain the rights to environmental services. Whilst a number of farmers may have another type of rights over the superficial land recognized under Peruvian law, such as “possession” or “right of superficial-land use ” (“Derecho de posesión” or “Derecho de uso y habitación”) they can not participate in this project until they obtain full title (Derecho de Propiedad) , given that their rights are not enough to obtain a forestry permit as described above. Documenting private land title
PROJECT DESCRIPTION: VCS Version 3
v3.1 25
In accordance with the requirements of the VCS Standard Plant your Future has checked that all farmers participating in the scheme who will be included in the first instances in Loreto and Ucayali have full title, including documentation and listing with the ‘public registry’. Copies of titles and signed legal agreements are available on request by the auditor. This corresponds to the following right of use requested by the VCS Standard under requirement 3.11: A right of use arising by virtue of a statutory, property or contractual right in the land, vegetation or conservational or management process that generates GHG emission reductions and/or removals (where such right includes the right of use of such reductions or removals and the project proponent has not been divested of such right of use). Transfer of the emission rights The project instances demonstrably complies with VCS Standard Requirement 3.11: An enforceable and irrevocable agreement with the holder of the statutory, property or contractual right in the land, vegetation or conservational or management process that generates GHG emission reductions or removals which vests the right of use in the project proponent Every farmers participating in the programme in the first instances in Loreto and Ucayali has signed or will sign a contract with Planta tu Futuro setting the conditions of their participation in the program, in which they agree to transfer all of their rights of use over carbon emission reductions generated by the forestry plantation/agroforestry systems to the Civil Association Planta tu Futuro. Planta tu Futuro will take responsibility for the certification of the carbon credits, as well as their sale. Plant your Future, in conjunction with partners, has carried out an extensive consultation and capacity building process with the smallholder farmers in relation to the legal agreements transferring the carbon rights. The concept of carbon rights, carbon offsets and carbon markets was novel to farmers, and farmers had limited knowledge of how carbon certification and commercialisation works. Plant your Future has developed a series of training workshops and take home materials to explain these concepts to farmers. Farmers have had the opportunity to participate in a range of large group, small groups and individual workshops and meetings to discuss the issue of the carbon rights. Participation by farmers in the scheme is entirely voluntary, and the programme has been designed with farmer decision making at the centre of the project since its inception. The legal agreement has also undergone an extensive review process from partners and donors, including a revisions process by a third party Peruvian legal institution to ensure equity and clarity for the smallholders was being given. Third party representative have been present at all plenary workshops to witness transparent information exchange between farmers and Planta tu Futuro representatives e.g. representatives from ProNaturaleza and from the donor organisation Instituto Interamericano de Cooperacion por la Agricultura (IICA). Copies of this contract are available on request by the auditor.
1.12.2
Emissions Trading Programs and Other Binding Limits
The GHG reductions or removals generated by this project will not be used for compliance with an emissions trading program or to meet biding limits on GHG emissions.
1.12.3 Participation under Other GHG Programs
The project is not seeking registration under any other GHG program.
PROJECT DESCRIPTION: VCS Version 3
v3.1 26
1.12.4 Other Forms of Environmental Credit
The project doe not intend to generate any other form of GHG-related environmental credit from GHG emission reductions or removals under the VCS Program.
1.12.5 Projects Rejected by Other GHG Programs
This project has not been rejected by any other GHG program.
1.13 Additional Information Relevant to the Project
Eligibility Criteria
Eligibility criteria for inclusion of new instances of each project activity:
be located in the Republic of Peru occur within one of the designated geographic areas specified in the project description. land belongs to a ‘smallholder” farmer’. A ‘smallholder farmer’ is defined here for the
purposes of this grouped project description as a land holder that is not structurally dependent on permanent hired labour, and manages their land mainly with their own and their family’s labour force, and whose primary income comes from their land management activities12.
the smallholder has clear land title and relevant documentation over their land. (in exceptional cases the smallholder can hold possession title over the land only, but be in the advanced stages of and committed to obtaining complete title. The complete title must be obtainable before verification)
it must be demonstrable that the land was not cleared of native vegetation to create GHG credits
It must be demonstrable that the land was clear of native ecosystems prior to this grouped project start date, of January 16th 2012.
the smallholder wants to restore their land to forest and put it into sustainable management
the land owner is willing and able to sign an agreement which commits him to transfer the rights for the carbon to the project proponent and maintain the trees which have been planted as part of the project for a minimum of 30 years in accordance with an agreed management plan.
the land owner is willing to allow access to his land holding for inspection, monitoring of carbon stocks
it must be demonstrable that the land to be included in new project instances meets one of the two baseline criteria presented in this PD, described in section xx. These are:
o Shifting cultivation ‘slash and burn’ agriculture The land must have been burnt to prepare the land for agriculture at
least once within the last 10 years o degraded pastures baseline
12 Definition taken from the Plan Vivo Standard www.planvivo.org
PROJECT DESCRIPTION: VCS Version 3
v3.1 27
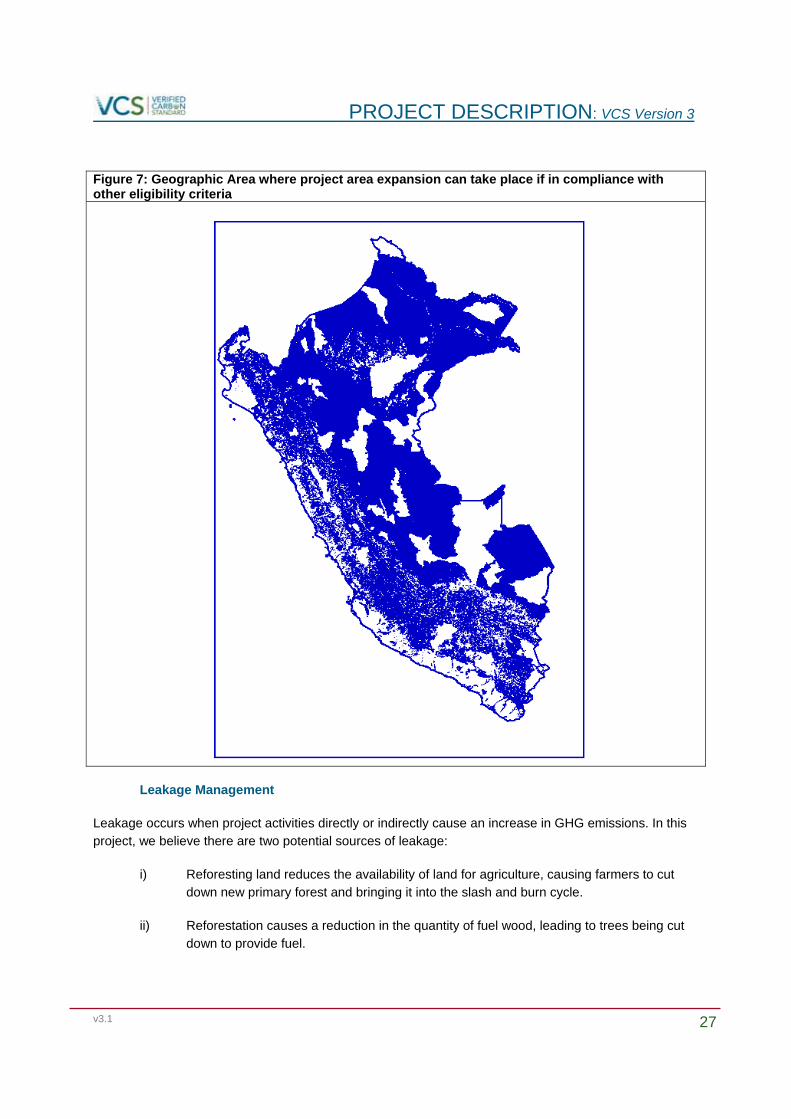
Figure 7: Geographic Area where project area expansion can take place if in compliance with other eligibility criteria
Leakage Management
Leakage occurs when project activities directly or indirectly cause an increase in GHG emissions. In this project, we believe there are two potential sources of leakage:
i) Reforesting land reduces the availability of land for agriculture, causing farmers to cut down new primary forest and bringing it into the slash and burn cycle.
ii) Reforestation causes a reduction in the quantity of fuel wood, leading to trees being cut down to provide fuel.
PROJECT DESCRIPTION: VCS Version 3
v3.1 28
We do not believe either will occur as a result of this project. We have set up the project so that farmer incomes from the land involved in the project should increase not decrease, with reliable revenue streams stretching into the future. Thus (i) does not apply: we do not believe the project will cause any additional natural forest to enter the slash-and-burn cycle. In both instances (ii) also does not apply: this is a very productive ecosystem with plentiful fuelwood available without the need to cut trees: no additional trees will be felled for fuel as a result of the project.
No leakage management plans are therefore thought necessary for this project.
Commercially Sensitive Information
No commercially sensitive information has been excluded from the public version of the project description.
Further Information
2 APPLICATION OF METHODOLOGY
2.1 Title and Reference of Methodology Clean Development Mechanism A/R Large-scale Methodology. Afforestation and reforestation of lands except wetlands Version 02.0.0 AR-ACM0003 The project will also follow: Agriculture, Forestry and Other Land Use (AFOLU) Requirements, VCS Version 3 v3.3 VCS Standard Version 3 v3.3 VCS Programme Guide Version 3 v3.4 AFOLU Non-Permanence Risk Tool Version 3 v3.2 Verified Carbon Standard AFOLU Guidance: Additional guidance for VCS Afforestation, Reforestation and Revegetation projects using CDM Afforestation/Reforestation Methodologies
2.2 Applicability of Methodology
The choice of methodology is justified because: CDM Applicability Criteria to meet:
1. This methodology is applicable under the following conditions:
(a) The land subject to the project activity does not fall in wetland category;
Project activities only occur on ‘uplands’ lands which do no fall into wetlands
(b) Soil disturbance attributable to the afforestation and reforestation (A/R) clean development mechanism (CDM) project activity does not cover more than 10 per
PROJECT DESCRIPTION: VCS Version 3
v3.1 29
cent of area13 in each of the following types of land, when these lands are included within the project boundary:
(i) Land containing organic soils;
(ii) Land which, in the baseline, is subjected to land-use and management practices and receives inputs listed in appendices 1 and 2 to this methodology.
Project activities involve minimal soil disturbance. Seedlings are planted into small pits at a maximum planting density of 2.5 x 2.5m which cover less than 10% of the project area.
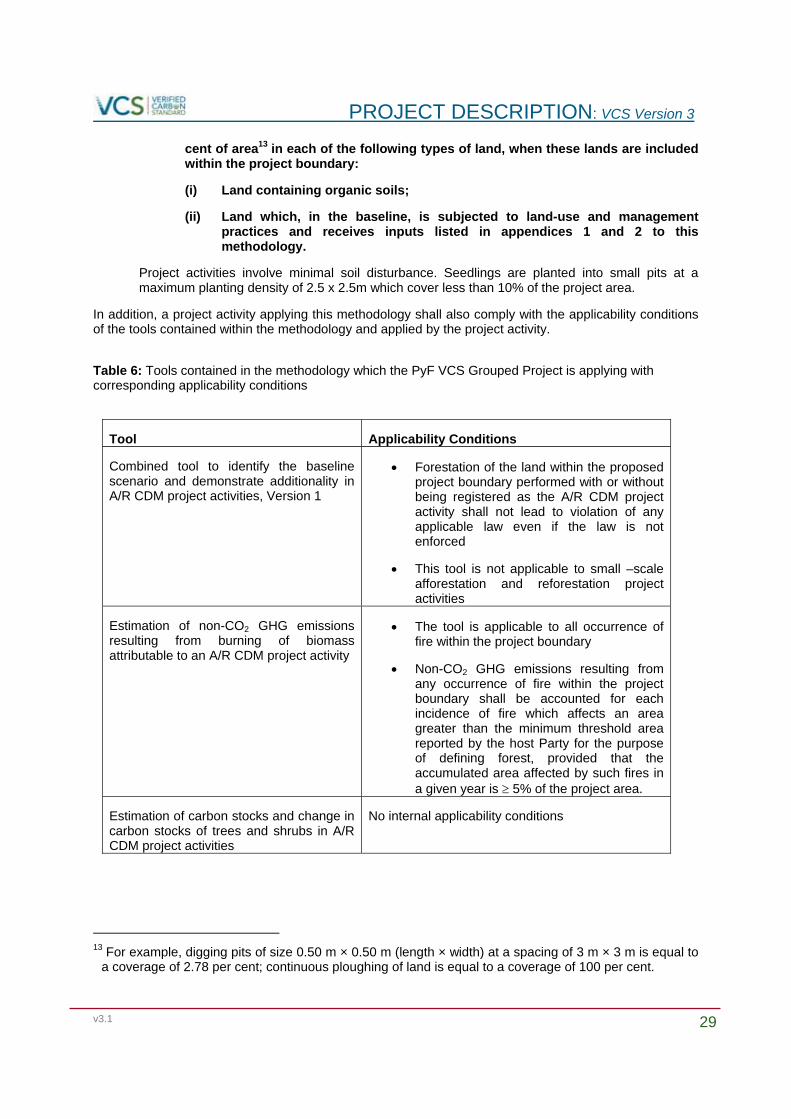
In addition, a project activity applying this methodology shall also comply with the applicability conditions of the tools contained within the methodology and applied by the project activity.
Table 6: Tools contained in the methodology which the PyF VCS Grouped Project is applying with corresponding applicability conditions
Tool Applicability Conditions
Combined tool to identify the baseline scenario and demonstrate additionality in A/R CDM project activities, Version 1
Forestation of the land within the proposed project boundary performed with or without being registered as the A/R CDM project activity shall not lead to violation of any applicable law even if the law is not enforced
This tool is not applicable to small –scale afforestation and reforestation project activities
Estimation of non-CO2 GHG emissions resulting from burning of biomass attributable to an A/R CDM project activity
The tool is applicable to all occurrence of fire within the project boundary
Non-CO2 GHG emissions resulting from any occurrence of fire within the project boundary shall be accounted for each incidence of fire which affects an area greater than the minimum threshold area reported by the host Party for the purpose of defining forest, provided that the accumulated area affected by such fires in a given year is 5% of the project area.
Estimation of carbon stocks and change in carbon stocks of trees and shrubs in A/R CDM project activities
No internal applicability conditions
13 For example, digging pits of size 0.50 m × 0.50 m (length × width) at a spacing of 3 m × 3 m is equal to
a coverage of 2.78 per cent; continuous ploughing of land is equal to a coverage of 100 per cent.

PROJECT DESCRIPTION: VCS Version 3
v3.1 30
VCS Applicability Criteria to meet:
VCS Criterion 3.1.6: Activities that convert native ecosystems to generate GHG credits are not eligible under the VCS Program. Evidence shall be provided in the project description that any ARR, ALM, WRC or ACoGS project areas were not cleared of native ecosystems to create GHG credits (eg, evidence indicating that clearing occurred due to natural disasters such as hurricanes or floods). Such proof is not required where such clearing or conversion took place at least 10 years prior to the proposed project start date. The onus is upon the project proponent to demonstrate this, failing which the project shall not be eligible.
The project will only work on lands that have been cleared of their native ecosystems for over 10 years before the project start. This is an eligibility criterion for participation of new instances in the Grouped Project, and must be demonstrated for their inclusion in the Grouped Project. For all lands included in the first instance in Loreto and Ucayali this has been demonstrated through the use of social surveys and using satellite imagery. All areas planted in the first instance have been cleared of the native ecosystem since at least 2002.
VCS Criterion 4.2.1: Eligible ARR activities are those that increase carbon sequestration and/or reduce GHG emissions by establishing, increasing or restoring vegetative cover (forest or non forest) through the planting, sowing or human-assisted natural regeneration of woody vegetation. Eligible ARR projects may include timber harvesting in their management plan. The project area shall not be cleared of native ecosystems within the 10 year period prior to the project start date, as set out in Section 3.1.6. ( above)
The project activities increase carbon sequestration in terrestrial ecosystems and reduce GHG emissions in the atmosphere through the planting of native fruit and timber trees. The project activities only occur on lands with have been cleared of their native ecosystems over 10 years before the project start date; this is an eligibility criterion for participation in the grouped project. The ARR project activities only occur on lands which have baselines which tend towards increasing degradation of the land either through ‘slash and burn’ agriculture or ‘degraded pastures’. The ARR activities will increase the carbon sequestration substantially against these conditions.
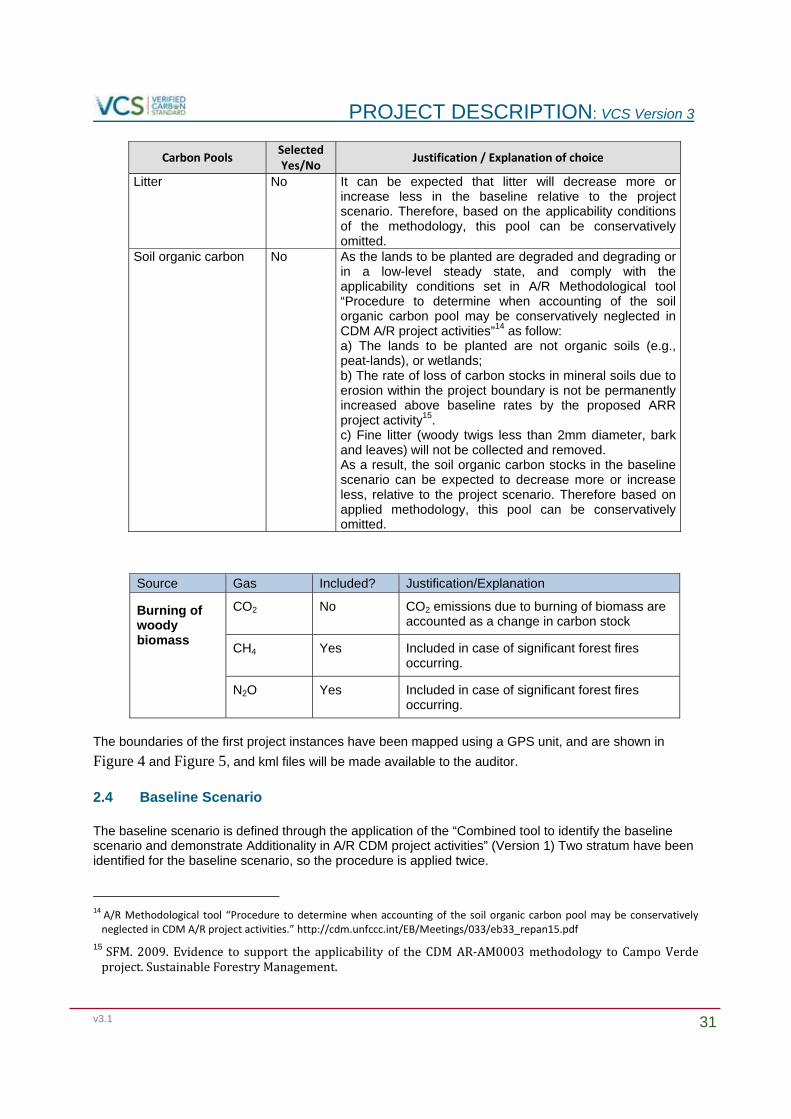
2.3 Project Boundary As specified in AR-ACM0003 Version 02.0.0 - Carbon pools to be considered by these methodologies are above- and below-ground biomass. All other pools are optional. In the case of this project only above and below ground biomass will be quantified. - Project emissions are considered insignificant and therefore neglected
Carbon Pools Selected Yes/No
Justification / Explanation of choice
Aboveground Yes Major carbon pool subjected to the project activity Belowground Yes Major carbon pool subjected to the project activity Deadwood No Deadwood can be expected to decrease more or increase
less in the baseline, relative to the project scenario. Therefore, based on the applicability conditions of the methodology, this pool can be conservatively omitted.
PROJECT DESCRIPTION: VCS Version 3
v3.1 31
Carbon Pools Selected Yes/No
Justification / Explanation of choice
Litter No It can be expected that litter will decrease more or increase less in the baseline relative to the project scenario. Therefore, based on the applicability conditions of the methodology, this pool can be conservatively omitted.
Soil organic carbon No
As the lands to be planted are degraded and degrading or in a low-level steady state, and comply with the applicability conditions set in A/R Methodological tool “Procedure to determine when accounting of the soil organic carbon pool may be conservatively neglected in CDM A/R project activities”14 as follow: a) The lands to be planted are not organic soils (e.g., peat-lands), or wetlands; b) The rate of loss of carbon stocks in mineral soils due to erosion within the project boundary is not be permanently increased above baseline rates by the proposed ARR project activity15. c) Fine litter (woody twigs less than 2mm diameter, bark and leaves) will not be collected and removed. As a result, the soil organic carbon stocks in the baseline scenario can be expected to decrease more or increase less, relative to the project scenario. Therefore based on applied methodology, this pool can be conservatively omitted.
Source Gas Included? Justification/Explanation
Burning of woody biomass
CO2 No CO2 emissions due to burning of biomass are accounted as a change in carbon stock
CH4 Yes Included in case of significant forest fires occurring.
N2O Yes Included in case of significant forest fires occurring.
The boundaries of the first project instances have been mapped using a GPS unit, and are shown in
Figure 4 and Figure 5, and kml files will be made available to the auditor.
2.4 Baseline Scenario The baseline scenario is defined through the application of the “Combined tool to identify the baseline scenario and demonstrate Additionality in A/R CDM project activities” (Version 1) Two stratum have been identified for the baseline scenario, so the procedure is applied twice.
14 A/R Methodological tool “Procedure to determine when accounting of the soil organic carbon pool may be conservatively neglected in CDM A/R project activities.” http://cdm.unfccc.int/EB/Meetings/033/eb33_repan15.pdf
15 SFM. 2009. Evidence to support the applicability of the CDMAR‐AM0003methodology to CampoVerdeproject.SustainableForestryManagement.
PROJECT DESCRIPTION: VCS Version 3
v3.1 32
Baseline Stratum 1: Shifting cultivation ‘slash and burn’ agriculture The slash and burn agriculture baseline represents land that has been cleared of tropical forest and burnt to make way for agriculture. The land is then cultivated for a few years until it is depleted of nutrients. The farmer then moves on to a new area of land to cultivate, leaving the previously cultivated area fallow. Following the area being left to fallow, the farmer will return to the land to re-clear and burn, allowing the soils to gain nutrients and allow the land to be re-cultivated. Under this baseline scenario, which applies in Loreto, the land owned by farmers undergoes a constant cycle of clearing for agriculture, being farmed for 2-3 years (“chacra”), then left as fallow (“purma”) for a number of years before being cleared again. Most farmer’s land is therefore a mosaic of agriculture and wooded fallow in various stages of recovery. Our baseline scenario assumes that land, if not used for the project, would remain in this cycle of growth and clearing. We assume that the time between clearing events will be the same in the future as in the recent past, and calculate the mean carbon stock through time using a set of field plots located in agriculture and various ages of regrowth. Satellite analysis to determine time between clearing events An analysis was performed using satellite imagery in order to confirm that the project area was subject to repeated clearings, and to attempt to estimate the average time between clearing events. This analysis was conducted using Landsat imagery, downloaded from the United States Geographical Survey, and analysed by Edward Mitchard from the University of Edinburgh. The Landsat archive from 1992 (20 years prior to the project start date) was queried, searching for scenes with less than 10 % cloud cover over the project area. Only scenes captured in the dry season were considered, as only in the dry season can intact forest, degraded forest/fallow, and agricultural land be confidently distinguished. Five cloud-free dry-season Landsat scenes were found, from 1995, 1999, 2005, 2009 and 2011. Training areas corresponding to areas of known landcover type were identified individually for every image. These included intact forest, young fallow, agriculture/grassland, bare ground and water bodies. At least 20 polygons were identified for each class, as recommended in GOFC-GOLD (2009). Not all sites used as training data had been visited, with in some cases access to hyperspatial imagery (e.g. IKONOS scenes from 2002 and 2010 made available to the project through a grant from the GeoEye Foundation) and expert knowledge were used to define the training sites. Supervised classification was then performed using a Neural Network approach, with user’s classification accuracies better than 95 % in all cases (mean 98.5 %). A full report is available on request by the auditors, which gives more details on the classification approach. A simple turnover analysis was used to confirm that all agricultural plots were found in areas that were in this shifting cultivation cycle. We took all five classifications (1995-2011) and mapped all areas that had changed from forest to non-forest at least once, in addition to those areas that were always non-forest or always forest. The result is shown in Figure 8.
PROJECT DESCRIPTION: VCS Version 3
v3.1 33
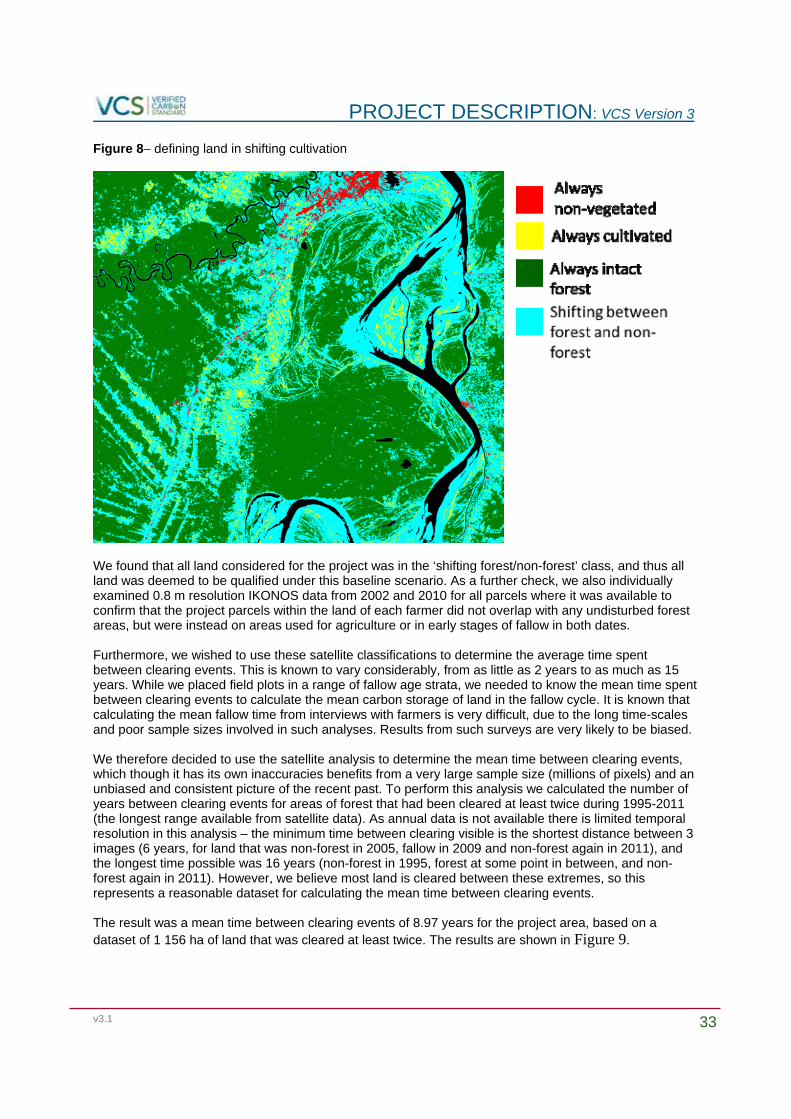
Figure 8– defining land in shifting cultivation
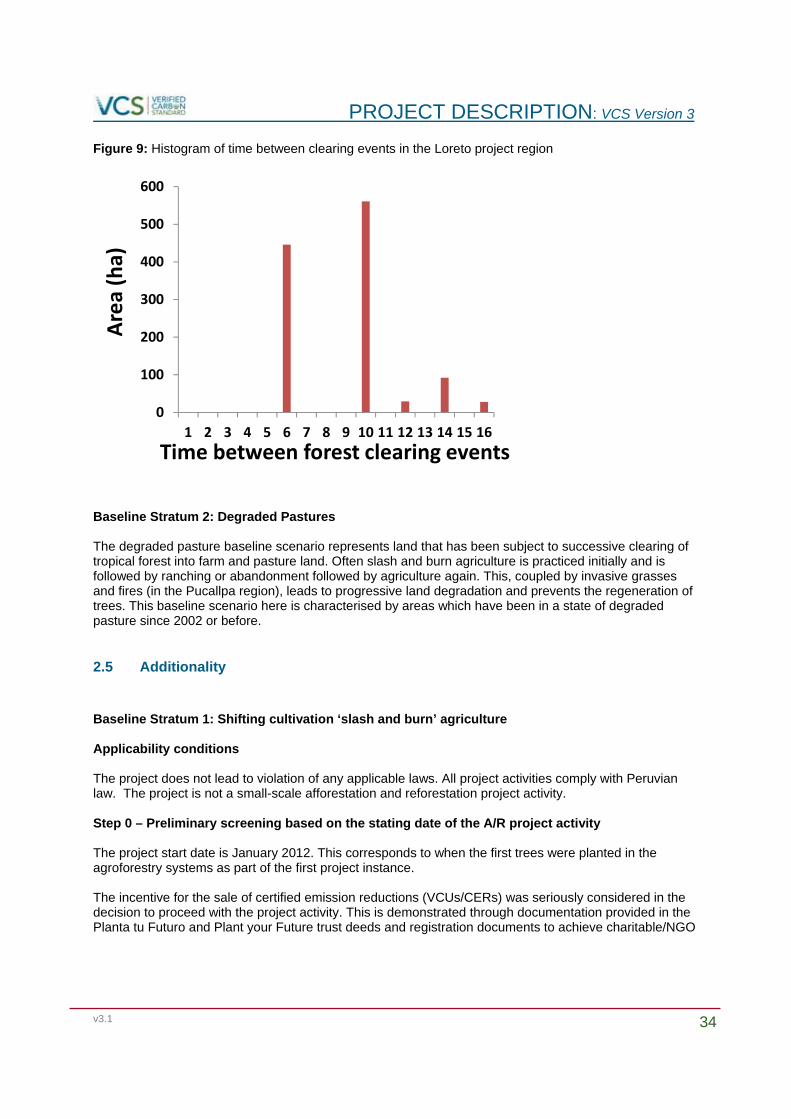
We found that all land considered for the project was in the ‘shifting forest/non-forest’ class, and thus all land was deemed to be qualified under this baseline scenario. As a further check, we also individually examined 0.8 m resolution IKONOS data from 2002 and 2010 for all parcels where it was available to confirm that the project parcels within the land of each farmer did not overlap with any undisturbed forest areas, but were instead on areas used for agriculture or in early stages of fallow in both dates. Furthermore, we wished to use these satellite classifications to determine the average time spent between clearing events. This is known to vary considerably, from as little as 2 years to as much as 15 years. While we placed field plots in a range of fallow age strata, we needed to know the mean time spent between clearing events to calculate the mean carbon storage of land in the fallow cycle. It is known that calculating the mean fallow time from interviews with farmers is very difficult, due to the long time-scales and poor sample sizes involved in such analyses. Results from such surveys are very likely to be biased. We therefore decided to use the satellite analysis to determine the mean time between clearing events, which though it has its own inaccuracies benefits from a very large sample size (millions of pixels) and an unbiased and consistent picture of the recent past. To perform this analysis we calculated the number of years between clearing events for areas of forest that had been cleared at least twice during 1995-2011 (the longest range available from satellite data). As annual data is not available there is limited temporal resolution in this analysis – the minimum time between clearing visible is the shortest distance between 3 images (6 years, for land that was non-forest in 2005, fallow in 2009 and non-forest again in 2011), and the longest time possible was 16 years (non-forest in 1995, forest at some point in between, and non-forest again in 2011). However, we believe most land is cleared between these extremes, so this represents a reasonable dataset for calculating the mean time between clearing events. The result was a mean time between clearing events of 8.97 years for the project area, based on a dataset of 1 156 ha of land that was cleared at least twice. The results are shown in Figure 9.
PROJECT DESCRIPTION: VCS Version 3
v3.1 34
Figure 9: Histogram of time between clearing events in the Loreto project region
0
100
200
300
400
500
600
1 2 3 4 5 6 7 8 9 10 11 12 13 14 15 16
Area (ha)
Time between forest clearing events
Baseline Stratum 2: Degraded Pastures The degraded pasture baseline scenario represents land that has been subject to successive clearing of tropical forest into farm and pasture land. Often slash and burn agriculture is practiced initially and is followed by ranching or abandonment followed by agriculture again. This, coupled by invasive grasses and fires (in the Pucallpa region), leads to progressive land degradation and prevents the regeneration of trees. This baseline scenario here is characterised by areas which have been in a state of degraded pasture since 2002 or before.
2.5 Additionality
Baseline Stratum 1: Shifting cultivation ‘slash and burn’ agriculture Applicability conditions The project does not lead to violation of any applicable laws. All project activities comply with Peruvian law. The project is not a small-scale afforestation and reforestation project activity. Step 0 – Preliminary screening based on the stating date of the A/R project activity The project start date is January 2012. This corresponds to when the first trees were planted in the agroforestry systems as part of the first project instance. The incentive for the sale of certified emission reductions (VCUs/CERs) was seriously considered in the decision to proceed with the project activity. This is demonstrated through documentation provided in the Planta tu Futuro and Plant your Future trust deeds and registration documents to achieve charitable/NGO

PROJECT DESCRIPTION: VCS Version 3
v3.1 35
status, as well as grant applications and trustee meeting minutes. The planned sale of emission reductions has been a key part of the project design and the decision to proceed with the activity16.
16 See England and Wales Charity Commission entry for PyF http://www.charitycommission.gov.uk/find-
charities/ The Charity has been officially registered since March 9th 2010.

PROJECT DESCRIPTION: VCS Version 3
v3.1 36
Step 1: Identification of alternative land use scenarios to the proposed A/R CDM project activity The study “Ecological and Economic Micro-Zoning for the Sustainable Development of the Iquitos-Nauta Highway area”, is currently being completed by the Regional Government of Loreto through the Research Institute of the Peruvian Amazon (IIAP). The study is in the final stages of completion and approval. A study by Ramirez in 2012 of the project zone identified a variety of different types of land-use. The list below summarises these. (Ramírez, J. 2012)
The diverse activities that constitute the zones of current use in the area around the Iquitos – Nauta road are the following (Ramírez, J. 2012):
1. Areas of intensive poultry breeding 2. Areas of intensive pig breeding 3. Areas of intensive cattle breeding 4. Areas of predominantly riparian crops in temporally flooded areas 5. Areas of predominantly lemon and papaya cultivation 6. Areas of predominantly sugar cane cultivation 7. Areas of predominantly huasaí and pijuayo cultivation for palm / palm heart 8. Areas of predominantly oil palm and sacha inchi cultivation 9. Areas of predominantly coca cultivation 10. Areas of predominantly subsistence crops 11. Areas of predominantly fruit cultivation in family gardens 12. Areas of new farm plots and in preparation 13. Areas of secondary forest (fallow) left idle 14. Areas of legal forest exploitation in concessions 15. Areas of informal harvesting of forest products 16. Areas of predominantly fish farms 17. Area for recreation and tourism
The sizes of the areas and their locations are variable. The study is still in its final stage of approval, any may be further updated. However the details of the areas can already be seen in the following map.
(Figure 10)

PROJECT DESCRIPTION: VCS Version 3
v3.1 37
Figure 10: Current land use in the area of the Iquitos- Nauta Highway

PROJECT DESCRIPTION: VCS Version 3
v3.1 38
The following realistic and credible alternatives to the proposed project activity area identified:
1. Scenario A) Continuation of project-project land use (subsistence crop cultivation using slash and burn techniques)
Slash and burn agriculture for the production of short-term subsistence crops such as manioc, banana, corn, pineapple and rice has been the traditional dominant rural activity in the project area and much of the Peruvian Amazon for decades. As described in the socio-economic study for the Iquitos-Nauta project instance this is currently the principle activity for the population of the area in terms of livelihood and income. The project area is of low fertility so farmers practice shifting cultivation. (Mateo, 2013, Rafael, 2012) According to the Master Plan for the RNAM the shifting cultivation agricultural activity of the area is characterized by small-scale manual agriculture, with traditional ‘slash and burn’ is employed for the rotation of crops. (INRENA, 2005) This involved the clearing of rainforest for agriculture, the cultivation of short term crops, the temporary abandoning of plots, the growth of fallow vegetation and the repeated deforestation of the area, and growing of crops. The application of chemical of organic fertilizers in not practiced.
2. Scenario B) Forestation of the land within the project boundary performed without being
registered as the A/R CDM project activity - reforestation of the project area through installation of agroforestry systems
The installation of mixed species agroforestry systems has occurred in the Loreto region in the past on a small-scale. There are few successful examples of financially sustainable agroforestry systems. Agroforestry has been implemented linked to short-term, limited NGO and regional government funded programmes with smallholder farmers. These systems generally incorporate the planting of a large range of fruit tree species – often over 10 different types of fruits in one hectare. Funds have generally been for installation of agroforestry systems, but not for the maintenance and management of systems until they start to produce an income. That has led to the abandonment of most agroforestry systems by the farmers following the initial installation, as they don’t have the resources or necessary support to continue with the systems (Acosta, 2011).There is considerable evidence that farmers lack funds to install agroforestry systems themselves, with all previous agroforestry projects we are aware of being linked to either NGO or government funded programs (Mateo, 2013). The commercial success of agroforestry systems also depends on the ability of farmers to market their products. Due to the basic level of education of smallholder farmers, coupled with their general past experience of only subsistence level trade farmers have not successfully marketed their products. The trend of failure of previously agroforestry initiatives (government or otherwise) has resulted in a loss of confidence in such projects amongst farmers. A top-down, short term, non-market orientated approach has characterised agroforestry systems the past, which has result in them being unsuccessful and largely abandoned.
3. Scenario C) Forestation of the land within the project boundary performed without being registered as the A/R CDM project activity - reforestation of the project area through direct planting with timber species without being registered as a VCS project activity
Because of the large areas of existing tropical forest in Loreto the reforestation of degraded cropland is not a common practice. There is no legal requirement to reforest in the Loreto region of Peru following use of the land for agriculture. There has been limited reforestation with timber species in the Loreto region, but in general the trend is for a reduction of forest cover in the region. Reforestation through human-assisted natural regeneration requires capital investment to plant the trees, as well as financing to maintain the trees, and carry out required silvicultural activities. The potential for timber revenues in the medium to long term are quite high, but the farmer needs a short term activity and technical support, which makes this kind of investment almost impossible. (Mateo, 2013) Outcome of sub-step 1a:

PROJECT DESCRIPTION: VCS Version 3
v3.1 39
List of alternative land use scenarios that would have occurred on the land within the project boundary of the ARR VCS project activity.
Land use scenario a) Continuation of pre-project land use (subsistence crop cultivation using slash and burn techniques with an average turnover time of 9 years)
Land use scenario b) Forestation of the land within the project boundary performed without being registered as the A/R CDM project activity - reforestation of the project area through installation of agroforestry systems
Land use scenario c) Forestation of the land within the project boundary performed without being registered as the A/R CDM project activity - reforestation of the project area through direct planting with timber species without being registered as a VCS project activity
Sub-step 1b: Consistency of credible land use scenarios with enforced mandatory applicable laws and regulations
Land use scenario a) Continuation of pre-project land use (subsistence crop cultivation using slash and burn techniques)
This land use is in compliance with legal and regulatory requirements. Land use scenario b) Forestation of the land within the project boundary performed without being
registered as the A/R CDM project activity - reforestation of the project area through installation of agroforestry systems
This land use is in compliance with legal and regulatory requirements. Reforestation is not mandated by any enforced law, statute or other regulatory framework. Land use scenario c) Forestation of the land within the project boundary performed without being
registered as the A/R CDM project activity - reforestation of the project area through direct planting with timber species without being registered as a VCS project activity
This land use is in compliance with legal and regulatory requirements. Reforestation is not mandated by any enforced law, statute or other regulatory framework.
Outcome of sub-step 1b: List of alternative land use scenarios to the VCS ARR project activity that are in compliance with mandatory legislation and regulations taking into account their enforcement in the region or country and ED decisions on national and/or sectoral policies and regulations.
Land use scenario a) Continuation of pre-project land use (subsistence crop cultivation using slash and burn techniques)
Land use scenario b) Forestation of the land within the project boundary performed without being registered as the A/R CDM project activity - reforestation of the project area through installation of agroforestry systems
Land use scenario c) Forestation of the land within the project boundary performed without being registered as the A/R CDM project activity - reforestation of the project area through direct planting with timber species without being registered as a VCS project activity
Step 2: Barrier Analysis Sub-step 2a. Identification of barrier that would prevent the implementation of at least one alternative land use scenarios.
PROJECT DESCRIPTION: VCS Version 3
v3.1 40
Land use scenario a) Continuation of project-project land use (subsistence crop cultivation using slash and burn techniques)
This scenario is not prevented by any barrier, it is the current dominant land use, and the one that has been practiced for decades in the Iquitos-Nauta highway region, and project area.
Land use scenario b) Forestation of the land within the project boundary performed without being registered as the A/R CDM project activity - reforestation of the project area through installation of agroforestry systems
Agroforestry projects which have been implemented in the past in the project zone have been implemented with grants or other non-commercial finance. The grant financing for these agroforestry has always been short-term and past agroforestry systems have not been specifically designed to be sustainable, and are not market-orientated. This has meant agroforestry systems installed in the past by grant financing have in their majority been abandoned by farmers. Smallholder farmers face barriers to implementing agroforestry systems themselves because of various reasons: Investment barriers: Installing and maintaining agroforestry systems has a high upfront cost, especially in the first three years. Smallholder farmers cannot access debt, loan or credit financing (Mateo, 2013) or private capital to install agroforestry systems. Access to grants from other NGOs or regional government is also limited, and farmers have grown tired, and skeptical of these grants given past experiences of failure in the region given the short term nature of the grants, to only help with installing agroforestry systems, and not maintaining them over the long term. (Acosta, 2011). Furthermore, many farmer communities are very remote with very poor access infrastructure: such villages, which are included in this project, have very little contact with regional government or NGO’s. Thus even if suitable grant programs existed they would be very unlikely to be used by these farmers. Technological barriers: Farmers lack access to necessary materials to install agroforestry systems, such as nurseries, pest control technologies, silvi-cultural for maintenance and harvesting techniques. Farmers lack of institutional and business infrastructure such as trade associations and a business and sales plan to market the agroforestry products in a commercially viable manner. The lack of baseline knowledge here cannot be overstated: there is no field manual for agroforestry systems in Peru, very little data on tree growth rates, ideal planting densities, necessary pesticide and fertilizer applications etc. Farmers need direct assistance and supervision from technical experts to create successful agroforestry systems. Barriers related to prevailing practice and local tradition: The smallholder farmers living in the project area depend on the crops produced from their land for their subsistence. Farmers live off the crops for food, and with the extra income they make from the sale of crops they have enough to meet only basic needs. Farmers live in poverty, and few are able to save money beyond that for ‘emergencies’. (Mateo, 2013, Ramirez, 2012) Given this farmers live with a ‘day-to-day’ focus, focusing on activities that generate an income within a relatively short time period. The trajectory for installing traditional agroforestry systems requires looking beyond the immediate time frame which the smallholder farmers do not generally do. Farmers know installing agroforestry systems is a medium to long-term investment with high upfront costs so this is not a traditional practice for them. Without the project VCS ARR project activity, there are barriers to implementing agroforestry systems in the project area.
Land use scenario c) Forestation of the land within the project boundary performed without being registered as the A/R CDM project activity - reforestation of the project area through direct planting with timber species without being registered as a VCS project activity
Investment barriers: The implementation of reforestation with timber species through direct planting is very costly (minimum $2,500 for installation of one hectare of reforestation at a small to medium scale). Reforestation of this type requires considerable investment in the initial years to implement the activity; namely planting costs,
PROJECT DESCRIPTION: VCS Version 3
v3.1 41
maintenance, pest control, weeding, fertilisation and silvi-cultural activities. This type of reforestation project requires considerable up-front financing with only long-term returns for the farmer. Smallholder farmers do not have access to the funds necessary to support this type of activity. Smallholder farmers cannot access loan capital (Mateo, 2013) and there are no accessible grants currently available to farmers in Loreto for this activity. Farmers have extremely low incomes, have little capital and do not know how to invest it, or are afraid to do so (Mateo, 2013, Gómez Romero & Ortiz, 1998). They do not even have funds to pay for additional manual labour on the land, so paying for costly reforestation is not possible. (Mateo, 2013) There is also traditionally very little culture in Peru of investment in plantation forestry. There are no funds in Peru to develop forestry projects. Resources are limited from the state even for established private companies; making access for smallholders impossible.17 Technological barriers: Smallholders also face technological barriers to manage a timber plantation on their land, as they don’t have access to the technical specifications on how to manage and maintain the systems. They lack the necessary materials such as nursery equipment, silvicultural tools, harvesting systems, fire control and pest control systems. Barriers related to prevailing practice and local tradition: Traditional knowledge of smallholders is not orientated to plantation management, and it is not a prevailing local practice to establish a timber plantation on deforestation lands in the project area, or Loreto more generally. As a result of these barriers it is not possible for smallholders to carry out forestation on their land with timber species. Outcome of Sub-step 2b: List of land use scenarios that are not prevented by any barrier:
Land use scenario a) Continuation of pre-project land use (subsistence crop cultivation using slash and burn techniques)
17 VCS Validated Project Description: ALTO HUAYABAMBA:CARBON DIOXIDE SEQUESTRATION
THROUGH REFORESTATION WITH SMALL-SCALE FARMERS IN PERU, SAN MARTIN REGION
PROJECT DESCRIPTION: VCS Version 3
v3.1 42
Sub-step 2c. Determination of baseline scenario Table 7 Application of Problem Tree Is forestation without being registered as an A/R CDM project activity included in the list of land use scenarios that are not prevented by any barrier? YES Does the list contain only one land use scenario? YES If Yes, then the remaining land use is the baseline scenario. Baseline scenario = Land use scenario a) Continuation of pre-project land use (subsistence crop cultivation using slash and burn techniques) Continue with Step 4: Common practice test Step 4: Common practice analysis There have been programmes to install agroforestry systems in the past in Loreto, including in the project zone. They have not been successful in improving farmers’ livelihoods, and have largely been abandoned. There have been examples of 9 agroforestry projects led by 9 different institutions over the last 30 years around the broad project zone of the Iquitos-Nauta highway. These were implemented through a mixture of NGO’s and regional government programmes namely: San Roque – INIA, CARITAS, OTAE, TOLERANCE, GOREL (Regional Government of Loreto)-United Nations Programme, INCAGRO, IIAP, FINCYT. (Acosta, 2011) Of these 9 programmes one was purely for research purposes (i.e. the establishment of an experimental system), three were for research carried out on farmers land, one was related to technology transfer and 4 were for the purposes of production. All of these past experiences with agroforestry were orientated to the generation of agricultural and forest products, but without defining ahead of time what would be done with the produce – i.e. there was no strategy for harvesting, processing, marketing or sales. None of these 9 projects were oriented to the sale of products, or income generation at the regional, national or international level. Most of the project experimented with a very large range of different species within one hectare, resulting low quantities of any one species. This ultimately resulted in frustration and disappointment amongst the farmers that participated in these schemes. It led to a loss of confidence and credibility of the farmers in regional institutions, as the farmers were not able to sell the products from their agroforestry systems and so they did not see the revenues or incomes that were mentioned at the start of these different agroforestry projects. The choice of species for use in agroforestry systems is arguable one of the major downfalls of existing systems to improve farmers’ livelihoods. The criteria for selecting species to grow in agroforestry systems of these 9 past projects has been related to whether they are found in the forests surrounding the project zone, suitable soils, availability of some information on how to cultivate the species- i.e. criteria were mainly related to ensuring there were conditions in which the species could grow, rather than any consideration of whether there was a market for the products of the chosen species. (Acosta, 2011) The lack of on-going support and non-market focus of other agroforestry systems has resulted in most of the agroforestry systems implemented by other NGOs and regional government in the project zone being abandoned. A common aspect in all these projects is that the plots with the smallholders were on average 1 hectare in size, and the project provided technical assistance, monitoring and evaluation for a maximum

PROJECT DESCRIPTION: VCS Version 3
v3.1 43
of 3 years. In some case this support was for less time, such as just one or two years. After this the farmer was left to his own devices, and expected to continue activities alone. No support was given after this time for on-going maintenance costs, silvicultural support, pest control advice on marketing the crops or harvesting. (Acosta, 2011) All the current agroforestry programmes mentioned above have in any case come to an end, with no further funding for them. There are currently not other funding opportunities for smallholder farmers to implement agroforestry systems. In contrast the Plant you Future financially sustainable agroforestry systems are distinct in a number of ways. The other agroforestry systems were implemented in the past, through funding streams which have now finished and are no longer available. The Plant your Future systems are fundamentally distinct in their design to past systems in five key ways:
i) The Plant your Future model is to provide support over the project duration orientated to on-going maintenance and support to the smallholders;
ii) The systems will generate carbon revenues which will be divided between the farmers and the project to fund the maintenance of the systems, expand systems and provide the farmer an additional income;
iii) The Plant your Future systems are market-orientated, with a business plan and strategy developed to sell the fruits from trees in the systems;
iv) The project will work with farmers to harvest, process, sell and coordinate product sales. Baseline Stratum 2: Degraded Pastures Step 0 – Preliminary screening based on the stating date of the A/R project activity The project start date is January 2012. This corresponds to when the first trees were planted in the agroforestry systems as part of the first project instance. The incentive for the sale of certified emission reductions (VCUs/CERs) was seriously considered in the decision to proceed with the project activity. This is demonstrated through documentation provided in the Planta tu Futuro and Plant your Future trust deeds and registration documents to achieve charitable/NGO status, as well as grant applications and trustee meeting minutes. The planned sale of emission reductions has been a key part of the project design and the decision to proceed with the activity18. Step 1: Identification of alternative land use scenarios to the proposed A/R CDM project activity Analysis of historical and current land use In the Pucallpa region over at least the last ten years there has been a successive clearing of tropical forest into farm and pasture land. Traditional slash-and-burn agriculture is practiced followed by ranching or abandonment followed by agriculture again. Over time invasive grasses have come to dominate the pasture. The combination of this grass, grazing, and fires has led to progressive land degradation and prevents the regeneration of trees. Of the roughly 600,000 hectares surrounding Pucallpa, more than 56% of the forest has been converted to either agriculture or grazing lands. Research by INRENA19 found the area deforested in Ucayali to be 608,917 ha in 1995 and 956,262 ha by 2002. Prior to land use conversion, the project area contained high carbon stock tropical forest. Since this land use conversion, estimated to have taken place in the 1960’s, the area has remained at a low carbon state of unproductive
18 See England and Wales Charity Commission entry for PyF http://www.charitycommission.gov.uk/find-
charities/ The Charity has been officially registered since March 9th 2010. 19 InstitutoNacionaldeRecursosNaturales,MinisteriodeAgriculturadePeru,2005.PlanNacionaldeReforestacion.
PROJECT DESCRIPTION: VCS Version 3
v3.1 44
pasture land. A report by WWF found that prior to the Campo Verde-Tornavista road, the region was covered by tropical forest and has been becoming deforested overtime since the road opened20. Assessment of the national and/or sectoral policies Although there are national policies that promote the reforestation of degraded zones, there are no financial resources provided for the reforestation with native species. In Peru Law 28852, the State has not allocated any resources for the reforestation of such degraded lands.21 As for the degraded areas in private lands, the State has not promoted reforestation. Therefore, without the proposed project activity the project area would not be reforested. Assessment of alternative land use scenarios According to INRENA and PROCLIM, 22 in Ucayali the annual deforestation rate was almost 8,000 hectares during the 1990-2000 period. The majority of this deforestation is attributed regionally to deforestation for smallholder shifting cultivation (INRENA) 23 . The unsustainable land use practices common in the region have led to the creation of large areas of degraded lands such as those in the project area. Analysis of Landsat imagery from 1996 and 2006 show that in the Pucallpa region, areas that were non-forested in the past have remained unforested. The following realistic and credible alternatives to the proposed project activity area identified: Land use scenario a: Continuation of pre-project land use: unproductive pastureland As detailed in Section 1.4, the lands to be reforested are abandoned degraded pastures with some herbaceous vegetation and few trees. These lands currently support little activity, apart from low-density cattle grazing. This area has remained in a state of degraded pastureland since the 1980’s. There have been no ecological changes that would result in a change in the current land use except the possible further degradation due to continued grazing and fires. Interviews with local officials and project stakeholders indicate that there is no common practice of converting unproductive pastureland into another land use. There is no evidence that pastureland will revert to forest in the short- to medium- term in the absence of human activity. This activity is widespread along the Federico Basadre and Tornavista highways. The neighbouring lands are also under low level grazing lands. Land use scenario b: Commercial cattle ranching The last commercial activity in the project area was commercial cattle grazing. However, this commercial cattle ranching was abandoned many years ago due to the economic downturn and terrorist activity, and was not re-established due to its degraded state and prospect of low returns. At the regional level, the Ucayali Government promotes the development of cattle grazing projects by giving concessional financing to the developers. Intensive management of the pastureland via suppression of the invasive grass, planting of additional forage plants, and rotational grazing could be instituted in this area. However, improved grazing management is not a common practice in the region. Land use scenario c: Crop production
20 WWF Peru. 2003. Analysis de cambios de paisaje: Tournavista‐Campo Verde y su area de influencia. Pérdida y Fragmentación de Bosques : (1963 – 2000)
21 InstitutoNacionaldeRecursosNaturales,MinisteriodeAgriculturadePeru,2005.PlanNacionaldeReforestacion.
22Jorge Elgegren, La Deforestacion en el Peru, Paracas, October 2005 based on official statistics of INRENA and PROCLIM 23 Jorge Elgegren, La Deforestacion en el Peru, Paracas, October 2005 based on official statistics of INRENA and PROCLIM
PROJECT DESCRIPTION: VCS Version 3
v3.1 45
Although this area may have supported crop production in the past, the area has been under pasture for over ten years. Due to the degraded nature of the pasture area, agricultural production would result in low yields. This degraded land cover is very common in the region. The Peruvian National Plan for Reforestation24 found that 966,191 hectares were deforested in 2005 and only 57% was being worked. The other 43% were abandoned. Land use scenario d: Afforestation/reforestation of the project area through direct planting without being registered as a VCS project activity Because of the large area of existing tropical forest surrounding the Pucallpa region, afforestation or reforestation of existing pastureland is not a common practice. There is no legal requirement to reforest in the Ucayali region of Peru. There has been virtually no reforestation or afforestation via large scale commercial forestry in the Pucallpa region. According to INRENA from 2001-2006 only 196 hectares of land have been reforested in the Ucayali Region. Land use scenario e: Afforestation/reforestation of the project area through human-assisted natural regeneration without being registered as a VCS project activity There is no legal requirement to reforest in the Ucayali region of Peru. There has been virtually no reforestation or afforestation in the Pucallpa region. According to INRENA from 2001-2006 only 196 hectares of land have been reforested in the Ucayali Region. Reforestation through human-assisted natural regeneration requires capital investment in land management and fire fighting activities. The potential for timber returns from such an activity are unknown. Outcome of sub-step 1a:
Land Use Scenario a: Unproductive pastureland Land Use Scenario b: Commercial cattle grazing Land Use Scenario c: Crop production Land Use Scenario d: Reforestation through direct planting without registration as a VCS Project Land Use Scenario e: Reforestation through human-assisted natural regeneration without registration as a VCS Project
Sub-step 1b: Consistency of credible land use scenarios with enforced mandatory applicable laws and regulations Land Use Scenario a: Unproductive pastureland
The current land use is in compliance with all legal and regulatory requirements. Land Use Scenario b: Commercial cattle grazing
At the regional level, the Ucayali Government promotes the development of cattle grazing projects by giving concessional financing to the developers. However, there is no legal regulation requiring cattle grazing take place in the project area.
Land Use Scenario c: Agricultural production There are no legal or regulatory requirements blocking or requiring the proposed project area used for crop production.
Land Use Scenario d: Afforestation without registration as a VCS Project At the national level, Peru has a reforestation plan aimed at promoting plantations with commercial purposes and basin conservation purposes. However this plan lacks resources, organisation and funding to support implementation, and no activities have been witnessed in Ucayali to date. Afforestation is not mandated by any enforced law, statute, or other regulatory framework25
24 InstitutoNacionaldeRecursosNaturales,MinisteriodeAgriculturadePeru,2005.PlanNacionaldeReforestacion. 25 VCS Additionality Project Test: Step 2: Regulatory Surplus (Section 5.8 of VCS 2007.1)
PROJECT DESCRIPTION: VCS Version 3
v3.1 46
Land Use Scenario e: Reforestation through assisted-natural regeneration without registration as a VCS Project
Afforestation is not mandated by any enforced law, statute, or other regulatory framework26 Outcome of sub-step 1b: Land Use Scenario a: Unproductive pastureland Land Use Scenario b: Commercial cattle grazing Land Use Scenario c: Agricultural production Land Use Scenario d: Reforestation through direct planting without registration as a VCS Project Land Use Scenario e: Reforestation through human-assisted natural regeneration without registration as a VCS Project Step 2: Barrier Analysis Sub-step 2a. Identification of barrier that would prevent the implementation of at least one alternative land use scenarios. The proposed project activities face barriers that prevent the implementation of the agroforestry systems. However, the most likely baseline scenario, unproductive pastureland, does not face any barriers to implementation. Investment Barriers: Public funding for reforestation activities in the Ucayali region is almost non-existent. In the 2008 Ucayali’s budget, funding for reforestation projects of native species was not considered while funding for reforestation of fast-growth species and for the recovery of degraded areas sums S/. 780,000 (seven hundred and eighty thousand Nuevos Soles) less than 1% of Ucayali’s budget.27 Funding from commercial banks is very limited as well. According to the USAID report Rural and Agricultural Finance: Emerging Practices from Peruvian Financial Institutions, “the formal financial system in Peru, all entities regulated by the Superintendency of Banks and Insurance, provides very limited rural and agricultural finance services and most financial institutions focus uniquely on serving urban clients”.28 The banks that do provide rural and agricultural finance require a repayment period not longer than 3 years29. Moreover, COFIDE, the government sponsored Peruvian development bank, offers funding for projects for up to 10 years only30. Technological Barrier: Smallholder farmers lack access to necessary materials to install agroforestry systems, such as nurseries, pest control technologies, silvi-cultural for maintenance and harvesting techniques. Currently, a combination of fires, grazing, and invasive grass species prevents any natural regeneration of the pastures. Smallholders lack the resources to prepare the lands for reforestation without technical assistance and financial resources from the project. Currently fires are common and caused by human
26 VCS Additionality Project Test: Step 2: Regulatory Surplus (Section 5.8 of VCS 2007.1)
27 Congreso de la Republica de Peru, 2008. Presupuesto Publico 2008. http://www.congreso.gob.pe/comisiones/2007/presupuesto/libro/TOMO1/25_Ucayali.pdf
28USAID,microNOTE#27,RuralandAgriculturalFinance:EmergingPracticesfromPeruvianFinancial Institutions, April, 2007. http://pdf.usaid.gov/pdf_docs/PNADI834.pdf 29FoodandAgricultureOrganizationof theUnitedNations,2008.Peru: la industriade lanuezdeBrasilenMadrededios.ftp://ftp.fao.org/docrep/fao/010/a0226s/a0226s08.pdf
30COFIDE,2009.Productosyserviciosfinancieroshttp://www.cofide.com.pe/productos2.html

PROJECT DESCRIPTION: VCS Version 3
v3.1 47
activities. MODIS HotSpot fire maps show the occurrence of fire in the region31 . Farmers need assistance to be able to install agroforestry systems in terms of preparing the land, especially overcoming the invasive grasses and also implementing strategies to prevent fire on their land destroying the reforestation activities. This is not possible without technical support and financing. Farmers also lack institutional and business infrastructure such as trade associations and a business and sales plan to market the agroforestry products in a commercially viable manner. Barriers related to prevailing practice and local tradition: The smallholder farmers living in the project area depend on the crops produced from their land for their subsistence as well as revenues from cattle grazing. Farmers live off the land, and with the extra income they make they have enough to meet only basic needs. Farmers live in poverty, and few are able to save money beyond that for ‘emergencies’. (Mateo, 2013, Ramirez, 2012) Given this farmers live with a ‘day-to-day’ focus, focusing on activities that generate an income within a relatively short time period. The trajectory for installing traditional agroforestry systems requires looking beyond the immediate time frame which the smallholder farmers do not generally do. Farmers know installing agroforestry systems is a medium to long-term investment with high upfront costs so this is not a traditional practice for them. Without the project VCS ARR project activity, there are barriers to implementing agroforestry systems in the project area. Outcome of Sub-step 2b: List of land use scenarios that are not prevented by any barrier: Land use scenario a: Continuation of pre-project land use: unproductive pastureland Sub-step 2c. Determination of baseline scenario (if allowed by the barrier analysis)
31 Information for Resource Management System, University of Maryland, 2009. Web Fire Mapper: South America. http://maps.geog.umd.edu/firms/

PROJECT DESCRIPTION: VCS Version 3
v3.1 48
Table 8 Application of Problem Tree Is forestation without being registered as an A/R CDM project activity included in the list of land use scenarios that are not prevented by any barrier? YES Does the list contain only one land use scenario? YES If Yes, then the remaining land use is the baseline scenario. Baseline scenario = scenario a: Continuation of pre-project land use: unproductive pastureland Continue with Step 4: Common practice test Step 4: Common practice analysis Agroforestry implemented on degraded pasturelands is not commonly practiced in the Pucallpa region. According to INRENA,32 for the period 2001-2006, only 196 hectares have been reforested in Ucayali Region. Therefore, there are no similar forestation activities in the Pucallpa region that can be compared. The Plant your Future systems are fundamentally distinct in their design to past systems in five key ways:
i) The Plant your Future model is to provide support over the project duration orientated to on-going maintenance and support to the smallholders;
ii) The systems will generate carbon revenues which will be divided between the farmers and the project to fund the maintenance of the systems, expand systems and provide the farmer an additional income;
iii) The Plant your Future systems are market-orientated, with a business plan and strategy developed to sell the fruits from trees in the systems;
iv) The project will work with farmers to harvest, process, sell and coordinate product sales. v) The agroforestry systems focus on a small number of species, meaning higher volumes to supply
market demand, increasing commercialization potential.
2.6 Methodology Deviations
No methodology deviations are requested
3 QUANTIFICATION OF GHG EMISSION REDUCTIONS AND REMOVALS
3.1 Baseline Emissions
Estimation of baseline emissions from the ‘slash-and-burn’ baseline scenario
32 Jorge Elgegren, La Deforestacion en el Peru, Paracas, October 2005 based on official statistics of INRENA and PROCLIM
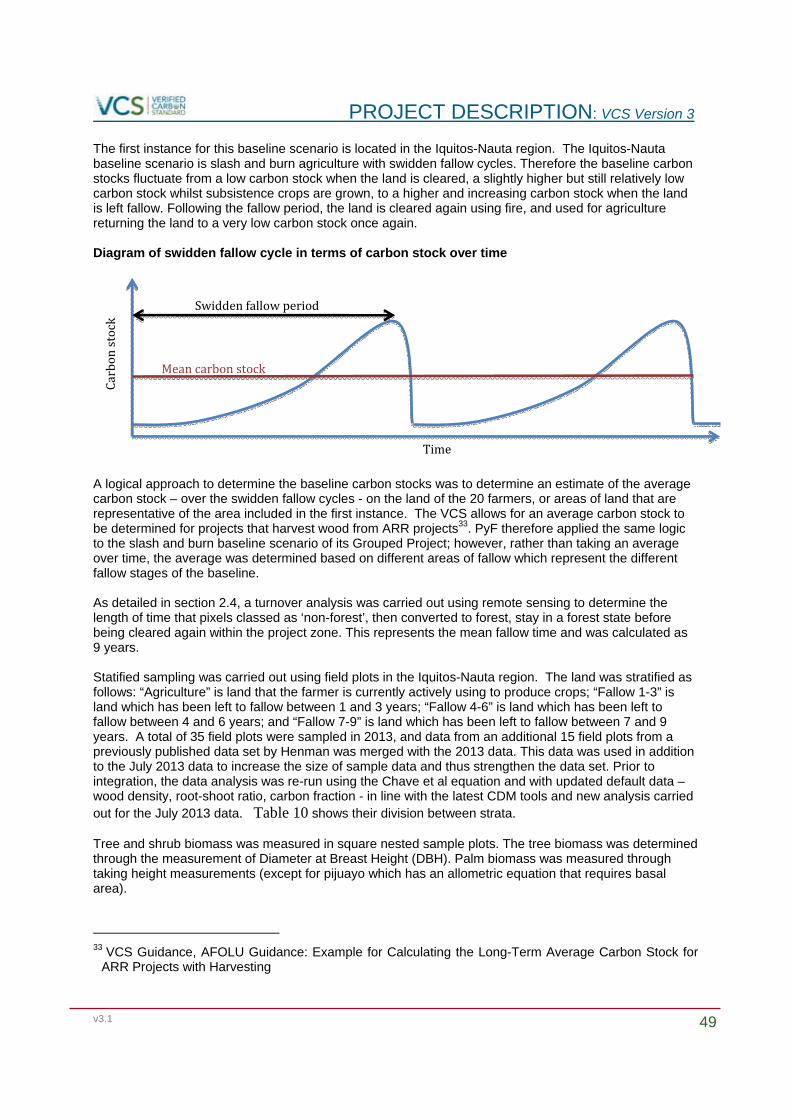
PROJECT DESCRIPTION: VCS Version 3
v3.1 49
The first instance for this baseline scenario is located in the Iquitos-Nauta region. The Iquitos-Nauta baseline scenario is slash and burn agriculture with swidden fallow cycles. Therefore the baseline carbon stocks fluctuate from a low carbon stock when the land is cleared, a slightly higher but still relatively low carbon stock whilst subsistence crops are grown, to a higher and increasing carbon stock when the land is left fallow. Following the fallow period, the land is cleared again using fire, and used for agriculture returning the land to a very low carbon stock once again. Diagram of swidden fallow cycle in terms of carbon stock over time
A logical approach to determine the baseline carbon stocks was to determine an estimate of the average carbon stock – over the swidden fallow cycles - on the land of the 20 farmers, or areas of land that are representative of the area included in the first instance. The VCS allows for an average carbon stock to be determined for projects that harvest wood from ARR projects33. PyF therefore applied the same logic to the slash and burn baseline scenario of its Grouped Project; however, rather than taking an average over time, the average was determined based on different areas of fallow which represent the different fallow stages of the baseline. As detailed in section 2.4, a turnover analysis was carried out using remote sensing to determine the length of time that pixels classed as ‘non-forest’, then converted to forest, stay in a forest state before being cleared again within the project zone. This represents the mean fallow time and was calculated as 9 years. Statified sampling was carried out using field plots in the Iquitos-Nauta region. The land was stratified as follows: “Agriculture” is land that the farmer is currently actively using to produce crops; “Fallow 1-3” is land which has been left to fallow between 1 and 3 years; “Fallow 4-6” is land which has been left to fallow between 4 and 6 years; and “Fallow 7-9” is land which has been left to fallow between 7 and 9 years. A total of 35 field plots were sampled in 2013, and data from an additional 15 field plots from a previously published data set by Henman was merged with the 2013 data. This data was used in addition to the July 2013 data to increase the size of sample data and thus strengthen the data set. Prior to integration, the data analysis was re-run using the Chave et al equation and with updated default data – wood density, root-shoot ratio, carbon fraction - in line with the latest CDM tools and new analysis carried out for the July 2013 data. Table 10 shows their division between strata. Tree and shrub biomass was measured in square nested sample plots. The tree biomass was determined through the measurement of Diameter at Breast Height (DBH). Palm biomass was measured through taking height measurements (except for pijuayo which has an allometric equation that requires basal area).
33 VCS Guidance, AFOLU Guidance: Example for Calculating the Long-Term Average Carbon Stock for
ARR Projects with Harvesting
Carbonstock
Time
Swiddenfallowperiod
Meancarbonstock
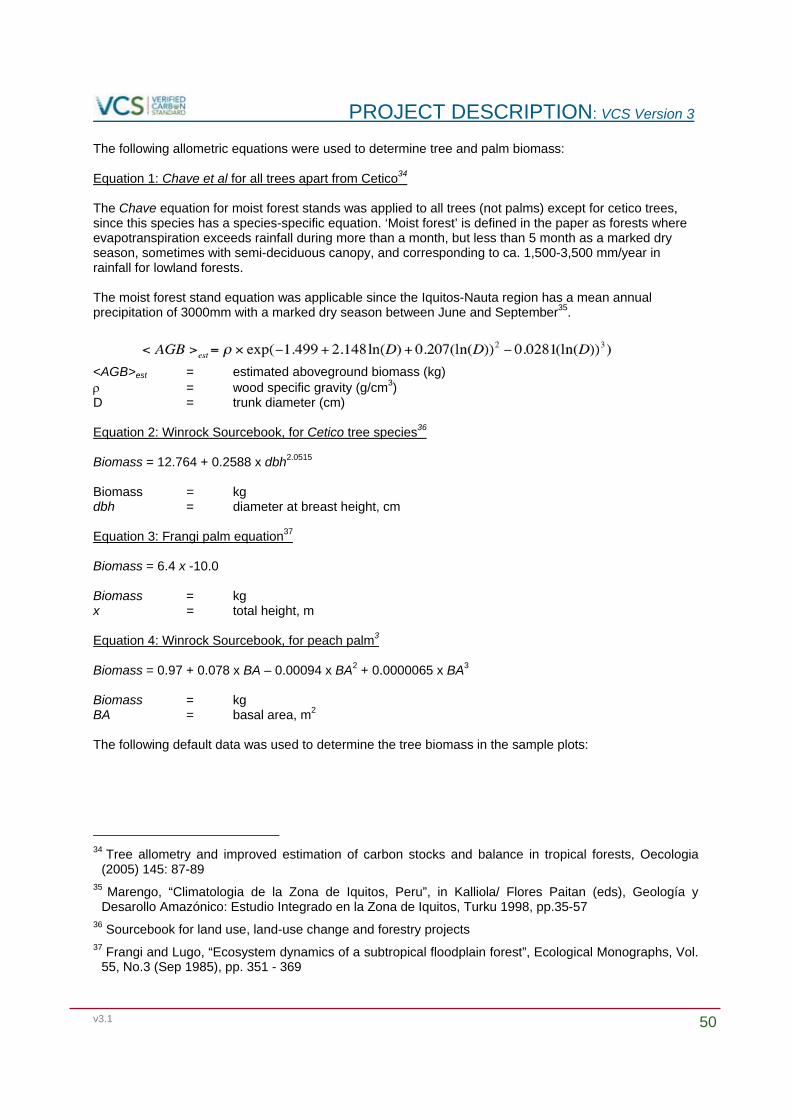
PROJECT DESCRIPTION: VCS Version 3
v3.1 50
The following allometric equations were used to determine tree and palm biomass: Equation 1: Chave et al for all trees apart from Cetico34 The Chave equation for moist forest stands was applied to all trees (not palms) except for cetico trees, since this species has a species-specific equation. ‘Moist forest’ is defined in the paper as forests where evapotranspiration exceeds rainfall during more than a month, but less than 5 month as a marked dry season, sometimes with semi-deciduous canopy, and corresponding to ca. 1,500-3,500 mm/year in rainfall for lowland forests. The moist forest stand equation was applicable since the Iquitos-Nauta region has a mean annual precipitation of 3000mm with a marked dry season between June and September35. <AGB>est = estimated aboveground biomass (kg) = wood specific gravity (g/cm3) D = trunk diameter (cm) Equation 2: Winrock Sourcebook, for Cetico tree species36 Biomass = 12.764 + 0.2588 x dbh2.0515
Biomass = kg dbh = diameter at breast height, cm Equation 3: Frangi palm equation37 Biomass = 6.4 x -10.0 Biomass = kg x = total height, m Equation 4: Winrock Sourcebook, for peach palm3
Biomass = 0.97 + 0.078 x BA – 0.00094 x BA2 + 0.0000065 x BA3 Biomass = kg BA = basal area, m2
The following default data was used to determine the tree biomass in the sample plots:
34 Tree allometry and improved estimation of carbon stocks and balance in tropical forests, Oecologia
(2005) 145: 87-89 35 Marengo, “Climatologia de la Zona de Iquitos, Peru”, in Kalliola/ Flores Paitan (eds), Geología y
Desarollo Amazónico: Estudio Integrado en la Zona de Iquitos, Turku 1998, pp.35-57 36 Sourcebook for land use, land-use change and forestry projects 37 Frangi and Lugo, “Ecosystem dynamics of a subtropical floodplain forest”, Ecological Monographs, Vol.
55, No.3 (Sep 1985), pp. 351 - 369

PROJECT DESCRIPTION: VCS Version 3
v3.1 51
Table 9: Default parameters for estimating tree carbon stocks Parameter Value Source Average wood density 0.41 t per m3 Calculated – average taken
over all species-specific wood densities – see below
Root shoot ratio for trees 0.25
CDM AR-Tool1438
Carbon Fraction 0.47 tC per t d.m Default value from CDM AR-Tool14
CO2/C 44/12
Universal constant
Specific Wood densities Species wood densities for seven of the ten most common tree species found in the baseline inventory, as well as cedrala fissilis, were applied on a species-specific basis. For the three species for which data was not found – Humanzamana, Zancudo Caspi (Alchornea triplinervia) and Pichirina (Vismia spp) – and all other species in the baseline inventory, the average of all the species-specific wood densities was taken and applied. Quality control of the biomass inventory was carried out through training, the implementation of spot checks, as well as the re-measurement of 10% of the plots. Overall the quality control results demonstrated that the measurement error of the inventory was acceptable, but that special care needed to be taken to ensure all trees were correctly monitored. Once all the data was integrated and stratified, the data was analyzed at the stratum level to determine the uncertainty of the means calculated. The CDM AR TOOL 14, requires that carbon stocks are determined to a precision level of +/- 10% uncertainty at the 90% confidence level. However, if the uncertainty of a parameter is outside of this precision level, then an uncertainty discount (uncertainty increase in the context of a baseline) can be applied – see Annex 2 of the CDM AR TOOL 14 for all uncertainty discounts/ increases. Table x shows the carbon stocks of the different strata along with their associated precision levels. Since all precision levels for all strata were above 10%, uncertainty increases had to be applied to all strata carbon stocks. In the case where an uncertainty increase of 100% had to be applied, this meant that a whole standard error needed to be added to the mean; a 75% uncertainty increase meant that 75% of a standard error needed to be added to the mean carbon stock of that specific stratum. Table 11 shows the final adjusted carbon stocks by stratum. Table 10: Carbon stocks per stratum and associated uncertainty
Stratum tCO2e Count Standard Deviation
Standard Error
Precision Level
Uncertainty Increase
Farm 14.5 15 20.1 5.2 60.2% 100% F 1-3 42.9 13 49.9 13.8 54.2% 100% F 4-6 93.4 6 67.9 27.7 49.7% 100% F 7-9 112.7 15 62.6 16.2 24.0% 75%
38 AR-TOOL14, Methodological tool: Estimation of carbon stocks and change in carbon stocks of trees
and shrubs in A/R CDM project activities, Version 04.1 http://cdm.unfccc.int/methodologies/ARmethodologies/tools/ar-am-tool-14-v4.1.pdf
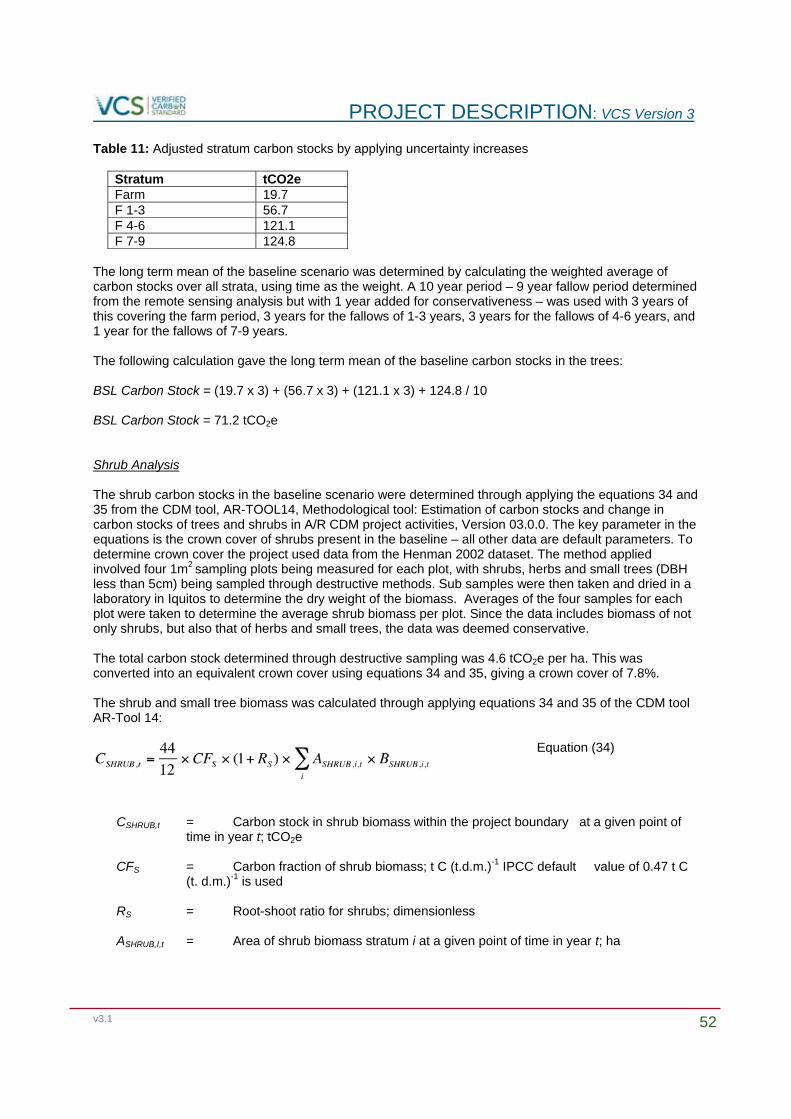
PROJECT DESCRIPTION: VCS Version 3
v3.1 52
Table 11: Adjusted stratum carbon stocks by applying uncertainty increases
Stratum tCO2e Farm 19.7 F 1-3 56.7 F 4-6 121.1 F 7-9 124.8
The long term mean of the baseline scenario was determined by calculating the weighted average of carbon stocks over all strata, using time as the weight. A 10 year period – 9 year fallow period determined from the remote sensing analysis but with 1 year added for conservativeness – was used with 3 years of this covering the farm period, 3 years for the fallows of 1-3 years, 3 years for the fallows of 4-6 years, and 1 year for the fallows of 7-9 years. The following calculation gave the long term mean of the baseline carbon stocks in the trees: BSL Carbon Stock = (19.7 x 3) + (56.7 x 3) + (121.1 x 3) + 124.8 / 10 BSL Carbon Stock = 71.2 tCO2e Shrub Analysis The shrub carbon stocks in the baseline scenario were determined through applying the equations 34 and 35 from the CDM tool, AR-TOOL14, Methodological tool: Estimation of carbon stocks and change in carbon stocks of trees and shrubs in A/R CDM project activities, Version 03.0.0. The key parameter in the equations is the crown cover of shrubs present in the baseline – all other data are default parameters. To determine crown cover the project used data from the Henman 2002 dataset. The method applied involved four 1m2 sampling plots being measured for each plot, with shrubs, herbs and small trees (DBH less than 5cm) being sampled through destructive methods. Sub samples were then taken and dried in a laboratory in Iquitos to determine the dry weight of the biomass. Averages of the four samples for each plot were taken to determine the average shrub biomass per plot. Since the data includes biomass of not only shrubs, but also that of herbs and small trees, the data was deemed conservative. The total carbon stock determined through destructive sampling was 4.6 tCO2e per ha. This was converted into an equivalent crown cover using equations 34 and 35, giving a crown cover of 7.8%. The shrub and small tree biomass was calculated through applying equations 34 and 35 of the CDM tool AR-Tool 14:
Equation (34)
CSHRUB,t = Carbon stock in shrub biomass within the project boundary at a given point of
time in year t; tCO2e CFS = Carbon fraction of shrub biomass; t C (t.d.m.)-1 IPCC default value of 0.47 t C
(t. d.m.)-1 is used RS = Root-shoot ratio for shrubs; dimensionless ASHRUB,I,t = Area of shrub biomass stratum i at a given point of time in year t; ha

PROJECT DESCRIPTION: VCS Version 3
v3.1 53
BSHRUB,I,t = Shrub biomass per hectare in shrub biomass stratum i at a given point of time in year t; t d.m. ha-1
i = 1, 2, 3, … shrub biomass sttrata delineated on the basis of shrub crown cover t = 1, 2, 3, …. Years counted from the start of the A/R CDM project activity
Equation (35)
BSHRUB,I,t = Shrub biomass per hectare in shrub biomass stratum i at a given point of time in
year t; t d.m. ha-1
BDRSF = Ratio of shrub biomass per hectare in land having a shrub crown cover of 1.0
and default above-ground biomass content per hectare in forest in the region/ country where the A/R CDM project is located; dimensionless
BFOREST = Default above-ground biomass content in forest in the region/ country where the
A/R CDM is located; t d.m. ha-1
CCSHRUB,I,t = Crown cover of shrubs in shrub biomass stratum i at a given point of time in year t expressed as a fraction ; dimensionless t = 1, 2, 3, … years counted from the start of the A/R CDM project activity
Table 12: Default parameters for estimating shrub carbon stocks
Parameter Value Source Root shoot ratio for shrubs 0.4 Default value from CDM
AR-Tool1439 Carbon Fraction 0.47 tC per t d.m Default value from CDM
AR-Tool14 CO2/C 44/12
Universal constant
BDRSF (ratio of shrub to forest biomass)
0.10 Default value from CDM AR-Tool14
CCSHRUB,I,t, Crown cover of shrubs
0.078 Measured through destructive sampling and converted into an equivalent crown cover
Aboveground biomass forest in Peru
245 t per ha IPCC GPG 2003 – see Table 3A.1.4 (page 209)
In line with the provisions of the tool, shrub crown cover was assumed to remain at the pre-project level; therefore there were no changes in the shrub carbon stocks from the initial pre-project value.
39 AR-TOOL14, Methodological tool: Estimation of carbon stocks and change in carbon stocks of trees
and shrubs in A/R CDM project activities, Version 03.0.0, http://cdm.unfccc.int/methodologies/ARmethodologies/tools/ar-am-tool-14-v3.0.0.pdf
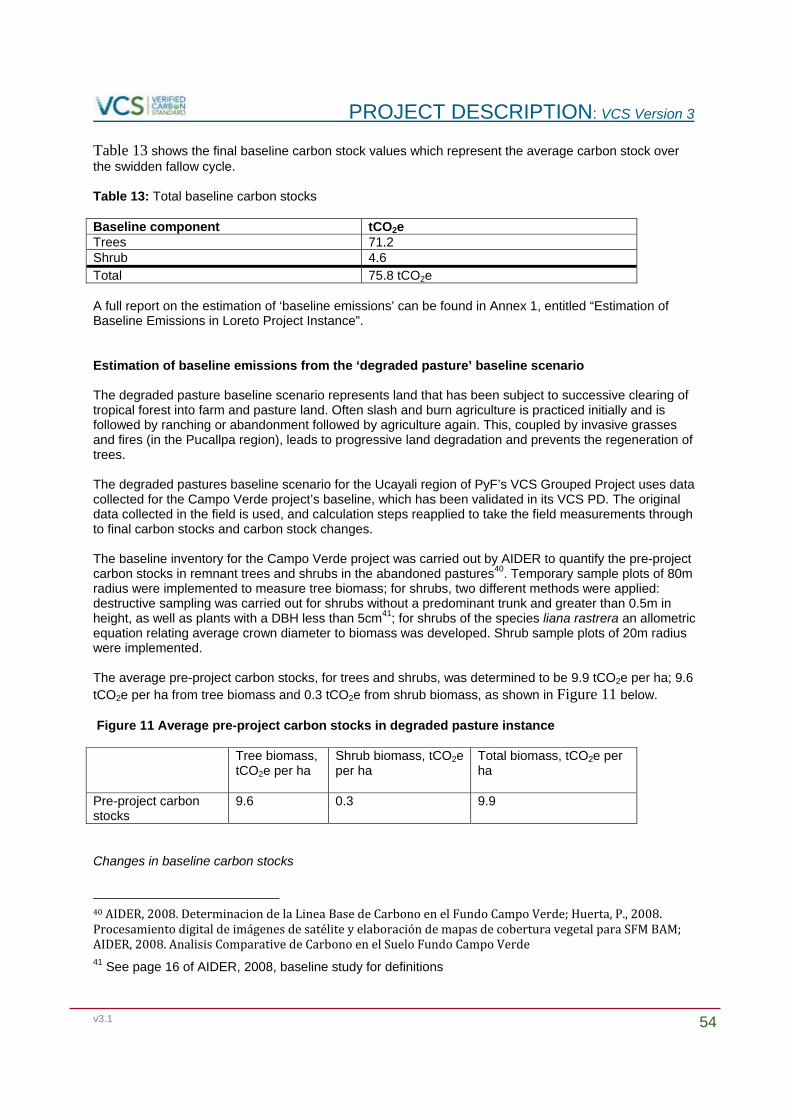
PROJECT DESCRIPTION: VCS Version 3
v3.1 54
Table 13 shows the final baseline carbon stock values which represent the average carbon stock over the swidden fallow cycle. Table 13: Total baseline carbon stocks Baseline component tCO2e Trees 71.2 Shrub 4.6 Total 75.8 tCO2e A full report on the estimation of ‘baseline emissions’ can be found in Annex 1, entitled “Estimation of Baseline Emissions in Loreto Project Instance”. Estimation of baseline emissions from the ‘degraded pasture’ baseline scenario The degraded pasture baseline scenario represents land that has been subject to successive clearing of tropical forest into farm and pasture land. Often slash and burn agriculture is practiced initially and is followed by ranching or abandonment followed by agriculture again. This, coupled by invasive grasses and fires (in the Pucallpa region), leads to progressive land degradation and prevents the regeneration of trees. The degraded pastures baseline scenario for the Ucayali region of PyF’s VCS Grouped Project uses data collected for the Campo Verde project’s baseline, which has been validated in its VCS PD. The original data collected in the field is used, and calculation steps reapplied to take the field measurements through to final carbon stocks and carbon stock changes. The baseline inventory for the Campo Verde project was carried out by AIDER to quantify the pre-project carbon stocks in remnant trees and shrubs in the abandoned pastures40. Temporary sample plots of 80m radius were implemented to measure tree biomass; for shrubs, two different methods were applied: destructive sampling was carried out for shrubs without a predominant trunk and greater than 0.5m in height, as well as plants with a DBH less than 5cm41; for shrubs of the species liana rastrera an allometric equation relating average crown diameter to biomass was developed. Shrub sample plots of 20m radius were implemented. The average pre-project carbon stocks, for trees and shrubs, was determined to be 9.9 tCO2e per ha; 9.6 tCO2e per ha from tree biomass and 0.3 tCO2e from shrub biomass, as shown in Figure 11 below. Figure 11 Average pre-project carbon stocks in degraded pasture instance Tree biomass,
tCO2e per ha
Shrub biomass, tCO2e per ha
Total biomass, tCO2e per ha
Pre-project carbon stocks
9.6 0.3 9.9
Changes in baseline carbon stocks
40AIDER,2008.DeterminaciondelaLineaBasedeCarbonoenelFundoCampoVerde;Huerta,P.,2008.ProcesamientodigitaldeimagenesdesateliteyelaboraciondemapasdecoberturavegetalparaSFMBAM;AIDER,2008.AnalisisComparativedeCarbonoenelSueloFundoCampoVerde 41 See page 16 of AIDER, 2008, baseline study for definitions
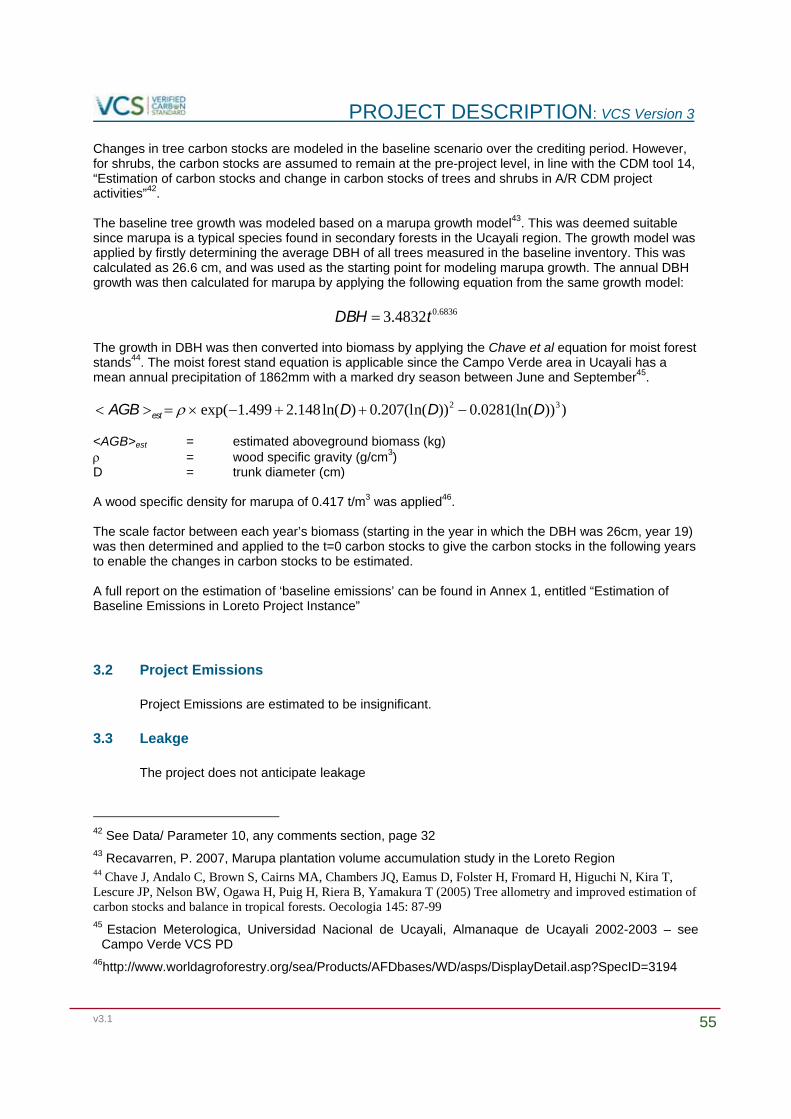
PROJECT DESCRIPTION: VCS Version 3
v3.1 55
Changes in tree carbon stocks are modeled in the baseline scenario over the crediting period. However, for shrubs, the carbon stocks are assumed to remain at the pre-project level, in line with the CDM tool 14, “Estimation of carbon stocks and change in carbon stocks of trees and shrubs in A/R CDM project activities”42. The baseline tree growth was modeled based on a marupa growth model43. This was deemed suitable since marupa is a typical species found in secondary forests in the Ucayali region. The growth model was applied by firstly determining the average DBH of all trees measured in the baseline inventory. This was calculated as 26.6 cm, and was used as the starting point for modeling marupa growth. The annual DBH growth was then calculated for marupa by applying the following equation from the same growth model:
DBH 3.4832t0.6836 The growth in DBH was then converted into biomass by applying the Chave et al equation for moist forest stands44. The moist forest stand equation is applicable since the Campo Verde area in Ucayali has a mean annual precipitation of 1862mm with a marked dry season between June and September45. AGB est exp(1.499 2.148ln(D) 0.207(ln(D))2 0.0281(ln(D))3) <AGB>est = estimated aboveground biomass (kg) = wood specific gravity (g/cm3) D = trunk diameter (cm) A wood specific density for marupa of 0.417 t/m3 was applied46. The scale factor between each year’s biomass (starting in the year in which the DBH was 26cm, year 19) was then determined and applied to the t=0 carbon stocks to give the carbon stocks in the following years to enable the changes in carbon stocks to be estimated. A full report on the estimation of ‘baseline emissions’ can be found in Annex 1, entitled “Estimation of Baseline Emissions in Loreto Project Instance”
3.2 Project Emissions
Project Emissions are estimated to be insignificant.
3.3 Leakge
The project does not anticipate leakage
42 See Data/ Parameter 10, any comments section, page 32 43 Recavarren, P. 2007, Marupa plantation volume accumulation study in the Loreto Region 44 Chave J, Andalo C, Brown S, Cairns MA, Chambers JQ, Eamus D, Folster H, Fromard H, Higuchi N, Kira T, Lescure JP, Nelson BW, Ogawa H, Puig H, Riera B, Yamakura T (2005) Tree allometry and improved estimation of carbon stocks and balance in tropical forests. Oecologia 145: 87-99 45 Estacion Meterologica, Universidad Nacional de Ucayali, Almanaque de Ucayali 2002-2003 – see
Campo Verde VCS PD 46http://www.worldagroforestry.org/sea/Products/AFDbases/WD/asps/DisplayDetail.asp?SpecID=3194
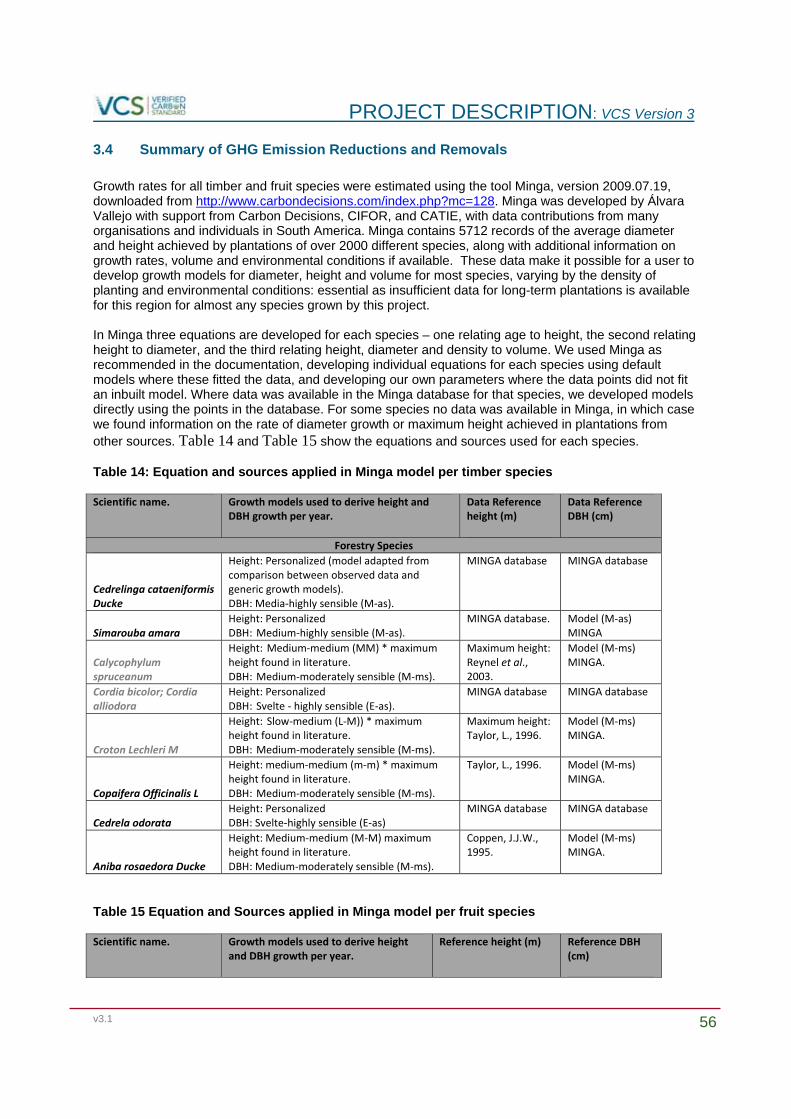
PROJECT DESCRIPTION: VCS Version 3
v3.1 56
3.4 Summary of GHG Emission Reductions and Removals
Growth rates for all timber and fruit species were estimated using the tool Minga, version 2009.07.19, downloaded from http://www.carbondecisions.com/index.php?mc=128. Minga was developed by Álvara Vallejo with support from Carbon Decisions, CIFOR, and CATIE, with data contributions from many organisations and individuals in South America. Minga contains 5712 records of the average diameter and height achieved by plantations of over 2000 different species, along with additional information on growth rates, volume and environmental conditions if available. These data make it possible for a user to develop growth models for diameter, height and volume for most species, varying by the density of planting and environmental conditions: essential as insufficient data for long-term plantations is available for this region for almost any species grown by this project. In Minga three equations are developed for each species – one relating age to height, the second relating height to diameter, and the third relating height, diameter and density to volume. We used Minga as recommended in the documentation, developing individual equations for each species using default models where these fitted the data, and developing our own parameters where the data points did not fit an inbuilt model. Where data was available in the Minga database for that species, we developed models directly using the points in the database. For some species no data was available in Minga, in which case we found information on the rate of diameter growth or maximum height achieved in plantations from other sources. Table 14 and Table 15 show the equations and sources used for each species. Table 14: Equation and sources applied in Minga model per timber species Scientific name. Growth models used to derive height and
DBH growth per year. Data Reference height (m)
Data Reference DBH (cm)
Forestry Species
Cedrelinga cataeniformis Ducke
Height: Personalized (model adapted from comparison between observed data and generic growth models). DBH: Media‐highly sensible (M‐as).
MINGA database MINGA database
Simarouba amara Height: Personalized DBH: Medium‐highly sensible (M‐as).
MINGA database. Model (M‐as) MINGA
Calycophylum spruceanum
Height: Medium‐medium (MM) * maximum height found in literature. DBH: Medium‐moderately sensible (M‐ms).
Maximum height:Reynel et al., 2003.
Model (M‐ms) MINGA.
Cordia bicolor; Cordia alliodora
Height: Personalized DBH: Svelte ‐ highly sensible (E‐as).
MINGA database MINGA database
Croton Lechleri M
Height: Slow‐medium (L‐M)) * maximum height found in literature. DBH: Medium‐moderately sensible (M‐ms).
Maximum height:Taylor, L., 1996.
Model (M‐ms) MINGA.
Copaifera Officinalis L
Height: medium‐medium (m‐m) * maximum height found in literature. DBH: Medium‐moderately sensible (M‐ms).
Taylor, L., 1996. Model (M‐ms) MINGA.
Cedrela odorata Height: Personalized DBH: Svelte‐highly sensible (E‐as)
MINGA database MINGA database
Aniba rosaedora Ducke
Height: Medium‐medium (M‐M) maximum height found in literature. DBH: Medium‐moderately sensible (M‐ms).
Coppen, J.J.W., 1995.
Model (M‐ms) MINGA.
Table 15 Equation and Sources applied in Minga model per fruit species Scientific name. Growth models used to derive height
and DBH growth per year. Reference height (m)
Reference DBH (cm)
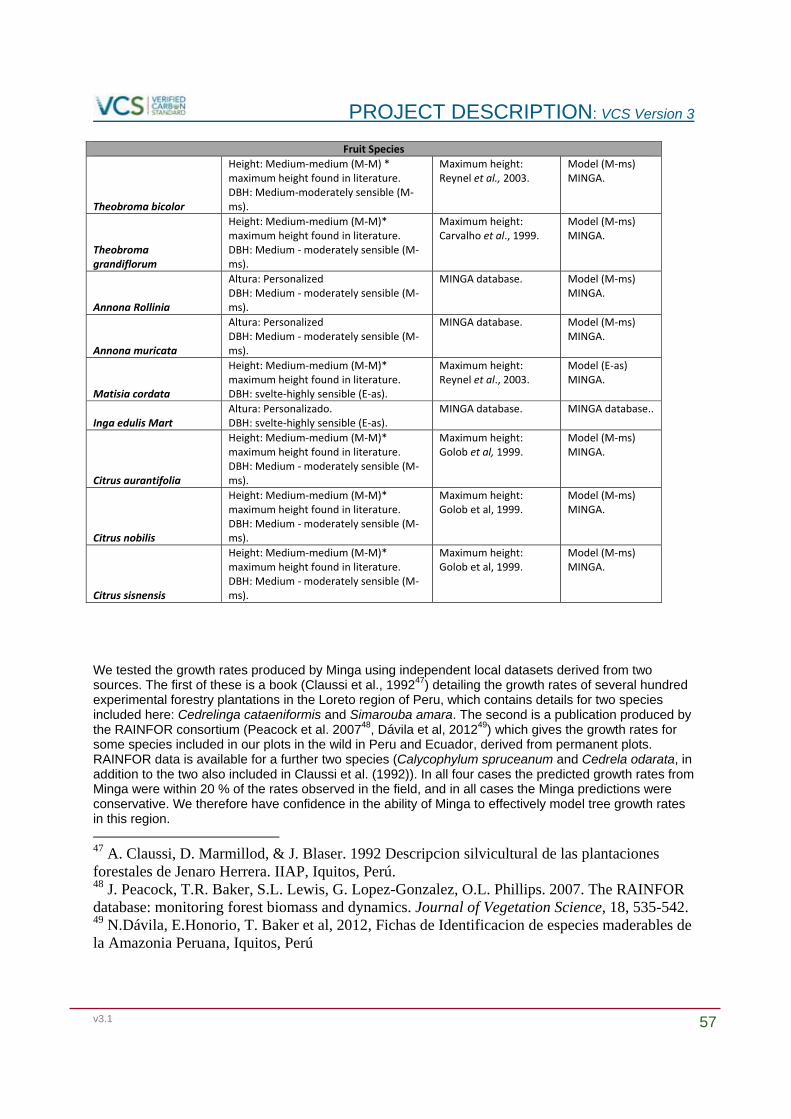
PROJECT DESCRIPTION: VCS Version 3
v3.1 57
Fruit Species
Theobroma bicolor
Height: Medium‐medium (M‐M) * maximum height found in literature. DBH: Medium‐moderately sensible (M‐ms).
Maximum height:Reynel et al., 2003.
Model (M‐ms) MINGA.
Theobroma grandiflorum
Height: Medium‐medium (M‐M)* maximum height found in literature. DBH: Medium ‐ moderately sensible (M‐ms).
Maximum height:Carvalho et al., 1999.
Model (M‐ms) MINGA.
Annona Rollinia
Altura: Personalized DBH: Medium ‐ moderately sensible (M‐ms).
MINGA database. Model (M‐ms) MINGA.
Annona muricata
Altura: Personalized DBH: Medium ‐ moderately sensible (M‐ms).
MINGA database. Model (M‐ms) MINGA.
Matisia cordata
Height: Medium‐medium (M‐M)* maximum height found in literature. DBH: svelte‐highly sensible (E‐as).
Maximum height:Reynel et al., 2003.
Model (E‐as) MINGA.
Inga edulis Mart Altura: Personalizado. DBH: svelte‐highly sensible (E‐as).
MINGA database. MINGA database..
Citrus aurantifolia
Height: Medium‐medium (M‐M)* maximum height found in literature. DBH: Medium ‐ moderately sensible (M‐ms).
Maximum height: Golob et al, 1999.
Model (M‐ms) MINGA.
Citrus nobilis
Height: Medium‐medium (M‐M)* maximum height found in literature. DBH: Medium ‐ moderately sensible (M‐ms).
Maximum height:Golob et al, 1999.
Model (M‐ms) MINGA.
Citrus sisnensis
Height: Medium‐medium (M‐M)* maximum height found in literature. DBH: Medium ‐ moderately sensible (M‐ms).
Maximum height:Golob et al, 1999.
Model (M‐ms) MINGA.
We tested the growth rates produced by Minga using independent local datasets derived from two sources. The first of these is a book (Claussi et al., 199247) detailing the growth rates of several hundred experimental forestry plantations in the Loreto region of Peru, which contains details for two species included here: Cedrelinga cataeniformis and Simarouba amara. The second is a publication produced by the RAINFOR consortium (Peacock et al. 200748, Dávila et al, 201249) which gives the growth rates for some species included in our plots in the wild in Peru and Ecuador, derived from permanent plots. RAINFOR data is available for a further two species (Calycophylum spruceanum and Cedrela odarata, in addition to the two also included in Claussi et al. (1992)). In all four cases the predicted growth rates from Minga were within 20 % of the rates observed in the field, and in all cases the Minga predictions were conservative. We therefore have confidence in the ability of Minga to effectively model tree growth rates in this region. 47 A. Claussi, D. Marmillod, & J. Blaser. 1992 Descripcion silvicultural de las plantaciones forestales de Jenaro Herrera. IIAP, Iquitos, Perú. 48 J. Peacock, T.R. Baker, S.L. Lewis, G. Lopez-Gonzalez, O.L. Phillips. 2007. The RAINFOR database: monitoring forest biomass and dynamics. Journal of Vegetation Science, 18, 535-542. 49 N.Dávila, E.Honorio, T. Baker et al, 2012, Fichas de Identificacion de especies maderables de la Amazonia Peruana, Iquitos, Perú
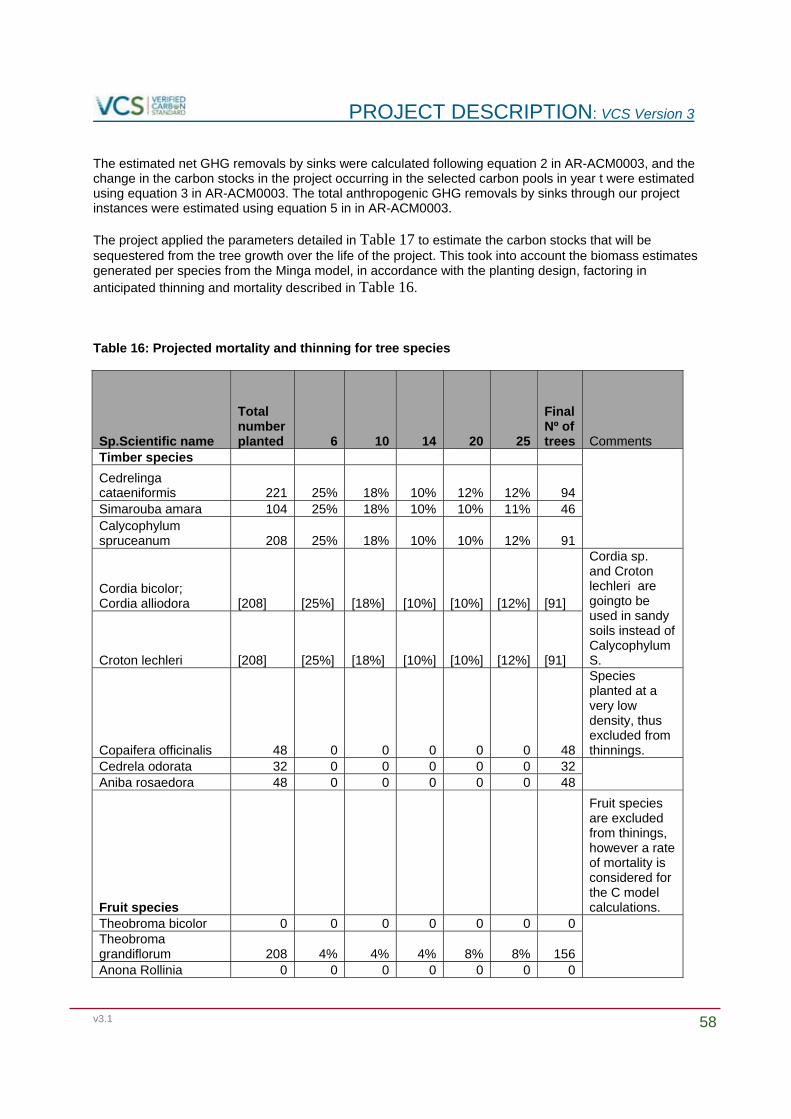
PROJECT DESCRIPTION: VCS Version 3
v3.1 58
The estimated net GHG removals by sinks were calculated following equation 2 in AR-ACM0003, and the change in the carbon stocks in the project occurring in the selected carbon pools in year t were estimated using equation 3 in AR-ACM0003. The total anthropogenic GHG removals by sinks through our project instances were estimated using equation 5 in in AR-ACM0003. The project applied the parameters detailed in Table 17 to estimate the carbon stocks that will be sequestered from the tree growth over the life of the project. This took into account the biomass estimates generated per species from the Minga model, in accordance with the planting design, factoring in anticipated thinning and mortality described in Table 16. Table 16: Projected mortality and thinning for tree species
Sp.Scientific name
Total number planted 6 10 14 20 25
Final Nº of trees Comments
Timber species
Cedrelinga cataeniformis 221 25% 18% 10% 12% 12% 94 Simarouba amara 104 25% 18% 10% 10% 11% 46 Calycophylum spruceanum 208 25% 18% 10% 10% 12% 91
Cordia bicolor; Cordia alliodora [208] [25%] [18%] [10%] [10%] [12%] [91]
Cordia sp. and Croton lechleri are goingto be used in sandy soils instead of Calycophylum S. Croton lechleri [208] [25%] [18%] [10%] [10%] [12%] [91]
Copaifera officinalis 48 0 0 0 0 0 48
Species planted at a very low density, thus excluded from thinnings.
Cedrela odorata 32 0 0 0 0 0 32 Aniba rosaedora 48 0 0 0 0 0 48
Fruit species
Fruit species are excluded from thinings, however a rate of mortality is considered for the C model calculations.
Theobroma bicolor 0 0 0 0 0 0 0
Theobroma grandiflorum 208 4% 4% 4% 8% 8% 156 Anona Rollinia 0 0 0 0 0 0 0

PROJECT DESCRIPTION: VCS Version 3
v3.1 59
Anona muricata 52 1% 1% 1% 2% 2% 48 Matisia cordata 18 0 0 0 0 0 18 Inga edulis Mart 34 0 0 0 0 0 34 Citrus aurantifolia 78 2% 2% 2% 4% 4% 68 Citrus nobilis 13 0 0 0 0 0 13 Citrus sisnensis 13 0 0 0 0 0 13 Total number at the end of year 30 709
Table 17: Parameters used to estimate carbon stock in trees Parameter Value Source Wood density Taken from the literature per
species Calculated – average taken over all species-specific wood densities – see below
Root shoot ratio for trees 0.25
CDM AR-Tool1450
Carbon Fraction 0.47 tC per t d.m Default value from CDM AR-Tool14
CO2/C 44/12
Universal constant
Table 18: GHG Emission Reductions and Removals from the Loreto Instance
Year
Estimated baseline emissions or removals (tCO2e)
Estimated project emissions or removals (tCO2e)
Estimated leakage emissions (tCO2e)
Estimated net GHG emission reductions or removals (tCO2e)
2012 309.19 0.00 0.00 -309.19 2013 1,488.64 8.24 0.00 -1,480.39 2014 1,488.64 49.21 0.00 -1,439.43 2015 1,488.64 94.90 0.00 -1,393.74 2016 1,488.64 142.19 0.00 -1,346.45 2017 1,488.64 201.81 0.00 -1,286.83 2018 1,488.64 314.69 0.00 -1,173.95 2019 1,488.64 616.03 0.00 -872.60 2020 1,488.64 1,148.45 0.00 -340.19 2021 1,488.64 1,896.98 0.00 408.35 2022 1,488.64 2,861.16 0.00 1,372.52 2023 1,488.64 3,832.56 0.00 2,343.93 2024 1,488.64 5,129.66 0.00 3,641.02 2025 1,488.64 6,531.51 0.00 5,042.87
50 AR-TOOL14, Methodological tool: Estimation of carbon stocks and change in carbon stocks of trees
and shrubs in A/R CDM project activities, Version 04.1 http://cdm.unfccc.int/methodologies/ARmethodologies/tools/ar-am-tool-14-v4.1.pdf
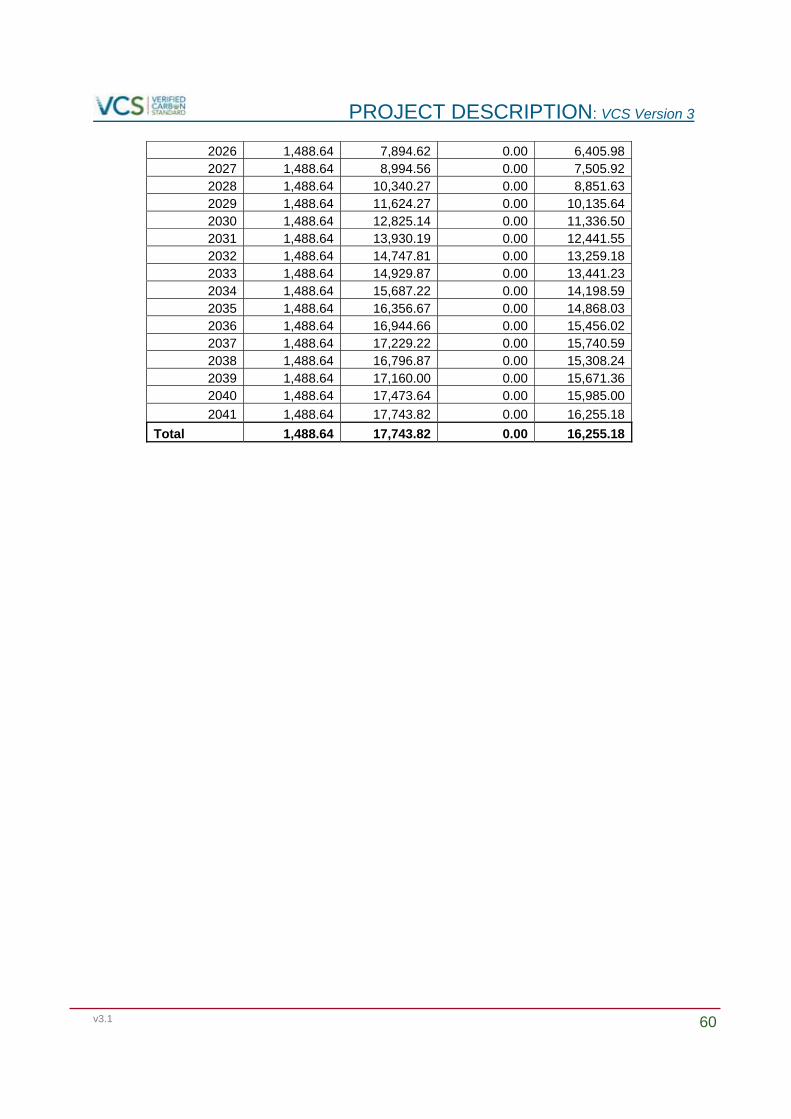
PROJECT DESCRIPTION: VCS Version 3
v3.1 60
2026 1,488.64 7,894.62 0.00 6,405.98 2027 1,488.64 8,994.56 0.00 7,505.92 2028 1,488.64 10,340.27 0.00 8,851.63 2029 1,488.64 11,624.27 0.00 10,135.64 2030 1,488.64 12,825.14 0.00 11,336.50 2031 1,488.64 13,930.19 0.00 12,441.55 2032 1,488.64 14,747.81 0.00 13,259.18 2033 1,488.64 14,929.87 0.00 13,441.23 2034 1,488.64 15,687.22 0.00 14,198.59 2035 1,488.64 16,356.67 0.00 14,868.03 2036 1,488.64 16,944.66 0.00 15,456.02 2037 1,488.64 17,229.22 0.00 15,740.59 2038 1,488.64 16,796.87 0.00 15,308.24 2039 1,488.64 17,160.00 0.00 15,671.36 2040 1,488.64 17,473.64 0.00 15,985.00
2041 1,488.64 17,743.82 0.00 16,255.18
Total 1,488.64 17,743.82 0.00 16,255.18
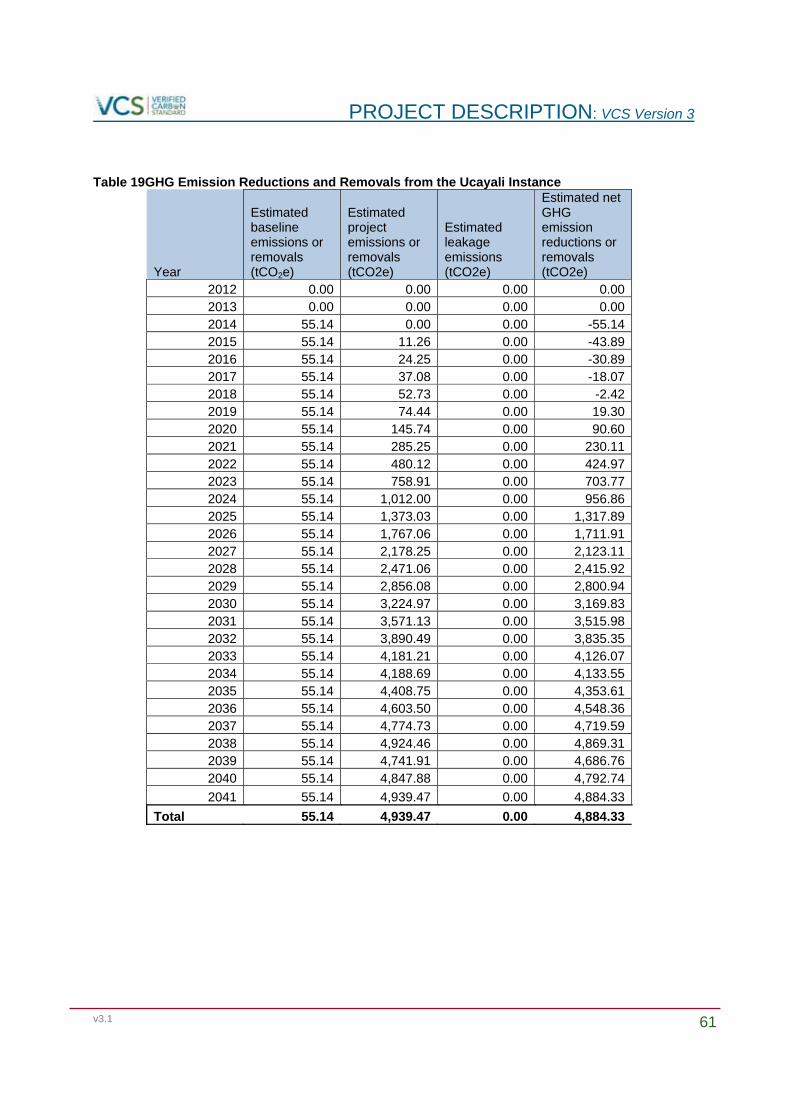
PROJECT DESCRIPTION: VCS Version 3
v3.1 61
Table 19GHG Emission Reductions and Removals from the Ucayali Instance
Year
Estimated baseline emissions or removals (tCO2e)
Estimated project emissions or removals (tCO2e)
Estimated leakage emissions (tCO2e)
Estimated net GHG emission reductions or removals (tCO2e)
2012 0.00 0.00 0.00 0.00 2013 0.00 0.00 0.00 0.00 2014 55.14 0.00 0.00 -55.14 2015 55.14 11.26 0.00 -43.89 2016 55.14 24.25 0.00 -30.89 2017 55.14 37.08 0.00 -18.07 2018 55.14 52.73 0.00 -2.42 2019 55.14 74.44 0.00 19.30 2020 55.14 145.74 0.00 90.60 2021 55.14 285.25 0.00 230.11 2022 55.14 480.12 0.00 424.97 2023 55.14 758.91 0.00 703.77 2024 55.14 1,012.00 0.00 956.86 2025 55.14 1,373.03 0.00 1,317.89 2026 55.14 1,767.06 0.00 1,711.91 2027 55.14 2,178.25 0.00 2,123.11 2028 55.14 2,471.06 0.00 2,415.92 2029 55.14 2,856.08 0.00 2,800.94 2030 55.14 3,224.97 0.00 3,169.83 2031 55.14 3,571.13 0.00 3,515.98 2032 55.14 3,890.49 0.00 3,835.35 2033 55.14 4,181.21 0.00 4,126.07 2034 55.14 4,188.69 0.00 4,133.55 2035 55.14 4,408.75 0.00 4,353.61 2036 55.14 4,603.50 0.00 4,548.36 2037 55.14 4,774.73 0.00 4,719.59 2038 55.14 4,924.46 0.00 4,869.31 2039 55.14 4,741.91 0.00 4,686.76 2040 55.14 4,847.88 0.00 4,792.74
2041 55.14 4,939.47 0.00 4,884.33
Total 55.14 4,939.47 0.00 4,884.33
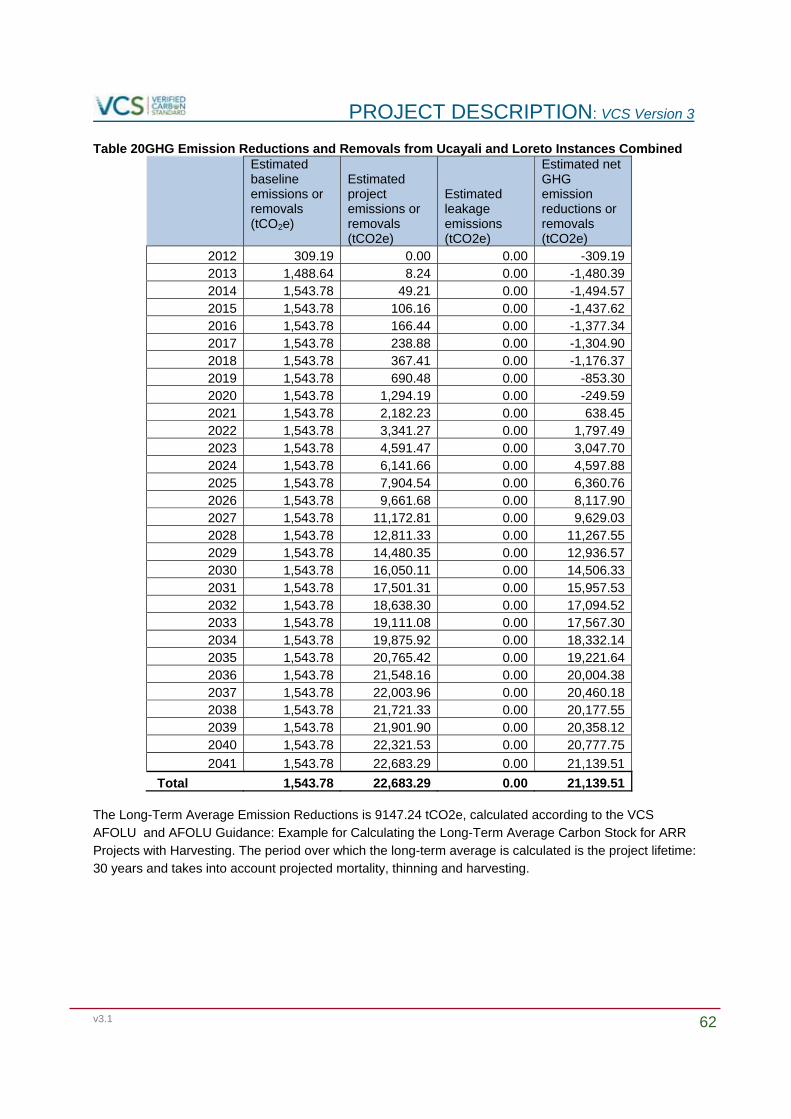
PROJECT DESCRIPTION: VCS Version 3
v3.1 62
Table 20GHG Emission Reductions and Removals from Ucayali and Loreto Instances Combined
Estimated baseline emissions or removals (tCO2e)
Estimated project emissions or removals (tCO2e)
Estimated leakage emissions (tCO2e)
Estimated net GHG emission reductions or removals (tCO2e)
2012 309.19 0.00 0.00 -309.19 2013 1,488.64 8.24 0.00 -1,480.39 2014 1,543.78 49.21 0.00 -1,494.57 2015 1,543.78 106.16 0.00 -1,437.62 2016 1,543.78 166.44 0.00 -1,377.34 2017 1,543.78 238.88 0.00 -1,304.90 2018 1,543.78 367.41 0.00 -1,176.37 2019 1,543.78 690.48 0.00 -853.30 2020 1,543.78 1,294.19 0.00 -249.59 2021 1,543.78 2,182.23 0.00 638.45 2022 1,543.78 3,341.27 0.00 1,797.49 2023 1,543.78 4,591.47 0.00 3,047.70 2024 1,543.78 6,141.66 0.00 4,597.88 2025 1,543.78 7,904.54 0.00 6,360.76 2026 1,543.78 9,661.68 0.00 8,117.90 2027 1,543.78 11,172.81 0.00 9,629.03 2028 1,543.78 12,811.33 0.00 11,267.55 2029 1,543.78 14,480.35 0.00 12,936.57 2030 1,543.78 16,050.11 0.00 14,506.33 2031 1,543.78 17,501.31 0.00 15,957.53 2032 1,543.78 18,638.30 0.00 17,094.52 2033 1,543.78 19,111.08 0.00 17,567.30 2034 1,543.78 19,875.92 0.00 18,332.14 2035 1,543.78 20,765.42 0.00 19,221.64 2036 1,543.78 21,548.16 0.00 20,004.38 2037 1,543.78 22,003.96 0.00 20,460.18 2038 1,543.78 21,721.33 0.00 20,177.55 2039 1,543.78 21,901.90 0.00 20,358.12 2040 1,543.78 22,321.53 0.00 20,777.75
2041 1,543.78 22,683.29 0.00 21,139.51
Total 1,543.78 22,683.29 0.00 21,139.51
The Long-Term Average Emission Reductions is 9147.24 tCO2e, calculated according to the VCS AFOLU and AFOLU Guidance: Example for Calculating the Long-Term Average Carbon Stock for ARR Projects with Harvesting. The period over which the long-term average is calculated is the project lifetime: 30 years and takes into account projected mortality, thinning and harvesting.
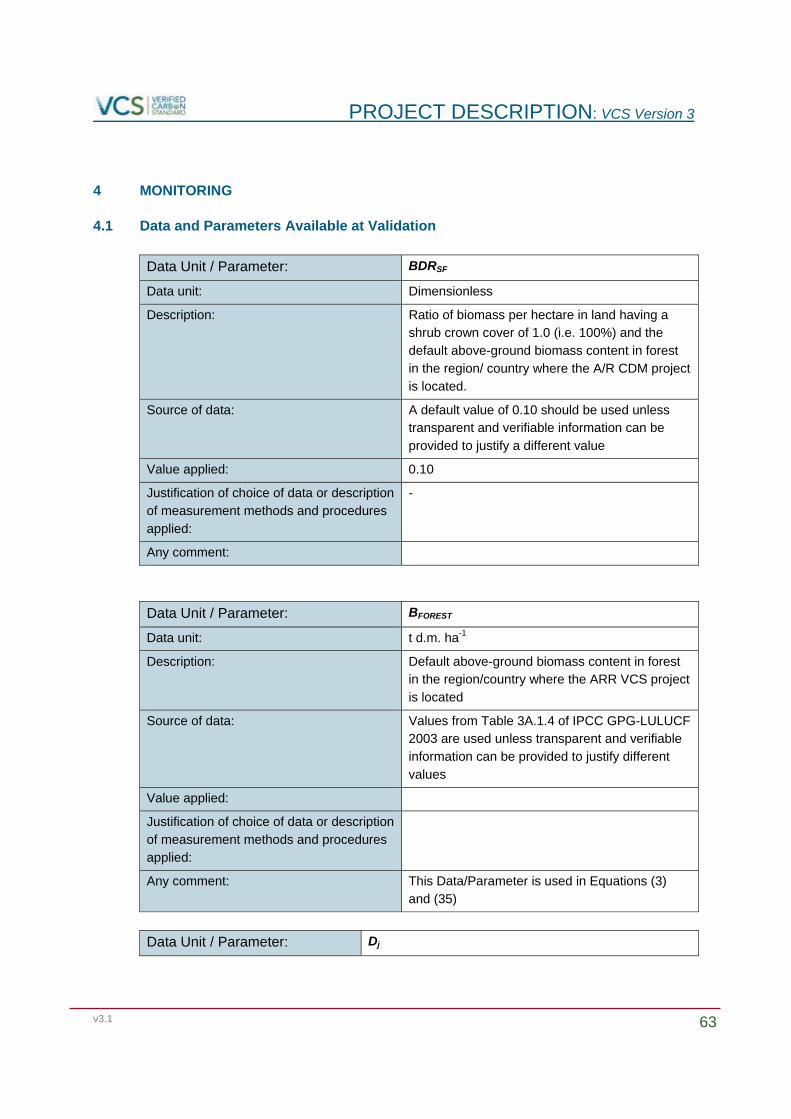
PROJECT DESCRIPTION: VCS Version 3
v3.1 63
4 MONITORING
4.1 Data and Parameters Available at Validation
Data Unit / Parameter: BDRSF
Data unit: Dimensionless
Description: Ratio of biomass per hectare in land having a shrub crown cover of 1.0 (i.e. 100%) and the default above-ground biomass content in forest in the region/ country where the A/R CDM project is located.
Source of data: A default value of 0.10 should be used unless transparent and verifiable information can be provided to justify a different value
Value applied: 0.10
Justification of choice of data or description of measurement methods and procedures applied:
-
Any comment:
Data Unit / Parameter: BFOREST
Data unit: t d.m. ha-1
Description: Default above-ground biomass content in forest in the region/country where the ARR VCS project is located
Source of data: Values from Table 3A.1.4 of IPCC GPG-LULUCF 2003 are used unless transparent and verifiable information can be provided to justify different values
Value applied:
Justification of choice of data or description of measurement methods and procedures applied:
Any comment: This Data/Parameter is used in Equations (3) and (35)
Data Unit / Parameter: Dj
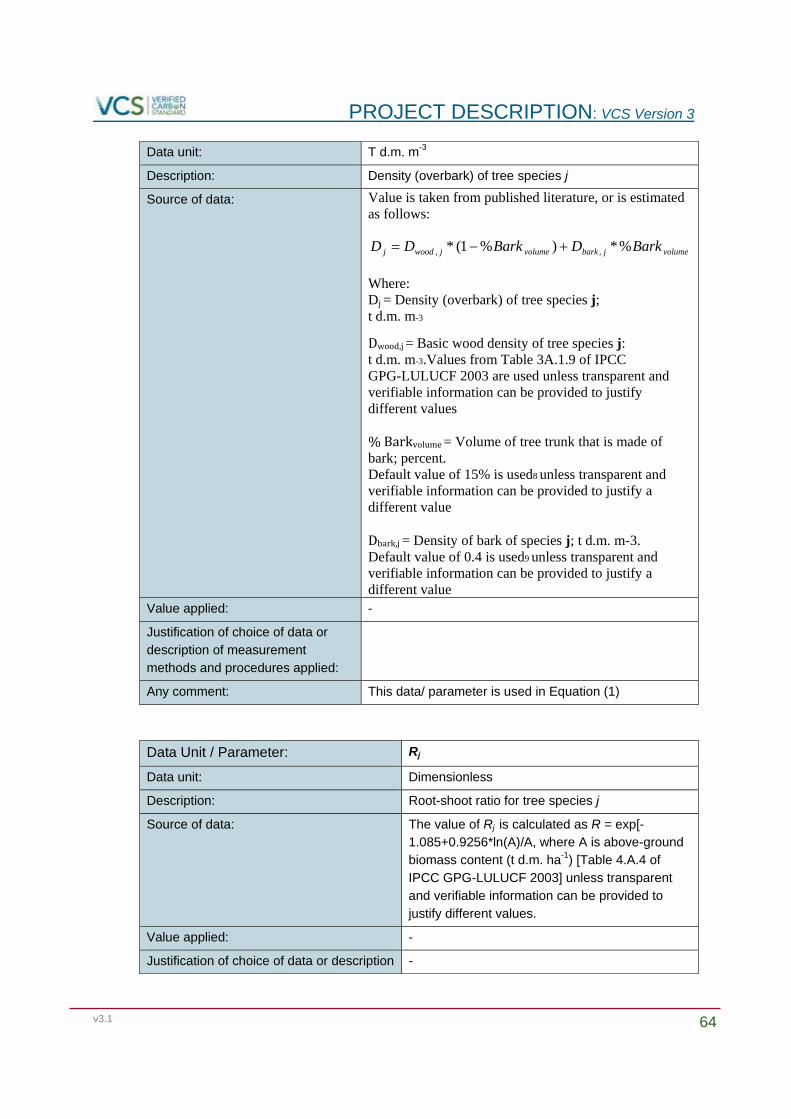
PROJECT DESCRIPTION: VCS Version 3
v3.1 64
Data unit: T d.m. m-3
Description: Density (overbark) of tree species j
Source of data: Value is taken from published literature, or is estimated as follows: D j Dwood , j * (1%Bark volume ) Dbark , j *%Bark volume
Where: Dj = Density (overbark) of tree species j; t d.m. m-3
Dwood,j= Basic wood density of tree species j: t d.m. m-3.Values from Table 3A.1.9 of IPCC GPG-LULUCF 2003 are used unless transparent and verifiable information can be provided to justify different values %Barkvolume= Volume of tree trunk that is made of bark; percent. Default value of 15% is used8 unless transparent and verifiable information can be provided to justify a different value Dbark,j= Density of bark of species j; t d.m. m-3. Default value of 0.4 is used9 unless transparent and verifiable information can be provided to justify a different value
Value applied: -
Justification of choice of data or description of measurement methods and procedures applied:
Any comment: This data/ parameter is used in Equation (1)
Data Unit / Parameter: Rj
Data unit: Dimensionless
Description: Root-shoot ratio for tree species j
Source of data: The value of Rj is calculated as R = exp[-1.085+0.9256*ln(A)/A, where A is above-ground biomass content (t d.m. ha-1) [Table 4.A.4 of IPCC GPG-LULUCF 2003] unless transparent and verifiable information can be provided to justify different values.
Value applied: -
Justification of choice of data or description -
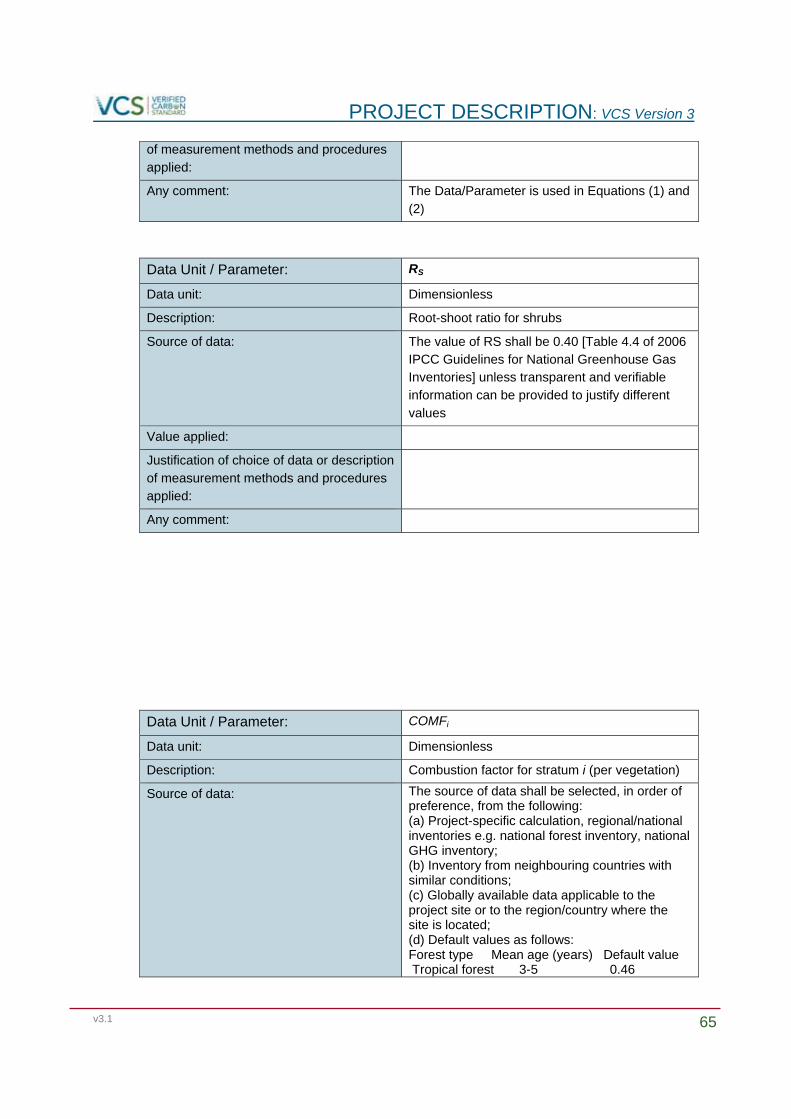
PROJECT DESCRIPTION: VCS Version 3
v3.1 65
of measurement methods and procedures applied:
Any comment: The Data/Parameter is used in Equations (1) and (2)
Data Unit / Parameter: RS
Data unit: Dimensionless
Description: Root-shoot ratio for shrubs
Source of data: The value of RS shall be 0.40 [Table 4.4 of 2006 IPCC Guidelines for National Greenhouse Gas Inventories] unless transparent and verifiable information can be provided to justify different values
Value applied:
Justification of choice of data or description of measurement methods and procedures applied:
Any comment:
Data Unit / Parameter: COMFi
Data unit: Dimensionless
Description: Combustion factor for stratum i (per vegetation)
Source of data: The source of data shall be selected, in order of preference, from the following: (a) Project-specific calculation, regional/national inventories e.g. national forest inventory, national GHG inventory; (b) Inventory from neighbouring countries with similar conditions; (c) Globally available data applicable to the project site or to the region/country where the site is located; (d) Default values as follows: Forest type Mean age (years) Default value Tropical forest 3-5 0.46
PROJECT DESCRIPTION: VCS Version 3
v3.1 66
6-10 0.67 11-17 0.50 18 and above 0.32 Boreal forest All 0.40 Temperate forest All 0.45
Value applied: 0.10
Justification of choice of data or description of measurement methods and procedures applied:
-
Any comment:
Data Unit / Parameter: EFCH4
Data unit: g kg-1 dry matter burnt
Description: Emission factor for CH4 in stratum i
Source of data: The source of data shall be selected, in order of preference, from the following: (a) Regional/national inventories e.g. national forest inventory, national GHG inventory; (b) Inventory from neighbouring countries with similar conditions; (c) Globally available data applicable to the project site or to the region/country where the site is located; (d) Default values as follows: (i) Tropical forest: 6.8 (ii) Other forest: 4.7
Value applied:
Justification of choice of data or description of measurement methods and procedures applied:
Any comment:
Data Unit / Parameter: EFN20
Data unit: g kg-1 dry matter burnt
Description: Emission factor for N2O in stratum i
Source of data: The source of data shall be selected, in order of preference, from the following: (a) Regional/national inventories e.g. national forest inventory, national GHG inventory; (b) Inventory from neighbouring countries with similar conditions; (c) Globally available data applicable to the project site or to the region/country where the site is located;
PROJECT DESCRIPTION: VCS Version 3
v3.1 67
(d) Default values as follows: (i) Tropical forest: 0.20 (ii) Other forest: 0.26
Value applied:
Justification of choice of data or description of measurement methods and procedures applied:
Any comment:
4.2 Data and Parameters Monitored
Data Unit / Parameter: Ap,i
Data unit: Ha
Description: Area of sample in stratum i
Source of data: Field measurement
Description of measurement methods and procedures to be applied:
Standard operating procedures (SOPs) developed by PyF in line with international best practices are applied
Frequency of monitoring/recording: Estimated to be every two years following the first verification
Value applied: 0.04 ha (estimated)
Monitoring equipment: Surveying tape measures (50m)
Compasses
Rope
QA/QC procedures to be applied: The PyF QA/QC SOPs will be followed
Calculation method: N/A
Any comment:
Data Unit / Parameter: ATREE,I,j
Data unit: Ha
Description: Area of tree biomass stratum I at a given point of time in year t
Source of data: Field measurement
Description of measurement methods and Standard operating procedures (SOPs)
PROJECT DESCRIPTION: VCS Version 3
v3.1 68
procedures to be applied: developed by PyF in line with international best practices are applied
Frequency of monitoring/recording: Estimated to be every two years following the first verification
Value applied:
Monitoring equipment: Garmin GPS
Compass
QA/QC procedures to be applied: The PyF QA/QC SOPs will be followed
Calculation method: N/A
Any comment:
Data Unit / Parameter: ASHRUB,I,j
Data unit: Ha
Description: Area of shrub biomass stratum I at a given point of time in year t
Source of data: Field measurement
Description of measurement methods and procedures to be applied:
Standard operating procedures (SOPs) developed by PyF in line with international best practices are applied
Frequency of monitoring/recording: Estimated to be every two years following the first verification
Value applied:
Monitoring equipment: Garmin GPS
Compass
QA/QC procedures to be applied: The PyF QA/QC SOPs will be followed
Calculation method: N/A
Any comment: This Data/Parameter is used in Equation (34)
Data Unit / Parameter: CCSHRUB,I,t
Data unit: Dimensionless
Description: Crown cover of shrubs in shrub biomass stratum I at a given point of time in year t
Source of data: Field measurement
Description of measurement methods and procedures to be applied:
Considering that the biomass in shrubs is smaller than the biomass in trees, a simplified method of measurement may be used for estimating shrub crown cover. Ocular estimation of crown cover may be carried out or any other method such as
PROJECT DESCRIPTION: VCS Version 3
v3.1 69
the line transect method or the relascope method may be applied
Frequency of monitoring/recording: Estimated to be every two years following the first verification
Value applied:
Monitoring equipment:
QA/QC procedures to be applied: The PyF QA/QC SOPs will be followed
Calculation method: N/A
Any comment: (a) When land is subjected to periodic slash-and-burn practices in the baseline, an average shrub crown cover equal to default value of 0.5 is used in Equation (35) unless transparent and verifiable information can be provided to justify a different value; (b) Ex ante estimation of shrub crown cover at a time other than at the start of the project is carried out with the following considerations in view: (i) Shrub crown cover is assumed to remain at the preproject level unless transparent and verifiable information can be provided to justify a different rate of change; (ii) When land is abandoned, shrubs may encroach such land and shrub crown cover may reach the maximum value of 1.0 over a period of 20 years from the year in which the land is abandoned. If the year in which the land is abandoned is not known, then an average crown cover of 0.50 is assumed at the start of the project. This Data/Parameter is used in Equation (35)
Data Unit / Parameter: Diameter at Breast Height (DBH)
Data unit: cm
Description: DBH of each tree with DBH > 5cm (dependent on allometric equation used ex post)
Source of data: Field measurements in sample plots
Description of measurement methods and procedures to be applied:
Standard operating procedures (SOPs) developed by PyF in line with international best practices are applied
Frequency of monitoring/recording: Estimated to be every two years following the first verification
Value applied:
Monitoring equipment: DBH tapes
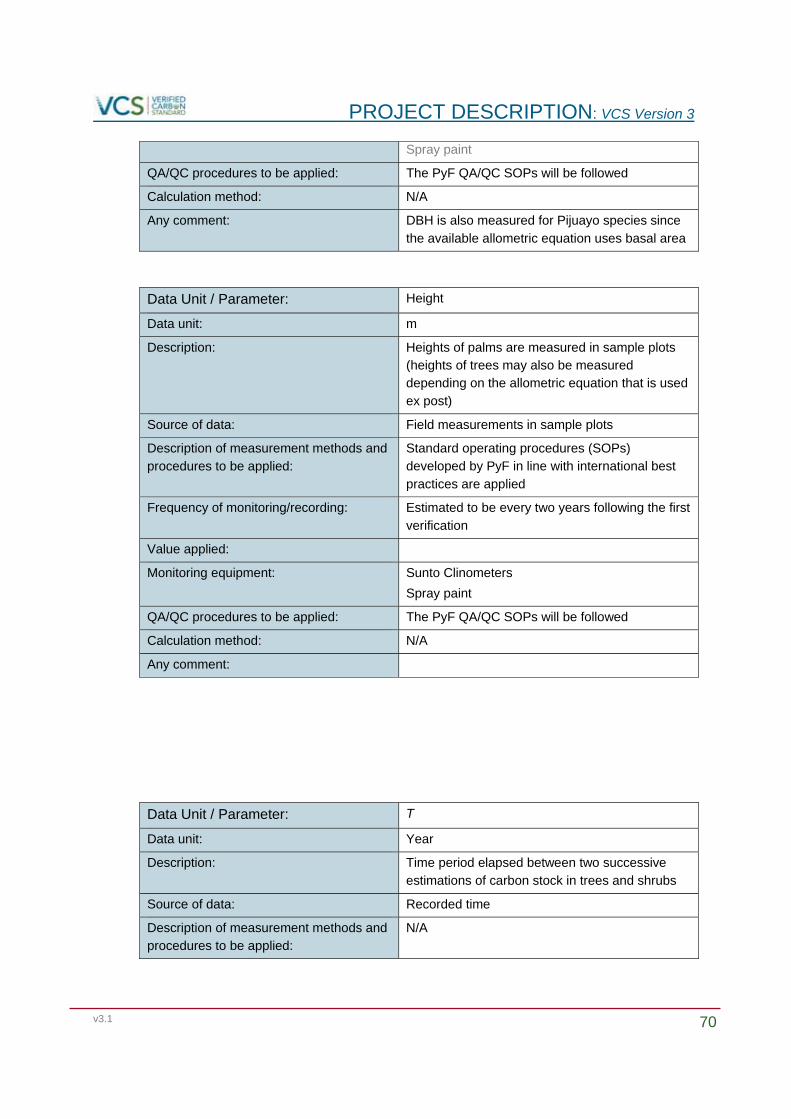
PROJECT DESCRIPTION: VCS Version 3
v3.1 70
Spray paint
QA/QC procedures to be applied: The PyF QA/QC SOPs will be followed
Calculation method: N/A
Any comment: DBH is also measured for Pijuayo species since the available allometric equation uses basal area
Data Unit / Parameter: Height
Data unit: m
Description: Heights of palms are measured in sample plots (heights of trees may also be measured depending on the allometric equation that is used ex post)
Source of data: Field measurements in sample plots
Description of measurement methods and procedures to be applied:
Standard operating procedures (SOPs) developed by PyF in line with international best practices are applied
Frequency of monitoring/recording: Estimated to be every two years following the first verification
Value applied:
Monitoring equipment: Sunto Clinometers
Spray paint
QA/QC procedures to be applied: The PyF QA/QC SOPs will be followed
Calculation method: N/A
Any comment:
Data Unit / Parameter: T
Data unit: Year
Description: Time period elapsed between two successive estimations of carbon stock in trees and shrubs
Source of data: Recorded time
Description of measurement methods and procedures to be applied:
N/A
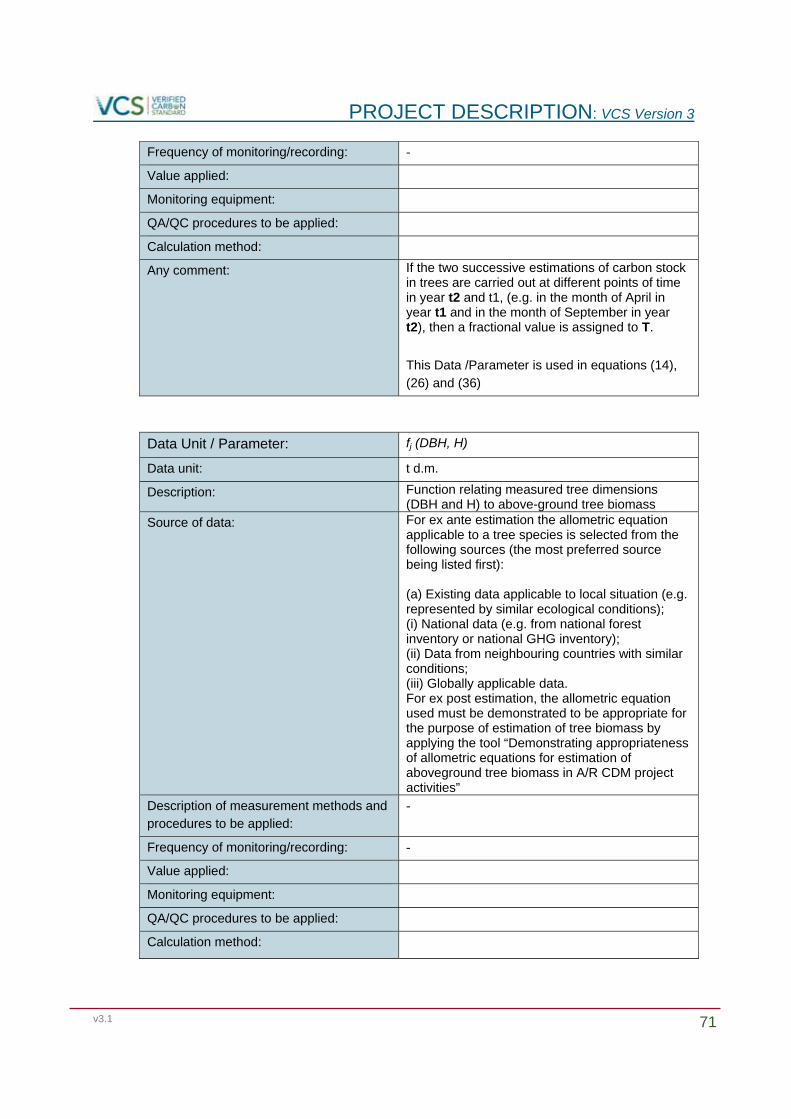
PROJECT DESCRIPTION: VCS Version 3
v3.1 71
Frequency of monitoring/recording: -
Value applied:
Monitoring equipment:
QA/QC procedures to be applied:
Calculation method:
Any comment: If the two successive estimations of carbon stock in trees are carried out at different points of time in year t2 and t1, (e.g. in the month of April in year t1 and in the month of September in year t2), then a fractional value is assigned to T.
This Data /Parameter is used in equations (14), (26) and (36)
Data Unit / Parameter: fj (DBH, H)
Data unit: t d.m.
Description: Function relating measured tree dimensions (DBH and H) to above-ground tree biomass
Source of data: For ex ante estimation the allometric equation applicable to a tree species is selected from the following sources (the most preferred source being listed first): (a) Existing data applicable to local situation (e.g. represented by similar ecological conditions); (i) National data (e.g. from national forest inventory or national GHG inventory); (ii) Data from neighbouring countries with similar conditions; (iii) Globally applicable data. For ex post estimation, the allometric equation used must be demonstrated to be appropriate for the purpose of estimation of tree biomass by applying the tool “Demonstrating appropriateness of allometric equations for estimation of aboveground tree biomass in A/R CDM project activities”
Description of measurement methods and procedures to be applied:
-
Frequency of monitoring/recording: -
Value applied:
Monitoring equipment:
QA/QC procedures to be applied:
Calculation method:
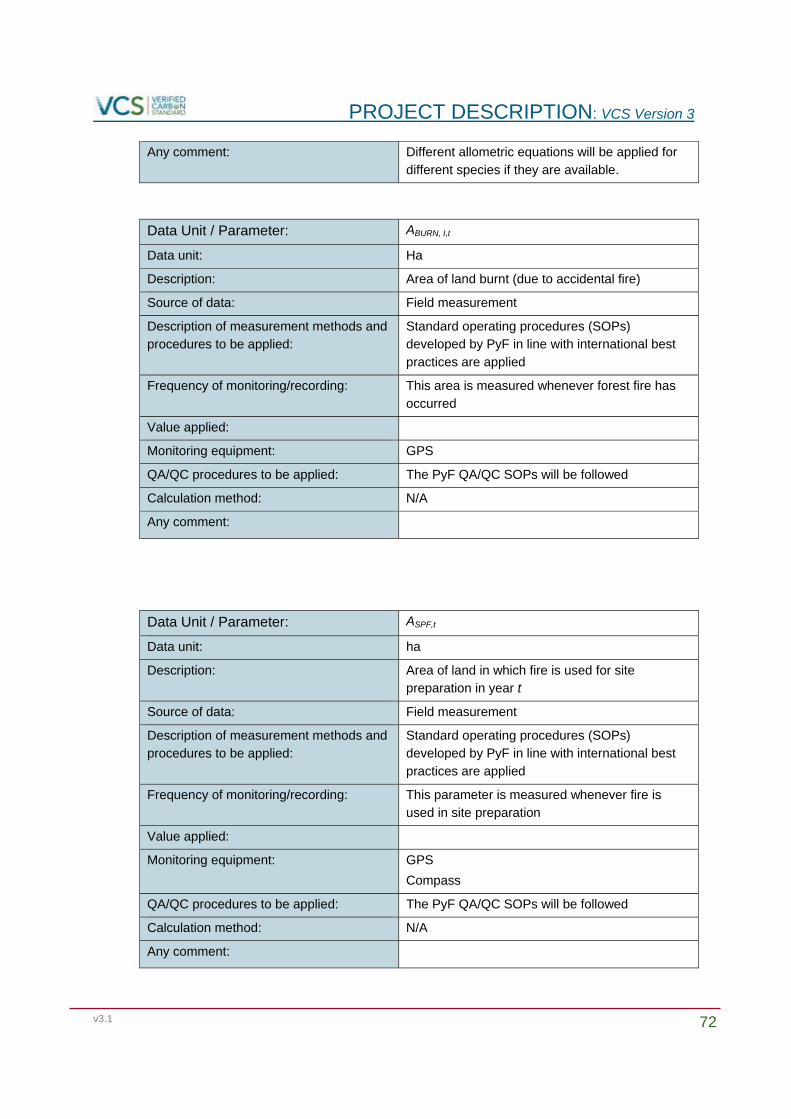
PROJECT DESCRIPTION: VCS Version 3
v3.1 72
Any comment: Different allometric equations will be applied for different species if they are available.
Data Unit / Parameter: ABURN, I,t
Data unit: Ha
Description: Area of land burnt (due to accidental fire)
Source of data: Field measurement
Description of measurement methods and procedures to be applied:
Standard operating procedures (SOPs) developed by PyF in line with international best practices are applied
Frequency of monitoring/recording: This area is measured whenever forest fire has occurred
Value applied:
Monitoring equipment: GPS
QA/QC procedures to be applied: The PyF QA/QC SOPs will be followed
Calculation method: N/A
Any comment:
Data Unit / Parameter: ASPF,t
Data unit: ha
Description: Area of land in which fire is used for site preparation in year t
Source of data: Field measurement
Description of measurement methods and procedures to be applied:
Standard operating procedures (SOPs) developed by PyF in line with international best practices are applied
Frequency of monitoring/recording: This parameter is measured whenever fire is used in site preparation
Value applied:
Monitoring equipment: GPS
Compass
QA/QC procedures to be applied: The PyF QA/QC SOPs will be followed
Calculation method: N/A
Any comment:
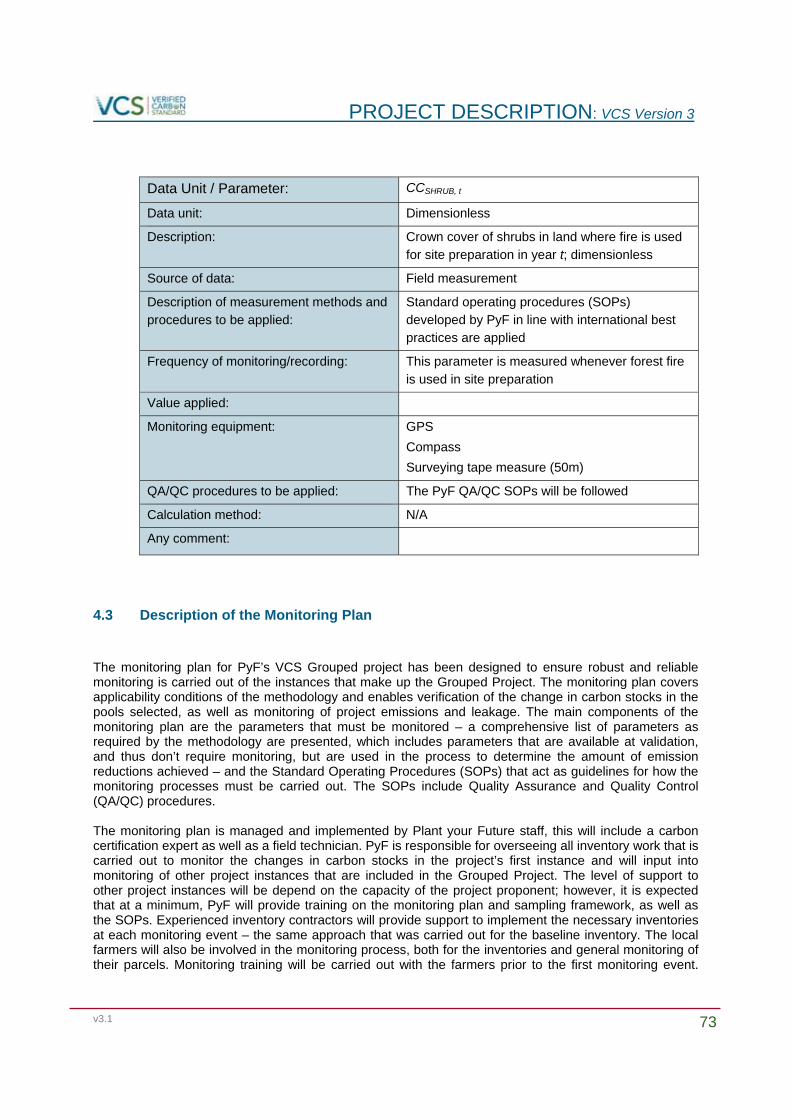
PROJECT DESCRIPTION: VCS Version 3
v3.1 73
Data Unit / Parameter: CCSHRUB, t
Data unit: Dimensionless
Description: Crown cover of shrubs in land where fire is used for site preparation in year t; dimensionless
Source of data: Field measurement
Description of measurement methods and procedures to be applied:
Standard operating procedures (SOPs) developed by PyF in line with international best practices are applied
Frequency of monitoring/recording: This parameter is measured whenever forest fire is used in site preparation
Value applied:
Monitoring equipment: GPS
Compass
Surveying tape measure (50m)
QA/QC procedures to be applied: The PyF QA/QC SOPs will be followed
Calculation method: N/A
Any comment:
4.3 Description of the Monitoring Plan
The monitoring plan for PyF’s VCS Grouped project has been designed to ensure robust and reliable monitoring is carried out of the instances that make up the Grouped Project. The monitoring plan covers applicability conditions of the methodology and enables verification of the change in carbon stocks in the pools selected, as well as monitoring of project emissions and leakage. The main components of the monitoring plan are the parameters that must be monitored – a comprehensive list of parameters as required by the methodology are presented, which includes parameters that are available at validation, and thus don’t require monitoring, but are used in the process to determine the amount of emission reductions achieved – and the Standard Operating Procedures (SOPs) that act as guidelines for how the monitoring processes must be carried out. The SOPs include Quality Assurance and Quality Control (QA/QC) procedures. The monitoring plan is managed and implemented by Plant your Future staff, this will include a carbon certification expert as well as a field technician. PyF is responsible for overseeing all inventory work that is carried out to monitor the changes in carbon stocks in the project’s first instance and will input into monitoring of other project instances that are included in the Grouped Project. The level of support to other project instances will be depend on the capacity of the project proponent; however, it is expected that at a minimum, PyF will provide training on the monitoring plan and sampling framework, as well as the SOPs. Experienced inventory contractors will provide support to implement the necessary inventories at each monitoring event – the same approach that was carried out for the baseline inventory. The local farmers will also be involved in the monitoring process, both for the inventories and general monitoring of their parcels. Monitoring training will be carried out with the farmers prior to the first monitoring event.
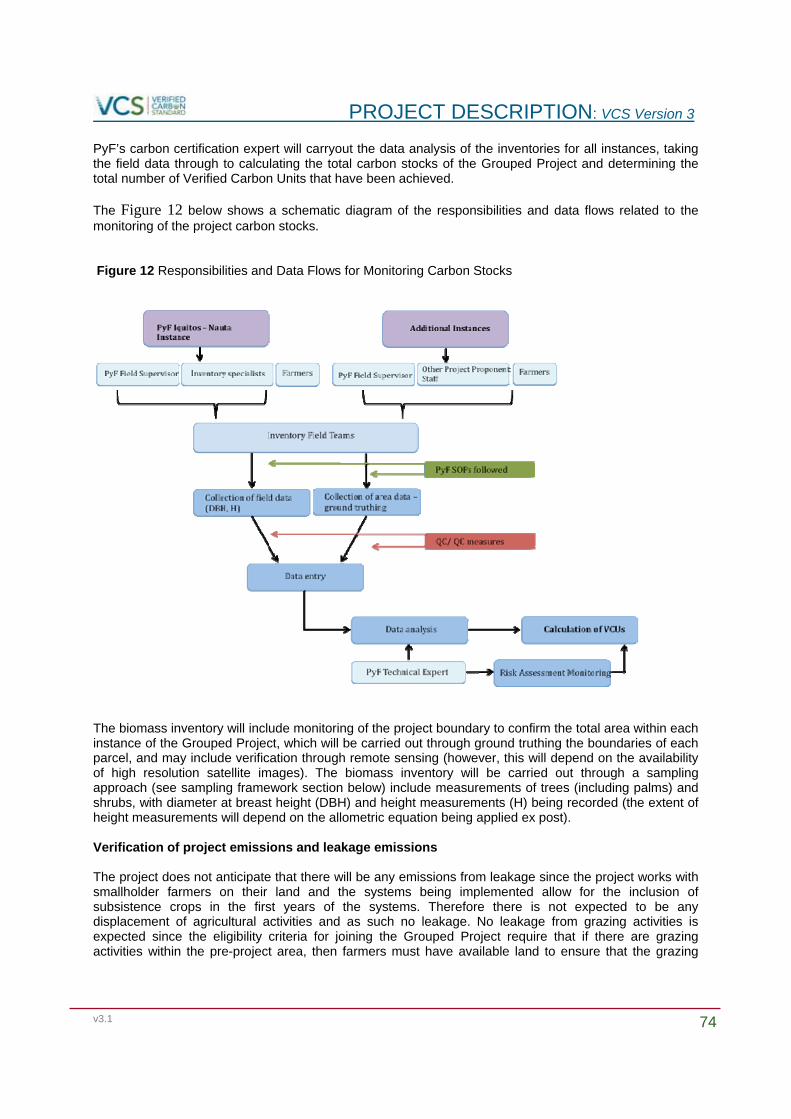
PROJECT DESCRIPTION: VCS Version 3
v3.1 74
PyF’s carbon certification expert will carryout the data analysis of the inventories for all instances, taking the field data through to calculating the total carbon stocks of the Grouped Project and determining the total number of Verified Carbon Units that have been achieved. The Figure 12 below shows a schematic diagram of the responsibilities and data flows related to the monitoring of the project carbon stocks. Figure 12 Responsibilities and Data Flows for Monitoring Carbon Stocks
The biomass inventory will include monitoring of the project boundary to confirm the total area within each instance of the Grouped Project, which will be carried out through ground truthing the boundaries of each parcel, and may include verification through remote sensing (however, this will depend on the availability of high resolution satellite images). The biomass inventory will be carried out through a sampling approach (see sampling framework section below) include measurements of trees (including palms) and shrubs, with diameter at breast height (DBH) and height measurements (H) being recorded (the extent of height measurements will depend on the allometric equation being applied ex post). Verification of project emissions and leakage emissions The project does not anticipate that there will be any emissions from leakage since the project works with smallholder farmers on their land and the systems being implemented allow for the inclusion of subsistence crops in the first years of the systems. Therefore there is not expected to be any displacement of agricultural activities and as such no leakage. No leakage from grazing activities is expected since the eligibility criteria for joining the Grouped Project require that if there are grazing activities within the pre-project area, then farmers must have available land to ensure that the grazing
PROJECT DESCRIPTION: VCS Version 3
v3.1 75
capacity of any displaced cattle can be met without the need to clear vegetation to create additional pastures. Project emissions are monitored through the application of the methodology’s tool, “Estimation of non-CO2 GHG emissions resulting from burning of biomass attributable to an A/R CDM project activity”. The parameters required from this tool are included in the monitoring plan and SOPs will be developed to provide guidance for how this should take place on the ground. Table 1, below, shows the emission sources and GHGs selected in line with the methodology. Table 21: Emission sources and GHGs selected for accounting
Sources Gas Whether Selected
Justification/Explanation
Burning of woody biomass
CO2 No CO2 emissions due to burning of biomass are accounted as a change in carbon stock
CH4 Yes Included in case of forest fires occurring.
N2O Yes Included in case of forest fires occurring.
Data management
All field data will be transferred to Excel files for archiving and data analysis with a quality control process of at least 10% of the data sheets being checked by a someone not involved in the field collection to ensure that the data has been entered correctly. The data will be backed up in a different location or in the ‘cloud’, and archived for a period of at least two years after the end of the crediting period of the project activity. Sampling framework The measurement of changes in carbon stocks in the project scenario will be carried out through biomass inventories that use a sampling approach to measure key tree data, including palms, (diameter at breast height and height) and shrub data (crown cover). The sample plots will be distributed between key strata identified through an ex post stratification of the project area. The number of sample plots will be estimated through application of the CDM tool, “Calculation of the number of sample plots for measurements within A/R CDM project activities, Version 02.1.0”. Sample plots will be randomly generated in the different parcels within each stratum using GIS prior to fieldwork being implemented – this will be done following the PyF SOP. Precision Requirements For the methodology, AR-ACM0003 Version 02.0.0, the tool “Estimation of carbon stocks and change in carbon stocks of trees and shrubs in A/R CDM project activities” sets the precision requirement. The precision requirement is an error of 10% at the 90% confidence interval. If the precision of the biomass inventory is not within this range, then the tool provides deduction rates that can be applied.
5 ENVIRONMENTAL IMPACT
The rainforest of Peru, known as the Western Arc of the Amazon Rainforest, is amongst the richest in the world, both in terms of biological diversity and natural resources. This diversity stems from the high and relatively seasonal rainfall in parts of the ecoregion. The complex topography and soils and vast river
PROJECT DESCRIPTION: VCS Version 3
v3.1 76
systems create a dynamic mosaic of habitats. This leads to an amazing growth of flora. Many species are endemic to these areas of forest and are present in great abundance only here. More than 310 tree species have been found to exist in a one hectare area in the Napo Moist Forests. Both the Ucayali and Loreto project instances are within the Napo Moist Forests eco-region and aim to restore degraded areas back to forest cover. The Loreto project area is adjacent to the species-rich Allpahuayo Mishana National Reserve which is home to many endangered species, including the Iquitos Gnatcatcher (Polioptila clementsi), classified as ‘critically endangered’ on the IUCN Red List, and found only on the rare white sand rainforest, with an estimated population of less than 100 specimens remaining. Despite the richness of Rainforest, it is being cut down, primarily through unsustainable agriculture. An environmental impact assessment was carried out by independent consultant Sara Mateo from November 2012-February 2013. Her assessment looked at the impact of the installation of agroforestry systems comprised of native species on degraded/deforested lands in the Peruvian Amazon. The assessment set out to review i) the environmental impacts (positive and negative) resulting from the project ii) understand the conservation value of the project, iii) identify potential indicators to monitor environmental impacts and iv) understand farmers perspectives on the environmental impact of the project. A full copy of this EIA is available to the auditor on request. Key findings are presented below. The project objectives are to reforest and restore, through sustainable agroforestry, areas of land degraded by smallholder agriculture. Through fieldwork and participative workshops with project beneficiaries, the following impacts relevant to biodiversity were identified:
The Project activities are implemented in areas which are already degraded or currently used for agriculture.
Activities are only being implemented in areas converted from forest to agricultural lands at least 10 years ago.
Therefore there is no deterioration of natural forest since the project will not be implemented in such areas.
The project favours environmentally friendly techniques, such as the use of natural fertilisers and biocides.
The project uses only traditional techniques suitable for the local environment. Only native or long established naturalised species will be planted
Therefore activities will not have a negative impact The project seeks to reconvert degraded areas to forest through reforestation (with timber and
fruit trees) The project will establish rules of conduct with the participants for sound management of plots
and rules for hunting These factors ensure that the project will have a positive impact on its surrounding environment.
Environmentally friendly techniques will be used for the protection of crops Improved value from production and the agricultural system is expected There will be an emphasis on implementation of activities for the strengthening of capacity of
local farmers, such as the establishment of nurseries that can supply plants to a greater number of smallholder farmers.
The finding of new partners is proposed to extend the livelihood impact in high value conservation areas.

PROJECT DESCRIPTION: VCS Version 3
v3.1 77
Through this the intention of the project is to achieve a wider overall positive impact. The result of the EIA is that the project will not have a negative impact on biodiversity or the environment, but rather positively supports conservation, helping to maintain the surrounding high value conservation areas. Other key points of note from the EIA:
Project activities are being implemented on areas of land which have already been degraded. Project activities involve the planting of native tree species so will increase forest cover and areas of forest habitat. The influence of the project is far greater than purely the hectares of reforestation implemented, and is designed to reduce the pressure on and deforestation rate in the existing rainforest. The intention of the project is to create an intensive agroforestry system where the farmer concentrates his activities within areas designated for the project, this reduces the need to transform forest to obtain new farm land and therefore reduces further deforestation. The Loreto Instance is located near the Allpahuayo-Mishana National Reserve. This location is very interesting in relation to creating transition habitat and potential connectivity by means of the agroforestry project. The area suffers from a high demographic pressure due to the city of Iquitos, which is a the only major urban centre in the region, and is the centre of diverse economic activities. Currently the area suffers from extreme poverty and environmental problems, such as the contamination of bodies of water, loss of soils and biodiversity through poor use of land and natural resources, etc. (IIAP, 2002). The EIA emphasises the important role that the project activities can play in protecting the remaining rainforest, as well as ensuring adequate buffer zones are maintained. The EIA also covers smallholder farmers perceptions of the biodiversity benefits of the project. The results of interviews with smallholder farmers revealed that more than 80% consider that the implementation of the reforestation project with agroforestry will bring the benefit of an increase in fauna in the area, especially for birds and small animals owing to the potential improved food sources.
6 STAKEHOLDER COMMENTS
The project has carried out extensive stakeholder consultation. This is a grassroots, and has its origins in farmers expressing their interest to the founders of Plant your Future (who were doing research in the region) of their wish to transition to more market-orientation, tree-based agriculture in recognitions their current systems are not sustainable and extremely-hard work for limited return. The project has been designed from the very start using a consultative and participatory process between farmers and technicians. Ultimately to allow participation in the project, farmers are required to sign a legal agreement with Plant your Future, which has now occurred in the case of those farmers who form part of the first instance. Stakeholder consultation is divided here into two categories i) with smallholder farmers ii) other stakeholder at the local, national and international level. Consultation with smallholder farmers: In order to benefit from the experience of farmers and their knowledge of land use, consultations and exchanges of ideas were carried out through-out the development of the project – during field visits, one-on-one meetings, informal small groups meetings and during the participative workshops led by the project technical team. This allowed many comments and questions to be raised, addressed and incorporated into the project design.

PROJECT DESCRIPTION: VCS Version 3
v3.1 78
Plant your Future, in collaboration with ProNaturaleza and Bosques Amazonicos carried out specific workshops to discuss elements of the project related to the VCS Carbon Project on the following dates: - 22nd October 2012, workshop with smallholder farmers in the village hall in Varillal. Presentation of
the project, interactive discussion and consultation. In addition to representatives from Plant your Future staff from ProNaturaleza, the World Agroforestry Centre (ICRAF) and the Instituto Interamericano de Cooperación para la Agricultura (IICA)
- 16th December 2012, workshop with smallholder farmers in the village hall in Varillal. Discussion of planting and management plan, and further Q & A on carbon elements of project.
- 20th January 2013, workshop with smallholder farmers in the village hall in Varillal. Review of guidelines for the management of plots, species and their availability and timing for cultivation, and agreement on timetable for project actions.
- 12th July 2013, workshop with smallholder farmers in the village hall in Varillal. Detailed discussion of legal elements of 30-year agreements between farmers and Plant your Future.
- 16th November 2013, informative and consultative meeting with smallholder farmers in Campo Verde, Ucayali convened by Bosques Amazonicos.
- 8-13thth November 2013, small-group meetings to discuss incorporation of feedback into legal agreements between farmers and Plant your Future. (list of participants from workshops available on request) The legal agreements between smallholder farmers and Plant your Future make provisions for an annual meeting between project beneficiaries and Plant your Future. However, there will also be on-going interactions between project beneficiaries and management on a constant basis.
Key questions which were raised by farmers during the consultative process: - why do they need to sign 30 years agreements specifically. - when will the carbon payments starts - can smallholders with existing land in the project add more hectares over time - can smallholders participate who don’t have full land title - how will the management plan for the agroforestry systems evolve over time - selection of trees species to plant
Summary of responses: – the minimum time frame allowable for a VCS project in accordance with the requirements of the non-
permanence risk tool is 30 years. This was explained to the smallholders, and hence that the selection of 30 years had been chosen to be the minimum permissible to still allow the project to be certified under the VCS, which was deemed the appropriate standard for this project.
– the exact date for the start of carbon payments is unclear and will depend on when the project finds a buyer. However, it is anticipated the first verification will occur around 3 years after the project start date. This is based on a cost-benefit analysis of the cost of verification versus the likely the carbon benefits. We determine until year 3 there will not be sufficient biomass to warrant a verification.
– the project is open to existing farmers adding further land into the programme as long as it meeting eligibility criteria, and the farmer has show commitment to the first hectare of agroforestry systems they’ve installed.
– smallholder farmers cannot receive carbon payments unless they have full land title. Preference will be given to farmers will full, documented land title. In exceptional cases the smallholder can hold possession title over the land only, but be in the advanced stages of and committed to obtaining complete title. The complete title must be obtainable before verification and receiving any carbon payments.
– whilst a general management plan has been developed for the duration of the project, a more specific management plan will be developed every 5 years. Adaptive management will be used by the project, to update the management and adjust to field conditions as the project evolves. Given the last of precedent and technical specifications for agroforestry systems of this composition in the
PROJECT DESCRIPTION: VCS Version 3
v3.1 79
Peruvian Amazon the project is seen as innovative at this stage, which does mean management will have to flexible to respond to conditions and growth.
– the final selection of trees to plant has taken into account technical advice from local agronomy specialists, studies on the marketability of the products and fruits as well as farmer preferences to develop a planting regime which the project hopes has the best potential to succeed inline with the objectives of the project.
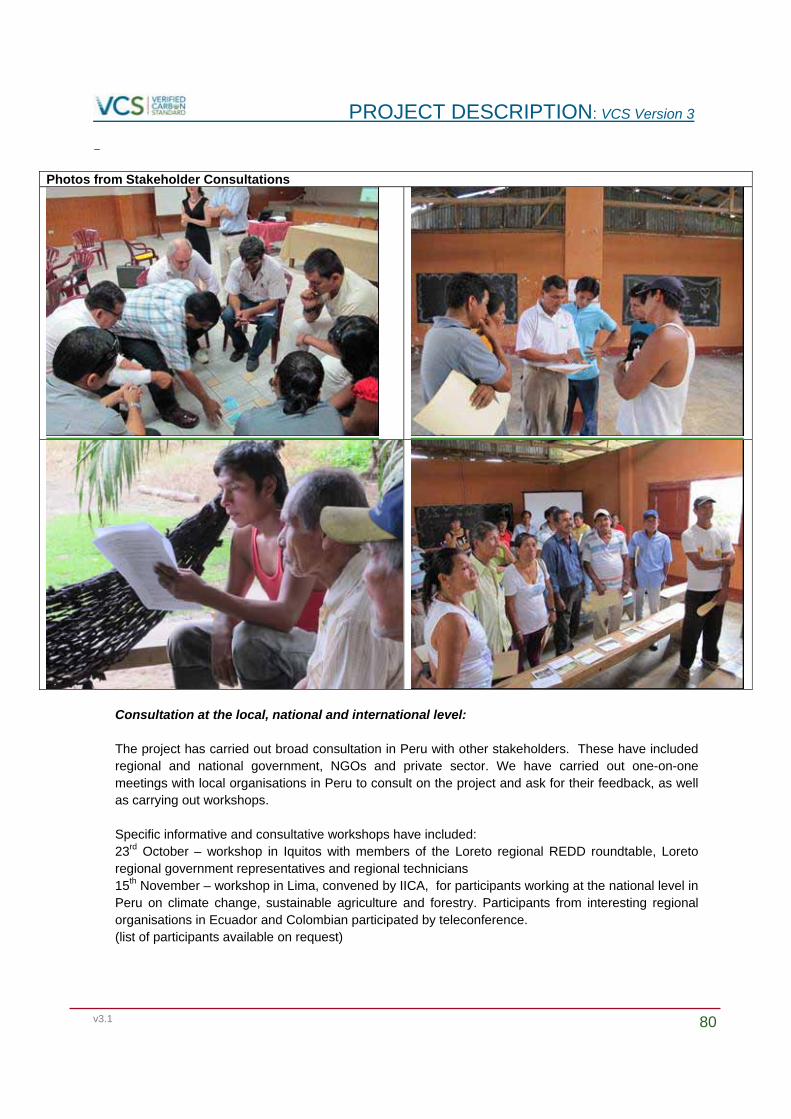
PROJECT DESCRIPTION: VCS Version 3
v3.1 80
-
Photos from Stakeholder Consultations
Consultation at the local, national and international level: The project has carried out broad consultation in Peru with other stakeholders. These have included regional and national government, NGOs and private sector. We have carried out one-on-one meetings with local organisations in Peru to consult on the project and ask for their feedback, as well as carrying out workshops. Specific informative and consultative workshops have included: 23rd October – workshop in Iquitos with members of the Loreto regional REDD roundtable, Loreto regional government representatives and regional technicians 15th November – workshop in Lima, convened by IICA, for participants working at the national level in Peru on climate change, sustainable agriculture and forestry. Participants from interesting regional organisations in Ecuador and Colombian participated by teleconference. (list of participants available on request)
PROJECT DESCRIPTION: VCS Version 3
v3.1 81
The legal agreement between farmers and Plant your Future also underwent independent consultation to reach the final version, being reviewed by representatives of IICA, the Finnish Government (donor), Peruvian National legal experts selected by IICA and ProNaturaleza. Comments from stakeholders have been supportive of the project. The innovative nature of the programmatic approach in Peru has meant many stakeholders required initial capacity building in the concept and structure of the project. There are no specific outstanding question or observations from stakeholders. The project will continue to meet regularly with the local community in Iquitos and Pucallpa and will have an ‘open-door’ policy in terms of explaining our activities and receiving feedback. We will continue to convene annual meetings in Peru to bring together technicians to discuss the project.