Planning Rescue Services with Non-Stationary Rescue Units
17
Planning Rescue Services with Non-Stationary Rescue Units Anders Dahlgren*, National Rural Development Agency, Ostersund, Sweden Lars Harrie, GIS Centre, Lund University, Lund, Sweden Anders Axelsson, Swedish Rescue Services Agency, Karlstad, Sweden Received: 26 November 2007/Accepted: 11 April 2008 Abstract. Geographical accessibility is fundamental when planning rescue services. At present there are several programs for computing the accessibility of stationary rescue units. This study suggests a method for evaluating geographic accessibility in scenarios containing also non-stationary units. The method supports the planning process by matching the risk of an incident occurring with the rescue unitsÕ capabili- ties and accessibility. The method is implemented in the computer program Rescue Unit Planner. The result of the analysis is presented in thematic maps and graphs as level of coverage, mean response time and concentration. The method and the com- puter program have been evaluated in two case studies: one urban area in southern Sweden and one rural area in northern Sweden. The case studies show that that this method can be useful in the rescue service planning process. Keywords: rescue service, accessibility, planning, non-stationary units, level of coverage, mean response time, concentration 1. Introduction The study presented in this paper is about rescue service planning. There are sev- eral methods that can be used to support the planning process such as cost-benefit analysis [1, 2]. This study concentrates on the geographic accessibility aspect of the planning process. The motivation for this research is the importance of being able to evaluate the geographic accessibility of stationary and non-stationary units in the rescue service. To evaluate the geographic accessibility we need to know the geographic distribution of the risks for accidents. Later in this article a risk-layer is introduced; this risk layer describes the probability of a risk of a certain type occurring in a particular geographic place. In this article we define a non-stationary rescue unit as a unit that is stationed within an area, rather than at a point. For example, a firefighter with equipment in his car when he is carrying out inspections within a predefined area. Other examples of non-stationary units could be roving units, units moving in a sector [3] and semi-stationary units that are relocated to a place with a high level of risk [2] (often denoted system status management, cf. [4]). An important distinction * Correspondence should be addressed to: Anders Dahlgren, E-mail: [email protected] Fire Technology, 45, 239–255, 2009 Ó 2008 Springer Science+Business Media, LLC. Manufactured in The United States DOI: 10.1007/s10694-008-0051-y 12
-
Upload
anders-dahlgren -
Category
Documents
-
view
222 -
download
6
Transcript of Planning Rescue Services with Non-Stationary Rescue Units

Planning Rescue Services withNon-Stationary Rescue Units
Anders Dahlgren*, National Rural Development Agency, Ostersund, Sweden
Lars Harrie, GIS Centre, Lund University, Lund, Sweden
Anders Axelsson, Swedish Rescue Services Agency, Karlstad, Sweden
Received: 26 November 2007/Accepted: 11 April 2008
Abstract. Geographical accessibility is fundamental when planning rescue services.
At present there are several programs for computing the accessibility of stationaryrescue units. This study suggests a method for evaluating geographic accessibility inscenarios containing also non-stationary units. The method supports the planning
process by matching the risk of an incident occurring with the rescue units� capabili-ties and accessibility. The method is implemented in the computer program RescueUnit Planner. The result of the analysis is presented in thematic maps and graphs aslevel of coverage, mean response time and concentration. The method and the com-
puter program have been evaluated in two case studies: one urban area in southernSweden and one rural area in northern Sweden. The case studies show that that thismethod can be useful in the rescue service planning process.
Keywords: rescue service, accessibility, planning, non-stationary units, level of coverage, mean response
time, concentration
1. Introduction
The study presented in this paper is about rescue service planning. There are sev-eral methods that can be used to support the planning process such as cost-benefitanalysis [1, 2]. This study concentrates on the geographic accessibility aspect ofthe planning process. The motivation for this research is the importance of beingable to evaluate the geographic accessibility of stationary and non-stationary unitsin the rescue service. To evaluate the geographic accessibility we need to know thegeographic distribution of the risks for accidents. Later in this article a risk-layeris introduced; this risk layer describes the probability of a risk of a certain typeoccurring in a particular geographic place.
In this article we define a non-stationary rescue unit as a unit that is stationedwithin an area, rather than at a point. For example, a firefighter with equipmentin his car when he is carrying out inspections within a predefined area. Otherexamples of non-stationary units could be roving units, units moving in a sector[3] and semi-stationary units that are relocated to a place with a high level of risk[2] (often denoted system status management, cf. [4]). An important distinction
* Correspondence should be addressed to: Anders Dahlgren, E-mail: [email protected]
Fire Technology, 45, 239–255, 2009
� 2008 Springer Science+Business Media, LLC. Manufactured in The United States
DOI: 10.1007/s10694-008-0051-y12

between a static and non-static unit is that the non-static unit does not need toreturn to a fire station before responding to an accident.
There are a number of planning methods that support planning for rescue unitswith a static placement. However, over the last few years several rescue serviceshave started testing non-stationary units. The consequences of using these non-stationary units present new challenges in the planning process.
The aim of this study is to establish new methods and develop a tool for sup-porting rescue service planning that includes non-stationary units. This includesthe possibility of testing scenarios using stationary units, non-stationary units or acombination of the two types of units.
The paper is structured as follows: It starts with the project�s background andsome related studies. In the fourth section the methodology of using non-station-ary units is described. This methodology is implemented in a tool for rescue plan-ning (Section 5) that is evaluated in two case studies (Section 6). The paper endswith discussion and conclusions.
2. Background
In many ways the fire and rescue services in Sweden can be regarded as fairly con-servative and traditional. The organisational structures have not changed sincethey used horses and steam-powered water pumps. The traditional approach,which is used all around the world, is to have a fire station from which the rescueservices respond to emergency situations. In some fire and rescue services inSweden the effectiveness of this traditional organisation is being questioned, whichhas been triggered by both financial reasons and a new law (SFS 2003:778Swedish Civil Protection Act) that has placed tougher requirements on the rescueservices� provision of an efficient organisation.
In Sweden, as in several other countries, there is increasing interest in non-sta-tionary units. Some rescue services now have a mixture of stationary and non-sta-tionary units. There are two primary reasons for using non-stationary units. Firstof all, it enables a more effective use of fire service personnel; the most substantialcost in the administration of a fire and rescue service is personnel. Traditionally,fire and rescue service personnel are divided into two distinct functions, one thatoften exclusively deals with emergency responses and another that primarily focu-ses on fire prevention and inspections. In the face of budget cuts, the integration ofthese two functions are evaluated in order to increase efficiency. However, organi-sational changes are necessary in order to achieve this. The most common staffingpattern at Swedish fire stations is one officer and four firefighters. They normallyperform their daily duties together at the station and travel in the same vehicle toincident scenes. In order for the crew to be able to perform preventive action thisstructure needs to be revised. For example, it would not be an efficient use ofresources to send the whole crew to carry out an inspection that only requires onefire fighter. In order to be effective the crew needs to split up, so that the stationaryunit comprised of five fire fighters is replaced by smaller non-stationary units thatmeet at the incident scene and form the full response unit on site.
240 Fire Technology 2009

The second reason for introducing non-stationary units is that it results indecreased response times at the same cost as for stationary units, or with evenlower costs. The reason for this is that transferring responses from large station-ary units to smaller non-stationary units, which are distributed over the area ofcoverage, will enhance fire service coverage for immediate, often vital, emergencyactions.
The benefit provided by non-stationary units is of course related to these units�capabilities; their major advantages are in the type of incidents where non-station-ary units have enough capacity (or where the non-stationary unit could take vitalearly action at the incident site). For accidents that immediately require morespecialised persons and equipment there are now real advantages to be found withnon-stationary units.
A decision of introducing non-stationary units must be based on objective facts.One important fact is the coverage of the rescue service. Hence, we need a simula-tion model that can handle response time calculations for non-stationary emer-gency vehicles.
3. Related Studies
Geographic accessibility is a much studied field in diverse areas of application,such as health geographics [5], transport modelling [6] and logistics [7]. It is also amain topic in rescue service planning. There are currently several commercial pro-grams that can be used for planning rescue service. Common programs in Swedenare Geosecma—Alarmos [8] and Effektanalys [9]; other examples are FSEC (FireService Emergency Cover) [10] and ADAM (Deccan International) [11]. Commonfor these programs are that they only can process stationary units.
There is substantial research in geographic accessibility for rescue services.Kolesar and Blum [12] predict the amount of resources required to obtain a cer-tain (average) response time. That is, they predict the number of rescue unitsrequired, but not where to place these units. Other researchers have studied prob-lems related to where to locate fire stations and other rescue resources. An earlystudy by Hogg [13] presents a method for locating fire stations in which the maincriterion is that each station must be financially viable, meaning that the optimumnumber of fire stations and their best position in relation to each other will mini-mise total losses from fire. In order to model this information about incident risksand travel time via the road network a similar approach is proposed by Toregaset al. [14]. In this study an upper limit is placed on the response time, and anoptimisation problem is solved in order to find locations for fire stations that min-imise costs whilst adhering to the response time. Karasakal and Karasakal [15]use a similar optimisation approach, where they introduce the concept of partialcoverage. A partially covered area is the area between the fully covered area(i.e. reached within the predefined response time) and the area without coverage.Andersson and Varbrand [16] studied the problem of dynamic relocation ofresources (in their case ambulances, but the concept is also valid for rescue units,see also [17]). Their idea is to build a decision support system that considers the
Planning Rescue Services 241

current location of resources and the possible relocation of resources in order tobetter meet incident risks. A related problem was studied by Swersey [18]. Hedeveloped a decision model for the number of units to send to an alarm. Thisdecision model balances the risk of delayed response (by not immediately sendingall available resources) with the risk of lowered capacity for later alarms (if toomany resources are sent to the first alarm). Huang and Pan [19] also developed adecision model for dispatching response units. In their model they considered traf-fic flow to obtain a better estimation of travel times. Finally, Andersson andSardqvist [20] optimised the location of rescue service resources. In their modelthey allow resources (e.g. small rescue units) to be placed outside the fire station,but all the resources have a fixed spatial location (i.e. non-stationary units are notallowed). The cost function that is optimised in their model is equal time, which isdefined as the integral of the rescue resources (here number of persons) as a func-tion of response time.
4. Methodology
4.1. Risk and Capacity
Smaller non-stationary units (e.g. first response units) do not have the capacity toundertake the required rescue actions at a large incident, due to a lack of peopleand equipment. That is, in order to take action at an incident it may be necessaryto combine one or more non-stationary rescue units with stationary units. Theplanning process requires that we have a good model for risk and capacity. In thisstudy we have used a model presented by Svensson and Sardqvist [21]. This modelconcentrates on a number of common types of incidents and the capacities of therescue units that are sent to respond to the incident (Tables 1, 2). The model oftenhas to be extended. For example, a small non-stationary unit could have halfcapacity, meaning that two units are required to obtain full capacity.
In a planning situation the risk levels for the different incident types are impor-tant. In our study, NCO (the Swedish Centre for Lessons Learned from Incidents& Accidents) produced map layers where the risks of different types of incidentsoccurring are presented (cf. Table 2). The map layers consist of a raster with a cellsize of 250 · 250 m. The layers, which are hereafter denoted as risk layers, havean estimated risk value for each incident type. NCO estimated the risk values by
Table 1Unit Capacities (From [21], SomewhatSimplified)
A Person release tools for use in vehicle accidents
B Firefighting
C Height work in houses lower than 4 floors
D Height work in houses 4 floors or higher
E Water supply
F Water rescue
242 Fire Technology 2009

using regression models. These models describe reported incidents using statisticsabout inhabitants (including socio-economic factors), buildings, traffic flow, etc.and the models can therefore be used to forecast future incidents.
4.2. Measures of Geographic Accessibility for Stationary Units
In order to measure geographic accessibility we need well defined measures (seea general overview in [22]). In our study these measures are based on the risklayers. This means that to compute geographic accessibility we need a risk layerwith the same area as the study area. In this study we used the followingmeasures:
4.2.1. Level of Coverage. This is the level of risk covered as a function of responsetime. Here, the response time is defined as the elapsed time from the emergencycall until enough capacity (personal and equipment according to Table 2) is avail-able at the incident location. It should be noted that the level of coverage isdefined as the level of risk covered, and not the level of inhabitants or space.
4.2.2. Mean Response Time. This is the mean value of all response times (RT).The normalization factor is the risk level; i.e., we have the following definition ofmean response time (MRT):
MRT ¼
Pn
j¼1RTj � riskj
Pn
j¼1riskj
where:
RTj is response time for cell j in the risk layer,riskj is the probability of an incident in cell j, andn is the number of cells in the risk layer.
Table 2Incident Classification and Capacities Required (From [21], SomewhatSimplified)
Incident type Extent Required capacity
Fire in building One-family house B
Multiple-family house, low B + C
Multiple-family house, high B + D
Public building B + C + E
Work locality B + C + E
Traffic accident Single vehicle accident A + B
Multiple vehicle accident A + B
Heavy vehicle accident A + B
Planning Rescue Services 243

4.2.3. Concentration. This measure varies depending on the position in the studyarea. It is defined as the number of persons that could be present at the incidentlocation as a function of time. The measure of concentration does not take thepersons� capacity into account.
4.3. Measures of Geographic Accessibility for Non-Stationary Units
Since the location of non-stationary units is not precisely known, measures of geo-graphic accessibility will be probability measures. In our study we have workedwith three cases for non-stationary units (see Figure 1).
The mean and the standard deviation of the response time are estimated bycomputing the response time for the non-stationary units� different locations.To study the effect of selecting locations a minor test was performed in themunicipality of Kavlinge, southern Sweden (Figures 3 and 4). Two non-station-ary units were defined, one in the village of Kavlinge and one in the village ofLoddekopinge. Both units could be located anywhere within the village border.Both of the units had capacity for the risk type being studied and both had aresponse time of 5 min. In this study we only used the risk category of ‘‘fire inbuildings, one-family house’’ (cf. Table 1) and used a risk layer with a geometricresolution of 250 m. Three different strategies were used for the computations.
5% 5%
Pro
bab
ility
Response time for a non-stationary unit
Meanresponse
time
90%
Most favourable case
Least favourable case
Figure 1. Definition of the normal, least favourable and mostfavourable case. For the normal case the mean response time is used.For the least favourable case the response time corresponding to95% of all cases is used and, finally, for the most favourable case theresponse time corresponding to 5% of all cases is used. The values forthe most (least) favourable case are computed using the mean valueand standard deviation of the response time and assume that theresponse times are normally distributed (i.e., the t-distribution isapplied because the standard deviations are estimated).
244 Fire Technology 2009

Four methods were used to select locations for the non-stationary units forestimating the response times. For the all points method one location iscomputed for each cell in the risk layer within the area for the non-stationaryunit. In this case, this equals 80 locations for the unit in Kavlinge and 90 loca-tions for the unit in Loddekopinge. In the second method, 20 random points, weselected a random subset of these locations. The reason for this method is todecrease computational load (the program has to compute the network distancefrom each location to each cell in the risk layer). In the third method we selec-ted 10 random points. In the fourth and final method we used the break pointsfor the polygon as locations. The mean response times for the four differentmethods are given in Table 3. The most accurate estimation of the responsetime is the all points method (if we assume that the likelihood for the locationof the non-stationary units in the area is uniform). We can see that a good esti-mation is obtained by only using a subset of the locations in the computations(10 and 20 random points). Therefore, this is the method we recommend forpractical computations if the area is too large to use all the cells in the risklayer as possible locations. Using the polygons� break points as locations doesnot provide a good estimation. The main reason is that in this case the rescueunit is never modelled within the area in which a major part of the incidentsoccur.
In practice there is often a mixture of stationary and non-stationary units.In those cases we also have to compute the most and least favourable case. Forthe stationary units the response time for these cases equals the normal responsetime.
5. A Tool for Planning Using Non-Stationary Rescue Units
5.1. Introduction
The Rescue Unit Planner (RUP) is a tool that is that is being developed for use inthe rescue services� planning process (Figure 2). The tool targets a user group con-sisting of planners and evaluators at the county or municipal level. In Sweden the
Table 3Mean Response Time Computed for Two Non-Stationary Units in theMunicipality of Kavlinge (see Figure 4)
Method for selecting
locations
Most favourable
case
Normal case Least favourable
case
All points 13 min, 53 s 18 min, 26 s 24 min, 40 s
20 Random points 14 min, 4 s 19 min, 14 s 24 min, 24 s
10 Random points 13 min, 46 s 18 min, 50 s 23 min, 54 s
Break points 12 min, 9 s 21 min, 1 s 29 min, 51 s
It should be noted that this study is only used for studying methodology for non-stationary units. In reality the two
rescue units are not capable of serving the whole municipality of Kavlinge
Planning Rescue Services 245

county administrative boards are responsible for evaluating the plans drawn up bythe rescue service planners at the municipal level.
In RUP, users can build different scenarios for rescue units, their equipmentand their placement. Then the scenarios can be tested against each other. Theresult is then presented using numerical data, diagrams and thematic maps.
5.2. Rescue Unit Planner—RUP
Rescue Unit Planner is a desktop application developed in C# for the Windowsenvironment. It uses the MapExtreme module for its mapping capability [23] andthe Netrider module for accessibility analysis [24–26].
To start a project in RUP the user has to define the geographic area by choos-ing a background map, a risk layer and a road network that covers the projectarea. The risk layer is a tiled GIS layer that describes the distribution of a partic-ular risk in the region. In the next step the user places different types of units intheir geographic positions. Because of the application�s mapping capabilities this isdone by digitising. If it is a stationary unit a point is digitised. In the case of anon-stationary unit an area within the unit is allowed to move and is digitised(cf. Figure 10). Accessibility data is calculated for each of the units.
In the third step, scenarios that are evaluated in the analysis are constructed bychoosing different combinations of the digitised units. In the last step, the joint
Figure 2. The Rescue Unit Planner�s user interface.
246 Fire Technology 2009

accessibility for a scenario is calculated and the result is presented in diagrams aslevel of coverage, mean response time and concentration. It is then possible for theuser to compare different scenarios and see how the joint capability of the sce-nario covers the risks in the risk layer.
6. Case Studies
Two case studies were performed. The first region is an urban region in southernSweden and the second a rural area further north in Sweden (Figure 3). The pointof the regional case study is to look at different scenarios for locating and equip-ping rescue units. The major aim of the studies is to evaluate RUP�s capabilitieswhen handling non-stationary rescue units in the planning process. This articlefocuses on the methods used in the case studies. Details and results of the casestudies are presented in [27] and [28] for the southern study area and in [29] forthe northern study area.
Figure 3. The study areas� location in Sweden.
Planning Rescue Services 247
6.1. Urban Region in Southern Sweden
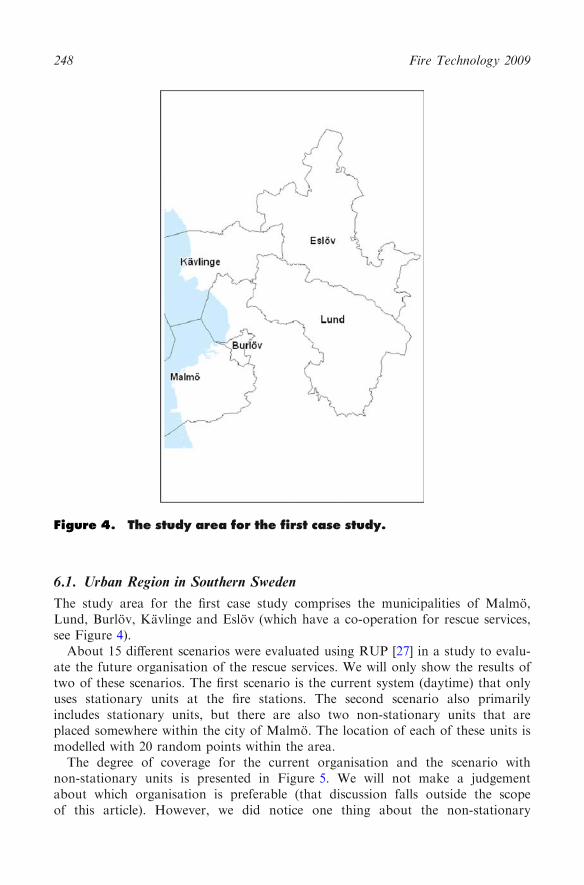
The study area for the first case study comprises the municipalities of Malmo,Lund, Burlov, Kavlinge and Eslov (which have a co-operation for rescue services,see Figure 4).
About 15 different scenarios were evaluated using RUP [27] in a study to evalu-ate the future organisation of the rescue services. We will only show the results oftwo of these scenarios. The first scenario is the current system (daytime) that onlyuses stationary units at the fire stations. The second scenario also primarilyincludes stationary units, but there are also two non-stationary units that areplaced somewhere within the city of Malmo. The location of each of these units ismodelled with 20 random points within the area.
The degree of coverage for the current organisation and the scenario withnon-stationary units is presented in Figure 5. We will not make a judgementabout which organisation is preferable (that discussion falls outside the scopeof this article). However, we did notice one thing about the non-stationary
Figure 4. The study area for the first case study.
248 Fire Technology 2009
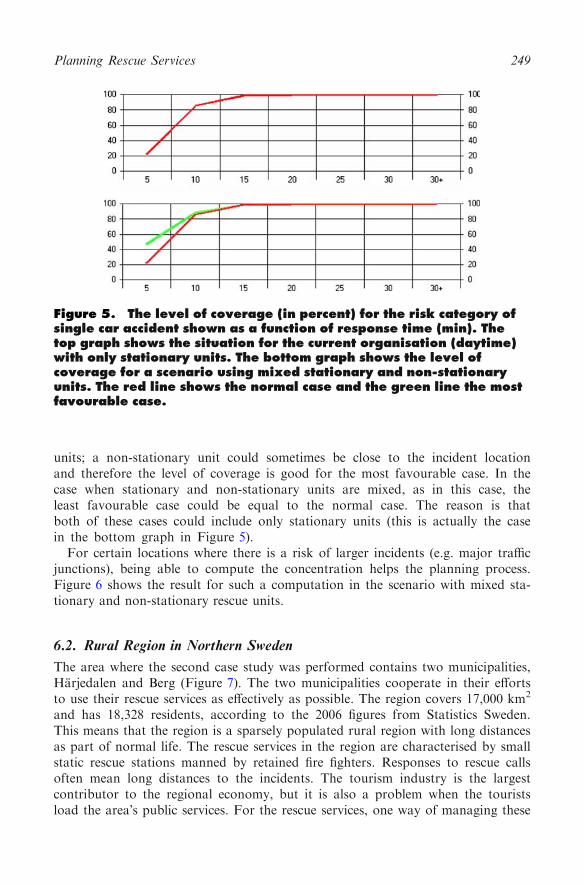
units; a non-stationary unit could sometimes be close to the incident locationand therefore the level of coverage is good for the most favourable case. In thecase when stationary and non-stationary units are mixed, as in this case, theleast favourable case could be equal to the normal case. The reason is thatboth of these cases could include only stationary units (this is actually the casein the bottom graph in Figure 5).
For certain locations where there is a risk of larger incidents (e.g. major trafficjunctions), being able to compute the concentration helps the planning process.Figure 6 shows the result for such a computation in the scenario with mixed sta-tionary and non-stationary rescue units.
6.2. Rural Region in Northern Sweden
The area where the second case study was performed contains two municipalities,Harjedalen and Berg (Figure 7). The two municipalities cooperate in their effortsto use their rescue services as effectively as possible. The region covers 17,000 km2
and has 18,328 residents, according to the 2006 figures from Statistics Sweden.This means that the region is a sparsely populated rural region with long distancesas part of normal life. The rescue services in the region are characterised by smallstatic rescue stations manned by retained fire fighters. Responses to rescue callsoften mean long distances to the incidents. The tourism industry is the largestcontributor to the regional economy, but it is also a problem when the touristsload the area�s public services. For the rescue services, one way of managing these
Figure 5. The level of coverage (in percent) for the risk category ofsingle car accident shown as a function of response time (min). Thetop graph shows the situation for the current organisation (daytime)with only stationary units. The bottom graph shows the level ofcoverage for a scenario using mixed stationary and non-stationaryunits. The red line shows the normal case and the green line the mostfavourable case.
Planning Rescue Services 249

special conditions is to evaluate the possibility of using temporary non-stationaryvehicles or static units during the holiday season.
A large ski-resort has been built in one geographically small area on the borderbetween the two municipalities (see Figures 7 and 8). The resort is now planningon expanding from �13,000 to �32,000 tourist beds in the area [30, 31]. Thisentails new challenges for the rescue services in the two municipalities.
Two scenarios were evaluated in a test. Firstly, a scenario like the current situa-tion in the test area (Figure 9) with three static rescue units placed in Vemdalen,Asarne and Ratan. The result of the coverage level calculation is shown inFigure 11 (top graph). In one of the possible scenarios, three first response units
Figure 6. The concentration for a roundabout north-east of the city ofMalmo (marked with a green circle) for a scenario using a mix ofstationary and non-stationary units. The stationary units are placed atthe fire stations (red squares) and the non-stationary units are placedsomewhere within the city of Malmo. The graph shows the number ofpersons (y axis) that could be present at this location as function oftime (min, x axis). The green line shows the most favourable case, thered the normal case, and the blue line shows the least favourablecase.
250 Fire Technology 2009

Study area Ski-resort Vemdalen
Östersund
YtterhogdalYtterhogdalYtterhogdalYtterhogdalYtterhogdalYtterhogdalYtterhogdalYtterhogdalYtterhogdal
LosLosLosLosLosLosLosLosLos
LillhärdalLillhärdalLillhärdalLillhärdalLillhärdalLillhärdalLillhärdalLillhärdalLillhärdal
SvegSvegSvegSvegSvegSvegSvegSvegSveg
VemdalenVemdalenVemdalenVemdalenVemdalenVemdalenVemdalenVemdalenVemdalen
SvenstavikSvenstavikSvenstavikSvenstavikSvenstavikSvenstavikSvenstavikSvenstavikSvenstavik
ÅsarneÅsarneÅsarneÅsarneÅsarneÅsarneÅsarneÅsarneÅsarne
KlövsjöKlövsjöKlövsjöKlövsjöKlövsjöKlövsjöKlövsjöKlövsjöKlövsjö
IdreIdreIdreIdreIdreIdreIdreIdreIdre
SärnaSärnaSärnaSärnaSärnaSärnaSärnaSärnaSärna
FunäsdalenFunäsdalenFunäsdalenFunäsdalenFunäsdalenFunäsdalenFunäsdalenFunäsdalenFunäsdalen
HedeHedeHedeHedeHedeHedeHedeHedeHede
Figure 7. The Vemdalen study area, on the border of Berg andHarjedalen municipalities.
Figure 8. Expansion plans for new tourist beds in the Vemdalenstudy area.
Planning Rescue Services 251

were added to the current scenario, Figure 10. Two static units in Bjornrike andVemdalsskalet and one non-stationary in Storhogna (modelled with randompoints). The bottom graph in Figure 11 shows the level of coverage for thatpossible scenario.
Figure 9. The current scenario for rescue units in the Vemdalen area.
Figure 10. A possible scenario adding three first response units tothe current scenario (one non-stationary unit).
252 Fire Technology 2009

7. Discussion
When two scenarios are compared with each other we use three types of measuresthat are commonly used in the rescue services: level of coverage, mean responsetime and concentration. There is one drawback to these measures, they are onlycapable of modelling zero or full capacity for a given risk category. There aremany circumstances in which it would be interesting to model partial capacity(e.g. the capacity of a small unit that could arrive early at the incident) (see [19]).Our tool could be extended to compute other measures that consider partialcapacities and present the results using new types of diagrams or thematic maps.
The concept of using two case studies in the project highlighted importantaspects of the differences in the planning process for urban and rural areas. Thisis important when considering whether an application is to be developed to sup-port the planning process in different types of areas. One example of this is that inrural areas the rescue services use retained firefighters and recruitment problemscan influence the location of the rescue services. The same problem is not found inurban areas, which have full-time firefighters. Another example is that responsetimes that are considered unacceptable in urban areas are considered acceptable inrural areas. This places different demands on a planning tool, which a developermust take into account when developing a program that works both in urban andrural areas.
Rescue Unit Planner is a good tool for evaluating a proposed rescue organisa-tion. With just a couple of hours� introduction the prototype users were able toproduce their own analysis, indicating high usability. When working with the
Figure 11. The level of coverage (in percent, y axis) for the riskcategory of a one-family house fire as a function of response time(min, x axis) in the Vemdalen study area. The top graph shows thecurrent situation and the bottom graph shows a scenario usingnon-stationary units. The red line shows the normal case, the greenline the most favourable case and the blue line the least favourablecase.
Planning Rescue Services 253

prototype in a group, the prototype acted as a catalyst for interesting discussions.The relatively high resolution of source data worked well in the application.Calculation times were reasonable and will probably show additional improvementin a real application. The next step is to integrate it with a tool for optimising thelocation of stationary rescue units (described in [19]). We anticipate that this will bethe major tool for planning rescue services in Sweden in a few years.
One important issue that became obvious when working on the case studies wasthe association between risk and a particular unit�s capabilities, based on discus-sions in the reference groups among people with knowledge of rescue service plan-ning. This is a key problem area that must have a good solution in order torender a tool like RUP trustworthy.
8. Conclusions
In this paper we have proposed a methodology for planning rescue services thatincludes non-stationary units. This methodology includes both computationalmethods and measures of geographic accessibility. We have used traditional mea-sures of geographic accessibility (level of coverage, mean response time and concen-tration) but instead of using single values (used for stationary units) we useprobabilistic measures.
The methodology was implemented in a tool for rescue planning (RUP) andtwo case studies have been used to evaluate it. The results show that RUP, andother tools based on similar theories, could be used as support when planning res-cue services using non-stationary units.
Acknowledgements
This study is part of the Geographic Accessibility Studies project. Financial sup-port from the Swedish Rescue Services and Swedish National Rural DevelopmentAgency is acknowledged. Thanks to the rescue services in Malmo, Berg andHarjedalen for their cooperation on the case studies. We would especially like tothank Johan Danielsson, Rima Adawi, Sven-Erik Svensson (rescue services in BergMunicipality) and Kurt Svensson (rescue services in Harjedalen Municipality). Weare also thankful to Tobias Andersson (Linkoping University), Anders Ostman(University of Gavle) and Martin Palm for valuable comments.
References
1. Jadell H (2004) Tidsfaktorns betydelse vid raddningsinsatser. Rescue Services Agency2. Savas ES (1969) Simulation and cost-effectiveness analysis of New York�s emergency
ambulance service. Manage Sci v15:B608–B6273. Larson RC (1975) Approximating the performance of urban emergency service systems.
Oper Res 23(5):845–868
4. Stout J (1983) System status management: the strategy of ambulance placement. JEMS9(5):22–32
254 Fire Technology 2009

5. Guagliardo MF (2004) Spatial accessibility of primary care: concepts, methods andchallenge. Int J Health Geogr 3(3)
6. Berglund S (2001) GIS in transport modelling. Doctoral thesis. Department of Infra-
structure and Planning, Royal Institute of Technology, Sweden7. Bergqvist R, Tornberg J (2005) GIS for describing and analysing regional logistics sys-
tems. Mapp Image Sci 2:61–688. Eurosys, Eurosys AB, http://www.eurosys.se (2007-11-08)
9. Effektanalys 1.0 - User manual, The rescue service in Jonkoping, 200510. FSEC (Fire Service Emergency Cover) http://www.communities.gov.uk/fire/runningfire/
fireserviceemergency/
11. ADAM (Deccan International) http://www.deccanintl.com/adam_overview.asp12. Kolesar P, Blum E (1973) Square root law for fire engine response distances. Manage
Sci 19(12):1368–1378
13. Hogg J (1968) The siting of fire stations. Oper Res Q 19(3):275–28714. Toregas C, Swain R, ReVelle C, Bergman L (1971) The location of emergency service
facilities. Oper Res 19(6):1363–137315. Karasakal O, Karasakal E (2004) A maximal covering location model in the presence
of partial coverage. Comput Oper Res 31:1515–152616. Andersson T, Varbrand P (2007) Decision support tools for ambulance dispatch and
relocation. J Oper Res Soc 58(2):195–201
17. Kolesar P, Walker W (1974) An algorithm for the dynamic relocation of fire compa-nies. Oper Res 22(2):249–274
18. Swersey AJ (1982) A Markovian decision model for deciding how many fire companies
to dispatch. Manage Sci 28(4):352–36519. Huang B, Pan X (2007) GIS coupled with traffic simulation and optimization for inci-
dent response. Comput Environ Urban Syst 31:116–13220. Andersson T, Sardqvist S (2007) Planning for effective use of fire and rescue service
resources. Manuscript21. Svensson S, Sardqvist S (2006) Grundmodell inom ramarna for BeRadd. Swedish Res-
cue Services Agency
22. Handy SL, Niemer DA (1997) Measuring accessibility: an exploration of issues andalternatives. Environ Plann A 29:1175–1194
23. MapInfo (2007) MapXtreme. www.mapinfo.com
24. Dahlgren A (2005) A proximity analysis application for large source dataset. In Pro-ceedings of ScanGIS 2005, Stockholm, pp 125–136
25. Dahlgren A, Harrie L (2007) Development of a tool for proximity applications. In Pro-ceedings of Agile 2007, Alborg, Denmark
26. Swedish National Rural Development Agency (2007) http://www.glesbygdsverket.se27. Danielsson J (2007) Analytisk dimensionering av raddningstjanst. Department of Fire
Safety Engineering and Systems Safety, Lund University, Report 5243
28. Adawi R, Olsson P, Pettersson M, Wahl P (2007) Utformning av arbete Skydd mot ol-yckor i Kavlinge kommun
29. Dahlgren A (2007) PM Forsoksomrade Vemdalen - utvardering av geografisk tillgangli-
ghet av raddningstjansten. Glesbygdsverket30. Muncipality of Berg (2007) Overview plan of the Vemdalen-Bjornrike area31. Muncipality of Harjedalen (2007) Overview plan of the Storhogna-Sangbacken-Katari-
na area
Planning Rescue Services 255