
Planning for Expansion Populations Massachusetts’ Experience Covering Non-Traditional Populations...
29
Planning for Expansion Populations Massachusetts’ Experience Covering Non-Traditional Populations National Governors Association April 2012 Stephanie Sullivan Chrobak Director of Program Management Massachusetts Health Insurance Connector Authority
-
Upload
iris-mclaughlin -
Category
Documents
-
view
215 -
download
0
Transcript of Planning for Expansion Populations Massachusetts’ Experience Covering Non-Traditional Populations...

Planning for Expansion Populations
Massachusetts’ Experience Covering Non-Traditional Populations
National Governors AssociationApril 2012
Stephanie Sullivan Chrobak Director of Program ManagementMassachusetts Health Insurance Connector Authority

2
Agenda
• Introduction– Massachusetts’ Health Connector– Commonwealth Care Program – Massachusetts’ Experience with Health Care Reform
• Eligibility & Enrollment • Expansion Population – what we know about this unique group
– Demographics– Utilization – Outreach, Education & Marketing
• Lessons Learned
3
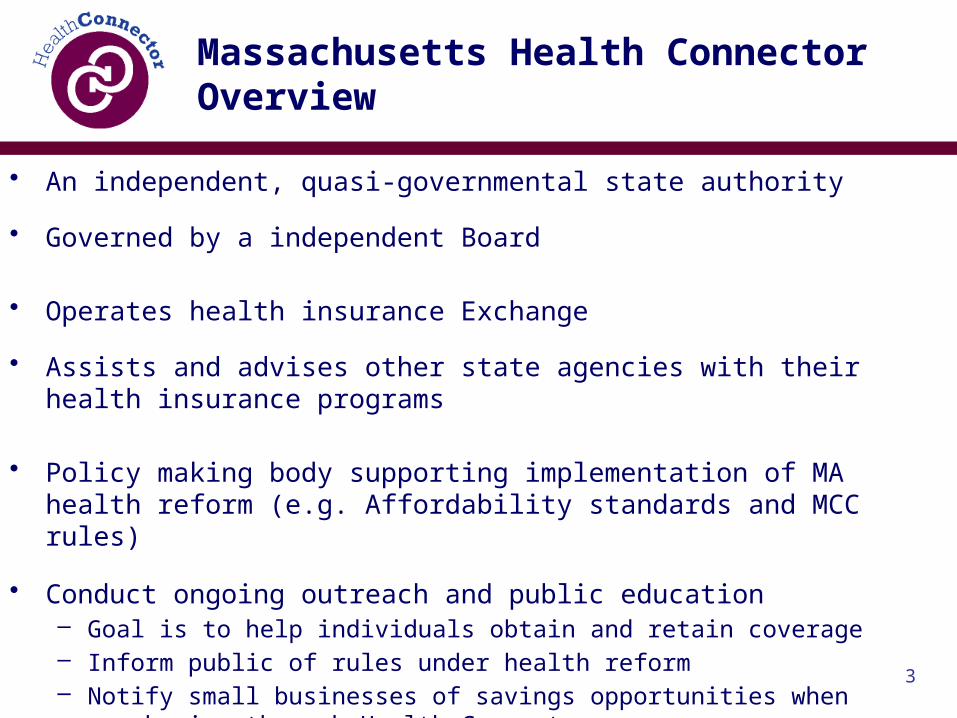
Massachusetts Health ConnectorOverview
• An independent, quasi-governmental state authority
• Governed by a independent Board
• Operates health insurance Exchange
• Assists and advises other state agencies with their health insurance programs
• Policy making body supporting implementation of MA health reform (e.g. Affordability standards and MCC rules)
• Conduct ongoing outreach and public education – Goal is to help individuals obtain and retain coverage – Inform public of rules under health reform– Notify small businesses of savings opportunities when purchasing
through Health Connector

4
Outreach By Health Connector
Public education and outreach has evolved over the years, was critically important early on, and remains a strong core competency of the Health Connector
● Public Information Unit
● During initial launch, partnerships were formed with corporate and civic organizations including the health care community, faith communities, unions, business groups, sports teams, etc.
● Media Outreach/Direct Mail
● Seminars and forums, working with Medicaid team
● Grants to Community Organizations
5
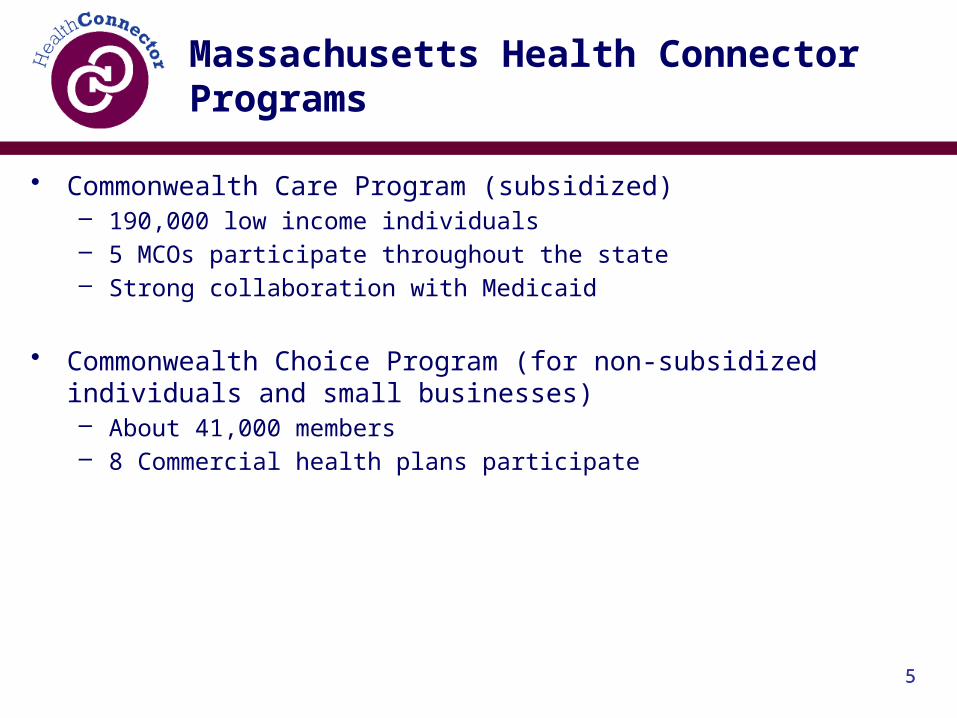
Massachusetts Health ConnectorPrograms
• Commonwealth Care Program (subsidized)– 190,000 low income individuals– 5 MCOs participate throughout the state – Strong collaboration with Medicaid
• Commonwealth Choice Program (for non-subsidized individuals
and small businesses) – About 41,000 members– 8 Commercial health plans participate
5

6
Current State of Massachusetts Health Connector
• Celebrating 5-year anniversary this year– Strong starting point– High rates of coverage and employer-sponsored insurance– Existing insurance market reforms (guaranteed issue, no pre-
existing coverage limitations, modified community rating, no medical underwriting)
– Political “stars aligned”
• 1.9% uninsured after 5 years (reduced disparities and improved access)
• 97% compliance with mandate
• Planning for 2014
• Heightened focus on cost containment
6

Overview of Commonwealth Care
Program
7

8
Commonwealth CareProgram Elements
• Eligibility requirements– Uninsured individuals who do not access to ESI, paying full COBRA– Age 19 or older (childless, non-pregnant, non disabled)– Family’s annual gross income at or below 300% FPL
Plan Type Salary Requirements
MembershipMarch 2012
Percent
1 < 100% FPL 78,533 45%
2 100 – 200% FPL 67,428 39%
3 201 – 300% FPL 27,477 16%
Total 173,438 100%

9
Commonwealth Care Membership by Health Plan (April 2012)
9
MCO Commonwealth Care
Membership
%
BMCHP 35,874 21%
CeltiCare 34,818 20%
Fallon 5,831 4%
Neighborhood Health Plan 34,161 20%
Network Health 63,926 38%
TOTAL 174,610 100%

10
Eligibility process
• Must complete Medical Benefit Request (MBR) form
• Same application used for – MassHealth (Medicaid) – Children’s Medical Security Plan (CMSP)– Healthy Start– Health Safety Net (formerly known as the Uncompensated
Care Pool)
• May seek assistance from staff at hospitals and community health centers
• Providers have online MBR access via EOHHS Virtual Gateway

11
Enrollment process
• Once deemed eligible, there are 3 ways a member can enroll – Majority of members call the Commonwealth Care– Online at www.MAhealthconnector.org– Through the mail
• From application to enrollment, process takes about 1 month
• Individuals must choose a plan in order to have coverage. They choose from approved health plans based on the service area they live in and certain member attributes
• Progressive enrollee premiums and copayments – Plan Type 1 benefit plan mirrors Medicaid, no premiums– Plan Type 2 & 3 members pay monthly premiums(similar to private
insurance) and can make payments via web or mail
• Yearly Open Enrollment (similar to private insurance) – Existing members can change health plan for any reason

12
Commonwealth Care ProgramProcurement
• Yearly procurement, with capitation based on Actuarially Sound Rate Range– Innovative programmatic changes introduced while monitoring utilization,
quality of care, access to care and overall member satisfaction
• Stop-loss insurance and aggregate risk sharing features in place
• Use of predictive modeling to adjust payment rate – minimizing practice of “risk selection” by health plans
• Closed insurance pool thereby negating “adverse selection”
• Incentives in place to encourage MCOs to bid low
• Heavy use of claims data and analytics to understand enrollment and cost dynamics
12

Massachusetts’ Experience with
Expansion Population
13
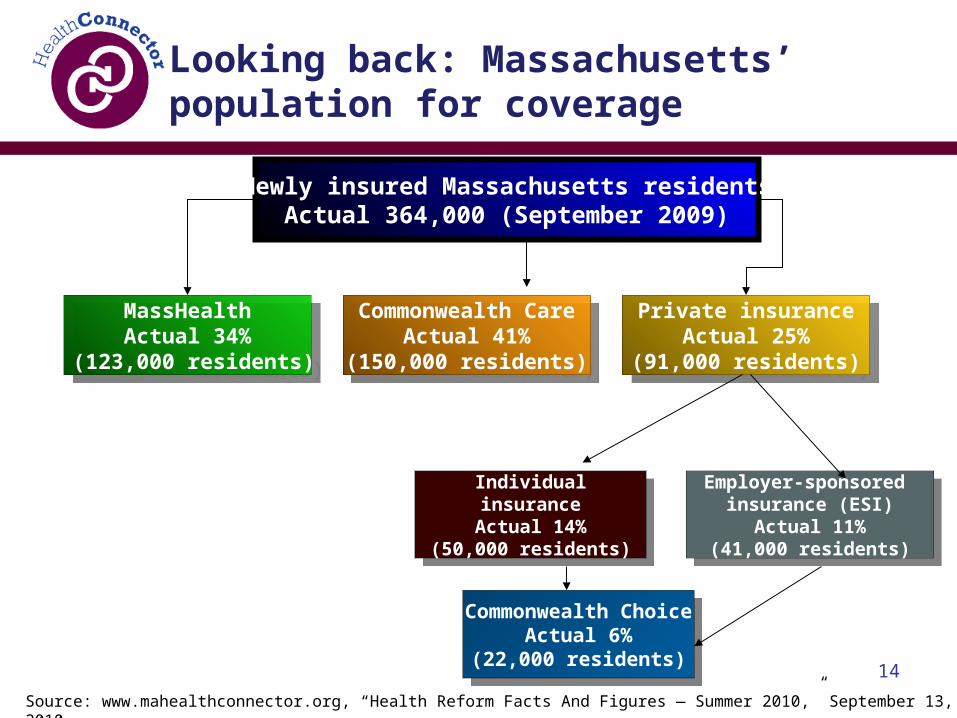
Looking back: Massachusetts’ population for coverage
Newly insured Massachusetts residentsActual 364,000 (September 2009)
MassHealthActual 34%
(123,000 residents)
MassHealthActual 34%
(123,000 residents)
Individualinsurance
Actual 14%(50,000 residents)
Individualinsurance
Actual 14%(50,000 residents)
Private insuranceActual 25%
(91,000 residents)
Private insuranceActual 25%
(91,000 residents)
Commonwealth CareActual 41%
(150,000 residents)
Commonwealth CareActual 41%
(150,000 residents)
Employer-sponsored insurance (ESI)
Actual 11%(41,000 residents)
Employer-sponsored insurance (ESI)
Actual 11%(41,000 residents)
Source: www.mahealthconnector.org, “Health Reform Facts And Figures — Summer 2010,” September 13, 2010
Commonwealth ChoiceActual 6%
(22,000 residents)
Commonwealth ChoiceActual 6%
(22,000 residents)14

15
Expansion population overview: Prior health insurance
Source: Commonwealth Health Insurance Connector Authority, April 2011

16
Expansion population overview: Member insights
• Demographically diverse• Many uninsured adults had not accessed care in years; most
had no ties to a primary care provider but wanted one• Key concerns were economic
– Allocated resources to take care of their families• Lack of insurance not a choice
– No sense of control or empowerment• Health insurance not a priority
– Healthy, won’t get sick, and can get free care if needed• People did not expect great coverage for free, but wanted
value for their money
Source: Network Health focus groups, 2006

17
Expansion population overview: Member demographics
• 66% are employed; 16% had more than one job• 53% are women• 82% are Caucasian, 5% are African American, 5%
are Asian, and 12% are Hispanic or of Latino descent
• 80% were born in the United States• 56% were uninsured at some point during the
12-month period before enrolling in Commonwealth Care
Source: Commonwealth Health Insurance Connector Authority survey, Fall 2010

18
Expansion population overview:Member source of care
• 81% have a usual source of health care and have seen a general doctor at least once during the past 12 months since becoming a Commonwealth Care member
• 72% visited a health care provider, and 52% visited a specialist
• 33% sought care in an emergency room; of those, 39% indicated that it was a low-acuity, non-emergency visit
Source: Commonwealth Health Insurance Connector Authority survey, Fall 2010

19
Expansion population comparisonwith Medicaid: Age
• Expansion population is older than expected
Source: Network Health, February 2012

20
Expansion population comparisonwith Medicaid: Gender
• Expansion population has balanced gender distribution
Source: Network Health, February 2012

21
Expansion population comparisonwith Medicaid: Tenure
• Expansion population has shorter tenure
Source: Network Health, February 2012

22
Expansion population comparisonwith Medicaid: Medical claims
• Expansion population had pent-up demand initially
Source: Network Health, February 2012

23
Expansion population comparisonwith Medicaid: Admitting diagnoses
• Abdominal pain• Pancreatitis• Ethanol withdrawal or delirium• Cellulitis• Chronic obstructive pulmonary
disease
Top five admitting diagnoses for
Commonwealth Care members
• Ethanol withdrawal or delirium• Pancreatitis• Cellulitis• Postoperative infection• Morbid obesity
Top five admitting diagnoses for MassHealth
members ages 19+
Source: Network Health, February 2012

24
Expansion population comparisonwith Medicaid: Utilization
Utilization metricsCommonwealth
CarePlan Type I
MassHealth
Rating Category I (Ages 19+)
Medical/Surgical admissions per 1,00073 57
Medical/Surgical days per 1,000322 186
Medical/Surgical average length of stay per 1,000 4.4 3.3
Emergency room visits per 1,000741 848
Pharmacy prescriptions per 1,00018,194 14,418
Source: Network Health, February 2012
• Expansion population has higher claims costs

25
Expansion population comparisonwith Medicaid: Utilization (cont’d.)
•Behavioral health•Medical/Surgical•Office visits•Other facility inpatient•Therapies
Top five services that cost more for
Commonwealth Care Plan Type I members than for MassHealth
Rating Category I members ages 19+
•Clinic•Emergency department•Obstetrics•Other professional services•Well newborn
Top five services that cost less for
Commonwealth Care Plan Type I members than for MassHealth
Rating Category I members ages 19+
Source: Network Health, February 2012

26
Expansion population comparisonwith Medicaid: Member satisfaction
SurveyCatergories
Commonwealth Care summary
rates*
MassHealth summary
rates*
Rating of health plan
68.7% 81.9%
Getting needed care 82.6% 81.0%
Customer service 81.2% 81.4%
* Summary rate represents the percentage of respondents who chose the top two answers of “usually” and “always” from four possible responses: “never,” “sometimes,” “usually,” and “always.”
Source: Network Health Consumer Assessment of Healthcare Providers and Systems (CAHPS), 2011

Future 2014: Lessons Learned
27

28
Lessons Learned
• Importance of shared responsibility– Individuals, employers, government, insurers
• Value of a phased approach
• Importance of ongoing outreach, education, and stakeholder engagement– Leverage all the help you can – Advocate group involvement is critical
• Be creative with outreach – leverage technology
• Must understand and value stakeholders’ interests
• Every state must assess their starting point– Each state is different
28

29
Lessons Learned (cont)
• Learn as much as possible about your population– Are they similar to Medicaid?– Are populations are difficult to reach?
• Must balance the ideal with the realities – State budgets, competing interests, etc
• Use this time to find efficiencies and leverage technology
• Create guiding principles and re-visit them often– Collaborate with other state agencies
• Develop strong relationships with health care and opinion leaders
29