plan601 e session 2 demo
42
SESSION 2 DEMO: CHARTS, GRAPHS, AND ICONS PLAN601E VERBAL AND VISUAL: INFORMATION GRAPHICS (SESSION 2)
Transcript of plan601 e session 2 demo

session 2 demo:charts, graphs, and iconsPLAN601E VErbAL ANd VisuAL: iNformAtioN GrAPhics (sEssioN 2)
SESSION 2 DEMO:CHARTS, GRAPHS, AND ICONSPLAN601E VERBAL AND VISUAL: INFORMATION GRAPHICS (SESSION 2)

copy exercise filesmAkE A LocAL coPy of foLdEr: sEssioN 2 ExErcisE fiLEs

charts in adobe illustratoroVErViEw of tooLs ANd PANELs
crEAtiNG PiE chArts ANd bAr chArts usiNG ExcEL dAtA

more detail on course blog under ‘resource Library’introduction to adobe illustrator

1) create a new document.creating a pie chart with adobe illustrator
1
menus

2) use the chart tool to make 4” x 4” pie chart.creating a pie chart with adobe illustrator
2chart tool

2) Paste population data into table.creating a pie chart with adobe illustrator
pop. data
3
study area vs. [city - study area]
study area vs. [study area - tract]
Let’s make two pie charts: one showing proportion of citywide population represented by the study area and another showing the proportion of the study area represented
by a census tract.

4) ungroup each chart at least twice to separate the elements.creating a pie chart with adobe illustrator
object menu
4

6) create a palette. 5) select part of chart you want to color with select tool; use eyedropper tool to color the polygon.
creating a pie chart with adobe illustrator
6
6
5

1) clean up data utilizing find & replace.creating a bar graph with adobe illustrator
Let’s use the sort functions in Excel in order to visually organize census data by discrete zones.
1
find / replace

creating a bar graph with adobe illustrator
Let’s use the sort functions in Excel in order to visually organize census data by discrete zones.
there are 29 census tracts in the study area. they are displayed here in ascending order.
zone a
301303361
365.01 365.02
363367369 371373 890892894896898
900 902906908 910912916918 920922924 928
10981132
zone b zone c

2) insert a column and indicate the zone for each tract.creating a bar graph with adobe illustrator
Let’s use the sort functions in Excel in order to visually organize census data based on our own study area zones.
2

3) sort the data based on the new column.creating a bar graph with adobe illustrator
use the sort function to organize census data based on the study area zones.
3
sort
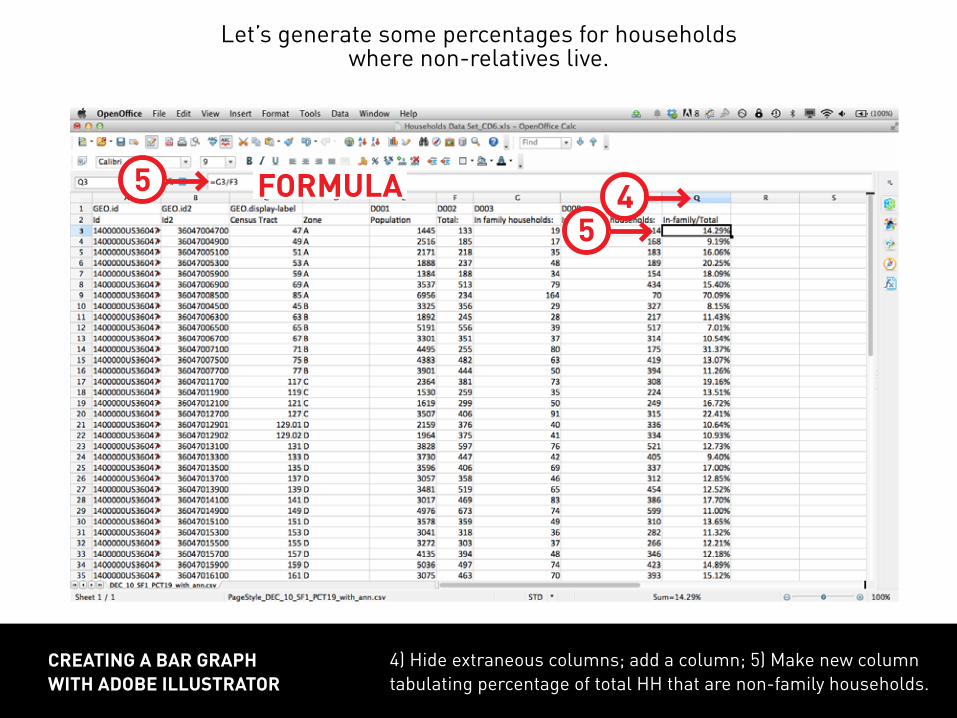
4) hide extraneous columns; add a column; 5) make new column tabulating percentage of total hh that are non-family households.
creating a bar graph with adobe illustrator
Let’s generate some percentages for households where non-relatives live.
45
5 formula
creating a bar graph with adobe illustrator
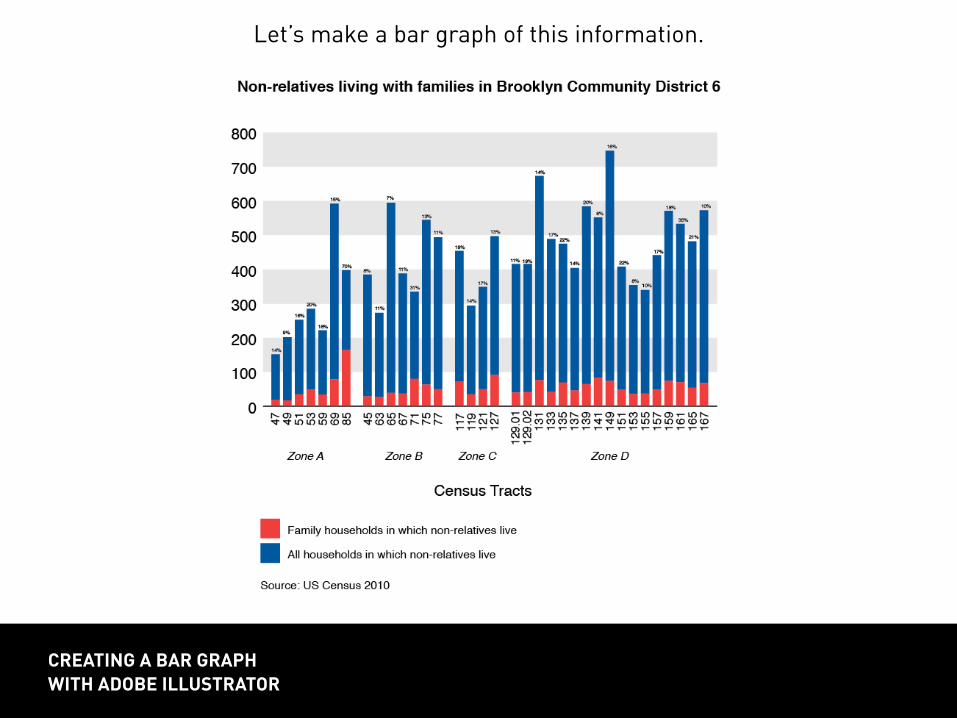
Let’s make a bar graph of this information.

6) use chart tool to create 6” x 4” stacked chart.creating a bar graph with adobe illustrator
6
6

7) Paste non-family households in first column; total hh into second column.
creating a bar graph with adobe illustrator
7

8) build a color palette. close table window for bar graph. 9) ungroup graph 3 times; use the wand to select the non-family bars; use eyedropper to color bars with your palette.
creating a bar graph with adobe illustrator
9
8
8
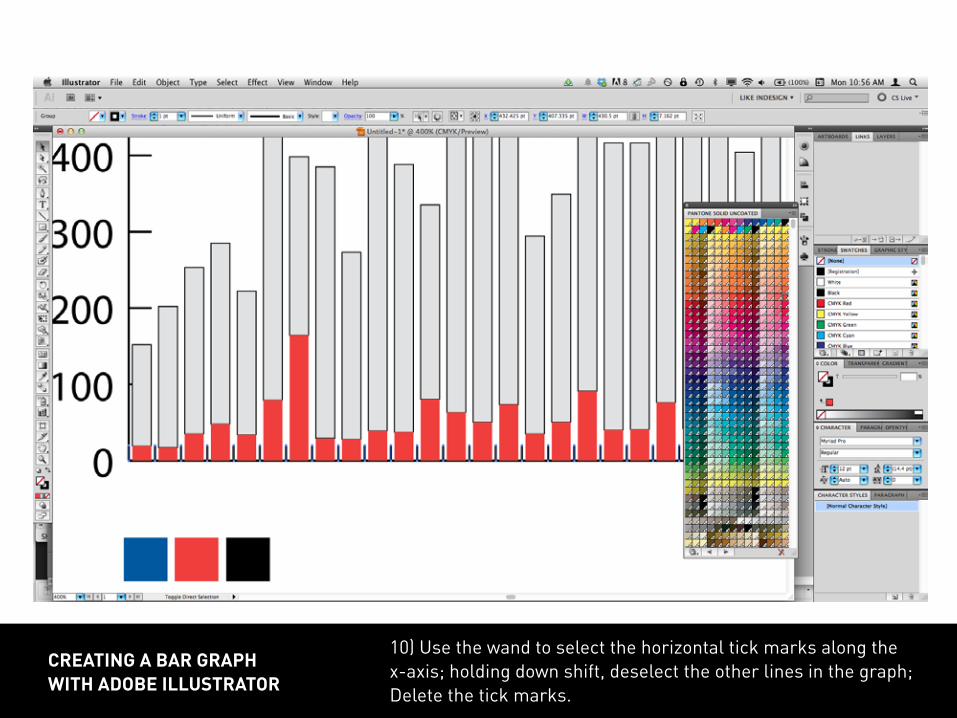
s10) use the wand to select the horizontal tick marks along the x-axis; holding down shift, deselect the other lines in the graph; delete the tick marks.
creating a bar graph with adobe illustrator
10

11) Add color to total hh bars; 12) ungroup all bars; use selection tool to create space between zones; 13) Add labels and use rotate tool to rotate them; 14) Extend and modify line weights of axes.
creating a bar graph with adobe illustrator
1314
11
12
stroke palette
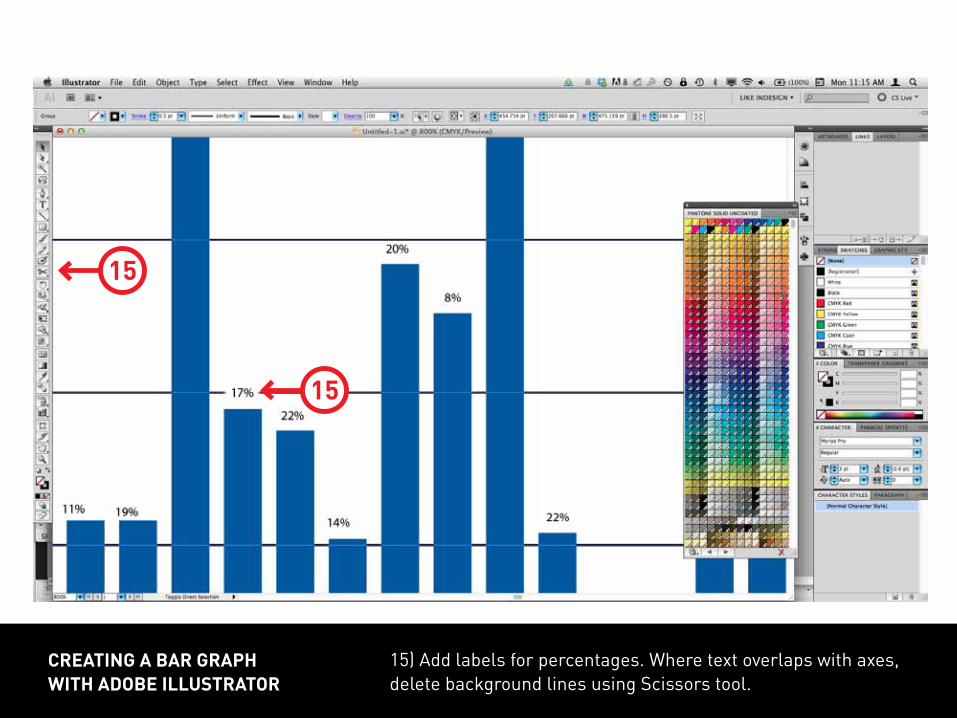
15) Add labels for percentages. where text overlaps with axes, delete background lines using scissors tool.
creating a bar graph with adobe illustrator
15
15

16) use ‘find font’ to replace fonts with preferred; adjust boxes, positions and point sizes accordingly.
creating a bar graph with adobe illustrator
16

17) Add labels for title, units, areas, key. 18) use rectangle tool to create background shading.
creating a bar graph with adobe illustrator
18
18
17

creating a bar graph with adobe illustrator
19) remove any unnecessary lines.

creating an icon in adobe illustrator

1) download a jpeg of an icon that has clean lines and few colors and file>Place it in illustrator.
creating an icon with adobe illustrator
Let’s first borrow an icon from the internet and convert a jpeg into vectors we can work with.
1

2) select object >Live trace>make and Expand to have illustrator approximate a series of vectors of the jpeg
creating an icon with adobe illustrator
3
Let’s first borrow an icon from the internet and convert a jpeg into vectors we can work with.
2

3) ungroup; use the direct selection tool to delete extraneous vectors.
creating an icon with adobe illustrator
4
Let’s first borrow an icon from the internet and convert a jpeg into vectors we can work with.
3
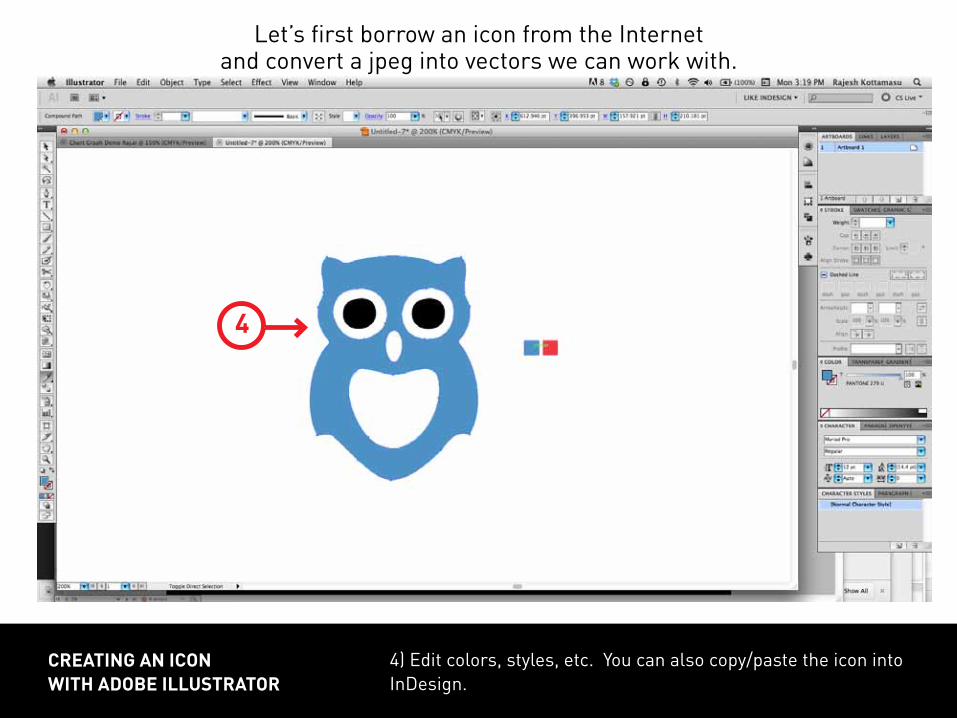
4) Edit colors, styles, etc. you can also copy/paste the icon into indesign.
creating an icon with adobe illustrator
4
Let’s first borrow an icon from the internet and convert a jpeg into vectors we can work with.

5) Place a jpeg of a photo with a clear figure in illustrator. Lock its layer.
creating an icon with adobe illustrator
5
Another approach is to create an icon by tracing over a photograph.
5

6) in a new layer, use the pen tool to trace the edges of the figure.creating an icon with adobe illustrator
6
Another approach is to create an icon by tracing over a photograph.
6

7) trace other important visual features.creating an icon with adobe illustrator
7
Another approach is to create an icon by tracing over a photograph.

8) Add lines if needed to describe the figure.creating an icon with adobe illustrator
8
Another approach is to create an icon by tracing over a photograph.

9) use direct selection tool and color palette to color the icon.creating an icon with adobe illustrator
Another approach is to create an icon by tracing over a photograph.
9
9

10) use direct selection tool and color palette to color the icon.creating an icon with adobe illustrator
Another approach is to create an icon by tracing over a photograph.
10
10

11) select any secondary line or shape overlaid on your flat color and use object>Path>divide objects below (or use the Pathfinder) to punch through your shapes and create new polygons.
creating an icon with adobe illustrator
Another approach is to create an icon by tracing over a photograph.
11

12) find an icon in a font that you like.creating an icon with adobe illustrator
A third way to create an icon is to convert typographic icons to vectors.
12
12
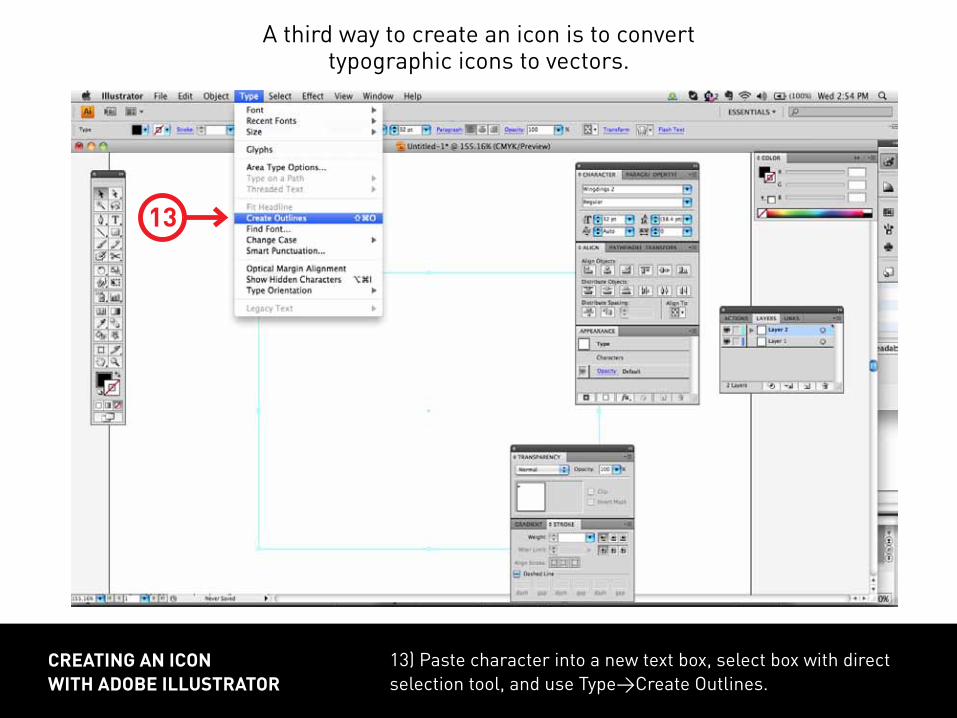
13) Paste character into a new text box, select box with direct selection tool, and use type>create outlines.
creating an icon with adobe illustrator
A third way to create an icon is to convert typographic icons to vectors.
13
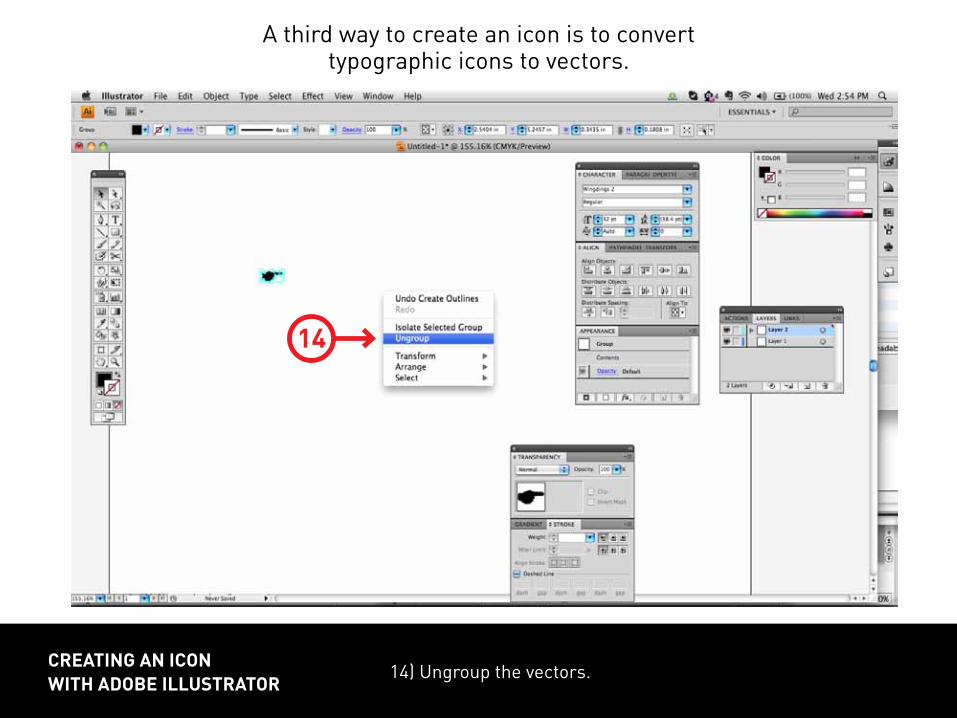
14) ungroup the vectors.creating an icon with adobe illustrator
A third way to create an icon is to convert typographic icons to vectors.
14

15) Edit colors, styles, etc. you can also copy/paste the icon into indesign.
creating an icon with adobe illustrator
A third way to create an icon is to convert typographic icons to vectors.
15
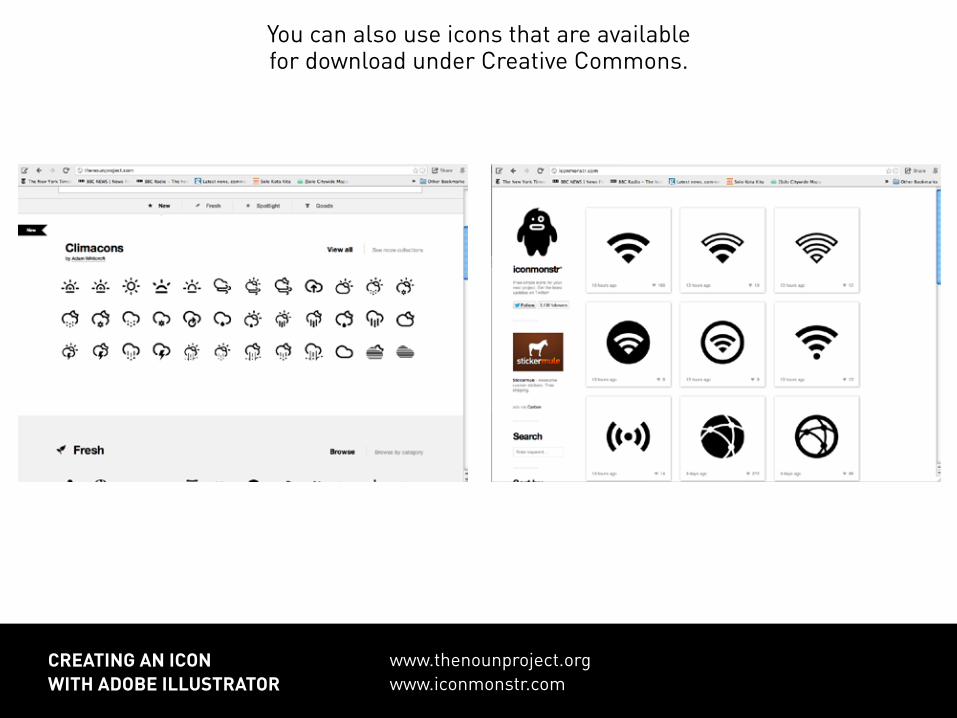
www.thenounproject.orgwww.iconmonstr.com
creating an icon with adobe illustrator
you can also use icons that are available for download under creative commons.

message of this slide/ category of data documented on this page
assignment 2
title of yourpresentation
title slide; Previous slides (Assignment 1)
Assignment 2: three sets of charts/graphs, integrating icon
pdf, 7.5”x10”
intertitle; sketches, notes, precedents and revisions for Assignment 2; All previous sketches, notes, precedents and revisions.
sketches, notes, precedents
and revisions
from some part of Assignment 2
jpeg
headline tells me the message of this slide
headline tells me the message of this slide
headline tells me the message of this slide
headline tells me the message of this slide