PLA-6219 SSES 2005 Meteorological Summary, April 2006 SSES ...
192
Attachment 48 to PLA-6219 SSES 2005 Meteorological Summary, April 2006 SSES 2006 Meteorological Summary, May 2007 (NR C Document Request 10 7)
Transcript of PLA-6219 SSES 2005 Meteorological Summary, April 2006 SSES ...
Attachment 48 to PLA-6219SSES 2005 Meteorological Summary, April 2006SSES 2006 Meteorological Summary, May 2007
(NR C Document Request 10 7)
SUSQUEHANNA
STEAM ELECTRIC STATION
2005 Meteorological Summary
Submitted to
PPL Susquehanna LLC
Prepared by
ABS Consulting, Inc.
Report R-1288497-601April 2006
VADS Consulting
TABLE OF CONTENTS
Page
LIST OF TABLES iv
LIST OF FIGURES vi
TABLE OF REVISIONS 2
EXECUTIVE SUMMARY 3
1.0 INTRODUCTION 5
1.2 Input Data 5
1.2.1 Meteorological Data 5
1.3 Methodology 6
1.3.1 MIDAS Software Calculations 6
2.0 METEOROLOGY 7
2.1 Onsite Meteorological Measurements Program 72.1.1 Meteorological Towers 72.1.2 Instrumentation 82.1.3 Data Reduction 82.1.4 Data Recovery 8
2.2 Regional Climatology 8
2.3 Local Meteorology 9
2.3.1 Normal and Extreme Value of Meteorological Parameters 92.3.1.1 Wind Direction and Wind Speed 92.3.1.2 Temperature and Atmospheric Water Vapor 102.3.1.3 Stability 112.3.1.4 Precipitation 12
3.0 DIFFUSION ESTIMATES 13
3.1 Short-Term (Accident) Diffusion Estimates 133.1.1 Diffusion Model for 0 to 2 Hours 13
3.1.1.1 Exclusion Area Boundary and Low Population Zone 153.1.1.2 Five Percent Overall Site X/Q Values 15
3.1.2 Results of Short-Term Diffusion Estimates 15
R-1288497-601, Rev. 0 ii of 95 April 12,2006s:\wp\ppl\Annual Report 2005.doc
3.2 Long-Term (Routine) Diffusion Estimates3.2.1 Atmospheric Diffusion Models
3.2.1.1 Straight-Line Airflow Model3.2.1.2 Methods of Depletion and Deposition Calculation3.2.1.3 Terrain/Recirculation Correction Factors
3.2.2 Results of Long-Term Diffusion Estimates
1616161717
18
19
A-1
4.0 REFERENCES
Appendix A - SSES Meteorological Instrumentation Description
R-1288497-601, Rev. 0 iii of 95s:\wp\ppl\Annual Report 2005.doc
April 12,2006
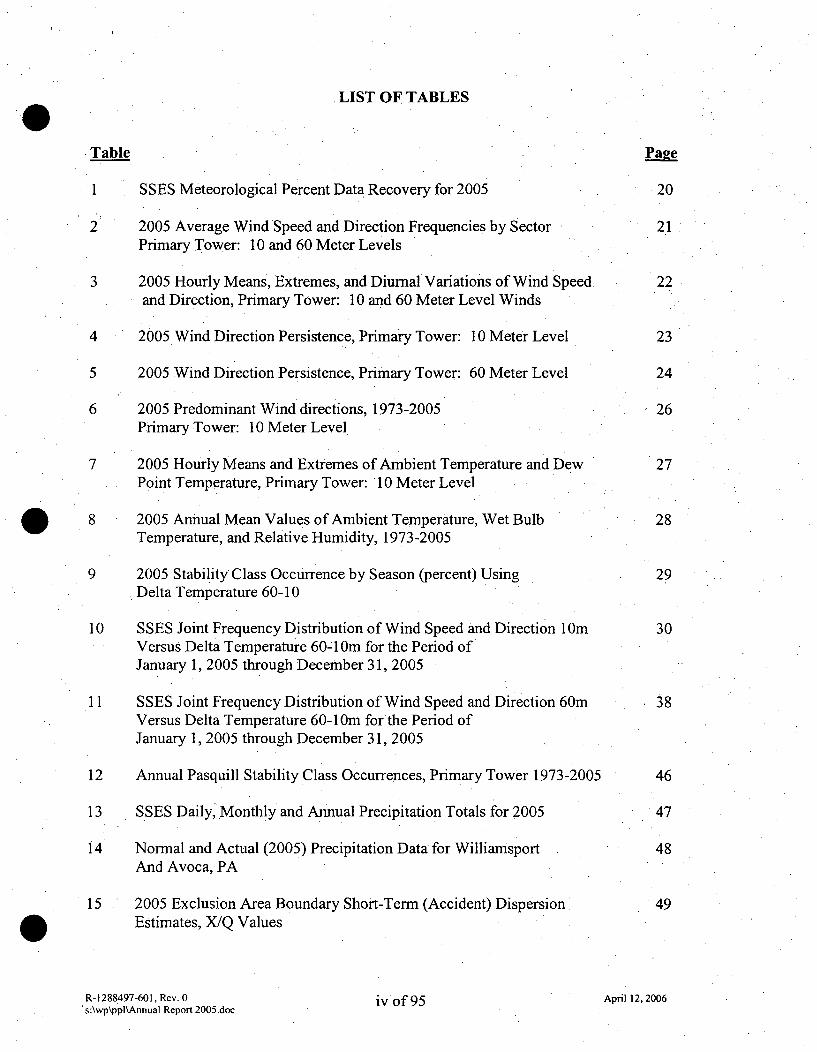
LIST OF TABLES
Table Page
1 SSES Meteorological Percent Data Recovery for 2005 20
2 2005 Average Wind Speed and Direction Frequencies by Sector 21Primary Tower: 10 and 60 Meter Levels
3 2005 Hourly Means, Extremes, and Diurnal Variations of Wind Speed, 22and Direction, Primary Tower: 10 and 60 Meter Level Winds
4 2005 Wind Direction Persistence, Primary Tower: 10 Meter Level 23
5 2005 Wind Direction Persistence, Primary Tower: 60 Meter Level 24
6 2005 Predominant Wind directions, 1973-2005 26Primary Tower: 10 Meter Level
7 2005 Hourly Means and Extremes of Ambient Temperature and Dew 27Point Temperature, Primary Tower: 10 Meter Level
8 2005 Annual Mean Values of Ambient Temperature, Wet Bulb 28Temperature, and Relative Humidity, 1973-2005
9 2005 Stability Class Occurrence by Season (percent) Using 29Delta Temperature 60-10
10 SSES Joint Frequency Distribution of Wind Speed and Direction 1 Om 30Versus Delta Temperature 60-1Oin for the Period ofJanuary 1, 2005 through December 31, 2005
11 SSES Joint Frequency Distribution of Wind Speed and Direction 60m 38Versus Delta Temperature 60-1Om for the Period ofJanuary 1, 2005 through December 31, 2005
12 Annual Pasquill Stability Class Occurrences, Primary Tower 1973-2005 46
13 SSES Daily, Monthly and Annual Precipitation Totals for 2005 47
14 Normal and Actual (2005) Precipitation Data for Williamsport 48And Avoca, PA
15 2005 Exclusion Area Boundary Short-Term (Accident) Dispersion 49Estimates, X/Q Values
R-1288497-601, Rev. 0s:\wp\ppl\Annual Report 2005,doc
iv of 95 April 12, 2006
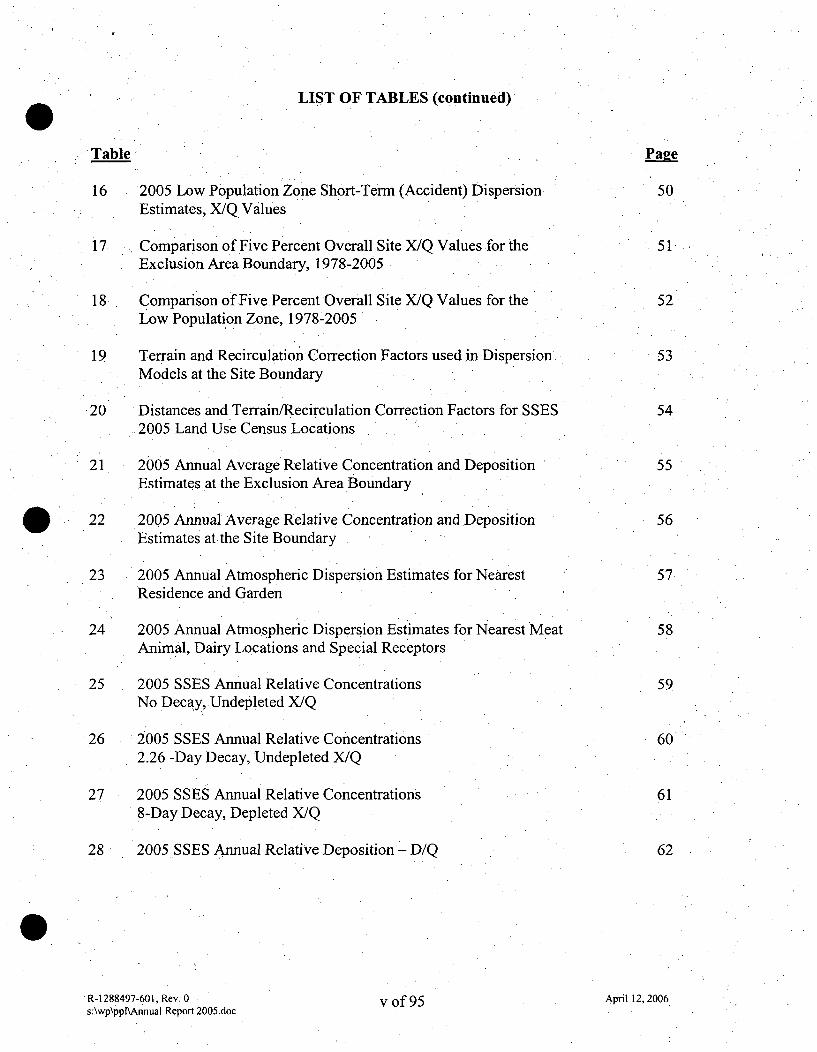
LIST OF TABLES (continued)
Table Page
16 2005 Low Population Zone Short-Term (Accident) Dispersion 50Estimates, X/Q Values
17 Comparison of Five Percent Overall Site X/Q Values for the 51Exclusion Area Boundary, 1978-2005
18 Comparison of Five Percent Overall Site X/Q Values for the 52Low Population Zone, 1978-2005
19 Terrain and Recirculation Correction Factors used in Dispersion 53Models at the Site Boundary
20 Distances and Terrain/Recirculation Correction Factors for SSES 542005 Land Use Census Locations
21 2005 Annual Average Relative Concentration and Deposition 55Estimates at the Exclusion Area Boundary
22 2005 Annual Average Relative Concentration and Deposition 56Estimates at the Site Boundary
23 2005 Annual Atmospheric Dispersion Estimates for Nearest .57Residence and Garden
24 2005 Annual Atmospheric Dispersion Estimates for Nearest Meat 58Animal, Dairy Locations and Special Receptors
25 2005 SSES Annual Relative Concentrations 59No Decay, Undepleted X/Q
26 2005 SSES Annual Relative Concentrations 602.26 -Day Decay, Undepleted X/Q
27 2005 SSES Annual Relative Concentrations 618-Day Decay, Depleted X/Q
28 2005 SSES Annual Relative Deposition - D/Q 62
R-1288497-601, Rev. 0s:\wp\pplNAnnual Report 2005.doc
v of 95 April 12,2006
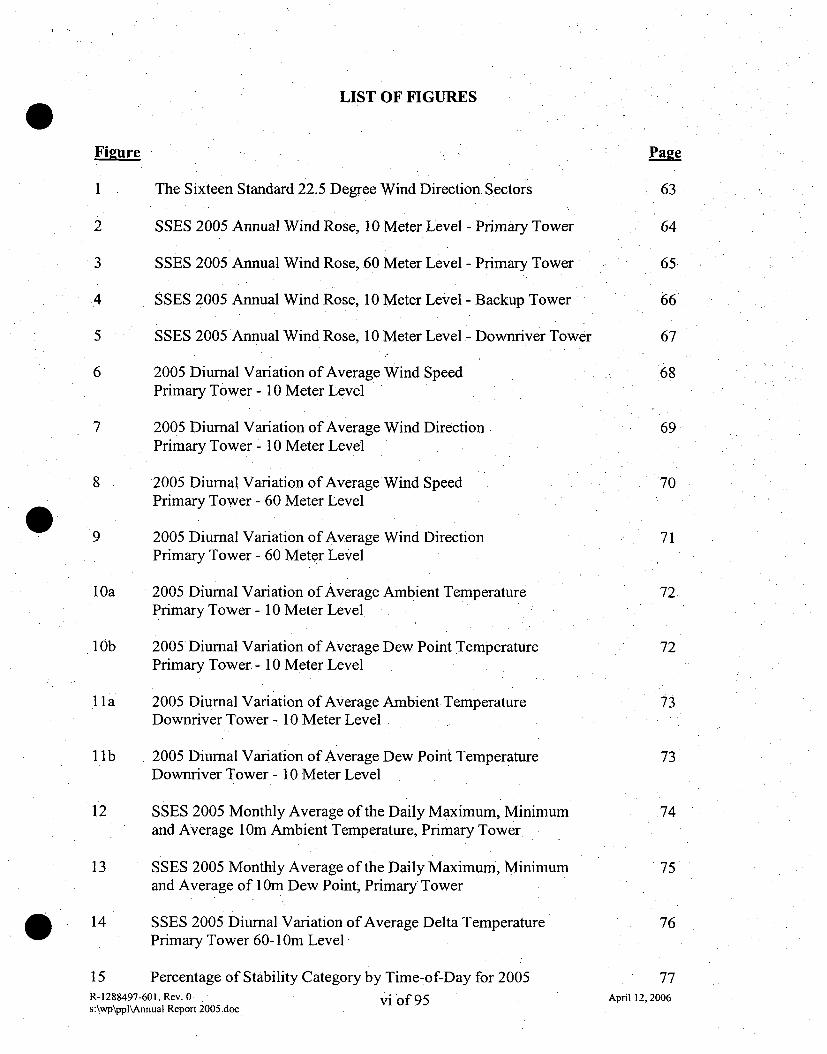
LIST OF FIGURES
Figure
1 The Sixteen Standard 22.5 Degree Wind Direction Sectors
2 SSES 2005 Annual Wind Rose, 10 Meter Level - Primary Tower
3 SSES 2005 Annual Wind Rose, 60 Meter Level - Primary Tower
4 SSES 2005 Annual Wind Rose, 10 Meter Level - Backup Tower
5 SSES 2005 Annual Wind Rose, 10 Meter Level - Downriver Tower
6 2005 Diurnal Variation of Average Wind SpeedPrimary Tower - 10 Meter Level
7 2005 Diurnal Variation of Average Wind DirectionPrimary Tower - 10 Meter Level
8 2005 Diurnal Variation of Average Wind SpeedPrimary Tower - 60 Meter Level
9 2005 Diurnal Variation of Average Wind DirectionPrimary Tower - 60 Meter Level
10a 2005 Diurnal Variation of Average Ambient TemperaturePrimary Tower - 10 Meter Level.
10b 2005 Diurnal Variation of Average Dew Point TemperaturePrimary Tower - 10 Meter Level
11 a 2005 Diurnal Variation of Average Ambient TemperatureDownriver Tower - 10 Meter Level
1 lb 2005 Diurnal Variation of Average Dew Point TemperatureDownriver Tower - 10 Meter Level
12 SSES 2005 Monthly Average of the Daily Maximum, Minimumand Average 10m Ambient Temperature, Primary Tower
13 SSES 2005 Monthly Average of the Daily Maximum, Minimumand Average of 10m Dew Point, Primary Tower
14 SSES 2005 Diurnal Variation of Average Delta TemperaturePrimary Tower 60-1 Om Level
15 Percentage of Stability Category by Time-of-Day for 2005R-1288497-601, Rev. 0 vi of 95s:\wp\ppl\Annual Report 2005.doc
Page
63
64
65
66.
67
68
69
70
71
72
72
73
73
74
75
76
77April 12, 2006
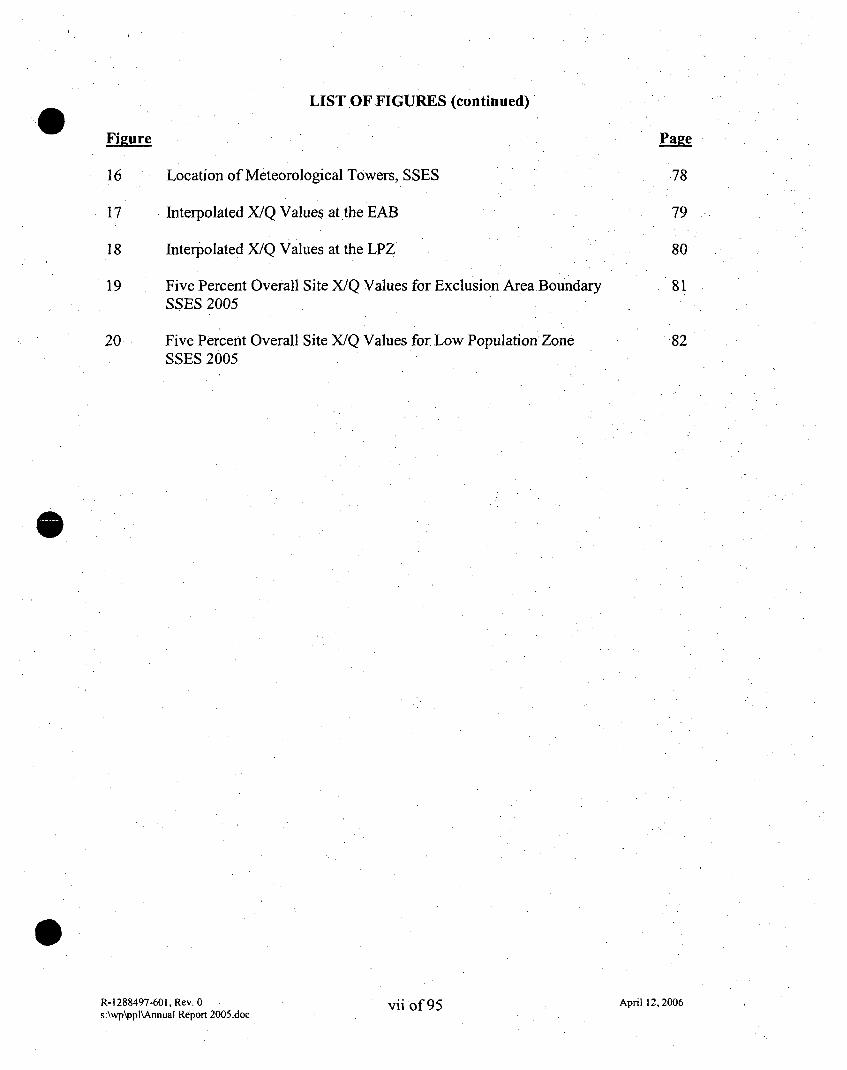
LIST OF FIGURES (continued)
Fieure Page
16 Location of Meteorological Towers, SSES 78
17 Interpolated X/Q Values at the EAB 79
18 Interpolated X/Q Values at the LPZ 80
19 Five Percent Overall Site X/Q Values for Exclusion Area.Boundary 81SSES 2005
20 Five Percent Overall Site X/Q Values for. Low Population Zone 82SSES 2005
R-1288497-601, Rev. 0s:\wp\ppl\Annual Report 2005.doc vii of 95 April 12, 2006

TABLE OF REVISIONS
Revision 0 Date: 12 April 2006
Original Issue
R-1288497-601, Rev. 0s:\wp\ppl\Annual Report 2005.doc
2 of 95 April 12, 2006
EXECUTIVE SUMMARY
This report summarizes the meteorological conditions at the PPL Susquehanna Steam ElectricStation (SSES) for the year 2005. The station is located in the Susquehanna Valley near thetownof Berwick, PA and the borough of Nescopeck, PA. The report will provide summaries forseveral meteorological parameters as measured at the primary meteorological tower located onthe SSES site. Additionally, the report will provide atmospheric. dispersion estimates of relativeconcentrations of radionuclides (X/Q) for several offsite areas. These dispersion estimates werederived using the XDCALC and WINDOW programs which follow the Nuclear RegulatoryCommission (NRC) technical guidance..
Section 1 summarizes the meteorological data collection program currently in operation at SSES.Section 1.1 describes the onsite meteorological measurements program. Section 1.2 provides abrief climatological summary for the area surrounding SSES. Section 1.3 provides a summary ofthe following measured parameters: wind direction, wind speed, temperature, dew pointtemperature (a measure of atmospheric water vapor), atmospheric stability, and precipitation.. In-depth tables and figures are presented to help the reader better understand the variousmeteorological conditions and the climatological environment at the station as well asPennsylvania's northern Susquehanna Valley.
An established data review quality assurance program at ABS Consulting, Inc. (ABS)substantiates the quality of data obtained from the meteorological monitoring program at theSSES. This review includes daily interrogation, evaluation and validation of the data by.meteorologists specializing in air quality. The meteorological data are then compiled on amonthly, quarterly and annual basis. Data from the primary meteorological tower are validatedby crosschecks with data from an independent, backup meteorological tower located on theSSES site. Additional checks are made to a supplemental meteorological tower located offsite inthe Susquehanna River plain. Meteorological data from the SSES meteorological monitoringprogram are also compared to offsite meteorological data at the regional National WeatherService observing sites in Williamsport, PA and Avoca, PA. With the exception of anunderestimation of precipitation, the program data are representative of the meteorologicalconditions at the SSES site.
The NRC recommends an annual data recovery for wind direction, wind speed and atmospheric.stability of at least 90 percent for a height level that represents the effluent release point. Thisrecommended recovery of 90 percent was again exceeded during 2005 with the actual recoverypercentages presented in Table 1.
Section 2 describes the long-term (routine) and short-term (accident) atmospheric dispersionestimates that were computed using onsite meteorological data for 2005. The 2005 dispersionestimates are compared to estimates. from previous years that were reported in the SSES FinalSafety Analysis Report (FSAR) and subsequent annual meteorological summaries. Thedispersion estimates for 2005 are within the range of previous years. Evaluation of floodingestimates based on the years precipitation is also within the range quoted in the SSES FSAR.
R-1288497-601, Rev. 0s:\wp\ppl\Annual Report 2005.doc
3 of 95 April 12, 2006
Dispersion calculations only use the terrain/recirculation factors for the long-term calculation ofX/Qs. This was to be consistent with the regulatory position on the calculation of short-termX/Qs where recirculation factors are not used. No changes to the site boundary distancesoccurred in 2005.
This report summarizes and documents the meteorological parameters at SSES. It also serves asinput to an ongoing climatological database for the SSES site and surrounding areas.
R-1288497-601, Rev. 0s:\wp\ppl\Annual Report 2005.doc
4 of 95 April 12, 2006
1.1 INTRODUCTION
The purpose of this report is to provide a summary of the 2005 meteorological data at theSusquehanna Steam Electric Station (SSES). The report uses several calculation programs fromthe Meteorological Information and Dose Assessment Software (MIDAS) suite of programs togenerate tables and figures included in the report. All of the calculations used hourlymeteorological data from SSES meteorological towers (primary and backup).• The hourlyaveraged data came from the onsite CR2 IX data loggers.
1.2 INPUT DATA
1.2.1 Meteorological Data
Meteorological data have been collected at the.SSES site since the early 1970s. At the presenttime, the meteorological system is based on a 200 ft high tower located approximately 1000 ft tothe southeast of the plant. Wind sensors are mounted at the 10m and 60m elevations on thistower. Vertical temperature differential is measured with redundant sensor pairs between the10m and 60m levels. Sigma theta (the standard deviation of horizontal wind direction). iscalculated from wind direction at both levels. Dew point and ambient temperature sensors arepresent at the I Om level. Precipitation is measured at ground level.
An onsite backup meteorological tower was erected in 1982. It is a 1Om tower providingalternative measurements of wind speed, wind direction and sigma theta. A 10m supplementaldownriver meteorological tower is also available. This tower measures wind speed, winddirections, sigma theta, temperature and dew point.
SSES meteorological data are transmitted to the plant Control Room, Technical Support Center,and Emergency Operations Facility for emergency response availability. The data are alsotransmitted via telephone data line directly to the ABS office in Rockville, Maryland.
The onsite CR21X data loggers at SSES generated the meteorological data used in allcalculations. The data are hourly averages with the exception of the rainfall data that is the totMdrainfall for the hour. These data were transmitted to ABS Consulting on a daily basis using theCampbell Scientific PC-208W program. Once the data was received, an ABS Meteorologistreviewed it. Data were compared between tower levels and between the primary, backup anddownriver towers. When discrepancies were found bad data were edited out of the database.These periods of bad or missing data were left out of all calculations.
R-1288497-601, Rev. 0s:\wp\ppl\Annual Report 2005.doc
5 of 95 April 12, 2006
1.3. METHODOLOGY
1.3.1 MIDAS Software Calculations
The calculations performed for this report used MIDAS programs to generate tables and figures.All calculations used a final set of hourly meteorological data generated by ABS Consulting.The MIDAS programs used in the calculations have been previously validated in TheVerification and Validation of MIDAS (Meteorological Information and Dose AssessmentSystem), Volumes I and 2, December 1988 (Reference 9).
The following MIDAS programs were run to generate this report:
MIDMT - Meteorological Trend PlotMIDEM Edit Meteorological DataMIDJF - Joint Frequency Distribution TableMIDBD - Data Recovery Percentage TableMIDRO - Wind Rose PlotMIDMA - Meteorological Average Data TableXDCALC - X/Q CalculationsXQINTR - X/Q Results at Specific Locations
Long-term dispersion modeling for effluents from normal operation of SSES is done using theMIDAS system XDCALC program, a straight-line Gaussian plume model designed to estimateaverage relative concentration. The model was developed in accordance with U.S. NRCRegulatory Guide 1.111 (Reference 3). For periods when the 1 Om wind speed is calm, the actualwind direction that occurred is used.
XDCALC and the XQINTR program that interpolates X/Q values to exact locations both useterrain correction factors to account for the temporal and spatial variations in the airflow in theregion. A straight-line trajectory model assumes that a constant mean wind transports anddiffuses effluents in the direction of airflow at the release point within the entire region ofinterest. The SSES terrain correction factors were taken from SSES FSAR Table 2.3-128Reference 5).
The WINDOW program was used for short-term diffusion estimates for 0-2 hour up to 30-dayperiods. The methodology used in WINDOW is described in NRC Regulatory Guide 1.145(1982) .(Reference 4). Allowances are made for plume meander during light winds and stableatmospheric conditions. The WINDOW methodology is distance and direction dependent,
R-1288497-601, Rev. 0s:\wp\ppi\Annual Report 2005.doc
6 of 95 April 12, 2006
2.0 METEOROLOGY
2.1 ONSITE METEOROLOGICAL MEASUREMENTS PROGRAM
The onsite meteorological program is designed to provide accurate and complete meteorologicalmonitoring of the SSES site area. The program also produces accurate, summarized, hourlymeteorological data for use as input in atmospheric dispersion estimate computer programs.Onsite meteorological data are processed and analyzed by air quality meteorologists usingstatistical computer programs. The output from these programs is then used as data input byatmospheric dispersion estimate computer programs. Atmospheric dispersion estimates providevaluable information to safety planners for both routine and accidental radioactivereleases. Thisinformation is also used when estimating the possible consequences of hypothetical accidentscenarios. Analysis of meteorological data provides an assessment of the diffusion patternscharacteristic to the site.
2.1.1 Meteorological Towers
In November 1972, a 300 ft steel framed primary meteorological tower was erected at the SSESsite approximately 1000 ft southeast of the Unit l/Unit 2 Reactor Building. Recordedmeteorological data from the tower's sensors are used to define the stability and movement ofthe layer of air into which the effluent from the facility would be released. In late June 1981, amajor modification to the primary tower was performed by moving the wind and temperaturesensors to 10 meters (33 ft) and 60 meters (197 ft). The rain gauge was left at the base of thetower. Also in 1981, a backup tower was erected to provide comparative meteorological data tothe primary tower and to serve as .a secondary data source in the event of sensor failure on theprimary tower. This backup tower is used to measure wind speed and wind direction at the10-meter level. The variability of wind direction (sigma theta) is also derived at this level andcan be used to gauge atmospheric stability. The backup tower is located approximately 1600 ftnorth-northeast of the primary tower (see Figure 16). A 60-meter tower replaced the primarytower in November 2001, located about 25 ft southwest of the original tower. All of theinstrumentation from the original 300 ft. tower was transferred to the new 60m tower at' theirsame locations.
Two supplemental 10-meter towers were erected in 1985. In reference to their positions relativeto the SSES site, these towers were named the "upriver" tower and the "downriver" tower.Figure 16 shows the location of the upriver tower that is used for the purpose of measuring theeffects of the Susquehanna River Valley on atmospheric dispersion and transport of site airborneeffluents. Wind speed and wind direction are measured at both towers with temperature and dewpoint temperature measured at the downriver tower. Variability of wind direction is derived atthe .10-meter level at both tower locations. Meteorological data validation at the upriver towerwas terminated on October 1, 1994. No data from the upriver tower is included in this report.
R-1288497-601, Rev. 0s:\wp\ppl\Annual Report 2005.doc
7 of 95 April 12, 2006
2.1.2 Instrumentation
W New meteorological instrumentation was installed on the primary and backup towers in earlyOctober 1988. ' This instrumentation along with the downriver supplemental towerinstrumentation is described in Appendix A. Model numbers, sensor heights and a briefdescription of instrument characteristics are provided.
Calibration and maintenance are conducted semi-annually on the primary, backup and downrivertower systems in accordance with the frequencies and procedures prescribed in themanufacturer's operating and maintenance manuals.
2.1.3 Data Reduction
Since April 1, 1992, the primary method of compiling the hourly meteorological data record wasby transmission of the data via telephone line from the SSES meteorological shelters. These datanow go directly to the ABS office in Rockville, Maryland. Prior to April 1992, data werereceived for review via electronic media from the PPL corporate computer in Allentown,Pennsylvania. This modification was made to eliminate duplication of the data (and the potentialfor error) by creating one validated meteorological database. The digital meteorological data areinspected daily by meteorologists to identify periods of questionable. or missing data. Digitalmeteorological data that are questionable or missing are compared to data obtained via analogstrip charts, maintained by the PPL staff at SSES. The analog strip chart data are used to replacequestionable or missing digital data as necessary.
The meteorological parameters required by atmospheric diffusion estimate computer models arewind speed, wind direction and atmospheric stability. Atmospheric stability is determined bymeasuring the change in temperature with respect to height at the two levels of 10 and 60 meters.The summarized hourly data are used as input to two atmospheric dispersion estimate computerprograms: the short-term (accident) atmospheric dispersion model (WINDOW) and the long-term (annual average) atmospheric dispersion model (XDCALC).
2.1.4 Data Recovery
Data recovery for all of the meteorological parameters measured at the primary, backup anddownriver towers during 2005 is included in Table 1.. The joint data recovery during 2005 forthe meteorological parameters measured at the primary tower was very good with recoveries of99% or greater for all parameters, with the exception of the 60m wind direction (83%) and therain gage (95%). With the exception of the 60m wind direction this is well above the 90 percentlevel recommended in NRC Regulatory Guide 1.23 (Reference 2).
2.2 REGIONAL CLIMATOLOGY
The regional climatology near the SSES site is profoundly influenced by the surroundingmountains and the Susquehanna River Valley, which is oriented from southwest to northeast.The topography influences the temperature, winds and precipitation amounts year round. Theprevailing westerly winds that affect Pennsylvania carry most weather systems to the SSESvicinity from the west and southwest. Precipitation is fairly evenly distributed throughout theyear; however, Atlantic coastal storms result in the heaviest rain and snowfalls during the fall,winter and spring months. Heavy rainfall occasionally affects central Pennsylvania from theR-1288497-601, Rev. 0 8 of 95 April 12, 2006s:\wp\ppl\Annual Report 2005.doc
outer fringes or remnants of Atlantic tropical storms during the summer and early fall months.The majority of. summer precipitation occurs from showers and thunderstorms. Temperaturesusually range between 0 and 100 degrees Fahrenheit over the course of a year.
2.3 LOCAL METEOROLOGY
2.3.1 Normal and Extreme Values of Meteorological Parameters
2.3.1.1 Wind Direction and Wind Speed
The wind direction classification system recommended by the NRC for annual meteorologicalsummaries are the standard sixteen 22.5 degree wind direction sectors as depicted in Figure 1.Wind directions always refer to the sector that the wind is coming from. Specifically, asouthwest wind is defined as a wind that originates from the southwest sector blowing toward thenortheast sector.
During 2005, the 10-meter wind direction with the greatest frequency was from the east-northeast sector (15.3% of the time) with the average wind speed from this sector of 2.4 mph.This was the twenty-first consecutive year that the east-northeast sector had the greatestfrequency of wind. The most frequent 60-meter wind direction during 2005 was from the north-northeast sector (16.9% of the time) with the average wind speed originating from that sector of6.4 mph. Table 2 summarizes the 2005 average wind speed and wind direction frequencies at theprimary tower from both the 10 and 60m levels. The wind direction at 60m was out-of servicefrom the end of May until the beginning of August due to a broken wind vane. A few periodswith high wind speeds during that period register good wind direction values. The remainder ofthe period was not used in the 2005 database.
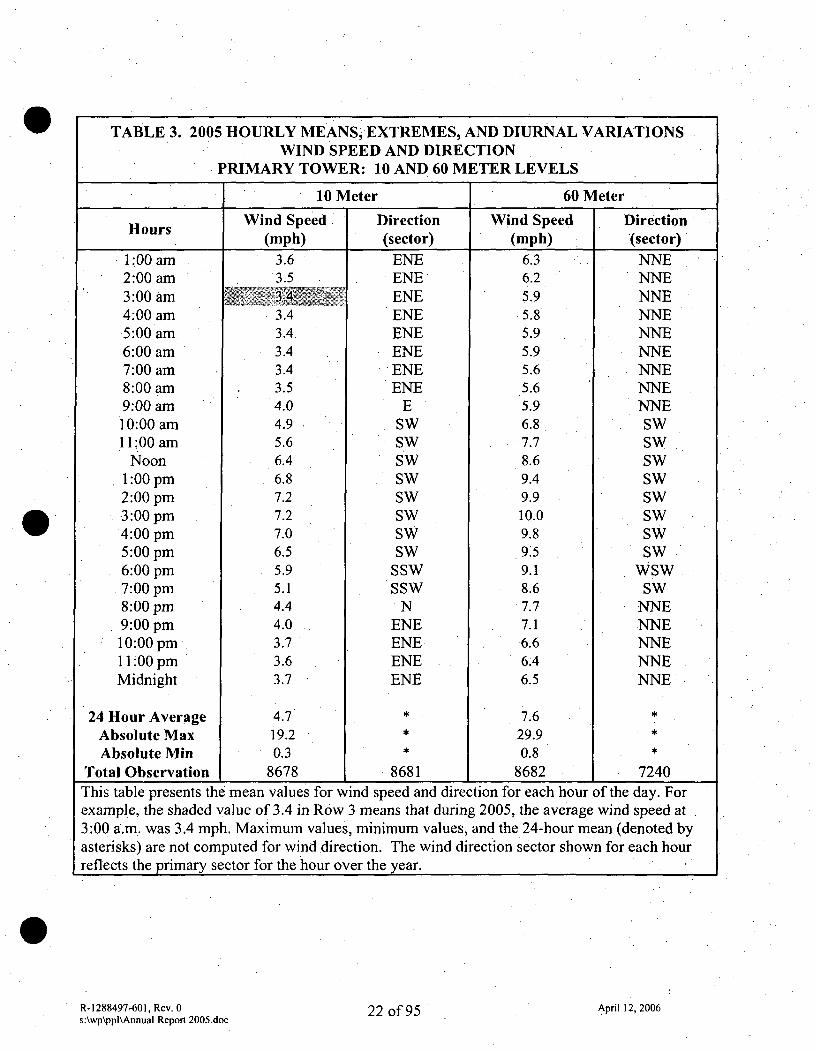
Table 3 lists annual hourly averages for wind directions and wind speeds at the 10 and 60-meterlevels. This table clearly shows that wind speeds at night are less than daytime wind speeds. Onaverage, the daytime winds flow "up the valley" and the lighter, overnight winds flow "down the.valley." Extreme wind speeds at the SSES site usually occur with the passage of Vigorous coldfronts and the subsequent onset of high pressure or during violent thunderstorms. The peakhourly average wind speed at the 10 and 60m levels were 19.9 mph and 29.9 mph respectivelyduring 2005.
Tables 4 and 5 provide the 2005 wind direction persistence at the 10 and 60-meter levels. Winddirection persistence is defined as the number of consecutive hours for which the winddirection originated from the same sector. It is useful in determining predominance of winddirection at the SSES site and the probability of wind direction continuing from any given sectorfor consecutive hours. In 2005, the maximum 10-meter wind direction persistence was 12 hoursfrom the southwest, west-southwest and east-northeast sectors. The maximum 60-meter winddirection persistence was 17 hours, , from the west-southwest sector. From a historicalperspective, the greatest periods of wind persistence at SSES site are generally from the north-northeast, east-northeast, or southwest sectors. When winds are blowing from these sectors,there is a higher than normal probability that winds will continue from these sectors, especiallyin the nighttime hours. These tend to also be the predominant wind directions for east coaststorms that can last for long periods of time. Figures 2 through 5 provide wind rose data at 10and 60 meters on the primary tower, 10m on the backup tower and 10m on the downriver tower.Wind roses display the frequency, in percent, of average wind direction and the wind speedR-1288497-601, Rev. 0 9 of 95 April 12, 2006s:\wp\pplhAnnual Report 2005.doc
groups from those directions. The data is also presented in Table 2 for the primary tower 10and 60m levels.
The diurnal variations of wind speed and direction at the 10 and 60-meter levels are presented inTable 3. Figures 6 through 9 provide the reader with a graphical presentation of these data.
Table 6 puts the primary tower 10-meter wind speed and direction data for 2005 into historicalperspective. During 2005 the wind direction with the greatest frequency (as measured at theprimary tower) was from the east-northeast sector. The second greatest wind direction frequencywas from the southwest sector. At the primary tower, winds from the 10-meter level havepredominated from the east-northeast sector for 22 of the past 27 years including the last21 years in a row. At the 60m level the predominate direction in .2005 was from the north-northeast. During the last 20 years the predominate wind direction has either been from thenorth-northeast or southwest
2.3.1.2 Temperature and Atmospheric Water Vapor
Table 7 provides annual averages for each hour of the day for the ambient air temperature andthe dew point temperature from the primary tower. Figures 10a, 10b, 1 la and 1 lb graphicallysummarize the diurnal variation of the ambient and dew point temperatures from the primary anddownriver towers. The dew point temperature on both the primary and downriver towersfunctioned normally during most of 2005. There were some time periods when they werereading too low, particularly during periods of rainfall and when the temperatures were belowfreezing. Figures 12 and 13 show the average of the daily maximums, minimums and averagesof temperature and dew point by month.
The temperatures during 2005 were a little above average. The winter temperatures were aboutthree degrees cooler than normal, the spring about normal, the summer was quite warmaveraging more than 4.5 degrees above normal. There were 13 days when temperatures reachedabove 90'F. This was well above the average, which is about 8 days per year. The remainder of
.the year averaged about normal. During 2005, the greatest average hourly temperature of 95.80Foccurred on August 13. The highest hourly average dew point temperature of 69.40F occurredon July 27. The lowest hourly average temperature of -7.0°F occurred on the morning ofJanuary 28, 2005. The temperature dropped to below zero on five days during 2005.
Table 8 presents a summary of mean annual values of temperature, wet bulb temperature, andrelative humidity at SSES since 1973. The mean annual temperature at SSES during 2005 was49.70F. July 2005 was the warmest month of the year with an average temperature of 73.2'F.January was the coldest month of 2005 with an average temperature of 25.8'F. The weatherpattern during 2005 was somewhat irregular with longer than normal stretches of cold weatherduring the winter and warm weather during the summer. There were about 46 days when thetemperature failed to get above 320F, compared with the 27 days in a normal year. There wereseveral prolonged warm periods during 2005. These were from June 6-9, June 25-28, July 10-13, July 18-21, August 1-5 and August 10-15 2005. Temperatures were particularly cold fromJanuary 21-24, January 27 through February 2 and December 13-15 2005. The data used in thiscomparison were the 2005 SSES site data and 30-year average (1971-2000) NOAA data fromScranton-Wilkes-Barre (measured at the Avon, PA airport).
R-1288497-601, Rev. 0s:\wp\ppl\Annual Report 2005.doc
10 of 95 April 12, 2006
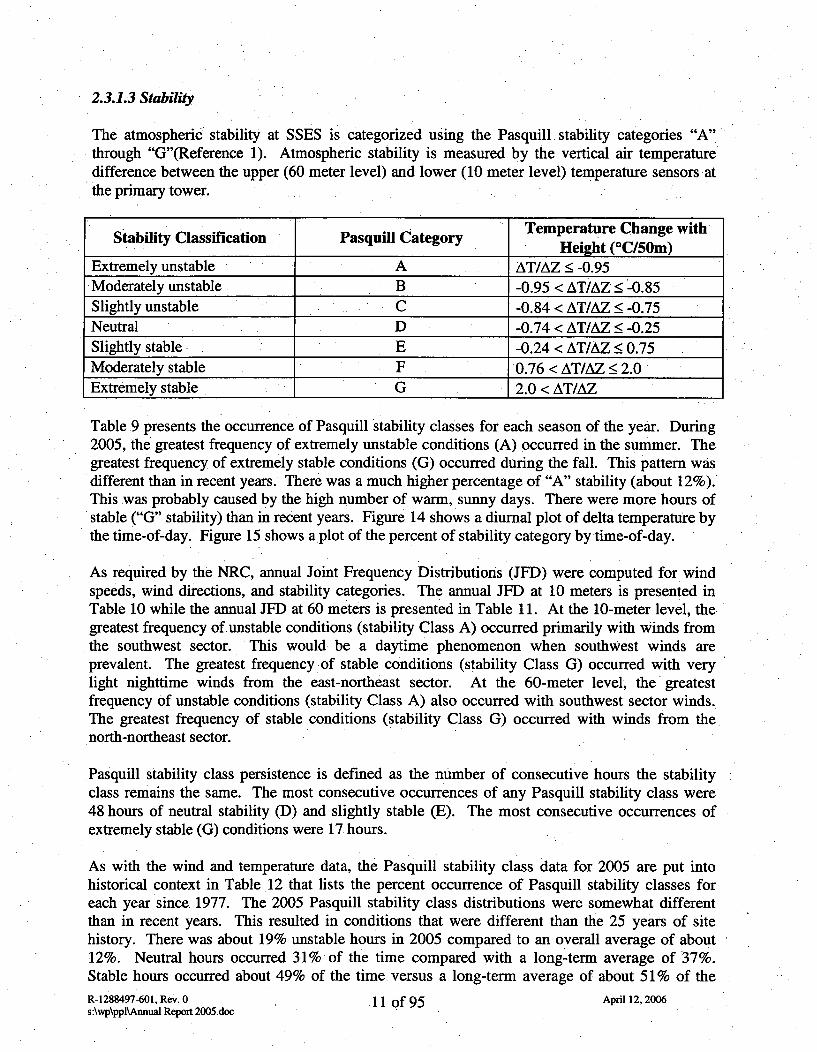
2.3.1.3 Stability
The atmospheric stability at SSES is categorized using the Pasquill• stability categories "A"through "G"(Reference 1). Atmospheric stability is measured by the vertical air temperaturedifference between the upper (60 meter level) and lower (10 meter level) temperature sensors atthe primary tower.
Temperature Change withStability Classification Pasqufll Category Height (°C/50m)
Extremely unstable A AT/AZ < -0.95Moderately unstable B -0.95 < ATAZ < -0.85Slightly unstable C -0.84 < AT/AZ < -0.75Neutral D -0.74 < AT/AZ < -0.25Slightly stable E -0.24 < AT/AZ •0.75Moderately stable F 0.76 < AT/AZ •2.0Extremely stable G 2.0 < AT/AZ
Table 9 presents the occurrence of Pasquill stability classes for each season of the year. During2005, the greatest frequency of extremely unstable conditions (A) occurred in the summer. Thegreatest frequency of extremely stable conditions (G) occurred during the fall. This pattern wasdifferent than in recent years. There was a much higher percentage of "A" stability (about 12%).This was probably caused by the high number of warm, sunny days. There were more hours ofstable ("G" stability) than in recent years. Figure 14 shows a diurnal plot of delta temperature bythe time-of-day. Figure 15 shows a plot of the percent of stability category by time-of-day.
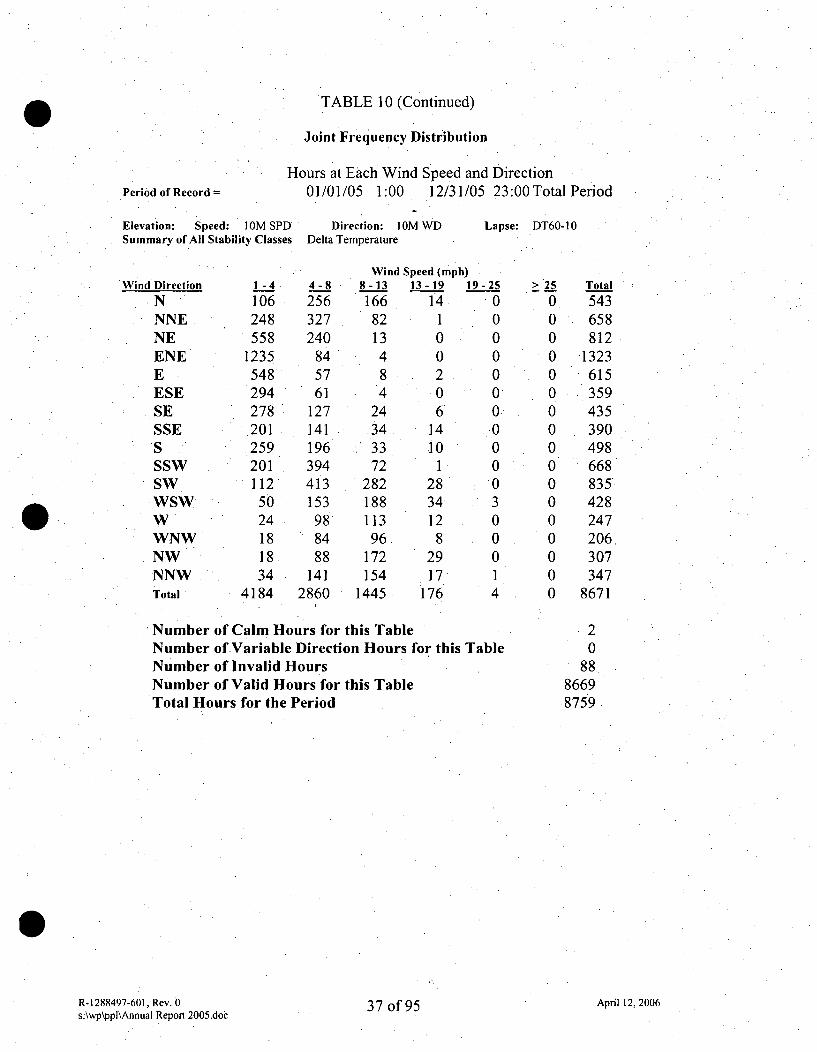
As required by the NRC, annual Joint Frequency Distributions (JFD) were computed for windspeeds, wind directions, and stability categories. The annual JFD at 10 meters is presented inTable 10 while the annual JFD at 60 meters is presented in Table 11. At the 10-meter level, thegreatest frequency of unstable conditions (stability Class A) occurred primarily with winds fromthe southwest sector. This would be a daytime phenomenon when southwest winds areprevalent. The greatest frequency of stable conditions (stability Class G) occurred with verylight nighttime winds from the east-northeast sector. At the 60-meter level, the greatestfrequency of unstable conditions (stability Class A) also occurred with southwest sector winds.The greatest frequency of stable conditions (stability Class G) occurred with winds from the.north-northeast sector.
Pasquill stability class persistence is defined as the number of consecutive hours the stabilityclass. remains the same. The most consecutive occurrences of any Pasquill stability class were48 hours of neutral stability (D) and slightly stable (E). The most consecutive occurrences ofextremely stable (G) conditions were 17 hours.
As with the wind and temperature data, the Pasquill stability class data for 2005 are put intohistorical context in Table 12 that lists the percent occurrence of Pasquill stability classes foreach year since. 1977. The 2005 Pasquill stability class distributions were somewhat differentthan in recent years. This resulted in conditions that were different than the 25 years of sitehistory. There was about 19% unstable hours in 2005 compared to an overall average of about12%. Neutral hours occurred 31% of the time compared with a long-term average of 37%.Stable hours occurred about 49% of the time versus a long-term average of about 51% of theR-1288497-601, Rev. 0s:\wp\ppl'Annual Report 2005.doc
11 of 95 April 12, 2006
time. Overall the differences in the stability categories had little affect on the dispersion.estimates since there was an increase in "A" stability class (extremely unstable) as well "G"stability class (extremely stable) which tended to offset each other.
2.3.1.4 Precipitation
In central Pennsylvania, the 30-year average (1971-2000) annual precipitation values range from41.59 inches in Williamsport, PA to 37.56 inches at Wilkes-Barre/Scranton Airport in Avoca,PA. The annual precipitation total during 2005 was 48.12 inches in Williamsport and 36.68inches in Avoca. The annual precipitation total as measured at the SSES site was 34.08 inches.The difference between the two NWS sites was mainly due to summertime hit and missthunderstorms and the passage of a tropical storm that had a much greater affect on Williamsportthan Avoca or SSES. The precipitation for the year started somewhat above average for the firstfour months. of the year. However, the next five months were below normal with Septemberrainfall being a record monthly low for the last 30 years of 0.80 inches. The last three months ofthe year had above average rain and snowfall. At SSES, the precipitation totals for 2005 werealso below normal as they were at Avoca. There was a period from the end of August throughthe end of October when the rain gage was not functioning properly. Data from the two nearbyNWS sites were used to substitute for the missing period. Precipitation at SSES tends to belower than the NWS sites particularly in the winter because the snow is difficult to collect andmelt, and during summer thunderstorms windblown rain may not end up in the tipping bucket.The greatest one-day total at SSES was 1.65 inches on October 7, 2005. There were ten dayswith one inch or more of rain. Table 13 shows daily, monthly and annual precipitation at SSES.Table 14 shows the normal and 2005 monthly and annual precipitation totals at Williamsport andAvoca.
R-1288497-601, Rev. 0 12 of 95 April 12, 2006s:\wp\ppl\Annual Report 2005.doc
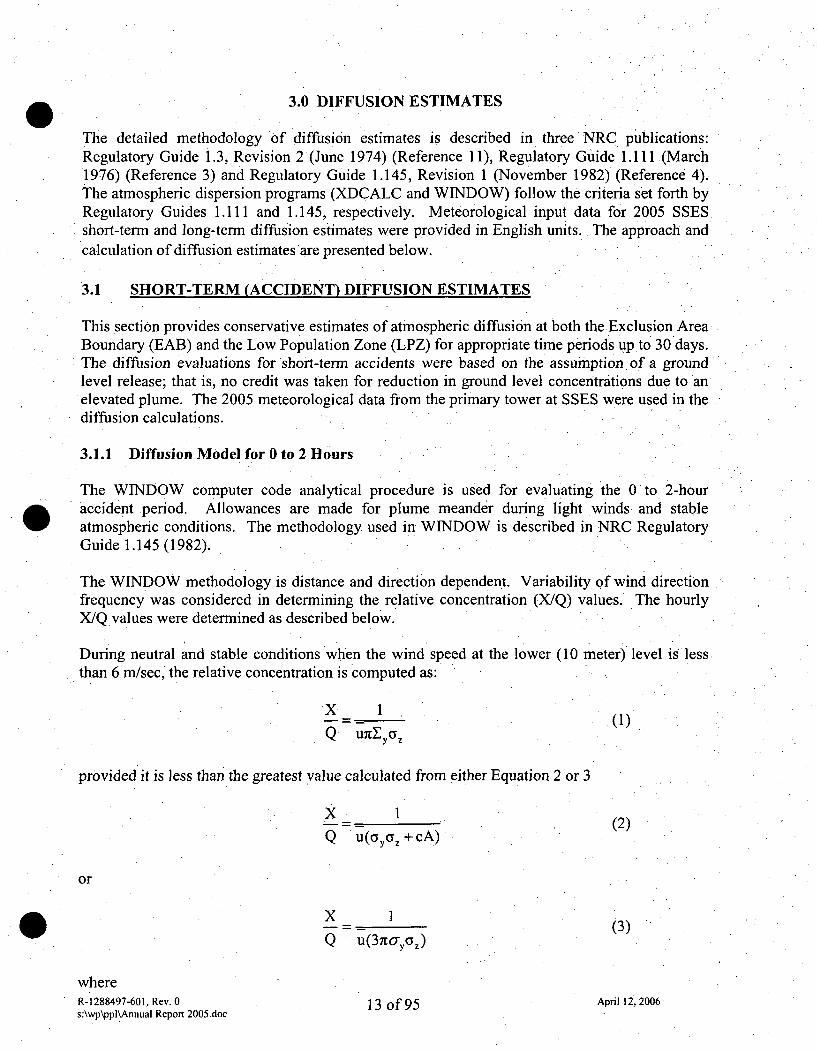
3.0 DIFFUSION ESTIMATES
The detailed methodology of diffusion estimates is described in three NRC publications:Regulatory Guide 1.3, Revision 2 (June 1974) (Reference 11), Regulatory Guide 1.111 (March1976) (Reference 3) and Regulatory Guide 1.145, Revision 1 (November 1982) (Reference 4).The atmospheric dispersion programs (XDCALC and WINDOW) follow the criteria set forth byRegulatory Guides 1.111 and 1.145, respectively. Meteorological input data for 2005 SSESshort-term and long-term diffusion estimates were provided in English units. The approach andcalculation of diffusion estimates are presented below.
3.1 SHORT-TERM (ACCIDENT) DIFFUSION ESTIMATES
This section provides conservative estimates of atmospheric diffusion at both the Exclusion AreaBoundary (EAB) and the Low Population•Zone (LPZ) for appropriate time periods up to 30 days.The diffusion evaluations for short-term accidents were based on the assumption of a groundlevel release; that is, no credit was taken for reduction in ground level concentrations due to anelevated plume. The 2005 meteorological data from the primary tower at SSES were used in thediffusion calculations.
3.1.1 Diffusion Model for 0 to 2 Hours
The WINDOW computer code analytical procedure is used for evaluating the 0 to 2-hour.accident period. Allowances are made for plume meander during light winds and stableatmospheric conditions. The methodology used in WINDOW is described in NRC RegulatoryGuide 1.145 (1982).
The WINDOW methodology is distance and direction dependent. Variability of wind directionfrequency was considered in determining the relative concentration (X/Q) values., The hourlyX/Q values were determined as described below.
During neutral and stable conditions when the wind speed at the lower (10 meter) level is lessthan 6 rn/sec, the relative concentration is computed as:
X_= 1 .'(1)
Q -7zC
provided it is less than the greatest value calculated from either Equation 2 or 3
x I - - " (2) -.Q U((Yyaz +cA)(
or
x _
S= y(3)
whereR-1288497-601, Rev. 0 13 of 95 April 12, 2006s:\wp\ppl\Annual Report 2005.doc
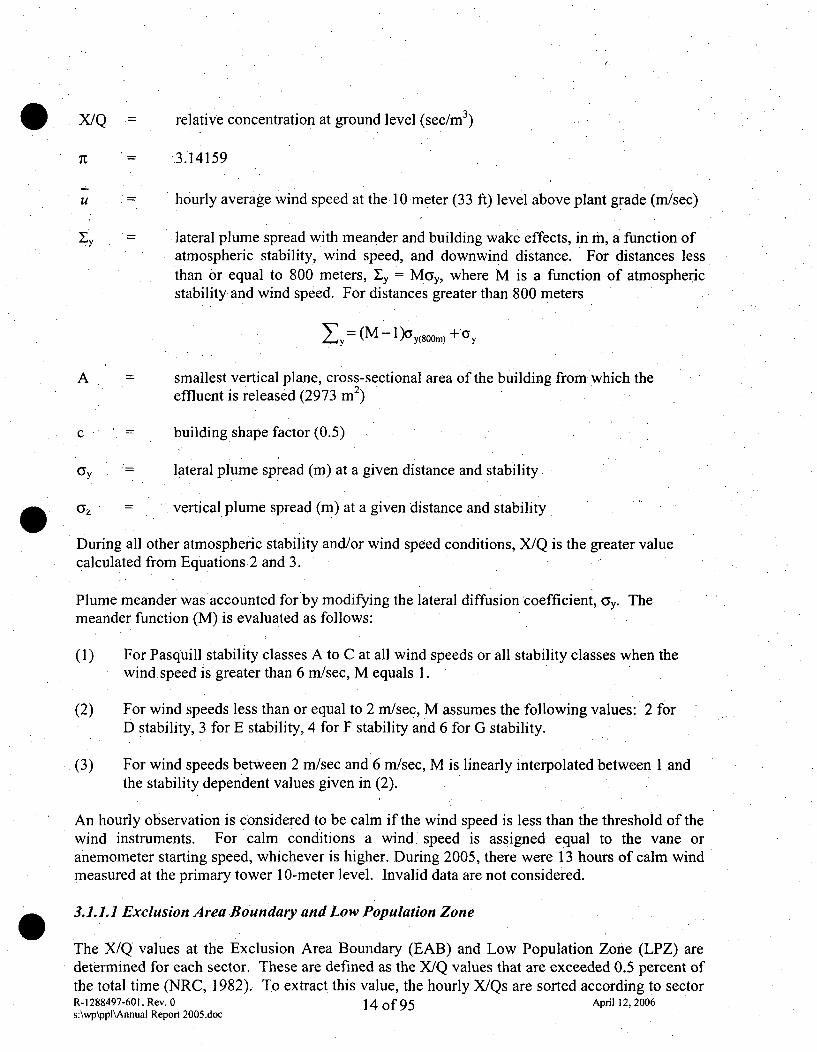
X/Q relative concentration at ground level (sec/rn 3)
7t = 3.14159
u = hourly average wind speed at the 10 meter (33 ft) level above plant grade (mr/sec)
y = lateral plume spread with meander and building wake effects, in m, a function ofatmospheric stability, wind speed, and downwind distance. For distances lessthan or equal to 800 meters, y = Mry, where M is a function of atmosphericstability and wind speed. For distances greater than 800 meters
•y= (M 1 1)(Yy(80Om) + y
A = smallest vertical plane, cross-sectional area of the building from which theeffluent is released (2973 m 2)
c = building shape factor (0.5)
y = lateral plume spread (in) at a given distance and stability.
z = vertical plume spread (m) at a given distance and stability
During all other atmospheric stability and/or wind speed conditions, X/Q is the greater valuecalculated from Equations 2 and 3.
Plume meander was accounted for by modifying the lateral diffusion coefficient, oy. Themeander function (M) is evaluated as follows:
(1) For Pasquill stability classes A to C at all wind speeds or all stability classes when thewind speed is greater than 6 mr/sec, M equals 1.
(2) For wind speeds less than or equal to 2 m/sec, M assumes the following values: 2 forD stability, 3 for E stability, 4 for F stability and 6 for G stability.
(3) For wind speeds between 2 m/sec and 6 mi/sec, M is linearly interpolated between l andthe stability dependent values given in (2).
An hourly observation is considered to be calm if the wind speed is less than the threshold of thewind instruments. For calm conditions a wind speed is assigned equal to the vane oranemometer starting speed, whichever is higher. During 2005, there were 13 hours of calm windmeasured at the primary tower 10-meter level. Invalid data are not considered.
3.1.1.1 Exclusion Area Boundary and Low Population Zone
The X/Q values at the Exclusion Area Boundary (EAB) and Low Population Zone (LPZ) aredetermined for each sector. These are defined as the X/Q values that are exceeded 0.5 percent ofthe total time (NRC, 1982). To extract this value, the hourly X/Qs are sorted according to sectorR-1288497-601, Rev. 0 14 of 95 April 12, 2006s:\wp\ppl\Annual Report 2005.doc
and magnitude. A cumulative probability distribution of X/Q values can easily be' constructedas:
rank of X/QP(X/Q) = "(4)X/Q population size
where P(X/Q) is the probability of being exceeded. For example, the tenth largest value of apopulation of 100 values has a probability of being exceeded of 10/100, or 10 percent. Thegreatest of the 16 sector X/Q values is defined as the maximum sector X/Q value.
For longer averaging times, these hourly X/Q values are used to represent the 2-hour X/Q value.Sector X/Q values are then determined for the EAB and LPZ for 8, 16, 72, and 624 hours by alogarithmic interpolation between the 2-hour X/Q value in each sector and the annual averageX/Q (see Section 3.2) at the same point. The highest of the 16 sector X/Q values are thenidentified for each time period.
3.1.1.2 Five Percent Overall Site X/Q Values
The X/Q values which are exceeded no more than 5 percent of the total time at the EAB and theLPZ are determined in a manner similar to the sector X/Q values. All of the hourly X/Q valuesare sorted according to magnitude (independent of direction) and the 5 percent value chosen.The 5 percent overall site X/Q values are also determined for 8, 16, 72, and 624 hours by
* logarithmic interpolation between the maximum annual average X/Q value and the 2-hour5 percent overall site X/Q value.
3.1.2 Results of Short-Term Diffusion Estimates
The 0.5% sector X/Q and maximum sector X/Q values for the EAB and LPZ are given in Tables15 and 16, respectively. Figures 17 and 18 are plots at the EAB and LPZ of each of the16 direction sectors for the five '(2, 8, .16, 72 and 624 hour) time periods. Tables 17 and 18present the 5 percent overall site X/Q values for the EAB and LPZ for the years 1978 through2005. Figures 19 and 20 show the 2005 5% overall X/Q for each of the five time periods at theEAB and LPZ. The values for 8, 16, 72, and 624 hours reflect a logarithmic interpolationbetween the 2-hour sector X/Qs and the annual average X/Qs for the same sector.
R-1288497-601, Rev. 0s:\wp\ppl\Annual Report 2005.doc
15 of 95 April 12, 2006
3.2 LONG-TERM (ROUTINE) DIFFUSION ESTIMATES
The long-term diffusion characteristics for the SSES were estimated in accordance with thecriteria set forth in NRC Regulatory Guide 1.111 (1977). The analysis was performed using theonsite meteorological data recorded at the primary tower for January through December 2005(see Section 1.2) and the atmospheric diffusion computer model, XDCALC.
3.2.1 Atmospheric Diffusion Models
3.2.1.1 Straight-Line Ahiflow Model
A ground level release model based on meteorological data and plant parameters was used tocalculate the annual average atmospheric relative, concentration (X/Q) values. Depletion factorsare computed directly from depletion curves from Regulatory .Guide 1.111 as the relativedeposition rates. For long-term, ground level relative concentrations, the, plume is assumed todiffuse evenly over a 22.5-degree sector.
The hourly relative concentration 'values are calculated in the• sector defined by the winddirection using the following equation:
X/Q 2 _ (5)
where
X/Q = ground level relative concentration (sec/m 3)
3 z = vertical standard deviation of the plume (in)
U = average wind speed (m/sec)
x = distance from the source (m)
However, with consideration of the turbulent wake effect, Equation 5 is revised as follows:
2.032X/Q= 2 (6)
y,+cV 2/htUX .(6
Where
c = building shape factor
V = vertical height of the highest adjacent building
The wake factor (cV 2/nt) is limited, close to the source, to a factor of 2az 2.
R-1288497-601, Rev. 0 16 of 95 April 12, 2006s:\wp\ppl\Annual Report 2005.doc
S2 VIf ,r3< the equation is(3< (T Z (z ' + C - - ,
= 2.032 (7)X/7).
(i.e., X/Q is calculated to be the larger of Equations 6.and 7). The total relative concentration ateach sector and distance is then divided by the total number of hours in the database.
'3.2.1.2 Methods of Depletion and Deposition Calculation
Depleted X/Q values are computed by applying the depletion factors provided in Figure 2 ofRegulatory Guide 1.1,11 to the calculated X/Q values. Relative deposition rates were calculatedusing the following equation:
DEPD/Q- *T' (8)
x *0.3927
where
D/Q = deposition rate at ground level (m-2).
DEPj = relative deposition rate at ground level (m-1) for the distance j interpolated fromTable 2.2.5.5.1-3 of the MIDAS documentation (derived from Regulatory Guide1.111 curves for program XDCALC.
0.3927 = radians per 22.5 degree direction sector
x = distance from the source (m)
Tf = terrain/recirculation correction factor (TCF)
3.2.1.3 Terrain/Recirculation Correction. Factors
The straight-line trajectory, Gaussian diffusion model assumes that a constant mean windtransports and diffuses plume effluents in the direction of airflow at the. release point within theentire region of interest. In other words, the wind speed and atmospheric stability at the releasepoint are assumed to determine the atmospheric dispersion characteristics in the direction of themean wind at all distances.
The PUFF model described in the SSES FSAR approximates a continuous release by dividingthe plume into a sufficient number of plume elements to represent a continuous plume. Eachplume element can be modified or advected independently according to the meteorological
* conditions (wind direction, wind speed, and atmospheric stability) of its immediate location. TheX/Q values calculated by the PUFF model would, therefore, account for the temporal and spatialvariations in the airflow in the site region.
R-1288497-601, Rev. 0s:\wp\ppl\Annual Report 2005.doc
17 of 95 April 12, 2006
* The terrain/recirculation correction factors (Tf) are determined as the ratio between the puffadvection X/Q estimates and the straight-line X/Q estimates in the form:
x-( ,Y)PQTf(x,y) - (9)
Where
Tf(x,y) = terrain/recirculation correction factor at the point (x,y)
X/Q(x,y)p- = the annual average relative concentration at point (x,y) using a puffadvection modeling scheme
X/Q(x,y)s = the annual average relative concentration at point (x,y) using a straight-line modeling scheme
As noted in the SSES FSAR, 1973-1976 data were used to compute the TCFs. The TCFs for theSB are listed in Table 19. The TCFs for standard distances are available in the SSES FSAR(1978). Terrain/recirculation correction factors and distances to the nearest residence, garden,dairy animal; and production animal in each sector are presented in Table 20.
3.2.2 Results of Long-Term Diffusion Estimates
The terrain/recirculation corrected annual average undecayed and undepleted relativeconcentration (X/Q) values calculated for the EAB and SB using the 2005 SSES meteorologicaldata are presented in Tables 21 and 22. These two tables also present the annual average 2.26-.day decayed and undepleted and 8-day decayed and depleted X/Qs as well as deposition rates(D/Q). Similar calculations were also made for the nearest residences, gardens, dairy animals,production animals, and two special locations within I mile of the SSES site. These calculationscan be found in Tables 23 and 24. Annual average X/Qs for standard distances in each sector arepresented in Tables 25 through 28.
R-1288497-601, Rev. 0 1 5 hif Qr April 12, 2006s:\wp~ppl\Annual Report 2005.doc
. 4.0 REFERENCES
1. ANSIANS-3.11 Standard for Determining Meteorological Information at Nuclear Facilities,February 16, 2000.
2. Nuclear Regulatory Commission, Regulatory Guide 1.23, Meteorological Programs inSupport of Nuclear Power Plants (Proposed Version. 1), 1980.
3. Nuclear Regulatory Commission, Regulatory Guide 1.111, 'Methods for EstimatingAtmospheric Transport and Dispersion of Gaseous Effluents in Routine Releases from Light-Water-Cooled Reactors,. 1977.
4. NuclearRegulatory Commission Regulatory Guide 1.145, Atmospheric Dispersion Modelsfor Potential Accident Consequence Assessments at Nuclear Power Plants, 1982.
5. Susquehanna Steam Electric Station FSAR, Section 2.
6. Susquehanna Steam Electric Station 2004 Meteorological Summary, January to December2004, ABS Consulting Inc., April 2005.
7. SSES 2005 Land Use Census, Ecology 111, inc., SSES Environmental Laboratory,November 2005.
8. NOAA, National Climate Data Center, Local Climatological Data for Avoca, Wilkes-Barre-Scranton, PA and Williamsport, PA, 2005.
9. MIDAS Programs, Verification and Validation of MIDAS Software Volumes 1 and 2,December 1988.
10. Certification of Computer Program, WINDOW, Version 5.4.1, June 07, 2001.
11. Nuclear Regulatory Commission Regulatory Guide 1.3, Assumptions Used for Evaluatingthe Potential Radiological Consequences of a Loss of Coolant Accident for Boiling Water
• Reactors, Revision 2, June 1974.
12. Calculation C-1288497-0607 Program output from Window, XDCALC and Wetnes.
R-1288497-601, Rev. 0s:\wp\ppl\Annual Reporl 2005.doc
19 of 95 April 12,2006
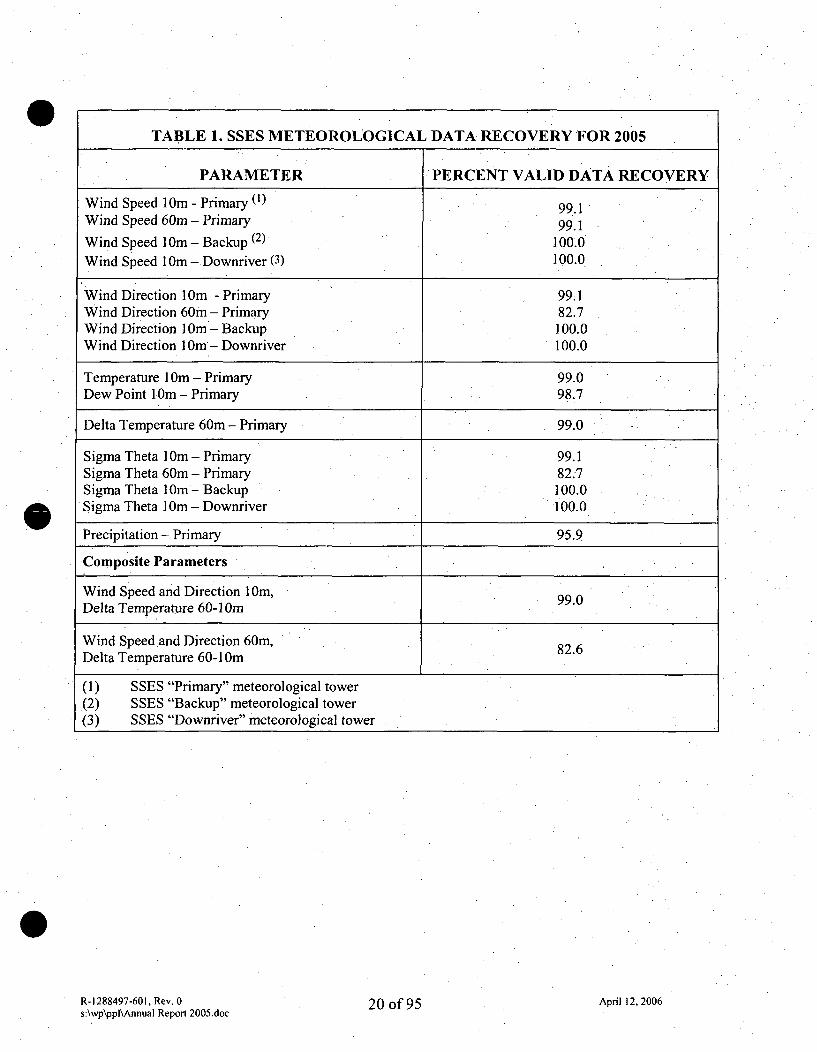
TABLE 1. SSES METEOROLOGICAL DATA RECOVERY FOR 2005
PARAMETER PERCENT VALID DATA RECOVERY
Wind Speed IOim - Primary (') 99.1Wind Speed 60m - Primary 99.1
Wind Speed I Om - Backup (2) 100.0Wind Speed lOim - Downriver (3) 100.0
Wind Direction 1Oim - Primary 99;1Wind Direction 60m - Primary 82.7Wind Direction l Om - Backup 100.0Wind Direction I Om - Downriver 100.0Temperature IOim - Primary 99.0
Dew Point 1Om -Primary 98.7
Delta Temperature 60m - Primary 99.0
Sigma Theta IOim - Primary 99.1Sigma Theta 60m - Primary 82.7Sigma Theta IOim -Backup 100.0Sigma Theta I Om - Downriver 100.0
Precipitation - Primary 95.9
Composite Parameters
Wind Speed and Direction 10m, 99.0Delta Temperature 60-1 Om
Wind Speed and Direction 60m, 82.6Delta Temperature 60-1Om
(1) SSES "Primary" meteorological tower.(2) SSES "Backup" meteorological tower(3) SSES "Downriver" meteorological tower
R-1288497-601, Rev. 0s:\wp\ppl\Annual Report 2005.doc
20 of 95 April 12, 2006

TABLE 2. 2005 AVERAGE WIND SPEED AND DIRECTIONFREQUENCIES BY SECTOR
PRIMARY TOWER: 10 AND 60 METER LEVELS
Direction 10 Meter 60 MeterFrom Frequency (%) Speed (mph) Frequency (%) Speed (mph)
N 6.3 6.3 7.7 7.4NNE 7.6 4.7 :16.9 6.4NE 9.4 3.2 9.5 5.3
ENE ° 15.3"j. 2.4 4.3 4.6E 7.1 2.3 3.2 4.6
ESE 4.1 2.5 3.3 4.5SE 5.0 3.5 4.5 5.6
SSE 4.5 4.4 4.4 7.5S .5.7 4.3 4.3 7.2
SSW 7.7 5.0 7.1 8.2SW 9.6 6.8 8.9 8.3
WSW 4.9 7.8 10.0 11.6W 2.8 7.5 4.5 10.4
WNW 2.4 7.6 3.0 10.3NW 3.5 8.6 4.4 10.5
NNW 4.0 7.7 3.9 9.7Calm 0.02 0.0
This table presents the frequency in percent that the winds originated from a given sector. Theaverage wind speed from that sector is also reported. During 2005, winds at the 10-meter leveloriginating from the East-Northeast sector were the most predominant, originating from thissector 15.3 % of the time. The average wind speed recorded from this sector during 2005 was2.4 miles per hour.
R-1288497-601, Rev. 0 21 of 95 April 12, 2006sAwp\ppi\Annual Reporn 2005.doc
TABLE•3. 2005 HOURLY MEANS, EXTREMES, AND DIURNAL VARIATIONSWIND SPEED AND DIRECTION
PRIMARY TOWER: 10 AND 60 METER LEVELS
10 Meter 60 Meter
Wind Speed Direction Wind Speed DirectionHours(mph) (sector) (mph) '(sector)
1:00 am 3.6 ENE 6.3 NNE2:00 am 3.5 ENE 6.2 NNE3:00am ENE 5.9 NNE4:00 am 3.4 ENE 5.8 NNE5:00 am 3.4 ENE 5.9 NNE6:00 am 3.4 ENE 5.9 NNE7:00 am 3.4 ENE 5.6 NNE8:00 am 3.5 ENE 5.6 NNE9:00 am 4.0 E 5.9 NNE10:00 am 4.9 SW 6.8 SW11:00 am 5.6 SW 7.7 SW
Noon 6.4 SW 8.6 SW1:00 pm 6.8 SW 9.4 SW2:00 pm 7.2 SW 9.9 SW3:00 pm 7.2 SW 10.0 SW4:00 pm 7.0 SW 9.8 SW5:00 pm 6.5 SW 9.5 SW6:00 pm 5.9 SSW 9.1 WSW.
•7:00 pm 5.1 SSW 8.6 SW8:00 pm 4.4 N 7;7 NNE9:00 pm 4.0 ENE 7.1 NNE10:00 pm 3.7 ENE 6.6 NNE11:00 pm 3.6 . ENE 6.4 NNEMidnight 3.7 ENE 6.5 NNE
24 Hour Average 4.7 * 7.6 *
Absolute Max 19.2 * 29.9 *
Absolute Min 0.3 * 0.8 *
Total Observation 8678 8681 8682 7240This table presents the mean values for wind speed and direction for each hour of the day. Forexample, the shaded value of 3.4 in Row 3 means that during 2005, the average wind speed at3:00 a.m. was 3.4 mph. Maximum values, minimum values, and the 24-hour mean (denoted byasterisks) are not computed for wind direction. The wind direction sector shown for each hourreflects the primary sector for the hour over the year.
R-1288497-601, Rev. 0s:\wp\ppl\Annual Report 2005.doc
22 of 95 April 12, 2006

TABLE 4. 2005 WIND DIRECTION PERSISTENCEPRIMARY TOWER: 10 METER LEVEL
Number of Consecutive Hours
Sector 1 2 3 4 5 6 7 8 19 10 11 12 13 14 .15 16N 250 53 23 11 3 5 3 1 0 0 0 0 0 0 0 0
NNE 309 78 18 12 4 4 3 2 0 1 0 0 0 0 0 0NE .464 93 32 7 2 1 2 1 0 0 0 0 0 0 0 0
ENE 506 137 54 26 18 11 6 5 3 0 0 1 0 0 0 0E 470 47 11 3. 0 1 0 0 0 0 0 0 0 0 0 0
ESE 287 26 4 2 0 0 0 0 0 0 0 0 0 0 0 0SE 284 41 13 5 2 0 0 0 0 0 0 0 0 0 0 0
SSE 249 26 10 4 3 1 2 0 1 0 0 0 0 0 0 0S 308 44 16 6 3 1] 0 0 1 0 0 0 0 0 0 0
SSW 350 96 20 7 5 1 1 0 0 0 0 0 0 0 0 0SW 366 86 35 20 3 6 2 2 1 1 0 1 0 0 0
WSW 239 45 10 7 2 2 1 0 0 0 0 1 0 0 0 0.W 139 31 12 1 0 1 0 0 0 0 0 0 0 0 0 0O
WNW 99 23 10 5 1 1 .0 0 0 0 0 0 0 0 0 0NW 119 25 12 7 3 5 0 0 2 0 1 0 0 0 0 0
NNW 160 36 11 11 5 1 1 0 0 0 0 0 0 0 0 0Total 4599 887291 134 54 41 21 11 8 2 1 3 0 0 0 0
This table presents the number of occurrences that the wind direction persisted from a givensector. For example, the shaded value (23) in the north sector means that 23 times during2005 the winds persisted from the north for three consecutive hours.
R-1288497-601, Rev. 0s:\wp\ppl\Annual Report 2005.doc
23 of 95 April 12,2006
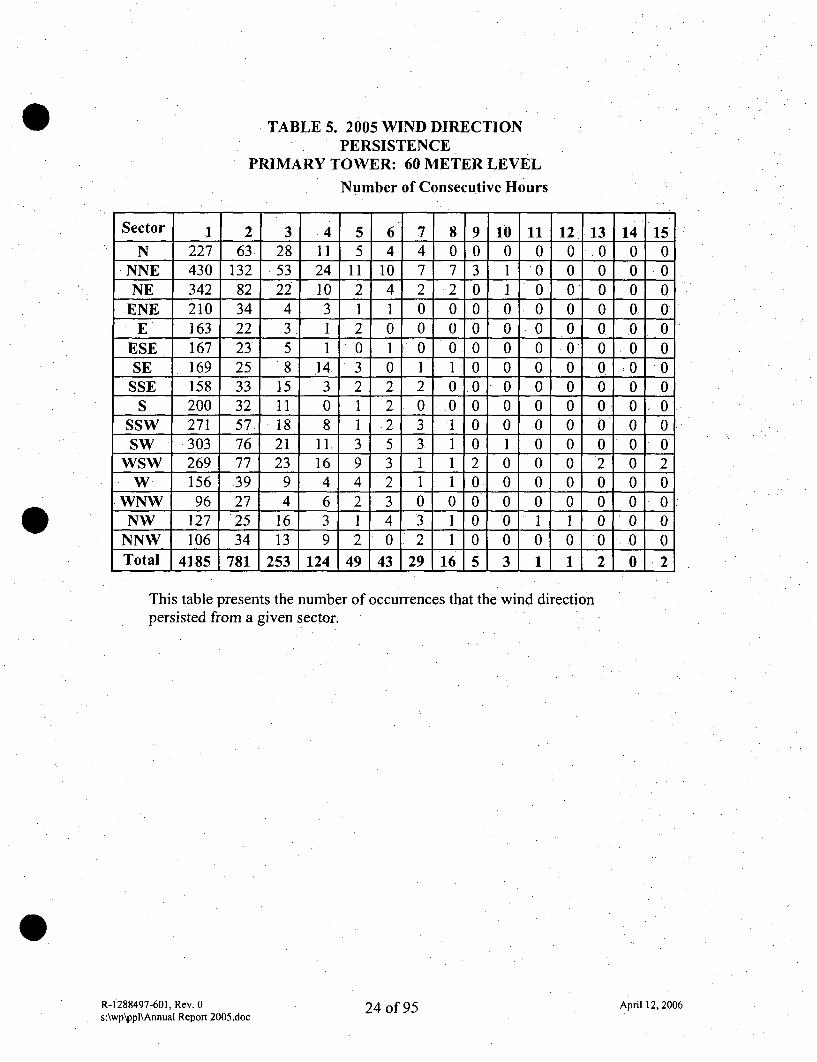
TABLE 5. 2005 WIND DIRECTIONPERSISTENCE
PRIMARY TOWER: 60 METER LEVEL
Number of Consecutive Hours
Sector 1 2 3 4 5 6 7 8 9 10 11 12 13 14 .15I N 227 63 28 11 5 4 4 0 0 0 0 0 .0 0 0
NNE 430 132 53 24 11 10 7 7 3 1 0 0 0 0 0NE 342 82 22 10 2 4 2 2 0 1 0 0 0 0 0
ENE 210 34 4 3 1 1 0 0 0 0 0 0 0 0 0E" 163 22 3 1 2 0 0 0 0 0 0 0 0 0 0
ESE 167 23 5 1 0 1 7 0 0 0 0 0 0 0 0 0SE 169 25 8 14 3 0 1 1 0 0 0 0 0 0 0
SSE 158 33 15 3 2 2 2 0 0 0 0 0 0 0 0S 200 32 11 0 1 2 0 0 0 0 0 0 0 0 -0
SSW 271 57 18 8 1 2 3 1 0 0 0 0 0 0 0SW 303 76 21 11. 3 5 3 1 0 1 0 0 0 0 0
WSW 269 77 23 16 9 3 1 1 2 0 0 ,0 2 0 2W 156 39 9 4 4 2 1 1 0 0 0 0 0 0 0
WNW 96 27 4 6 2 3 0 0 0 0 0 0 0 0 0NW 127 25 16 3 1 4 3 1 0 0 1 1 .0 0 0
NNW 106 34 13 9 2 0 2 1 0 0 0 0 0 0 0Total 4185 781 253 124 49 43 29 16 5 3 1 1 2 0 2
This table presents the number of occurrences that the wind directionpersisted from a given sector.
R-12884977601, Rev. 0s:\wp\ppl\Annual Report 2005.doc
24 of 95 April 12, 2006
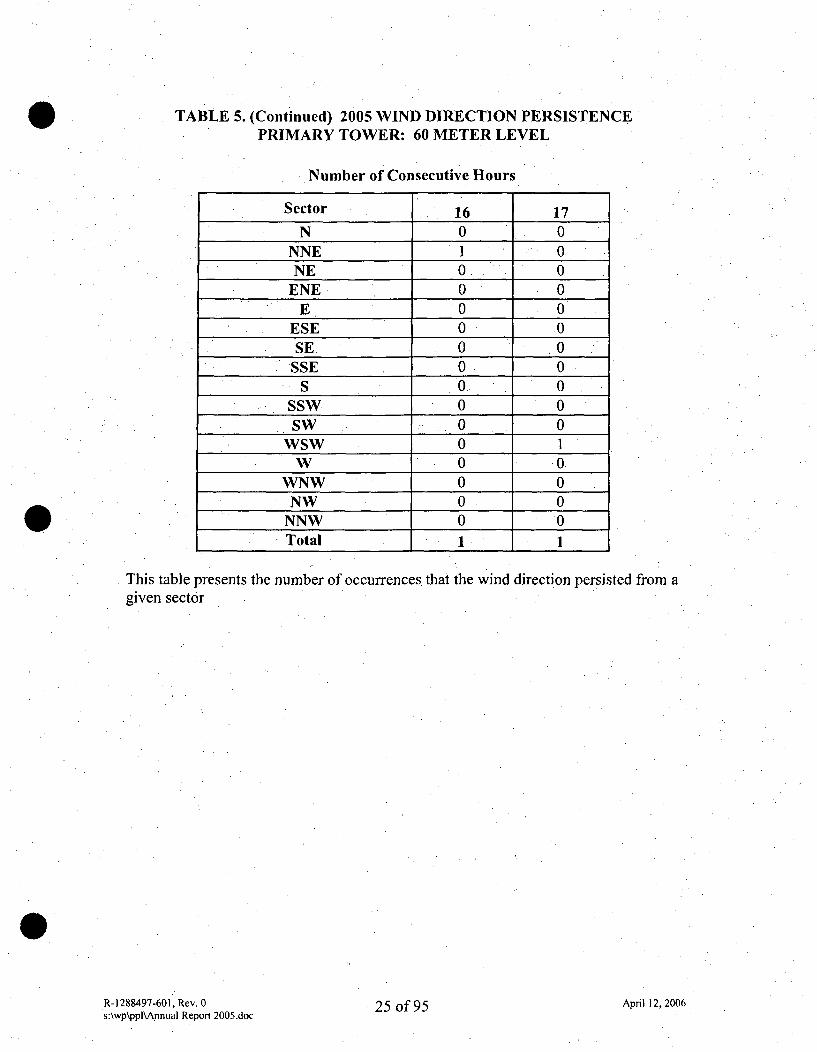
TABLE 5. (Continued) 2005 WIND DIRECTION PERSISTENCEPRIMARY TOWER: 60 METER LEVEL
Number of Consecutive Hours
Sector 16 17
N 0 0NNE 1 0NE 0. 0
ENE 0 0E 0 0
ESE 0• 0SE 0 0
SSE 0 0S 0 0
SSW 0 0SW 0 0
WSW 0 1W 0 0
WNW 0 0NW 0 0
NNW 0 0Total 1 1
This table presents the number of occurrences. that the wind direction persisted from agiven sector
R-1288497-601, Rev. 0s:\wp\ppl\Annual Report 2005.doc
25 of 95 April 12, 2006
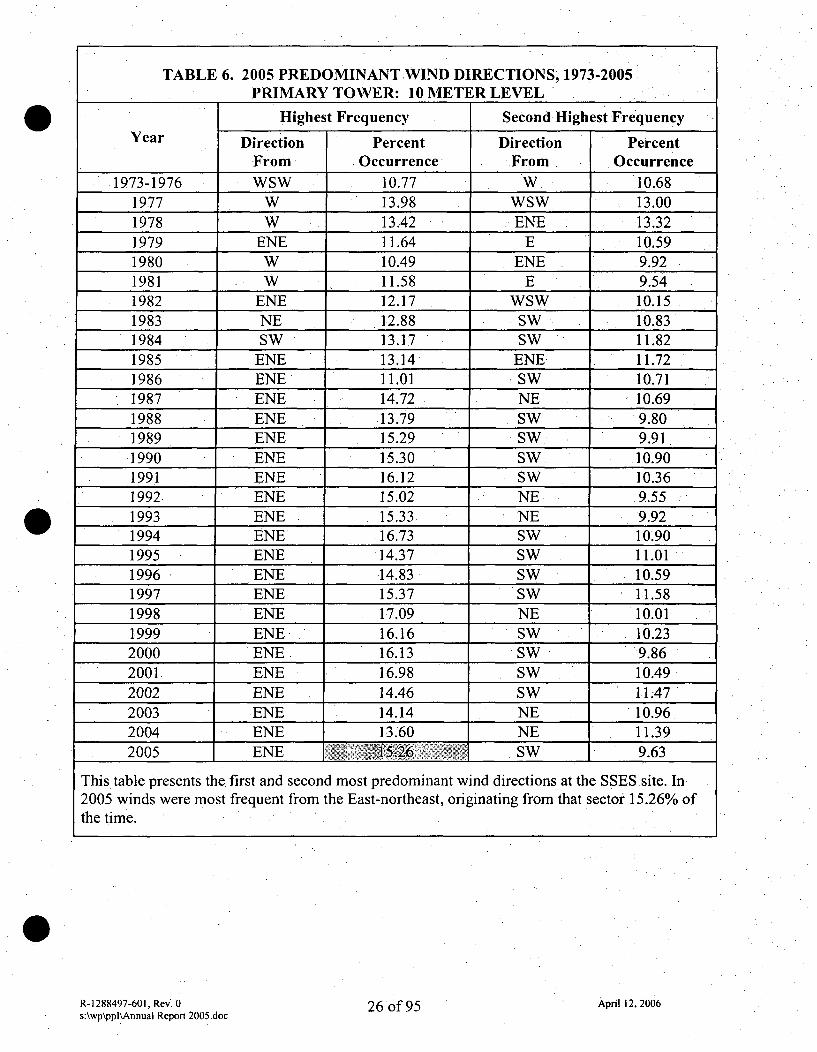
TABLE 6. 2005 PREDOMINANT WIND DIRECTIONS, 1973-2005PRIMARY TOWER: 10 METER LEVEL
Highest Frequency Second Highest FrequencyYear Direction Percent Direction Percent
From Occurrence From . Occurrence.1973-1976 WSW 10.77 W 10.68
1977 W 13.98 WSW 13.001978 W 13.42 ENE 13.321979 ENE 11.64 E 10.591980 W 10.49 ENE •9.921981 W 11.58 E 9.541982 ENE 12.17 WSW 10.151983 NE 12.88 SW 10.831984 SW 13.17 SW 11.821985 ENE 13.14 ENE 11.721986 ENE 11.01 SW 10.711987 ENE 14.72 NE 10.691988 ENE 13.79 SW 9.801989 ENE 15.29 SW, 9.91
.1990 ENE 15.30 SW 10.901991 ENE 16.12 SW 10.361992 ENE 15.02 NE 9.551993 ENE 15.33 NE 9.921994 ENE 16.73 SW 10.901995 ENE 14.37 SW 11.011996 ENE 14.83 SW 10.591997 ENE 15.37 SW 11.581998 ENE 17.09 NE •10.011999 ENE. 16.16 SW 10.232000 ENE 16.13 SW 9.862001 ENE 16.98 SW 10.492002 ENE 14.46 SW 11.472003 ENE 14.14 NE 10.96,2004 ENE 13.60 NE 11.392005 ENE 15.26 SW 9.63
This table presents the first and second most predominant wind directions at the SSES site. In2005 winds were most frequent from the East-northeast, originating from that sector 15.26% ofthe time.
R-1288497-601, Rev. 0s:\wp\ppl\Annual Report 2005.doc
26 of 95 April 12, 2006
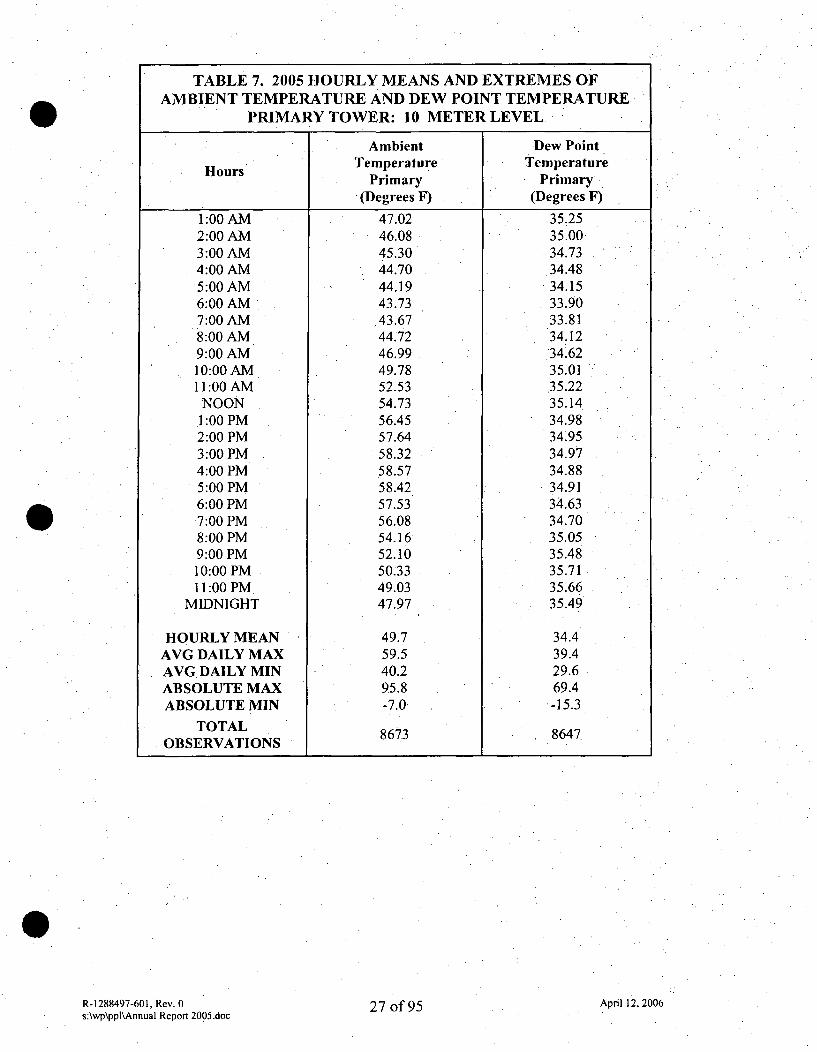
TABLE 7. 2005 HOURLY MEANS AND EXTREMES OFAMBIENT TEMPERATURE AND DEW POINT TEMPERATURE
PRIMARY TOWER: 10 METER LEVEL.
Ambient Dew PointHours Temperature Temperature
Primary Primary(Degrees F) (Degrees F)
1:00 AM 47.02 35.252:00 AM 46.08 35.003:00 AM 45.30 34.734:00 AM 44.70 34.485:00 AM 44.19 34.156:00 AM 43.73 33.907:00 AM 43.67 33.818:00 AM 44.72 34.129:00 AM 46.99 34'.6210:00 AM 49.78 35.0111:00 AM 52.53 35.22
NOON 54.73 35.141:00 PM 56.45 34.982:00 PM 57.64 34.953:00 PM 58.32 34.974:00 PM 58.57 34.885:00 PM 58.42 34.916:00 PM 57.53 34.637:00 PM 56.08 34.708:00 PM 54.16 35.059:00 PM 52.10 35.4810:00 PM 50.33 35.7111:00 PM 49.03 35.66
MIDNIGHT 47.97 35.49
HOURLY MEAN 49.7 34.4AVG DAILY MAX 59.5 39.4AVG DAILY MIN 40.2 29.6ABSOLUTE MAX 95.8 69.4ABSOLUTE MIN -7.0 -15.3
TOTALOBSERVATIONS 8673 8647
R-1288497-601, Rev. 0s:\wp\ppl\Annual Report 2005.doc
27 of 95 April 12, 2006
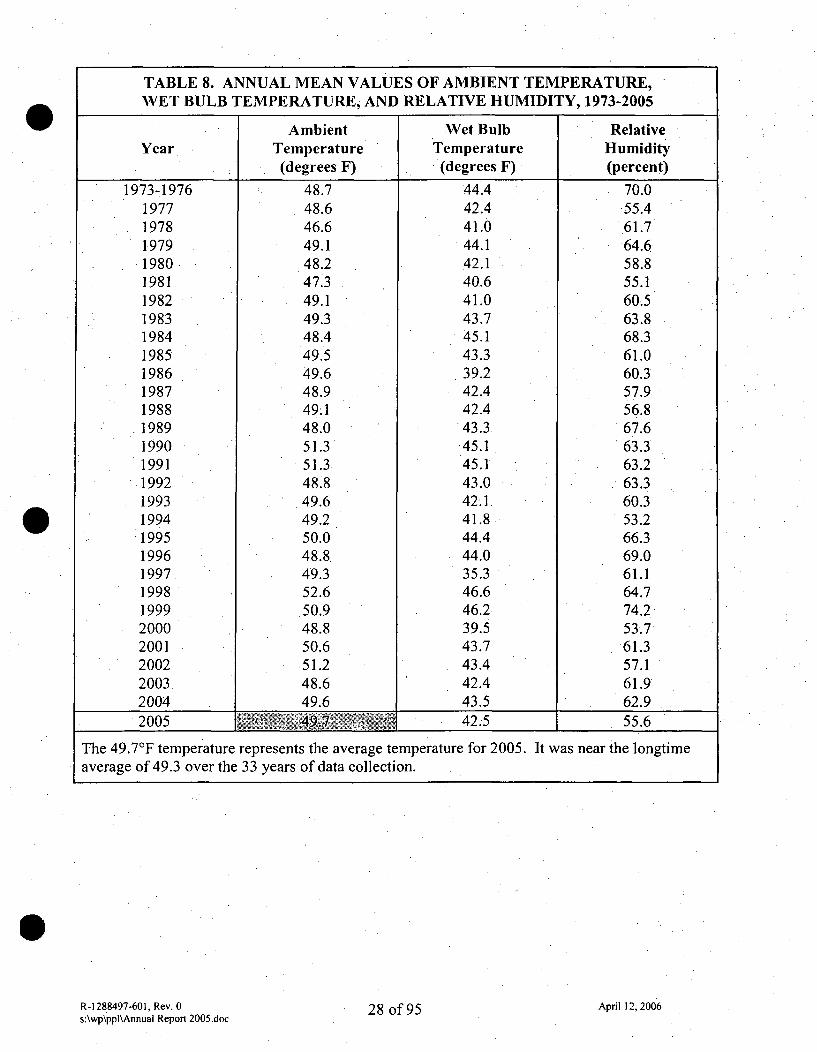
TABLE 8. ANNUAL MEAN VALUES OF AMBIENT TEMPERATURE,WET BULB TEMPERATURE, AND RELATIVE HUMIDITY, 1973-2005
Ambient Wet Bulb RelativeYear Temperature Temperature Humidity
_ (degrees F) (degrees F) (percent)
1973-1976197719781979198019811982198319841985198619871988198919901991199219931994
.1995
199619971998199920002001200220032004
48.748.646.649.148.247.349.149.348.449.549.648.949.148.051.351.3.48.849.649.250.048.849.352.650.948.850.651.248.649.6
44.442.441.044.142.140.641.043.745.143.339.242.442.443.345.145.143.042.1.41.844.444.035.346.646.239.543.743.442.443.5
70.055.461.764.6
58.855.160.563.868.361.060.3
57.956.867.663.363.263.360.3
53.266.369.061.164.774.253.761.357.161.962.9
2005 4 9.7 , 42.5 55.6
The 49.7°F temperature represents the average temperature for 2005. It was near the longtimeaverage of 49.3 over the 33 years of data collection.
R-1288497-601, Rev. 0s:\wp\ppl\Annual Report 2005.doc
28 of 95 April 12, 2006
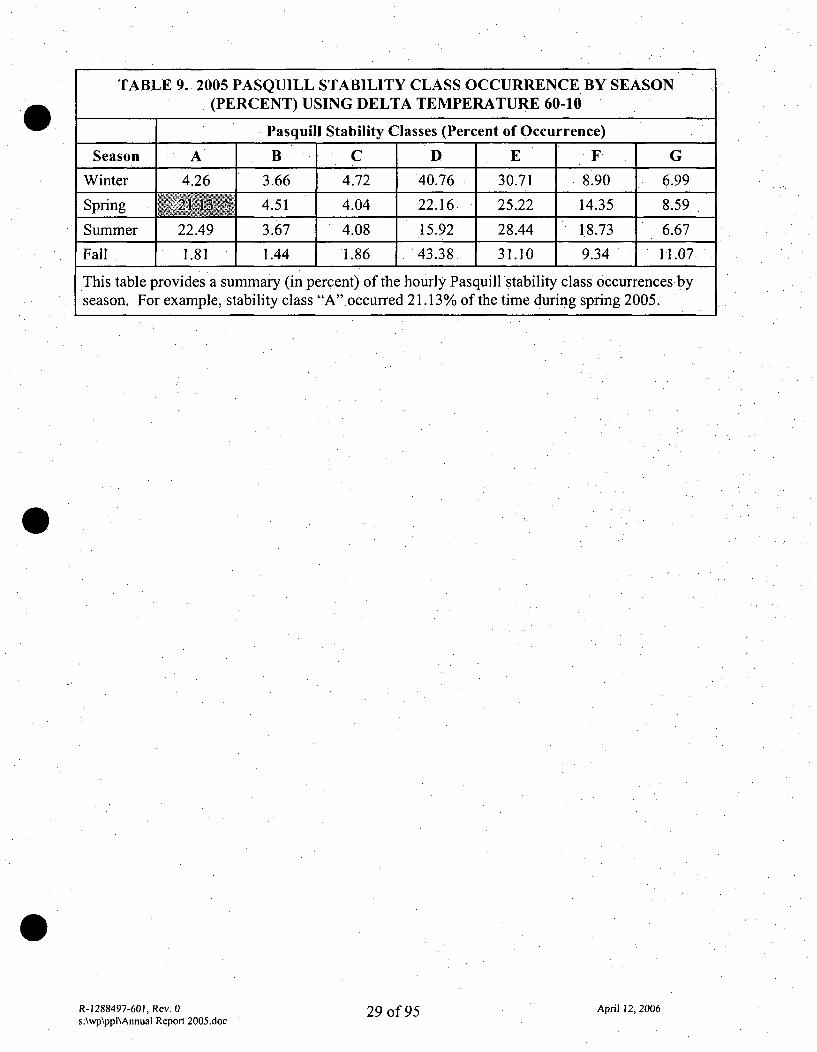
TABLE 9. 2005 PASQUILL STABILITY CLASS OCCURRENCE BY SEASON(PERCENT) USING DELTA TEMPERATURE 60-10
Pasquill Stability Classes (Percent of Occurrence)
Season A B C D E F G
Winter 4.26 3.66 4.72 40.76 30.71 8.90 6.99
Spring 21.13 4.51 4.04 22.16 25.22 14.35 8.59
Summer 22.49 3.67 4.08 15.92 28.44 18.73 6.67
Fall 1.81 1.44 1.86 43.38 31.10 9.34 11.07
This table provides a summary (in percent) of the hourly Pasquill stability class occurrences byseason. For example, stability class "A".occurred 21.13% of the time during spring 2005.
R-1288497-601, Rev. 0s:\wp\ppl\Annual Report 2005.doc
29 of 95 April 12, 2006
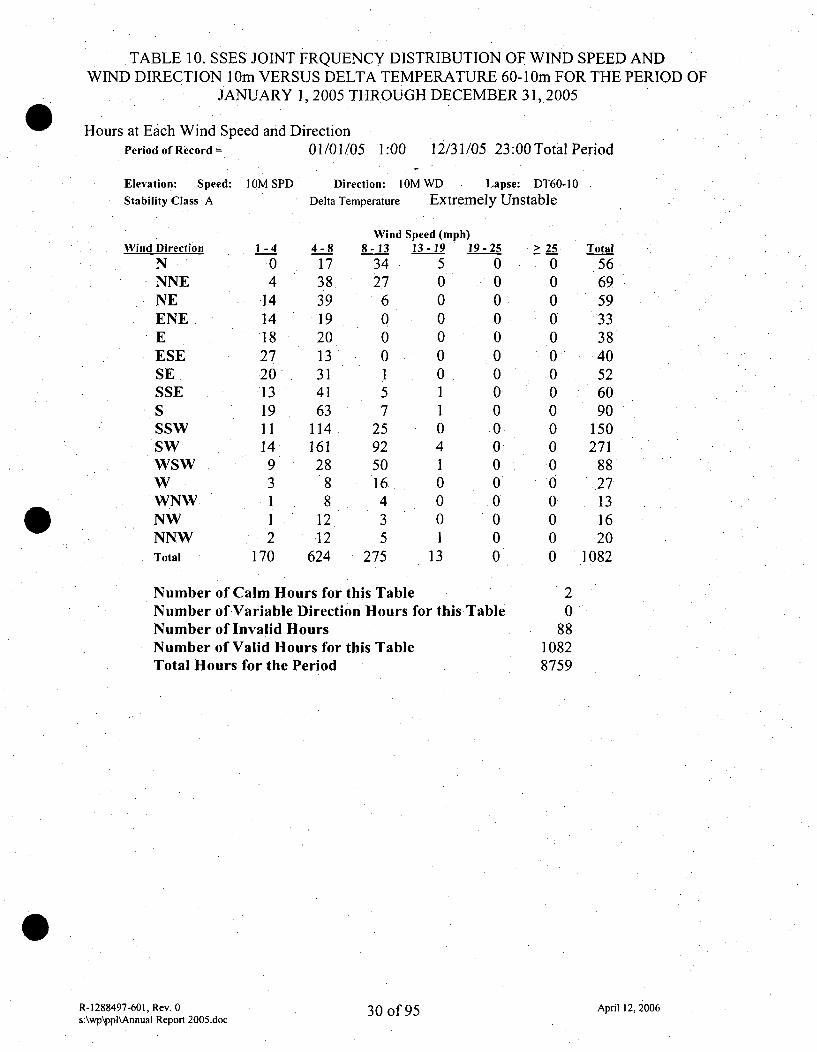
• TABLE 10. SSES JOINT FRQUENCY DISTRIBUTION OF WIND SPEED ANDWIND DIRECTION IOim VERSUS DELTA TEMPERATURE 60-1Oin FOR THE PERIOD OF
JANUARY 1, 2005 THROUGH DECEMBER 31, 2005
Hours at Each Wind Speed and DirectionPeriod of Record= 01/01/05 1:00 12/31/05 23:00 Total Period
Elevation: Speed:
Stability Class A
Wind Direction
NNNENEENE.EESESESSESSSWSWWSWWWNWNWNNWTotal
IOM SPD
1-404
141418
27•20'.1319
1114931I2
170
Direction: 10M WD Lapse: DT60-10Delta Temperature Extremely Unstable
4-817
.38.3919
2013314163
1141612888
1212
624
8
2
Wind Speed (mph)-13 13-19 1
34 527 0
6 00 00 00 01 05 17 1
25. 092 450 116 04 03 05 1
75 13
9 - 25
000000000
000000
00
> 2500000000000000000
Total
566959333840
526090
150271
8827131620
1082
Number of Calm Hours for this TableNumber of Variable Direction Hours for this TableNumber of Invalid HoursNumber of Valid Hours for this TableTotal Hours for the Period
R-1288497-601. Rev. 0s:\wp\ppl\Annual Report 2005.doc
20
8810828759
April 12, 2006
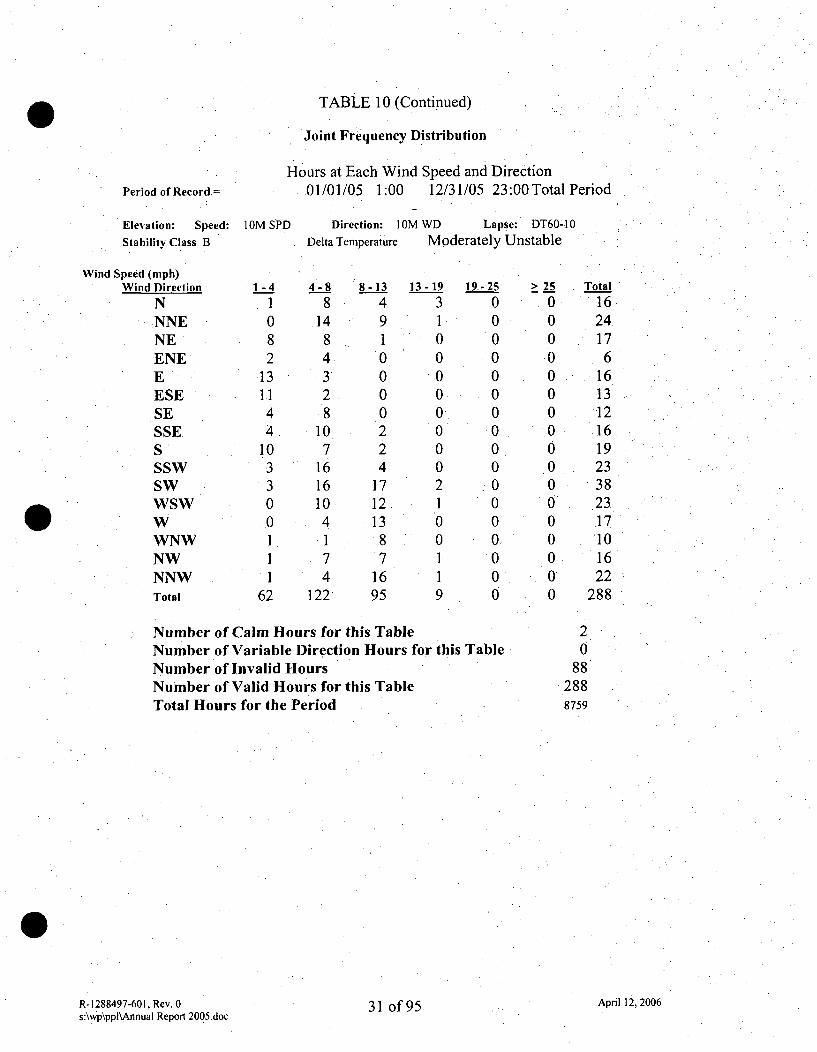
TABLE 10 (Continued)
Joint Frequency Distribution
Hours at Each Wind Speed and DirectionPeriod of Record. 01/01/05 1:00 12/31/05,23:00Total Period
Elevation: Speed: IOM SPD *Direction: IOM WD Lapse: DT60-10
Stability Class B Delta Temperature Moderately Unstable
Wind Speed (mph)Wind Direction 1 -4 4-8 8-13 13 -19. 19- 25 > 25 Total
N 1 8 4 3 0 0 16NNE 0 14 9 1 0 0 24NE 8 8 1 0 0 0 17ENE 2 4 0 0 0 0 6E 13 3 0 0 0 0 16ESE 11 2 0 0 . 0 0 13SE 4 8 0 0 0 0 12SSE 4. 10 2 0 0 0 16S 10 7 2 0 0 0 19SSW 3 16 4 0 0 0 23SW 3 16 17 2 0 0 38WSW 0 10 12 1 0 0 23W 0 4 13 0 0 0 17WNW 1 1 8 0 0 0 10NW 1 7 7 1 0 0 16NNW 1 4 16 1 0 0 22Total 62 122 95 9 0 0 288
Number of Calm Hours for this Table 2Number of Variable Direction Hours for this Table • 0Number of Invalid Hours 88Number of Valid Hours for this Table 288Total Hours for the Period 8759
R-1288497-601. Rev. 0t1 0fOS April 12, 2006s:\wp\ppl\Annual Report 2005.doc
.. /at VI J.d

TABLE 10 (Continued)
Joint Frequency Distribution
Hours at Each Wind Speed and Direction01/01/05 1:00 12/31/05 23:00 Total PeriodPeriod of Record =
Elevation: Speed:
Stability Class C
Wind Direction
NNNENEENEEESESESSESSSWSWWSWWWNWNWNNWTotal
IOM SPD
1-41
453
1313445.6301001
63
Direction: IOM WD Lapse: DT60-10Delta Temperature Slightly Unstable
4-8
9106553527
1432105
427
126
8
1
Wind Speed (mph)-13 13-19 1
17 12 00 00 01 00 03 01 02 04 0
18 222 315 04 0
13 318 120 10
9 - 25
00000000000000000
> 25
00000000000000000
Total
2816118
1916127
142455
35218
1827
319
Number of Calm Hours for this TableNumber of Variable Direction Hours for this TableNumber of Invalid HoursNumber of Valid Hours for this TableTotal Hours for the Period
20
88319
8759
R-1288497-601, Rev. 0s:\wp\ppl\Annual Report 2005.doc
32 of 95 April 12, 2006

TABLE 10 (Continued)
Joint Frequency Distribution
Hours at Each Wind Speed and Direction01/01/05 1:00 12/31/05 23:00Total PeriodPeriod of Record =
Elevation: Speed:
Stability Class D
I OM SPD Direction: 1OM WD Lapse:- DT60-10Delta Temperature Neutral
Wind Direction
NNNENEENEEESESE
.SSESSSWSWWSWWWNWNWNNWTotal
1-4
3562.53586940462950.433116588
14567
4-8
14211479241622616181
144123
66565337,74
1153
8
7
117
Wind Speed (mph)-13 .13-19 1
84, 530 0
1 02 0
.2 01 0
18 317 811 422 121 1795 .29
68 1274 743 2504 1493 125
9 - 25
00000000000
300:044
> 25
00
.0
00
00000000000.0
Total
266206133848763
128
115146210292209141142213207
2642
Number of Calm Hours for this TableNumber of Variable Direction Hours for this TableNumber of Invalid HoursNumber of Valid Hours for this TableTotal Hours for the Period
2,0
8826428759
R-1288497-601. Rev. 0s:\wp\ppl\Annual Repon 2005.doc
33 of 95 April 12, 2006
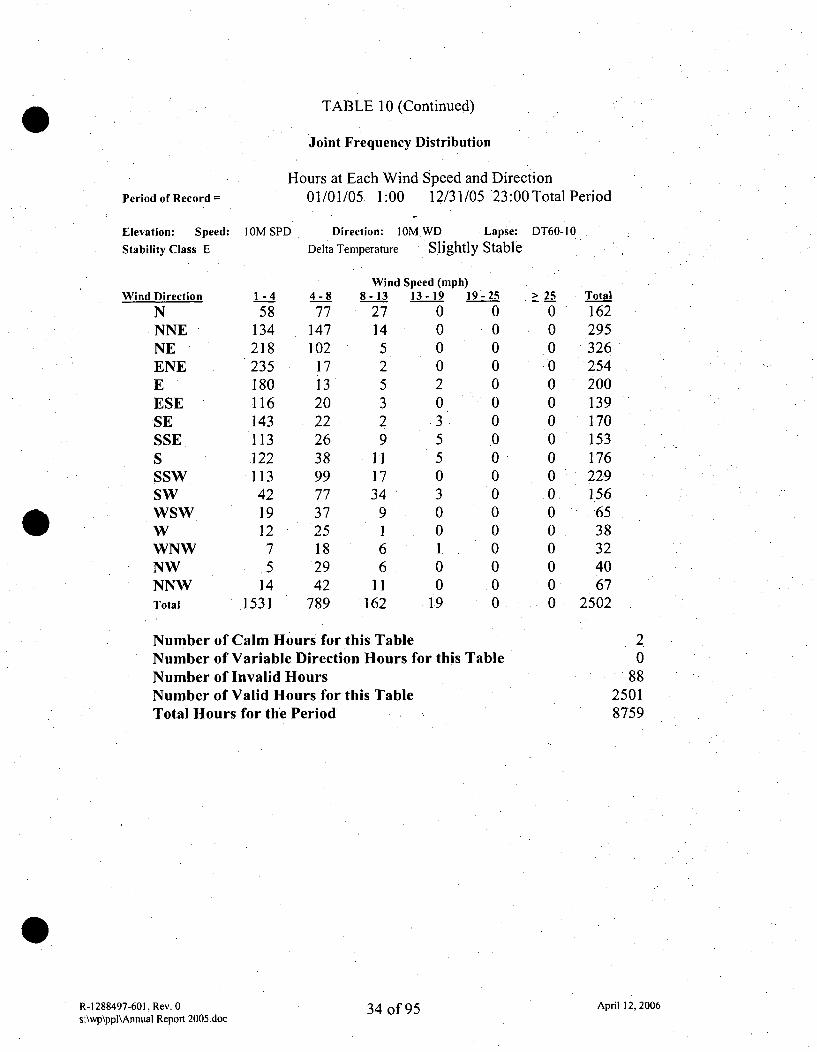
TABLE 10 (Continued)
Joint Frequency Distribution
Period of Record
Elevation: Speed: IOM SP
Stability Class E
Hours at Each Wind Speed and Direction01/01/05 1:00 12/31/05 23:00Total Period
D Direction: 10M.WD Lapse: DT60-10
Delta Temperature Slightly Stable
Wind Direction
NNNENEENEEESESESSESSSWSWWSWWWNWNWNNWTotal
1-4
58134218235180116143113122113
4219127
141531
4-877
14710217132022263899773725182942
789
8
1
Wind Speed (mph)-13 13-19 127 014 05 02 05 23 0..2 .39 5
11 517 034 3
9 01 06 16 0
11 062 19
9 - 2500
0000
00000000000
> 25
000000000000
0000
Total1622953262542n0139170153176229156
6538324067
2502
Number of Calm Hours for this TableNumber of Variable Direction Hours for this TableNumber of Invalid HoursNumber of Valid Hours for this TableTotal Hours for the Period
20
8825018759
April 12, 2006R-1288497-601, Rev. 0s:\wp\ppl\Annual Report 2005.doc
34 of 95

TABLE 10 (Continued)
Joint Frequency Distribution
Hours at Each Wind Speed and Direction01/01/05. 1:00 12/31/05 23:00Total PeriodPeriod of Record =
Elevation: Speed:
Stability Class F
Wind Direction
NNNENEENEEESESESSESSSWSWWSWWWNWNWNNWTotal
IOM SPD
1-4
840
1344711.89.6850254423186.3.1
32
1085
Direction: IOM WD . Lapse: . DT60-10
Dehta Temperature Moderately Stable
4-8
2.339000.10
5320ýO
231
8Wind Speed (mph)
-13 13-19 1
0 00 00 00 00 00 00 0
0 00 00 00 00. 00 00 00 00 00 0
99-250000
000
.0
000
0
00000
> 25
00000000000000000
Total1043
137480189685026442821
8314
41116
Number of Calm Hours for this TableNumber of Variable Direction Hours for this TableNumber of Invalid HoursNumber of Valid Hours for this TableTotal Hours for the Period
20
8811168759
R-1288497-601, Rev. 0s:\wp\ppl\Annual Report 2005.doc
35 of 95 April 12, 2006
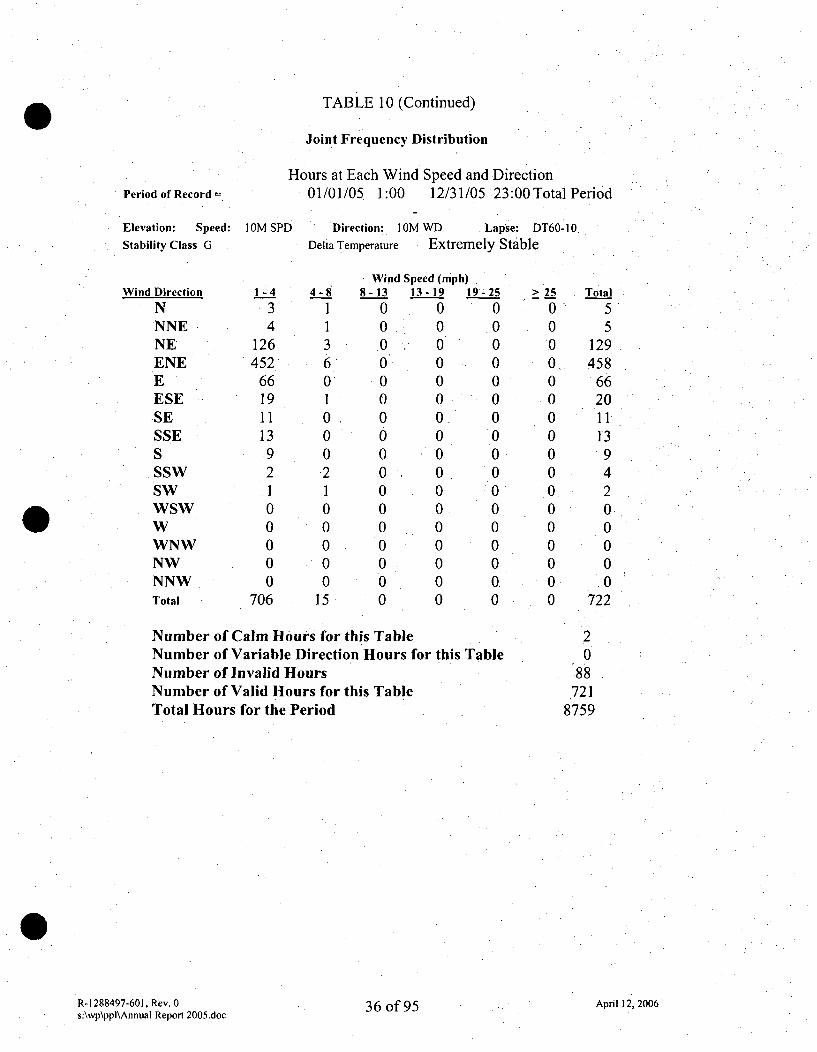
TABLE 10 (Continued)
Joint Frequency Distribution
Hours at Each Wind Speed and DirectionPeriod of Record =
Elevation: Speed:
Stability Class G
Wind Direction
NNNENEENEEESESESSESSSWSWWSWWWNWNWNNWTotal
01/01/05 1:00 12/31/05 23:00 Total Period
IOM SPD Direction: IOM WD Lapse: DT60-10O
Delia Temperature Extremely Stable
1-434
126452
6619111392000000
706
4-8
3601000.210
0000
15
8Wind Speed (mph)
-13 13-19 10 00 00 00 00 00 00 00 00 00 00 00 00 00 00 00 00 0
9-25
00000000000
000000
> 25
000
00
000000000000
Total5
5129458
6620111394200000722
Number of Calm Hours for this TableNumber of Variable Direction Hours for this TableNumber of Invalid HoursNumber of Valid Hours for this TableTotal Hours for the Period
20
88721
8759
R-1288497-601, Rev. 0s:\wp\ppl\Annual Report 2005.doc
36 of 95 April 12, 2006
• TABLE 10 (Continued)
Joint Frequency Distribution
Hours at Each Wind Speed and DirectionPeriod of Record= 01/01/05 1:00 12/31/05 23:00 Total Period
Elevation: Speed: I OM SPD Direction: 1OM WD Lapse: DT60-10Summary of All Stability Classes Delta Temperature
Wind Speed (mph)
Wind Direction 1-4 4-8 8-13 13-19 19-25 > 25 Total
N 106 256 166 14 0 0. 543NNE 248 327 82 1 0 0: 658NE 558 240 13 0. 0 0 812ENE 1235 84 4 0 0 0 1323E 548 57 8 2 0 0 615
ýESE 294 61 4 0 0 0 .359SE 278 127 24 6 0 0 435SSE 201 141 34 14 0 0 390S 259 196 33 10 0 0 498SSW 201 394 72 1 0 0 668SW 112 413 282 28 0 0 835WSW. 50 153 188 34 3 0 428W 24 98 113 12 0 0 247WNW 18 84 96 8 0 0 206NW 18 88 172 29 0 0 307NNW 34 141 154 17 1 0 347Total 4184 2860 1445 176 4 0 8671
Number of Calm Hours for this Table 2Number of Variable Direction Hours for this Table 0Number of Invalid Hours 88.1Number of Valid Hours for this Table 8669Total Hours for the Period 8759
R-1288497-601, Rev. 0 37 of 95 April 12, 2006s:\wp\ppl\Annual Report 2005.do3 o

TABLE 11. SSES JOINT FREQUENCY DISTRIBUTION OF WIND SPEEDAND DIRECTION 60M VERSUS DELTA TEMPERATURE 60-10M
FOR THE PERIOD OF JANUARY 1,2005 THROUGH DECEMBER 31, 2005
Joint Frequency Distribution
Hours at Each Wind Speed and Direction01/01/05 1:00 12/31/05 23:00Total PeriodPeriod of Record =
Elevation: Speed:
Stability Class A
Wind Direction
NNNENEENEEESESESSESSSWSWWSWWWNWNWNNWTotal
60M SPD
1-41
41296
129
.347720100,
77
*Direction: 60M WD Lapse: DT60-0
Delta Temperature Extremely Unstable
4-8
3183317.9.9
2019
204342100064
253
8
2
Wind Speed (mph)-13 13-19 1
16 641 1717 214 22, 00 0
16 011 214 333 1365 3036 2512 2
7 05 .04 0
93 102
9-25:
20000000200000005
> 25.0000000
000
-000000
Total
2880644217
21.45.354396
145
7314
8118
730
Number of Calm Hours for this TableNumber of Variable Direction Hours for this TableNumber of Invalid HoursNumber of Valid Hours for this TableTotal Hours for the Period
R-1288497-601, Rev. 0 38 of 95s:\wp\ppl\Annual Report 2005.doc
00
1528730
8759
April 12, 2006

Table 11 (continued)
Joint Frequency Distribution
Period of Record
Elevation: Speed:
Stability Class B.
Wind Direction
NNNENEENEEESESESSESSSWSWWSWWWNWNWNNWTotal
Hours at Each Wind Speed and Direction01/01/05 1:00 12/31/05 23:00Total Period
60M SPD Direction: 60M WD Lapse: DT60-10.Delta Temperature Moderately Unstable
1-4013347233400003
32
4-845
15532i61
6122413
71
8Wind Speed (mph)
-13 13-19 13 59 74 11 12 01 05 03 22 07 18 38 126 79 09 17 5
84 45
9-25
100000
00
0
1
00006
> 2500000
00000000
000
Total13.
2223.109
.108
14.71925
2317101414
238v .
Number of Calm Hours for this Table.Number of Variable Direction Hours for this TableNumber of Invalid HoursNumber of Valid Hours for this TableTotal Hours for the Period.
R-1288497-601, Rev. 0 39 of 95s:\wp\ppl\Annual Report 2005.doc
00
1528238
8759
April 12, 2006
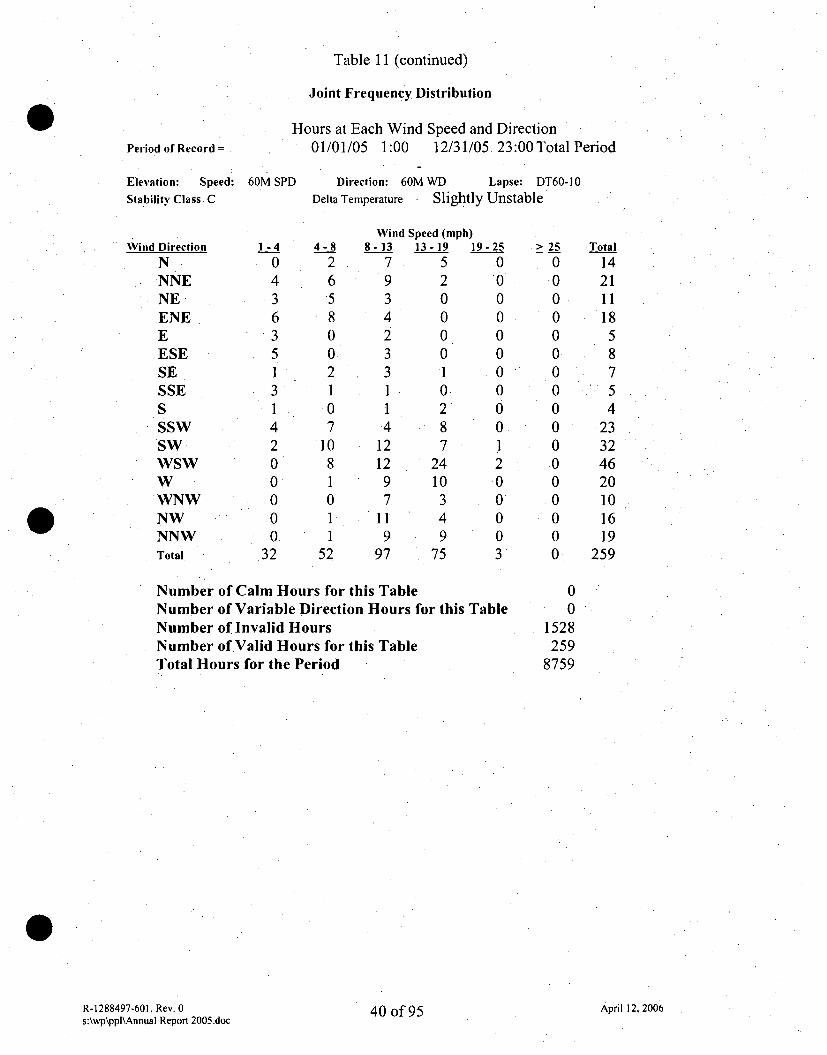
Table 1.1 (continued)
Joint Frequency Distribution
Period of Record =
Elevation: Speed:
Stability Class. C
Wind Direction
NNNENEENEEESESESSESSSWSW.
WSWWWNWNWNNWTotal
Hours at Each Wind Speed and Direction01/01/05 1:00 12/31/05 23:00Total Period
60M SPD Direction: 60M WD Lapse: DT60-10
Delta Temperature Slightly Unstable
Wind Speed (mph)1-4
0436351
31
4200
.000.
32
4-8265
8002107
1081011
52
8-1379342331
.4
121297
119
97
13-19520000.1
0.287
2410349
75
19-250
0
00000000
200003
> 250000
0000000000000
Total14211118587
' 5
4.231324620101619
259
Number of Calm Hours for this TableNumber of Variable Direction Hours for this TableNumber of Invalid HoursNumber of Valid Hours for this TableTotal Hours for the Period
00
1528259
8759
R-1288497-601, Rev. 0s:\wp\ppl\Annual Report 2005.doc
40 of 95 April 12, 2006
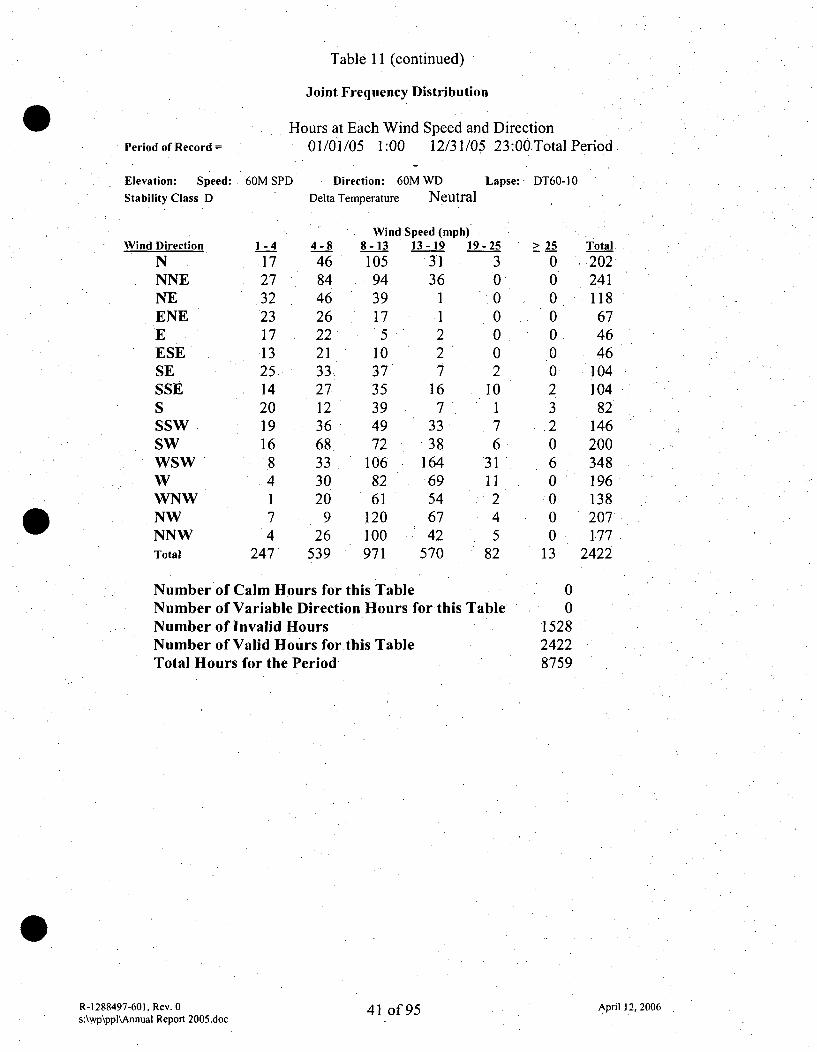
Table 11 (continued)
Joint Frequency Distribution
Hours at Each Wind Speed and Direction01/01/05 1:00 12/31/05 23:00 Total PeriodPeriod of Record =
Elevation: Speed:Stability Class D
60M SPD Direction: 60M WD Lapse: DT60-10Delta Temperature Neutral
Wind Direction
NNNENEENEEESESESSESSSWSWWSWWWNWNWNNWTotal
1-4.1727322317.13
251420191684174
247
4-8
46844626222133.27123668333020
926
539
8.
9
Wind Speed (mph)-13 13-19 1
05 3194 3639 117 1
5 210 237' 735 1639 7.49 3372 3806 16482 6961 5420 6700 4271 570
9 - 25.300000
210176
31II
245
82
> 25
00000002320600
00
13
Total.202•
241118
674646
104104 .
82146200348196138207177
2422
Number of Calm Hours for this TableNumber of Variable Direction Hours for this TableNumber of Invalid HoursNumber of Valid Hours for.this TableTotal Hours for the Period
00
152824228759
R-1288497-601. Rev. 0s:\wp\ppl\Annual Report 2005.doc
41 of 95 April 12, 2006

Table 11 (continued)
Joint Frequency Distribution
Hoursat Each Wind Speed and Direction01/01/05 1:00 12/31/05 23:00Total PeriodPeriod of Record =
Elevation: Speed:
Stability Class E
Wind Direction
NNNENEENEEESESESSESSSWSWWSW.W
WNWNWNNWTotal
60M SPD
1 -4
3458703832324741374035145319
496
Direction: 60M WD Lapse: DT60-10Delta Temperature Slightly Stable.
4-8
73164894143374036355163563020149
801
8
5
Wind Speed (mph)-13 13-19 1
36 995 3268 1312 012 417 2.15 323 626 1051 2262 1371 5629 013 534 330 394 181
9-250100I
27.5541
000
27.
> 2500000102330000009
Total
152350240
919290
10711511617217719864415251
2108
Number of Calm Hours for this TableNumber of Variable Direction Hours for this TableNumber of Invalid Hours.Number of Valid Hours for this TableTotal Hours for the Period
00
152821088759
R-1288497-601, Rev.0s:\wp\ppl\Annual Report 2005.doc
42 of 95 April 12, 2006
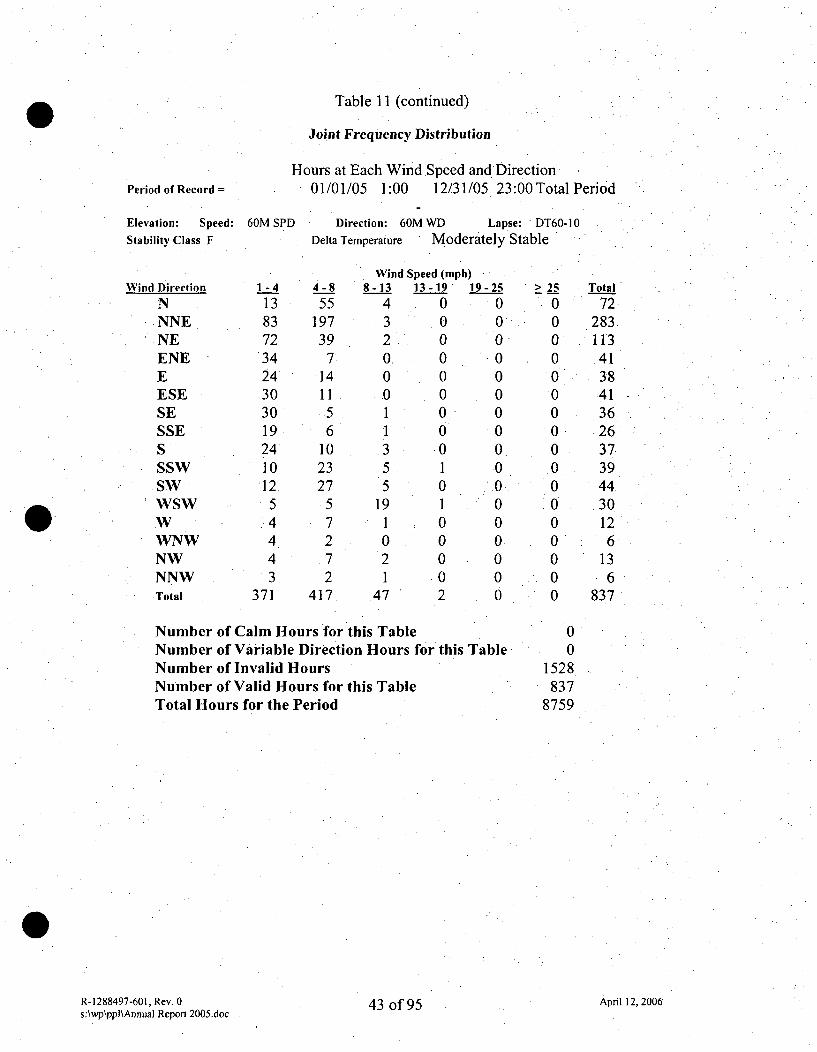
Table 11 (continued)
Joint Frequency Distribution
Period of Record =
Elevation: Speed:
Stability Class F
Wind Direction
NNNE
S•NE
ENEEESESESSESSSWSWWSWWWNWNWNNWTotal
Hours at Each Wind Speed and Direction01/01/05 1:00 12/31/05 23:00 Total Period
60M SPD Direction: 60M WD Lapse: DT60-10
Delta Temperature Moderately Stable
1-41383723424303019241012.
5.4443
371
4-8
55197397
.14
115
61023275
72.7
2417.
8Wind Speed (mph)
-13 13-19 1
4 03 02 00 00 00 0S1 01 0
3 05 1
5 019 1
1 00 02 01 0
47 2
9-25
000
0
0000000
0
0000
> 250000
0
000000000000
Total
72283113.41
384136
.26373944
.30126
136
837
Number of Calm Hours for this TableNumber of Variable Direction Hours for this TableNumber of Invalid HoursNumber of Valid Hours for this TableTotal Hours for the Period
R-1288497-601. Rev. 0s:\wp\ppl\Annual Reporl 2005.doc
00
1528837
8759
April 12, 2006
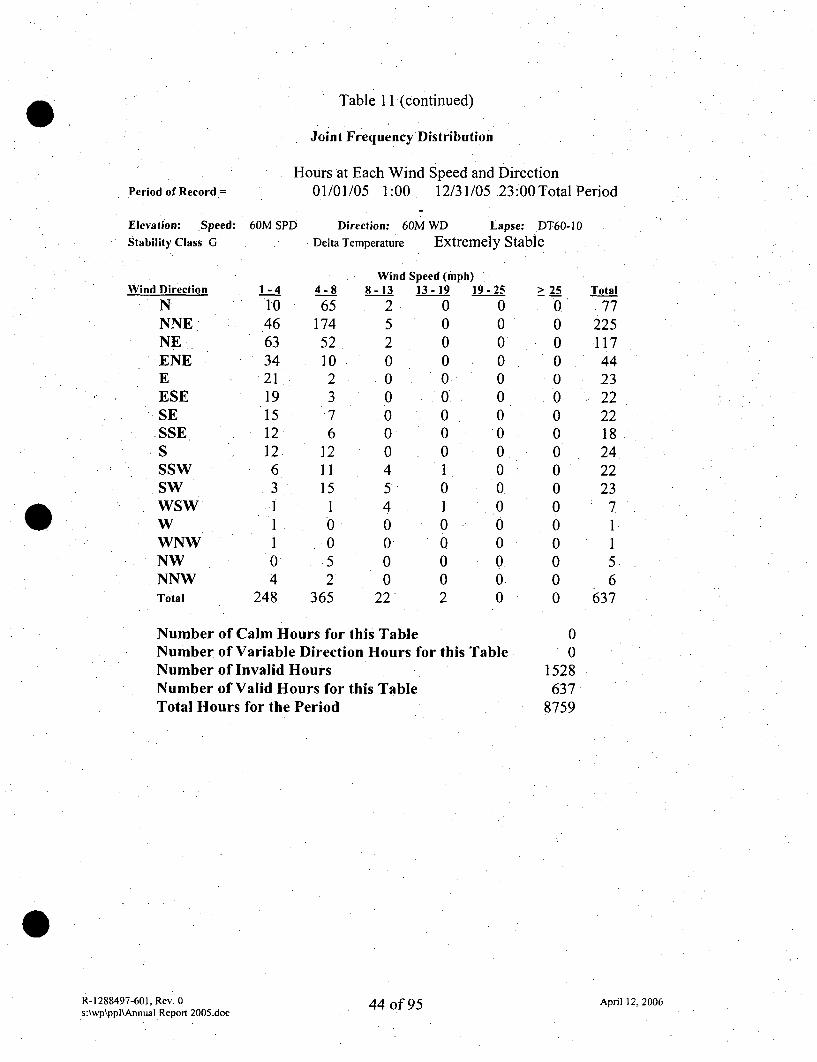
Table 11 (continued)
Joint Frequency Distribution
Hours at Each Wind Speed and Direction01/01/05 1:00 12/31/05 23:00Total PeriodPeriod of Record.=
Elevation: Speed:
Stability Class G
Wind Direction
NNNENEENE
EESESESSESSSWSWWSWWWNWNWNNWTotal
60M SPD
1-4
1046633421
19151212.63l
04
248
Direction: 60M WD Lapse: DT60-1 0Delta Temperature Extremely Stable
4-8
6517452102376
12111510
0.52
365
8Wind Speed (mph)
-13 13-19 12 05 02 00 00 00 00 00 00 04 15 04 10 00 00 00 0
22 2
9-25
00000000000000
000
> 25
0
0000
0
00000000000
Total.772251174423,22221824222371156
637
Number of Calm Hours for this TableNumber of Variable Direction Hours for this TableNumber of Invalid HoursNumber of Valid Hours for this TableTotal Hours for the Period
R-1288497-601, Rev. 0 44 of 95s:\wp\ppl\Annual Report 2005.doc
00
1528637
8759
April 12, 2006
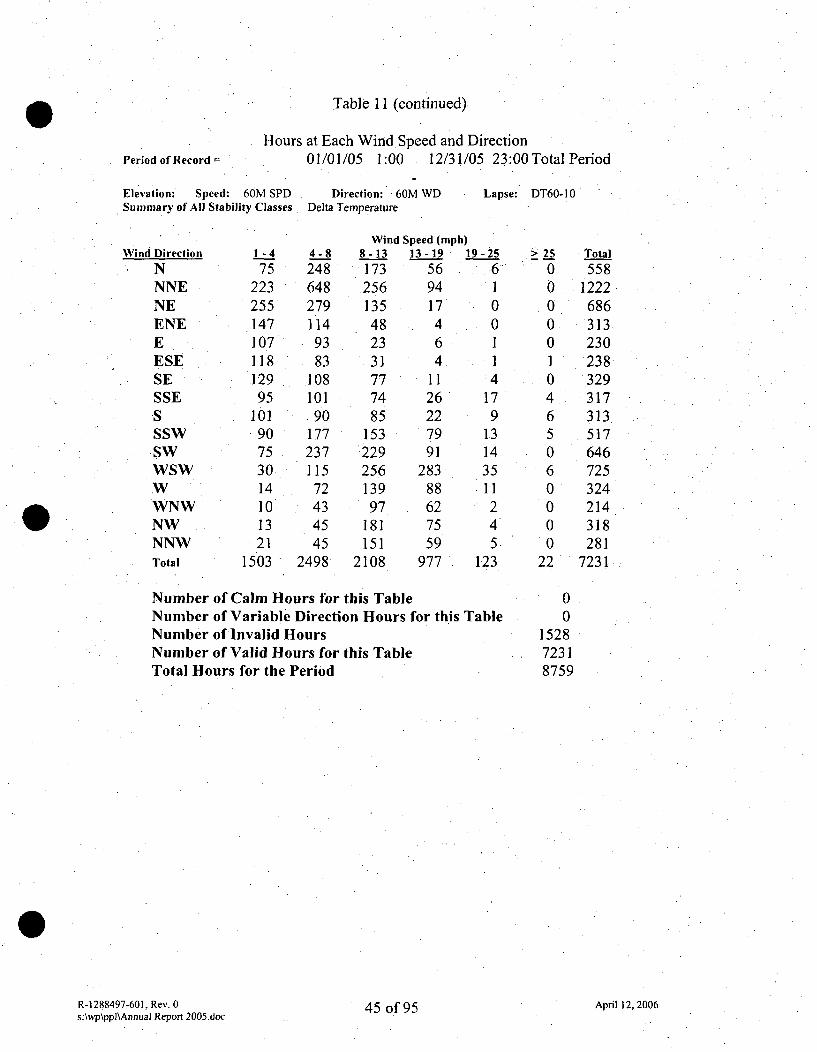
Table 11 (continued),
Hours at Each Wind Speed and DirectionPeriod of Record =
Elevation: Speed: 60M SPDSummary of All Stability Classes
01/01/05 1:00
Direction: 60M,Delta Temperature
12/31/05 23:00 Total Period
VD Lapse: DT60-10
Wind Direction
NNNENEENEEESESESSESSSWSWWSWWWNWNWNNWTotal
1-4
75223255147107118129
95101
90753014101321
1503
4-8248648279114
9383
108101
9017723711572434545
2498
8
2
1
2221
121
Wind Speed (mph)-13 13-19 173 56
256 9435 1748 423 631 477 1174 2685 2253 7929 9156 28339 8897 6281 7551 5908 977
9-25600
.01
4179
1.3143511245
123
> 25
000001046506
0000
22
Total558
1222686313230238329317313.517646725324214318281
7231
Number of Calm Hours for this TableNumber of Variable Direction Hours for this TableNumber of Invalid HoursNumber of Valid Hours for this TableTotal Hours for the Period
00
152872318759
R-1288497-601., Rev. 0s:\wp\pp]\Annual Report 2005.doc
45 of 95 April 12, 2006

TABLE 12. ANNUAL PASQUILL STABILITY CLASS OCCURRENCESPRIMARY TOWER 1973-2005
(in percent)
YEAR A B C D E FJG1973-1976. 16.23 7.64 4.24 30.72 26.17 10.51 4.49
1977 6.62 3.29 1.45 34.03 38.52 11.49' 4.591978 1.38 1.82 0.79 34.72 44.72 12.33 4.231979 1.36 1.72 1.44 38.18 .41.27 11.46 4.561980 5.68 4.02 2.41 41.84 27.37 12.34 6.341981 11.29 3.45 2.82 32.80 29.29 11.38 8.971982 15.68 3.48 2.83 23.41 29.99 14.00 11.591983 4.35 3.30 5.02 39.32 28.69 12.02 7.301984 3.57 2.72 4.23 34.36• 33.51 13.50 8.101985 5.36 3.50 3.98 35.44 33.36. 12.05 6.301986 5.62 3.13 3.67 32.92 35.78 11.26 7.621987 9.33 2.53 3.61 34.09 28.72 13.43 8.291988 13.83 3.60 4.19 31.10 27.26 12.74 7.281989 4.57 3.00 4.51 40.90 30.01 10.72 6.281990 3.37 2.53 3.59 39.34 29.79 13.93 7.441991 5.25 3.75 4.55 39.38 25.28 14.24 7.551992 3.06 2.91 4.80 47.76 26.26 11.09 4.111993 3.78 3.56 4.11 39.33 26.68 12.19 7.341994 6.24 3.18 4.43 34.25 29.55 13.26 9.081995 5.34 3.48 4.62 41.06 27.08 11.29 7.141996 2.17 2.22 3.94 44.42 .30.79 11.13 5.331997 4.98 3.66 5.49 38.80 28.05 12.87 6.161998 2.88 2.94 4.08 35.15 30.97 15.58 8.39.1999 5.63 3.35 4.05 38.27 27.24 11.94 9.522000 2.65 3.08 4.63 44.92 25.47 11.86 7.392001 4.55 3.82 5.22 37.39 27.47 13.49 8.062002 3.21 3.71 4.93 40.47 26.43 13.28 7.972003 4.10 1.70 2.89 43.99 30.15 11.08 6.092004 3.51 3.30 5.24 39.42 32.38 11.56 4.892005 12.48 3.32 3.68 30.47 28.85 12.87 8.33
Pasquill stability class assignments were based on the temperature difference between the 90-meter and 10-meter levels from 1973 through July 1981. From July 1981 to present, the stabilityclass assignment is based on the temperature difference between the 60-meter and I 0-meter levels.
R-1288497-601. Rev. 0s:\wp\ppl\Annual Report 2005.doc
46 of 95 April 12, 2006
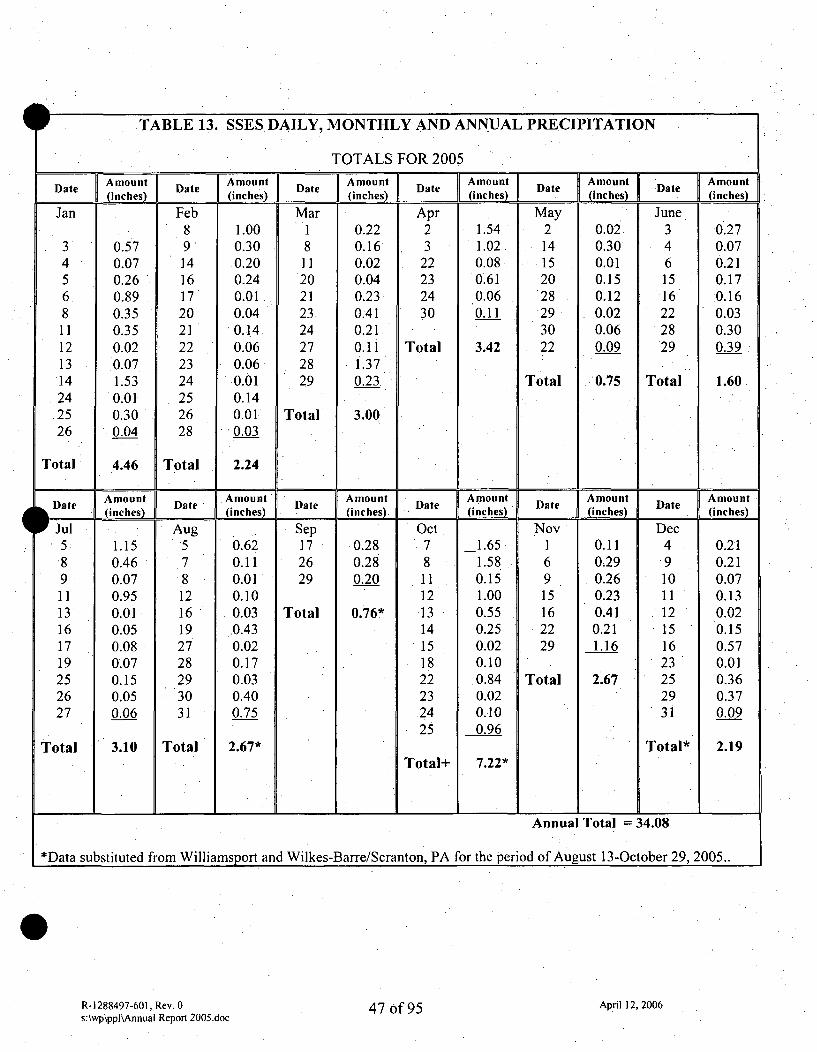
TABLE 13. SSES DAILY, MIONTHLY AND ANNUAL PRECIPITATION
TOTALS FOR 2005
Amount Dt Amount Da1e Amount Dat A mount I Amount AmountDate (inches) Date (inches) Date (inches Date (inches) Date (inches)Date (inches)
Jan Feb Mar Apr May June8 1.00 1 0.22 2 1.54 2 0.02 3 0.27
3 0.57 9' 0.30 8 0.16 3 1.02 14 0.30 4 0.074 0.07 14 0.20 11 0.02 22 0.08 15 0.01 6 0.215 0.26 16 0.24 20 0.04 23 0 61 20 0.15 15 0.176 0.89 17 0.01 21 0.23 24 0.06 28 0.12 16 .0.168 0.35 20 0.04 23. 0.41 30 0.11 29 . 0.02 22 0.03
11 0.35 21 '0.14 24 0.21 30 0.06 28 0.3012 0.02 22 0.06 27 0.1 Total 3.42 22 0.09 29 0.3913 0.07 23 0.06 28 1.3714 1.53 24 0.01 29 0.23 Total 0.75 Total 1.60
.24 0.01 25 0.14
25 0.30 26 0.01 Total 3.0026 0.04 28 0.03
Total 4.46 Total 2.24
i Amount AmoAmount Amount Amount Amount AmountAd (inches) Date (inche(inche (cs (inches) =Date (inches) Date (inches)J Jul Aug Sep Oct Nov Dec
5: 1.15 5 0.62 17 0.28 7 1.65 1 0.11 4 0.218 0.46 7 0.11 26 0.28 8 1.58 6 0.29 9 0.219 0.07 8 0.01 29 0.20 11 0.15 9 0.26 10 0.0711 0.95 12 0.10 12 1.00 15 0.23 11 0.1313 0.01 16 0.03 Total 0.76* 13 0.55 16 0.41 12 0.0216 0.05 19 .0.43 14 0.25 22 0.21 15 0.1517 0.08 27 0.02 15 0.02 29 1.16 16 0.5719 0.07 28 0.17 18 0.10 23 0.0125 0.15 29 0.03 22 0.84 Total 2.67 25 0.36
26 0.05 30 0.40 23 0.02 29 0.3727 0.06 31 0.75 24 0.10 31 0.09
25 0.96Total 3.10 Total 2.67* Total* 2.19Total+ 7.22*
Annual Total = 34.08
*Data substituted from Williamsport and Wilkes-Barre/Scranton, PA for the period of August 13-October 29, 2005..
R-1288497-601, Rev. 0s:\wp\ppl\Annual Report 2005.doc
47 of 95 April 12, 2006
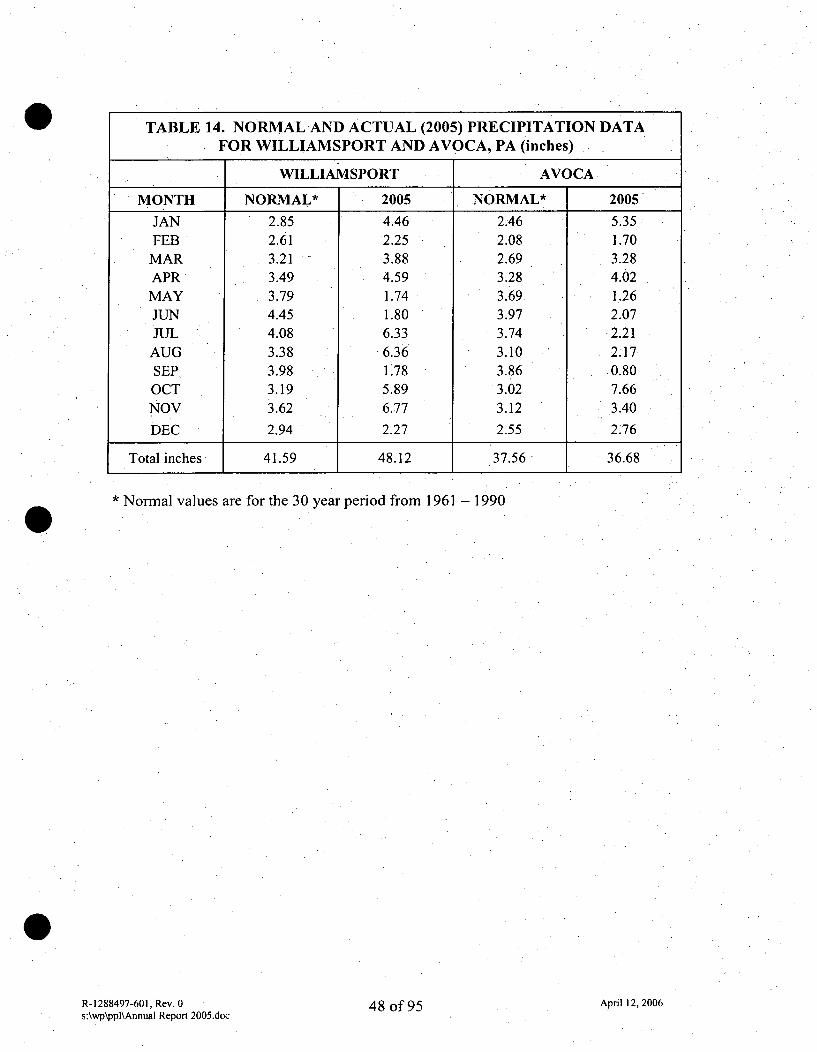
TABLE 14. NORMAL AND ACTUAL (2005) PRECIPITATION DATA
FOR WILLIAMSPORT AND AVOCA, PA (inches)
WILLIAMSPORT AVOCA
MONTH NORMAL* 2005 NORMAL* 2005
JAN 2.85 4.46 2.46 5.35FEB 2.61 2.25 2.08 1.70
MAR 3.21 - 3.88 2.69 3.28APR 3.49 4.59 3.28 4.02MAY 3.79 1.74 3.69 1.26JUN 4.45 1.80 3.97 2.07JUL 4.08. 6.33 3.74 2.21AUG 3.38 6.36 3.10 2.17SEP 3.98 1.78 3.86 0.80OCT 3.19 5.89 3.02 7.66NOV 3.62 6.77 3.12 3.40
DEC 2.94 2.27 2.55 2.76
Total inches 41.59 48.12 37.56 36.68
* Normal values are for the 30 year period from 1961 -
R-1288497-601, Rev. 0 48 of 95s:\wp\ppl\Annual Report 2005.doc
1990
April 12, 2006
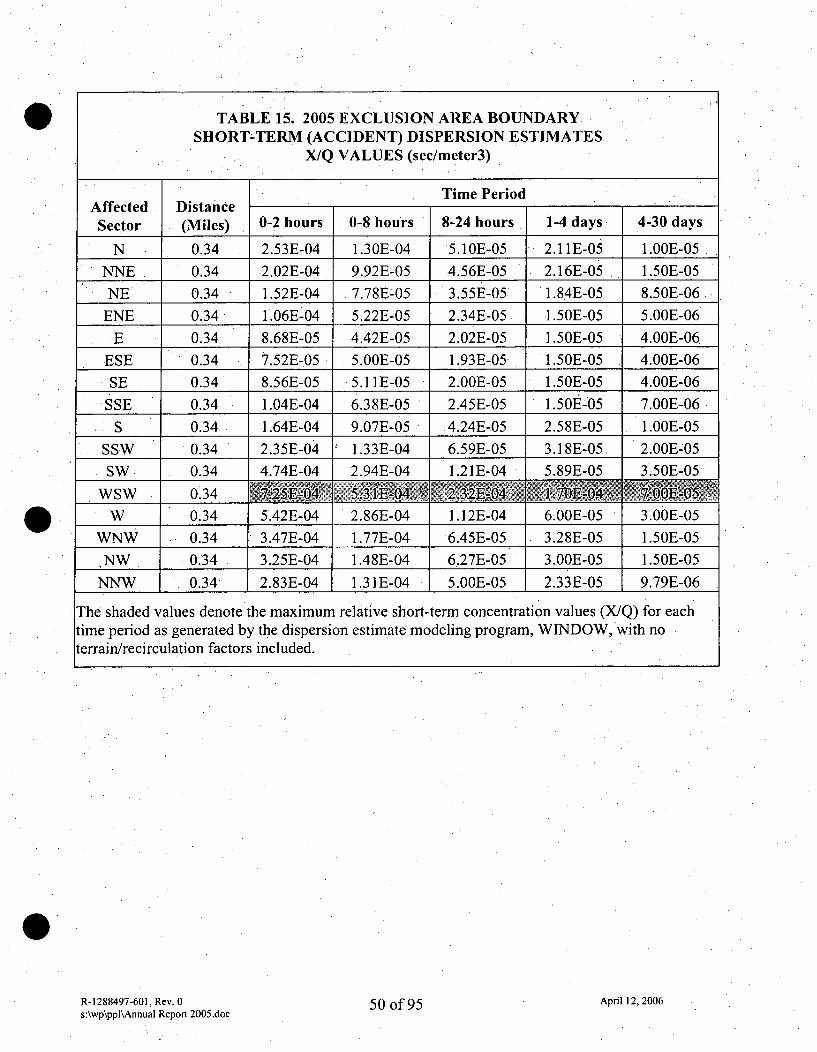
TABLE 15. 2005 EXCLUSION AREA BOUNDARYSHORT-TERM (ACCIDENT) DISPERSION ESTIMATES
X/Q VALUES (sec/meter3)
Time PeriodAffected DistanceSector (Miles) 0-2 hours 0-8 hours 8-24 hours 1-4 days 4-30 day5
N 0.34 2.53E-04 1.30E-04 5.10E-05 2.11E-05 1.00E-05
NNE 0.34 2.02E-04 9.92E-05 4.56E-05 2.16E-05 1.50E-05
NE 0.34 1.52E-04 7.78E-05 3.55E-05 1.84E-05 8.50E-0(
ENE 0.34 1.06E-04 5.22E-05. 2.34E-05 1.50E-05 5.00E-0
E 0.34 8.68E-05 4.42E-05 2.02E-05 1.50E-05 4.00E-0(
ESE 0.34 7.52E-05 5.00E-05 1.93E-05 1.50E-05 4.00E-0(
SE 0.34 8.56E-05 5.11E-05 2.OOE-05 1.50E-05 4.OOE-0(
SSE 0.34 1.04E-04 6.38E-05 2.45E-05 1.50E-05 7.OOE-0(
S 0.34 1.64E-04 9.07E-05 4.24E-05 2.58E-05 1.00E-05
SSW 0.34 2.35E-04 .1.33E-04 6.59E-05 3.18E-05 2.00E-05
SW 0.34 4.74E-04 2.94E-04 1.21E-04 5.89E-05 3.50E-05
WSW 0.34 7.25E-04 5.3I E-0 2.3 2E -0 4 1.70E-04 E
W 0.34 5.42E-04 2.86E-04 1.12E-04 6.00E-05 3.00E-05
WNW 0.34 3.47E-04 1.77E-04 6.45E-05 3.28E-05 1.50E-05
NW 0.34 3.25E-04 1.48E-04 6.27E-05 3.OOE-05 1.50E-05
NNW 0.34 2.83E-04 1.31E-04 5.OOE-05 2.33E-05 9.79E-0(
The shaded values denote the maximum relative short-term concentration values (X/Q) for eachtime period as generated by the dispersion estimate modeling program, WINDOW, with noterrain/recirculation factors included.
s
R-1288497-601, Rev. 0s:\wp\ppl\Annual Report 2005.doc
50 of 95 April 12, 2006
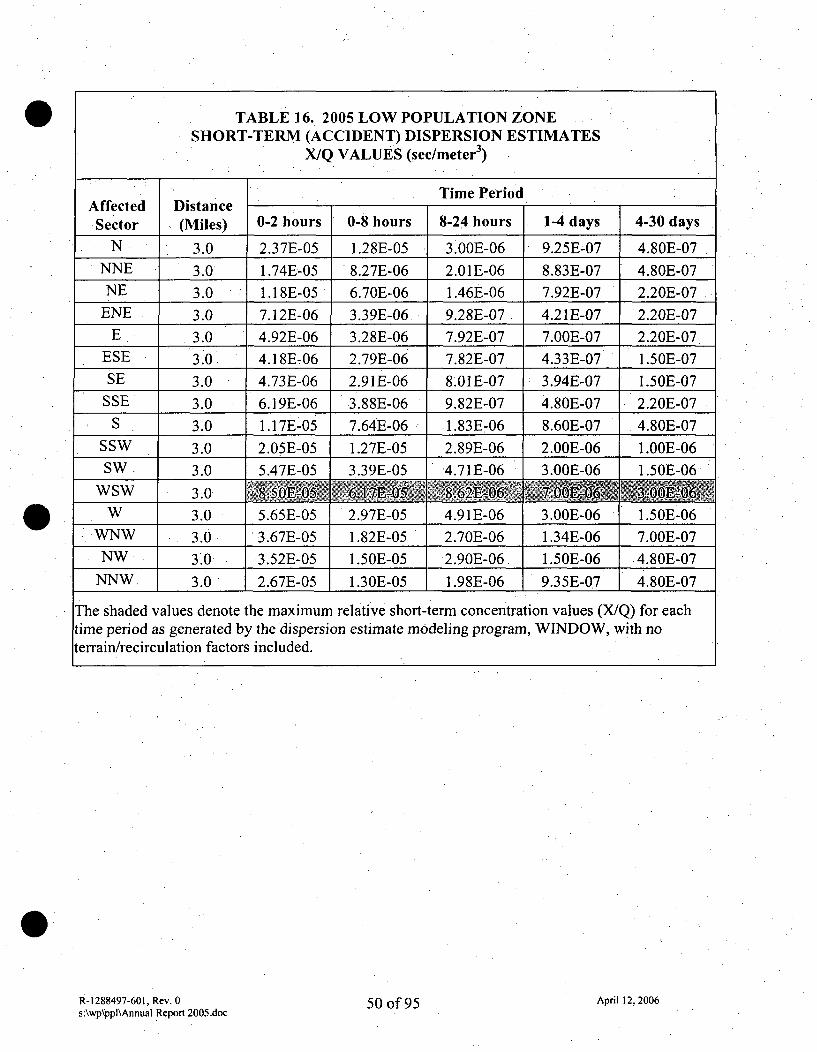
TABLE 16. 2005 LOW POPULATION ZONESHORT-TERM (ACCIDENT) DISPERSION ESTIMATES
X/Q VALUES (sec/meter 3)
Time PeriodAffected DistanceSector (Miles) 0-2 hours 0-8 hours 8-24 hours 1-4 days 4-30 days
N 3.0 2.37E-05 1.28E-05 3.OOE-06 9.25E-07 4.80E-07
NNE 3.0 1.74E-05 8.27E-06 2.01E-06 8.83E-07 4.80E-07
NE 3.0 1.18E-05 6.70E-06 1.46E-06 7.92E-07 2.20E-07
ENE 3.0 7.12E-06 3.39E-06 9.28E-07 4.21E-07 2.20E-07
E 3.0 4.92E-06 3.28E-06 7.92E-07 7.OOE-07 2.20E-07
ESE 3.0 4.18E-706 2.79E-06 7.82E-07 4.33E-07 1.50E-07
SE 3.0 4.73E-06 2.91E-06 8.01E-07 3.94E-07 1.50E-07
SSE 3.0 6.19E-06 3.88E-06 9.82E-07 4.80E-07 2.20E-07
S 3.0 1.17E-05 7.64E-06 1.83E-06 8.60E-07 4.80E-07
SSW 3.0 2.05E-05 1.27E-05 2.89E-06 2.OOE-06 1.00E-06
SW 3.0 5.47E-05 3.39E-05 4.71E-06 3.OOE-06 1.50E-06WSW 3.0 6.17E8E5
W 3.0 5.65E-05 • 2.97E-05 4.91E-06 3.OOE-06 1.50E-06
WNW 3.0 3.67E-05 1.82E-05 2.70E-06 1.34E-06 7.OOE-07
NW 3.0 3.52E-05 1.50E-05 2.90E-06 1.50E-06 •4.80E-07
NNW 3.0 2.67E-05 1.30E-05 1.98E-06 9.35E-07 4.80E-07
The shaded values denote the maximum relative short-term concentration values (X/Q) for eachtime period as generated by the dispersion estimate modeling program, WINDOW, with noterrain/recirculation factors included.
R-1288497-601, Rev. 0s:\wp\ppl\Annual Report 2005.doc
50 of 95 April 12, 2006
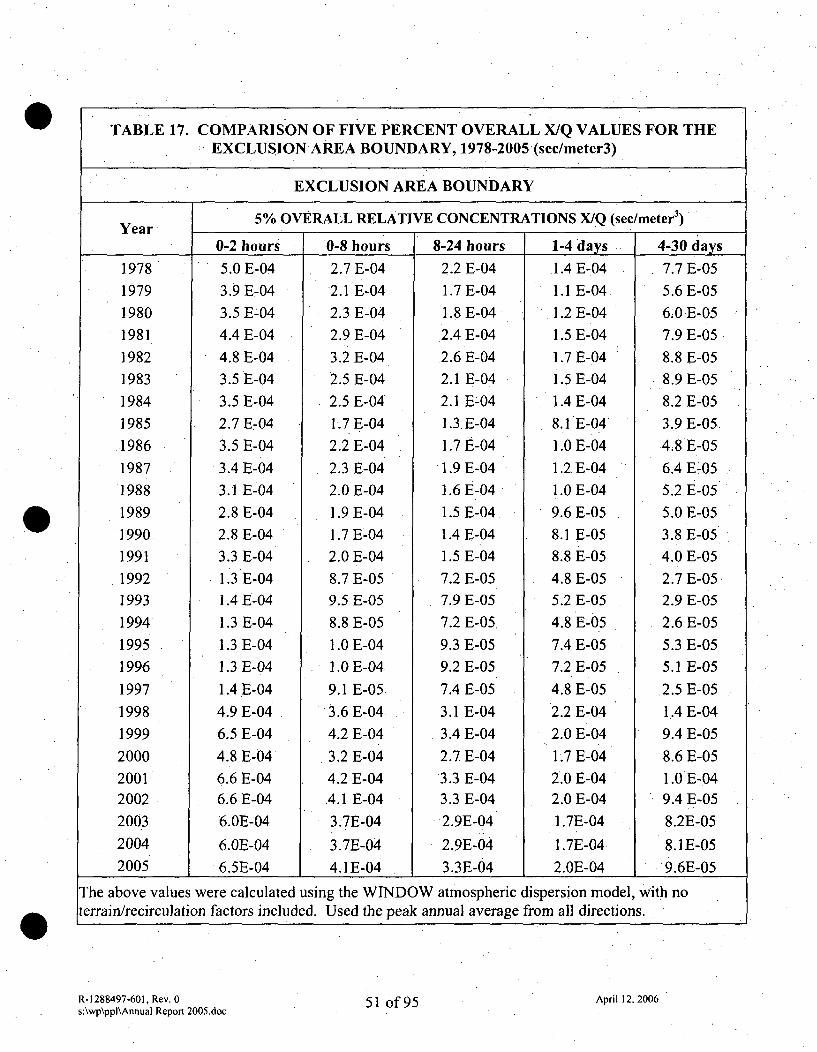
TABLE 17. COMPARISON OF FIVE PERCENT OVERALL X/Q VALUES FOR THE: EXCLUSION AREA BOUNDARY, 1978-2005 (sec/meter3)
EXCLUSION AREA BOUNDARY
5% OVERALL RELATIVE CONCENTRATIONS X/Q (sec/meter 3)Year 0-2 hours •0-8 hours 8-24 hours 1-4 days 4-30 days
197819791980
198119821983198419851986
19871988
19891990199119921993199419951996
1997
199819992000200120022003
20042005
5.0 E-043.9 E-043.5 E-044.4 E-04
4.8 E-043.5 E-04
3.5 E-042.7 E-043.5 E-04
3.41E-043.1 E-04
2.8 E-042.8 E-043.3 E-041.3 E-041.4 E-04
1.3 E-041.3 E-041.3 E-04
1.4 E-04
4.9 E-046.5 E-044.8 E-04
6.6 E-046.6 E-046.OE-04
6.OE-046.5E-04
2.7 E-04
2.1 E-04
2.3 E-04
2.9 E-04
3.2 E-04
2.5 E-04
2.5 E-04
1.7 E-04
2.2 E-04
2.3 E-04
2.0 E-04
1.9 E-04
1.7 E-04
2.0 E-04
8.7 E-05
9.5 E-05
8.8 E-05
1.0 E-04
1.0 E-04
9.1 E-05
3.6 E-04
4.2 E-04
3.2 E-04
4.2 E-044.1 E-04
3.7E-04
3.7E-04
4.1E-04
2.2 E-04
1.7 E-04
1.8 E-04
2.4 E-04
2.6 E-04
2.1 E-04
2.1 E-04
1.3 E-04
1.7 E-04
1.9 E-04
1.6 E-04
1.5 E-04
1.4 E-04
1.5 E-04
7.2 E-05
7.9 E-05
7.2 E-05
9.3 E-05
9.2 E-05
7.4 E-05
3.1 E-04
3.4 E-04
2.7 E-04
3.3 E-043.3 E-04
2.9E-04
2.9E-04
3.3E-04
1.4 E-04
1.1 E-04
1.2 E-04
1.5 E-04
1.7 E-04
1.5 E-04
1.4 E-04
8.1 E-04
1.0 E-04
1.2 E-04
1.0 E-04
9.6 E-05
8.1 E-05
8.8 E-05
4.8 E-05
5.2 E-05
4.8 E-05
7.4 E-05
7.2 E-05
4.8 E-05
2.2 E-04
2.0 E-04
1.7 E-04
2.0 E-042.0 E-04
1.7E-04
1.7E-04
2.OE-04
7.7 E-05
5.6 E-05
6.0 E-05
7.9 E-05
8.8 E-05
8.9 E-05
8.2 E-05
3.9 E-05
4.8 E-05
6.4 E-05
5.2 E-05
5.0 E-05
3.8 E-05
4.0 E-05
2.7 E-05
2.9 E-05
2.6 E-05
5.3 E-05
5.1 E-05
2.5 E-05
1.4 E-04
9.4 E-05
8.6 E-05
1.0 E-049.4 E-05
8.2E-05
8.1E-05
9.6E-05
The above values were calculated using the WINDOW atmospheric dispersion model, with noterrain/recirculation factors included. Used the peak annual average from all directions.
R-1288497-601, Rev. 0s:\wp\ppl\Annual Report 2005.doc
51 of 95 April 12, 2006
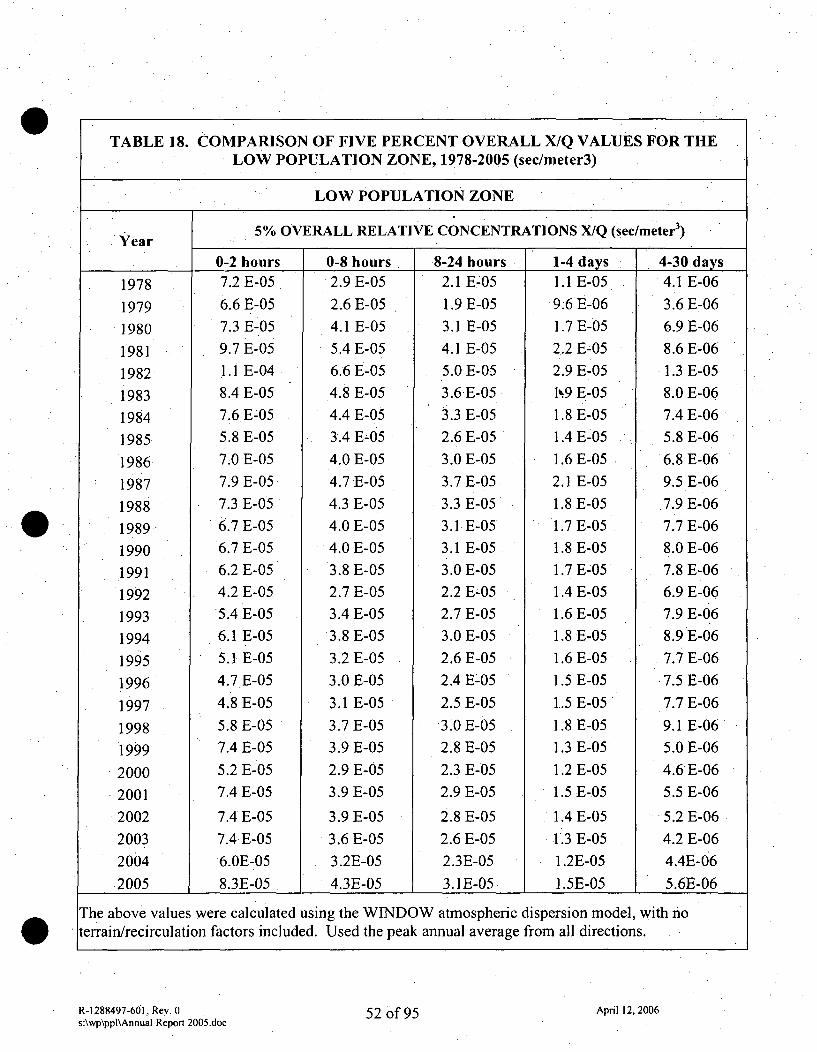
TABLE.] 8. COMPARISON OF FIVE PERCENT OVERALL X/Q VALUES FOR THELOW POPULATION ZONE, 1978-2005 (sec/meter3)
LOW POPULATION ZONE
5% OVERALL RELATIVE CONCENTRATIONS X/Q (sec/meter3)00ear0-2 hours 0-8 hours 8-24 hours 1-4 days 4-30 days
197819791980
19811982198319841985
198619871988198919901991
19921993199419951996
1997
19981999
2000200120022003
20042005
7.2 E-056.6 E-057.3 E-059.7 E-051.1 E-048.4 E-057.6 E-055.8 E-057.0 E-057.9 E-057.3 E-056.7 E-056.7 E-056.2 E-054.2 E-055.4 E-056.1 E-055.1 E-054.7 E-05
4.8 E-055.8 E-057.4 E-05
5.2 E-057.4 E-05
7.4 E-057.4 E-056.0E-058.3E-05
2.9 E-052.6 E-054.1 E-055.4 E-056.6 E-054.8 E-054.4 E-053.4 E-054.0 E-054.7 E-054.3 E-054.0 E-054.0 E-053.8 E-052.7 E-053.4 E-053.8 E-053.2 E-053.0 E-053.1 E-053.7 E-053.9 E-05
2.9 E-053.9 E-05
3.9 E-053.6 E-053.2E-05
4.3E-05
2.1 E-051.9 E-053.1 E-054.1 E-055.0 E-053.6 E-053.3 E-052.6 E-053.0 E-053.7 E-053.3 E-053.1. E-053.1 E-053.0 E-052.2 E-052.7 E-05
3.0 E-052.6 E-052.4 E-052.5 E-053.0 E-05
2.8 E-052.3 E-052.9 E-05
2.8 E-052.6 E-052.3E-053. E-05
1.1 E-05.9.6 E-06
1.7 E-052.2 E-052.9 E-051N9 E-051.8 E-051.4 E-051.6 E-052.1 E-051.8 E-051.7 E-051.8 E-051.7 E-051.4 E-051.6 E-051.8 E-051.6 E-051.5 E-051.5 E-051.8 E-051.3 E-051.2 E-051.5 E-05
1.4 E-05
1.3 E-051.2E-051.5E-05
4.1 E-06
3.6 E-066.9 E-068.6 E-061.3 E-058.0 E-067.4 E-065.8 E-066.8 E-069.5 E-06
7.9 E-067.7 E-068.0 E-067.8 E-066.9 E-06
7.9 E-068.9 E-067.7 E-06
.7.5 E-06
7.7 E-069.1 E-065.0 E-06
4.6 E-065.5 E-06
5.2 E-06
4.2 E-064.4E-06
5.6E-06
The above values were calculated using the WINDOW atmospheric dispersion model, with noterrain/recirculation factors included. Used the peak annual average from all directions.
R-1288497-601. Rev. 0s:\wp\ppl\Annual Report 2005.doc
52 of 95 April 12, 2006
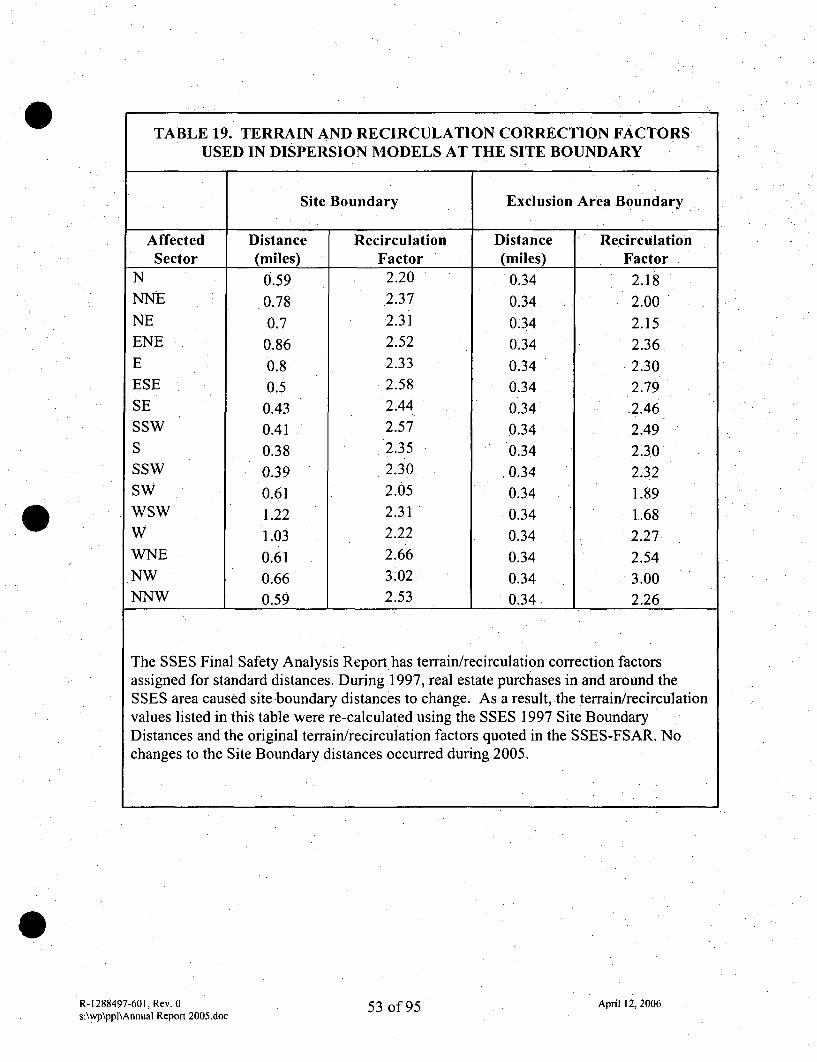
TABLE 19. TERRAIN AND RECIRCULATION CORRECTION FACTORSUSED IN DISPERSION MODELS AT THE SITE BOUNDARY
Site Boundary Exclusion Area Boundary
Affected Distance Recirculation Distance RecirculationSector (miles) Factor (miles) Factor
N 0.59 2.20 0.34 2.18NNE 0.78 2.37 0.34. 2.00NE 0.7 2.31 0.34 2.15ENE 0.86 2.52 0.34 2.36E 0.8 2.33 0.34 2.30ESE 0.5 2.58 0.34 2.79SE 0.43 2.44 0.34 2.46SSW 0.41 2.57 0.34 2.49
S 0.38 2.35 0.34 2.30SSW 0.39 2.30 0.34 2.32SW 0.61 2.05 0.34 1.89WSW 1.22 2.31 0.34 1.68W 1.03 2.22 0.34 2.27WNE 0.61 2.66 0.34 2.54NW 0.66 3.02 0.34 3.00NNW 0.59 2.53 0.34 2.26
The SSES Final Safety Analysis Report has terrain/recirculation correction factorsassigned for standard distances. During 1997, real estate purchases in and around theSSES area caused site boundary distances to change. As a result, the terrain/recirculationvalues listed in this table were re-calculated using the SSES 1997 Site BoundaryDistances and the original terrain/recirculation factors quoted in the SSES-FSAR. Nochanges to the Site Boundary distances occurred during 2005.
R-1288497-601, Rev. 0s:\wp\ppl\Annual Report 2005.doc
53 of 95 April 12, 2006
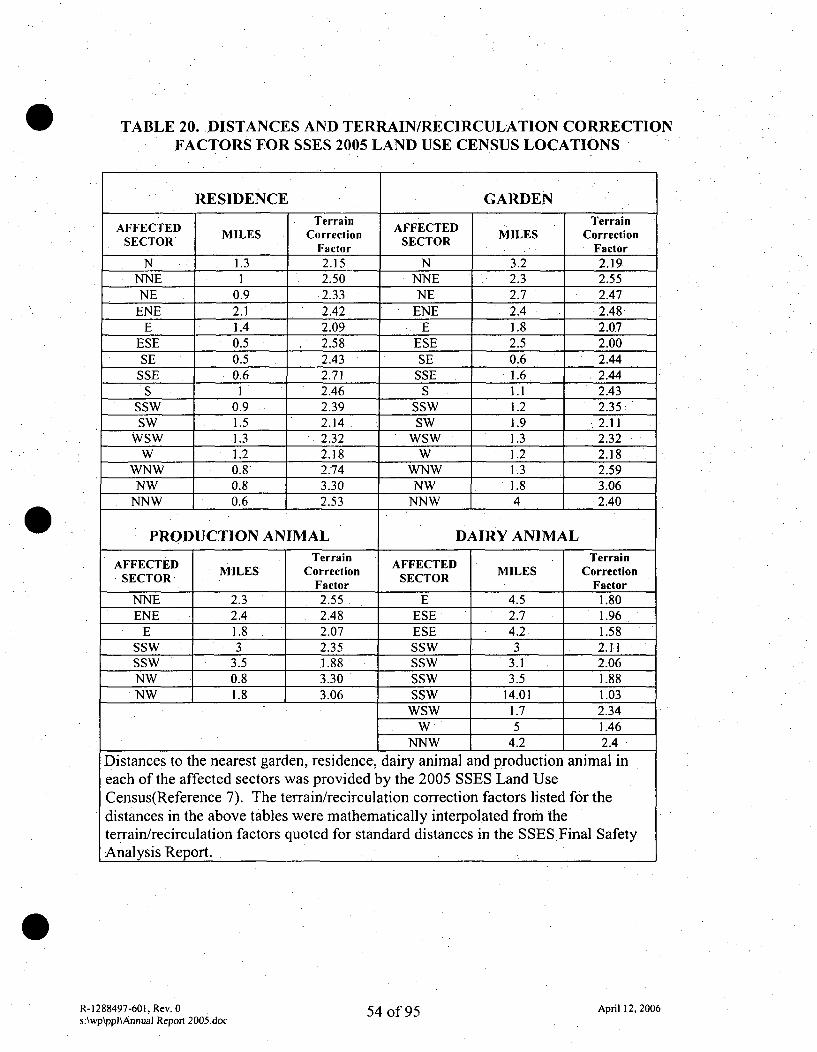
TABLE 20..•DISTANCES AND TERRAIN/RECIRCULATION CORRECTIONFACTORS FOR SSES 2005 LAND USE CENSUS LOCATIONS
RESIDENCE GARDENTerrain ATerrainAFFECTED MILES Correction AFFECTED MILES Correction
SECTORC Factor SECTOR Factor
N 1.3 2.15 N 3.2 2.19NNE 1 2.50 NNE 2.3 2.55.NE 0.9 2.33 NE 2.7 2.47
ENE 2.1 2.42 ENE 2.4 2.48E 1.4 2.09 E 1.8 2.07
ESE 0.5 2.58 ESE 2.5 2.00SE 0.5 2.43 SE 0.6 2.44
SSE 0.6 2.71 SSE 1.6 2.44S 1 2.46 S 1.1 2.43
SSW 0.9 2.39 SSW 1.2 2.35:SW 1.5 2.14 SW 1.9 2.11
WSW .1.3 2.32 WSW 1.3 2.32W 1.2 2.18 W 1.2 2.18
WNW 0.8 2.74 WNW 1.3 2.59NW 0.8 3.30 NW 1.8 3.06
NNW 0.6 2.53 NNW 4 2.40
PRODUCTION ANIMAL DAIRY ANIMALTerrain AFFECTED Terrain
.SECTED MILES Correction MILES CorrectionSECTOR Fatr SECTOR FcoFactor Factor
NNE 2.3 2.55 E 4.5 1.80ENE 2.4 2.48 ESE 2.7 1.96
E 1.8 2.07 ESE 4.2 1.58SSW 3 2.35 SSW 3 2.1.1SSW 3.5 .1.88 SSW 3.1 2.06NW 0.8 3.30 SSW 3.5 1.88NW 1.8 3.06 SSW 14.01 1.03
WSW 1.7 2.34W 5 1.46
NNW 4.2 2.4
Distances to the nearest garden, residence, dairy animal and production animal ineach of the affected sectors was provided by the 2005 SSES Land UseCensus(Reference 7). The terrain/recirculation correction factors listed for thedistances in the above tables were mathematically interpolated from theterrain/recirculation factors quoted for standard distances in the SSES Final SafetyAnalysis Report.
R-1288497-601, Rev. 0s:\wp\pp]\Annual Report 2005.doc
54 of 95 April 12, 2006
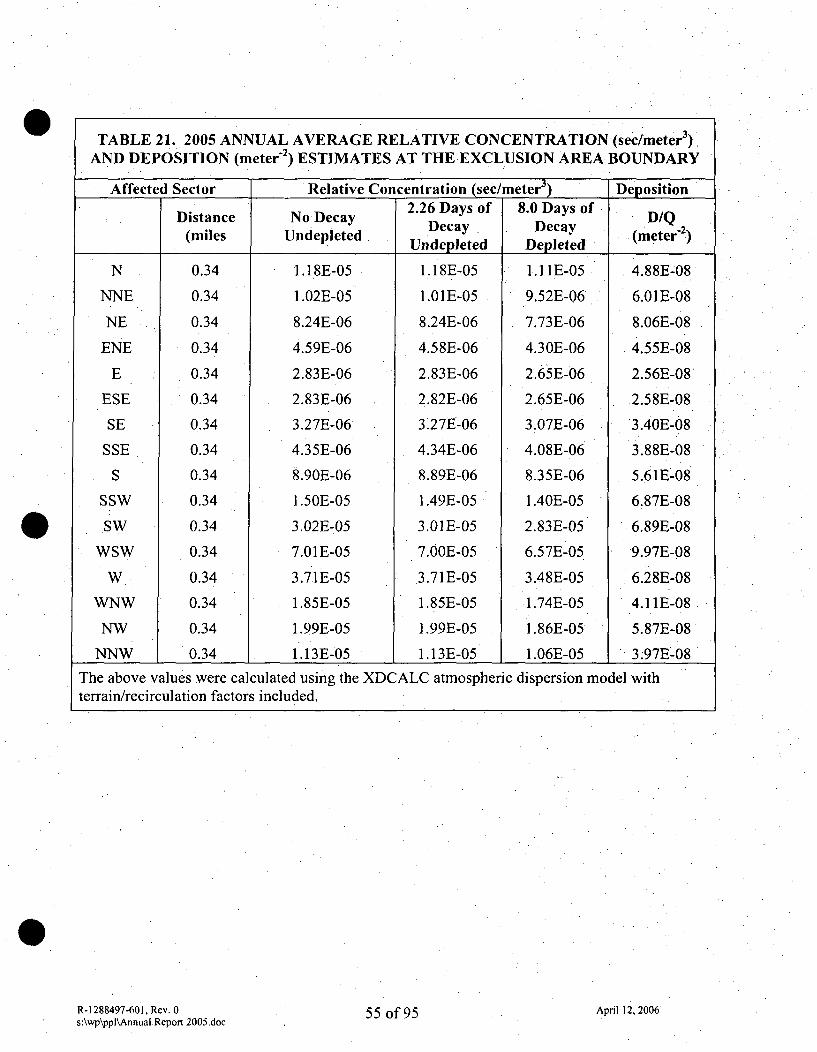
TABLE 21. 2005 ANNUAL AVERAGE RELATIVE CONCENTRATION (sec/meter 3)AND DEPOSITION (meter 2 ) ESTIMATES AT THEEXCLUSION AREA BOUNDARY
Affected Sector Relative Concentration (sec/meter3) DepositionDistance No Decay 2.26 Days of 8.0 Days of D/Q
Decay Decay (meter2)(miles Undepleted Undepleted Depleted
N 0.34 1.18E-05 1.18E-05 1..11E-05 4.88E-08
NNE 0.34 1.02E-05 1.01E-05 9.52E-06 6.01E-08
NE 0.34 8.24E-06 8.24E-06 7.73E-06 8.06E-08
ENE 0.34 4.59E-06 4.58E-06 4.30E-06 4.55E-08
E 0.34 2.83E-06 2.83E-06 2.65E-06 2.56E-08
ESE 0.34 2.83E-06 2.82E-06 2.65E-06 2.58E-08
SE 0.34 3.27E-06 3.27E-06 3.07E-06 3.40E-08
SSE 0.34 4.35E-06 4.34E-06 4.08E-06 3.88E-08
S 0.34 8.90E-06 8.89E-06 8.35E-06 5.61E-08
SSW 0.34 1.50E-05 1.49E-05 1.40E-05 6.87E-08
SW 0.34 3.02E-05 3.01E-05 2.83E-05 6.89E-08
WSW 0.34 7.01E-05 7.OOE-05 6.57E-05 9.97E-08
W 0.34 3.71E-05 3.71E-05 3.48E-05 6.28E-08
WNW 0.34 1.85E-05 1.85E-05 1.74E-05 4.11E-08
NW 0.34 1.99E-05 1.99E-05 i.86E-05 5.87E-08
NNW 0.34 1.13E-05 1.13E-05 1.06E-05 3.97E-08
The above values were calculated using the XDCALC atmospheric dispersion model withterrain/recirculation factors included.
R-1288497-601, Rev. 0s:\wp\ppl\Annual. Report 2005.doc
55 of 95 April 12, 2006

TABLE 22. 2005 ANNUAL AVERAGE RELATIVE CONCENTRATION (sec/meter 3)AND DEPOSITION (meter2) ESTIMATES AT THE SITE BOUNDARY
Affected Sector Relative Concentration (sec/meter 3 DepositionDistance No Decay 2.26 Days of 8.0 Days of D/Q
(miles Undepleted Decay Decay (meter-2Undepleted Depleted
N •0.59 5.34E-06 5.32E-06 4.83E-06 1.93E-08
NNE 0.78 3.61E-06 3.59E-06 3.20E-06 1.74E-08
NE 0.58 3.93E-06 3.92E-06 3.55E-06 3.43E-08
ENE 0.49 2.69E-06 2.69E-06 2.46E-06 2.47E-08
E 0.48 1.71E-06 1.71E-06 1.57E-06 1.44E-08
ESE 0.5 1.48E-06 1.48E-06 1.35E-06 1.25E-08
SE 0.43 2.30E-06 2.29E-06 2.12E-06 2.27E-08
SSE 0.41 3.41E-06 3.41E-06 3.16E-06 2.93E-08
S 0.38 7.72E-06 7.71E-06 7.18E-06 4.74E-08
SSW 0.39 1.22E-05 1.22E-05• 1. 14E-05 5.43E-08
SW 0.61 1.36E-05 1.35E-05 1.22E-05 2.78E-08
WSW 1.22 1.33E-05 1.32E-05 1.14E-05 1.56E-08
W 1.03 6.94E-06. 6.88E-06 6.02E-06 9.32E-09
WNW 0.61 8.22E-06 8.17E-06 7.40E-06 1.59E-08
NW 0.66 7.65E-06 7.61E-06 6.85E-06 1.92E-08
NNW 0.59 5.65E-06 5.63E-06 5.1OE-06 1.75E-08
The above values were calculated using the XDCALC atmospheric dispersion model withterrain/recirculation factors included.
R-1288497-601, Rev. 0s:\wp\ppl\Annual Report 2005.doc
56 of 95 April 12, 2006
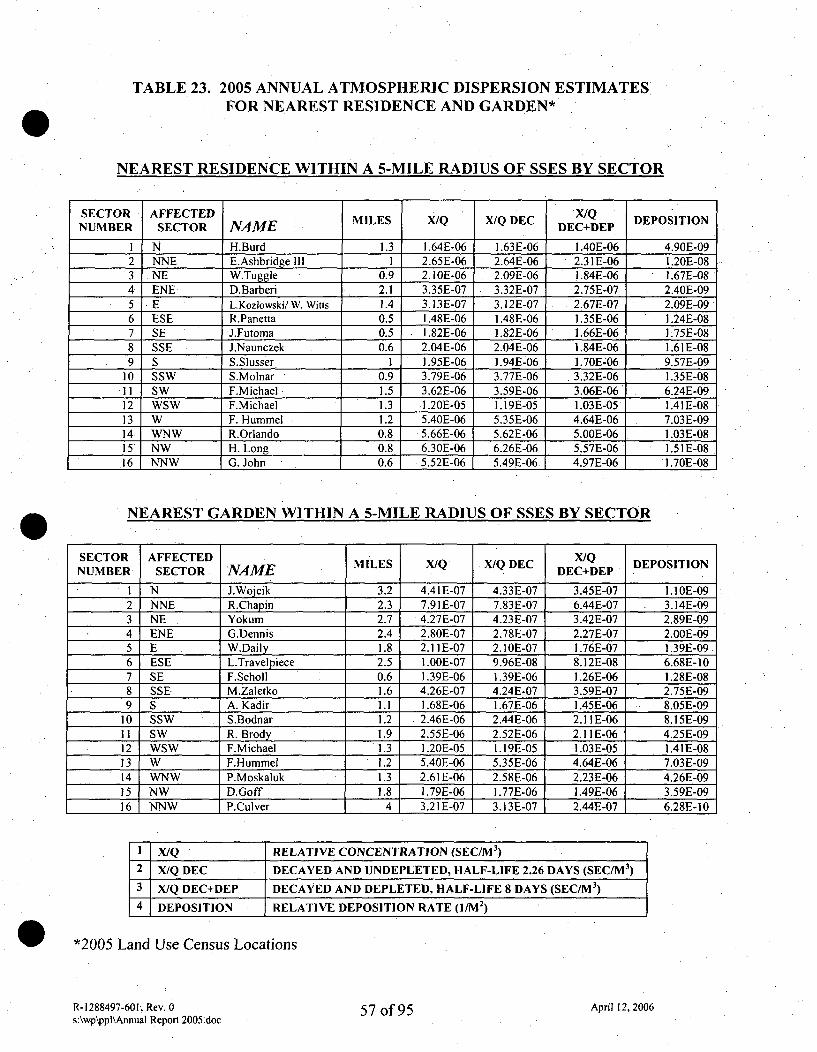
TABLE 23. 2005 ANNUAL ATMOSPHERIC DISPERSION ESTIMATESFOR NEAREST RESIDENCE AND GARDEN*
NEAREST RESIDENCE WITHIN A 5-MILE RADIUS OF SSES BY SECTOR
SECTOR AFFECTED X/Q DEPOSITION
NUMBER SECTOR NAME MILES / DEC DEC+DEP
I N H.Burd 1.3 1.64E-06 1.63E-06 1.40E-06 4.90E-092 NNE E.Ashbridge IIl I 2.65E-06 2.64E-06 2.31E-06 1.20E-083 .,NE W.Tuggle 0.9 2.10E-06 2.09E-06 1.84E-06 1.67E-084 ENE D.Barberi 2.1 3.35E-07 3.32E-07 2.75E-07 2.40E-095 E L.Kozlowski/W. Witts 1.4 3.13E-07 3.12E-07 2.67E-07 2.09E-096 ESE R.Panetta 0.5 1.48E-06 1.48E-06 1.35E-06 1.24E-087 SE J.Futoma 0.5 1.82E-06 1.82E-06 1.66E-06 1.75E-088 SSE J.Naunczek 0.6 2.04E-06 2.04E-06 1.84E-06 1.61E-089 S S.Slusser 1 1.95E-06 1.94E-06 1.70E-06 9.57E-09
10 SSW S.Molnar .0.9 3.79E-06 3.77E-06 3.32E-06 1.35E-0811 SW F.Michael 1.5 3.62E-06 3.59E-06 3.06E-06' 6.24E-0912 WSW F.Michael 1.3 1.20E-05 1.19E-05 1.03E-05 1.41E-0813 W F. Hummel 1.2 5.40E-06 5.35E-06 4.64E-06 7.03E-0914 WNW R.Orlando 0.8 5.66E-06 5.62E-06 5.OOE-06 1.03E-0815 NW H. Long 0.8 6.30E-06 6.26E-06 5.57E-06 1.51E-0816 NNW G. John 0.6 5.52E-06 5.49E-06 4.97E-06 1.70E-08
NEAREST GARDEN WITHIN A 5-MILE RADIUS OF SSES BY SECTOR
SECTOR AFFECTED X/Q DEPOSITIONNUMBER SECTOR NAME MILES X/Q X/Q DEC DEC+DEP
I N J.Wojcik 3.2 4.41E-07 4.33E-07 3.45E-07 1.1OE-092 NNE R.Chapin 2.3 7.91E-07 7.83E-07 6.44E-07 3.14E-093 NE Yokum 2.7 4.27E-07 4.23E-07 3.42E-07 2.89E-094 ENE G.Dennis 2.4 2.80E-07 2.78E&07 2.27E-07 2.OOE-095 E W.Daily 1.8 2.11 E-07 2.1OE-07 1.76E-07 1.39E-09.6 ESE L.Travelpiece 2.5 1.00E-07 9.96E-08 8.12E-08 6.68E-107 SE F.Scholl 0.6 1.39E-06 1.39E-06 1.26E-06 i .28E-088 SSE M.Zaletko 1.6 4.26E-07 4.24E-07 3.59E-07 2.75E-099 S A. Kadir 1.1 1.68E-06 1.67E-06 1.45E-06 8.05E-09
10 SSW S.Bodnar 1.2 2.46E-06 2.44E-06 2.11E-06 8.15E-09I I SW R. Brody 1.9 2.55E-06 2.52E-06 2.11 E-06 4.25E-0912 WSW F.Michael 1.3 1.20E-05 .1.19E-05 1.03E-05 1.41E-0813 W F.Hummel 1.2 5.40E-06 5.35E-06 4.64E-06 7.03E-0914 WNW P.Moskaluk 1.3 2.61E-06 2.58E-06 2.23E-06 4.26E-0915 NW D.Goff 1.8 1.79E-06 1.77E-06 1.49E-06 3.59E-0916 NNW P.Culver 4 3.2 1E-07 3.13E-07 2.44E-07 6.28E-I0
I X/Q RELATIVE CONCENTRATION (SEC/M3)2 X/Q DEC DECAYED AND UNDEPLETED, HALF-LIFE 2.26 DAYS (SEC/M3)
3 X/Q DEC+DEP DECAYED AND DEPLETED, HALF-LIFE 8 DAYS (SEC/M3 )
4 DEPOSITION RELATIVE DEPOSITION RATE (I/M 2)
*2005 Land Use Census Locations
R-1288497-601, Rev. 0s:\wp\ppl\Annual Report 2005.doc
57 of 95 April12, 2006
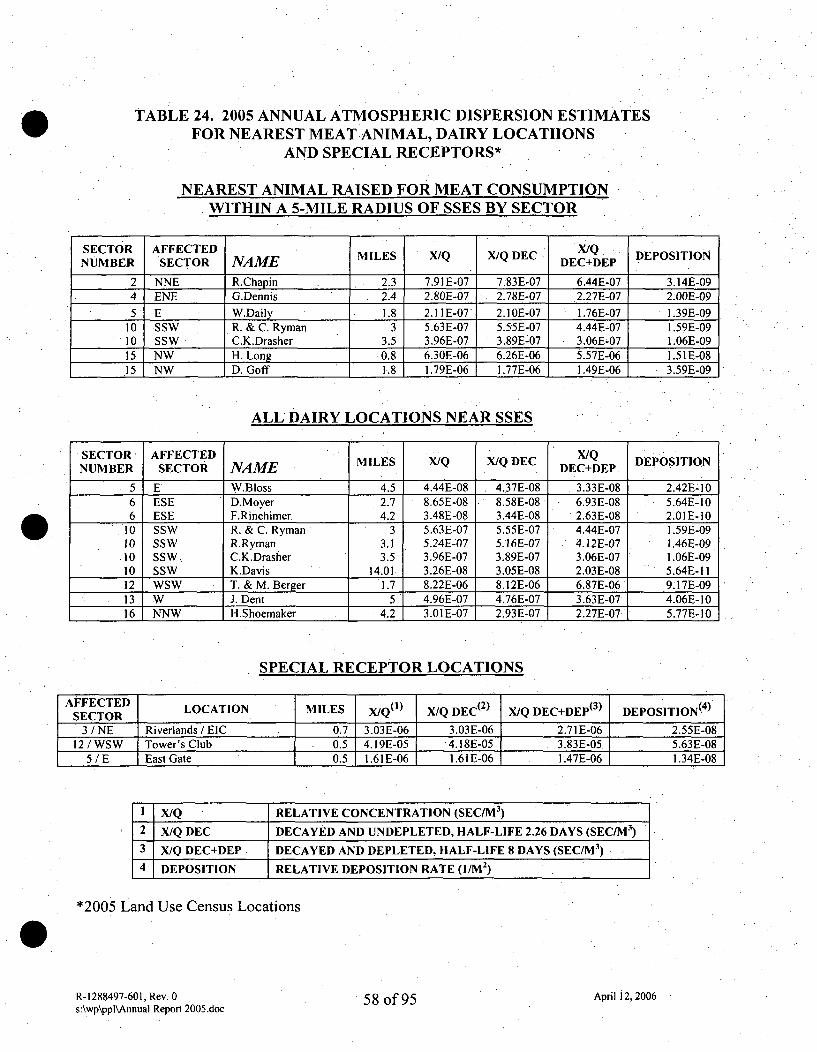
TABLE 24. 2005 ANNUAL ATMOSPHERIC DISPERSION ESTIMATESFOR NEAREST MEAT ANIMAL, DAIRY LOCATTIONS
AND SPECIAL RECEPTORS*
NEAREST ANIMAL RAISED FOR MEAT CONSUMPTIONWITHIN A 5-MILE RADIUS OF SSES BY SECTOR
SECTOR AFFECTED X/Q DEPOSITIONNUMBER SECTOR NAME MILES X/Q X/Q DEC DEC+DEP
2 NNE R.Chapin 2.3 7.91E-07 7.83E-07 6.44E-07 3.14E-094 ENE G.Dennis 2.4 2.80E-07 2.78E-07 2.27E-07 2OOE-095 E W.Daily 1.8 2.11E-07 2.10E-07 1.76E-07 1.39E-09
10 SSW R. & C. Ryman 3 5.63E-07 5.55E-07 4.44E-07 1.59E-0910 SSW C.K.Drasher 3.5 3.96E-07 3.89E-07 3.06E&07 1.06E-0915 NW H. Long 0.8 6.30E-06 6.26E-06 5.57E-06 1.51E-0815 NW D. Goff 1.8 1.79E-06 1.77E-06 1.49E-06 3.59E-09
ALL DAIRY LOCATIONS NEAR SSES
.SECTOR AFFECTED M • X/QNUMBER SECTOR NAME MILES XiQ X/Q DEC DEC+DEP DEPOSITION
5 E . W.Bloss 4.5 4.44E-08 . 4.37E-08 . 3.33E-08 2.42E-106 ESE D.Moyer 2.7 8.65E-08 8.58E-08 6.93E-08 5.64E-I06 ESE F.Rinehimer. 4.2 3.48E-08 3.44E-08 . 2.63E-08 2.01E-10
10 SSW R. & C. Ryman 3 5.63E-07 5.55E-07 4.44E-07 1.59E-0910 SSW R.Ryman 3.1 5.24E-07 5.16E-07 4.12E-07 1.46E-0910 SSW. C.K.Drasher 3.5 3.96E-07 3.89E-07 3.06E-07 1.06E-0910 SSW K.Davis 14.01 3.26E-08 3.05E-08 2.03E-08 5.64E-II12 WSW T. & M. Berger 1.7 8.22E-06 8.12E-06 6.87E-06 9.17E-0913 W J. Dent 5 4.96E-07 4.76E-07 3.63E-07 4.06E-1016 NNW H.Shoemaker 4.2 3.01E-07 2.93E-07 2.27E-07 5.77E-l0
SPECIAL RECEPTOR LOCATIONS
AFFECTED LOCATION MILES X/Q(1) X/Q DEC(2 ) X/Q DEC+DEP(3 ) DEPOSITION(4)SECTOR
3/NE Riverlands / EIC 0.7 3.03E-06 3.03E-06 2.71E-06 2.55E-0812 / WSW Tower's Club 0.5 4.19E-05 4.18E-05 3.83E-05 5.63E-08
5/E East Gate 0.5 1.61E-06 1.61E-06 1.47E-06 1.34E-08
1 X/Q RELATIVE CONCENTRATION (SEC/M3 )
2 X/Q DEC DECAYED AND UNDEPLETED, HALF-LIFE 2.26 DAYS (SEC/M3)
3 X/Q DEC+DEP DECAYED AND DEPLETED, HALF-LIFE 8 DAYS (SEC/M3)4 DEPOSITION RELATIVE DEPOSITION RATE (]/M 2)
*2005 Land Use Census Locations
R-1288497-601, Rev. 0s:\wp\ppl\Annual Report 2005.doc
58 of 95 April 12, 2006
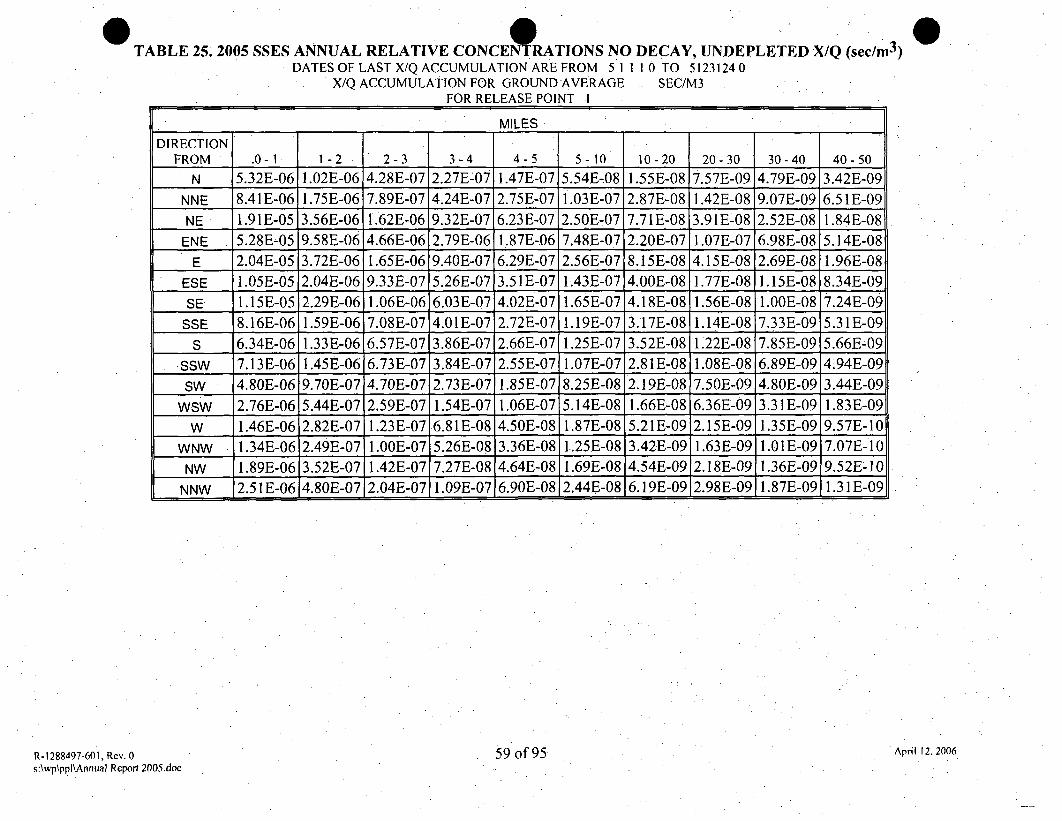
TABLE 25. 2005 SSES ANNUAL RELATIVE CONCE RATIONS NO DECAY, UNDEPLETED X/Q (sec/m 3 )DATES OF LAST X/Q ACCUMULATION ARE FROM 5 1 11 0 TO 5123124 0
X/Q ACCUMULATION FOR GROUND AVERAGE SEC/M3FOR RELEASE POINT .1
MILESDIRECTION
FROM .0-1 1-2. 2-3 3-4 4-5 5-10 10-20 20-30 30-40 40-50
N 5.32E-06 1.02E-06 4.28E-07 2.27E-07 1.47E-07 5.54E-08 1.55E-08 7.57E-09 4.79E-09 3.42E-09NNE 8.41E-06 1.75E-06 7.89E-07 4.24E-07 2.75E-07 1.03E-07 2.87E-08 1.42E-08 9.07E-09 6.51E-09NE 1.91E-05 3.56E-06 1.62E-06 9.32E-07 6.23E-07 2.50E-07 7.71E-08 3.91E-08 2.52E-08 1.84E-08
ENE 5.28E-05 9.58E-06 4.66E-06 2.79E-06 1.87E-06 7.48E-07 2.20E-07 1.07E-07 6.98E-08 5.14E-08E 2.04E-05 3.72E-06 1.65E-06 9.40E-07 6.29E-07 2.56E-07 8.15E-08 4.15E-08 2.69E-08 1.96E-08
ESE 1.05E-05 2.04E-06 9.33E-07 5.26E-07 3.51E-07 1.43E-07 4.OOE-08 1.77E-08 1.15E-08 8.34E-09SE 1.15E-05 2.29E-06 1.06E-06 6.03E-07 4.02E-07 1.65E-07 4.18E-08 1.56E-08 1.00E-08 7.24E-09
SSE 8.16E-06 1.59E-06 7.08E-07 4.01E-07 2.72E-07 1.19E-07 3.17E-08 1.14E-08 7.33E-09 5.31E-09s 6.34E-06 1.33E-06 6.57E-07 3.86E-07 2.66E-07 1.25E-07 3.52E-08 1.22E-08 7.85E-09 5.66E-09
SSW 7.13E-06 1.45E-06 6.73E-07 3.84E-07 2.55E-07 1.07E-07 2.81E-08 1.08E-08 6.89E-09 4.94E-09SW 4.80E-06 9.70E-07 4.70E-07 2.73E-07 1.85E-07 8.25E-08 2.19E-08 7.50E-09 4.80E-09 3.44E-09
WSW 2.76E-06 5.44E-07 2.59E-07 1.54E-07 1.06E-07 5.14E-08 1.66E-08 6.36E-09 3.31E-09 1.83E-09W 1.46E-06 2.82E-07 1.23E-07 6.81E-08 4.50E-08 1.87E-08 5.21E-09 2.15E-09 1.35E-09 9.57E-10
WNW 1.34E-06 2.49E-07 1.00E-07 5.26E-08 3.36E-08 1.25E-08 3.42E-09 1.63E-09 1.01E-09 7.07E-10NW 1.89E-06 3.52E-07 1.42E-07 7.27E-08 4.64E-08 1.69E-08 4.54E-09 2.18E-09 1.36E-09 9.52E-10
NNW 2.51E-06 4.80E-07 2.04E-07 1.09E-07 6.90E-08 2.44E-08 6.19E-09 2.98E-09 1.87E-09 1.31E-09
R- 1288497-601, Rev. 0s:\wp\ppl\Annual Report 2005.doe
59 of 95 April 12, 2006
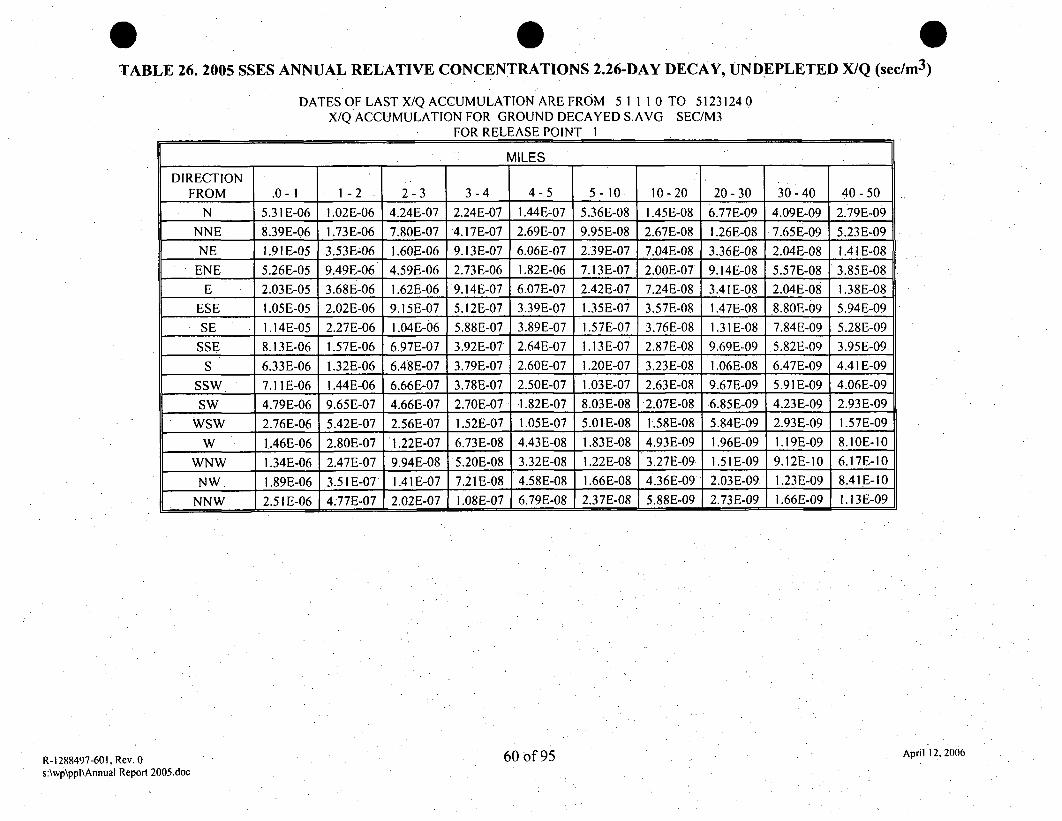
0 0TABLE 26. 2005 SSES ANNUAL RELATIVE CONCENTRATIONS 2.26-DAY DECAY, UNDEPLETED X/Q (sec/m 3 )
DATES OF LAST X/Q ACCUMULATION ARE FROM 5 1 1 1 0 TO 5123124 0X/Q ACCUMULATION FOR GROUND DECAYED S.AVG SEC/M3
FOR RELEASE POINT 1
MILES _
DIRECTIONFROM .0-1 1-2 2-3 3-4 4-5 5-10 10-20 20-30 30 -40 40-50
N 5.31E-06 1.02E-06 4.24E-07 2.24E-07 1.44E-07 5.36E-08 1.45E-08 6.77E-09 4.09E-09 2.79E-09NNE 8.39E-06 1.73E-06 7.80E-07 4.17E-07 2.69E-07 9.95E-08 2.67E-08 1.26E-08 7.65E-09 5.23E-09NE 1.91E-05 3.53E&06 1.60E-06 9.13E-07 6.06E-07 2.39E-07 7.04E-08 3.36E-08 2.04E-08 1.41E-08
ENE 5.26E-05 9.49E-06 4.59E-06 2.73E-06 1.82E-06 7.13E-07 200E-07 9.14E-08 5.57E-08 3.85E-08E 2.03E-05 3.68E-06 1.62E-06 9.14E-07 6.07E-07 2.42E-07 7.24E-08 3.41E-08 2.04E-08 1.38E-08
ESE 1.05E-05 2.02E-06 9.15E-07 5.12E-07 3.39E-07 1.35E-07 3.57E-08 1.47E-08 8.80E-09 5.94E-09SE 1.14E-05 2.27E-06 1.04E-06 5.88E-07 3.89E-07 1.57E-07 3.76E-08 1.31E-08 7.84E-09 5.28E-09
SSE 8.13E-06 1.57E-06 6.97E-07 3.92E-07 2.64E-07 1.13E-07 2.87E-08 9.69E-09 5.82E-09 3.95E-09
S 6.33E-06 1.32E-06 6.48E-07 3.79E-07 2.60E-07 1.20E-07 3.23E-08 1.06E-08 6.47E-09 4.41E-09SSW 7.11iE-06 1.44E-06 6.66E-07 3.78E-07 2.50E-07 1.03E-07 2.63E-08 9.67E-09 5.91E-09 4.06E-09SW 4.79E-06 9.65E-07 4.66E-07 2.70E-07 1.82E-07 8.03E-08 2.07E-08 6.85E-09 4.23E-09 2.93E-09
WSW 2.76E-06 5.42E-07 2.56E-07 1.52E-07 1.05E-07 5.01E-08 1.58E-08 5.84E-09 2.93E-09 1.57E-09W 1.46E-06 2.80E-07 1.22E-07 6.73E-08 4.43E-08 1.83E-08 4.93E-09 1.96E-09 1.19E-09 8.10E-10
WNW 1.34E-06 2.47E-07 9.94E-08 5.20E-08 3.32E-08 1.22E-08 3.27E-09 1.51E-09 9.12E-10 6.17E-10
NW 1.89E-06 3.51E-07 1.41E-07 7.21E-08 4.58E-08 1.66E-08 4.36E-09 2.03E-09 1.23E-09 8.41E-10NNW 2.5 1E-06 4.77E-07 2.02E-07 1.08E-07 6.79E-08 2.37E-08 5.88E-09 2.73E-09 1.66E-09 1.13E-09
R-1288497-601, Rev. 0s:\wp\ppl\Annual Report 2005.doc
60 of 95 April 12, 2006

TABLE 27. 2005 SSES ANNUAL RELATIVE CONCE TIONS 8-DAY DECAY, DEPLETED X/Q (sec/m 3 )
DATES OF LAST X/Q ACCUMULATIONARE FROM 51 1 10 TO 51231240X/Q ACCUMULATION FOR DECAYED DEPLETION SEC/M3
FOR RELEASE POINT I
Mu FS
DIRECTIONFROM .0-1 1-2 2-3 3- 4 4-5 5-10 10-20 .20-30 30-40 40-50
N 4.86E-06 8.67E-07 3.46E-07 1.76E-07 1.1OE-07 3.85E-08 9.51E-09 4.05E-09 2.29E-09 1.48E-09
NNE 7.68E-06 1.48E-06 6.38E-07 3.29E-07 2.06E-07 7.16E-08 1.76E-08 7.59E-09 4.33E-09 2.81E-09
NE 1.75E-05 3.01 E-06 1.3 1E-06 7.21E-07 4.65E-07 .1.73E-07 4.70E-08 2.07E-08 1.19E-08 7.85E-09
ENE 4.82E-05 8.11E-06 3.76E-06 2.15E-06 1.40E-06 5.17E-07 1.34E-07 5.67E-08 3.28E-08 2.18E-08
E 1.86E-05 3.15E-06 1.33E-06 7.25E-07 4.69E-07 1.77E-07 4.94E-08 2.17E-08 1.25E-08 8.16E-09
ESE 9.60E-06 1.72E-06 7.52E-07 4.06E-07 2.61E-07 9.83E-08 2.43E-08 9.29E-09 5.33E-09 3.48E-09
SE 1.05E-05 1.94E-06. 8.56E-07 4.66E-07 3.OOE-07 1.14E-07 2.54E-08 8.19E-09 4.68E-09 3.04E-09
SSE 7.45E-06 1.34E-06 5.72E-07 3.10E-07 2.03E-07 8.21E-08 1.93E-08 6.03E-09 3.44E-09 2.24E-09S 5.79E-06 1.13E-06 5.31E-07 2.99E-07 1.99E-07 8.65E-08 2.15E-08 6.50E-09 3.72E-09 2.42E-09
SSW 6.51E-06 1.23E-06 5.44E-07 2.97E-07 1.91E-07 7.42E-08 1.73E-08 5.78E-09 3.30E-09 2.15E-09
SW 4.38E-06 8.22E-07 3.80E-07 2.12E-07 1.39E-07 5.74E-08 1.35E-08 4.04E-09 2.32E-09 1.51E-09
WSW 2.53E-06 4.61E-07 2.09E-07 1.19E-07 7.98E-08 3.58E-08 1.03E-08 3.43E-09 1.60E-09 8.06E-10
W 1.34E-06 2.39E-07 9.97E-08 5.28E-08 3.37E-08 1.30E-08 3.21E-09 1.16E-09 6.53E-I0 4.19E-10
WNW 1.23E-06 2.11E-07 8.1OE-08 4.08E-08 2.52E-08 8.70E-09 2.12E-09 8.82E-10 4.92E-10 3.12E-10
NW 1.73E-06 2.98E-07 1.15E-07 5.64E-08 3.48E-08 1.18E-08 2.81E-09 1.18E-09 6.62E-10 4.22E-10
NNW 2.29E-06 4.06E-07 1.65E-07 8.43E-08 5.17E-08 1.70E-08 3.82E-09 1.61E-09 9.04E-10 5.78E-10
R- 1288497-601, Rev. 0s:\wp\ppl\Annual Report 2005.doc
61 of 95 April 12, 2006

TABLE 28. 2005 SSES ANNUAL REL 9 IVE DEPOSITION - D/Q (meters- 2)
DATES OF LAST X/Q ACCUMULATION ARE FROM 5 1 1,1 0 TO 5123124 0X/Q ACCUMULATION FOR DEPOSITION I /M2
FOR RELEASE POINT 1
MILES
DIRECTIONFROM .0-1 1-2 2-3 3-4 4-5 5-10 10-20 20-30 30-40 40-50
N 3.13E-08 4.61E-09 1.89E-09 8.97E-10 5.30E-]0 1 68E-10 4.02E-11 I1.48E-1I 7.90E-12 4.96E-12NNE 3.57E-08 5.54E-09 2.40E-09 1.14E-09 6.72E-10 2.09E-10 4.88E-1. I.80E-II 9.60E-12 6.03E-12NE 4.11 E-08 6.20E-09 2.65E-09 1.28E-09 7.61E-10 2.45E-10 6.01E- 11 2.21E-I I 1.18E-1 1 7.42E-12
ENE 7.13E-08 1.LIE-08 4.93E-09 2.41E-09 1.43E-09 4.51E-10 1.03E-10 3.60E-11 1.92E-11 1.21E-I1E 3.21E-08 4.70E-09 1.91E-09 9.13E-10 5.45-710 1.80E-10 4.55E-11 1.68E-11 8.94E-12 5.62E-12
ESE 2.16E-08 3.27E-09 1.39E-09 6.73E-10 4.02E-10 1.33E-10 3.03E-11 9.78E-12 5.22E-12 3.28E-12SE 3.13E-08 4.76E-09 2.08E-09 1.03E-09 6.16E-10 2.08E-10 4.33E-II 1.19E-11 6.33E-12 3.97E-12
SSE 2.67E-08 3.98E-09 1.70E-09 8.37E-10 5.1OE-10 1.83E-10 4.01E-I1 1.07E-11 5.69E-12 3.57E-12S 2.43E-08 3.89E-09 1.83E-09 9.39E-10 5.85E-10 2.27E-10 5.29E-11 1.36E-11 7.24E-12 4.55E-12
SSW 3.91E-08 5.99E-09 2.69E-09 1.36E-09 8.23E-10 2.87E-10 6.38E-11 1.82E-11 9.71E-12 6.10E-12SW 4.41E-08 7.OOE-09 3.29E-09 1.70E-09 1.05E-09 3.96E-10 8.94E-1 1 2.28E-1 I 1.22E- 11 7.64E-12
WSW 2.58E-08 3.97E-09 1.86E-09 9.94E-10 6.32E-10 2.61E-10 7.33E-11 2.12E-1I 9.27E-12 4.55E-12W 1.24E-08 1.87E-09 8.08E-10 4.03E-10 2.46E-10 8.80E-11 2.15E-11 6.73E-12 3.59E-12 2.26E-12
WNW 1.15E-08 1.67E-09 6.71E-10 3.21E-10 1.90E-10 6.17E-1I 1.52E-11 5.61E-12 3.OOE-12 1.88E-12NW 1.85E-08 2.71E-09 1.08E-09 5.05E-10 2.98E-10 9.47E-I1 2.27E-I1 8.36E-12 4.46E-12 2.80E-12
NNW 2.11E-08 3.13E-09 1.32E-09 6.39E-10 3.74E-10 1.14E-10 2.57E-11 9.45E-12 5.05E-12 3.17E-12
R-1288497-601, Rev. 0s:\wp\ppl\Annual Report 2005.doc
62 of 95 April 12, 2006
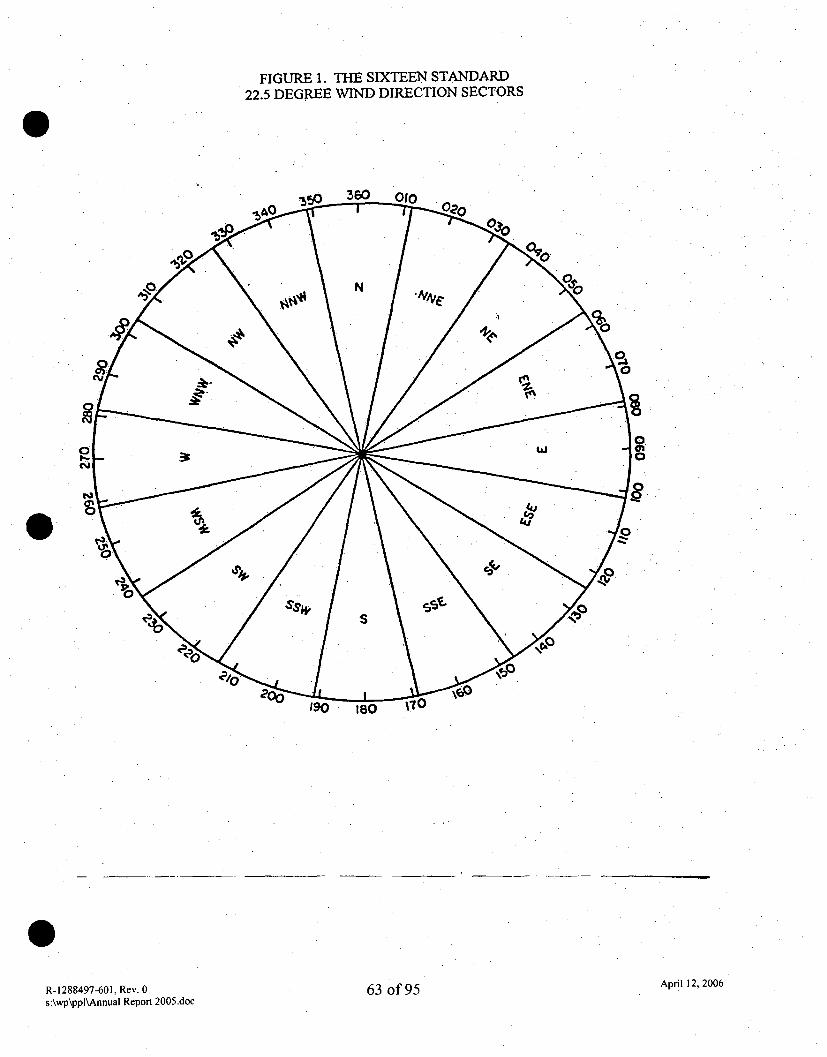
FIGURE 1. THE SIXTEEN STANDARD22.5 DEGREE WIND DIRECTION SECTORS
w In
SS s
Al f r April 12, 2006R-1288497-601, Rev. 0s:\wp\ppl\Annual Report 2005.doc
%JU J
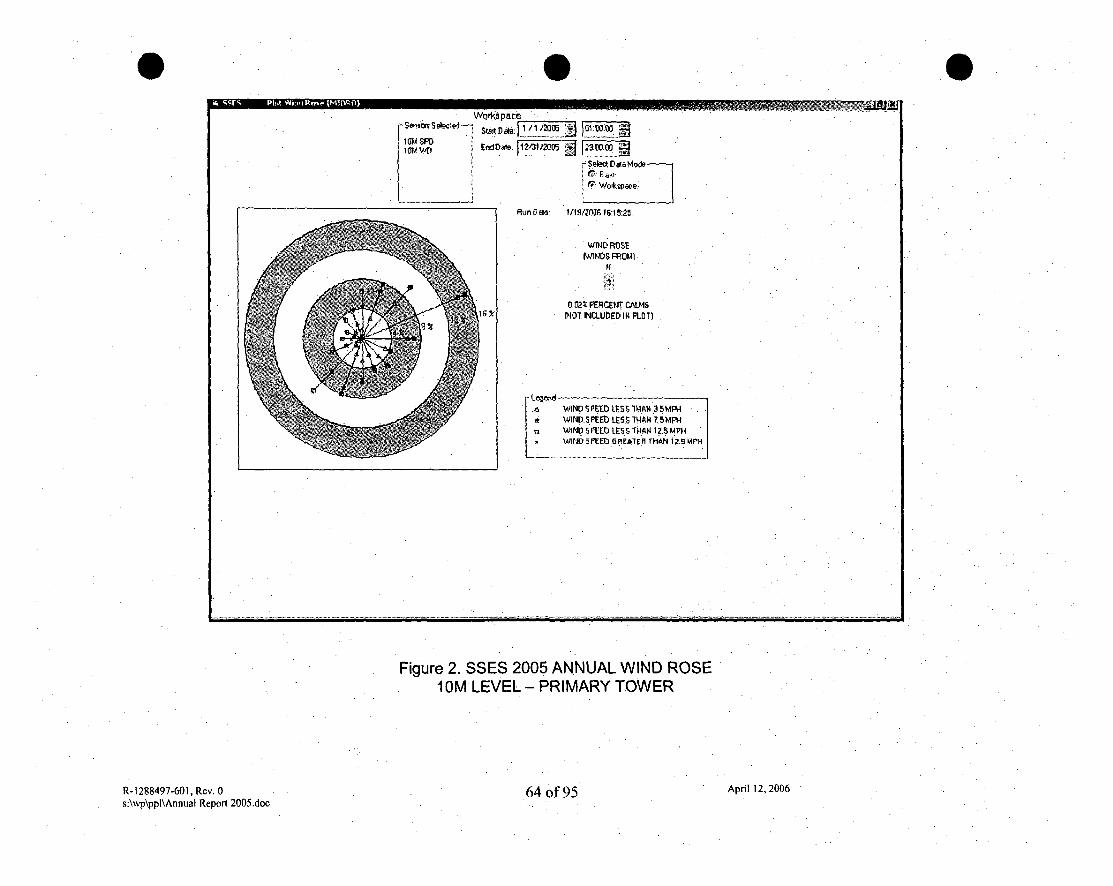
ii Uq P1,0 Weml R- IMIMI)
wow.9 Eace
1014 SF0tD
Arn~ DEW 912026G16:15:25.
V IND RO0SEWVINDS FROMIA
0.C2% PEACEJ1 CALMS
_6 WIND SPEED L.ESS 14ANI3I14' IN PEED LESS 'IHAH 7,5MPt4
u WIND SPEED LESS IAN 12.5 MP14
Figure 2. SSES 2005 ANNUAL.WIND ROSEIOM LEVEL - PRIMARY TOWER
R-1288497-601, Rev. 0s:\wp\ppl\Annual Report 2005.doc
64 of 95 April 12, 2006
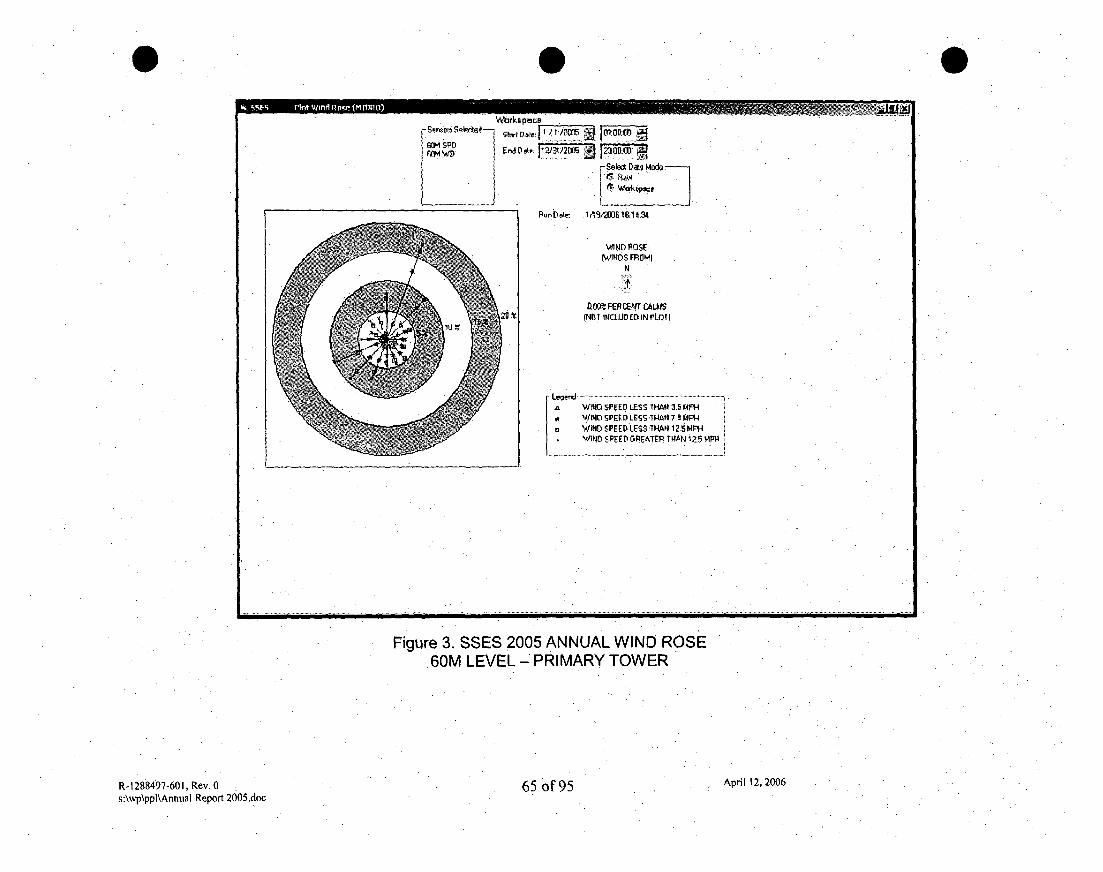
S
mm~, O~kD~.
Works Pas _______
S1V Val I -;
Rfde ~ Sa 1 Daw M&43A
$4 ND POSE
00WIEfltErT CALMS(NOT TNCIJJflED IN PLOT I
L eis WIND SPEED LESS THAN 3.5 mrPWIN, D SP.EE1 LsEsTIN 7.I 5 4P IWIND SPEED LESST4ALPI 1251*14WIND SPEED GRFALtTHA NA 1Ž5 M¶P)
Figure 3. SSES 2005 ANNUAL WIND ROSE.60M LEVEL - PRIMARY TOWER
R-1288497-601, Rev. 0 5s:\wp\ppl\Annual Report 2005.doc
65 of 95 April 12, 2006
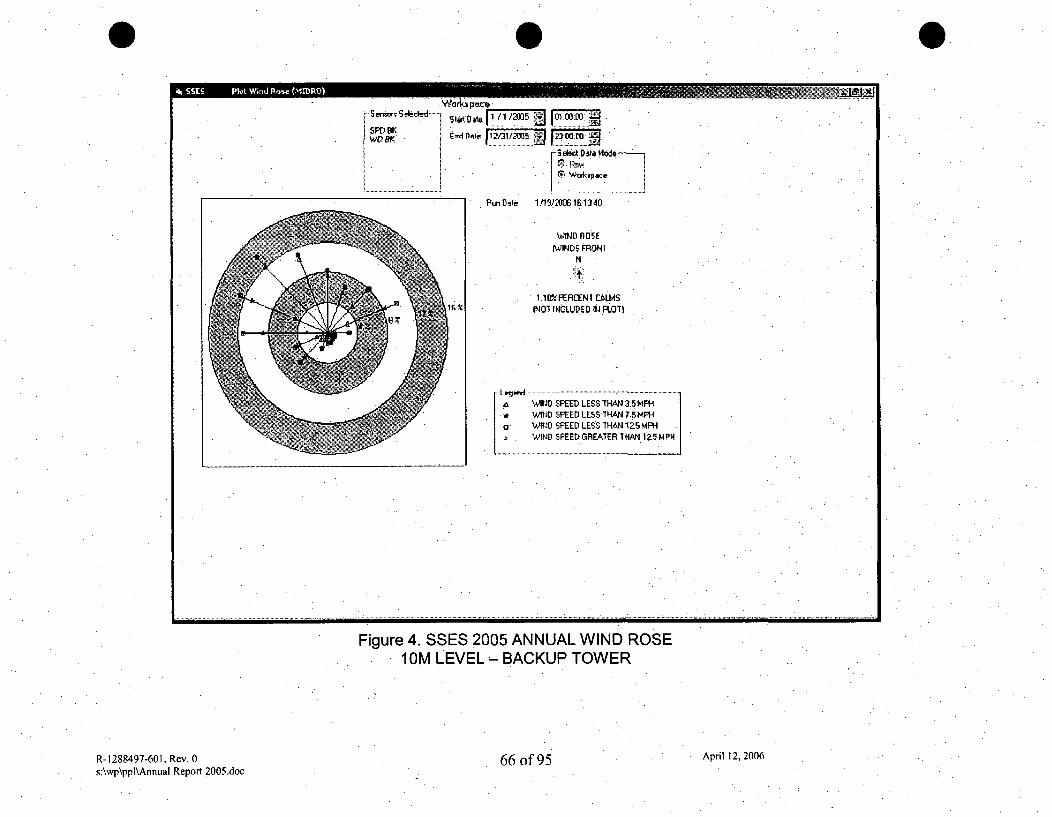
04 SSS Plt V~d Fk~e I.'O
et ra v S eLacted YýSWD rl 11 /M5 -7 FO1 -0010---ýSPD PK i . . ,wV gr En
.......... .. ....... ......S ekt Data Moder
....................... .... ... .. ....................
1119)' '016161346~
WIND RDSEP41NDS mONI
N
1.1DftERICENI CILMSNOT INICLUDED IN FLOT.
.- L ~ e ~ ... ... ... .. ........ ... .... ............................. •....... .-- ---.... ........ .. ........W ,IND SPEED LESS THAN 3,5 NFHIWIND SPEED LESS T-r•AJ 7.5 MFI I
a WIND SPEED LESS THAN 12.5 MPHWIND SFEED GREtTER THO 12.5I0PH...... ..... .. I
Figure 4. SSES 2005 ANNUAL WIND ROSE1OM LEVEL - BACKUP TOWER
R-1288497-601, Rev. 0s:\wp\ppl\Annual Report 2005.doc
66 of 95 April 12, 2006
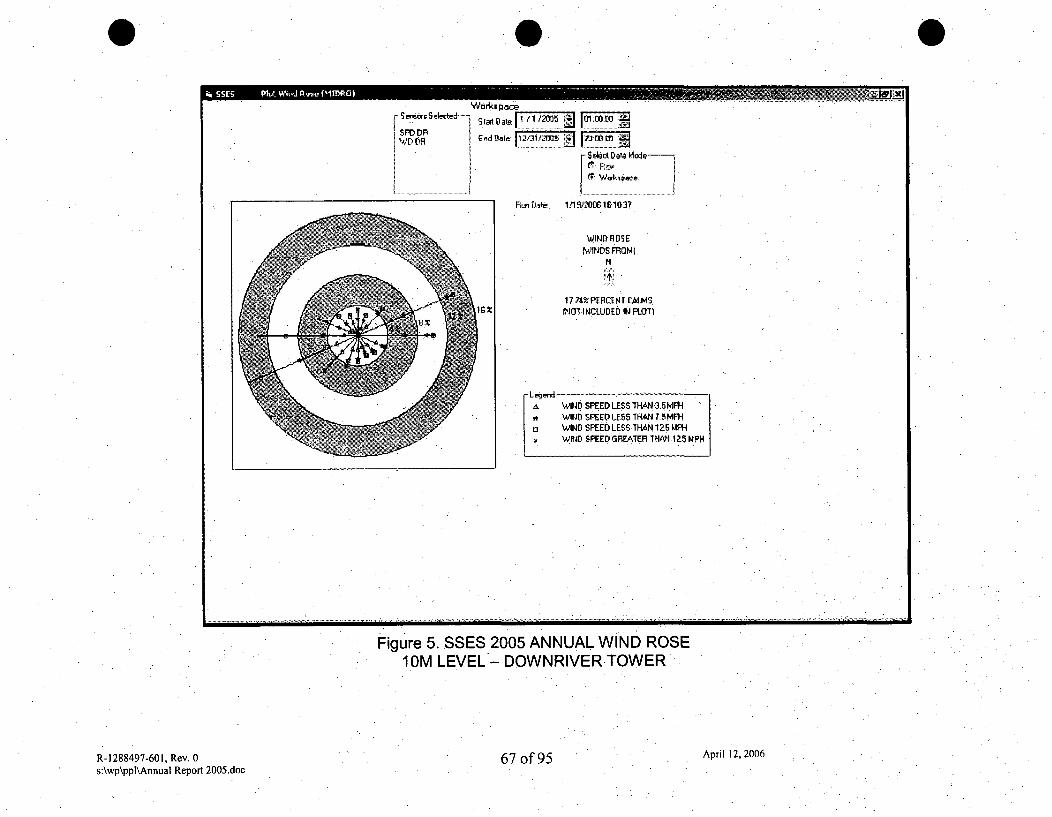
ii. SSES plut vrind Rý 01MR011 -----------
S -so 0Se ecded
SIrT, p.14)D9R
., o . . ... .. .. .... ... .
E udDaf, 121IM5 19237;G137 M
WINo ROSEIWINDS FROM I
N
17.74"PERCENT CAILMS19t (7 INOT INCLUD ED I1J FLOT1
i WIND SPEED LESS THAN 3.5 MFRWIND SPEED LESS TH4AN .5 MW-I
0 WIND SPEED LESS ITHN 1 Z5 MMIWIND SPEED GREATER THfVI 1,5 MZPH
Figure 5. SSES 2005 ANNUAL WIND ROSE10M LEVEL - DOWNRIVER TOWER
R-1288497-601, Rev. 0s:\wp\ppl\Annual Report 2005.doc
67 of 95 April 12, 2006
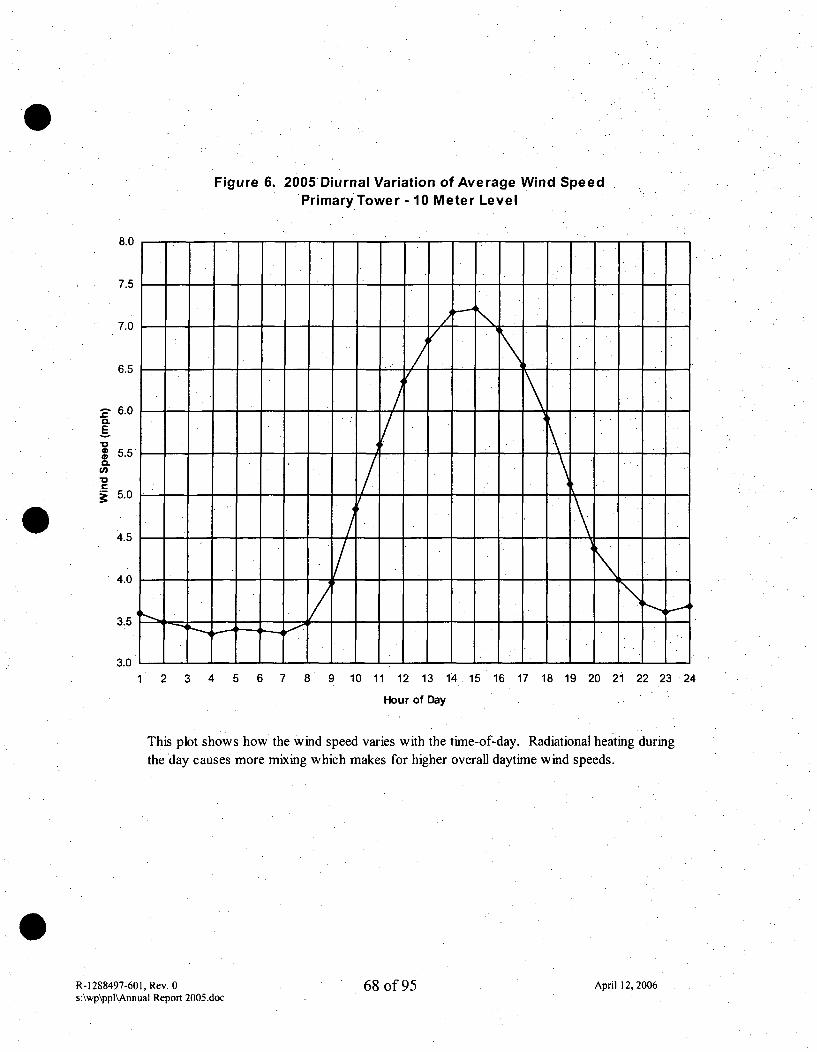
Figure 6. 2005 Diurnal Variation of Average Wind SpeedPrimary Tower- 10 Meter Level
8.0
7.5.
7.0
6.5
6 6.00.
E
4)4 5.5.'0Co
5.0
4.5
4.0
3.5
3.01 2 3 4 5 6 7 8 9 10 11 12 13 14 15 16 17 18 19 20 21 22 23 24
Hour of Day
This plot shows how the wind speed varies with the time-of-day. Radiational heating duringthe day causes more mixing which makes for higher overall daytime wind speeds.
R-1288497-601, Rev. 0s:\wp\ppl\Annual Report 2005.doc
68 of 95 April 12, 2006
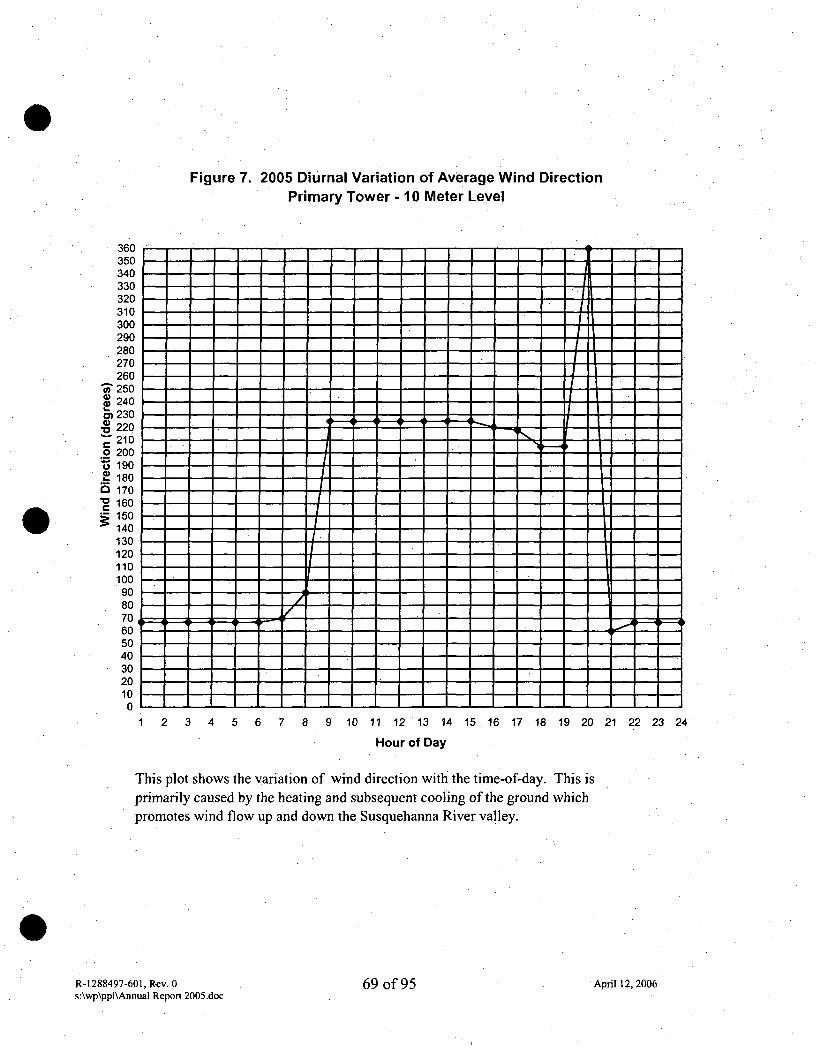
Figure 7. 2005 Diurnal Variation of Average Wind DirectionPrimary Tower - 10 Meter Level
360350340330320310300290280270260
"• 250* 2405)230-• 220
2100 200, 190i- 180O 170
160150140130120110100
9080706050403020100 1 2 3 4 5 6 7 8 9 10 11 12 13 14 15
Hour of Day
16 17 18 19 20 21 22 23 24
This plot shows the variation of wind direction with the time-of-day. This isprimarily caused by the heating and subsequent cooling of the ground whichpromotes wind flow up and down the Susquehanna River valley.
R-1288497-601, Rev. 0s:\wp\ppl\Ainual Report 2005.doc
69 of 95 Apil 12, 2006
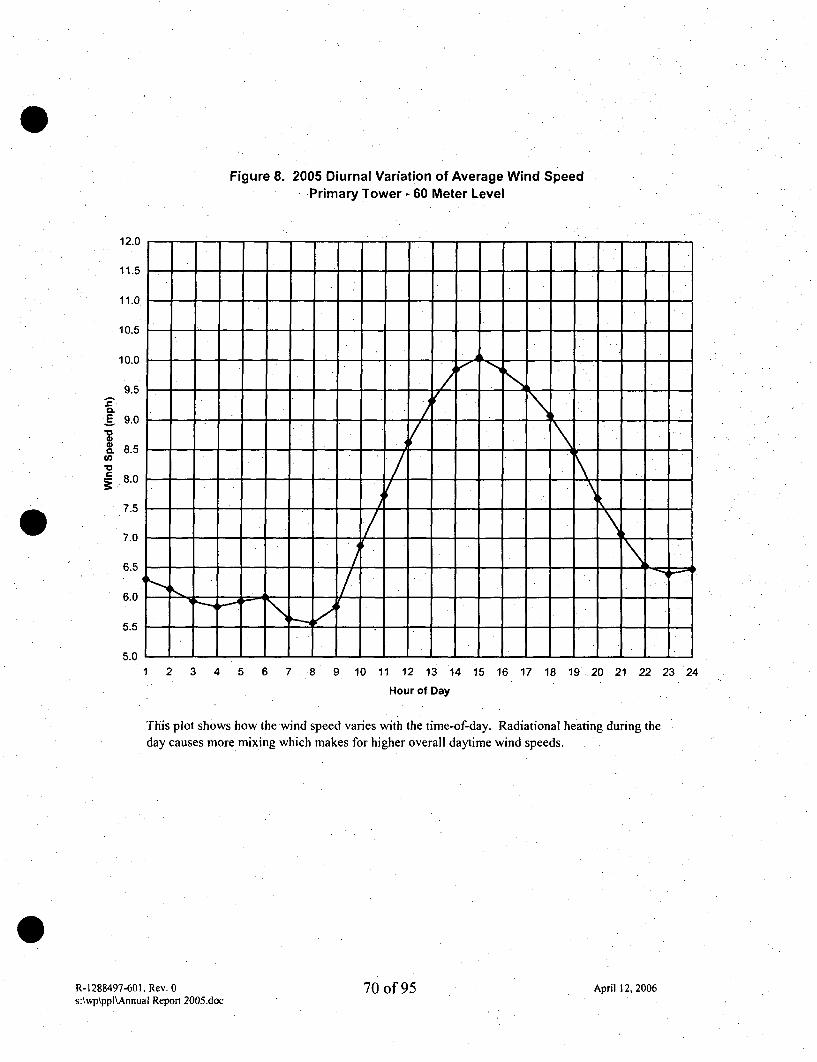
Figure 8. 2005 Diurnal Variation of Average Wind SpeedPrimary Tower - 60 Meter Level
12.0
11.5
11.0
10.5
10.0
9.52.
E 9.0"0a)'. 8.5
- 8.0
7.5
7.0
6.5
6.0
5.5
5.01 2 3 4 5 6 7 8 9 10 11 12 13 64 15 16 17 18 19 20 21 22 23 24
Hour of Day
This plot shows how the wind speed varies with the time-of-day. Radiational heating during theday causes more mixing which makes for higher overall daytime wind speeds.
R-1288497-601, Rev. 0s:\wp\ppl\Annual Report 2005.doc
70 of 95 April 12, 2006
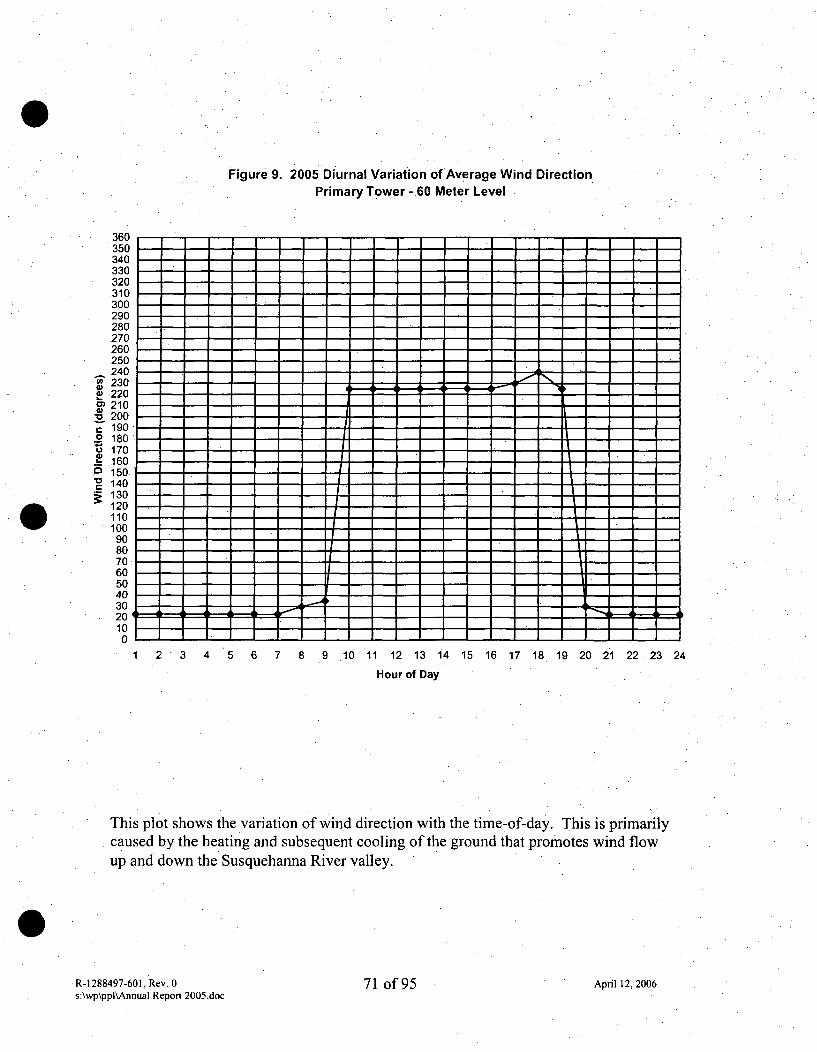
Figure 9. 2005 Diurnal Variation of Average Wind DirectionPrimary Tower -.60 Meter Level
- 360350340 -330-320
310300290 -280270260250 --0
~240-230 -P220- ---
210200190
.2 180/
=o170=-160150
140
130----120
110----100--90----80 ! -
70----605040
30102o0
2 3 4 5 6 7 8 9 10 11 12. 13 14
Hour of Day
15 16 17 18 19 20 21 22. 23 24
This plot shows the variation of wind direction with the time-of-day. This is primarilycaused by the heating and subsequent cooling of the ground that promotes wind flowup and down the Susquehanna River valley.
R-1288497-601, Rev. 0s:\wp\ppl\Annual Report 2005.doc
71 of 95 April 12, 2006
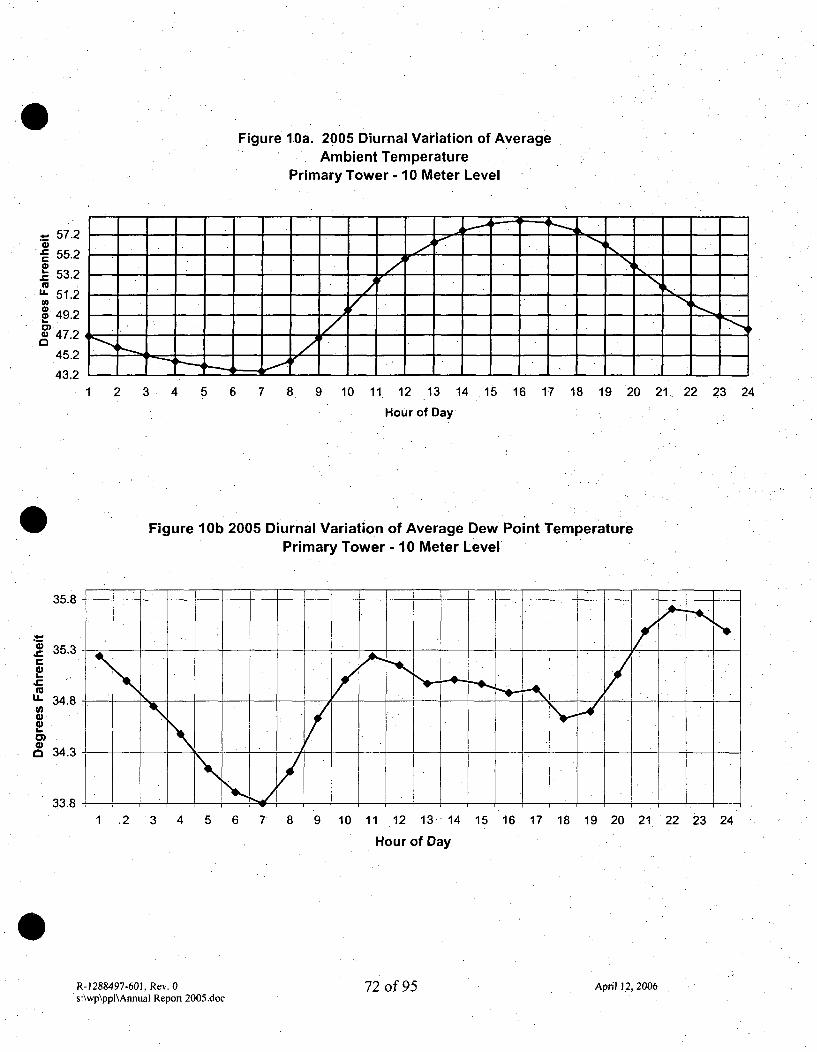
Figure 10a. 2005 Diurnal Variation of AverageAmbient Temperature
Primary Tower - 10 Meter Level
57.2
55.2
.• 53.2L. 5 1 .2
• 49.2
47.2
45.24392
4L4.......432 1 2 3 4' 5 6 7 8 9 10 11 12 13 14 15 16 17 18 19 20 21 22 23 24
Hour of Day
Figure 10b 2005 Diurnal Variation of Average Dew Point TemperaturePrimary Tower - 10 Meter Level
35.8
4' 35.3C0
4).
34
a 34.3
33.8
1 ,2 3 4 5 6 7 8 9 10 11 12 13 14 15 16 17 18 19 20 21 22 23 24
Hour of Day
R-1288497-601, Rev. 0s:\wp\ppl\Annual Repon 2005.doc
72 of 95 April 12, 2006
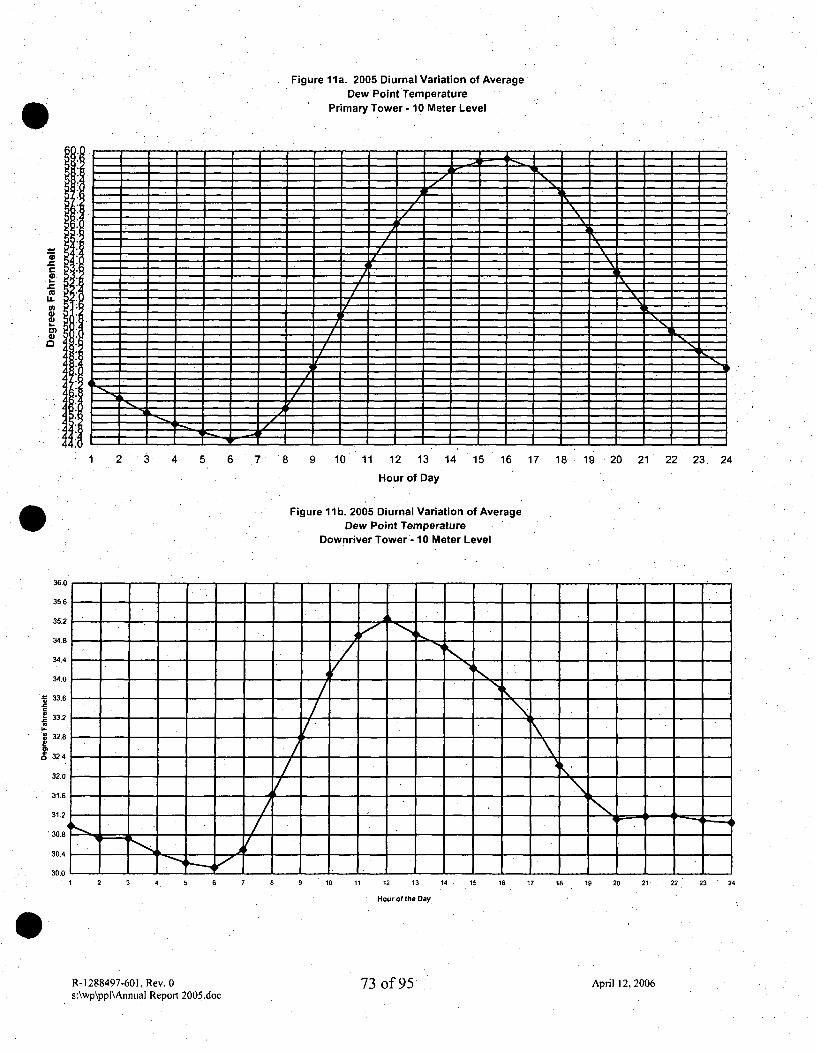
Figure Ila. 2005 Diurnal Variation of AverageDew Point Temperature
Primary Tower - 10 Meter Level
LL-
2.2.2.2.2.2.2.2.2.2.2.2.
2.
2.
2.2.2.
1 2 '3 4 5 6 7 '8 9 10 11 12 13 14 15 16 17 18 19 20 21 22 23 24
Hour of Day
Figure 1.1b. 2005 Diurnal Variation of AverageDew Point Temperature
Downriver Tower - 10 Meter Level
36.0
35.6
35:2
34.8
34.4
34.0
33.6
33.2
f 32.8
€ 32.4
32.0
31.6
31.2
308
30.4
30.0
k,
-2ý4
A
0
1 2 3 "4 5 8 7 6 9 10 11 12 13 14 15 16 17 18 19 20 21 . 22 23 24
Hour of the Day
73 of 95R-1288497-601, Rev. 0s:\wp\ppl\Annual Report 2005.doc
April 12,2006
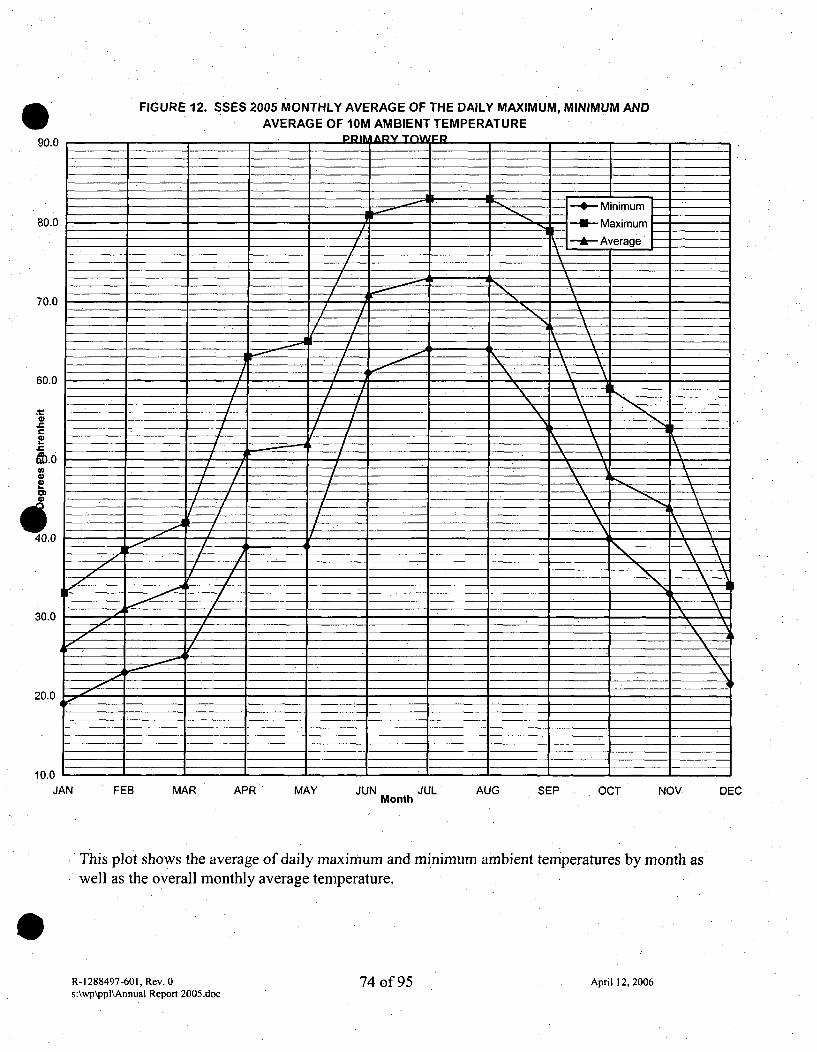
FIGURE 12. SSES 2005 MONTHLY AVERAGE OF THE DAILY MAXIMUM, MINIMUM ANDAVERAGE OF 10M AMBIENT TEMPERATURE
90.0
80.0
70.0
60.0
U)In
40.0
30.0
20.0,
10.0
T
JAN FEB MAR APR MAY JUN JUL AUG SEP OCT NOVMonth
This plot shows the average of daily maximum and minimum ambient temperatures by month aswell as the overall monthly average temperature.
R-1288497-601, Rev. 0 74 of 95 April 12, 2006s:\wp\ppl\Annual Report 2005.doc
DEC
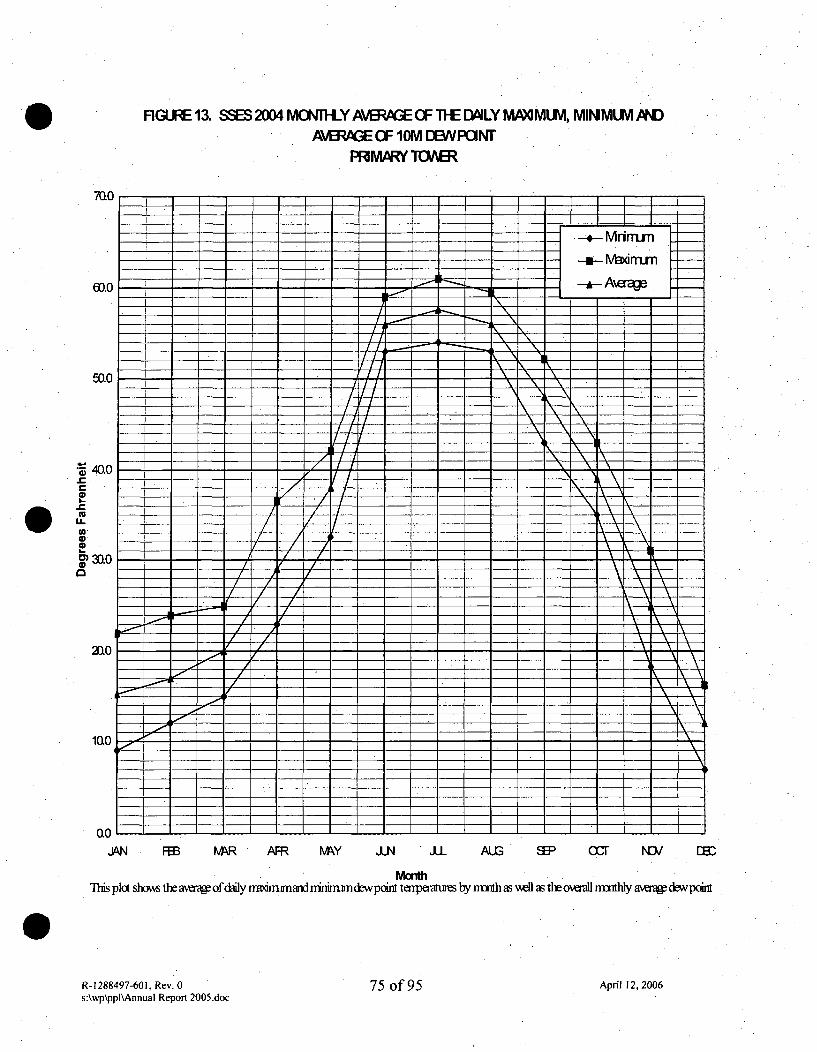
RGURE 13. SSES 2004 MONIN-LY AVERPGE OF T:E 'DLY MAMMAI, MINMUM MNDA- EAOF 1OM DB/PIFNT
PRMARY TOWER
70.0
C
LLU-
MOQ
2ao
10L
_____- -. Mrirnmm
M.-dnu-n
-i--
T--I
\
,AN FM KM AMR MY &N &L AWI SE ozr IO/ E
Month
This pklo shbom the avaa!ofdaily nwmn~and nini&w poin teaiptwAi by nmhb as vAi as the avwA ntrihl am-eug, dewponn
R-1288497-601, Rev. 0 75 of 95 April 12, 2006s:\wp\pp]\Annual Report 2005.doc
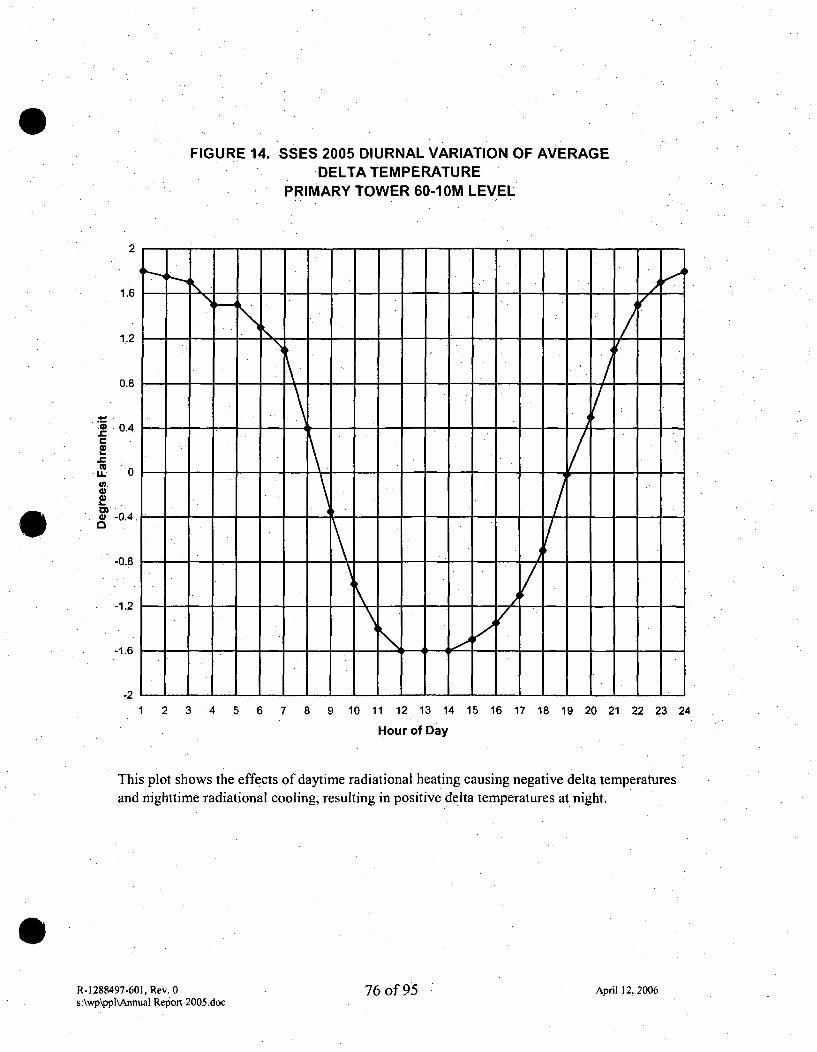
FIGURE 14. SSES 2005 DIURNAL VARIATION OF AVERAGEDELTA TEMPERATURE
PRIMARY TOWER 60-10M LEVEL
2
1.6
1.2
0.8
0.4
I..
LL 0
U).
* -0.4
-0.8
-1.2
-1.6
-21 2 3 4 5 6 7 8 9 10 11 12 13 14 15 16 17 18 19 20 21 22 23 24
Hour of Day
This plot shows the effects of daytime radiational heating causing negative delta temperaturesand nighttime radiational cooling, resulting in positive delta temperatures at night.
R-1288497-601, Rev. 0s:\wp\ppl\Annual Report 2005.doc
76 of 95 April 12, 2006
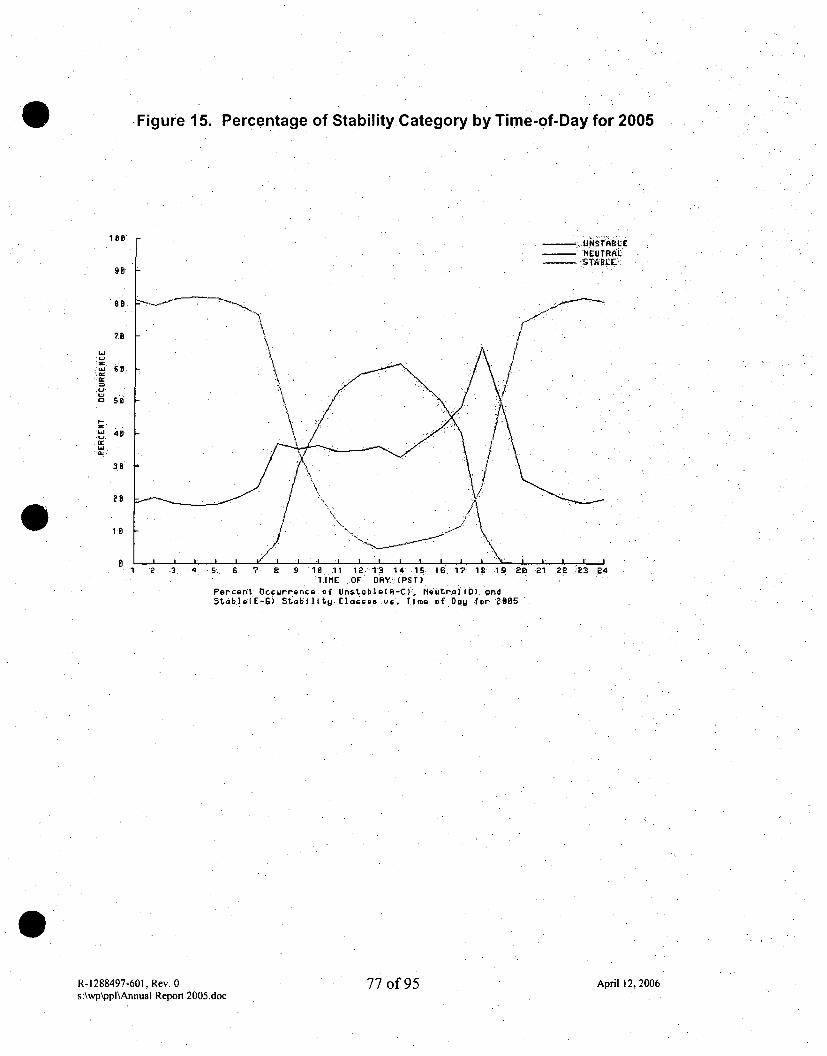
Figure 15. Percentage of Stability. Category by Time-of-Day for 2005
le1
'NEUlTRIkL
860
U
La 40ý
20
B5ý. 6 7 8 9 18 11 12.13 1ý4' 15. 16 17 1.8 19 20 21 22 213 .24
lIME OF DRY, (PST)
Percent Occurrence of Unstable(A-Ci., Neutral (DI. andStab.le(E-G) StabilitIy Claese Us. Time Df.DOW for ?,005
R-1288497-601, Rev. 0s:\wp\ppl\Annual Report 2005.doc
77 of 95 April 12, 2006
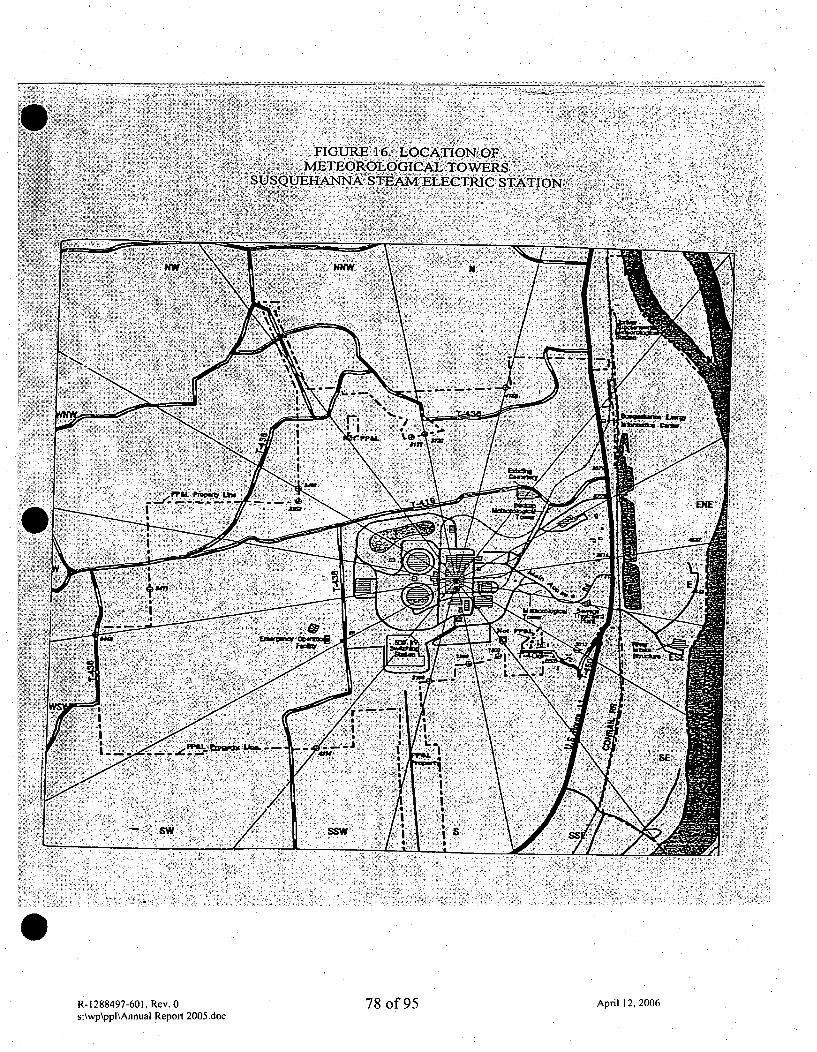
TCNT £*-%V
K, '
K,'-
7 K2 -:,-' -
-'-sw ~SSW
R-1288497-601, Rev. 0s:\wp\ppl\Annual Report 2005.doc
78 of 95 April 12, 2006
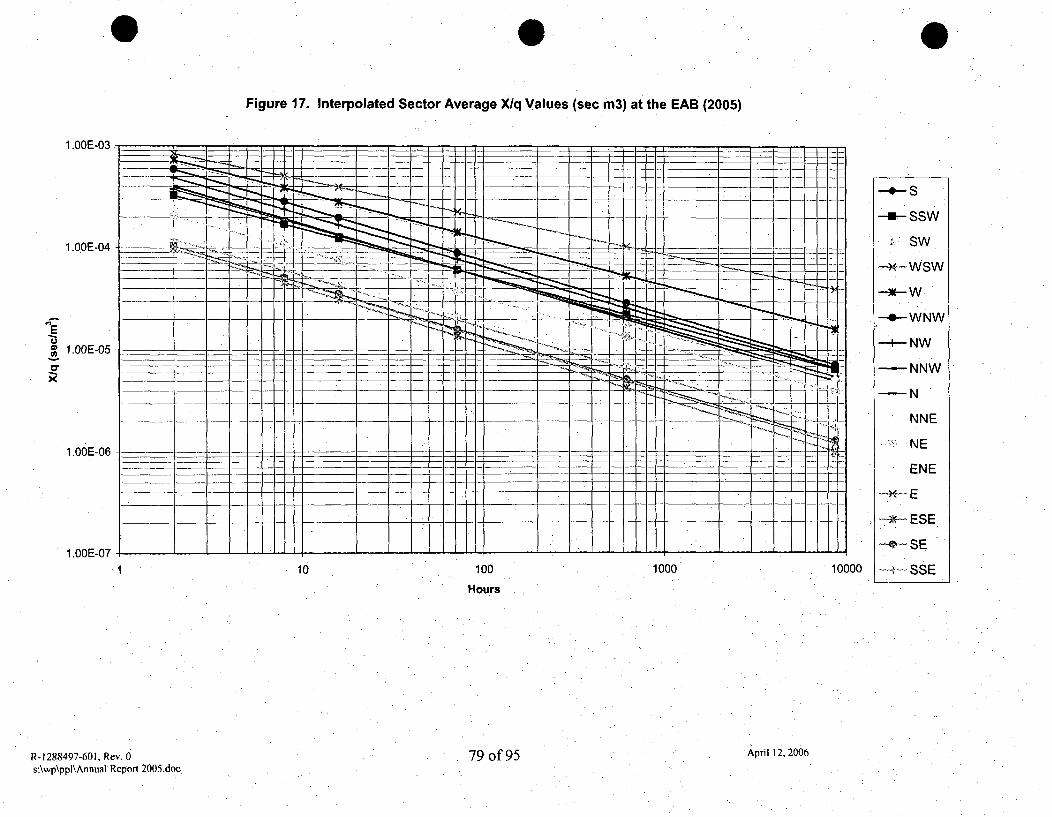
0 0
Figure 17. Interpolated Sector Average Xlq Values (sec m3) at the EAB (2005)
1.OOE-03.
1.00OE-04
e~E
, 1.00E-05
x
1 .OOE-06
1.OOE-07
-4,-S
SSW:•SW
-- x- WSW
. lW .
--.- WNW
-I-NW
-NNW
-N
NNE
NE
ENE
-3•-- E
--X--ESE
-0- SE
.. SSE1 10 100 1000
Hours
10000
R-1288497-601, Rev. 0s:\wp\ppl\Annual Report 2005.doc
79 of 95 April 12, 2006
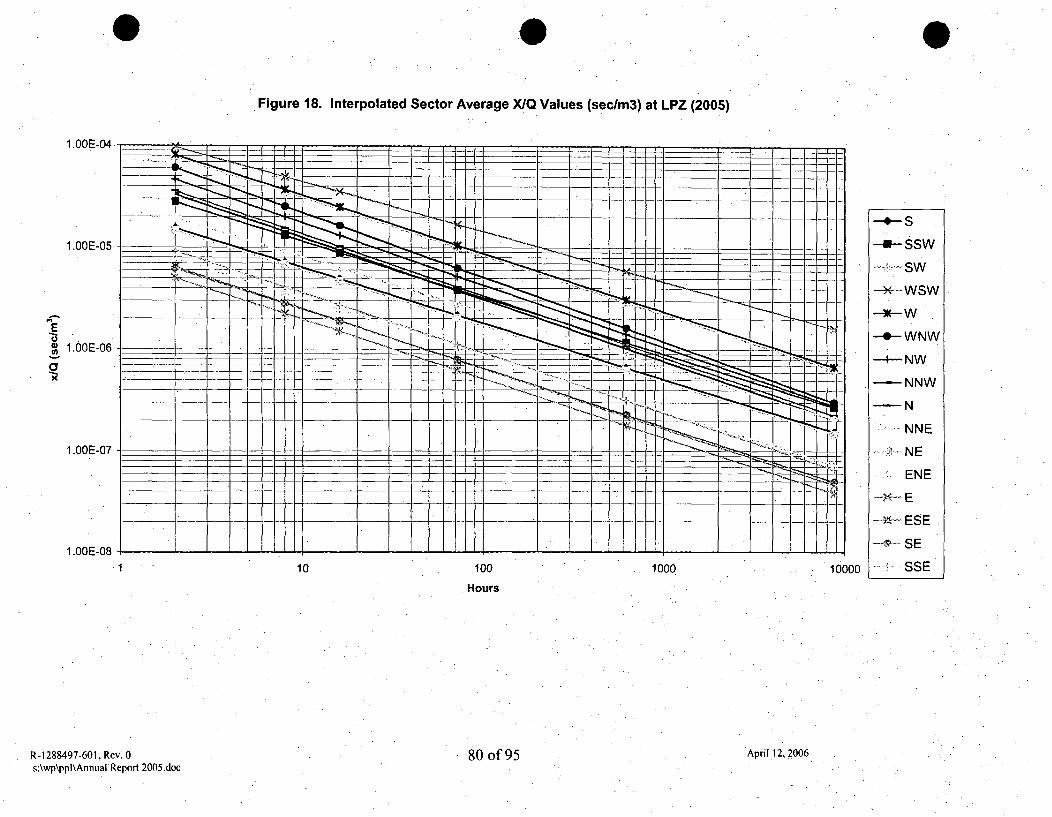
Figure 18. Interpolated Sector Average X/Q Values (seclm3) at LPZ (2005)
1 .OOE-04
1.oOE-o4 - SSW
I -' 44
-a "w',--oWN
1 .OOE07 ___._sN1.OOE-068--_. - ------- E•" •-• ._•• -4---NW
10 100-1-- 10000 -SNNW
-7 •-NNE1.00E.-07 - - - - .... ;i-,NE
.:. ENE
• --•--SE
1.00E-08 SE-1 ""10 100 1000 10000 ... " SSE
Hours
288497-601, Rev. 0 80 of 95 April 12. 2006R-Is:\wp\ppl\Annual Report 2005.doc
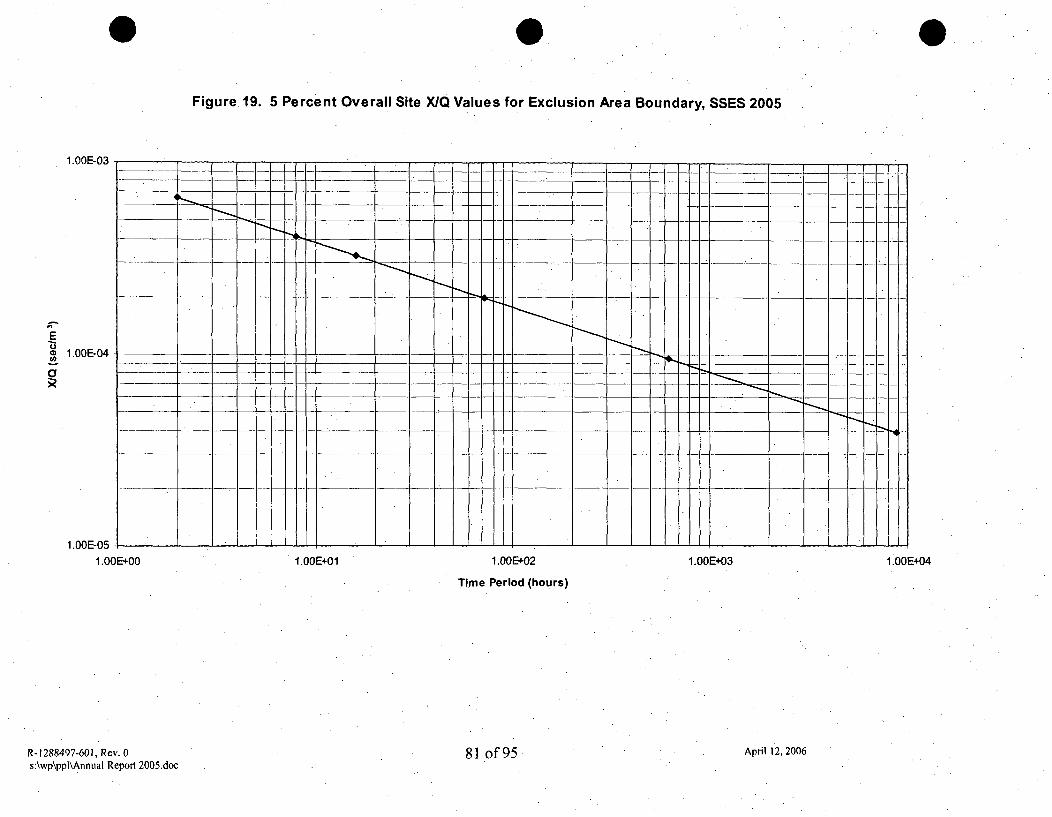
0
Figure. 19. 5 Percent Overall Site X/Q Values for Exclusion Area Boundary, SSES 2005
1.0015-03
1.OOE-04
CY3z
1.OOE-05 -1.00E+00 1.00E+01 1.00E+02 1.00E+03
Time Period (hours)
1.OOE+04
R-1288497-601, Rev. 0s:\wp\ppl\Annual Report 2005.doc
81 of 95 April 12, 2006
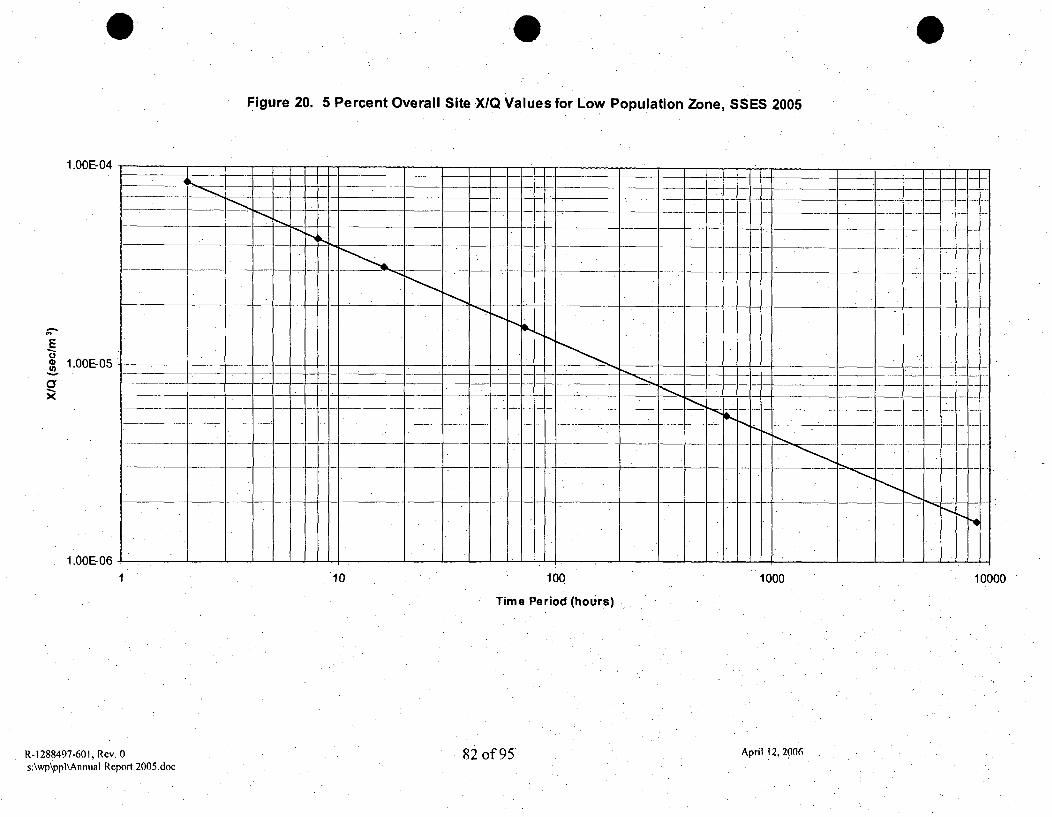
Figure 20. 5 Percent Overall Site XIQ Values for Low Population Zone, SSES 2005
1.OOE-04 _
1.00E-05
1.OOE-06 -
1 10 100 1000 10000
Time Period (hours)
88497-601, Rev. 0 82 of 95 April 12, 2006R-12s:\wp~ppl\Annual Report 2005.doc
APPENDIX A
SSES
METEOROLOGICAL INSTRUMENTATION
DESCRIPTION
R1 nf Qa; April 12, 2006R-1288497-601, Rev. 0s:\wp\ppl\Annual Report 20005.doc I...,1,.,./ VIt J,,,"
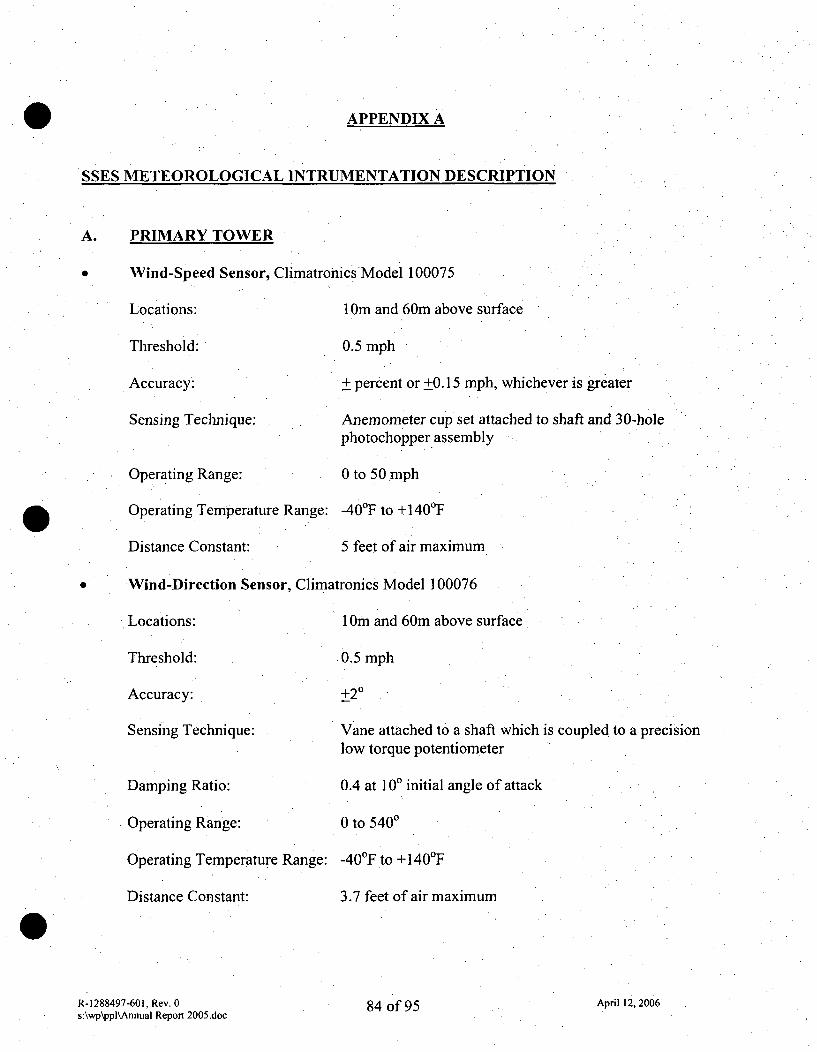
APPENDIX A
SSES METEOROLOGICAL INTRUMENTATION DESCRIPTION
A. PRIMARY TOWER
Wind-Speed Sensor, Climatronics Mode 100075
Locations: 1 Om and 60m above surface
Threshold: 0.5 mph
* Accuracy: + percent or +0.15 mph, whichever is greater
Sensing Technique: Anemometer cup set attached to shaft and 30-holephotochopper assembly
Operating Range: 0 to 50 mph
Operating Temperature Range: -40°F to +I40°F
Distance Constant: 5 feet of air maximum
'Wind-Direction Sensor, Climatronics Model 100076
Locations: I Om and 60m above surface
Threshold: 0.5 mph
Accuracy: +20
Sensing Technique: Vane attached to a shaft which is coupled to a precisionlow torque potentiometer
Damping Ratio: 0.4 at 100 initial angle of attack
Operating Range: 0 to 5400
Operating Temperature Range: -40°F to +140°F
Distance Constant: 3.7 feet of air maximum
R-1288497-601, Rev. 0 84 of 95 April 12, 2006s:\wp\ppl\Annual Report 2005.doc
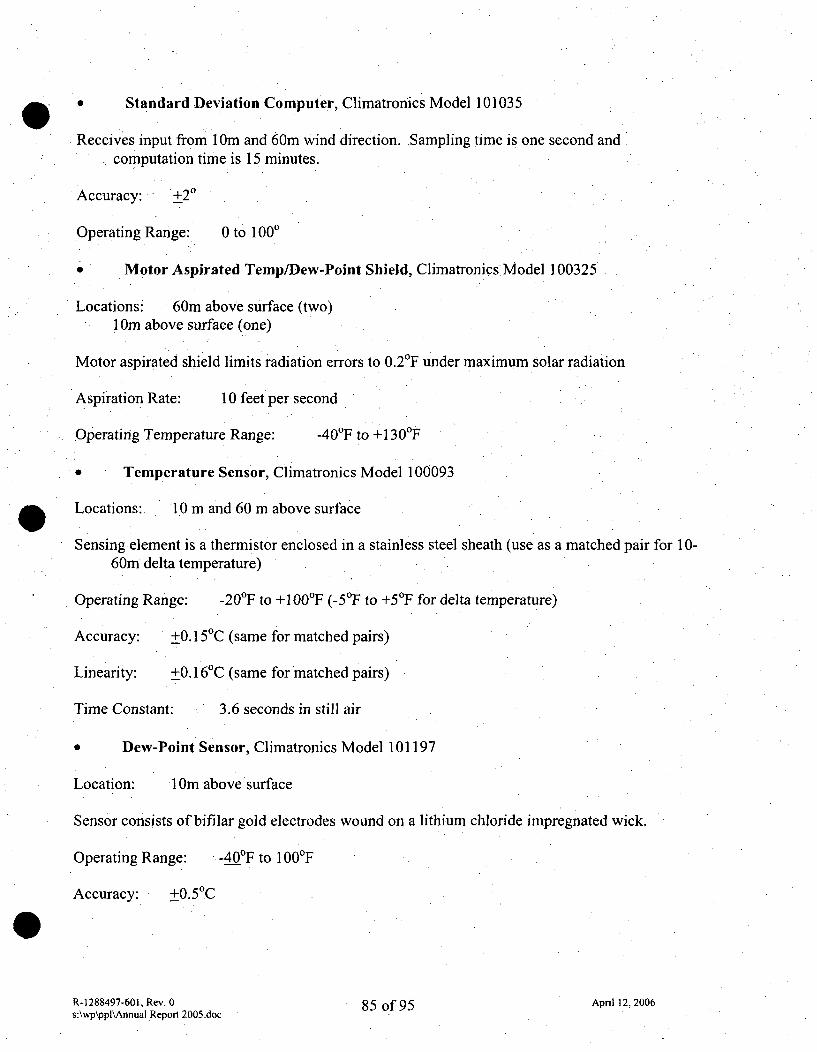
* . Standard Deviation Computer, Climatronics Model 101035
Receives input from 10m and 60m wind direction. Sampling time is one second andcomputation time is 15 minutes.
Accuracy: +20
Operating Range: 0 to 1000
0 Motor Aspirated Temp/Dew-Point Shield, Climatronics Model 100325
Locations: 60m above surface (two)10m above surface (one)
Motor aspirated shield limits radiation errors to 0.2'F under maximum solar radiation
Aspiration Rate: 10 feet per second
Operating Temperature Range: -40°F to +130°F
* Temperature Sensor, Climatronics Model 10009.3
. Locations: 10 m and 60 m above surface
Sensing element is a thermistor enclosed in a stainless steel sheath (use as a matched pair for 10-60m delta temperature)
Operating Range: -20 0 F to +100°F (-50F to +50F for delta temperature)
Accuracy: +0.1 5oC (same for matched pairs)
Linearity: +0.1 6°C (same for matched pairs)
Time Constant: 3.6 seconds in still air
* Dew-Point Sensor, Climatronics Model 101197
Location: 10m above surface
Sensor consists of bifilar gold electrodes wound on a lithium chloride impregnated wick.
Operating Range: -40_F to I 00°F
Accuracy: +0.5 0C
R-1288497-601, Rev. 0 April 12. 2006s:\wp\ppl\Annual Report 2005.doc 85 of 95

* * Rain Gauge (Heated), Climatronics Model 100097-1
A tipping bucket precipitation gauge (0.01 inches water/tip)
Location: near base of tower (approximately 650 feet MSL)
Accuraby: +1.0 percent at 3 inches per hour
* Analog Recording System
Location: control room
Analog strip chart recorders for the various measured or computed parameters
* Digital Data Acquisition System, Campbell Scientific Model 21X
Location: base of tower
Digital recording system parallels the analog recorders
R-1288497-601, Rev. 0s:\wp\ppl\Annual Report 2005.doc
86 of 95 April 12, 2006

VBBACKUP TOWER
* Wind-Speed Sensor, Climatronics Model 100075
Location: I Om above surface
Specifications: same as for primary tower
* Wind-Direction Sensor, Climatronics Model 100076
Location: 1Om above surface
Specifications- same as for primary tower
Standard Deviation Computer, Climatronics Model 101035
Accuracy: +20
Range: 0 to 1000
R-1288497-601. Rev. 0 87 of 95s:\wp\ppl\Annual Report 2005.doc
April 12, 2006
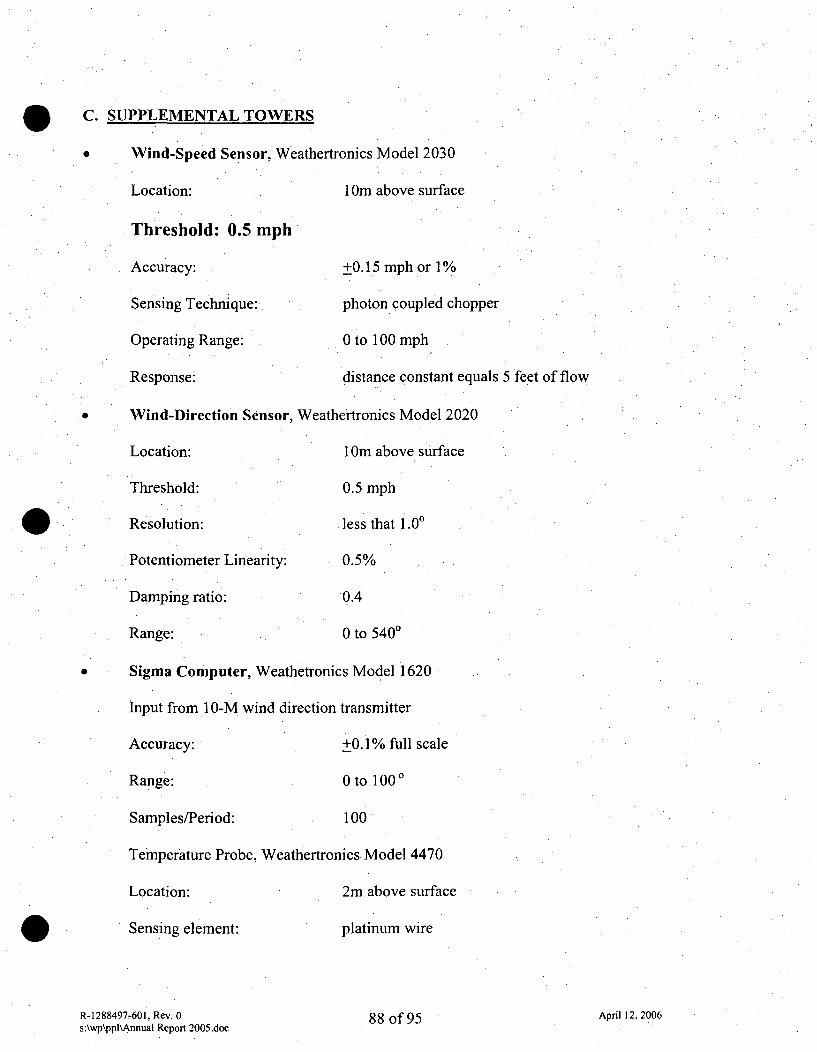
C. SUPPLEMENTAL TOWERS
* Wind-Speed Sensor, Weathertronics Model 2030
Location: 1 Om above surface
Threshold: 0.5 mph
Accuracy: +0.15 mph or 1%
Sensing Technique: photon coupled chopper
Operating Range: 0 to 100 mph
Response- distance constant equals 5 feet of flow
Wind-Direction Sensor, Weathertronics Model 2020
Location: I Om above surface
Threshold: 0.5 mph
Resolution: less that 1.00
Potentiometer Linearity: 0.5%
Damping ratio: 0.4
Range: 0 to 5400
* Sigma Computer, Weathetronics Model 1620
Input from I 0-M wind direction transmitter
Accuracy: +0.1% full scale
Range: 0 to 100 0
Samples/Period: 100
Temperature Probe, Weathertronics Model .4470
Location: 2m above surface
Sensing element:. platinum wire
R-1288497-601, Rev. 0 88 of 95s:\wp\ppl\Annual Report 2005.doc
April 12, 2006
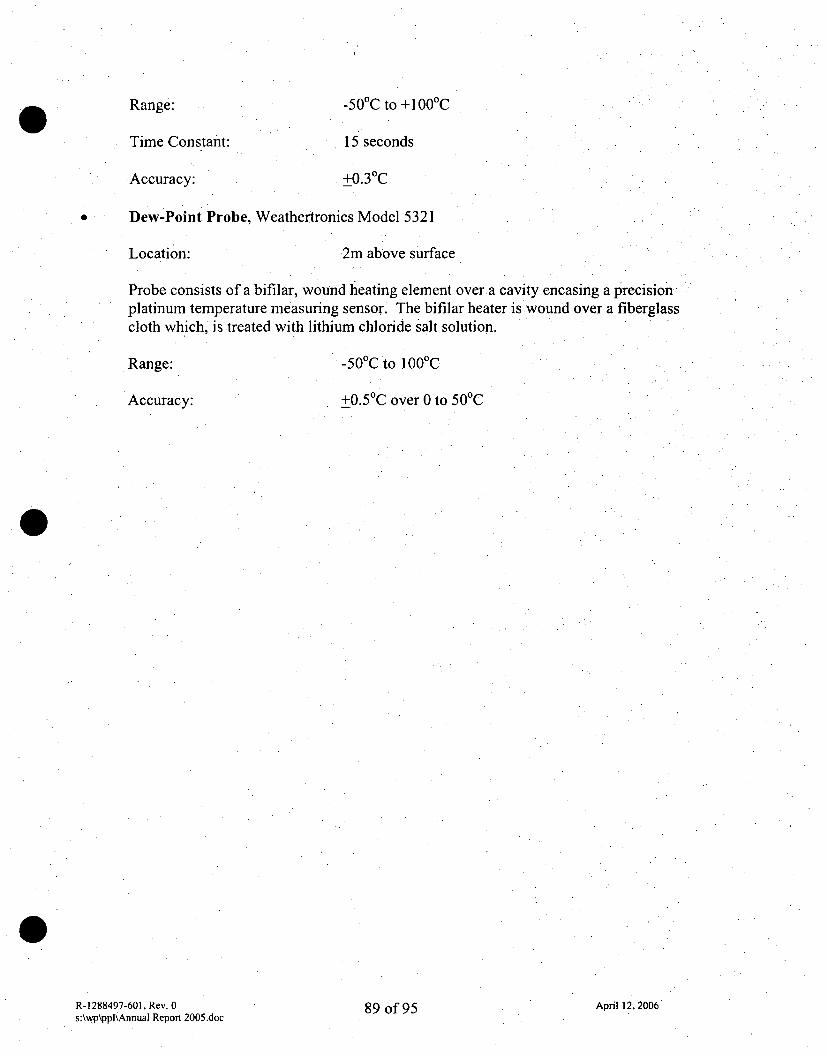
Range: -500C to +100°C
Time Constant:
Accuracy:
15 seconds
+0.3 0C
Dew-Point Probe, Weathertronics Model 5321
Location: 2m above surface
Probe consists of a bifilar, wound heating element over a cavity encasing a precisionplatinum temperature measuring sensor. The bifilar heater is wound over a fiberglasscloth which, is treated with lithium chloride salt solution.
Range: -500C to 100°C
Accuracy: +0.5 0C over 0 to 500C
R-1288497-601, Rev. 0s:\wp\ppl\Annual Report 2005.doc
89 of 95 April 12, 2006
Z•ABS Consulting
SUSQUEHANNA
STEAM ELECTRIC STATION
2006 Meteorological Summary
Submitted to
PPL Susquehanna LLC
Prepared by
ABS Consulting Inc.
Report R-1710010-701May 2007
TABLE OF CONTENTS
Page
LIST OF TABLES 4
LIST OF FIGURES 6
APPROVAL COVER SHEET 8
TABLE OF REVISIONS 9
EXECUTIVE SUMMARY 10
1.0 INTRODUCTION 12.
1.2 Input Data 12
1.2.1 Meteorological Data 12
1.3 Methodology 13
1.3.1 MIDAS Software Calculations 13
2.0 METEOROLOGY 14
2.1 Onsite Meteorological Measurements Program 142.1.1 Meteorological Towers 142.1.2 Instrumentation 152.1.3 Data Reduction 152.1.4 Data Recovery 15
2.2 Regional Climatology 15
2.3 Local Meteorology 16
2.3.1 Normal and Extreme Value of Meteorological Parameters 162.3.1.1 Wind Direction and Wind Speed 162.3 . 1.2 Temperature and Atmospheric Water Vapor 172.3.1.3 Stability 182.3.1.4 Precipitation 19
3.0 DIFFUSION ESTIMATES 20
3.1 Short-Term (Accident) Diffusion Estimates 203.1.1 Diffusion Model for 0 to 2 Hours 20
3.1.1.1 Exclusion Area Boundary and Low Population Zone 213.1.1.2 Five Percent Overall Site X/Q Values 22
R-1710010-701, Rev. 0 5/30/2007s:\wp\pp1\annrpt\SQAnnua1 Repon 2006.doc 2 of 96
3.1.2 Results of Short-Term Diffusion Estimates 22
3.2 Long-Term (Routine) Diffusion Estimates3.2.1 Atmospheric Diffusion Models
3.2.1.1 Straight-Line Airflow Model3.2.1.2 Methods of Depletion and Deposition Calculation3.2.1.3 Terrain/Recirculation Correction Factors
3.2.2 Results of Long-Term Diffusion Estimates
4.0 REFERENCES
Appendix A - SSES Meteorological Instrumentation Description
R-1710010-701, Rev. 0s:\wp\ppl\annrpt\SQAnnuaI Report 2006.doc 3 of 96
232323.242425
26
A-1
5/30/2007
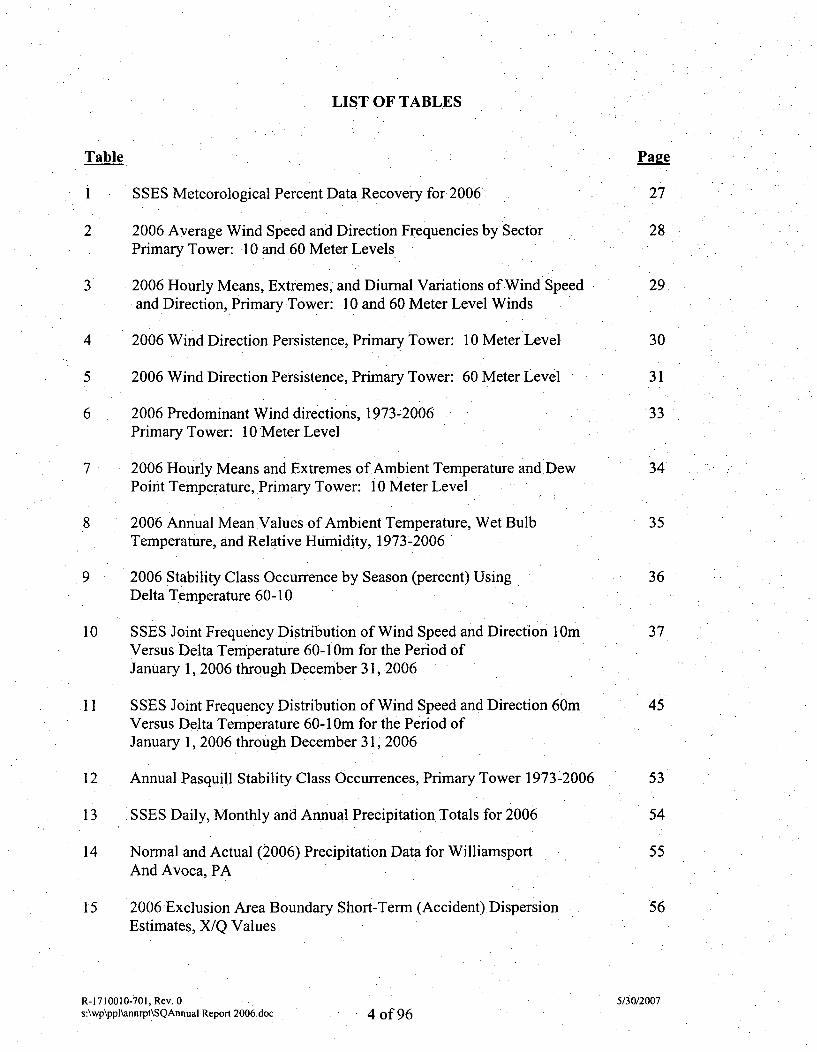
LIST OF TABLES
Table Page
I SSES Meteorological Percent Data Recovery for 2006*" 27
2 2006 Average Wind Speed and Direction Frequencies by Sector 28Primary Tower: 10 and 60 Meter Levels
3 2006 Hourly Means, Extremes, and Diurnal Variations of Wind Speed 29and Direction, Primary Tower: 10 and 60 Meter Level Winds
4 .2006 Wind Direction Persistence, Primary Tower: 10 Meter Level 30
5 2006 Wind Direction Persistence, Primary Tower: 60 Meter Level 31
6 2006 Predominant Wind directions, 1973-2006 33Primary Tower: 10 Meter Level
7 2006 Hourly Means and Extremes of Ambient Temperature and.Dew 34Point Temperature, Primary Tower: 10 Meter Level
8 2006 Annual Mean Values of Ambient Temperature, Wet Bulb 35Temperature, and Relative Humidity, 1973-2006
9 2006 Stability Class Occurrence by Season (percent) Using 36Delta Temperature 60-10
10 SSES Joint Frequency Distribution of Wind Speed and Direction lOiM 37Versus Delta Temperature 60-1 Om for the Period ofJanuary 1, 2006 through December 31, 2006
11 SSES Joint Frequency Distribution of Wind Speed and Direction 60m 45Versus Delta Temperature 60-1 Om for the Period ofJanuary 1, 2006 through December 31, 2006
12 Annual Pasquill Stability Class Occurrences, Primary Tower 1973-2006 53
13 SSES Daily, Monthly and Annual Precipitation Totals for 2006 54
14 Normal and Actual (2006) Precipitation Data for Williamsport 55And Avoca, PA
15 2006 Exclusion Area Boundary Short-Term (Accident) Dispersion 56Estimates, X/Q Values
R-1710010-701, Rev. 0 5/30/2007sAwp\ppNnnrpt\SQAnnua1 Report 2006.doc 4 of 96
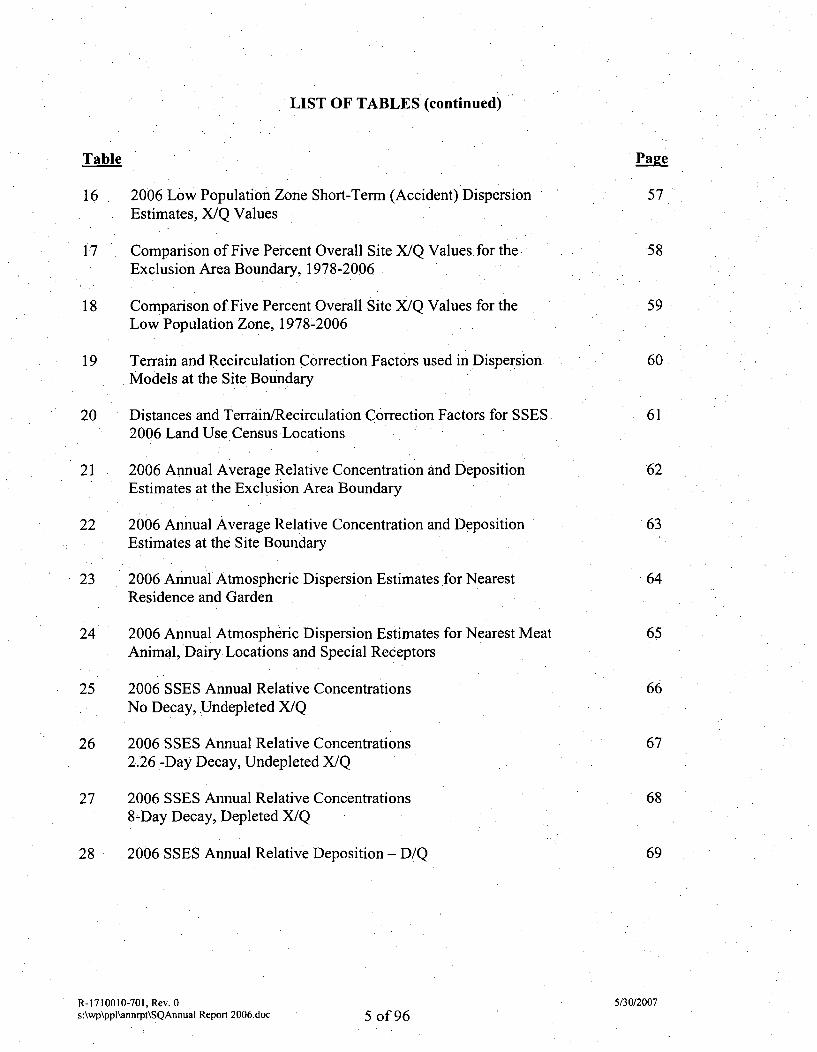
LIST OF TABLES (continued)
Table Page
16 2006 Low Population Zone Short-Term (Accident) Dispersion 57Estimates, X/Q Values
.17 Comparison of Five Percent Overall Site X/Q Values for the. 58Exclusion Area Boundary, 1978-2006
18 Comparison of Five Percent Overall Site X/Q Values for the 59Low Population Zone, 1978-2006
19 Terrain and Recirculation Correction Factors used in Dispersion 60Models at the Site Boundary
20 Distances and Terrain/Recirculation Correction Factors for SSES 612006 Land Use Census Locations
21 2006 Annual Average Relative Concentration and Deposition 62Estimates at the Exclusion Area Boundary
22 2006 Annual Average Relative Concentration and Deposition 663Estimates at the Site Boundary
23 2006 Annual Atmospheric Dispersion Estimates for Nearest 64Residence and Garden
24 2006 Annual Atmospheric Dispersion Estimates for Nearest. Meat 65Animal, Dairy Locations and Special Receptors
25 2006 SSES Annual Relative Concentrations 66No Decay, Undepleted X/Q
26 2006 SSES Annual Relative Concentrations 672.26 -Day Decay, Undepleted X/Q
27 2006 SSES Annual Relative Concentrations 688-Day Decay, Depleted X/Q
28 .2006 SSES Annual Relative Deposition - D/Q 69
R-1710010-701. Rev. 0 5/30/2007Is:\wp\ppNnnrpt\SQAnnua1 Repon 2006.doc 5 of 96
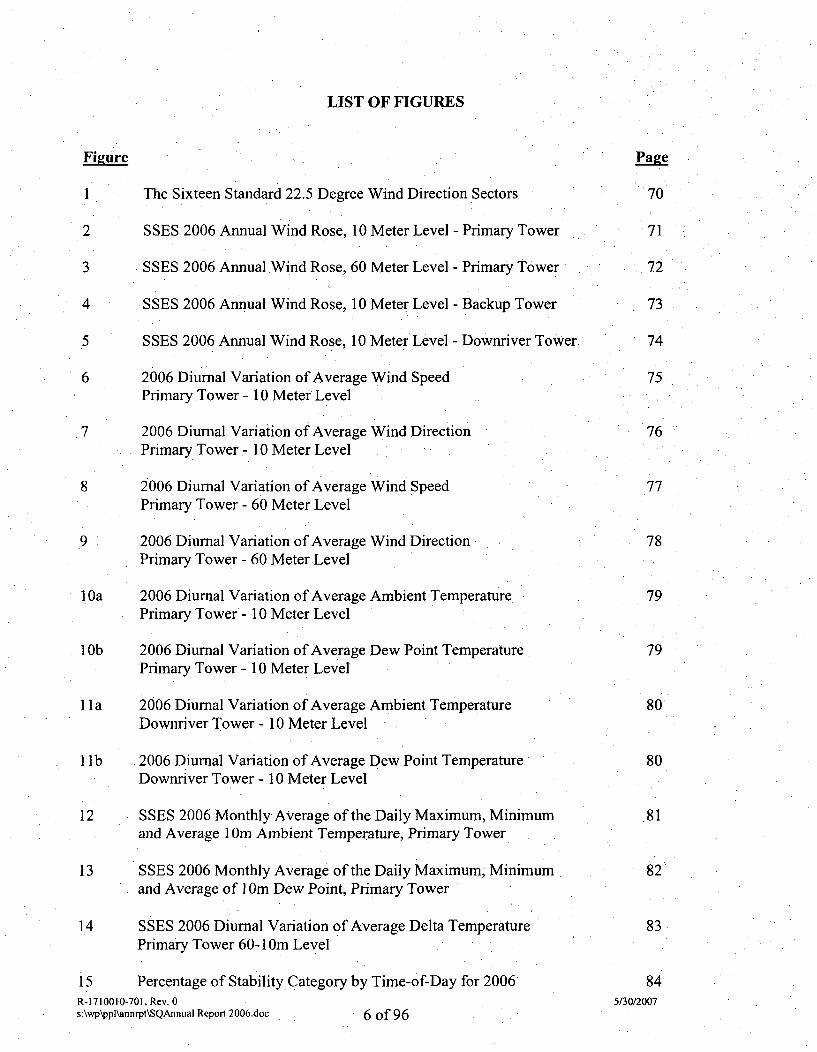
LIST OF FIGURES
Fieure Page
I The Sixteen Standard 22.5 Degree Wind Direction Sectors 70
2 SSES 2006 Annual Wind Rose, 10 Meter Level - Primary Tower 71
3 SSES 2006 Annual Wind Rose, 60 Meter Level - Primary Tower 72
4 SSES 2006 Annual Wind Rose, 10 Meter Level - Backup Tower 73
5 SSES 2006 Annual Wind Rose, 10 Meter Level - Downriver Tower. 74
6 2006 Diurnal Variation of Average Wind Speed 75Primary Tower - 10 Meter Level
•7 2006 Diurnal Variation of Average Wind Direction 76Primary Tower - 10 Meter Level
8 2006 Diurnal Variation of Average Wind Speed 77Primary Tower - 60 Meter Level
9 2006 Diurnal Variation of Average Wind Direction 78Primary Tower - 60 Meter Level
1 Oa 2006 Diurnal Variation of Average Ambient Temperature. 79Primary Tower'- 10 Meter Level
1 Ob 2006 Diurnal Variation of Average Dew Point Temperature 79Primary Tower - 10 Meter Level
1 la 2006 Diurnal Variation of Average Ambient Temperature 80Downriver Tower - 10 Meter Level
1 lb 2006 Diurnal Variation of Average Dew Point Temperature 80Downriver Tower - 10 Meter Level
12 SSES 2006 Monthly Average of the Daily Maximum, Minimum 81and Average I Om Ambient Temperature, Primary Tower
13 SSES 2006 Monthly Average of the Daily Maximum, Minimum •82and Average of I Om Dew Point, Primary Tower
14 SSES 2006 Diurnal Variation of Average Delta Temperature 83Primary Tower 60-1 Om Level
15 Percentage of Stability Category by Time-of-Day for 2006 84R-1 710010-701, Rev. 0 5/30/2007s:\wp\ppl\annrpt\SQAnnual Report 2006.doc 6 of 96
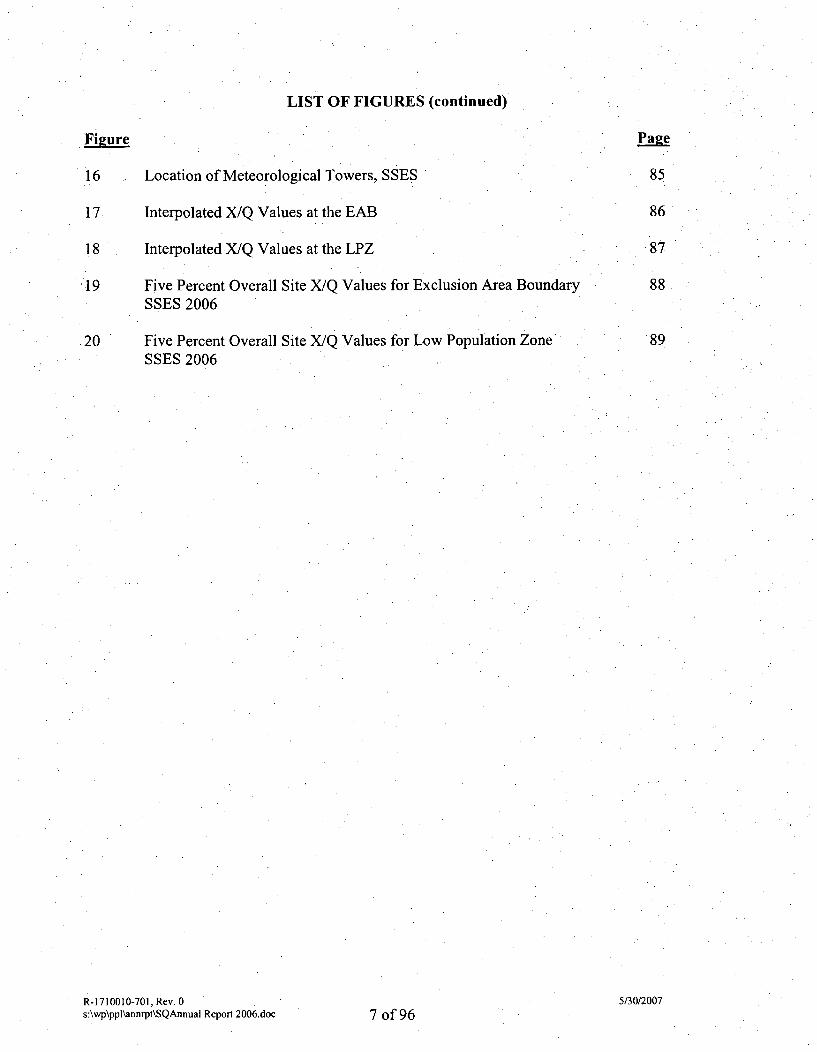
LIST OF FIGURES (continued)
Figure Pave
16 Location of Meteorological Towers, SSES 85
17 Interpolated X/Q Values at the EAB 86
18 Interpolated X/Q Values at the LPZ 87
19 Five Percent Overall Site X/Q Values for Exclusion Area Boundary 88SSES 2006
20 Five Percent Overall Site X/Q Values for Low Population Zone 89SSES 2006
R-1710010-701, Rev. 0 5/30/2007s:\wp\ppl\annrpt\SQAnnual Report 2006.doc 7 of 96
IZABS Consulting
APPROVAL COVER SHEET
Title: Susquehanna Steam Electric Station, 2006 Meteorological Summary
R-1 710010-701
PPL Susquehanna LLC
1710010
ReportNumber:
Client:
Project:
Revision Approval
Number 'Date Prepared Reviewed Approved
0 25May-2006
R-1710010-701, Rev. 0s:\wp\ppI\annrpt\SQAnnuaJ Report 2006.doc
5/30/2007
8 of 96

TABLE OF REVISIONS
Revision 0. Date: 25 May 2006
Original Issue
5/30/2007R-1710010-701, Rev. 0s:\wp\ppl\annrpt\SQAnnual Report 2006.do C 9 of 96
EXECUTIVE SUMMARY
This report summarizes the meteorological conditions at the PPL Susquehanna Steam ElectricStation (SSES) for the year 2006 The station is located in the Susquehanna Valley near thetown of Berwick, PA and the borough of Nescopeck, PA. The report will provide summaries forseveral meteorological parameters as measured at the primary meteorological tower located onthe SSES site. Additionally, the report will provide atmospheric dispersion estimates of relativeconcentrations of radionuclides (X/Q) for several offsite areas. These dispersion estimates werederived using the XDCALC and WINDOW programs which follow the Nuclear RegulatoryCommission (NRC) technical guidance.
Section 1 summarizes the meteorological data collection program currently in operation at SSES.Section 1.1 describes the onsite meteorological measurements program. Section 1.2 provides abrief climatological summary for the area surrounding SSES. Section 1.3 provides a summary ofthe following measured parameters: wind direction, wind speed, temperature, dew pointtemperature (a measure of atmospheric water vapor), atmospheric stability, and precipitation. In-depth tables and figures are presented to help the reader better understand the variousmeteorological conditions and the climatological environment at the station as well asPennsylvania's northern Susquehanna Valley.
An established data review quality assurance program at ABS Consulting, Inc. (ABS)substantiates the quality of data obtained from the meteorological monitoring program at the.SSES. This review includes daily interrogation, evaluation and validation of the data bymeteorologists specializing in air quality. The meteorological data are then compiled on amonthly, quarterly and annual basis. Data from the primary meteorological tower are validatedby crosschecks with data from an independent, backup meteorological tower located on theSSES site. Additional checks are made to a supplemental meteorological tower located offsite inthe Susquehanna River plain. Meteorological data from the SSES meteorological monitoringprogram are also compared to offsite meteorological data at the regional National WeatherService observing sites in Williamsport, PA and Avoca, PA. With the exception of anunderestimation of precipitation, the program data are representative of the meteorologicalconditions at the SSES site.
The NRC recommends an annual data recovery for wind direction, wind speed and atmosphericstability of at least 90 percent for a height level that represents the effluent release point. Thisrecommended recovery of 90 percent was again exceeded during 2006 with the actual recoverypercentages presented in Table 1.
Section 2 describes the long-term (routine) and short-term (accident) atmospheric dispersionestimates that were computed using onsite meteorological data for 2006. The 2006 dispersionestimates are compared to estimates from previous years that were reported in the SSES FinalSafety Analysis Report (FSAR) and subsequent annual meteorological summaries. Thedispersion estimates for 2006 are within the range of previous years. Evaluation of floodingestimates based on the years precipitation is also within the range quoted in the SSES FSAR.
R- 1710010-701, Rev. 0 5/30/2007s:\wp\ppl\annrpt\SQAnnual Report 2006.doc 10 of 96

Dispersion calculations only use the terrain/recirculation factors for the long-term calculation ofX/Qs. This was to be consistent with the regulatory position on the calculation of short-termX/Qs where recirculation factors are not used. No changes to the site boundary distancesoccurred in 2006.
This report summarizes and documents the meteorological parameters at SSES. It also serves asinput to an ongoing climatological database for the SSES site and. surrounding areas.
R-1710010-701, Rev. 0s:\wp\ppl\annrpt\SQAnnual Report 2006.doc
5/30/200711 of 96
1.1 INTRODUCTION
The purpose of this report is to provide a summary of the 2006 meteorological data at theSusquehanna. Steam Electric Station (SSES). The report uses several calculation programs fromthe Meteorological Information and Dose Assessment Software (MIDAS) suite of programs togenerate tables and figures included in the report. All of the calculations used hourlymeteorological data from SSES meteorological towers (primary and backup). The hourly*averaged data came from the onsite CR21X data loggers.
1.2 INPUT DATA
1.2.1 Meteorological Data
Meteorological data have been collected .at the SSES site since the early 1970s. At the presenttime, the meteorological system is based on a 200 ft high tower located approximately 1000 ft tothe southeast of the plant. Wind sensors are mounted at the I Om and 60m elevations on this
*tower. Vertical temperature differential is measured with redundant sensor pairs between the.0I Om and, 60m levels. Sigma theta (the standard deviation of horizontal wind direction) is
calculated from wind direction at both levels. Dew point and ambient temperature sensors arepresent at the I Om level. Precipitation is measured at ground level.
An onsite backup meteorological tower was erected in 1982. It is a 10m tower providingalternative measurements of wind speed, wind direction and sigma theta. A 10m supplementaldownriver meteorological tower is also available. This tower measures wind speed, winddirections, sigma theta, temperature and dew point.
SSES meteorological data are transmitted to the plant Control Room, Technical Support Center,and Emergency Operations Facility for emergency response availability. The data are alsotransmitted via telephone data line directly to the ABS office in Rockville, Maryland.
The onsite CR21X data loggers at SSES generated the meteorological data used in allcalculations. The data are hourly averages with the exception of the rainfall data that is the totalrainfall for the hour. These data were transmitted to ABS Consulting on a daily basis using theCampbell Scientific LoggerNet program. Once the data was received, an ABS Meteorologistreviewed it. Data were compared between tower levels and between the primary, backup anddownriver towers. When discrepancies were found bad data were edited out of the database.These periods of bad or missing data were left out of all calculations.
R-1710010-701, Rev. 0 5/30/2007s'\wp\ppl~annrpz\SQAnnuaJ Report 2006.doc 12 of 96
1.3. METHODOLOGY
1.3.1 MIDAS Software Calculations
The calculations performed for this report used MIDAS programs to generate tables and figures.All calculations used a final set of hourly meteorological data generated by ABS Consulting.The MIDAS programs used in the calculations have been previously validated in TheVerification and Validation of MIDAS (Meteorological Information and Dose AssessmentSystem), Volumes 1 and 2, December 1988 (Reference 9).
The following MIDAS programs were run to generate this report:
MIDMT Meteorological Trend PlotMIDEM - Edit Meteorological DataMIDJF - Joint Frequency Distribution TableMIDBD - Data Recovery Percentage TableMIDRO -Wind Rose PlotMIDMA - Meteorological Average Data TableXDCALC - X/Q CalculationsXQINTR - X/Q Results at Specific Locations
Long-term dispersion modeling for effluents from normal operation of SSES is done using theMIDAS system XDCALC program, a straight-line Gaussian plume model designed to estimateaverage relative concentration. The model was developed in accordance with U.S. NRCRegulatory Guide 1.111 (Reference 3). For periods when the 1 Om wind speed is calm, the actualwind direction that occurred is used.
XDCALC and the XQINTR program that interpolates X/Q values to exact locations both useterrain correction factors to account for the temporal and spatial variations in the airflow in theregion. A straight-line trajectory model assumes that a constant mean wind transports anddiffuses effluents in the direction of airflow at the release point within the entire region ofinterest. The SSES terrain correction factors were taken from SSES FSAR Table 2.3-128(Reference 5).
The WINDOW program was used for short-term diffusion estimates for 0-2 hour up to 30-dayperiods. The methodology used in WINDOW is described in NRC Regulatory Guide 1.145(1982) (Reference 4). Allowances are made for plume meander during light'winds and stableatmospheric conditions. The WINDOW methodology is distance and direction dependent.
R-1710010-701, Rev. 0 5/30/2007s:\wp\ppl\annrpt\SQAnnual Report 2006.doc 13 of 96
2.0 METEOROLOGY
2.1 ONSITE METEOROLOGICAL MEASUREMENTS PROGRAM
The onsite meteorological program is designed to provide accurate and complete meteorologicalmonitoring of the SSES site area. The program also produces accurate, summarized, hourlymeteorological data for use as input in atmospheric dispersion estimate computer programs.Onsite meteorological data are processed and analyzed by air .quality meteorologists usingstatistical computer programs. The output from these programs is then used .as input data byatmospheric dispersion estimate computer programs. Atmospheric dispersion estimates provide'valuable information to safety planners for both routine and accidental radioactive releases. Thisinformation is also used when estimating the possible consequences of hypothetical accidentscenarios. Analysis of meteorological, data provides an assessment of the diffusion patternscharacteristic to the site.
2.1.1 Meteorological Towers
In November 1972, a 300 ft steel framed primary meteorological tower was erected at the SSESsite approximately 1000 ft southeast• of the Unit 1/Unit 2 Reactor Building. Recordedmeteorological data from the tower's sensors areused to define the stability and movement ofthe layer of air into which the effluent from the facility would be released. In late June 1981, amajor modification to the primary tower was performed by moving the wind and temperaturesensors to 10 meters (33 ft) and 60 meters (197 ft). The rain gauge was left at the base of thetower. Also in 1981, a backup tower was erected to provide comparative meteorological data tothe primary tower and to serve as a secondary data source in the event of sensor failure on theprimary tower. This backup tower is used to measure wind speed and wind direction at the10-meter level. The variability of wind direction (sigma theta) is also derived at this level andcan be used to gauge atmospheric stability. The backup tower is located approximately 1600 ftnorth-northeast of the primary tower (see Figure 16). A 60-meter tower replaced the primarytower in November 2001, located about 25 ft southwest of the original tower. All of theinstrumentation from the original 300 ft. tower was transferred to the new 60m tower at the sameheights.
Two supplemental 10-meter towers were erected in 1985. In reference to their positions relativeto the SSES site, these towers were named the "upriver" tower and the "downriver" tower.Figure 16 shows the location of the upriver tower that is used for the purpose of measuring theeffects of the Susquehanna River Valley on atmospheric dispersion and transport of site airborneeffluents. Wind speed and wind direction are measured at both towers with temperature and dewpoint temperature measured at the downriver tower. Variability of wind direction is derived atthe 10-meter level at both tower locations. Meteorological data validation at the upriver towerwas terminated on October 1, 1994. No data from the upriver tower is included in this report.
R-1710010-701, Rev. 0 5/30/2007s:\wp\pp1\annrpt\SQAnnua1 Report 2006.doc 14 of 96
2.1.2 Instrumentation
New meteorological instrumentation was installed on the primary and backup towers in earlyOctober 1988. This instrumentation along with the downriver supplemental towerinstrumentation is described in Appendix A. Model numbers, sensor heights and a briefdescription of instrument characteristics are provided.
Calibration and maintenance are conducted semi-annually on the primary, backup and downrivertower systems :in accordance with the frequencies and procedures prescribed in themanufacturer's operating and maintenance manuals.
2.1.3 Data Reduction
Since April 1, 1992, the primary method of compiling the hourly meteorological data record wasby transmission of the data via telephone line from the. SSES meteorological shelters. These datanow go directly to the ABS office in .Rockville, Maryland. Prior to April 1992, data werereceived for review via electronic media from the PPL corporate computer in Allentown,Pennsylvania. This modification was made to eliminate duplication of the data (and the potentialfor error) by creating one validated meteorological database. The digital meteorological data areinspected daily by meteorologists to identify periods of questionable or missing data. Digitalmeteorological data that are questionable or missing are compared to data obtained via analogstrip charts, maintained by the PPL staff at SSES. The analog strip chart data are used to replacequestionable or missing digital data as necessary.
The meteorological parameters required by atmospheric diffusion estimate computer models arewind speed, wind direction and atmospheric stability. Atmospheric stability, is determined bymeasuring the change in temperature with respect to height at the two levels of 10 and 60 meters.The summarized hourly data are used as input to two atmospheric dispersion estimate computerprograms: the short-term (accident) atmospheric dispersion model (WINDOW) and the long-term (annual average) atmospheric dispersion model (XDCALC).
2.1.4 Data Recovery
Data recovery for all of the meteorological parameters measured at the primary, backup anddownriver towers during 2006 is included in Table 1. The joint data recovery during 2006 forthe meteorological parameters measured at the primary tower was very good with recoveries of99%. or greater for all parameters, with the exception of the I Om dew point temperature (98.6%).This is well above the 90 percent level recommended in NRC Regulatory Guide 1.23 (Reference•2).
2.2 REGIONAL CLIMATOLOGY
The regional climatology near the SSES site is profoundly influenced by the surroundingmountains and the Susquehanna River Valley, which is oriented from southwest to northeast.The topography influences the temperature, winds and precipitation amounts year round. Theprevailing westerly winds that affect Pennsylvania carry most weather systems to the SSESvicinity from the west and southwest. Precipitation is fairly evenly distributed throughout theyear; however, Atlantic coastal storms result in the heaviest rain and snowfalls during the fall,winter and spring months. Heavy rainfall occasionally affects central Pennsylvania from theR-1710010-701, Rev. 0 5/30/2007s:\wpkppl~annrpt\SQAnnuaI Report 2006.doc 15 of 96
outer fringes orremnants of Atlantic tropical storms during the summer and early fall months.The majority of summer precipitation occurs from showers and thunderstorms. Temperaturesusually range between 0 and 100 degrees Fahrenheit over the course of a year.
2.3 LOCAL METEOROLOGY
2.3.1 Normal and Extreme Values of Meteorological Parameters
2.3.1.1 Wind Direction and Wind Speed
*The wind direction classification system recommended by the NRC for annual meteorologicalsummaries are the standard sixteen 22.5 degree wind direction sectors as depicted in Figure 1.Wind directions always refer to the sector that the wind is coming from. Specifically, asouthwest wind is defined as a wind that originates from the southwest sector blowing toward thenortheast sector.
During 2006, the 10-meter wind direction with the greatest frequency was from the east-northeast sector (14% of the time) with the average wind speed from this sector of 2.4 mph. Thiswas the 22nd consecutive year that the east-northeast sector had the greatest frequency of wind.The most frequent 60-meter wind direction during 2006 was from the north-northeast sector(14.7% of the time) with the average wind speed originating from that sector of 6.0 mph. Table2 summarizes the 2006 average wind speed and wind direction frequencies at the primary towerfrom both the 10 and 60m levels.
Table 3 lists annual hourly averages for wind directions and wind speeds at the 10 and 60-meterlevels. This table clearly shows that wind speeds at night are less than daytime wind speeds. Onaverage, the daytime winds flow "up the valley" and the lighter, overnight winds flow "down thevalley." Extreme wind speeds at the SSES site usually occur with the passage of vigorous coldfronts and the subsequent onset of high pressure or during violent thunderstorms. The peakhourly average wind speed at the 10 and 60m levels during 2006 were 23.8 mph and 38.3 mph,respectively.
Tables 4 and 5 provide the 2006 wind direction persistence at the 10 and 60-meter levels. Winddirection persistence is defined as the number of consecutive hours for which the winddirection originated from the same sector. It is useful in determining predominance of winddirection at the SSES site and the probability of wind direction continuing from any given sectorfor consecutive hours. In 2006, the maximum 10-meter wind direction persistence was 16 hoursfrom the southwest sector. The maximum 60-meter wind direction persistence was 29 hours,from the west-southwest sector. From an historical perspective, the greatest periods of windpersistence at SSES site are generally from the north-northeast, east-northeast, or southwestsectors. When winds are blowing from these sectors, there is a higher than normal probabilitythat winds will continue from these sectors, especially in the nighttime hours. These tend to alsobe the predominant wind directions for east coast storms that can last for long periods of time.Figures 2 through 5 provide wind rose data at 10 and 60 meters on the primary tower, I Om on thebackup tower and I Om on the downriver tower. Wind roses display the frequency, in percent,of average wind direction and the wind speed groups from those directions. The data is alsopresented in Table 2 for the primary tower 10 and 60m levels.
R-1710010-701, Rev. 0 5/30/2007s:\wp\pp)\annrpt\SQAnnual Report 2006.doc 16 of 96
The diurnal variations of wind speed and direction at the 10 and 60-meter levels are presented inTable 3. Figures 6 through 9 provide the reader with a graphical presentation of these data.
Table 6 puts the primary tower 10-meter wind speed and direction data for 2006 into historicalperspective. During 2006 the wind direction with the greatest frequency (as measured at theprimary tower) was from the east-northeast sector. The second greatest wind direction frequencywas from the southwest sector... At the primary tower, winds from the 10-meter level havepredominated from the east-northeast sector for 24 of the past 28 years including the last 22years in a row. At the 60m level the predominate direction in 2006 was from the north-northeast.During the last 21 years the predominate wind direction has either been from thenorth-northeast or southwest
2.3.1.2 Temperature and.Atmospheric Water Vapor
Table 7 provides annual averages for each hour of the day for the ambient air temperature andthe dew point temperature from the primary tower. Figures 1Oa, lOb, 1 la and 1 lb graphicallysummarize the diurnal variation of the ambient and dew point temperatures from the primary anddownriver towers. The dew point temperature on both the primary and downriver towersfunctioned normally during most of 2006. There were some time periods when they werereading too low, particularly during periods of rainfall and when the temperatures were belowfreezing. Particularly during the second half of 2006 dew point readings from the Downrivertower were 5-10 degrees below readings on the primary tower. The lower dew point readingsfrom the downriver tower are evident in Figure 1 lb. Figures 12 and 13 show the average of thedaily maximums, minimums and averages of temperature and dew point by month.
The temperatures during 2006 were above average. The winter temperatures were about fourdegrees warmer than normal, the spring and summer were about normal and fall was slightlycoolerthan normal. There were 8 days when temperatures reached above 90'F. This was aboutaverage for any given year. During 2006, the greatest average hourly temperature of 93.6'Foccurred on August 1 and 2. The highest hourly average dew point temperature of 68.7'Foccurred on August 1. The lowest hourly average temperature of 9.9°F occurred on the morningof February 19.
Table 8 presents a summary of mean annual values of temperature, wet bulb temperature, andrelative humidity at SSES since 1973. The mean annual temperature at SSES during 2006 was51•.5°F. July 2006 was the warmest month of the year with an average temperature of 73.2'F.February was the coldest month of 2006 with an average temperature of 31 .0°F. The weatherpattern during 2006 was similar to recent years with warmer than normal winter conditions andthen normal to warm summers. There were only 19 days when the temperature failed to getabove 32°F, compared with the 27 days in a normal year. The minimum temperature for the yearof 9.9 degrees is unusually warm. During a normal year it is expected that there will be 3 to 4days with temperatures below zero. There were several prolonged warm periods during 2006.These were from May 29-31, June 17-19, July 16-21 and July 29-August 3 2006. Temperatureswere particularly cold.from January 15-17, February 18-20, February 26-28 and December 8-92006. The data used in this comparison were the 2006 SSES site data and 30-year average(1971-2000) NOAA data from Scranton-Wilkes-Barre (measured at the Avoca, PA airport).
R- 1710010-701, Rev. 0 5/30/2007s:\wp\ppl\annrpt\SQAnnuaI Report 2006.doc 17 of 96
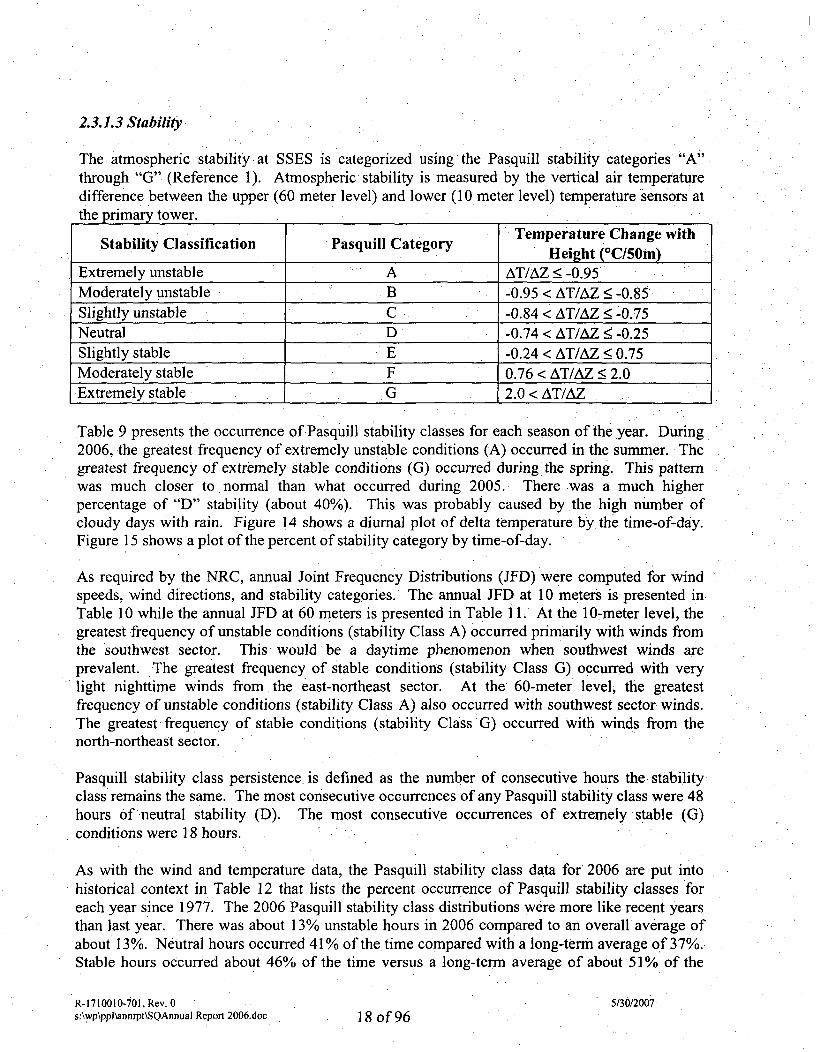
2.3.1.3 Stability
The atmospheric stability at SSES is categorized using'the Pasquill stability categories "A"through "G" (Reference 1). Atmospheric stability is measured by the vertical air temperaturedifference between the upper (60 meter level) and lower (10 meter level) temperature sensors atthe primary tower.
Temperature Change withStability Classification Pasquill Category Hem ght ChnewtHeight ('C/50!!)
Extremely unstable A AT/AZ < -0.95Moderately unstable B -0.95 < AT/AZ < -0.85Slightly unstable C -0.84< AT/AZ < -0.75Neutral D -0.74 < AT/AZ < -0.25Slightly stable E -0.24 < AT/AZ •0.75Moderately stable F 0.76 < AT/AZ:< 2.0Extremely stable G 2.0 < AT/AZ
Table 9 presents the occurrence of Pasquill stability classes for each season of the year. During2006, the greatest frequency of extremely unstable conditions (A) occurred in the summer. Thegreatest frequency of extremely stable conditions (G) occurred during the spring. This patternwas much closer to normal than what occurred during 2005. There was a much higherpercentage of "D" stability (about 40%). This was probably caused by the high number ofcloudy days with rain. Figure 14 shows a diurnal plot of delta temperature by the time-of-day.Figure 15 shows a plot of the percent of stability category by time-of-day.
As required by the NRC, annual Joint Frequency Distributions (JFD) were computed for windspeeds, wind directions, and stability categories. The annual JFD at 10 meters is presented inTable 10 while the annual JFD at 60 meters is presented in Table i1. At the 10-meter level, thegreatest frequency of unstable conditions (stability Class A) occurred primarily with winds fromthe southwest sector. This Would be a daytime phenomenon when southwest winds areprevalent. The greatest frequency of stable conditions (stability Class G) occurred with verylight nighttime winds from the east-northeast sector. At the 60-meter level, the greatestfrequency of unstable conditions (stability Class A) also occurred with southwest sector winds.The greatest frequency of stable conditions (stability Class G) occurred with winds from thenorth-northeast sector.
Pasquill stability class persistence, is defined as the number of consecutive hours the stabilityclass remains the same. The most consecutive occurrences of any Pasquill stability class were 48hours of neutral stability (D). The most consecutive occurrences of extremely stable (G)conditions were 18 hours.
As with the wind and temperature data, the Pasquill stability class data for 2006 are put intohistorical context in Table 12 that lists the percent occurrence of Pasquill stability classes foreach year since 1977. The 2006 Pasquill stability class distributions were more like recent yearsthan last year. There was about 13% unstable hours in 2006 compared to an overall average ofabout 13%. Neutral hours occurred 41% of the, time compared with a long-term average of 37%.Stable hours occurred about 46% of the time versus a long-term average of about 51% of the
R- 1710010-701, Rev. 0 5/30/2007sAývp\pp]\annrpt\SQAnnua] Report 2006.doc 18 of 96
time. Overall these are insignificant differences when considering the affect on the dispersionestimates.
2.3.1.4 Precipitation
In central Pennsylvania, the 30-year average (1971-2000) annual precipitation values range from41.59 inches in Williamsport, PA to 37.56 inches at Wilkes-Barre/Scranton Airport in Avoca,PA. The annual precipitation total during 2006 was 47.91 inches in Williamsport and 46.56inches in Avoca. The annual precipitation total as measured at the SSES site was 42.46 inches.Precipitation data was supplemented with data from the NWS for the period of September 5through October 31, 2006. The precipitation for the year started somewhat below average for thefirst five months of the year. However, the next five months were well above normal with Junerainfall being over nine inches. The last two months of the year had about average rain andsnowfall. Precipitation at SSES tends to .be lower than the NWS sites particularly in the winterbecause the snow is difficult to collect and melt, and during summer thunderstorms windblownrain may not end up in the tipping bucket. The greatest one-day total at SSES was 3.43 inches.on June 27, 2006. There were eight days with one inch or more of rain. Table 13 shows daily,monthly and annual precipitation at SSES. Table 14 shows the normal and 2006 monthly andannual precipitation totals 'at Williamsport and Avoca.
R-1710010-701, Rev. 0s:\wp\ppl\annrpt\SQAnnual Report 2006.doc
5/30/200719 of 96
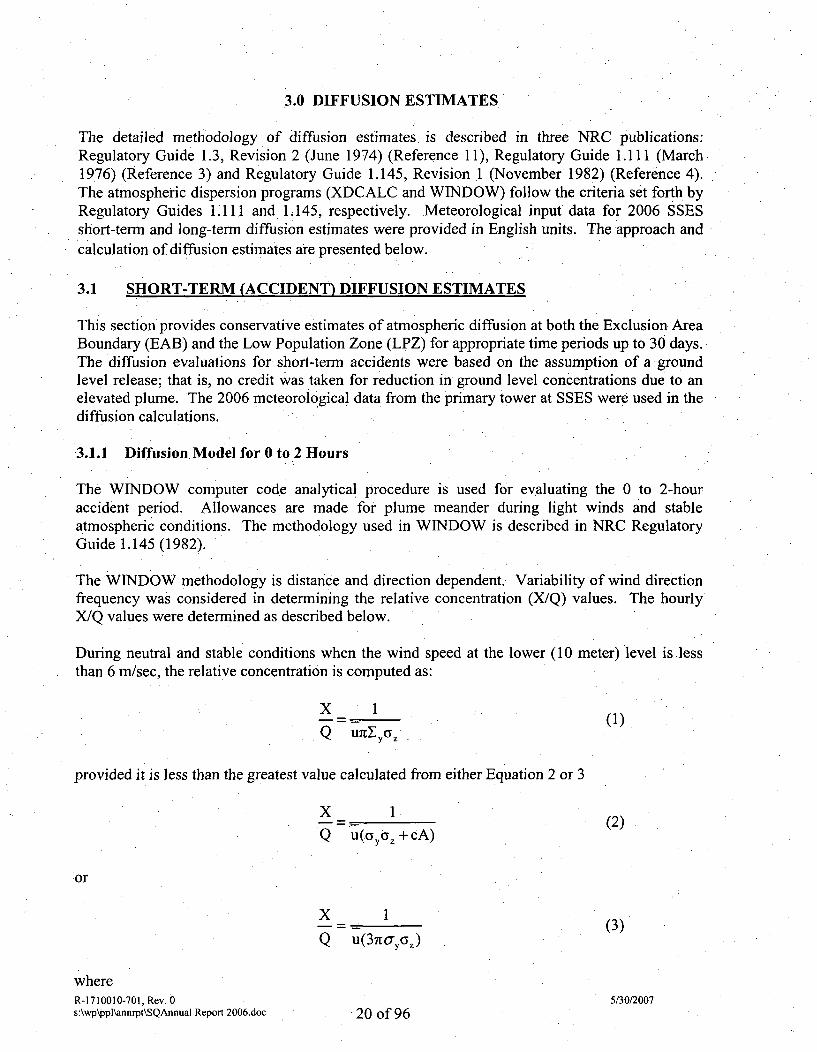
3.0 DIFFUSION ESTIMATES
The detailed methodology of diffusion estimates. is described in three NRC publications:*Regulatory Guide 1.3, Revision 2 (June 1974) (Reference 11), Regulatory Guide 1.111 (March1976) (Reference 3) and Regulatory Guide 1.145, Revision 1 (November 1982) (Reference 4).The atmospheric dispersion programs (XDCALC and WINDOW) follow the criteria set forth byRegulatory Guides 1: 11 1 and 1.145, respectively. Meteorological input data for 2006 SSESshort-term and long-term diffusion estimates were provided in English units. The approach andcalculation of diffusion estimates are presented below.
3.1 SHORT-TERM (ACCIDENT) DIFFUSION ESTIMATES
This section provides conservative estimates of atmospheric diffusion at both the Exclusion AreaBoundary (EAB) and the Low Population Zone (LPZ) for appropriate time periods up to 30 days.The diffusion evaluations for short-term accidents were based on the assumption of a groundlevel release; that is, no credit was taken for reduction in ground level concentrations due to anelevated plume. The 2006 meteorological data from the primary tower at SSES were used in thediffusion calculations.
3.1.1 Diffusion Model for 0 to 2 Hours
The WINDOW computer code analytical procedure is used for evaluating the 0 to 2-houraccident period. Allowances are made for plume meander during light winds and stableatmospheric conditions. The methodology used in WINDOW is described in NRC RegulatoryGuide 1.145 (1982).
The WINDOW methodology is distance and direction dependent. Variability of wind directionfrequency was considered in determining the relative concentration (X/Q) values. The hourlyX/Q values were determined as described below.During neutral and stable conditions when the wind speed at the lower (10 meter) level is less
than 6 m/sec, the relative concentration is computed as:
Q UREYyUZI
provided it is less than the greatest value calculated from either Equation 2 or 3
x I-- = .-- ,(2)Q U(ayaz+cA)
.or
X I-- = -'(3)Q u(3no7ya,)
whereR- 1710010-701, Rev. 0 5/30/2007s:\wp\ppl\annrpt\SQAnnual Report 2006.doc 20 of 96
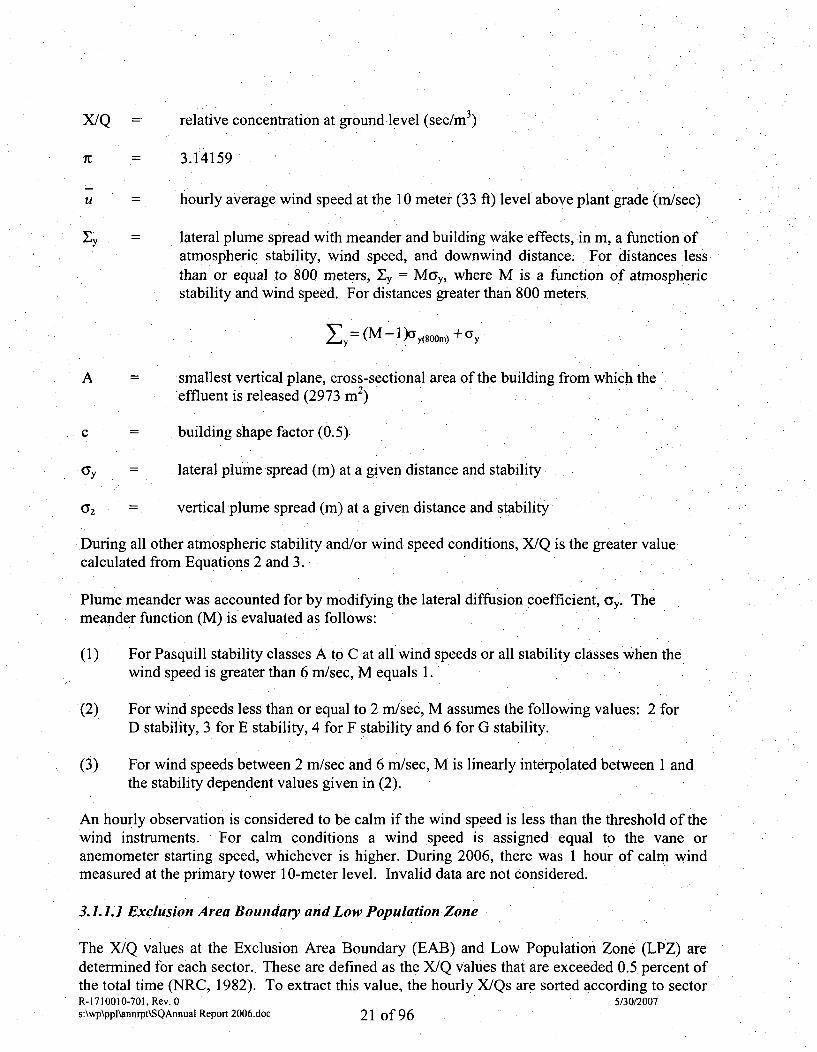
X/Q =• relative concentration at ground level (sec/m 3)
it = 3.14159
u hourly average wind speed at the 10 meter (33 ft) level above plant grade (m/sec)
=y lateral plume spread with meander and building wake effects, in m, a function ofatmospheric stability, wind speed, and downwind distance. For distances lessthan or equal to 800 meters, Xly = May, where M is a function of atmosphericstability and wind speed. For distances greater than 800 meters
y= (M - 1 )Xy(80 0m) + (Y
A = smallest vertical plane, cross-sectional area of the building from which theeffluent is released (2973 mi2 )
c = building shape factor (0.5)
( = lateral plume spread (m) at a given distance and stability
z =• vertical plume spread (m) at a given distance and stability
During all other atmospheric stability and/or wind speed conditions, X/Q is the greater valuecalculated from Equations 2 and 3.
Plume meander was accounted for by modifying the lateral diffusion coefficient, ay. Themeander function (M) is evaluated as follows:
(1) For Pasquill stability classes A to C at all wind speeds or all stability classes when thewind speed is greater than 6 m/sec, M equals 1.
(2) For wind speeds less than or equal to 2 m/sec, M assumes the following values: 2 forD stability, 3 for E stability, 4 for F stability and 6 for G stability.
(3) For wind speeds between 2 m/sec and 6 mn/sec, M is linearly interpolated between I andthe stability dependent values given in (2).
An hourly observation is considered to be calm if the wind speed is less than the threshold of thewind instruments. For calm conditions a wind speed is assigned equal to the vane oranemometer starting speed, whichever is higher. During 2006, there was 1 hour of calm windmeasured at the primary tower 10-meter level. Invalid data are not considered.
3.1.1.1 Exclusion Area Boundary and Low Population Zone
The X/Q values at the Exclusion Area Boundary (EAB) and Low Population Zone (LPZ) aredetermined for each sector.. These are defined as the X/Q values that are exceeded 0.5 percent ofthe total time (NRC, 1982). To extract this value, the hourly X/Qs are sorted according to sectorR-1710010-701, Rev. 0 5/30/2007s:\wp\ppi\annrpt\SQAnnual Report 2006.doc 21 of 96
and magnitude. A cumulative probability distribution of X/Q values can easily be constructedas:
rank of X/QP(X/Q) =(4)X/Q population size (
where P(X/Q) is the probability, of being exceeded. For example, the tenth largest value of apopulation of 100 values has a probability of being exceeded of 10/100, or 10 percent. Thegreatest of the 16 sector X/Q values is defined as the maximum sector X/Q value.
For longer averaging times, these hourly X/Q values are used to represent the 2-hour X/Q value.Sector X/Q values are then determined for the EAB and LPZ for 8, 16, 72, and 624 hours by alogarithmic interpolation, between the 2-hour X/Q value in each sector and the annual averageX/Q (see Section 3.2) at the same point. The highest of the 16 sector X/Q values are thenidentified for each time period..
3.1..2 Five Percent Overall Site X/Q Values
The X/Q values which are exceeded no more than 5 percent of the total time at the EAB and theLPZ are determined in a manner similar to the sector X/Q values. All of the hourly X/Q valuesare sorted according to magnitude (independent of direction) and the 5 percent value chosen.The 5 percent overall site X/Q values are also determined for 8, 16, 72, and 624 hours bylogarithmic interpolation between the maximum annual average X/Q value and the 2-hour5 percent overall site X/Q value.
3.1.2 Results of Short-Term Diffusion Estimates
The 0.5% sector X/Q and maximum sector X/Q values for the EAB and LPZ are given in Tables15 and 16, respectively. Figures 17 and 18 are plots at the EAB and LPZ of each of the16 direction sectors for the five (2, 8, 16, 72 and 624 hour) time periods. Tables 17 and 18present the 5 percent overall site X/Q values for the EAB and LPZ for the years 197.8 through2005. Figures 19 and 20 show the 2006 5% overall X/Q for each of the five time periods at theEAB and LPZ. The values for 8, 16, 72, and 624 hours reflect a logarithmic interpolationbetween the 2-hour sector X/Qs and the annual average X/Qs for the same sector.
R-1 710010-701, Rev. 0 5/30/2007sAwp\ppI\annrpt\SQAnnuaI Report 2006.doc 22 of 96
3.2 LONG-TERM (ROUTINE) DIFFUSION ESTIMATES
The long-term diffusion characteristics for the SSES were estimated in accordance with thecriteria set forth in NRC Regulatory Guide 1.111 (1977). The, analysis was performed using theonsite meteorological data recorded at the primary tower for January through December 2006(see Section 1.2) and the atmospheric diffusion computer model, XDCALC.
3.2.1 Atmospheric Diffusion Models
3.2.1.1 Straight-Line Airflow Model
A ground level release model based on meteorological data and plant parameters was used tocalculate the annual average atmospheric relative, concentration (X/Q) values. Depletion factorsare computed directly from depletion curves from Regulatory Guide 1.111 as the relativedeposition rates. For long-term, ground level relative concentrations, the plume is assumed todiffuse evenly over a 22.5-degree sector.
The hourly relative concentration values are calculated in the sector defined by the winddirection using the following equation:
2.032 (X/Q =---=(5)(Tux
where
X/Q = ground level relative concentration (sec/m 3)
z = vertical standard deviation of the plume (in)
u average wind speed (m/sec)
x = distance from the source (in)
However, with consideration of the turbulent wake effect, Equation 5 is revised as follows:
2.032X/Q Vo2 + cV 2/7rux (6)
Where
c = building shape factor
V - vertical height of the highest adjacent building
The wake factor (cV 2/Ir) is limited, close to the source, to a factor of 2d,2.
R-1710010-701, Rev. 0 5/30/2007sAwp\ppI\annrpt\SQAnnuaI Report 2006.doc 23 of 96
•Y V2
If ,3 < cz < + c-,the equation is
2.032X/Qro u (7)
(i.e., X/Q is calculated to be the larger of Equations 6 and 7). The. total relative concentration ateach sector and distance is then divided by the total number of hours in the database.
3.2.1.2 Methods of Depletion and Deposition Calculation
Depleted X/Q values are computed by applying the depletion factors provided in Figure 2 ofRegulatory Guide 1.111 to the calculated X/Q values. Relative deposition rates were calculatedusing the following equation:
DEP.D/Q= ' *Tf (8).
x *0.3927
where
D/Q = deposition rate at ground level (m-2)
DEPj = relative deposition rate at ground level (m1 ) for the distancej interpolated fromTable 2.2.5.5.1-3 of the MIDAS documentation (derived from Regulatory Guide1.111 curves for program XDCALC.
0.3927 = radians per 22.5 degree direction sector
x " distance from the source (in)
Tf terrain/recirculation correction factor (TCF)
3.2.1.3 Terrain/Recirculation Correction Factors
The straight-line trajectory, Gaussian diffusion model assumes that a constant mean windtransports and diffuses plume effluents in the direction of airflow at the release point within the.entire, region of interest. In other words, the wind speed and atmospheric stability at the releasepoint are assumed to determine the atmospheric dispersion characteristics in the direction of themean wind at all distances.
The PUFF model described in the SSES FSAR approximates a continuous release by dividingthe plume into a sufficient number of plume elements to represent a continuous plume. Eachplume element can be modified or advected independently according to the meteorologicalconditions (wind direction, wind speed, and atmospheric stability) of its immediate location. The
*X/Q values calculated by the PUFF model would, therefore, account for the temporal. and spatialvariations in the airflow in the site region.
R-171 10fl-701 Rev. 0 5/30/2007
s:\wp\ppNnnrpt\SQAnnual Report 2006.doc 24 of 96
The terrain/recirculation correction factors (Tf) are determined as the ratio between the puffadvection X/Q estimates and the straight-line X/Q estimates in the form:
x-(x,y)P
Tf(x,y) X (9)(x ,Y)s
QWhere
Tf(x,y) = terrain/recirculation correction factor at the point (xy)
X/Q(x,y)p the annual average relative concentration at point (x,y) using a puffadvection modeling scheme
X/Q(x,y)ý the annual average relative concentration at point (x,y) using a straight-line modeling scheme
As noted in the SSES FSAR, 1973-1976 data were used to compute the TCFs. The TCFs. for theSB are listed in Table 19. The TCFs for standard distances are available in the SSES FSAR(1978). Terrain/recirculation correction factors. and distances to the nearest residence, garden,dairy animal, and production animal in each sector are presented in Table 20.
3.2.2 Results of Long-Term Diffusion Estimates
The terrain/recirculation corrected annual average undecayed and undepleted relativeconcentration (X/Q) values calculated for the EAB and SB using the 2006 SSES meteorologicaldata are presented in Tables 21 and 22. These two tables also present the annual average 2.26-day decayed and undepleted and 8-day decayed and depleted X/Qs as well as deposition rates(D/Q). Similar calculations were also made for the nearest residences, gardens, dairy animals,production animals, and two special locations within 1 mile of the, SSES site. These calculationscan be found in Tables 23 and 24. Annual average X/Qs for standard distances in each sector arepresented in Tables 25 through 28.
R-1710010-701. Rev. 0 5/30/2007s:\wp\ppNnnrpI\SQAnnuaJ Report 2006.doc 25 of 96
4.0 REFERENCES
1. ANSI/ANS-3.11 Standard for Determining Meteorological Information at Nuclear Facilities,December 22, 2005.
2. Nuclear Regulatory Commission, Regulatory Guide 1.23,.Meteorological MonitoringPrograms For Nuclear Power Plants (March 2007, Revision 1).
3. Nuclear Regulatory Commission, Regulatory Guide 1.111, Methods for EstimatingAtmospheric Transport and Dispersion of Gaseous Effluents in Routine Releases from Light-
'Water-Cooled Reactors, 1977.
4. NuclearRegulatory Commission Regulatory Guide 1.145, Atmospheric Dispersion Modelsfor Potential Accident Consequence Assessments at Nuclear Power Plants, 1982.
5. Susquehanna Steam Electric Station FSAR, Section 2.
6. Susquehanna Steam Electric Station 2005 Meteorological Summary, January to December.2005, ABS Consulting Inc., April 2006.
7. SSES 2006 Land Use Census, Ecology 1II, Inc., SSES Environmental Laboratory,November 2006.
8. NOAA, National Climate Data Center, Local Climatological Data for Avoca, Wilkes-Barre-Scranton, PA and Williamsport, PA, 2006.
9. MIDAS Programs, Verification and Validation of MIDAS Software Volumes I and 2,December 1988.
10. Certification of Computer Program, WINDOW, Version 5.4.1, June 07, 2001.
11. Nuclear Regulatory Commission Regulatory Guide 1.3, Assumptions Used for Evaluatingthe Potential Radiological Consequences of a Loss of Coolant Accident for Boiling WaterReactors, Revision 2, June 1974.
12. Report R-1288497-0701 Program output from Window, XDCALC and Wetnes.
R-1710010-701, Rev. 0 5/30/2007s:\wp\pp1\annrpt\SQAnnua1 Report 2006.doc 26 of 96
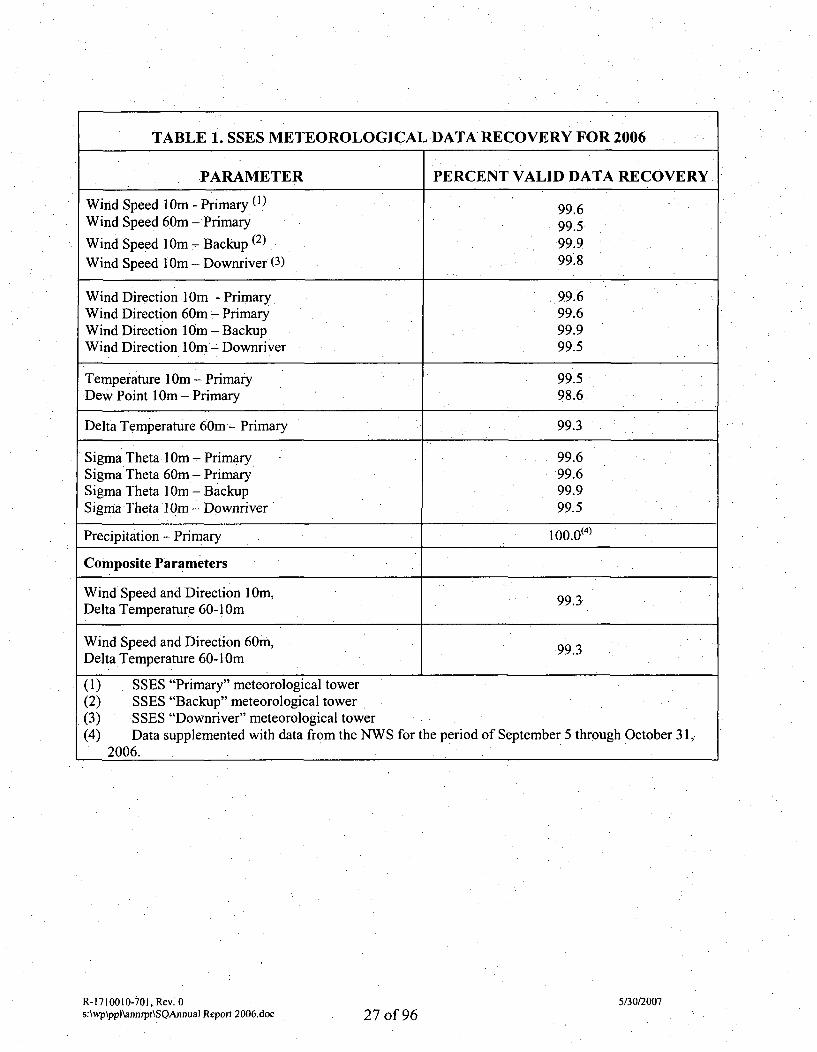
TABLE 1. SSES METEOROLOGICAL DATA RECOVERY FOR 2006
PARAMETER PERCENT VALID DATA RECOVERY
Wind Speed l0m - Primary (,) 99.6Wind Speed 60m - Primary .99.5Wind Speed I Om - Backup (2) 99.9Wind Speed I Om - Downriver (3) 99.8
Wind Direction 1Oim - Primary 99.6Wind Direction 60m - Primary 99.6Wind Direction lOm -Backup 99.9Wind Direction lOim Downriver 99.5Temperature I Om - Primary 99.5
Dew Point 1 Om -Primary 98.6
Delta Temperature 60m - Primary 99.3
Sigma Theta 1Oim - Primary 99.6Sigma Theta 60m - Primary .99.6Sigma Theta 1 Om - Backup 99.9Sigma Theta 1 Om - Downriver 99.5
Precipitation - Primary 100.014)
Composite Parameters
Wind' Speed and Direction 10m,Delta Temperature 60-1 Om
Wind Speed and Direction 60m, 993Delta Temperature 60-10m l
(1) SSES "Primary" meteorological tower(2) SSES "Backup" meteorological tower(3) SSES "Downriver" meteorological tower(4) Data supplemented with data from the NWS for the period of September 5 through October 31,.
2006.
R-17 10010-10 1, Rev. 0s:\wp\ppJ\annrp1\SQAnnuaJ Report 2006.doc
5/30/2007
27 of 96
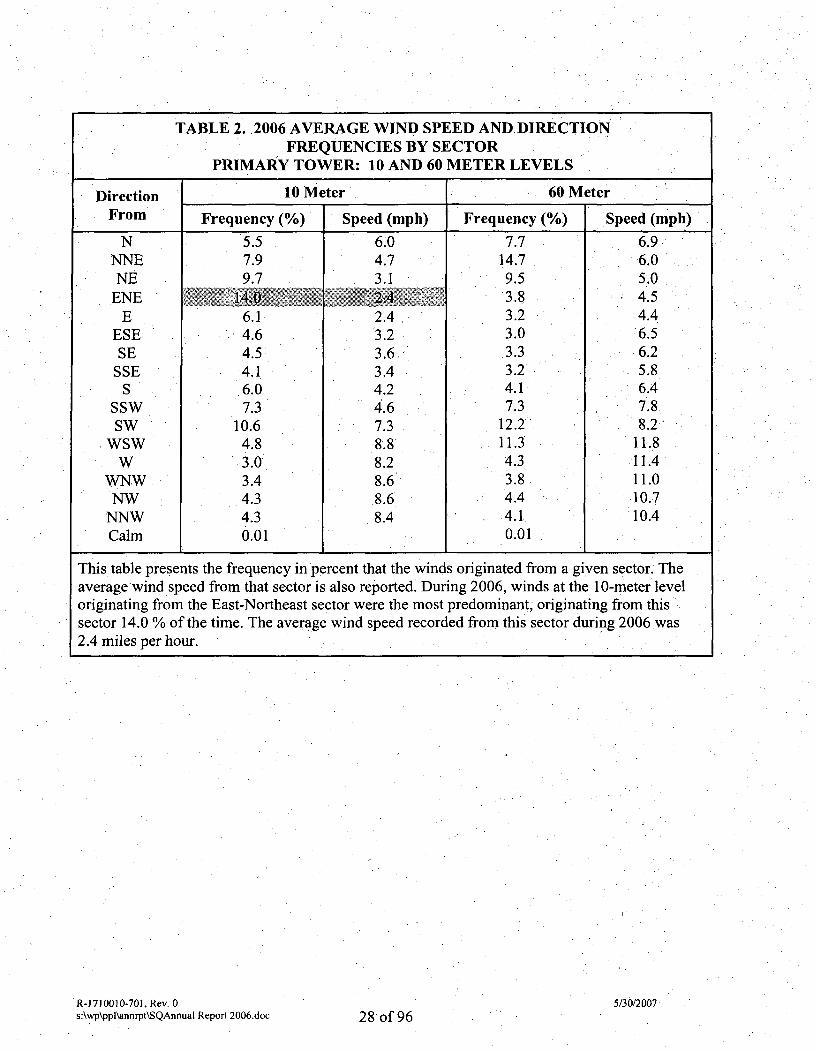
TABLE 2. 2006 AVERAGE WIND SPEED AND DIRECTIONFREQUENCIES BY SECTOR
PRIMARY TOWER: 10 AND 60 METER LEVELS
Direction 10 Meter 60 MeterFrom Frequency (%) Speed (mph) Frequency (%) Speed (mph
N 5.5 6.0 7.7 6.9NNE 7.9 4.7 14.7 6.0NE 9.7 3.1 9.5 5.0
ENE 14.0 1.4 , 3.8 4.5E 6.1 2.4 3.2 4.4
ESE 4.6 3.2 3.0 6.5SE 4.5 3.6: 3.3 6.2
SSE 4.1 3.4 3.2 5.8S 6.0 4.2 4.1 6.4
SSW 7.3 4.6 7.3 7.8SW .10.6 7.3 12.2 8.2
WSW 4.8 8.8 11.3 11.8,W 3.0 8.2 4.3 11.4
WNW 3.4 8.6 3.8 11.0NW 4.3 8.6 4.4 10.7
NNW 4.3 8.4 4.1 10.4Calm 0.01 0.01
This table presents the frequency in percent that the winds originated from a given sector. Theaverage wind speed from that sector is also reported. During 2006, winds at the 10-meter leveloriginating from the East-Northeast sector were the most predominant, originating from thissector 14.0 % of the time. The average wind speed recorded from this sector during 2006was2.4 miles per hour.
)
R-1710010-701, Rev. 0s:\wp\ppl\annrpt\SQAnnual Report 2006.doc
5/30/200728 of 96
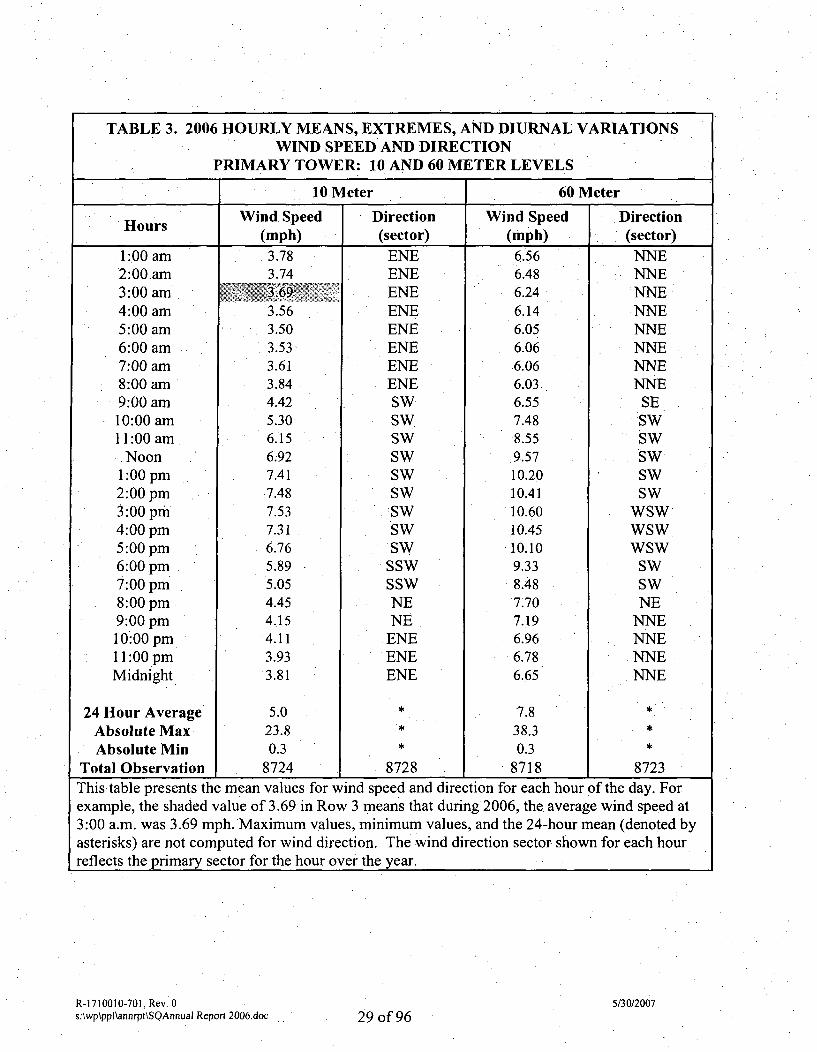
TABLE 3. 2006 HOURLY MEANS, EXTREMES, AND DIURNAL VARIATIONSWIND SPEED AND DIRECTION
PRIMARY TOWER: 10 AND 60 METER LEVELS
10 Meter 60 Meter
HoursWind Speed
(mph)Direction(sector)
Wind Speed(mph)
Direction(sector)
1:00 am2:00 am3:00 am4:00 am5:00 am6:00 am7:00 am8:00 am9:00 am10:00 am11:00 am
Noon1:00 pm2:00 pm3:00 pm4:00 pm5:00 pm6:00 pm7:00 pm8:00 pm9:00 pm10:00 pm11:00 pmMidnight
24 Hour AverageAbsolute MaxAbsolute Min
Total Observation
3.783.74
.3.693.563.503.533.613.844.425.306.156.927.417.48
.7.53
7.316.765.895.054.454.154.11
3.933.81
ENEENEENEENEENEENEENEENESWSWSWSWSWSWSWSWSW
SSWSSWNENE
ENEENEENE
6.566.486.246.146.056.066.066.036.557.488.559.57.10.2010.4110.6010.4510.109.338.487.707.196.966.786.65
7.838.3
0.38718
NNENNENNENNENNENNENNENNE
SESWSWSWSWSW
WSWWSWWSW
SWSWNE
NNENNENNENNE
5.023.80.3
8724 8728 8723This table presents the mean values for wind speed and direction for each hour of the day. Forexample, the shaded value of 3.69 in Row 3 means that during 2006, the. average wind speed at3:00 a.m. was 3.69 mph. Maximum values, minimum values, and the 24-hour mean (denoted byasterisks) are not computed for wind direction. The wind direction sector shown for each hourreflects the primary sector for the hour over the year.
R-1710010-701, Rev. 0s:\wp\ppl~annrpt\SQAnnuai Report 2006.doc
5/30/200729 of 96
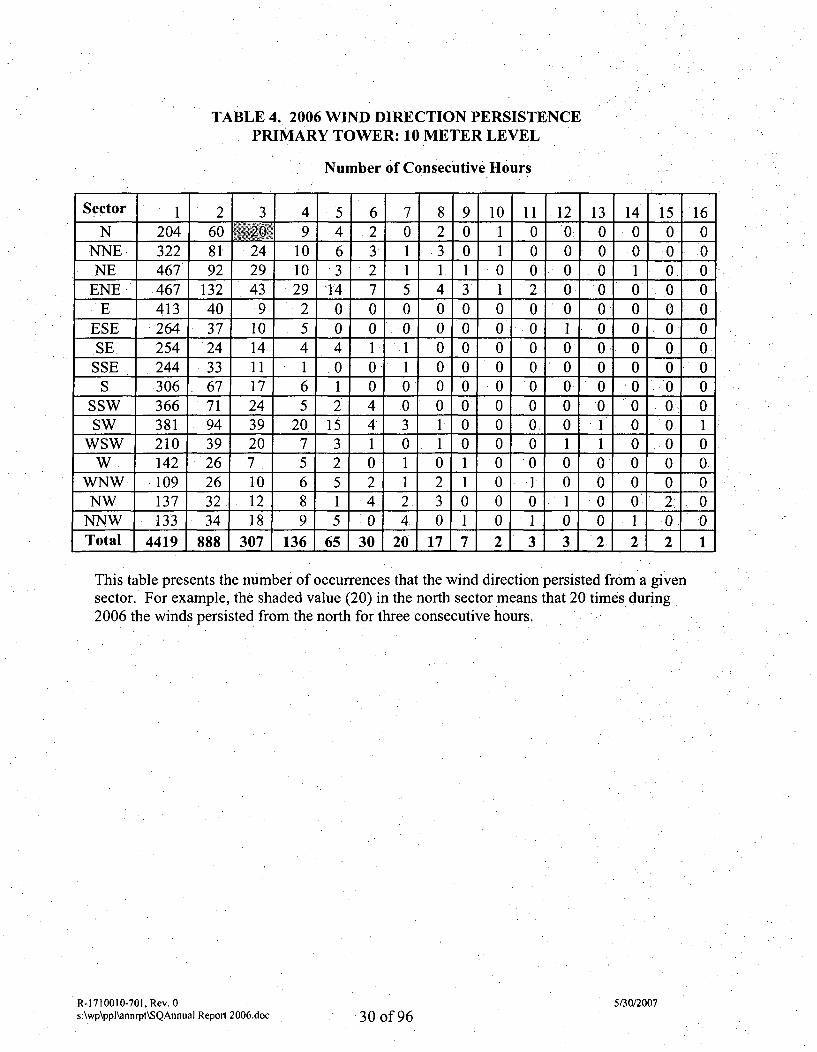
TABLE 4. 2006 WIND DIRECTION PERSISTENCEPRIMARY TOWER: 10 METER LEVEL
Number of Consecutive Hours
Sector 1 2 3 4 5 6 7 81 9 10 11 .12 13 14 15 16
N 204 60 20 9 4 2 0 2 0 1 0 0. 0 0 0 0NNE 322 81 24 10 6 3 1 3 0 1 0 0 0 0 0 0NE 467 92 29 10 3 2 1 1 1 0 0 0 0 1 0.: 0
ENE 467 132 43 29 14 7 5 4 3 1 2 0 0 0 0 0• E 413 40 9 2 0 0 0 0 0 0 0 0 0 0 0 0
ESE 264 37 10 5 0 0 0 0 0 0 0 1 0 0 0 0SE 254 24 14 4 4 1 1 0 0 0 0 0 0 0 0 0
SSE 244 33 11 1 0 0 1 0 0 0 0 0 0 0 0 0S 306 67 17 6 1 0 0 0 0 0 0 0 0 0 0
SSW 366 71 24 5 2 4 0 0 0 0 0 0 0 0 0 0SW 381 94 39 20 15 4 3 1 0 0 0 0 1 0 0 1
WSW 210 39 20 7 3 1 0 1 0 0 0 1 1 0 0 0W 142 26 7 5 2 0 00 0 0 0 0 0 0
WNW 109 26 10 6 5 2 1 2 1 0 1 0 0 0 0 0NW 137 32 12 8 1 4 2 3 0 0 0 1 0 0 2: 0
NNW 133 34 18 9 5 0 4. 0 1 0 1 0 0 1 0 0Total 4419 888 307 136 65 30 20 17 7 2 3 3 2 2 2 1
This table presents the number of occurrences that the wind direction persisted from a givensector. For example, the shaded value (20) in the north sector means that 20 times during2006 the winds persisted from the north for three consecutive hours.
R-1710010-701, Rev. 0s:\wp\ppl\annrpt\SQAnnual Report 2006.doc
5/30/200730 of 96
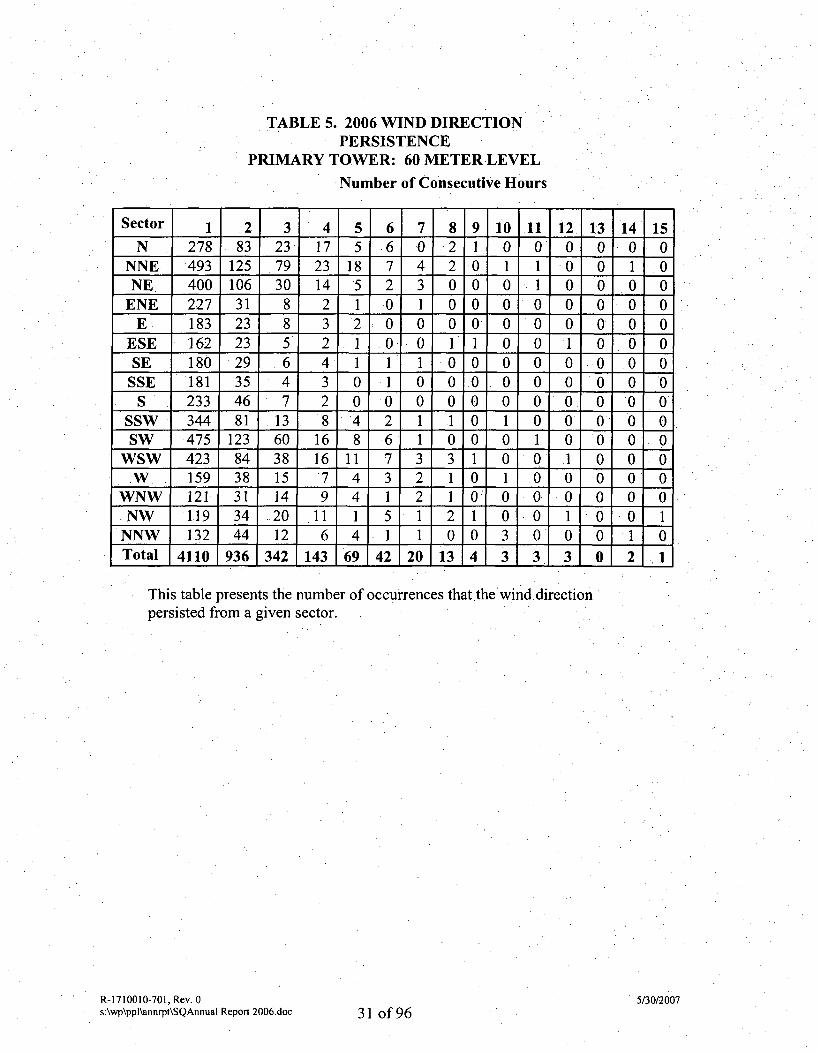
TABLE 5. 2006 WIND DIRECTIONPERSISTENCE
PRIMARY TOWER: 60 METER LEVELNumber of Consecutive Hours
Sector 1 2 3 4 5 6 7 8 9 1011 12 13 14 15
•N 278 83 23 17 5 6 0 2 1 0 0 0 0 0 0NNE 493 125 79 23 18 7 4 2 0 1 1 0 0 1 0NE 400 106 30 14 5 2 3 0 0 0 1 0 0 0 0
ENE 227 31 8 2 1 0 1 0 0 0 0 0 0 0 0E 183 23 8 3 2 0 0 0 0 0 0 0 0 0
ESE 162 23 5 2 1 .0 0 1 1 0 0 1 0 0 0SE 180 29 6 4 1 1 1 0 0 0 0 0 0 0 0
SSE 181 35 4 3 0 1 0 0 .0 0 0 0 0 0 0S 233 46 7 2 0 0 0 0 0 0 0 0 0 0 0
SSW 344 81 13 8 4 2 1 1 0 1 0 0 0 0 0SW 475 123 60 16 8 6 1 0 0 0 1 0 0 0 0
WSW 423 84 38 16 11 7 3 3 1 0 0 1 0 0 0W 159 38 15 7 4 3 2 1 0 1 0 0 0 0 0
WNW 121 31 14 9 4 1 2 1 0- 0 0 0 0 0 0NW 119 34 20 11 1 5 1 2 1 0 0 1 0 0 1
NNW 132 44 12 6 4 1 1 0 0 3 0 0 0 11 0Total 4110 936 342 143 69 42 20 13 4 3 3 3 0 2 1
This table presents the number of occurrences that the wind directionpersisted from a given sector.
R-1710010-701, Rev. 0s:\wp\ppl\annrpt\SQAnnual Report 2006.doc
5/30/200731 of 96
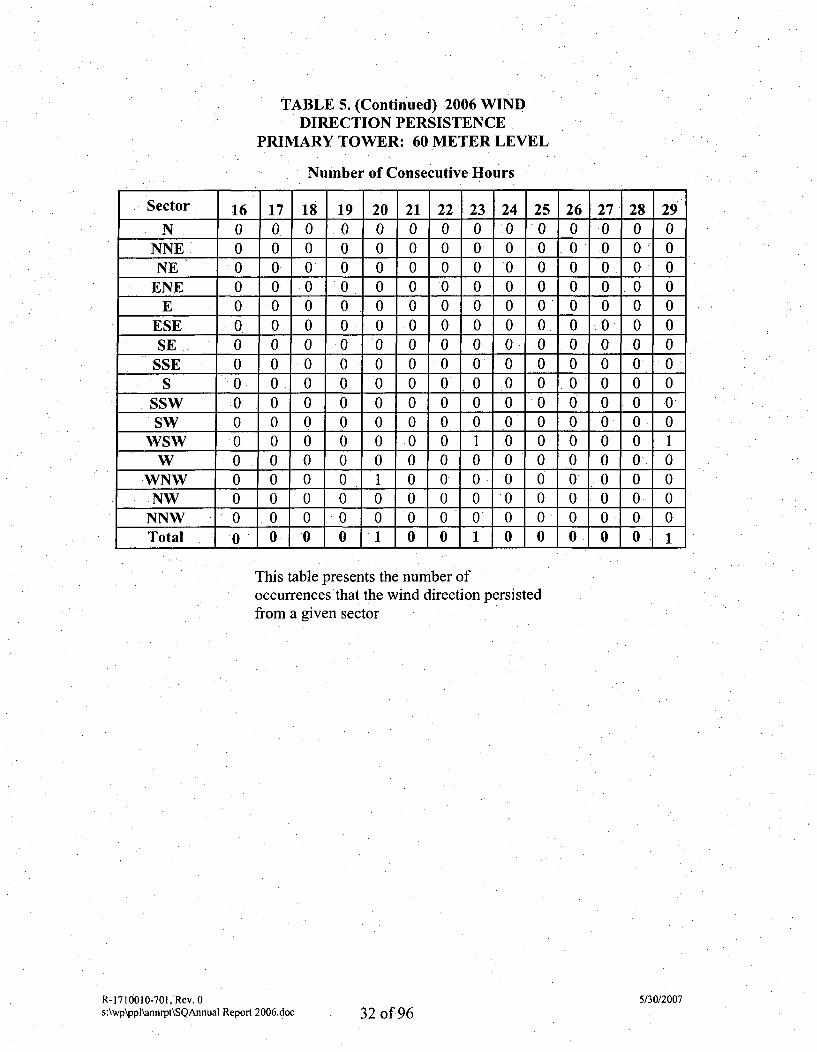
TABLE 5. (Continued) 2006 WINDDIRECTION PERSISTENCE
PRIMARY TOWER: 60 METER LEVEL
Number of Consecutive Hours
Sector 16 17 18 19 20 21 22 23 24 25 26 27 28 29
N 0- 0 0 0 0 0 0 0 .0 0 0 0 0 0NNE 0 0 0 0 0 0 0 0 0 0 0 0 0 0NE 0 0 0 0 0 0 0 0 0 0 0 0 0 0
ENE 0 0" 0 0 0 0 0 0 0 0 0 0 0 0E 0 0 0 0 0 0 0 0 0 0 0 0 0 0
ESE .0 0 0 0 0 0 0 0 0 0 0 0 0 0 0SE 0 0 0 0 0 0 0 0 0 0 0 0 0
SSE 0 0 0 0 0 0 0 0 0 0 0 0 0 0S 0 0 0 0 0 0 0 0 0 0 0 0 0 0
SSW •0 0 0 0 0 0 0 0 0 0 0 0 0 0SW 0 0 0 0 0 0 0 0 0 0 0 0 0 0
WSW 0 0 0 0 0 0 0 1 0 0 0 0 0 1W 0 a 0 0 0 0 0 0 0 0 0 0 0 0
WNW 0 0 0 0 1 0 0 0 0 0 0 0 0 0NW 0 0 0 0 0 0 0 0 0 0 0 0 0.
NNW 0 0 0 0 00 0 0 oo 0 0 •0Total 0 0 0 0 1 0 0 1 0 0 0 0 0 1
This table presents the number ofoccurrences that the wind direction persistedfrom a given sector
R-1710010-701, Rev. 0s:\wp\ppl\annrpt\SQAnnual Report 2006.doc
5/30/2007
32 of 96
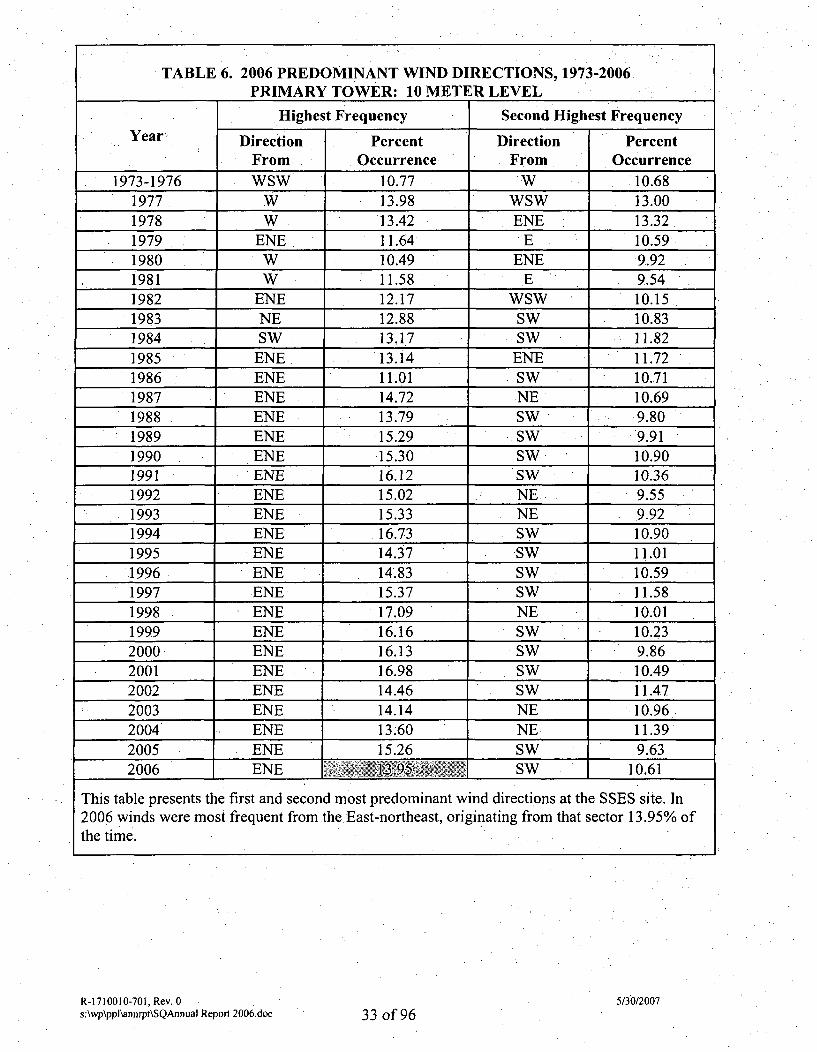
TABLE 6. 2006 PREDOMINANT WIND DIRECTIONS, 1973-2006.PRIMARY TOWER: 10 METER LEVEL
Highest Frequency Second Highest FrequencyYear Direction Percent Direction Percent
From Occurrence From Occurrence1973-1976 WSW 10.77 W 10.68
1977 W 13.98 WSW 13.001978 W 13.42 ENE 13.321979 ENE 11.64 E 10.591980 W 10.49 ENE 9.921981 W 11.58 E 9.541982 ENE 12.17 WSW 10.151983 NE 12.88 Sw 10.831984 SW 13.17 SW 11.821985 ENE, 13.14 ENE 11.721986 ENE 11.01 SW 10.711987 ENE 14.72 NE 10.691988 ENE 13.79 SW 9.801989 ENE 15.29 SW 9.911990 ENE .15.30 SW 10.901991 ENE 16.12 SW 10.361992 ENE 15.02 NE 9.551993 ENE 15.33 NE 9.921994 ENE .16.73 SW 10.901995 ENE 14.37 ýSW 11.011996 ENE 14.83 SW 10.591997 ENE 15.37 SW 11.581998 ENE 17.09 NE 10.011999 ENE 16.16 SW 10.232000 ENE 16.13 SW 9.862001 ENE 16.98 SW 10.492002 ENE 14.46 SW 11.472003 ENE 14.14 NE 10.962004 ENE 13.60 NE 11.392005 ENE 15.26 SW 9.632006 ENE .. 3.95. • SW 10.61
This table presents the first and second most predominant wind directions at the SSES site. In2006 winds were most frequent from the East-northeast, originating from that sector 13.95% ofthe time.
R-1710010-701, Rev. 0s\wp\ppi~annrpt\SQAnnuaJ Reporl 2006.doc
5/30/2007
33 of 96
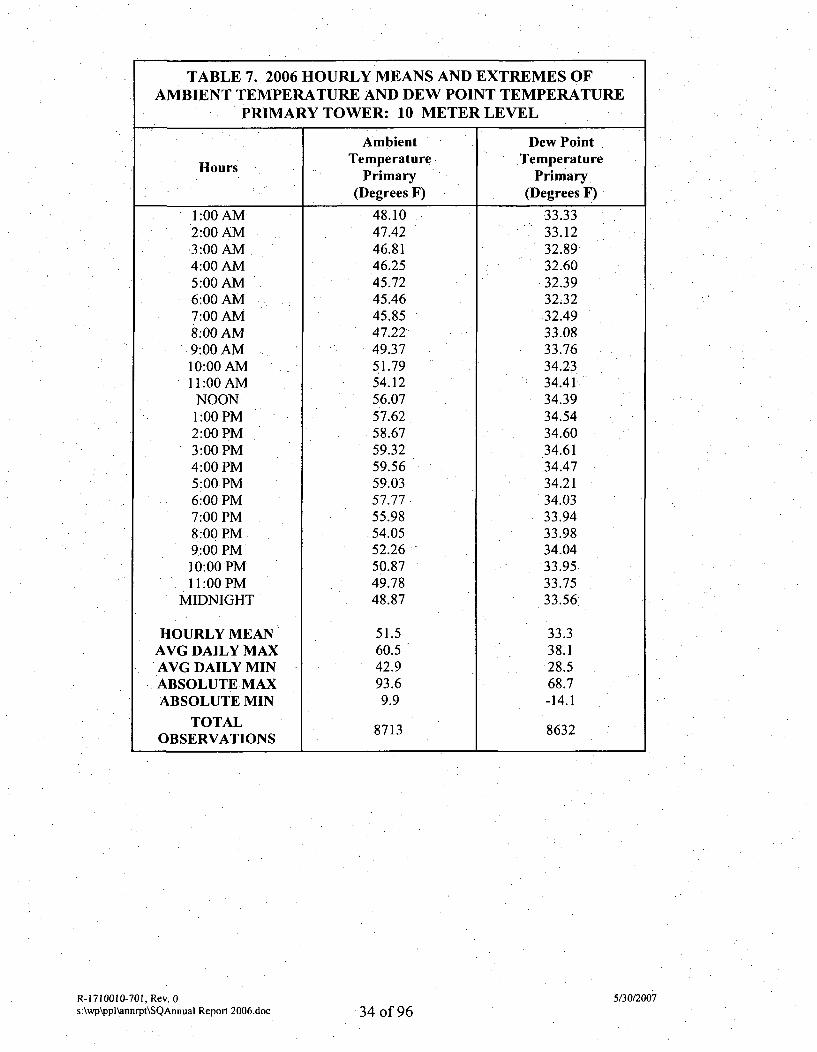
TABLE 7. 2006 HOURLY MEANS AND EXTREMES OFAMBIENT TEMPERATURE AND DEW POINT TEMPERATURE
PRIMARY TOWER: 10 METER LEVEL
Ambient Dew PointTemperature Temperature
Primary Primary__ (Degrees F) (Degrees F)
1:00 AM 48.10 33.332:00 AM 47.42 33.123:00 AM 46.81 32.894:00 AM 46.25 32.605:00 AM 45.72 32.396:00 AM 45.46 32.327:00 AM 45.85 32.498:00 AM 47.22 33.089:00 AM 49.37 33.7610:00 AM 51.79 34.2311:00 AM 54.12 .34.41NOON 56.07 34.391:00 PM 57.62 34.542:00 PM 58.67 34.603:00 PM 59.32 34.614:00 PM 59.56 34.475:00 PM 59.03 34.216:00 PM 57.77 34.037:00 PM 55.98 33.948:00 PM .54.05 33.989:00 PM 52.26 . 34.0410:00 PM 50.87 33.9511:00 PM 49.78 33.75
MIDNIGHT 48.87 33.56
HOURLY MEAN 51.5 33.3AVG DAILY MAX 60.5 38.1AVG DAILY MIN 42.9 28.5ABSOLUTE MAX 93.6 68.7ABSOLUTE MIN 9.9 -14.1
TOTALOBSERVATIONS 8713 8632
1, Rev. 0 5/30/2007R-1710010-70s:\wp\ppl\annrpt\SQAnnual Report 2006.doc 34 of 96
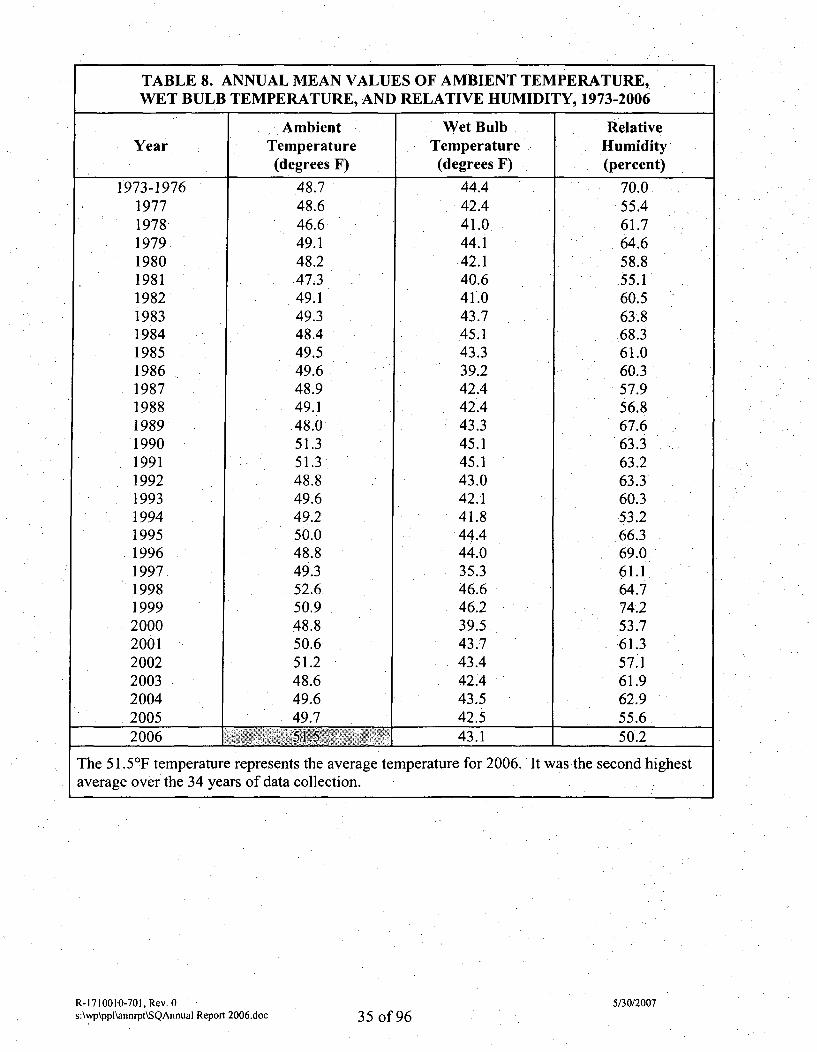
TABLE 8. ANNUAL MEAN VALUES OF AMBIENT TEMPERATURE,WET BULB TEMPERATURE, AND RELATIVE HUMIDITY, 1973-2006
Ambient Wet Bulb. RelativeYear Temperature Temperature Humidity
(degrees F) (degrees F) (percent)
1973-1976 48.7 44.4 70.01977 48.6 42.4 55.41978 46.6 41.0 61.71979 49.1 44.1 64.61980 48.2 42.1 58.81981 47.3 40.6 55.11982 49.1 41.0 60.51983 49.3 43.7 63.81984 48.4 45.1 68.31985 49.5 43.3 61.01986 49.6 39.2 60.31987 48.9 42.4 57.91988 49.1 42.4 56.81989 48.0 43.3 67.61990 51.3 45.1 63.31991 51.3 45.1 63.21992 48.8 43.0 63.31993 49.6 42.1 60.31994 49.2 41.8 53.21995 50.0 44.4 66.31996 48.8 44.0 69.01997 49.3 35.3 61.1.1998 52.6 46.6 64.71999 50.9 46.2 74.22000 48.8 39.5 53.72001 50.6 43.7 61.32002 51.2 43.4 57.12003 48.6 42.4 61.92004 49.6 43.5 62.92005 49.7 42.5 55.62006 - -7 [1., 1 43.1 50.2
The 51.59F temperature represents the average temperature for 2006. It was the second highestaverage over the 34 years of data collection.
R-1710010-701, Rev. 0 5/30/2007s:\wp\ppl\annrpt\SQAnnual Report 2006.doc 35 of 96
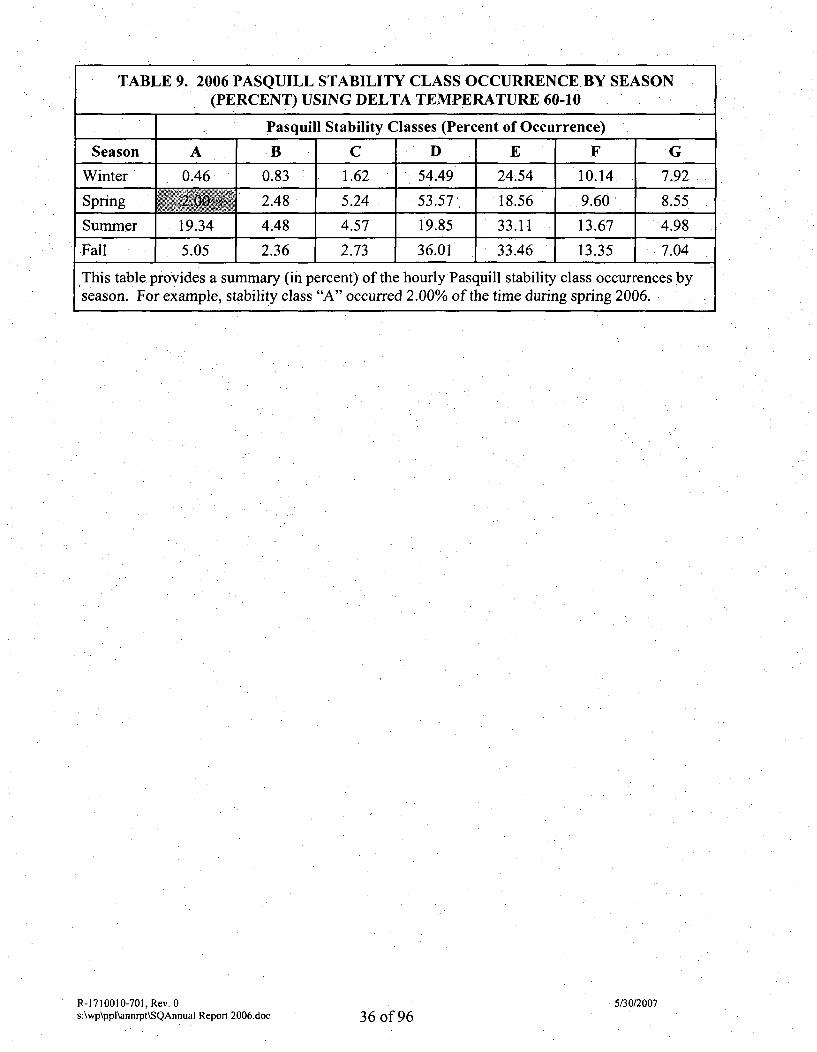
TABLE 9. 2006 PASQUILL STABILITY CLASS OCCURRENCE BY SEASON(PERCENT) USING DELTA TEMPERATURE 60-10
.... _ Pasquill Stability Classes (Percent of Occurrence)
Season A B C D E F G
Winter 0.46 0.83 1.62 54.49 24.54 10.14 7.92
Spring 2.00 2.48 5.24 53.57 18.56 9.60 8.55
Summer 19.34 4.48 4.57 19.85 33.11 13.67 4.98
Fall 5.05 2.36 2.73 36.01 33.46 13.35 7.04
This table provides a summary (in percent) of the hourly Pasquill stability class occurrences byseason. For example, stability class "A" occurred 2.00% of the time during spring 2006.
R-1710010-701, Rev. 0s:\wp\ppl\annrpt\SQAnnua1 Report 2006.doc
5/30/200736 of 96
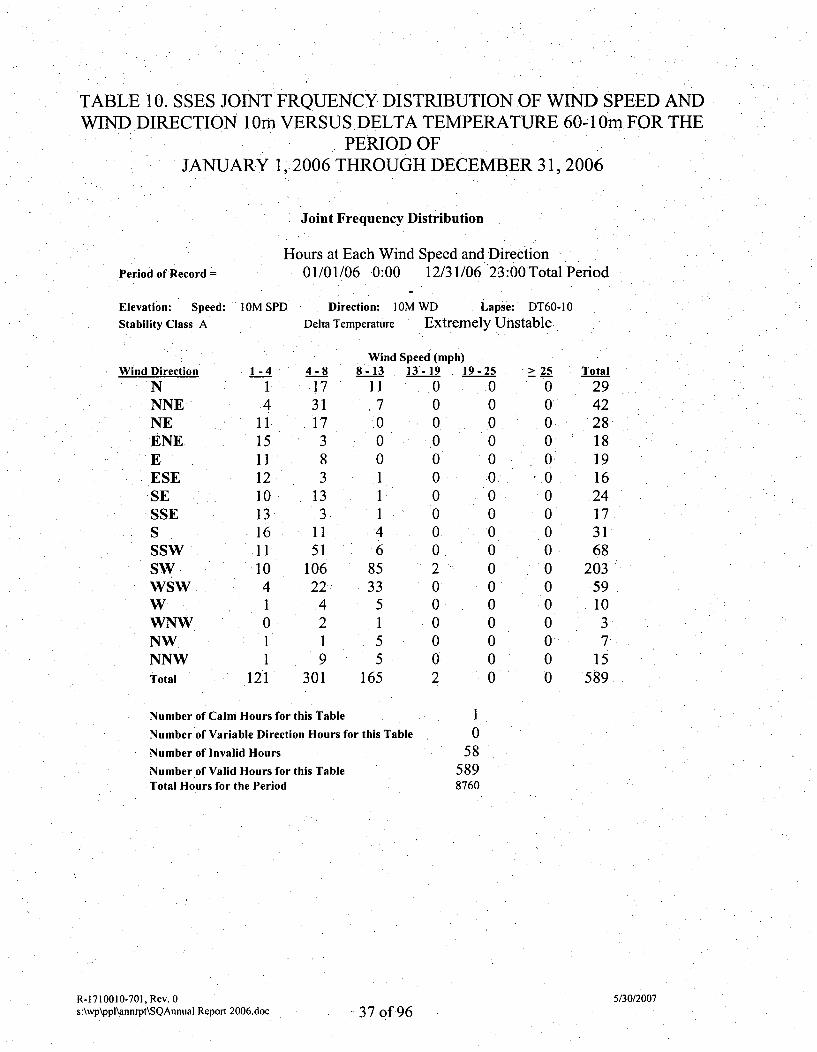
TABLE 10. SSES JOINT FRQUENCY DISTRIBUTION OF WIND SPEED ANDWIND DIRECTION lOim VERSUS DELTA TEMPERATURE 60-1Om FOR THE
PERIOD OFJANUARY 1, 2006 THROUGH DECEMBER 31, 2006
Joint Frequency Distribution
Hours at Each Wind Speed and Direction01/01/06 0:00 12/31/06 23:00Total PeriodPeriod of Record =
Elevation: Speed:
Stability Class A
Wind Direction
NNNENEENEEESESESSESSSWSWWSWWWNWNWNNWTotal
I OM SPD
1-4154
1115111210131611
104
0
1
121
Direction: IOM WD Lapse: DT60-10Delta Temperature Extremely Unstable
4-8
173117
383
133
1151
106.22
4219
301
8
1
Wind Speed (mph)-13 13- 19 111 0
00 00 00 01 0.1 01 04 06 0.
85 233 0
5 01 05 05 0
65 2
9-25
.00
00.00000000000
0
> 25
000000000
00000000
Total29422818
191624.173168
20359
1037
15589
Number of Calm Hours for this Table
Number of Variable Direction Hours for this Table
Number of Invalid Hours
Number of Valid Hours for this TableTotal Hours for the Period
I0
585898760
R-1710010-701, Rev. 0s:\wp\ppl\annrpt\SQAnnual Report 2006.doc
5/30/2007
-37 of 96
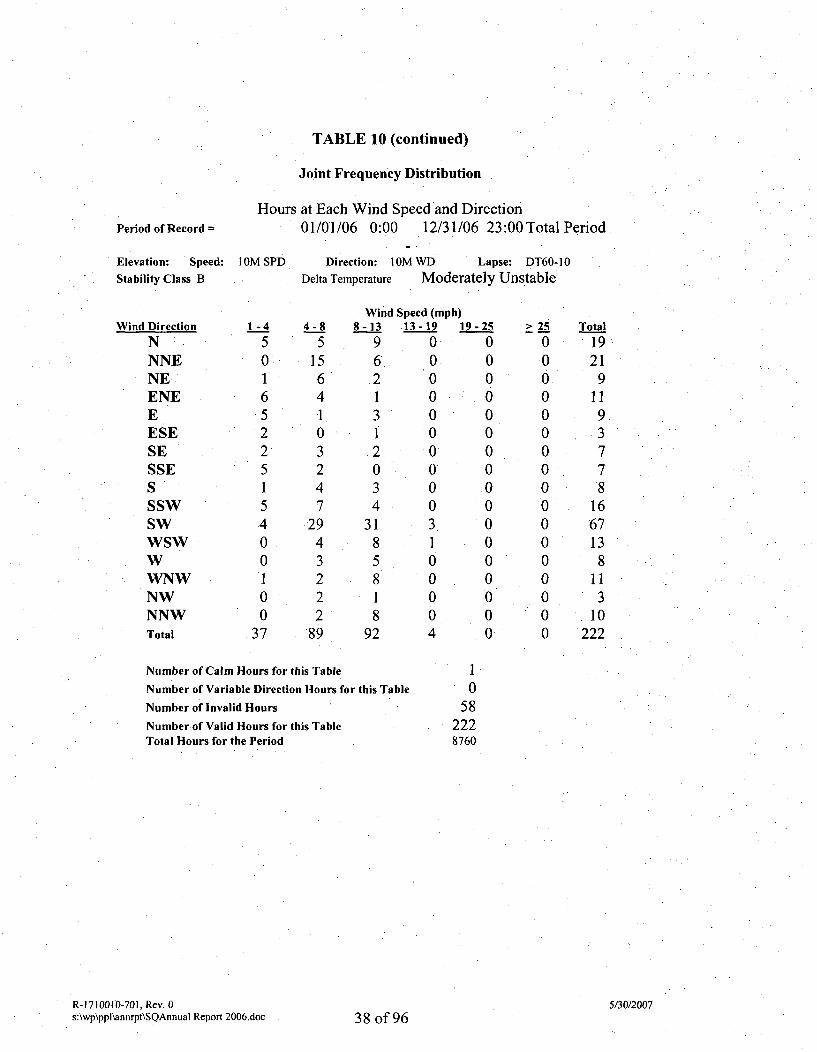
TABLE 10 (continued)
Joint Frequency Distribution
Hours at Each Wind Speed and Direction01/01/06 0:00 12/31/06 23:00Total PeriodPeriod of Record =
Elevation: Speed:
Stability Class B
Wind Direction
NNNENEENEEESESESSESSSWSWWSWWWNWNWNNWTotal
I OM SPD
1-4
501
652251
54000
037
Direction: IOM WD Lapse: DT60-10Delta Temperature Moderately Unstable
Wind Speed (mph)4-8
51564103247
2943222
89
8-139621312
034
3185818
92
.13-190000000
00031000
4
19 -25
000000000000
00000
> 25
00000000000000000
Total
19.21
9119
.3778
16.67138
113
10222
Number of Calm Hours for this Table
Number of Variable Direction Hours for this Table
Number of Invalid Hours
Number of Valid Hours for this TableTotal Hours for the Period
I0
582228760
R-1710010-701, Rev. 0s:\wp\ppl\annrpt\SQAnnual Report 2006.doc
5/30/200738 of 96
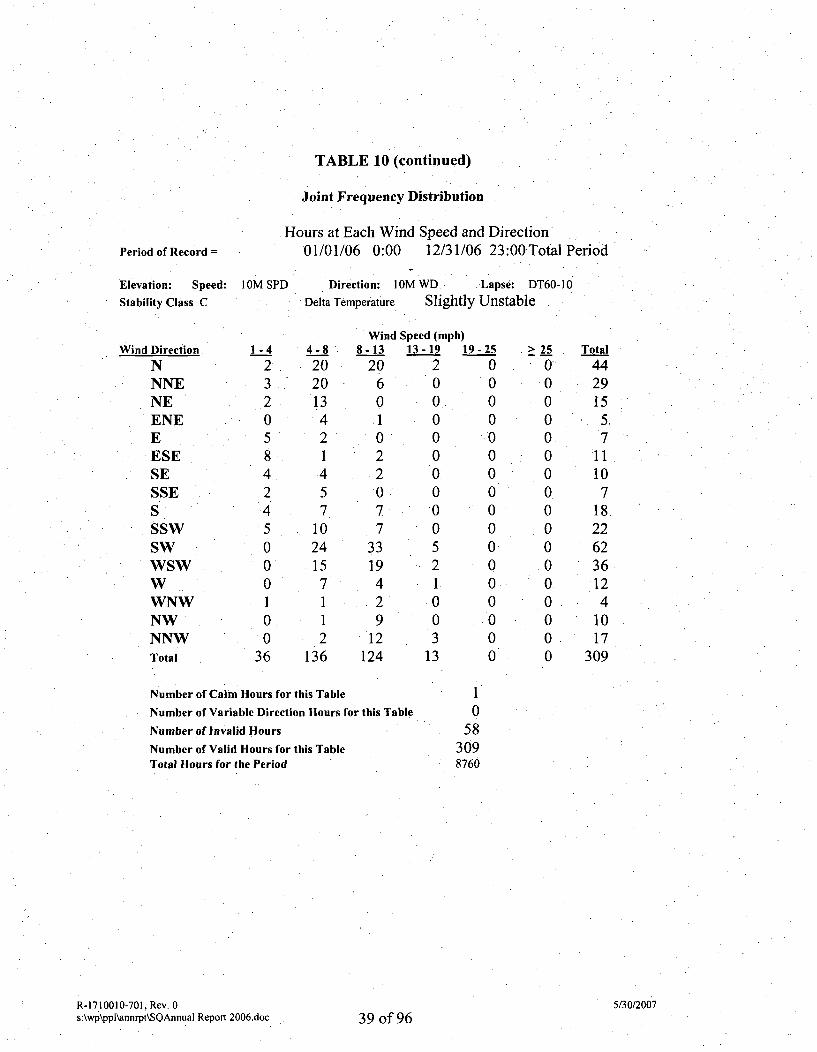
TABLE 10 (continued)
Joint Frequency Distribution
Hours at Each Wind Speed and Direction01/01/06 0:00 12/31/06 23:00 Total PeriodPeriod of Record =
Elevation: Speed:
Stability Class C
Wind Direction.
NNNENEENEEESESESSESSSWSWWSWWWNWNWNNWTotal
I OM SPD
1-4
23205
4245
0001
0.0
36
Direction: IOM WD. Lapse: DT60-10
Delta Temperature Slightly Unstable
Wind Speed (mph)4-82020134
21.457
1024157112
136
8-132060.1
022
077
3319429
12124
13-192000000
0.0
~052
0
313
19 -25000000000000
00000
> 25
0
00000.00000.00,0000
Total44-2915
. 5
711107
18.22623612
41017
309
Number of Calm Hours for this Table
Number of Variable Direction Hours for this Table
Number of Invalid Hours
Number of Valid Hours for this TableTotal Hours for the Period
I0
583098760
R-1710010-701, Rev. 0s:\wp\ppl\annrpt\SQAnnual Report 2006.doc
5/30/200739 of 96
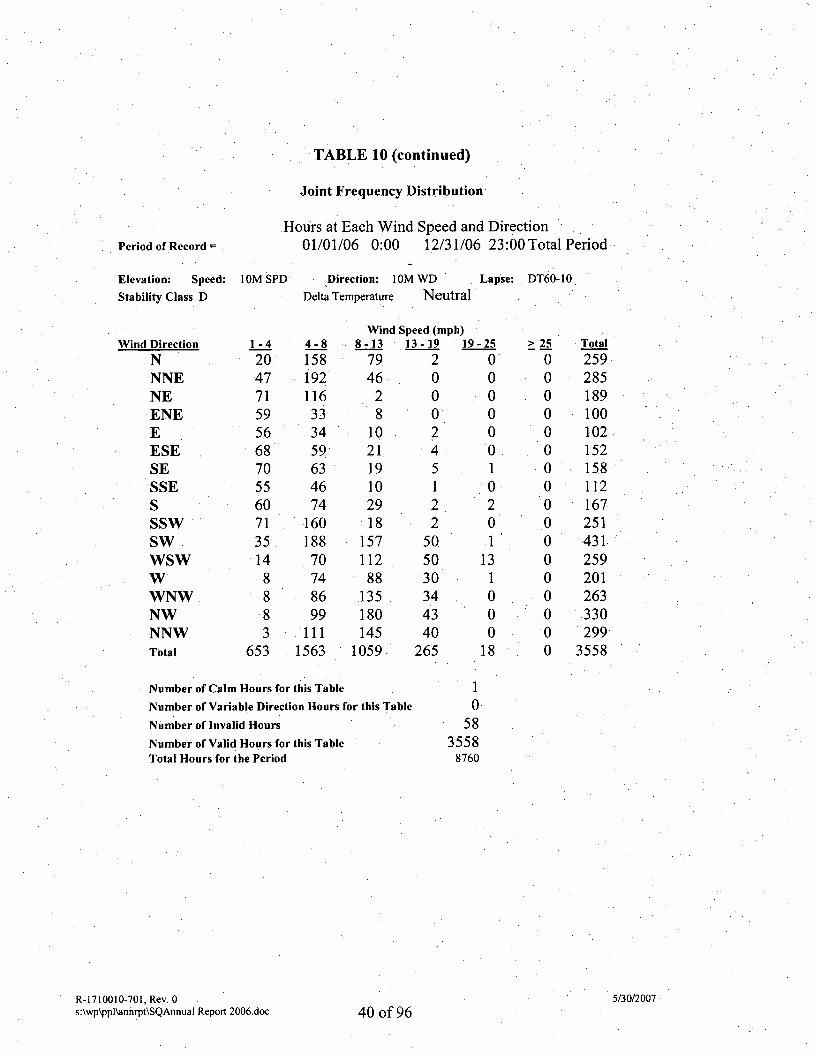
TABLE 10 (continued)
Joint Frequency Distribution
Hours at Each Wind Speed and Direction01/01/06 0:00 12/31/06 23:00Total PeriodPeriod of Record =
Elevation: Speed:
Stability Class D
I OM SPD Direction: IOM WD Lapse: DT60-10
Delta Temperature Neutral
Wind Direction
NNNENEENEEESESESSESSSWSWWSWWWNW,NW,NNWTotal
1-4
204771595668705560713514888
3653
4-8
158192116.333459634674
16018870
7486
8Wind Speed (mph)-13 *13-19 1
79 246 0
2 08 0
10 221 419 510 129 218 2
L57 50112 5088 30
L35 34
9-25
00000010
201
1310
> 2500000000000000000
Total
259285189100102152158112167251431259201263330
2993558
99 180111 145
1563 1059
43 040 0
265 18
Number of Calm Hours for this Table
Number of Variable Direction Hours for this Table
Number of Invalid Hours
Number of Valid Hours for this TableTotal Hours for the Period
R-1710010-701, Rev. 0s:\wp\ppl\annrpt\SQAnnual Report 2006.doc 40 of 96
10•
583558
8760
5/30/2007
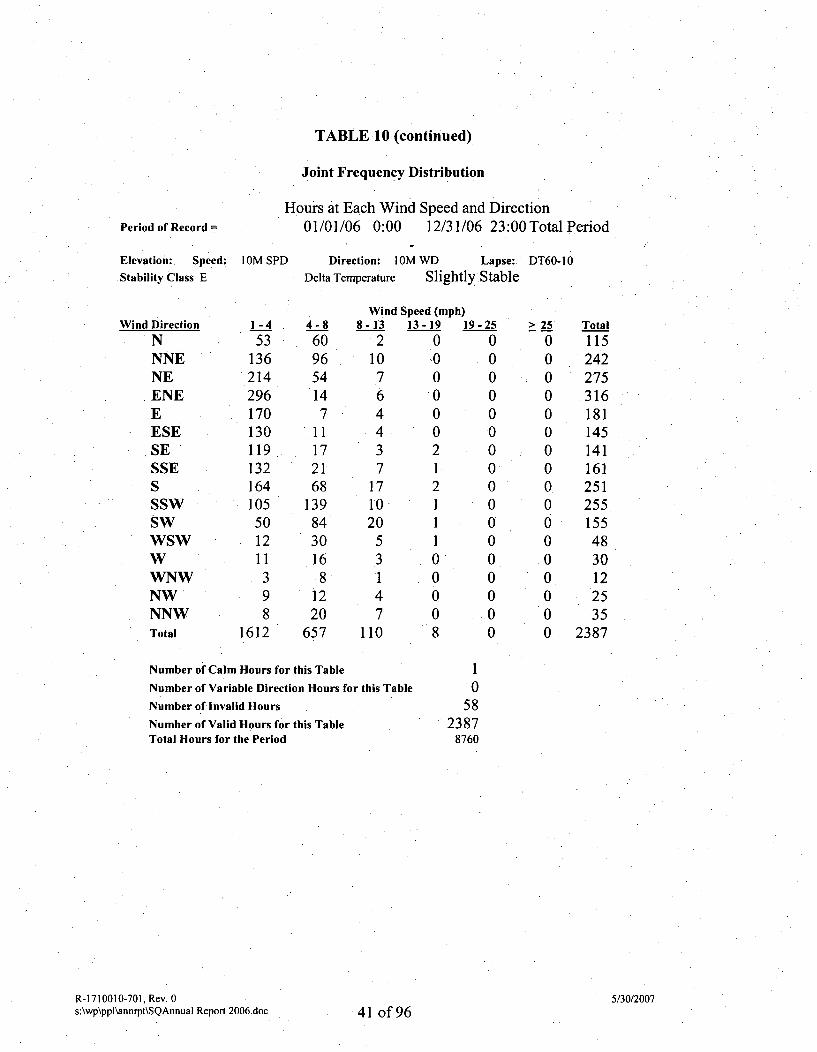
TABLE 10 (continued)
Joint Frequency Distribution
Hours at Each Wind Speed and DirectionPeriod of Record
Elevation: Speed:
Stability Class E
Wind Direction
NNNENEENEEESESESSESSSWSWWSWWWNWNWNNWTotal
01/01/06 0:00 12/31/06 23:00 Total Period
IOM SPD Direction: IOM WD Lapse:. DT60-10Delta Temperature Slightly Stable
1-4
53136214
296170130
119132164105501211398
1612
4-
6951
•11
26
13831
265
Wind Speed (mph)8 8-13 13-19 19-250 2 0 06 10 0 04 7 0 04 6 0 07 4 0 01 4 0 07 3 2 01 7 1 08 17 2 09 10 1 04 20 1 00 5 1 06 3 0 08 1 0 02 4 0 00 7 0 07 110 8 0
> 2500000000000000000
Total
115242275
.316181.145141161251255155483012
2535
2387
Number of Calm Hours for this Table
Number of Variable Direction Hours for this Table
Number of invalid Hours
Number of Valid Hours for this TableTotal Hours for the Period
I0
582387
8760
R- 1710010-701., Rev. 0s:\wp\ppl\annrpt\SQAnnual Report 2006.doc
5/30/2007
41 of 96

TABLE 10 (continued)
Joint Frequency Distribution
Hours at Each Wind Speed and Direction. 01/01/06 0:00 12/31/06 23:00 Total PeriodPeriod of Record =
Elevation: Speed:
Stability Class F
Wind Direction
NNNENEENEEESESESSESSSWSWWSWWWNWNWNNWTotal
I OM SPD
1 -48
46174407148484244.3717320
231
982
Direction: IOM WD Lapse: DT60-10
Delta Temperature Moderately Stable
Wind Speed (mph)4-8
18961000
351
0000
35
8-13
0000000"0
000
000000
13-1900000000000000000
19 2500000000000000000
> 25000000000
0.0000000
Total
955
183413.149
4842444022430231
1018
Number of Calm Hours for this TableNumber of Variable Direction Hours for this Table
Number of Invalid Hours
Number of Valid Hours for this TableTotal Hours for-the Period
R-1710010-701, Rev. 0s:\wp\ppl\annrpt\SQAnnual Report 2006.doc 42 of 96
10
581017
8760
5/30/2007
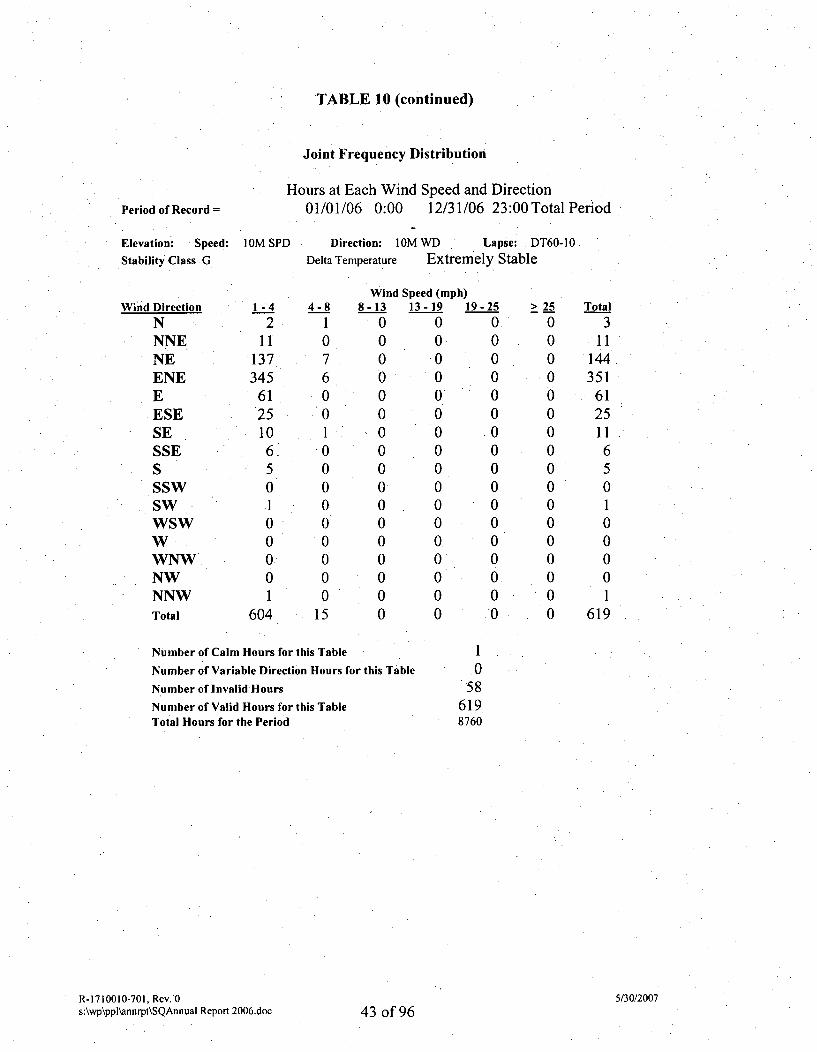
TABLE 10 (continued)
Period of Record =
Elevation: Speed:
Stability Class .G
Wind Direction
NNNENEENEEESESESSESSSWSWWSWWWNWNWNNWTotal
Joint Frequency Distribution
Hours at Each Wind Speed and Direction01/01/06 0:00 12/31/06 23:00 Total Period
IOM SPD Direction: IOM WD Lapse: DT60-10
Delta Temperature Extremely Stable
1-42
11137•
345612510650.100001
604
4-810760010
0000000
15
8Wind Speed (mph)-13 13-19 1
0 00 00 00 00 00 00 00 00 00 00 00 00 00 00 00 00 0
9-25
0000000
0000000000
> 25
0000
0000000000000
Total3
.11
144351
612511650100001
619
Number of Calm Hours for this Table
Number of Variable Direction Hours for this Table
Number of InvalidiHours
Number of Valid Hours for this Table
Total Hours for the Period
1.058
6198760
R-1710010-701, Rev.0s:\wp\ppl\annrpt\SQAnnual Report 2006.doc
5/30/200743 of 96
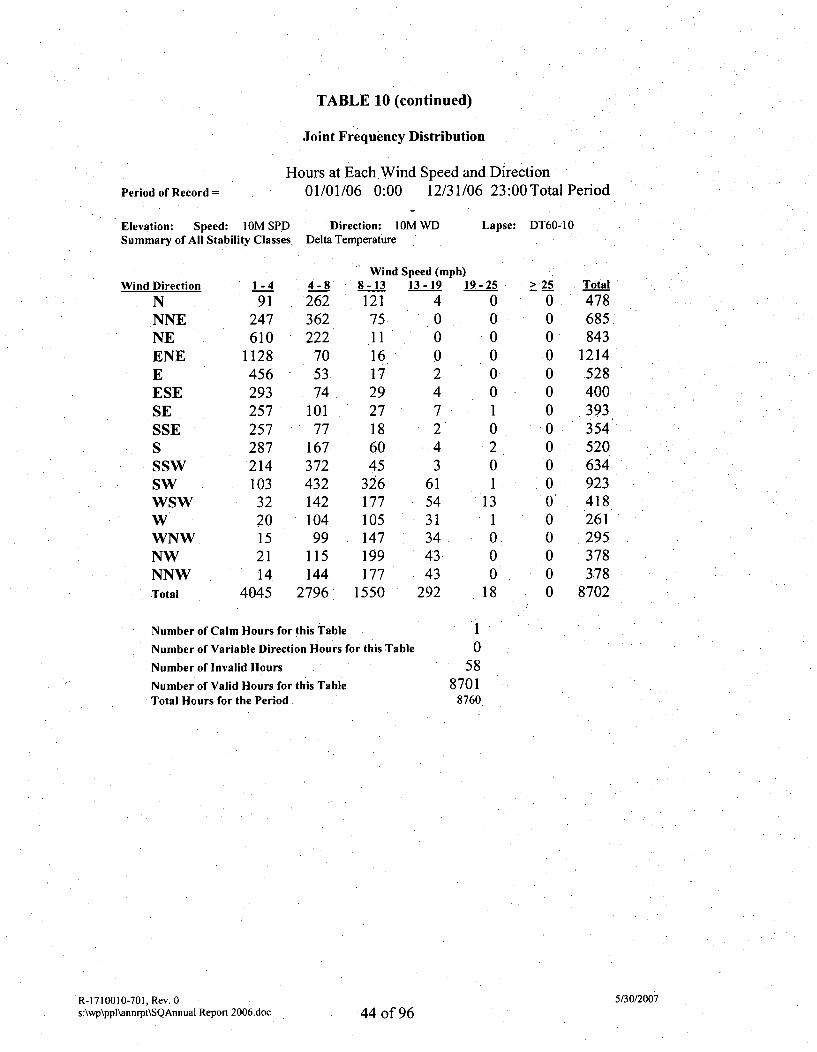
TABLE 10 (continued)
Joint Frequency Distribution
Hours at Each Wind Speed and. DirectionPeriod of Record =
Elevation: Speed: IOM SPDSummary of All Stability Classes,
01/01/06 0:00 12
Direction: I OM WDDelta Temperature
/31/06 23:00 Total Period
Lapse: DT60-I 0
Wind Direction
NNNENEENEEESESESSE
.SSSWSWWSWWWNWNWNNWTotal
1-491
247610
11284562932572572872141033220152114
4045
4-8
262362222
7053.74
101•77167372432142104
99115144
2796
8
*1
Wind Speed (mph)-13 13-19 1
121 475 011 016 017 229 427 718 260 445 3
326 61177 54105 31147 34199 43177 43550 292
9-25000
0001
0201
13*1
000
18
> 25000-00000000000000
Total478685,843
1214528400393354.520634923418261295378378
8702
Number of Calm Hours for this Table
Number of Variable Direction Hours for this Table
Number of Invalid Hours
Number of Valid Hours for this TableTotal Hours for the Period
1
588701
8760
R-1710010-701, Rev.O0s:\wp\ppl'annrpt\SQAnnuaI Report 2006.doc
5/30/2007
44 of 96
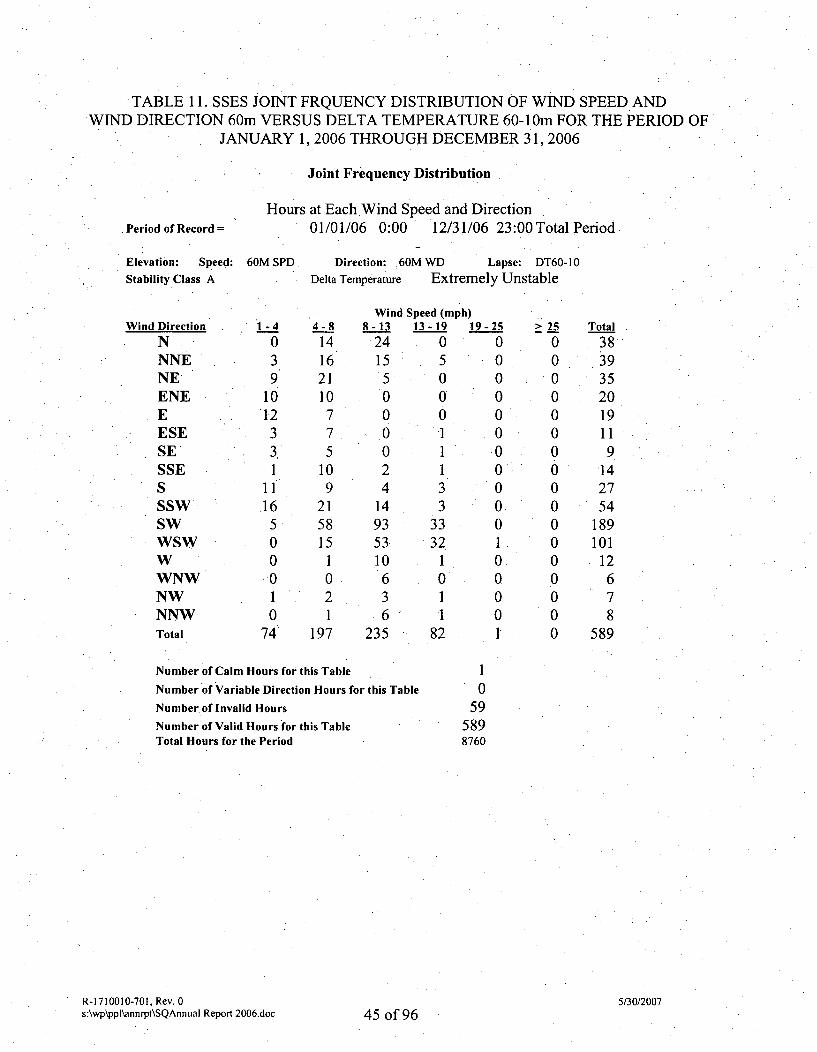
TABLE 1.1. SSES JOINT FRQUENCY DISTRIBUTION OF WIND SPEED ANDWIND DIRECTION 60m VERSUS DELTA TEMPERATURE 60-1Om FOR THE PERIOD OF
JANUARY 1, 2006 THROUGH DECEMBER 31, 2006
Joint Frequency Distribution
Hours at Each.Wind Speed and DirectionPeriod of Record= 01/01/06 0:00 12/31/06 23:00 Total Period
Elevation: Speed: 60M SPD. Direction: 60M WD Lapse: DT60-10Stability Class A Delta Temperature Extremely Unstable
Wind Speed (mph)Wind Direction 1-4 4-8 8-13 .13-19 19-25 > 25 Total
N 0 14 24 0 0 0 38NNE 3 16. 15 5 0 0 39NE 9 21 5 0 0 0 35ENE 10 10 0 0 0 0 20E 12 7 0 0 0 0 19ESE, 3 7 0 1 0 0 11SE 3 5 0 1 0 0 9SSE 1 10 2 1 0 0 14S 11 9 4- 3 0 0 27SSW 16 21 14 3 0 0 54SW 5 58 93 33 0 0 189WSW 0 .15 53 32. 1 0 101W 0 1 10 1 0 0 12WNW .0 0 6 0 0 0 6NW 1 2 3 1 0 0 7NNW 0 1 6 1 0 0 8Total 74 197 235 82 1 0 589
Number of Calm Hours for this Table 1Number of Variable Direction Hours for this Table 0
Number.of Invalid Hours 59Number of Valid Hours for this Table 589Total Hours for the Period 8760
R-I710010-701, Rev. 0 5/30/2007s:\wp\ppi\annrpt\SQAnnual Report 2006.doc 45 of 96
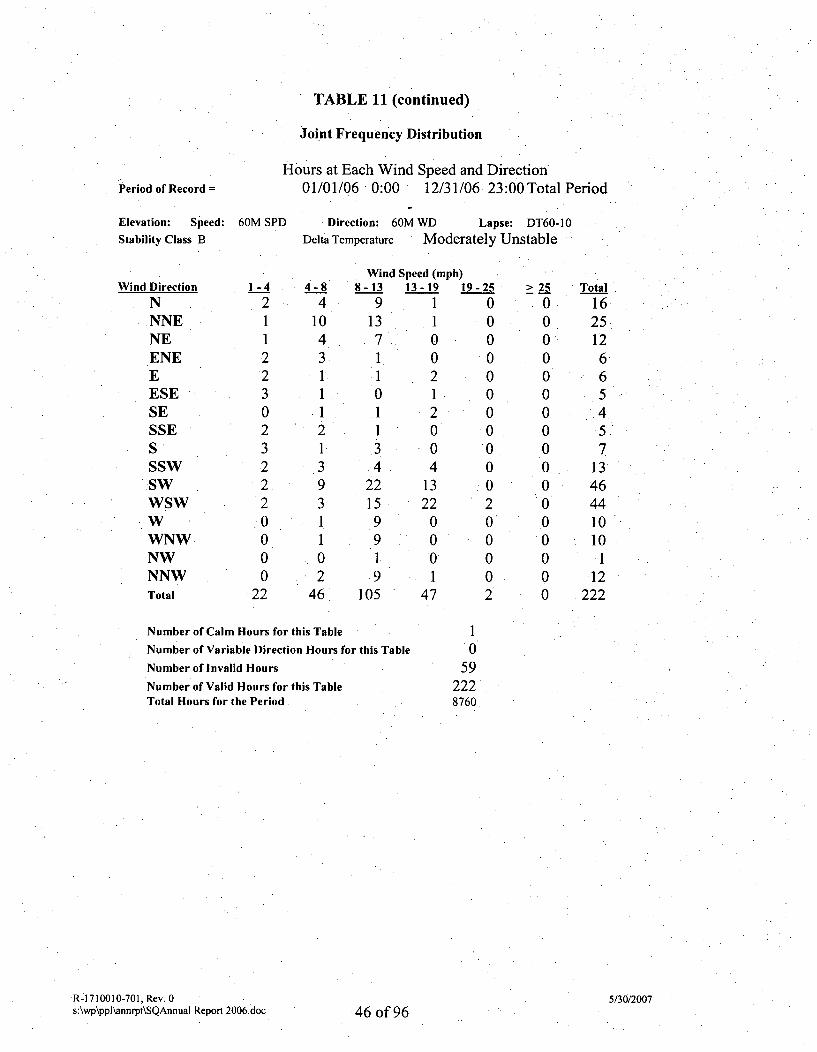
TABLE 11 (continued)
Joint Frequency Distribution
Period of Record =
Elevation: Speed:
Stability Class B
Wind Direction
NNNENEENEEESESESSESSSWSWWSWWWNWNWNNWTotal
Hours at Each Wind Speed and Direction01/01/06 0:00 12/31/06 23:00 Total Period
60M SPD Direction: 60M WD Lapse: DT60-10Delta Temperature Moderately Unstable
1-421
222
302322.20000
22
4-8
4104311.12
3931
02
46
8Wind Speed (mph-13 13-19
9 113 1
7 011
0.11
.3.42215991
19105
0212004
13220001
47
I)19-25
000000000002
00002•
> 2500000000000000000
Total
162512665
.4."5
71346441010*1
12222
Number of Calm Hours for this Table
Number of Variable Direction Hours for this Table
Number of Invalid Hours
Number of Valid Hours for this Table
Total Hours for the Period
R-1710010-701, Rev. 0s:\wp\ppl~annrpt\SQAnnual Report 2006.doc 46 of 96
10
592228760
5/30/2007
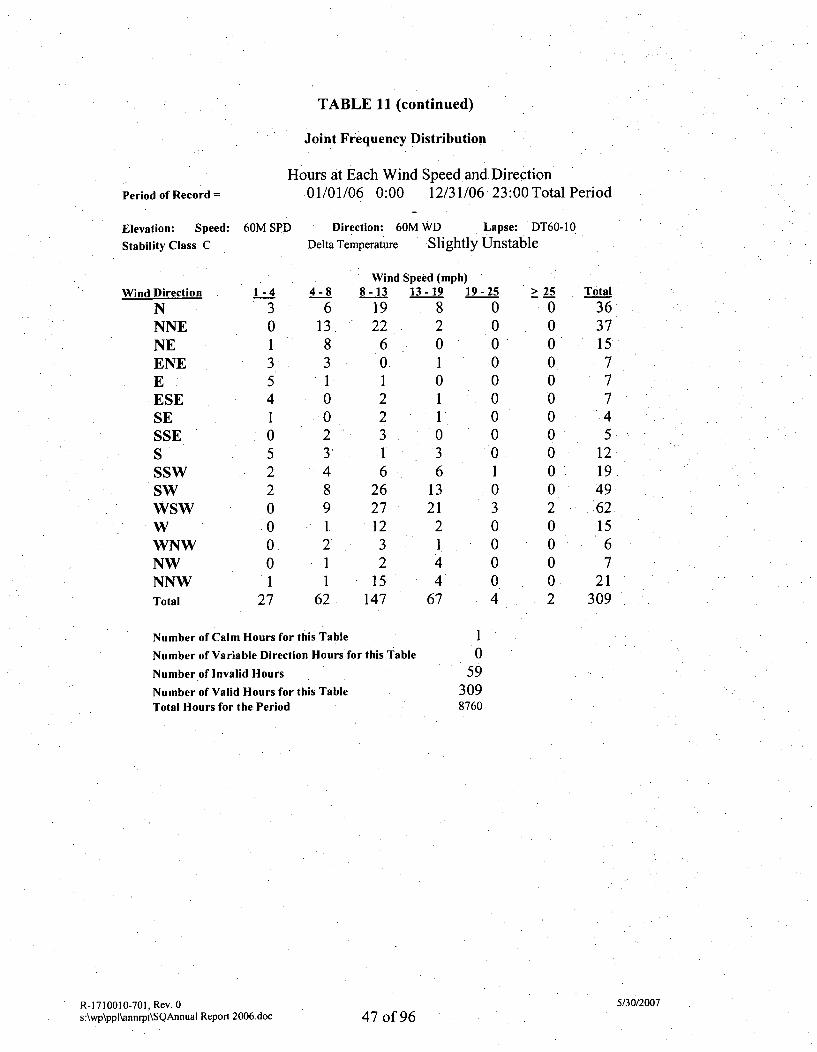
TABLE 11 (continued)
Joint Frequency Distribution
Period of Record =
Elevation: Speed:
Stability Class C
Wind Direction
NNNENEENEEESESESSE
SSSWSWWSWWWNWNWNNWTotal
Hours at Each Wind Speed and Direction•01/01/06 0:00 12/31/06 23:00 Total Period
60M SPD Direction: 60M WD Lapse: DT60-10Delta Temperature Slightly Unstable
1-4
3013541052200001
27
4-8
61383100
23
•48912
162
8
1
Wind Speed (mph)-13 13-19 119 822 2
6 00 11 02 12 13 01 36 6
26 1327 2112 23 12 4
15 447 67
9-2500000000010300004
> 25
000000
00000200002
Total363715777
45
121949621567
21309
Number of Calm Hours for this Table
Number of Variable Direction Hours for this Table
Number of Invalid Hours
Number of Valid Hours for this TableTotal Hours for the Period
10
593098760
R-1710010-701, Rev. 0s:\wp\ppl~annrpt\SQAnnual Report 2006:doc
5/30/2007
47 of 96

TABLE 11 (continued)
Joint Frequency Distribution
Hours at Each Wind Speed and Direction01/01/06 0:00 12/31/06 23:00 Total PeriodPeriod ofRecord =
Elevation: Speed:
Stability Class D
60M SPD Direction: 60M WD Lapse: DT60-10
Delta Temperature Neutral
Wind Direction
NNNENEENEEESESESSESSSWSWWSW
WNWNWNNWTotal
1-4
1133413216172132253033102I02
306
4-8
67936331212640213662
1627939394424
847
8
1
.1
1
1I114
Wind Speed (mph)-13 13-19 1.47 2255 3769 921 426 541 2530 1633 1025 1648 2938 6538 17023 8725 10075 9260 .6754 754
9-251
5501155
.10
104
7525118
12160
> 250000021
0222
19
000
37
Total
2483191828969
.11611397
104181404491285276
319265
3558
Number of Calm Hours for this Table
Number of Variable Direction Hours for this Table
Number of Invalid Hours
Number of Valid Hours for this TableTotal Hours for the Period
R-1710010-701, Rev. 0s:\wp\ppl\annrpt\SQAnnual Report 2006.doc 48 of 96
I0
593558
8760
5/30/2007
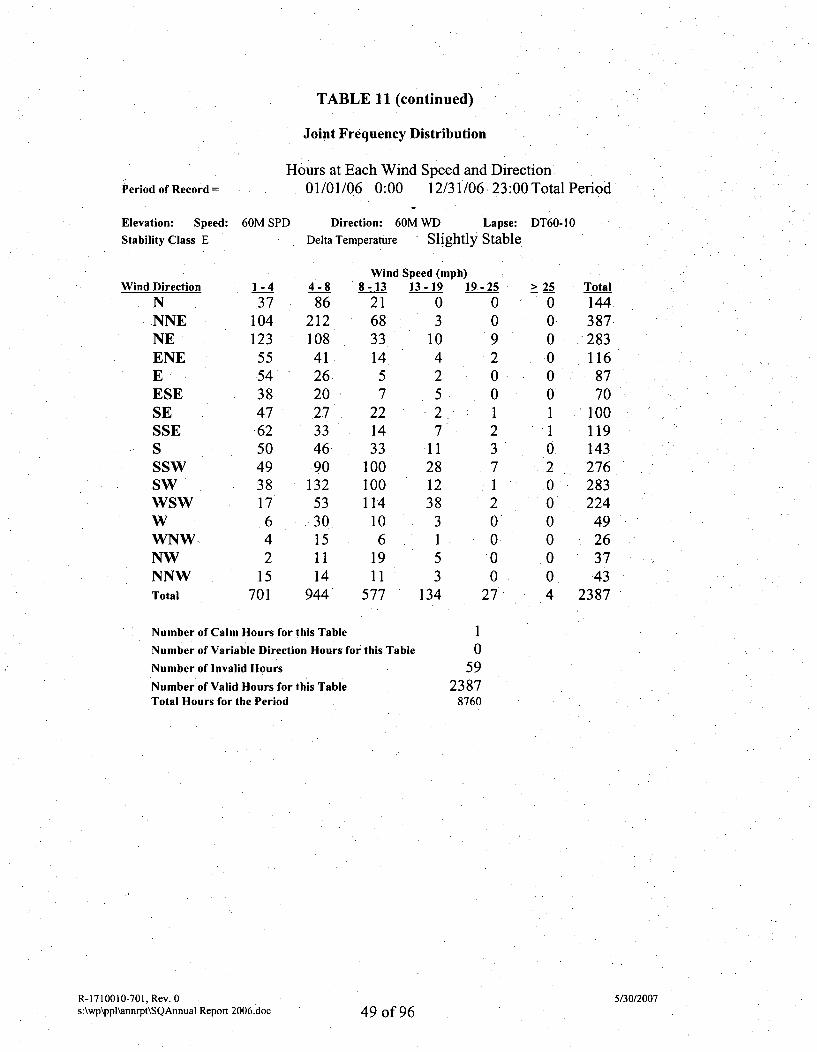
TABLE 11 (continued)
Joint Frequency Distribution
Hours at Each Wind Speed and DirectionPeriod of Record = 01/01/06 0:00 12/31/06 23:00 Total Period
Elevation: Speed: 60M SPD
Stability Class E
*Direction: 60M WD Lapse: DT60-I0
Delta Temperature Slightly Stable
Wind Direction
NNNENEENE
EESESESSESSSWSWWSWWWNW.NWNNWTotal
1-4
.37104123
55543847*62
50493817642
15701
4-8
8621210841262027334690
13253.30151114
944
8Wind Speed (mph
-13 13-19
21 068 333 101457
221433
100100114106
1911
577
42527
11
2812383153
134
i)19-25
009200
23-7
20000
27
> 25
0
00.0001
020000004
Total
144-387283116
8770
100119143276283224
49263743
2387
Number of Calm Hours for this Table
Number of Variable Direction Hours for this Table
Number of Invalid Hours
Number of Valid Hours for this TableTotal Hours for the Period
10
592387
8760,
R-1710010-701, Rev. 0s:\wp\ppl\annrpt\SQAnnual Report 2006.doc
5/30/200749 of 96
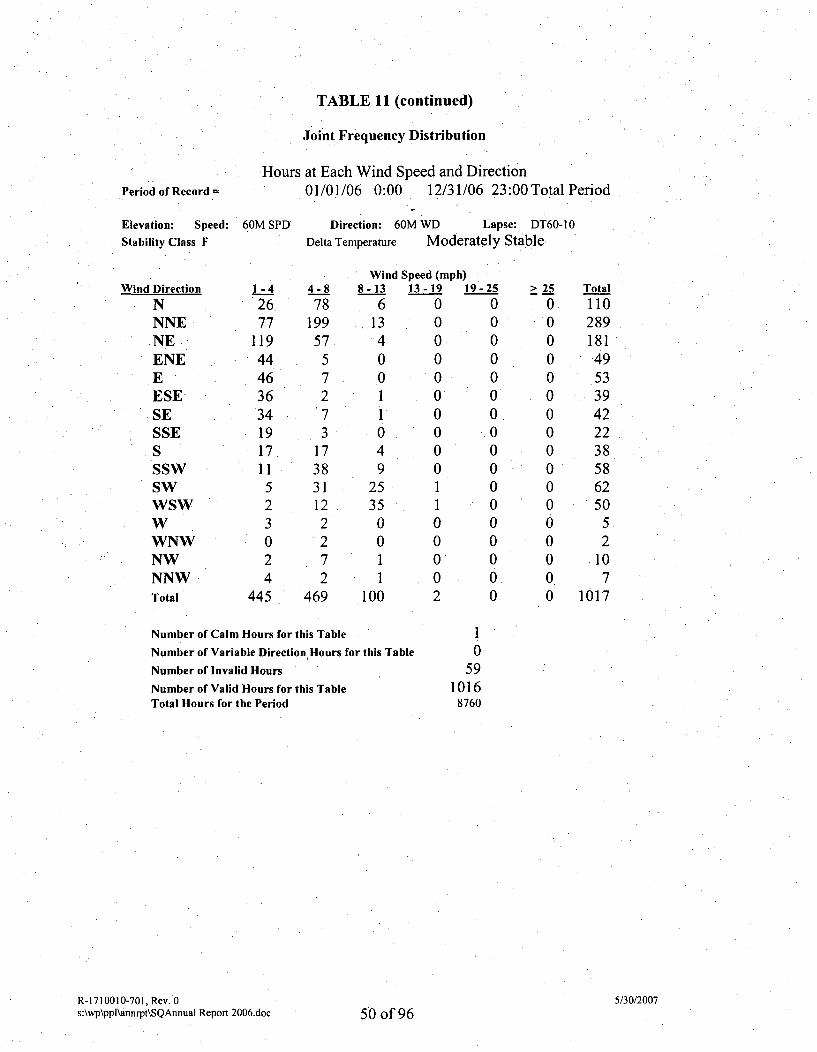
TABLE 11 (continued)
Joint Frequency Distribution
Hours at Each Wind Speed and DirectionPeriod of Record =
Elevation: Speed:
Stability Class F
Wind Direction
NNNENEENEEESESESSESSSWSWWSWWWNWNWNNWTotal
01/01/06 0:00 12/31/06 23:00 Total Period
60M SPD Direction: 60M WD Lapse: DT60-10
Delta Temperature Moderately Stable
1-4
26.77
119444636341917.11523024
445
4-8
781995757273
173831122272
469
8
1
Wind Speed (mph)-13 13-19 1
6 013 04 00 00 01 01 00 04 09 0
25 135 10 00 01 01 0
00 2
9 - 25
00000000
00000000.0
> 25
000000000000
0000
Total110289181.49533942223858625052
107
1017
Number of Calm Hours for this Table
Number of Variable Direction Hours for this Table
Number of Invalid Hours
Number of Valid Hours for this TableTotal Hours for the Period
R-1710010-701, Rev. 0s:\wp\ppi~annrpt\SQAnnual Report 2006.doc 50 of 96
10
591016
8760
5/30/2007
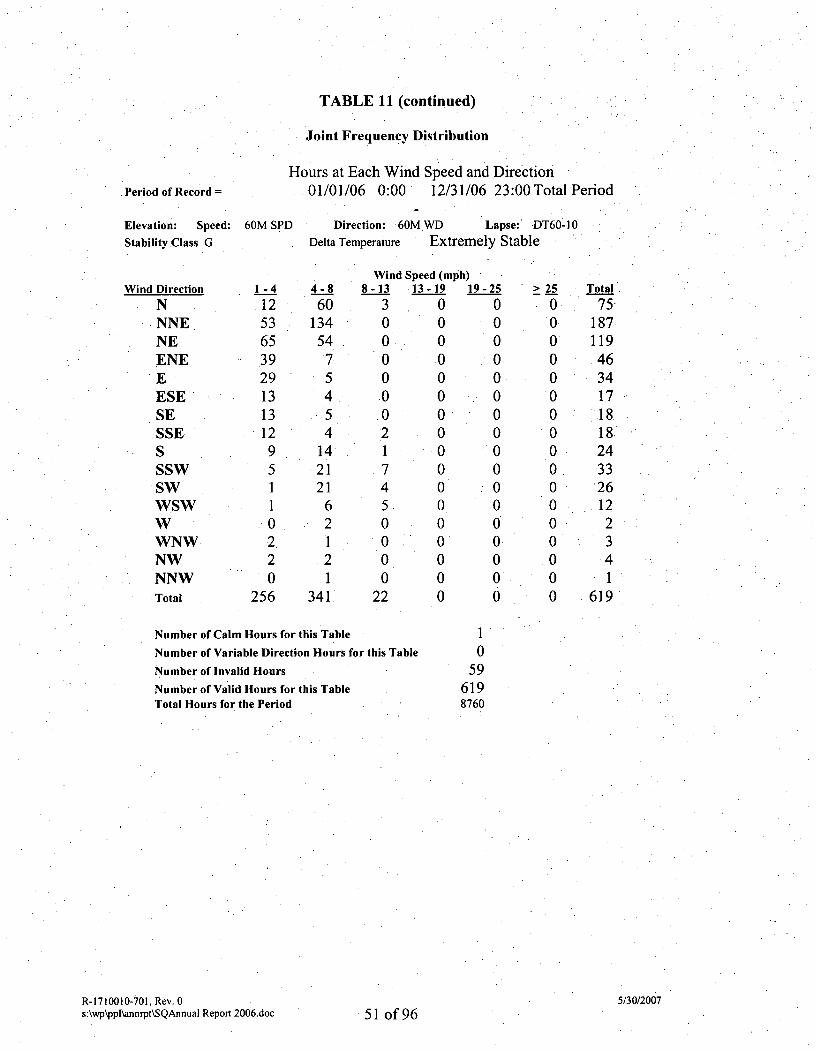
TABLE 11 (continued)
Joint Frequency Distribution
Hours at Each Wind Speed and Direction01/01/06 0:00 12/31/06 23:00 Total PeriodPeriod of Record =
Elevation: Speed:
Stability Class G
Wind Direction
NNNENEENE
EESESESSESSSWSwWSWWWNWNWNNWTotal
60M SPD
1-4
12536539291313
129511
>0
220
256
Direction: 60M WD Lapse:' DT60-10
Delta Temperature Extremely Stable
4-8
601345475454
1421216
2121
341•
8Wind Speed (mph)-13 13-19 1
3 00 00 00 00 00 00 02 01 07 04 05 00 00 00 00 0
22 0
9-25000000
000
00
000000
>; 25
00
000000000000000
Total75-.
187.119463417.18,
.18.2433261223
.41
619
Number of Calm Hours for this Table
Number of Variable Direction Hours for this Table
Number of Invalid Hours
Number of Valid Hours for this Table
Total Hours for the Period
10
596198760
R-1710010-701, Rev. 0s:\wp\ppl\annrpt\SQAnnual Report 2006.doc
5/30/200751 of 96
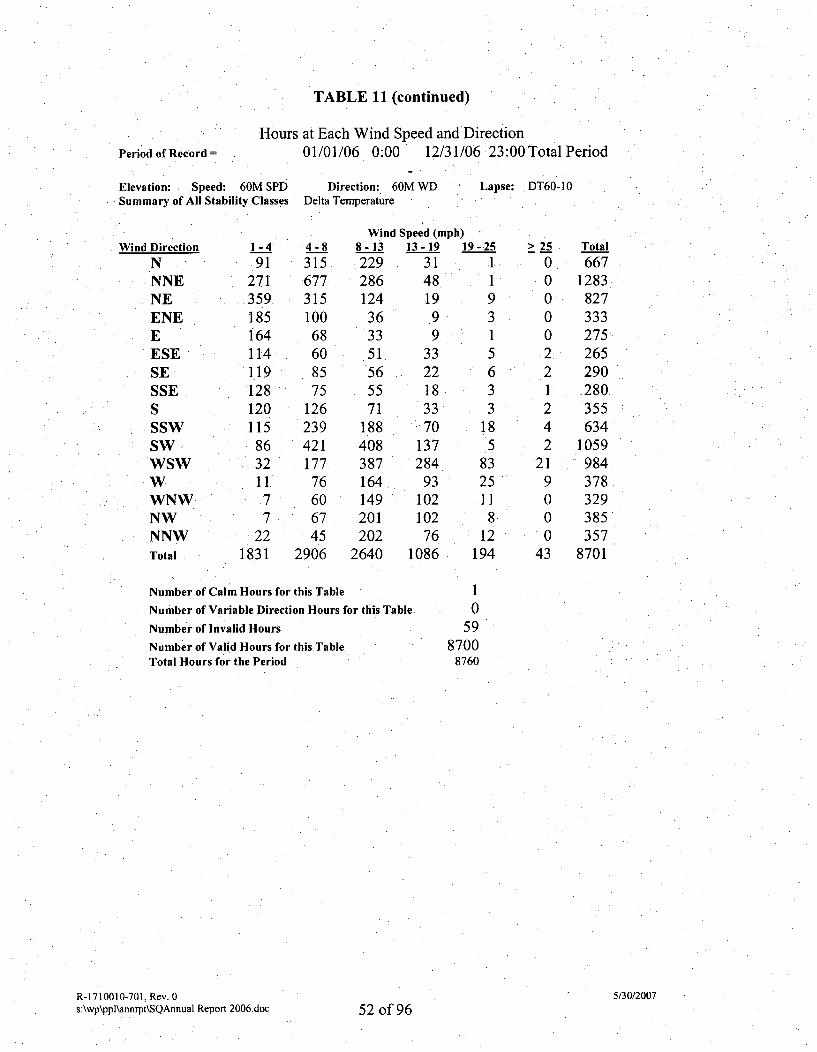
TABLE 11 (continued)
Hours at Each Wind Speed and Direction01/01/06 0:00 12/31/06 23:00 Total PeriodPeriod of Record =
Elevation: Speed: 60M SPDSummary of All Stability Classes
Direction: 60M WDDelta Temperature
Lapse: DT60-10
Wind DirectionN.NNENEENEEESESESSESSSWSWWSWWWNWNWNNWTotal
1-491
271359.185164114119
128120115
86321177
22
1831
4-831567731510068608575
12623942117776606745
2906
822
4
3
222
Wind Speed (mph)-13 13-19 1
229 31286 48.24 1936 933 951 3356 2255 1871 3388 7008 137.87 28464 9349 10201 10202 7640 1086
9-2511
9315633
185
8325
.118
12194
1069
60
> 25
00000221
242
219000
43
Total
6671283827333
275265290280355634
1059984378.329385357
8701
Number of Calm Hours for this Table
Number of Variable Direction Hours for this Table
Number of Invalid Hours
Number of Valid Hours for this TableTotal Hours for the Period
8787
R-1710010-701, Rev. 0s:\wp\ppl\annrpt\SQAnnual Report 2006.doc
5/30/2007
52 of 96
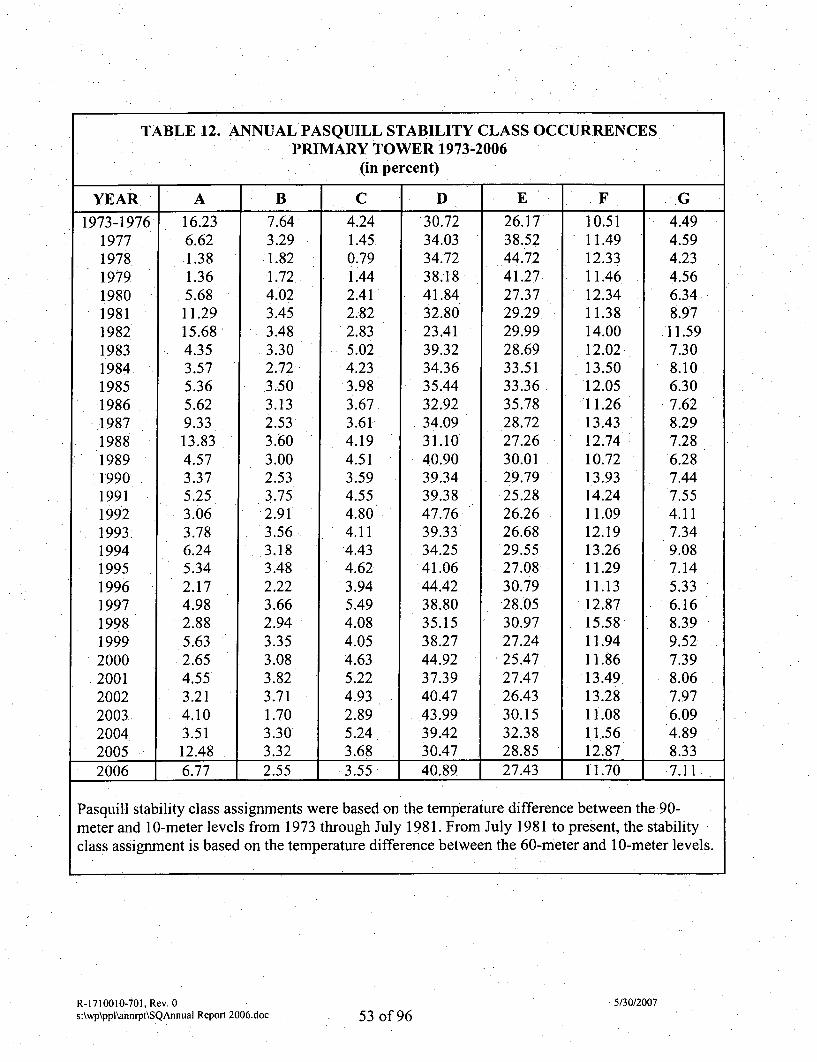
TABLE 12. ANNUAL PASQUILL STABILITY CLASS OCCURRENCESPRIMARY TOWER 1973-2006
*(in percent)
YEAR. A B C D E F G
1.973-1976 16.23 7.64 4.24 30.72 26.17 10.51 4.491977 6.62 3.29 1.45 34.03 38.52 11.49 4.591978 1.38 1.82 0.79 34.72 44.72 12.33 4.231979 1.36 1.72 1.44 38.18 41.27 11.46 4.561980 5.68 4.02 2.41 41.84 27.37 12.34 6.34,1981 11.29 3.45 2.82 32.80 29.29, 11.38 8.971982 15.68 3.48 2.83 23.41 29.99 14.00 11.591983 4.35 3.30 5.02 39.32 28.69 12.02 7.301984 3.57 2.72 4.23 34.36 33.51 13.50 8.101985 5.36 3.50 3.98 35.44 33.36 12.05 6.301986 5.62 3.13 3.67 32.92 35.78 11.26 7.621987 9.33 2.53 3.61 34.09 28.72 13.43 8.291988 13.83 3.60 4.19 31.10 27.26 12.74 7.281989 4.57 3.00 4.51 40.90 30.01 10.72 6.281990 3.37 2.53 3.59 39.34 29.79 13.93 7.441991 5.25 3.75 4.55 39.38 25.28 14.24 7.551992 3.06 2.91 4.80 47.76 26.26 11.09 4.111993: 3.78 3.56 4.11 39.33 26.68 12.19 7.341994 6.24 3.18 4.43 34.25 29.55 13.26 9.081995 5.34 3.48 4.62 41.06 27.08 11.29 7.141996 2.17 2.22 3.94 44.42 30.79 11.13 5.331997 4.98 3.66 5.49 38.80 28.05 12.87 6.161998 2.88 2.94 4.08 35.15 30.97 15.58 8.391999 5.63 3.35 4.05 38.27 27.24 11.94 9.522000 2.65 3.08 4.63 44.92 25.47 11.86 7.392001 4.55 3.82 5.22 37.39 27.47 13.49 8.062002 3.21 3.71 4.93 40.47 26.43 13.28 7.972003 4.10 1.70 2.89 43.99 30.15 11.08 6.092004 3.51 3.30 5.24 39.42 32.38 11.56 4.892005 12.48 3.32 3.68 30.47 28.85 12.87 8.332006 6.77 2.55 3.55 40.89 27.43 11.70 7.11
Pasquill stability class assignments were based on the temperature difference between the 90-meter and 10-meter levels from 1973 through July 1981. From July 1981 to present, the stabilityclass assignment is based on the temperature difference between the 60-meter and 10-meter levels.
R-1710010-701. Rev. 0 5/30/2007s:\wp\ppl\annrpt\SQAnnual Report 2006.doc 53 of 96
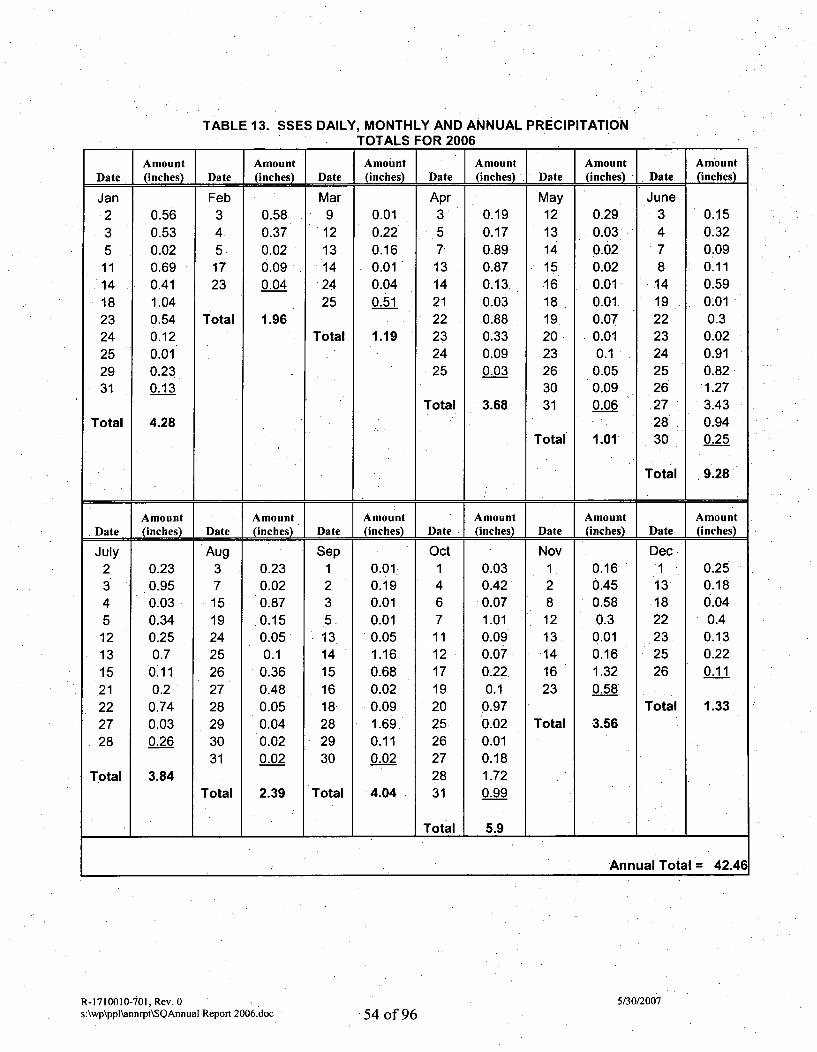
TABLE 13. SSES DAILY, MONTHLY AND ANNUAL PRECIPITATION•_ " TOTALS FOR 2006
AmutAmount Amount Amount Amount AmountDate (inches) Date. (inches) Date (inches) Date (inches) . Date (inches) Date (inches)
Jan Feb Mar Apr May June2 0.56 3 0.58 9 0.01 3 0.19 12 0.29 3 0.15
3 0.53 4 0.37 12 0.22 5 0.17 13 0.03 4 0.32
5 0.02 5 0.02 13 0.16 7 0.89 14 0.02 7 0.0911 0.69 17 0.09 14 0.01 13 0.87 15 0.02 8 0.11
14 0.41 23 0.04 24 0.04 14 0.13 16 0.01 14 0.5918 1.04 25 0.51 21 0.03 18 0.01 19 0.0123 0.54 Total 1.96 22 0.88 19 0.07 22 0.324 0.12 Total 1.19 23 0.33 20 0.01 23 0.0225 0.01 24 0.09 23 0.1 24 0.9129 0.23 25 0.03 26 0.05 25 0.8231 0.13 30 0.09 26 1.27
Total 3.68 31 0.066 27 3.43
Total 4.28 28 0.94Total 1.01 30 0.25
Total 9.28
Amount Amount Amount Amount Amount Amount
Date (inches) Date (inches) Date (inches) Date (inches). Date (inches) Date (inches)
July Aug Sep Oct Nov Dec2 0.23 3 0.23 1 0.01 1 0.03 1 0.16 1 0.253 0.95 7 0.02 2 0.19 4 0.42 2 0.45 13 0.184 0.03 15 0.87 3 0.01 6 0.07 8 0.58 18 0.045 0.34 19 0.15 5. 0.01 7 1.01 12 0.3 22 0.4
12 0.25 24 0.05 13 0.05 11 0.09 13 0.01 23 0.1313 0.7 25 0.1 14 1.16 12 0.07 14 0.16 25 0.2215 0.11 26 0.36 15 0.68 17 0.22 16 1.32 26 0.11
21 0.2 27 0.48 16 0.02 19 0.1 23 0.5822 0.74 28 0.05 18- 0.09 20 0.97 Total 1.3327 0.03 29 0.04 28 1.69 25 0.02 Total 3.5628 0.26 30 0.02 29 0.11 26 0.01
31 0.02 30 0.02 27 0.18Total 3.84 28 1.72
Total 2.39 Total 4.04 31 0.99
Total 5.9
Annual Total 42.46
R-1710010-701, Rev. 0s:\wp\ppl\annrpt\SQAnnual Report 2006.doc
5/30/2007
54 of 96
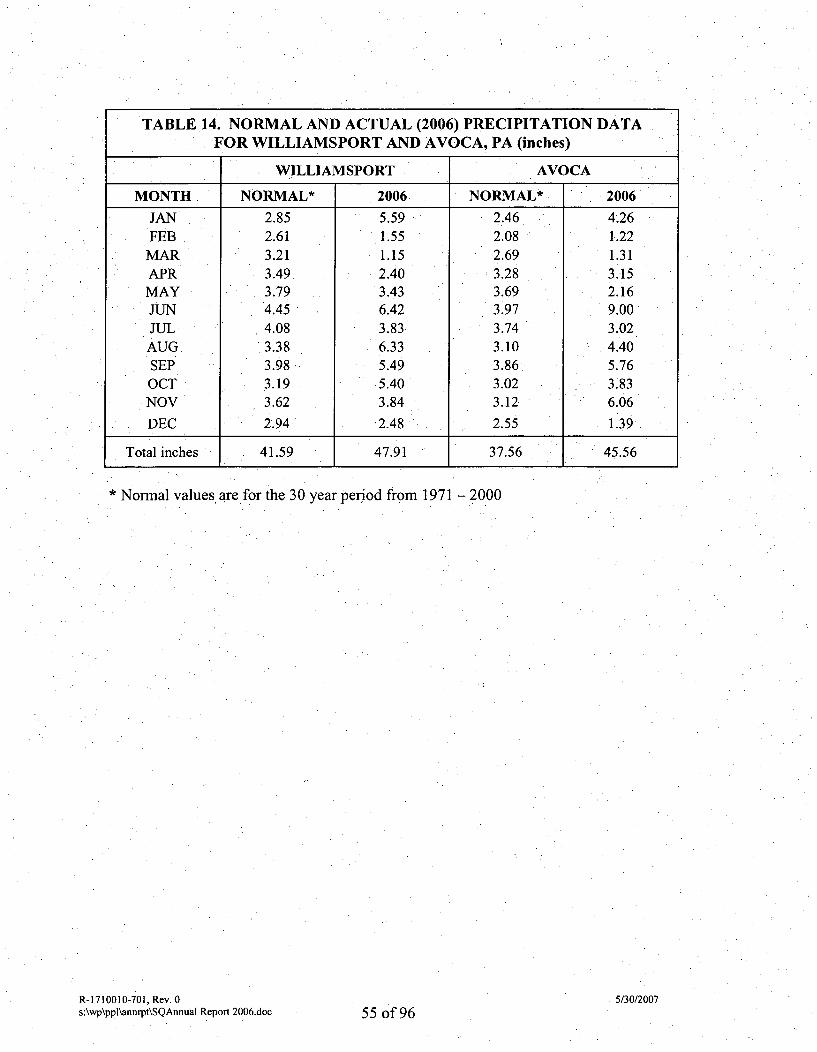
TABLE 14. NORMAL AND ACTUAL (2006) PRECIPITATION DATA
FOR WILLIAMSPORT AND AVOCA, PA (inches)
WILLIAMSPORT AVOCA
MONTH. NORMAL* 2006. NORMAL* 2006
JAN 2.85 5.59 2.46 4.26FEB 2.61 1.55 2.08 1.22
MAR 3.21 1.15 2.69 1.31APR 3.49 2.40 3.28 3.15
MAY 3.79 3.43 3.69 2.16JUN 4.45 6.42 3.97 9.00JUL 4.08 3.83 3.74 3.02
AUG 3.38 6.33 3.10 4.40SEP 3.98 5.49 3.86 5.76OCT 3.19 5.40 3.02 3.83NOV 3.62 3.84 3.12 6.06
DEC 2.94 2.48 2.55 1.39
Total inches 41.59 47.9,1 37.56 45.56
* Normal values are for the 30 year period from 1971 -2000
R-1710010-701, Rev. 0s:\wp\ppl\annrpt\SQAnnual Report 2006.doc
5/30/2007
55 of 96
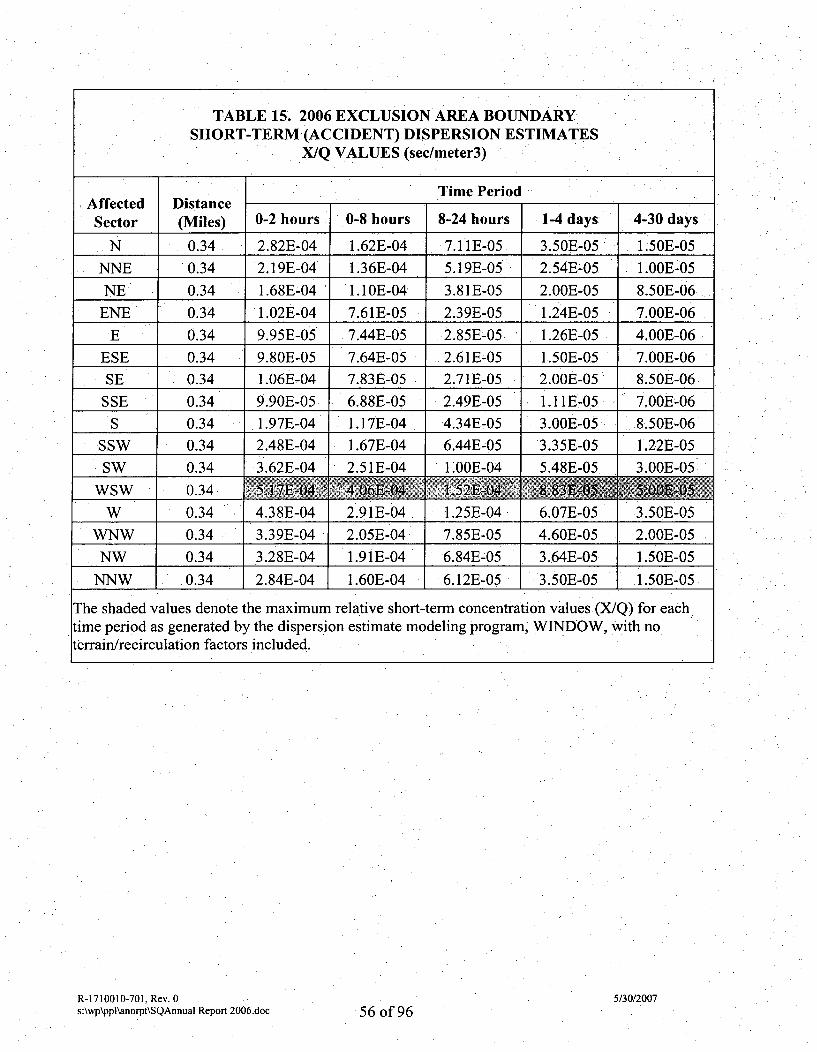
TABLE 15. 2006 EXCLUSION AREA BOUNDARYSHORT-TERM (ACCIDENT) DISPERSION ESTIMATES
X/Q VALUES (sec/meter3)
Time PeriodAffected DistanceSector (Miles) 0-2 hours •0-8 hours 8-24 hours 1-4 days 4-30 days
N 0.34 2.82E-04 1.62E-04 7.11E-05 3.50E-05 1.50E-05NNE 0.34 2.19E-04 1.36E-04 5.19E-05 2.54E-05 1.00E-05
NE 0.34 1.68E-04 A.IOE-04 3.81E-05 2.OOE-05 8.50E-06ENE 0.34 1.02E-04 7.61E-05 2.39E-05 1.24E-05 7.OOE-06
E • 0.34 9.95E-05 7.44E-05 2.85E-05 1.26E-05 4.OOE-06
ESE 0.34 9.80E-05 7.64E-05 2.61E-05 1.50E-05 7.OOE-06SE 0.34 1.06E-04 7.83E-05 2.71E-05 2.OOE-05 8.50E-06
SSE 0.34 9.90E-05 6.88E-05 2.49E-05 1.1 !E-05 7.OOE-06S 0.34 1.97E-04 1.17E-04 4.34E705 3.OOE-05 8.50E-06
SSW 0.34 2.48E-04 1.67E-04 6.44E-05 3.35E-05 1.22E-05SW 0.34 3.62E-04 2.5 1E-04 L.OOE-04 5.48E-05 3.OOE-05
WSW 0.34 .j_57EA-4~ 4.0E0- _L21F04 83E5 5OE0-5W 0.34 4.38E-04 2.91E-04 1.25E-04 6.07E-05 3.50E-05
WNW 0.34 3.39E-04 2.05E-04 7.85E-05 4.60E-05 2.OOE-05NW 0.34 3.28E-04 1.91 E-04 6.84E-05 3.64E-05 1.50E-05
NNW 0.34 2.84E-04 1.60E-04 6.12E-05 3.50E-05 1.50E-05
The shaded values denote the maximum relative short-term concentration values (X/Q) for eachtime period as generated by the dispersion estimate modeling program, WINDOW, With noterrain/recirculation factors included.
R-1710010-701, Rev. 0s:\wp\pplhannrpt\SQAnnual Report 2006.doc
5/30/200756 of 96
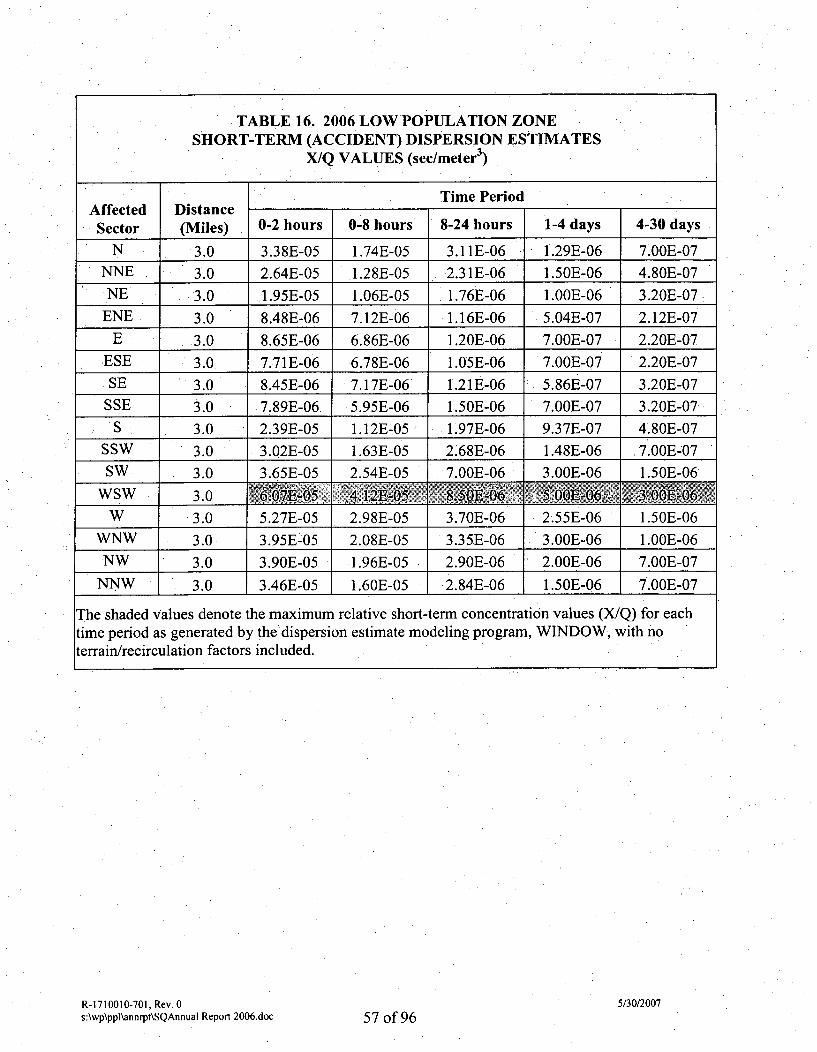
TABLE 16. 2006 LOW POPULATION ZONESHORT-TERM (ACCIDENT) DISPERSION ESTIMATES
X/Q VALUES (sec/meter3)
Time PeriodAffected DistanceSector (Miles) 0-2 hours 0-8 hours 8-24 hours 1-4 days 4-30 days
N 3.0 3.38E-05 1.74E-05 3.11E-06 1.29E-06 7.00E-07NNE 3.0 2.64E-05. 1.28E-05 2.31E-06 1.50E-06 4.80E-07
NE .3.0 .1.95E-05 1.06E-05 1.76E-06 1.00E-06 3.20E-07
ENE 3.0 8.48E-06 7.12E-06 1.16E-06 5.04E-07 2.12E-07
E 3.0 8.65E-06 6.86E-06 1.20E-06 7.OOE-07 2.20E-07
ESE 3.0 7.71E-06 6.78E-06 1.05E-06 7.OO&E07 2.20E-07
SE 3.0 8.45E-06 7.17E-06 1.21E-06 5.86E-07 3.20E-07
SSE 3.0 7.89E-06. 5.95E-06 1.50E-06 7.OOE-07 3.20E-07
S 3.0 2.39E-05 1.12E-05 1.97E-06 9.37E-07 4.80E-07SSW 3.0 3.02E-05 1.63E-05 2~68E-06 1.48E-06 7.00E-07
SW 3.0 3.65E-05 2.54E-05 7.OOE-06 3.OOE-06 1.50E-06
WSW 3.0 6.07E0 4.12E-0 _ E-06 5_.00E- 0,0___' • 3OOE-0
W 3.0 5.27E-05 2.98E-05 3.70E-06 2.55E-06 1.50E-06
WNW 3.0 3.95E-05 2.08E-05 3.35E-06 3.OOE-06 1.OOE-06
NW 3.0 3.90E-05 1.96E-05 2.90E-06 2.OOE-06 7.OOE-07
NNW 3.0 3.46E-05 1.60E-05 2.84E-06 1.50E-06 7.OOE-07
The shaded values denote the maximum relative short-term concentration values (X/Q) for eachtime period as generated by the dispersion estimate modeling program, WINDOW, with noterrain/recirculation factors included.
R-1710010-701, Rev. 0s:\wp\ppl\annrpt\SQAnnual Report 2006.doc
5/30/2007
57 of 96
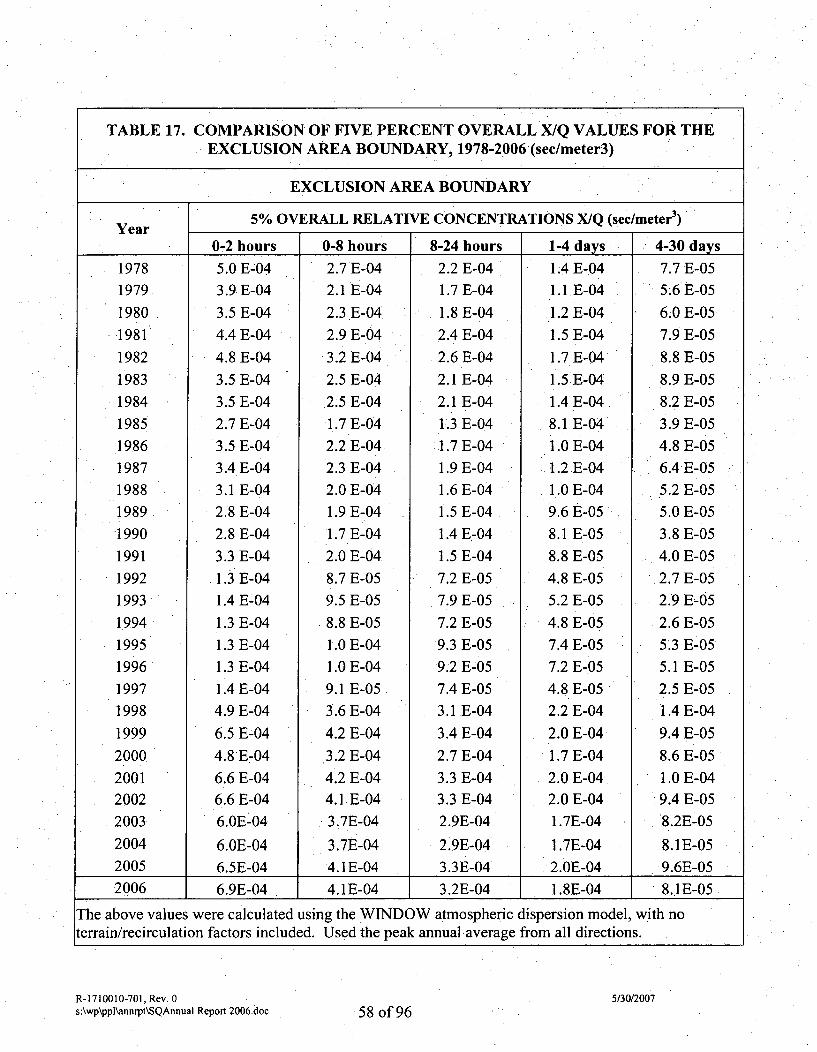
TABLE 17. COMPARISON OF FIVE PERCENT OVERALL X/Q VALUES FOR THEEXCLUSION AREA BOUNDARY, 1978-2006 (sec/meter3)
EXCLUSION AREA BOUNDARY
5% OVERALL RELATIVE CONCENTRATIONS X/Q (sec/meter 3)Year 0-2 hours 0-8 hours !8-24 hours 1-4 days 4-30 days
19781979
19801981
198219831984
19851986
19871988
19891990
1991
19921993199419951996199719981999
2000
200120022003
20042005
5.0 E-043.9 E-04
3.5 E-04
4.4 E-044.8 E-043.5 E-04
3.5 E-042.7 E-043.5 E-043.4 E-043.1 E-042.8 E-042.8 E-043.3 E-04
1.3 E-041.4 E-04
1.3 E-04
1.3 E-041.3 E-041.4 E-044.9 E-04
6.5 E-044.8 E-04
6.6 E-046.6 E-046.OE-04
6.OE-046.5E-04
2.7 E-042.1 E-04
2.3 E-04.
2.9 E-043.2 E-042.5 E-042.5 E-041.7 E-042.2 E-042.3 E-042.0 E-041.9 E-041.7 E-042.0 E-04
8.7 E-059.5 E-058.8 E-051.0 E-041.0 E-049.1 E-053.6 E-04
4.2 E-04
3.2 E-04
4.2 E-044.1 E-043.7E-04
3.7E-044.1E-04
2.2 E-041.7 E-04
1.8 E-042.4 E-04
2.6 E-042.1 E-04
2.1 E-041.3 E-041.7 E-04
1.9 E-041.6 E-04
1.5 E-041.4 E-041.5 E-04
7.2 E-057.9 E-05
7.2 E-059.3 E-059.2 E-05
7.4 E-053.1 E-043.4 E-04
2.7 E-043.3 E-043.3 E-042.9E-04
2.9E-043.3E-04
.1.4 E-041.1 E-04
1.2 E-04
1.5 E-041.7 E-041.5 E-041.4 E-048.1 E-0411.0 E-04
.1.2 E-041.0 E-049.6 E-058.1 E-058.8 E-05
4.8 E-055.2 E-05
4.8 E-057.4 E-057.2 E-054.8 E-052.2 E-04
2.0 E-04
1.7 E-042.0 E-042.0 E-041.7E-04
1.7E-042.OE-04
7.7 E-055.6 E-05
6.0 E-057.9 E-058.8 E-058.9 E-058.2 E-053.9 E-054.8 E-056.4 E-055.2 E-055.0 E-053.8 E-054.0 E-052.7 E-052.9 E-052.6 E-055.3 E-055.1 E-052.5 E-051.4 E-04
9.4 E-058.6 E-051.0 E-049.4 E-058.2E-05
8.1E-059.6E-05
2006 6.9E-04 4.1E-04 3.2E-04 1.8E-04 8.1E-05
The above values were calculated using the WINDOW atmospheric dispersion model, with noterrain/recirculation factors included. Used the peak annualaverage from all directions.
R-1710010-701, Rev. 0s:\wp\pplkannrpt\SQAnnual Report 2006.doc
5/30/2007
58 of 96
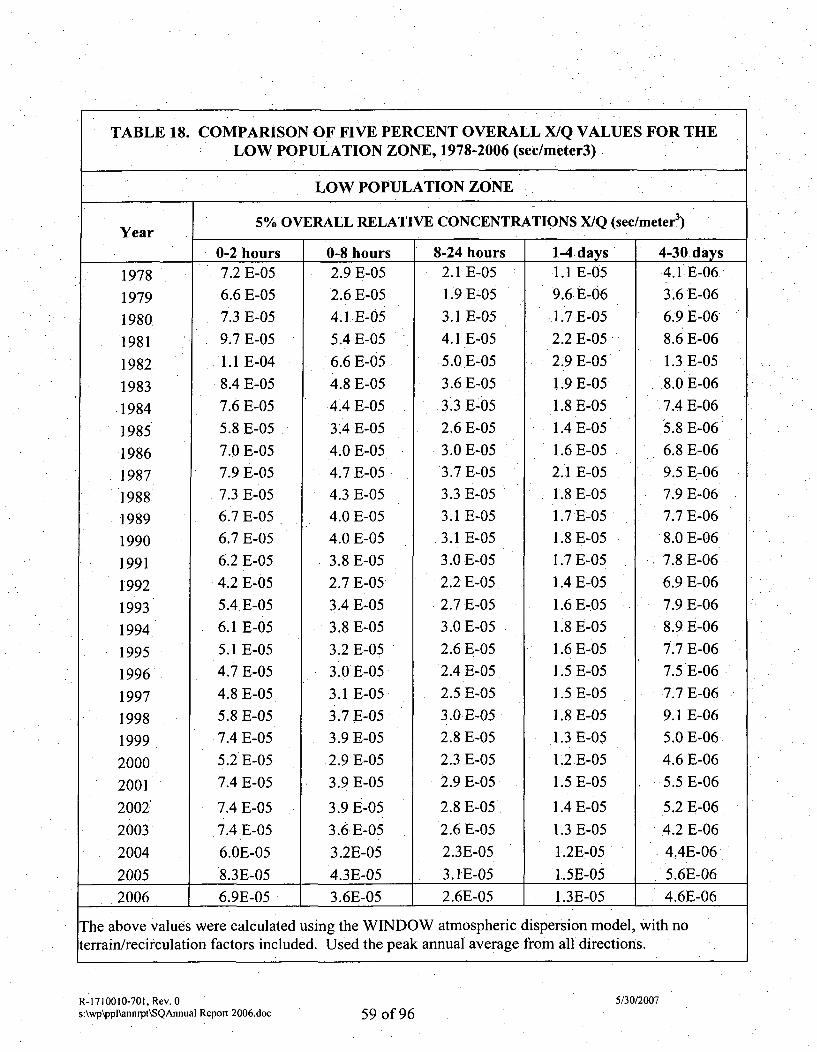
TABLE 18. COMPARISON OF FIVE PERCENT OVERALL X/Q VALUES FOR THELOW POPULATION ZONE, 1978-2006 (sec/meter3)
LOW POPULATION ZONE
5% OVERALL RELATIVE CONCENTRATIONS X/Q (sec/meter3)Year
0-2 hours 0F-8 hours 8-24 hours 1-4 days 4-30 days
1978
19791980.1981
198219831984
19851986
i987.198819891990199119921993
199419951996199719981999
20002001
2002:
2003
2004
2005
7.2 E-056.6 E-05
7.3 E-05
9.7 E-05
1.1 E-048.4 E-05
7.6 E-055.8 E-057.0 E-057.9 E-057.3 E-056.7 E-056.7 E-056.2 E-054.2 E-055.4E-056.1 E-055.1 E-054.7 E-054.8 E-055.8 E-057.4 E-055.2 E-057.4 E-05
7.4 E-057.4 E-056.OE-05
8.3E-05
2.9 E-052.6 E-054.1 E-055.4 E-056.6 E-054.8 E-054.4 E-05
3.4 E-054.0 E-054.7 E-054.3 E-054.0 E-054.0 E-053.8 E-052.7 E-053.4 E-053.8 E-053.2 E-053.0 E-053.1 E-053.7 E-053.9 E-052.9 E-053.9 E-05
3.9 E-053.6 E-053.2E-054.3E-05
2.1 E-051.9 E-053.1 E-054.1 E-05•5.0 E-053.6 E-053.3 E-052.6 E-053.0 E-053.7 E-053.3 E-053.1 E-053.1 E-053.0 E-052.2 E-05O2.7 E-053.0 E-052.6 E-052.4 E-052.5 E-053.0 E-052.8 E-052.3 E-052.9 E-05
2.8 E-052.6 E-052.3E-05
3. 1E-05
1.1 E-059.6 E-06
1.7 E-052.2 E-052.9 E-051.9 E-051.8 E-051.4 E-051.6 E-052.1 E-051.8 E-051.7 E-051.8 E-051.7 E-051.4 E-051.6 E-051.8 E-051.6 E-051.5 E-051.5 E-051.8 E-051.3 E-051.2 E-051.5 E-05
1.4 E-051.3 E-051.2E-05
1.5E-05
•4.1 E-06.
3.6 E-06
6.9 E-06
8.6 E-061.3 E-058.0 E-06
7.4 E-065.8 E-06
6.8 E-069.5 E-067.9 E-067.7 E-068.0 E-067.8 E-06
6.9 E-06
7.9 E-068.9 E-06
7.7 E-067.5 E-067.7 E-06
9.1 E-065.0 E-06
4.6 E-065.5 E-06
5.2 E-06E4.2 -06
4,4E-06
S5.6E-06
2006 6.9E-05 3.6E-05 2.6E-05 1.3E-05 4.6E-06.
The above values were calculated using the WINDOW atmospheric dispersion model, with noterrain/recirculation factors included. Used the peak annual average from all directions.
R-1710010-701, Rev. 0s:\wp\ppl\annrpt\SQAnnual Report 2006.doc
5/30/200759 of 96
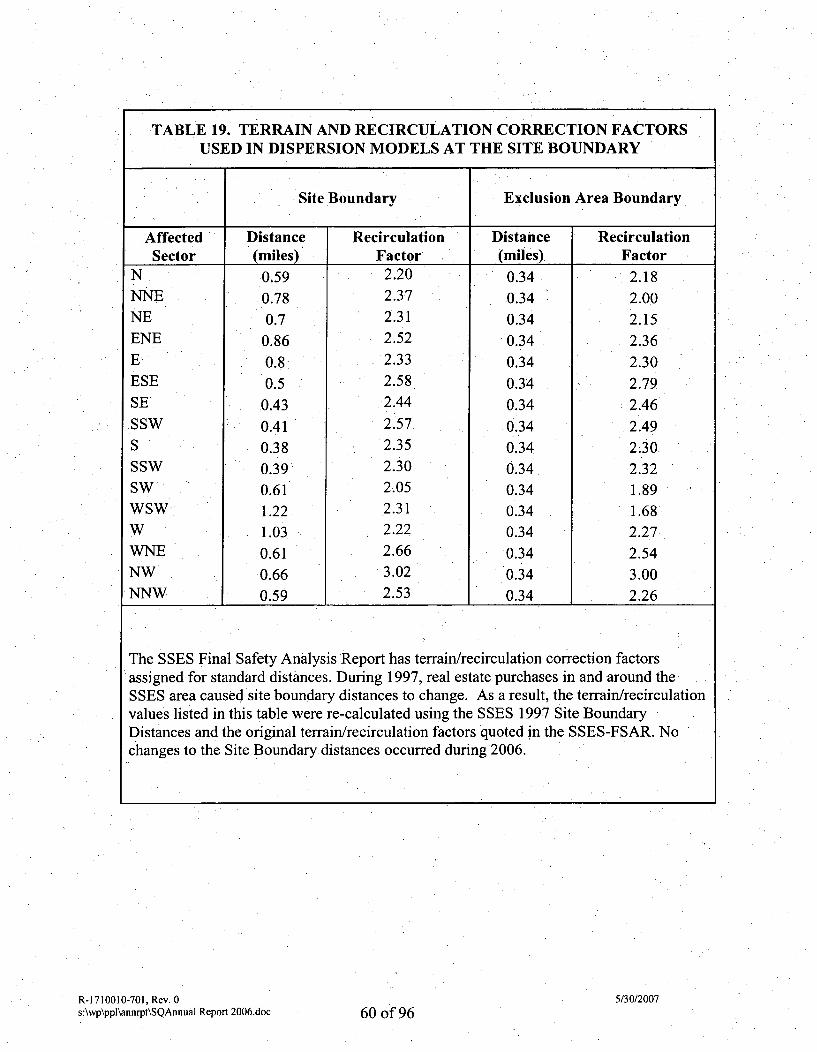
TABLE 19. TERRAIN AND RECIRCULATION CORRECTION FACTORSUSED IN DISPERSION MODELS AT THE SITE BOUNDARY
Site Boundary Exclusion Area Boundary
Affected Distance Recirculation Distance RecirculationSector (miles)' Factor (miles) Factor
N 0.59 2.20 0.34 2.18
NNE •0.78 2.37 0.34 2.00
NE 0.7 2.31 0.34 2.15
ENE 0.86 2.52 0.34 2.36
E 0.8 2.33 0.34 2.30
ESE 0.5 2.58 0.34 2.79
SE 0.43 2.44 0.34 2.46
SSW 0.41 2.57 .0.34 2.49
S 0.38 2.35 0.34 2.30SSW 0.39 2.30 0.34 2.32
SW 0.61 2.05 0.34 1.89
WSW 1.22 2.31 0.34 1.68
W• , 1.03 2.22 0.34 2.27
WNE 0.61 2.66 0.34 2.54
NW 0.66 3.02 0.34 3.00
NNW 0.59 2.53 0.34 2.26
The SSES Final Safety Analysis Report has terrain/recirculation correction factorsassigned for standard distances. During 1997, real estate purchases in and around the,SSES area caused site boundary distances to change. As a result, the terrain/recirculationvalues listed in this table were re-calculated using the SSES 1997 Site BoundaryDistances and the original terrain/recirculation factors quoted in the SSES-FSAR. Nochanges to the Site Boundary distances occurred during 2006.
R-1710010-701, Rev. 0s:\wp\ppl\annrpt\SQAnnual Report 2006.doc
5/30/2007
60 of 96
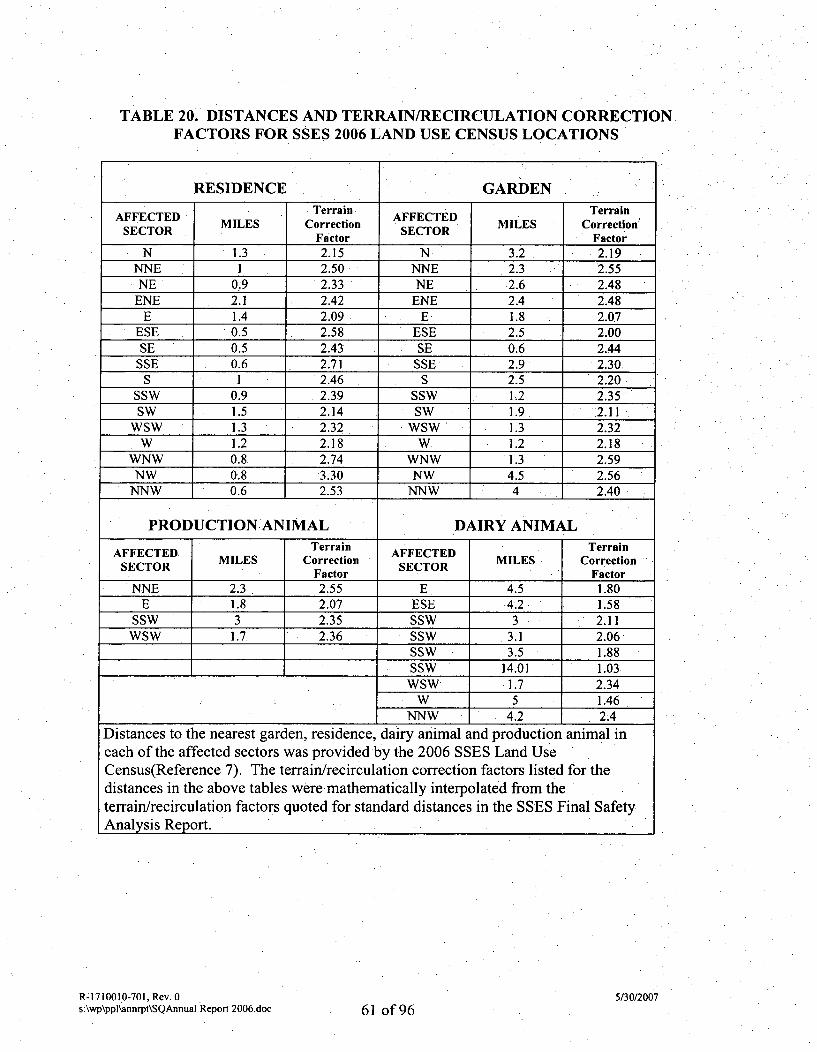
TABLE 20.' DISTANCES AND TERRAIN/RECIRCULATION CORRECTIONFACTORS FOR SSES 2006 LAND USE CENSUS LOCATIONS
RESIDENCE GARDEN. TerainTerrain
AFFECTED Terrain AFFECTED M SrreinSETR MILES Correction SETR MILES Correction"
SECTOR Corcto SECTORFactor Factor
N 1.3 2.15 N 3.2 2.19NNE 1 2.50 NNE 2.3 2.55NE 0.9 2.33 NE 2.6 2.48
ENE 2.1 2.42 ENE 2.4 2.48E 1.4 2.09 E 1.8 2.07
ESE 0.5 2.58 ESE 2.5 2.00SE 0.5 2.43 SE 0.6 2.44
SSE 0.6 2.71 SSE 2.9 2.30S 1 2.46 S 2.5 2.20
SSW 0.9 2.39 SSW 1.2 2.35SW 1.5 2.14 SW 1.9 .2.11
WSW 1.3 2.32 WSW 1.3 2.32W 1.2 2.18 W 1.2 2.18
WNW 0.8 2.74 WNW 1.3 2.59NW 0.8 3.30 NW 4.5 2.56
NNW 0.6 2.53 NNW 4 2.40
PRODUCTION ANIMAL DAIRY ANIMALTerrain TerrainAFFECTED MILES Correction AFFECTED MILES Correction
SECTOR SECTORSI_______ Factor FactorNNE 2.3 2.55 E 4.5 1.80
E 1.8 2.07 ESE 4.2 1.58SSW 3 2.35 SSW 3 2.11
WSW 1.7, 2.36 SSW .3.1 2.06SSW 3.5 1.88SSW 14.01 1.03
WSW •1.7 2.34W 5 1.46
NNW 4.2 2.4
Distances to the nearest garden, residence, dairy animal and production animal ineach of the affected sectors was provided by the 2006 SSES Land UseCensus(Reference 7). The terrain/recirculation correction factors listed for thedistances in the above tables were mathematically interpolated from theterrain/recirculation factors quoted for standard distances in the SSES Final SafetyAnalysis Report.
R-1710010-701, Rev. 0s:\wp\ppikannrpt\SQAnnual Report 2006.doc
5/30/200761 of 96
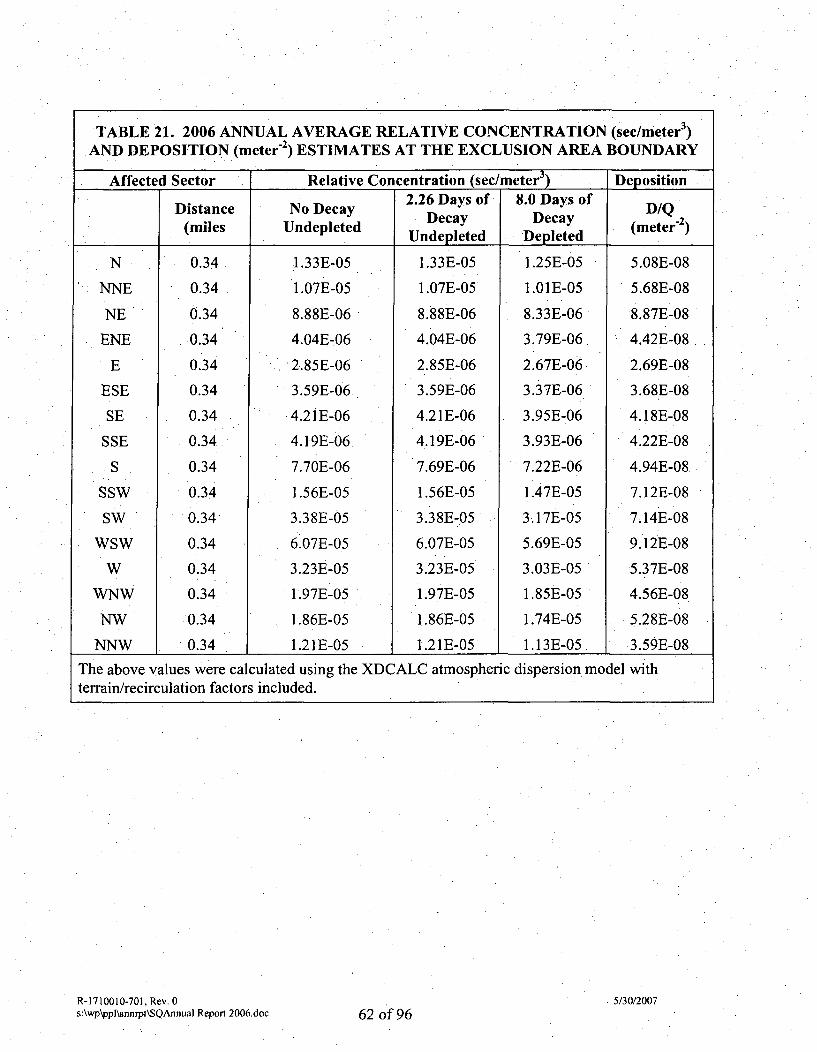
TABLE 21. 2006 ANNUAL AVERAGE RELATIVE CONCENTRATION (sec/meter 3).AND DEPOSITION (meter-) ESTIMATES AT THE EXCLUSION AREA BOUNDARY
Affected Sector Relative Concentration (sec/meter3) DepositionDistance No Decay 2.26 Days of 8.0 Days of D/Q
D Decay Decay (meer2(miles Undepleted Undepleted Depleted (meter
N 0.34 1.33E-05 1.33E-05 1.25E-05 5.08E-08
NNE 0.34 1.07E-05 1.07E-05 1.01E-05 5.68E-08
NE 0.34 8.88E-06 8.88E-06 8.33E-06 8.87E-08
ENE 0.34 4.04E-06 4.04E-06 3.79E-06 4.42E-08
E 0.34 2.85E-06 2.85E-06 2.67E-06 2.69E-08
ESE 0.34 3.59E-06 3.59E-06 3.37E-06 3.68E-08
SE 0.34 4.2iE-06 4.21E-06 3.95E-06 4.18E-08
SSE 0.34 4.19E-06 4.19E-06 3.93E-06 4.22E-08
S 0.34 7.70E-06 7.69E-06 7.22E-06 4.94E-08
SSW 0.34 1.56E-05 1.56E-05 1.47E-05 7.12E-08
SW 0.34 3.38E-05 3.38E-05 3.17E-05 7.14E-08
WSW 0.34 6.07E-05 6.07E-05 5.69E-05 9.12E-08
W 0.34 3.23E-05 3.23E-05 3.03E-05 5.37E-08
WNW 0.34 1.97E-05 1.97E-05 1.85E-05 4.56E-08
NW 0.34 1.86E-05 1.86E-05 1.74E-05 5.28E-08
NNW 0.34 1.21E-05 1.21E-05 1..13E-05 3.59E-08
The above values were calculated using the XDCALC atmospheric dispersion model withterrain/recirculation factors included.
R-1710010-701, Rev. 0s:\wp\ppJ\annrpt\SQAnnual Report 2006.doc
5/30/2007
62 of 96
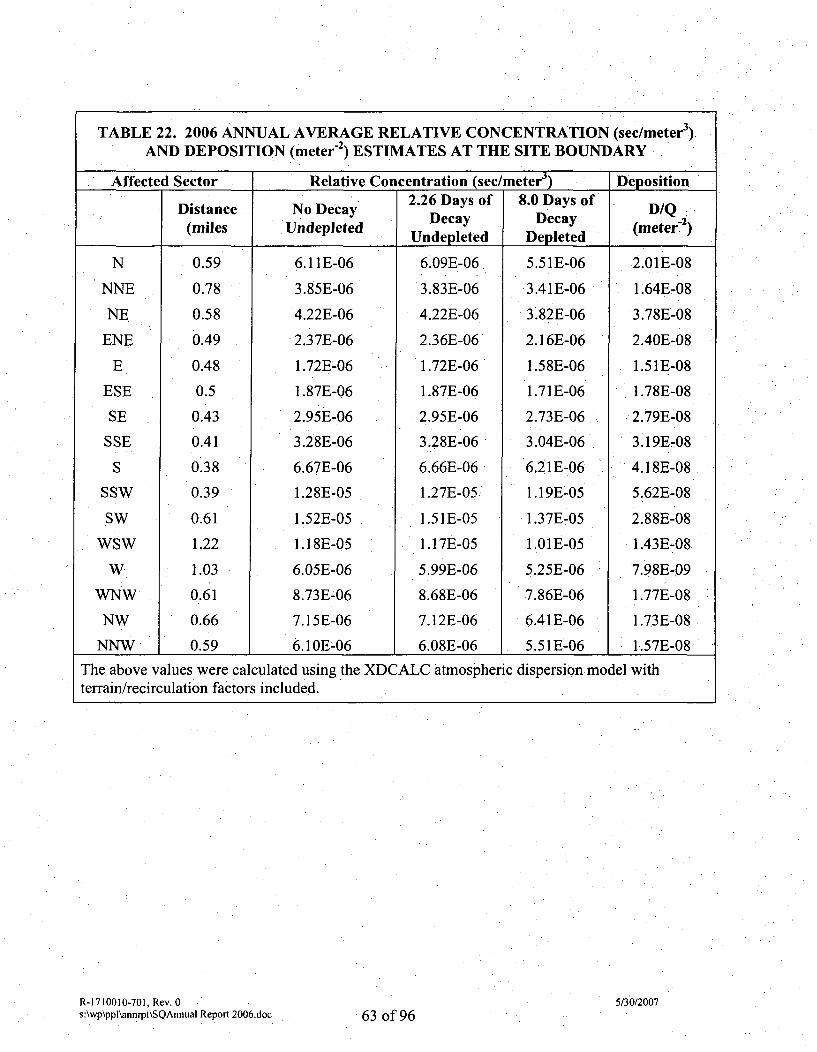
TABLE 22. 2006 ANNUAL AVERAGE RELATIVE CONCENTRATION (sec/meter3)AND DEPOSITION (meter-2) ESTIMATES AT THE SITE BOUNDARY
Affected Sector Relative Concentration (sec/meter 3) DepositionDistance No Decay 2.26 Days of 8.0 Days of D/Q
(miles Undepleted Decay Decay -2• . Undepleted Depleted (meter.
N 0.59 6.11E-06 6.09E-06 5.51E-06 2.01E-08
NNE 0.78 3.85E-06 3.83E-06 3.41E-06 1.64E-08
NE 0.58 4.22E-06 4.22E-06 3.82E-06 3.78E-08
ENE 0.49 2.37E-06 2.36E-06 2.16E-06 2.40E-08
E 0.48 1.72E-06 1.72E-06 1.58E-06 1.51E-08
ESE 0.5 1.87E-06 1.87E-06 1.71E-06 1.78E-08
SE 0.43 2.95E-06 2.95E-06 2.73E-06 2.79E-08
SSE 0.41 3.28E-06 3.28E-06 3.04E-06 3.19E-08
S 0.38 6.67E-06 6.66E-06 6.21E-06 4.18E-08
SSW 0.39 1.28E-05 1.27E-05 1.19E-05 5.62E-08
SW 0.61 1.52E-05 1.51E-05 1.37E-05 2.88E-08
WSW 1.22 1.18E-05 1.17E-05 1.01E-05 1.43E-08
W 1.03 6.05E-06 5.99E-06 5.25E-06 7.98E-09
WNW 0.61 8.73E-06 8.68E-06 7.86E-06 1.77E-08
NW 0.66 7.15E-06 7.12E-06 6.41E-06 1.73E-08
NNW 0.59 6.1OE-06 6.08E-06 5.51E-06 1.57E-08
The above values were calculated using the XDCALC atmospheric dispersion model withterrain/recirculation factors included.
R-1710010-701, Rev. 0s:\wp\ppl\annrpt\SQAnnual Report 2006.doc
5/30/2007
63 of 96
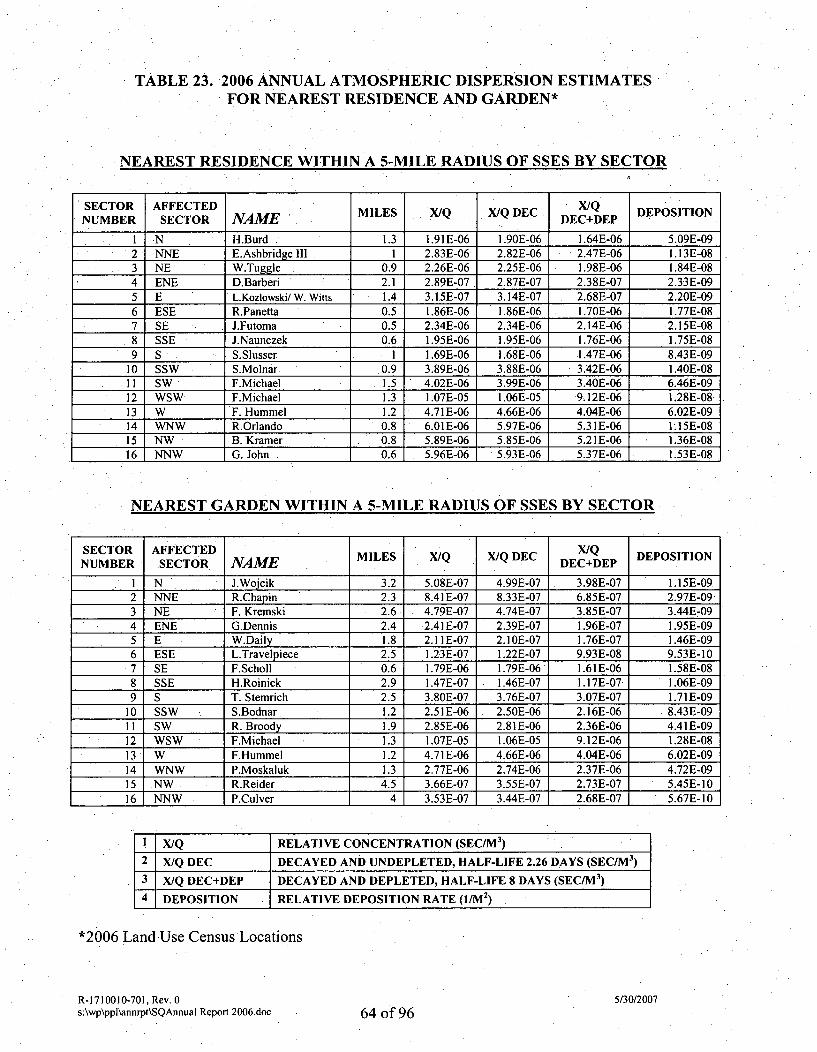
TABLE 23. 2006 ANNUAL ATMOSPHERIC DISPERSION ESTIMATESFOR NEAREST RESIDENCE AND GARDEN*
NEAREST RESIDENCE WITHIN A 5-MILE RADIUS OF SSES BY SECTOR
SECTOR AFFECTED X/QNUMBER SECTOR NAME MILES X/Q X/Q DEC DEC+DEP DEPOSITION
1 N H.Burd 1.3 1.91E-06 1.90E-06 1.64E-06 5.09E-092 NNE E.Ashbridge III I 2.83E-06 2.82E-06 2.47E-06 1.13E-083 NE W.Tuggle 0.9 2.26E-06 2.25E-06 1.98E-06 1.84E-084 ENE D.Barberi 2.1 2.89E-07 2.87E-07 2.38E-07 2.33E-095 E L.Kozlowski/W. Witts 1.4 3.15E-07 3.14E-07 2.68E-07 2.20E-09
6 ESE R.Panetta 0.5 1.86E-06 1.86E-06 1.70E-06 1.77E-087 SE J.Futoma 0.5 2.34E-06 2.34E-06 2.14E-06 2.15E-088 SSE J.Naunczek 0.6 1.95E-06 1.95E-06 1.76E-06 1.75E-08
9 S S.Slusser 1 1.69E-06 1.68E-06 .1.47E-06 8.43E-0910 SSW S.Molnar. 0.9 3.89E-06 3.88E-06 3.42E-06 1.40E-0811 SW F.Michael 1.5 4.02E-06 3.99E-06 3.40E-06 6.46E-0912 WSW F.Michael 1.3 1.07E-05 1.06E-05 9.12E-06 1.28E-0813 W F. Hummel 1.2 4.71E-06 4.66E-06 4.04E-06 6.02E-0914 WNW R.Orlando 0.8 6.01E-06 5.97E-06 5.31E-06 1.15E-0815 NW B. Kramer 0.8 5.89E-06 5.85E-06 5.21E-06 1.36E-0816 NNW G. John 0.6 5.96E-06 5.93E-06 5.37E-06 1.53E-08
NEAREST GARDEN WITHIN A 5-MILE RADIUS OF SSES BY SECTOR
SECTOR AFFECTED MILES X/Q X/Q DEC X/Q DEPOSITIONNUMBER SECTOR NAME ME X DEC+DEP
I N J.Wojcik 3.2 5.08E-07 4.99E-07 3.98E-07 1.15E-09.2 NNE R.Chapin 2.3 8.41E-07 8.33E-07 6.85E-07 2.97E-093 NE F. Kremski 2.6 4.79E-07 4.74E-07 3.85E-07 3.44E-09
•4 ENE G.Dennis 2.4 2.41E-07 .2.39E-07 1.96E-07 1.95E-095 E W.Daily 1.8 2.11 E-07 2.10E-07 1.76E-07 1.46E-096 ESE L.Travelpiece 2.5 1.23E-07 1.22E-07 9.93EL08 9.53E-107 SE F.Scholl 0.6 1.79E-06 1.79E-06 1.61E-06 1.58E-08
8 SSE H.Roinick 2.9 1.47E-07 1.46E-07 1. 1 7E-07 1.06E-099 S T. Stemrich 2.5 3.80E-07 3.76E-07 3.07E-07 1.71E-09
10 SSW S.Bodnar. 1.2 2.51E-06 2.50E-06 2.16E-06 8.43E-09I I SW R. Broody 1.9 2.85E-06 2.81E-06 2.36E-06 4.41E-09
12 WSW F.Michael 1.3 1.07E-05 1.06E-05 9.12E-06 1.28E-0813 W F.Hummel 1.2 4.71E-06 4.66E-06 4.04E-06 6.02E-0914 WNW P.Moskaluk 1.3 2.77E-06 2.74E-06 2.37E-06 4.72E-0915 NW R.Reider 4.5 3.66E-07 3.55E-07 2.73E-07 5.45E-1016 NNW P.Culver 4 3.53E-07 3.44E-07 2.68E-07 5.67E- 10
1 X/Q RELATIVE CONCENTRATION (SEC/M3 )
2 X/Q DEC DECAYED AND UNDEPLETED, HALF-LIFE 2.26 DAYS (SEC/M3 )3 X/Q DEC+DEP DECAYED AND DEPLETED, HALF-LIFE 8 DAYS (SEC/M3 )
4 DEPOSITION RELATIVE DEPOSITION RATE (I/M 2 )
*2006 Land Use Census Locations
R-1710010-701, Rev. 0s:\wp\pplkannrpt\SQAnnual Report 2006.doc
5/30/2007
64 of 96
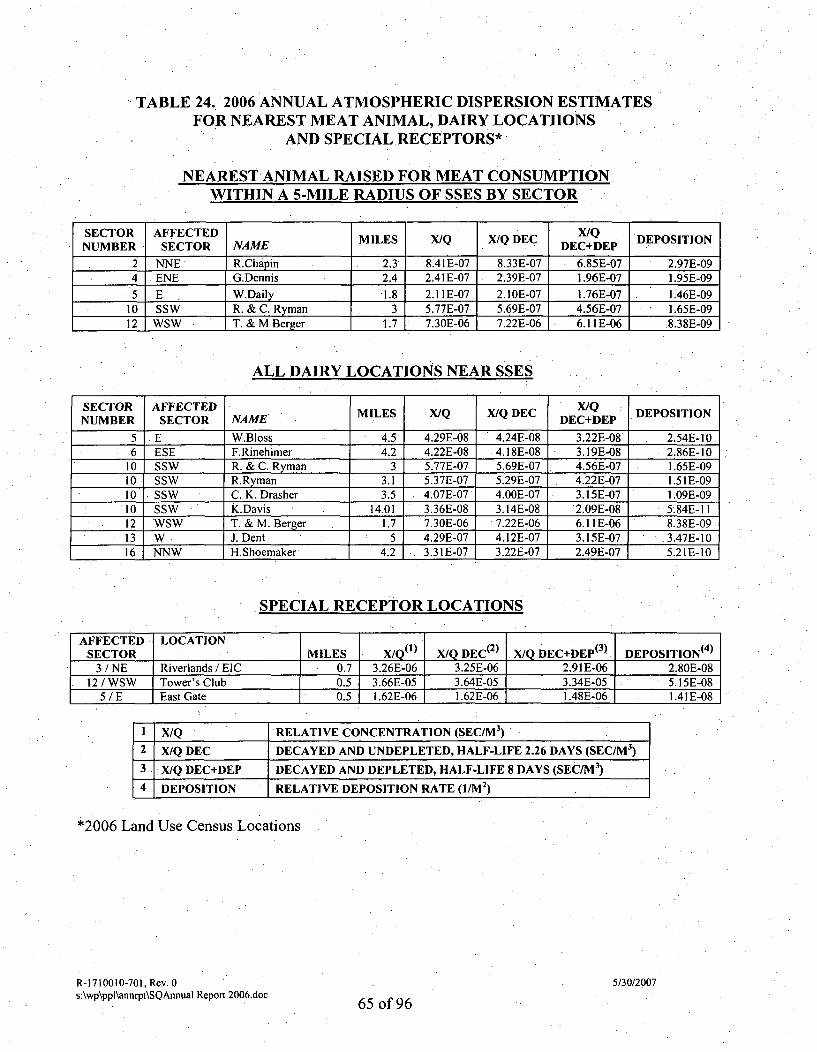
TABLE 24. 2006 ANNUAL ATMOSPHERIC DISPERSION ESTIMATESFOR NEAREST MEAT ANIMAL, DAIRY LOCATIIONS
AND SPECIAL RECEPTORS*
NEAREST-ANIMAL RAISED FOR MEAT CONSUMPTIONWITHIN A 5-MILE RADIUS OF SSES BY SECTOR
SECTOR AFFECTED X/QNUMBER SECTOR NAME MILES X/Q X/Q DEC DEC+DEP DEPOSITION
2 NNE R.Chapin 2.3 8.41E-07 8.33E-07 6.85E-07 2.97E-094 ENE G.Dennis 2.4 2.41E-07 2.39E-07 1.96E-07 1.95E-09
5 E W.Daily 1.8 2.11E-07 2.1OE-07 1.76E-07 1.46E-0910 SSW R. & C. Ryman 3 5.77E-07 5.69E-07 4.56E-07 1.65E-0912 WSW T. & M Berger 1.7 7.30E-06 7.22E-06 6.11 E-06 .8.38E-09
ALL DAIRY LOCATIONS NEAR SSES
SECTOR AFFECTED X/Q DEPOSITIONNUMBER SECTOR NAME MILES XIQ X/Q DEC DEC+DEP
5 E W.Bloss 4.5 4.29E-08 4.24E-08 3.22E-08 2.54E-10.6 ESE F.Rinehimer 4.2 4.22E-08 4.18E-08 3.19E-08 2.86E-10
10 SSW R. & C. Ryman 3 5.77E-07 5.69E-07 4.56E-07 1.65E-0910 SSW R.Ryman 3.1 5.37E-07 5.29E-07 4.22E-07 1.51E-0910 SSW C. K. Drasher 3.5 4.07E-07 4.OOE-07 3.15E-07 1.09E-0910 SSW K.Davis 14.01 3.36E-08 3.14E-08 2.09E-08 5.84E-1112 WSW T. & M. Berger 1.7 7.30E-06 7.22E-06 6.11 E-06 8.38E-0913 W J. Dent 5 4.29E-07 4.12E-07 3.15E-07 3.47E-1016 NNW H.Shoemaker 4.2 3.31E-07 3.22E-07 2.49E-07 5.21E-10
SPECIAL RECEPTOR LOCATIONS
AFFECTED LOCATIONSECTOR MILES X/Q(1) X/Q DEC( X/Q DEC+DEPe 3 ) DEPOSITION•4 )
:3 / NE Riverlands / EIC 0.7 3.26E-06 3.25E-06 2.91E-06 2.80E-0812 /WSW Tower's Club 0.5 3.66E-05 3.64E-05 3.34E-05 5.15E-08
5 / E East Gate 0.5 1.62E-06 1.62E-06 1.48E-06 1.41 E-08
1 X/Q RELATIVE CONCENTRATION (SEC/M3)
2 X/Q DEC DECAYED AND UNDEPLETED, HALF-LIFE 2.26 DAYS (SEC/M3 )
3 X/Q DEC+DEP DECAYED AND DEPLETED, HALF-LIFE 8 DAYS (SEC/M3)
4 DEPOSITION RELATIVE DEPOSITION RATE (I/M 2)
*2006 Land Use Census Locations
R-1710010-701, Rev. 0s:\wp\ppl\annrpt\SQAnnual Report 2006.doc
5/30/2007
6•5 of 96
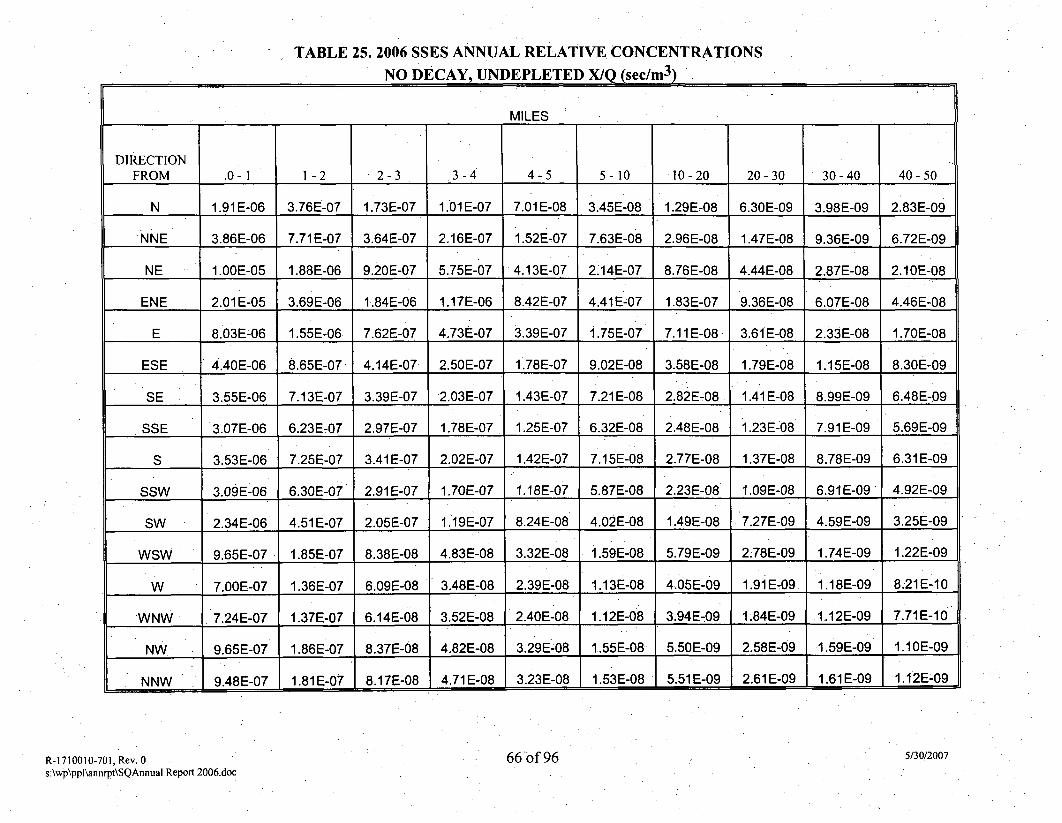
TABLE 25. 2006 SSES ANNUAL RELATIVE CONCENTRATIONS
NO DECAY, UNDEPLETED X/Q (sec/r 3 )
MILES
DIRECTION
FROM .0-1 1-2 2-3 3-4 4-5 5-10 10-20 20-30 30-40 40-50
N 1.91 E-06 3.76E-07 1.73E-07 1.01 E-07 7.01E-08 3.45E-08 1.29E&08 6.30E-09 3.98E-09 2.83E-09
NNE 3.86E-06 7.71E-07 3.64E-07 2.16E-07 1.52E-07 7.63E-08 2.96E-08 1.47E-08 9.36E-09 6.72E-09
NE 1.OOE-05 1.88E-06 9.20E-07 5.75E-07 4.13E-07 2.14E-07 8.76E-08 4.44E-08 2.87E-08 2.10E-08
ENE 2.01E-05 3.69E-06 1.84E-06 1.17E-06 8.42E-07 4.41E-07 1.83E-07 9.36E-08 6.07E-08 4.46E-08
E 8.03E-06 1.55E-06 7.62E-07 4.73E-07 3.39E-07 1.75E-07 7.11E-08 3.61E-08 2.33E-08 1.70E-08
ESE 4.40E-06 8.65E-07 4.14E-07 2.50E-07 1.78E-07 9.02E-08 3.58E-08 1.79E-08 1.15E-08 8.30E-09
SE 3.55E-06 7.13E-07 3.39E-07 2.03E-07 1.43E-07 7.21E-08 2.82E-08 1.41 E-08 8.99E-09 6.48E-09
SSE 3.07E-06 6.23E-07 2.97E-07 1.78E-07 1.25E-07 6.32E-08 2.48E-08 1 .23E-08 7.91 E-09 5.69E-09
S 3.53E-06 7.25E-07 3.41E-07 2.02E-07 1.42E-07 7.15E-08 2.77E-08 1.37E-08 8.78E-09 6.31E-09
SSW 3.09E-06 6.30E-07 2.91E-07 1.70E-07 1.18E-07 5.87E-08 2.23E-08 1.09E-08 6.91E-09 4.92E-09
SW 2.34E-06 4.51E-07 2.05E-07 1.19E-07 8.24E-08 4.02E-08 1.49E-08 7.27E-09 4.59E-09 3.25E-09
WSW 9.65E-07 1.85E-07 8.38E-08 4.83E-08 3.32E-08 i.59E-08 5.79E-09 2.78E-09 1.74E-09 1.22E-09
W 7.OOE-07 1.36E-07 6.09E-08 3.48E-08 2.39E-08 1.13E-08 4.05E-09 1.91E-709 1.18E-09 8.21E-10
WNW 7.24E-07 1.37E-07 6.14E-08 3.52E-08 2.40E-08 1.12E-08 3.94E-09 1.84E-09 1.12E-09 7.71E-10
NW 9.65E-07 1.86E-07 8.37E-08 4.82E-08 3.29E-08 1.55E-08 5.50E-09 2.58E-09 1.59E-09 1.10E-09
NNW 9.48E-07 1.81E-07 8.17E-08 4.71E-08 3.23E-08 1.53E-08 5.51E-09 2.61E-09 1.61E-09 1.12E-09
R-1710010-701, Rev. 0s:\wp\ppl\annrpt\SQAnnual Report 2006.doc
66'of 96 5/30/2007
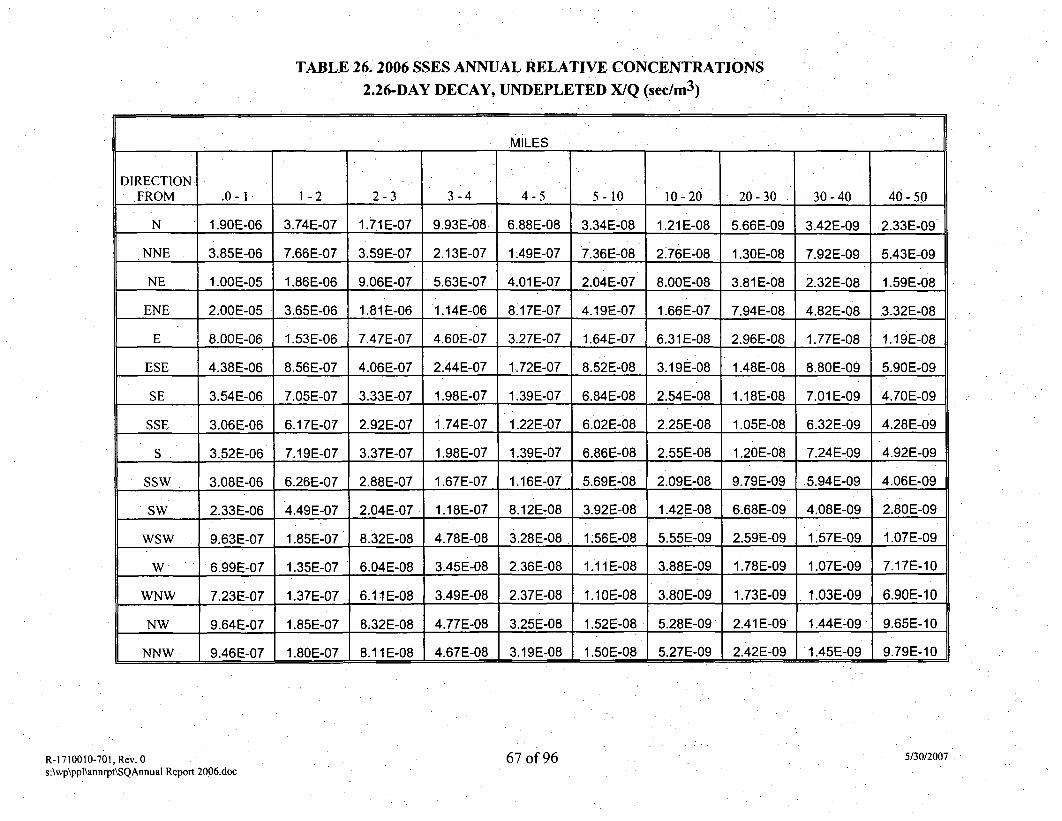
TABLE 26. 2006 SSES ANNUAL RELATIVE CONCENTRATIONS2.26-DAY DECAY, UNDEPLETED X/Q (sec/m 3 )
MILES
DIRECTION
FROM .0-1 1]-2 2-3 3-4 4-5 5-10 10-20 20-30 30-40 40-50
N 1.90E-06 3.74E-07 1.71 E-07 9.93E-08 6.88E-08 3.34E-08 1.21 E-08 5.66E-09 3.42E-09 2.33E-09
NNE 3.85E-06 7.66E-07 3.59E-07 2.13E-07 1.49E-07 7.36E-08 2.76E-08 1.30E-08 7.92E-09 5.43E-09
NE 1.OOE-05 1.86E-06 9.06E-07 5.63E-07 4.01 E-07 2.04E-07 8.OOE-08 3.81 E-08 2.32E-08 1.59E-08
ENE 2.OOE-05 3.65E-06 1.81E-06 1.14E-06 8.17E-07 4.19E-07 1.66E-07 7.94E-08 4.82E-08 3.32E-08
E 8.OOE-06 1.53E-06 7.47E-07 4.60E-07 3.27E-07 1.64E-07 6.31E-08 2.96E-08 1.77E-08 1.19E-08
ESE 4.38E-06 8.56E-07 4.06E-07 2.44E-07 1.72E-07 8.52E-08 3.19E-08 1.48E-08 8.80E-09 5.90E-09
SE 3.54E-06 7.05E-07 3.33E-07 1.98E-07 1.39E-07 6.84E-08 2.54E-08 1.18E-08 7.01 E-09 4.70E-09
SSE 3.06E-06 6.17E-07 2.92E-07 1.74E-07 1.22E-07 6.02E-08 2.25E-08 1.05E-08 6.32E-09 4.28E-09
S 3.52E-06 7.19E-07 3.37E-07 1.98E-07 1.39E-07 6.86E-08 2.55E-08 1.20E-08 7.24E-09 4.92E-09
SSW 3.08E-06 6.26E-07 2.88E-07 1.67E-07 1.16E-07 5.69E-08 2.09E-08 9.79E-09 5.94E-09 4.06E-09
SW 2.33E-06 4.49E-07 2.04E-07 1.18E-07 8.12E-08 3.92E-08 1.42E-08 6.68E-09 4.08E-09 2.80E-09
WSW 9.63E-07 1.85E-07 8.32E-08 4.78E-08 3.28E-08, 1.56E-08 5.55E-09 2.59E-09 1.57E-09 i.07E-09
W 6.99E-07 1.35E-07 6.04E-08 3.45E-08 2.36E-08 1.11 E-08 3.88E-09 1.78E-09 1.07E-09 7.17E-10
WNW 7.23E-07 1.37E-07 6.11E-08 3.49E-08 2.37E-08 1.10E-08 3.80E-09 1.73E-09 1.03E-09 6.90E-10
NW 9.64E-07 1.85E-07 8;32E-08 4.77E-08 3.25E-08 1.52E-08 5.28E-09 2.41E-09 1.44E-09 9.65E-10
NNW 9.46E-07 1.80E-07 8.11 E-08 4.67E-08 3.19E-08 1.50E-08 5.27E-09 2.42E-09 1.45E-09 9.79E-10
R-1710010-701, Rev. 0s:\wp\ppl\annrpt\SQAnnual Report 2006.doc
67 of 96 5/30/2007
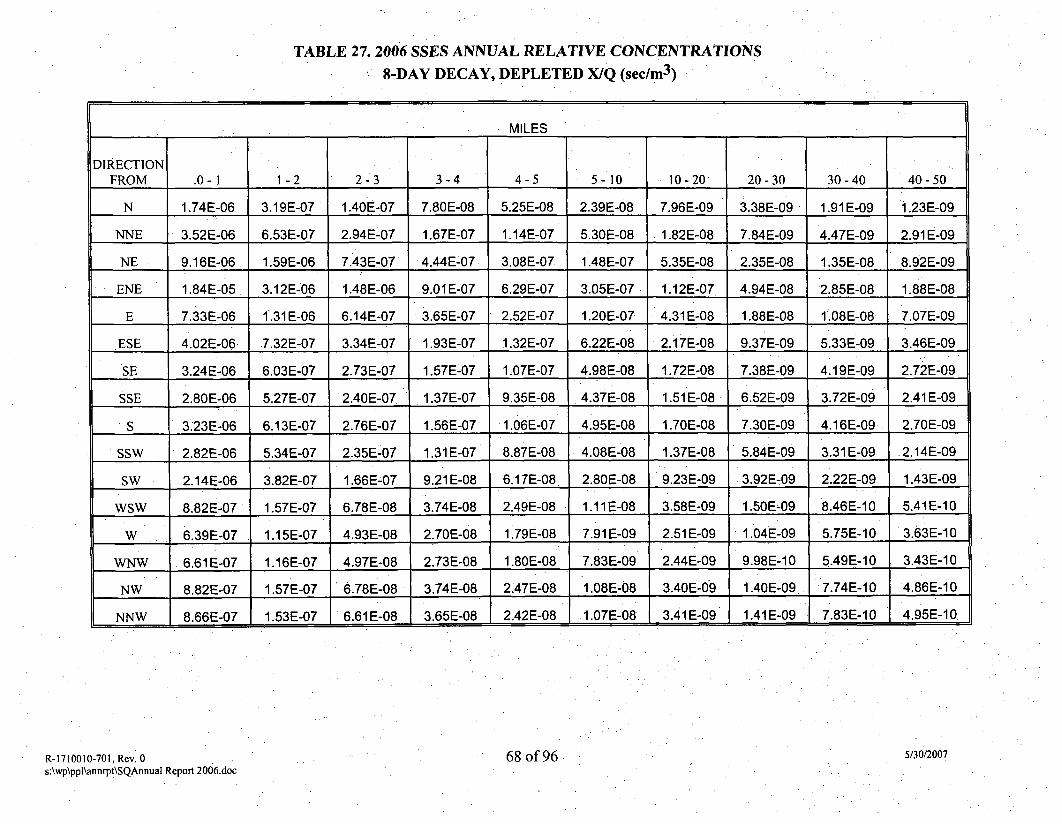
TABLE 27. 2006 SSES ANNUAL RELATIVE CONCENTRATIONS8-DAY DECAY, DEPLETED X/Q (sec/m 3 )
MILES
DIRECTION
FROM .0-1 1-2 2-3 3-4 4-5 5-10 10-20 20-30 30-40 40-50
N 1.74E-06 3.19E-07 1.40E-07 7.80E-08 5.25E-08 2.39E-08 7.96E-09 3.38E-09 1.91E-09 1.23E-09
NNE 3.52E-06 6.53E-07 2.94E-07 1.67E-07 1.14E-07 5.30E-08 1.82E-08 7.84E-09 4.47E-09 2.91 E-09
NE 9.16E-06 1.59E-06 7.43E-07 4.44E-07 3.08E-07 1.48E-07 5.35E-08 2.35E-08 1.35E-08 8.92E-09
ENE 1.84E-05 3.12E-06 1.48E-06 9.01 E-07 6.29E-07 3.05E-07 1.12E-07 4.94E-08 2,85E-08 1.88E-08
E 7.33E-06 1.31 E-06 6.14E-07 3.65E-07 2.52E-07 1.20E-07 4.31 E-08 1.88E-08 1.08E-08 7.07E-09
ESE 4.02E-06 7.32E-07 3.34E-07 1.93E-07 1.32E-07 6.22E-08 2. 17E-08 9.37E-09 5.33E-09 3.46E-09
SE 3.24E-06 6.03E-07 2.73E-07 1.57E-07 1.07E-07 4.98E-08 1.72E-08 7.38E-09 4.19E-09 2.72E-09
SSE 2.80E-06 5.27E-07 2.40E-07 1.37E-07 9.35E-08 4.37E-08 1.51 E-08 6.52E-09 3.72E-09 2.41 E-09
S 3.23E-06 6.13E-07 2.76E-07 1.56E-07 1.06E-07 4.95E-08 1.70E-08 7.30E-09 4.16E-09 2.70E-09
SSW 2.82E-06 5.34E-07 2.35E-07 1.31 E-07 8.87E-08 4.08E-08 1.37E-08 5.84E-09 3.31E-09 •2.14E-09
SW 2.14E-06 3.82E-07 1.66E-07 9.21E-08 6.17E-08 2.80E-08 9.23E-09 3.92E-09 2.22E-09 1.43E-09
WSW 8.82E-07 1.57E-07 6.78E-08 3.74E-08 2.49E-08 1.11E-08 3.58E-09 1.50E-09 8.46E-10 5.41E-10
W 6.39E-07 1.15E-07 4.93E-08 2.70E-08 1.79E-08 7.91E-09 2.51E-09 1.04E-09 5.75E-10 3.63E-10
WNW 6.61E-07 1.16E-07 4.97E-08 2.73E-08 1.80E-08 7.83E-09 2.44E-09 9.98E-10 5.49E-10 3.43E-10
NW 8.82E-07 1.57E-07 6.78E-08 3.74E-08 2.47E-08 1.08E-08 3.40E-09 1.40E-09 7.74E-10 4.86E-10
NNW 8.66E-07 1.53E-07 6.61 E-08 3.65E-08 2.42E-08 1.07E-08 3.41 E-09 1.41 E-09 7.83E-10 4.95E-10
R-1710010-701, Rev. 0s:\wp\ppl\annrpt\SQAnnual Report 2006.doc
68 of 96 5/30/2007
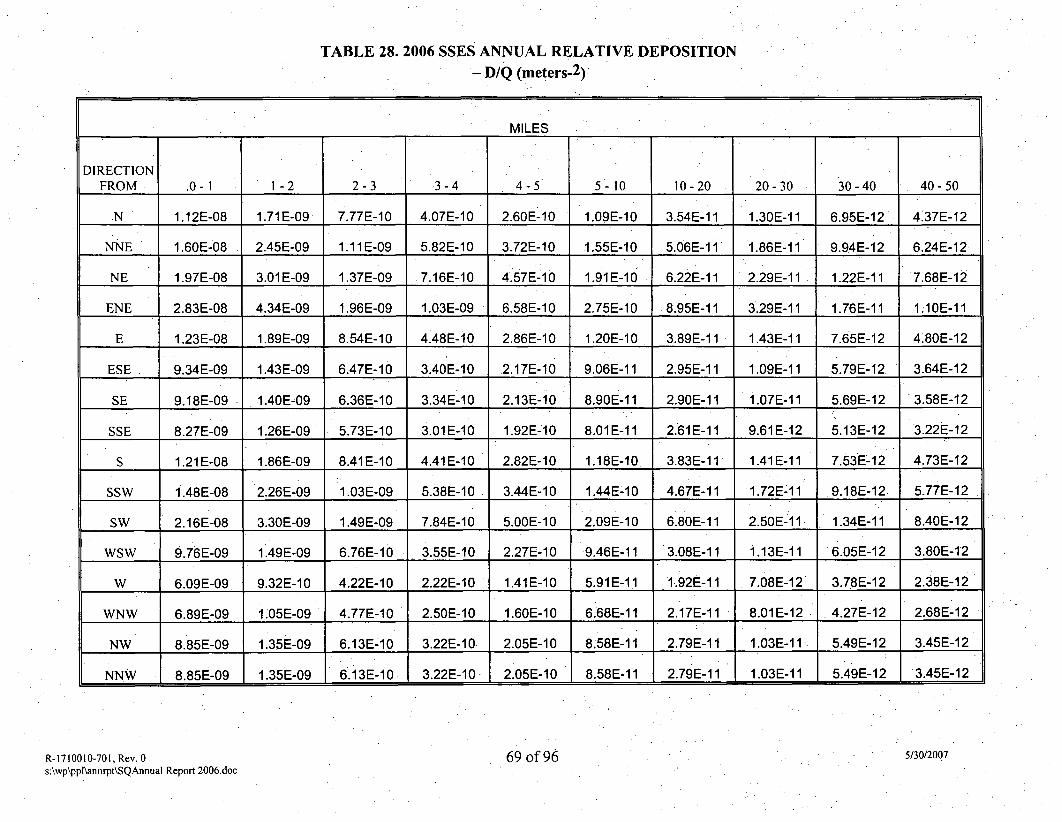
TABLE 28. 2006 SSES ANNUAL RELATIVE DEPOSITION-D/Q (meters-2)•
MILES
DIRECTIONFROM .0-1 1 -2 2-3 3-4 4-5 5-10 10-20 20-30 30-40 40-50
N 1.12E-08 1.71E-09 7.77E-10 4.07E-10 2.60E-10 1.09E-10 3.54E-11 1.30E-11 6.95E-12 4.37E-12
NNE 1.60E-08 2.45E-09 1.11E-09 5.82E-10 3.72E-10 1.55E-10 5.06E-11 1.86E-11 9.94E-12 6.24E-12
NE 1.97E-08 3.01 E-09 1.37E-09 7.16E-10 4.57E-10 1.91E-10 6.22E-11 2.29E-11 1.22E-11 '7.68E-12
ENE 2.83E-08 4.34E-09 1.96E-09 1.03E-09 6.58E-10 2.75E-10 8.95E-11 3.29E-11 1.76E-11 1.10E-11
E 1.23E-08 1.89E-09 8.54E-10 4.48E-10 2.86E-10 1.20E-10 3.89E-11 1.43E-11 7.65E-12 4&80E-12
ESE 9.34E-09 1.43E-09 6.47E-10 3.40E-10 2.17E-10 9.06E-11 2.95E-11 1.09E-11 5.79E-12 3.64E-12
SE 9.18E-09 1.40E-09 6.36E-10 3.34E-10 2.13E-10 8.90E-11 2.90E-11 1.07E-11 5.69E-12 3.58E-12
SSE 8.27E-09 1.26E-09 5.73E-10 3.01E-10 1.92E-10 8.01E-11 2.61E-11 9.61E-12 5.13E-12 3.22E-12
S 1.21E-08 1.86E-09 8.41E-10 4.41E-10 2.82E-10 1,18E-10 3.83E-11 1.41E-11 7.53E-12 4.73E-12
SSW 1.48E-08 2.26E-09 1.03E-09 5.38E-10 3.44E-10 1.44E-10 4.67E-11 1.72E-11 9.18E-12 5.77E-12
SW 2.16E-08 3.30E-09 1.49E-09 7.84E-10 5.OOE-10 2.09E-10 6.80&-11 2.50E-11 1.34E-11 8.40E-12
WSW 9.76E-09 1.49E-09 6.76E-10 3.55E-10 2.27E-10 9,46E-11 3.08E-11 1.13E-11 6.05E-12 3.80E-12
w 6.09E-09 9.32E-10 4.22E-10 2.22E-10 1.41E-10 5.91E-1i 1.92E-11 7.08E-12 3.78E-12 2.38E-12
WNW 6.89E-09 1.05E-09 4.77E-10 2.50E-10 1.60E-10 6.68E-11 2.17E-11 8.01E-12 4.27E-12 2.68E-12
NW 8.85E-09 1.35E-09 6.13E-10 3.22E-10: 2.05E-10 8.58E-11 2.79E-1 1 1.03E-11 5.49E-12 3.45E-12
NNW 8.85E-09 1.35E-09 6.13E-10 3.22E-10 2.05E-10 8.58E-11 2.79E-11 1.03E-11 5.49E-12 3.45E-12
R-1710010-701, Rev. 0s:\wp\ppf\annrpt\SQAnnual Report 2006.doc
69 of 96 5/30/2007
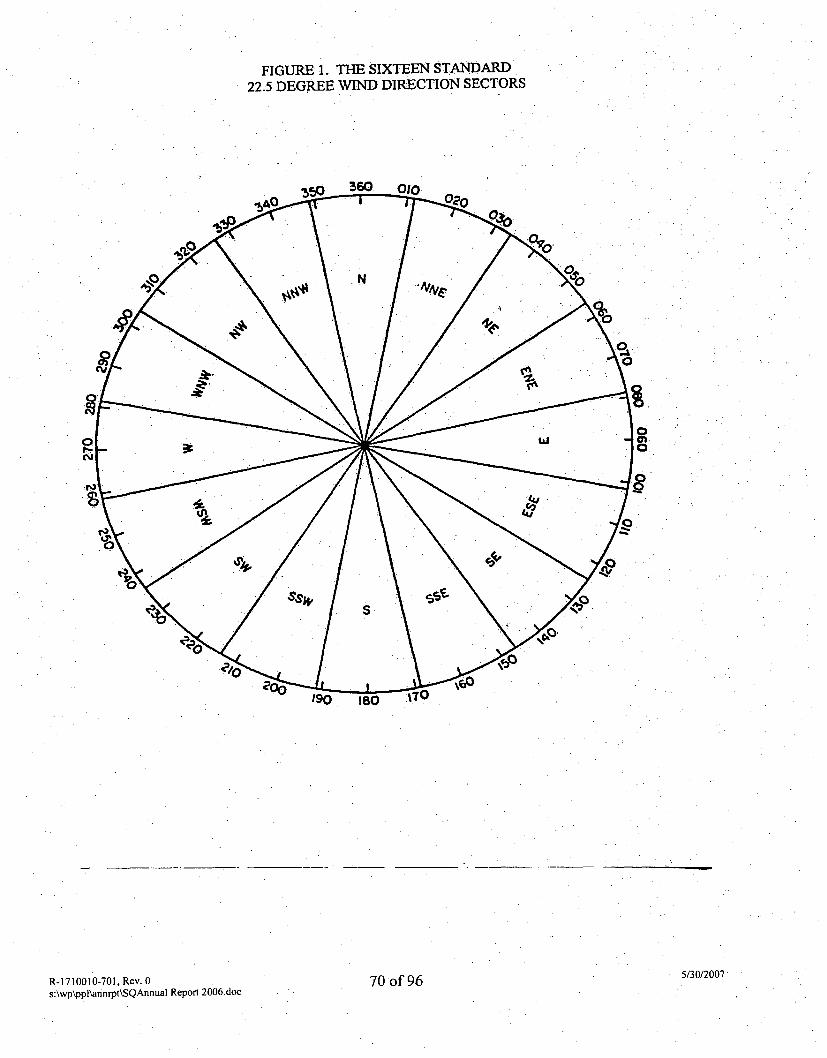
FIGURE 1. THE SIXTEEN STANDARD22.5 DEGREE WIND DIRECTION SECTORS
-5AO • •- a
S0
u 01 95/30/2007R-1710010-701, Rev. 0s:\wp\ppl\annrpt\SQAnnual Report 2006.doc
70 ot 96
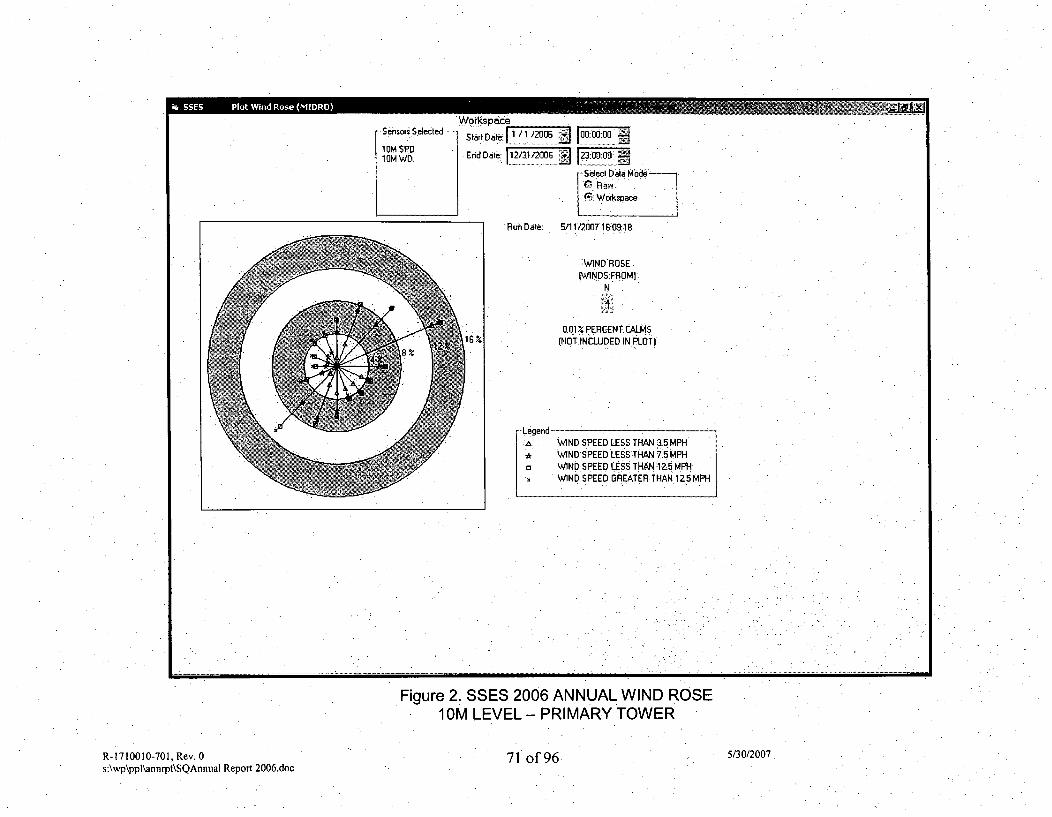
ik, SES Pot Wnd Rse (IDR.i
Sensori Selected-
10M SPD1 OMWD.
Workspdce
Start Dat F1O/61_/_20_06 - A0 _.00o
End Date: 112m/31200E I!f-o.o.• • ..... ...
.Selecl Data Mode
rt. Workspace-
Run Date 5/11/200716:09.18
"WIND ROSE(WINDSFROM}
N
!0.01 PERCENT CALMS6 • (NOT INCLUDED IN.PLO.T)
-Legend ..., WIND SPEED LESS THAN '35MPH* WINDSPEED LESS THAN 7.5MPHo WIND SPEED LESS THAN 12.5 MPH
WIND SPEED GREATERTHAN 1•5 MPH
Figure 2. SSES 2006 ANNUAL WIND ROSE10M LEVEL - PRIMARY TOWER
R-1710010-701, Rev. 0s:\wp\pplkannrpt\SQAnnual Report 2006.doc
71 of 96: 5/30/2007
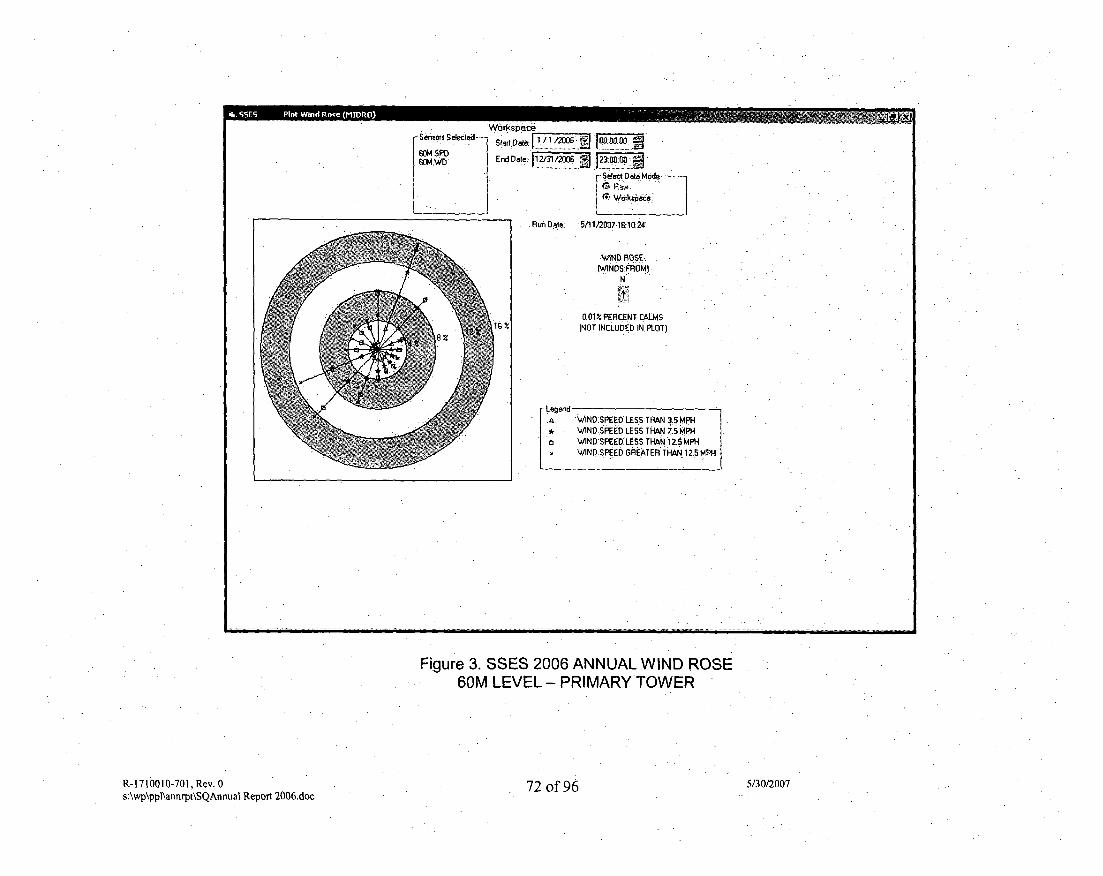
114.SSES Plo Win Roe (MDR,
'Workspac ______
Senws, Selected-- Star Oat: rln6 "
GMVD End DaleIv128 JJ3aD[ Select Data Made-
(t7 Weok ace.
Run Date: ý5/11/207,16.1024
WIND ROSE
N
0.01• %PERCENT •ALMS(NOT INCLUDED IN PLOT)
Is,
[ L~egend
WIND SPEEDILESS THAN 3.5 MPH* WIND SPEED LESS THAN 7.5 MPH
1 WIND SPEED LESS THAN 1•ZMPHWIND SPEED GREATER THAN1 125 MPH
Figure 3. SSES 2006 ANNUAL WIND ROSE60M LEVEL - PRIMARY TOWER
R-1710010-701, Rev. 0s:\wp\pp1\annrpt\SQAnnua1 Report 2006.doc
72 of 96 5/30/2007

im, SSES Plot Wind Rose (MIDRO)
mWorkspace-senorsSelected- s&i 1
.WD BK End Dole:12/31/2006 j 2OOO~-ISelect Data Mode
[ ( Wokspace
I Run Dale: .5/11/200716:10:57
WIND ROSEI'WINDS FROM)
N
0.05% PERCENT CALMS(NOT INCLUDED IN PLOT)
-- Legend
i WIND SPEED LESS THAN3.5MPH, WIND SPEED LESS THAN.7.5 MPH
0 WIND SPEED LESS THAN 1Z5 MPHW1NDOSPEED GREATER THAN 12.5 MPH
Figure 4. SSES 2005 ANNUAL WIND ROSE
Figure 4. SSES 2005 ANNUAL WIND ROSE1 OM LEVEL - BACKUP TOWER
73 of 96. 5/30/2007R-1710010-701, Rev. 0s:\wp\ppl\annrpt\SQAnnual Report 2006.doc
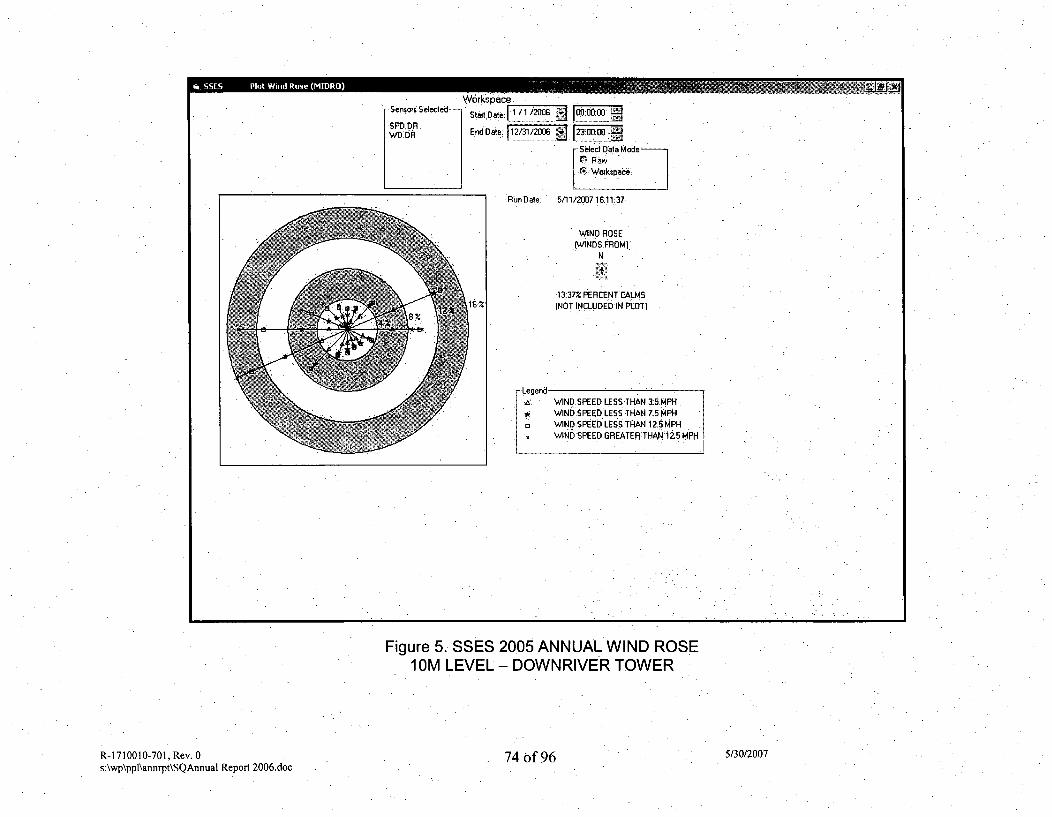
%, SE Pot in Rse(MIRO ýý 1 S:--,
Sensors Selected--
SPD.DRwub R
Workspace
Start Date: Fl / 20 1FooEnd Date: 1 2/311200 R
Selec Data ModeI• P,•i
rt; Workspace JRunDale: 5/11)2007 16:1.1;37
WVND ROSEWNDS FROM]
N
"13.37% PERCENT CALMS16[ INOT INCLUDE DIN PLOT)
FLegendWIND SPEED LESS THAN 3.5 MPHWIND SPEEDLESS THAN 7.5 MPHvIND SPEED LESS THAN 12.5 MPHWIND SPEED GREATER THAN 125 MPH
Figure 5. SSES 2005 ANNUAL WIND ROSE1OM LEVEL - DOWNRIVER TOWER
R-1710010-701, Rev. 0s:\wp\ppl\annrpt\SQAnnual Report 2006.doc
74 of 96 5/30/2007
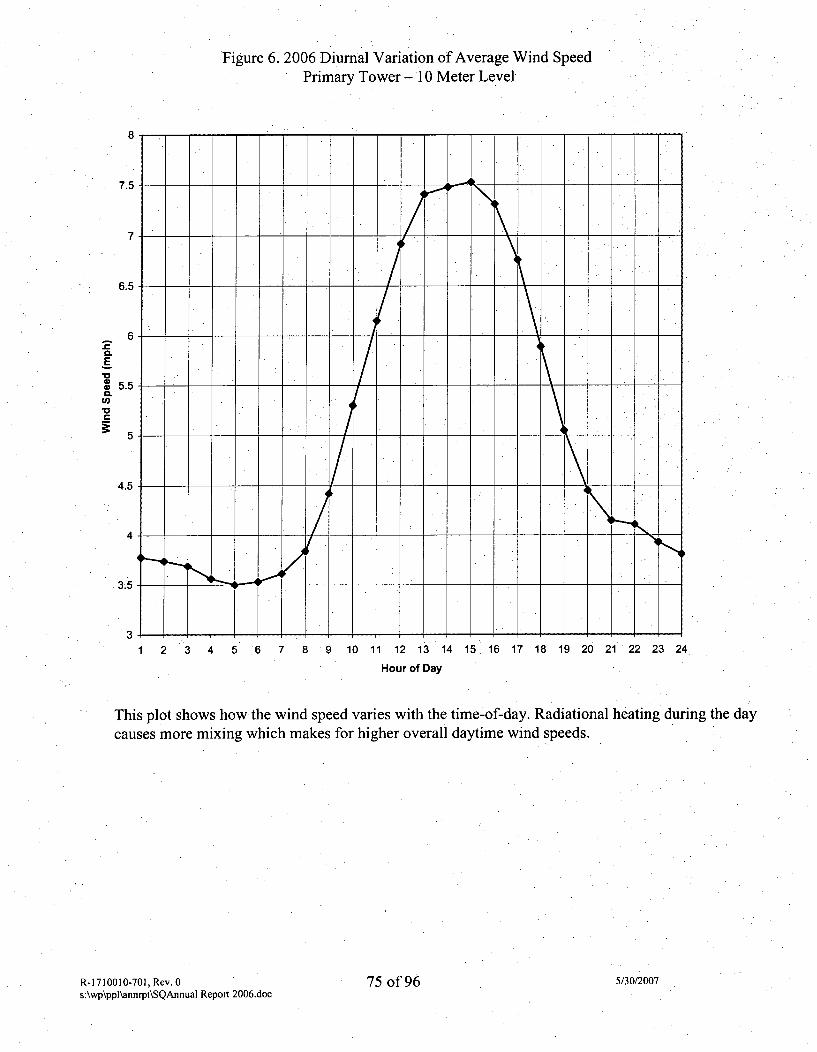
Figure 6. 2006 Diurnal Variation of Average Wind SpeedPrimary Tower - 10 Meter Level
8
7.5
7
6.5
6A
C.E'000 5.50.
CLUl)
5
4.5
4
3.5
31 2 3 4 5 .6 7 8 9 10 11 12 13 14 15. 16 17 18 19 20 21 22 23 24
Hour of Day
This plot shows how the wind speed varies with the time-of-day. Radiational heating during the daycauses more mixing which makes for higher overall daytime wind speeds.
010-701 Rev. 0 75• f 96 5/30/2007R-ITI0s:\wp\ppl\annrpt\SQAnnual Report 2006.doc
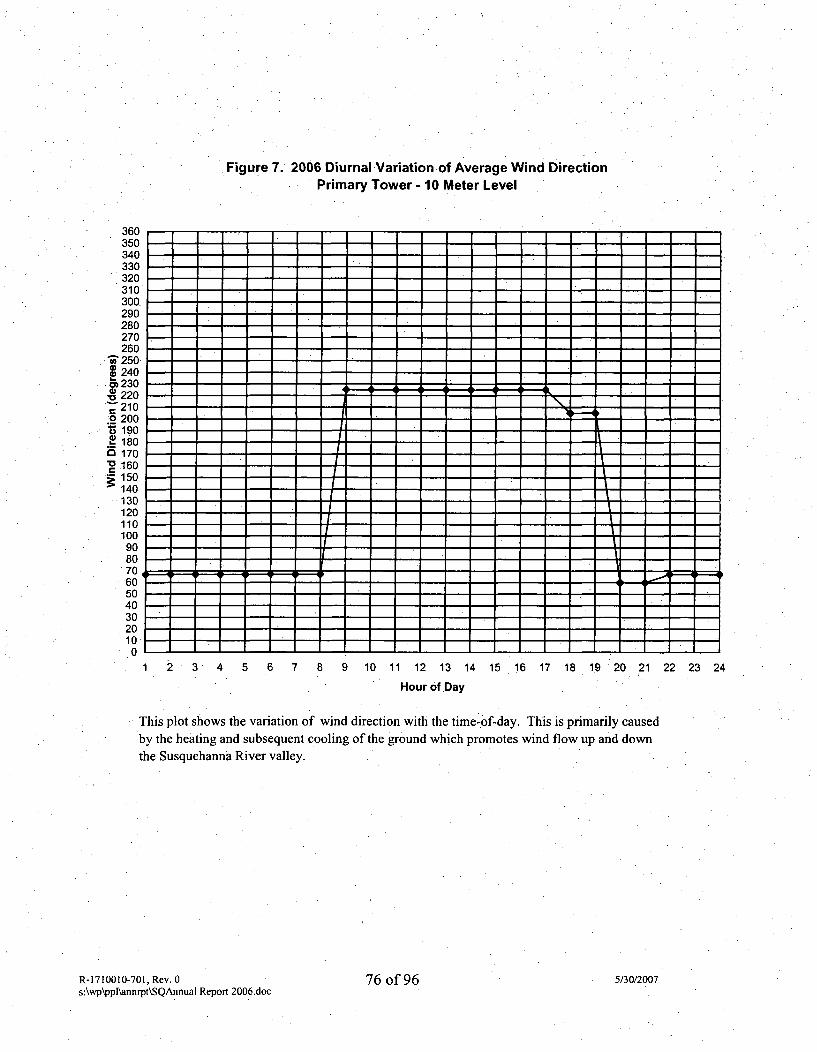
Figure 7. 2006 Diurnal Variation of Average Wind DirectionPrimary Tower - 10 Meter Level
.360350340330320310300.290280270260
.c 2504 240o 230. 220C 210.2 2005 190*€ 180B 170
160150140130120110100
90807060
50403020100
1 2 3 4 5 6 7 8 9 10 11 12 .13 14 15 .16 17 18 .19 20 21 22 23 24Hour of Day
This plot shows the variation of wind direction with the time-of-day. This is primarily causedby the heating and subsequent cooling of the ground which promotes wind flow up and down
the Susquehanna River valley.
01 Rev. 0 76 of Q9 5/30/2007R-1T10010-7s:\wp\ppi~nnrpt\SQAnnual Report 2006.doc
# V V• J •
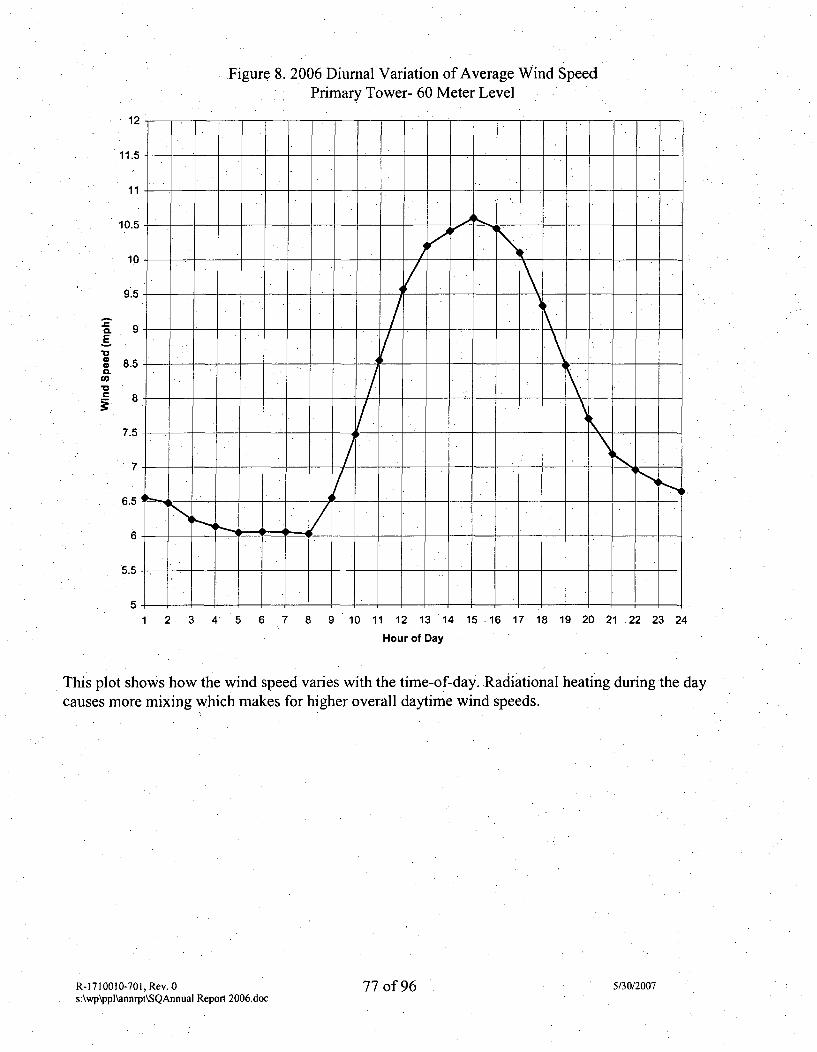
Figure 8. 2006 Diurnal Variation of Average Wind SpeedPrimary Tower- 60 Meter Level
12
11.5
11
10.5
10
9.5
2.
CL
CL
CD
9
8.5
8
7.5
7
6.5
6
5.5
5
1 2 3 4 5 6 7 8 9 10 11 12 13 14 15 16 17 18 19 20 21 22 23 24
Hour of Day
This plot shows how the wind speed varies with the time-of-day. Radiational heating during the daycauses more mixing which makes for higher overall daytime wind speeds.
R- 1710010-701, Rev. 0 77 of 96 5/30/2007s:\wp\ppi~nnrpt\SQAnnuaI Report 2006.doc
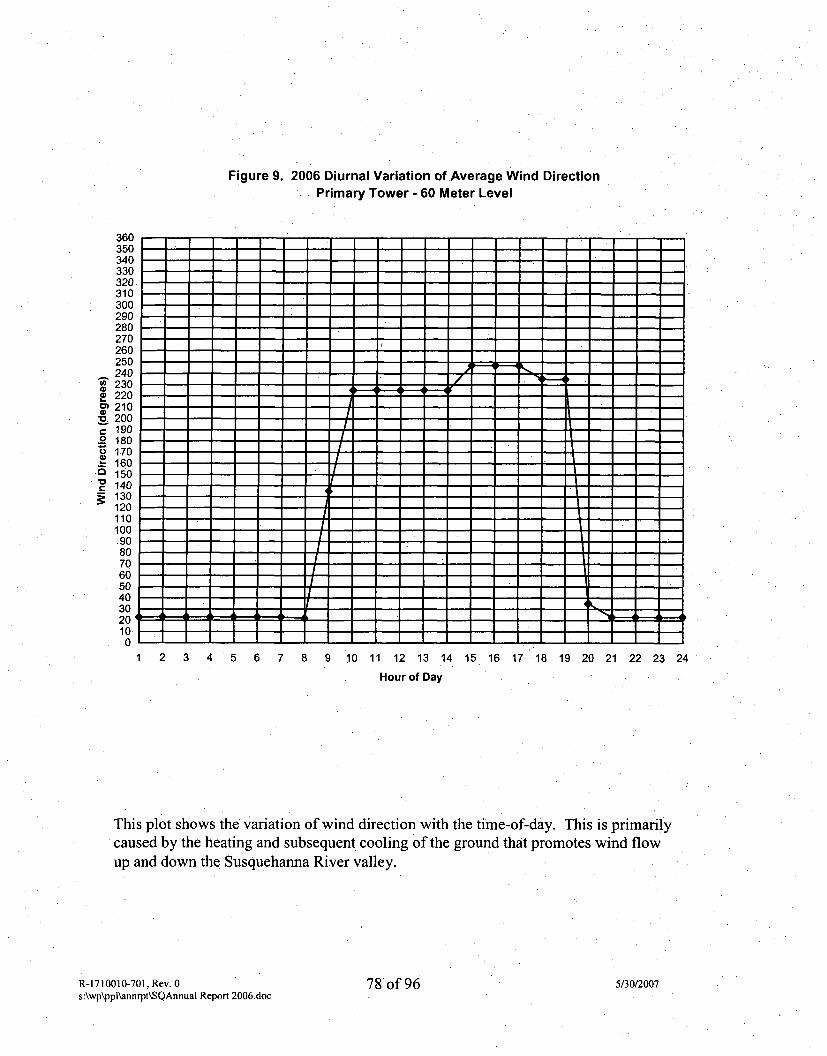
Figure 9. 2006 Diurnal Variation of Average Wind Direction. . Primary Tower - 60 Meter Level
0)a)*0
C0
C)0
.0*0C
360350340330320310300290280270260250240230220210200190180170160150140130120110100.9080706050403020100
= -----
1 2 3 4 5 6 7 8 9 10 11 12 13 14
Hour of Day
15 16 i7 18 19 20 21 22 23 24
This plot shows the variation of wind direction with the time-of-day. This is primarily
caused by the heating and subsequent cooling of the ground that promotes wind flow
up and down the Susquehanna River valley.
R-1710010-701, Rev. 0 78 of 96 5/30/2007
s:\wp\ppl\annrpt\SQAnnual Report 2006.doc
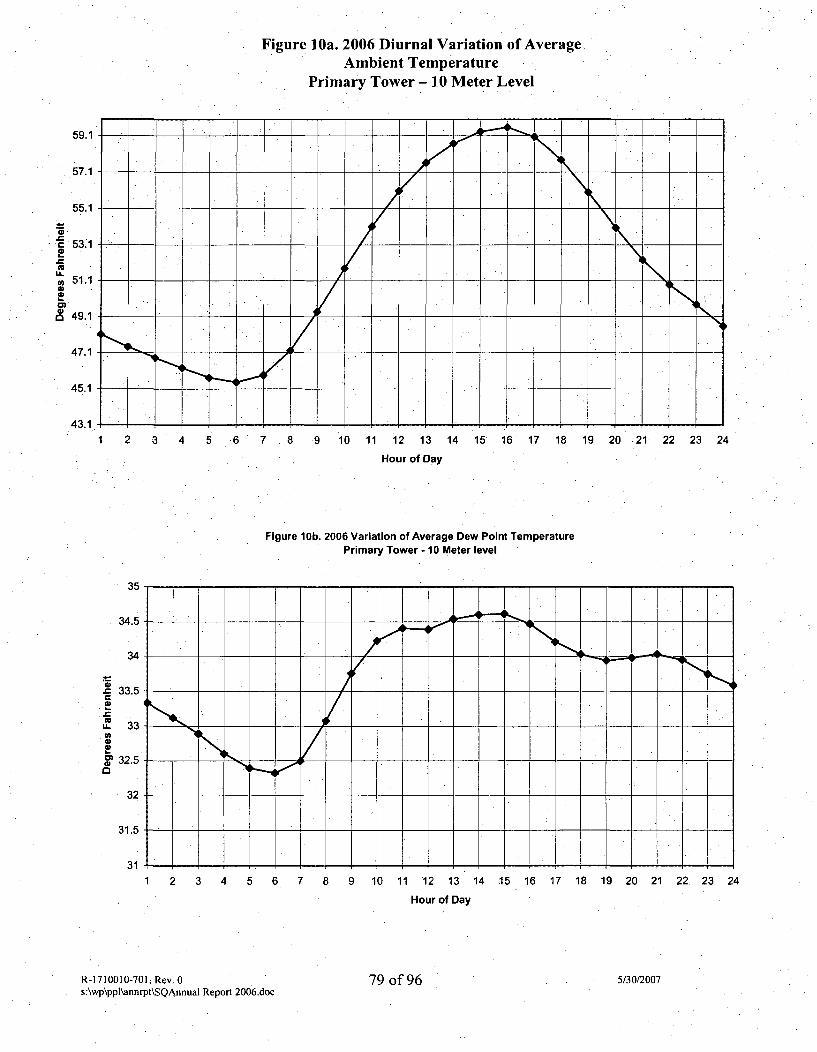
Figure 1oa. 2006 Diurnal Variation of AverageAmbient Temperature
Primary Tower - 10 Meter Level
59.1
57.1
55.1
53.10
51.1,0
o 49.1
47.1
45.1
43.1
1 2 3 4 5 6 7 8 9 10 11 12 13 14 15 16 17 18 19 20 21 22 23 24
Hour of Day
Figure 10b. 2006 Variation of Average Dew Point TemperaturePrimary Tower - 10 Meter level
35
34.5
34
.- 33.50
uL 33
C 32.5
32
31.5
31
1 2 3 4 5 6 7 8 9 10 11 12 13 14 15 16 17 18 19 20 21 22 23 24
Hour of Day
R-1710010-701, Rev. 0s:\wp\ppl~annrpt\SQAnnual Report 2006.doc
79 of 96 5/30/2007

Figure 11 a. 2006 Diurnal Varation of Average Temperature DownriverTower - 10 Meter Level
1 2 3 4 5 6 7 8 9 10 11 12 13 14 15 16 17 18 19 20 21 22 23 24
Hour of Day
31.8
31.4
31
30.6
30.2
29.8
29.4
2928'.6
28.2
27.8
27.4
27
26.6
26.2
25.8
25.4
25
Figure 1Ib. 2006 Diurnal Variation of Average*Dew Point Temperature
Downriver Tower -.10 Meter Level
__ _____ 1 ._ _ - -
1____"_ i
0
1 2 3 4 5 6 7 8 9 10 11 12 13
Hour of Day
80 of 96
14 15 16 17 18 19 20 21 22 23 24
R-1710010-701, Rev. 0s:\wp\ppl\annrpt\SQAnnual Report 2006.doc
5/30/2007
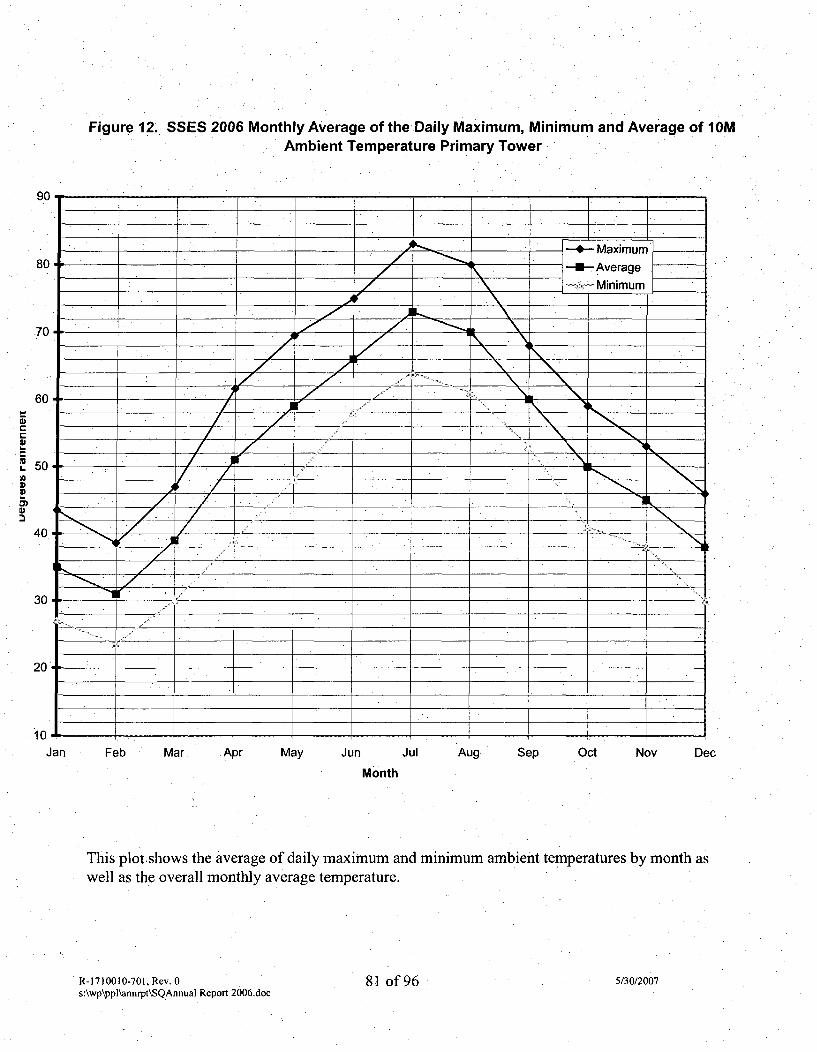
Figure 12. SSES 2006 Monthly Average of the Daily Maximum, Minimum and Average of IOMAmbient Temperature Primary Tower
80." " -u-Average
60 _____
50
40 -'
10.777
Jan Feb Mar. Apr May Jun Jul Aug Sep Oct Nov Dec
Month
This plot shows the average of daily maximum and minimum ambient temperatures by month aswell as the overall monthly average temperature.
R-1710010-701, Rev. 0s:\wp\ppl\annrpt\SQAnnual Report 2006.doc
81 of 96 5/30/2007

70
60
50
40
-.LL'D0
2 30
20
Figure 13. SSES 2005 Monthly Average of the Daily Maximum, Minimum andAverage of 10M Dew Point
Primary Tower
A .. I . Maximumr
-..- AverageMinimum
_ . /K_",
_ 11111 -a.
~-------L
•. el\ l
10
0Jan Feb " Mar Apr May, Jun Jul Aug . Sep Oct. Nov Dec.
Month
This plot shows the average of the daily maximum and minimum dew point temperatures bymonth as well as the overall monthly average dew point.
R-1710010-701, Rev. 0s:\wp\pplhannrpt\SQAnnual Report 2006.doc
82 of 96 5/30/2007
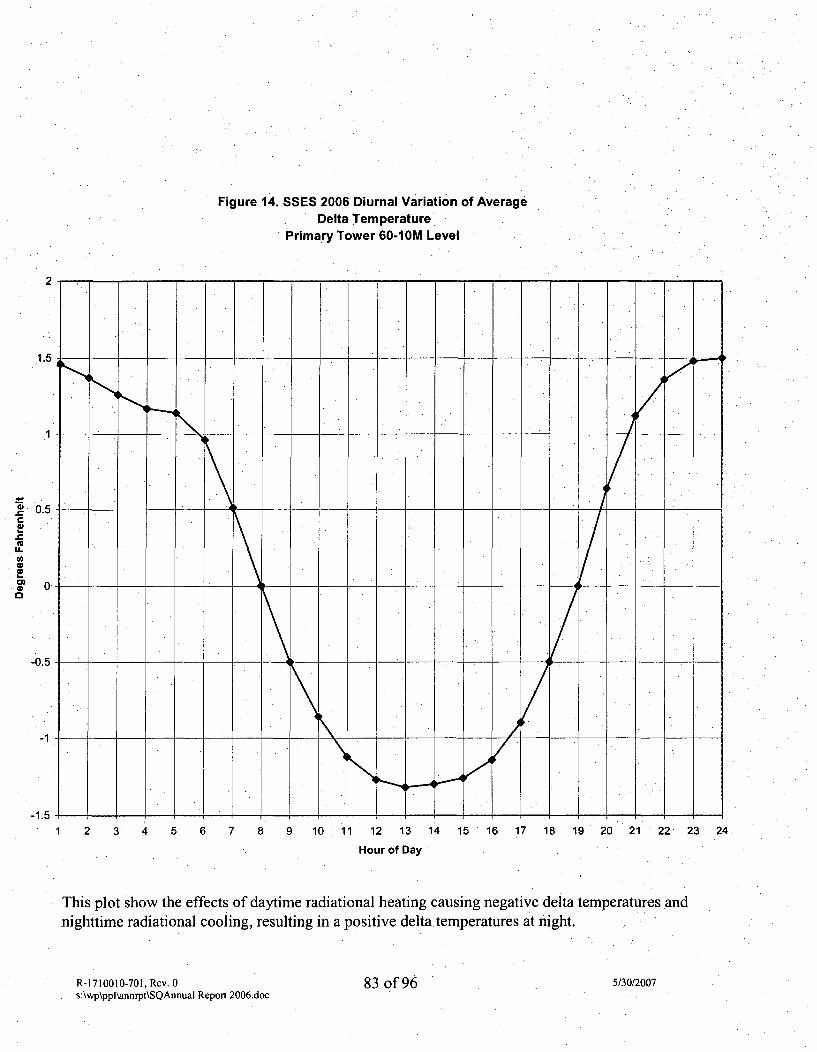
Figure 14. SSES 2006 Diurnal Variation of AverageDelta Temperature
Primary Tower 60-1OM Level
2
.1.5
4' 0.5
CD
-0.5
-1
-1.52 3 4 5 6 7 8 9 10 11 12 13 14 15 16 17 18 19 20 21 22 23 24
Hour of Day
This plot show the effects of daytime radiational heating causing negative delta temperatures andnighttime radiational cooling, resulting in a positive delta.temperatures at night.
R-1710010-701, Rev. 0 83 of 96 5/30/2007s:\wp\ppl\.annrpt\SQAnnual Report 2006.doc
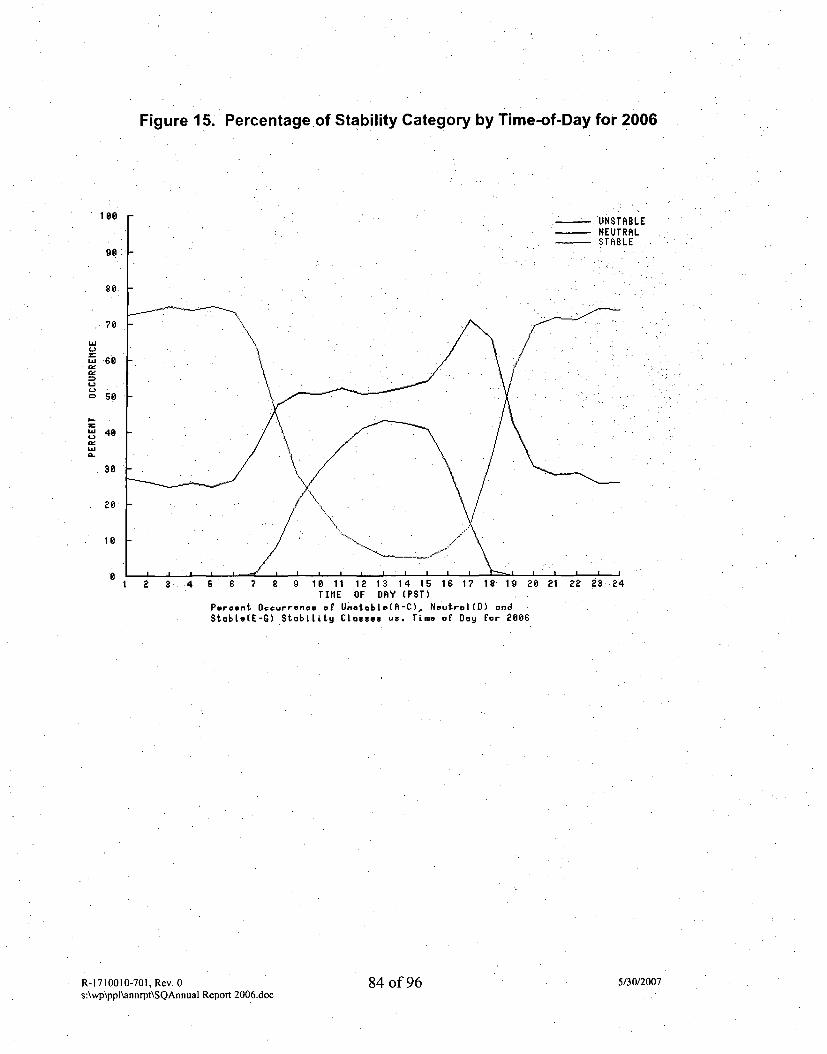
Figure 15. Percentage of Stability Category by Time-of-Day for 2006
188, .. . . .-UNSTABLE
NEUTRALSTABLE
98
6 68
L-
L.J 48
wA
30
28
1 2 3 .4 6 6 7 8 0 10 11 12 13 14 16 1s 17 18 10 28 21 22 23 24TIME OF DRY (PST)
Percent Occurrence of Unatable(A-C), Noutral CD) andStabLe(E-G) Stability Ctaaaaa ue. Time of' Day for 2886
1710010-70 1.Rev.0 84 of96 5/30/2007Rs:\wp\ppl\annrpt\SQAnnual Report 2006.doc
v .....
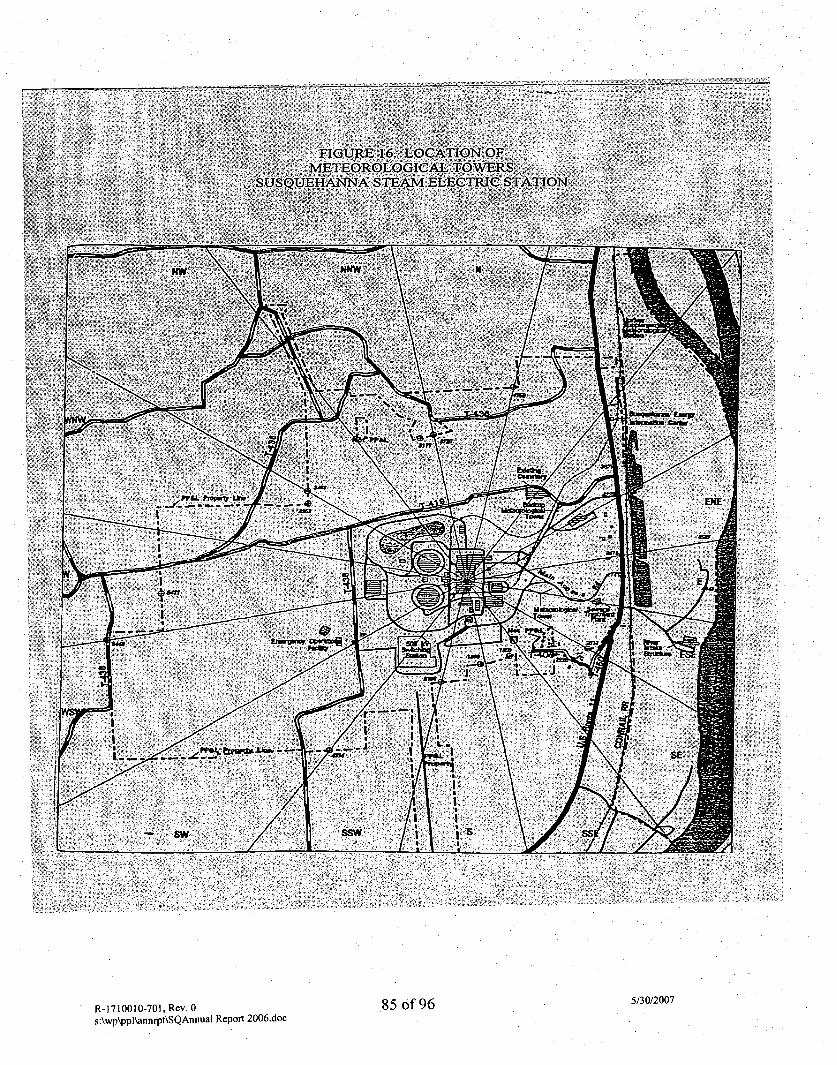
R-1710010-701, Rev. 0 85 of 96 5/30/2007s:\wp\ppl\annrpt\SQAnniual Report 2006.doc
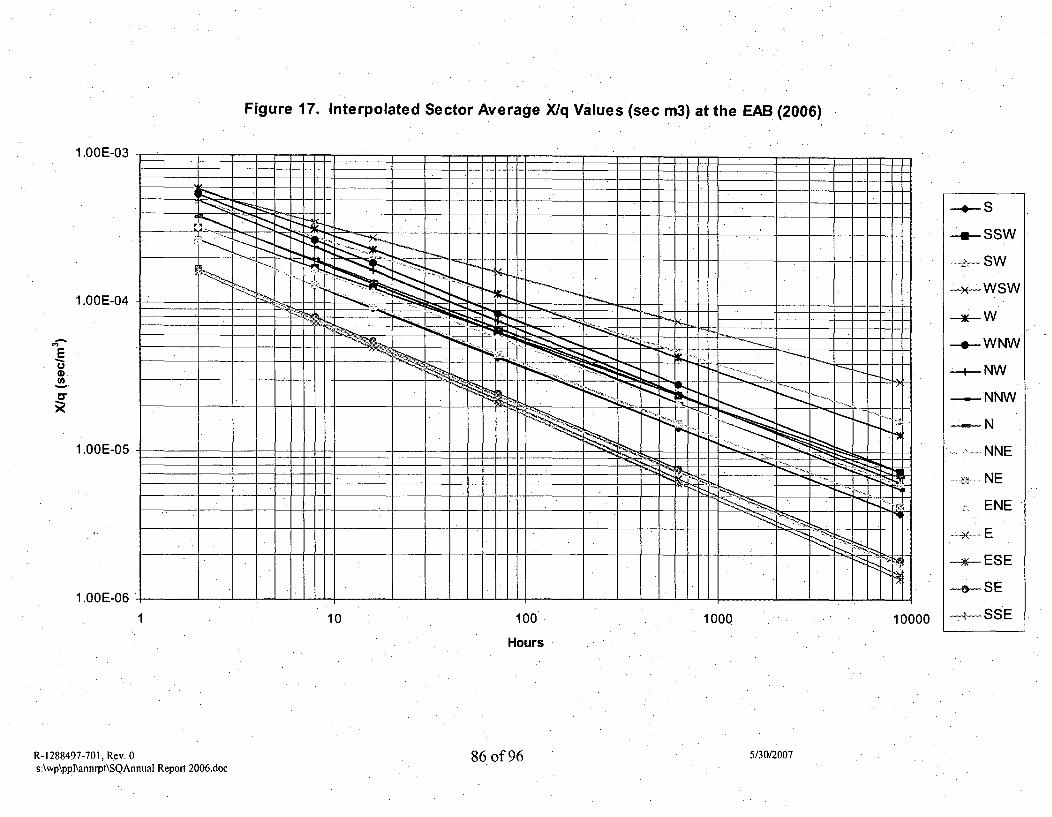
Figure 17. Interpolated Sector Average X/q Values (sec m3) at the EAB (2006)
1."OE-03 --
•S
__~-~- -m--SSW
-WSW
= % ............. N1 .. OE-04
-.- WNW
:~~-- --....- }.- NW
U NNW
1 .OOE-05 -NNE
_ NE
/ .ESE
1.OOE-06 S E
1 10 100 1000 10000 SSE
Hours
288497-701, Rev. 0 86 of 96 5/30/2007R-1s:\wp\ppl\annrpt\SQAnnua1 Report 2006.doc
• V• J V
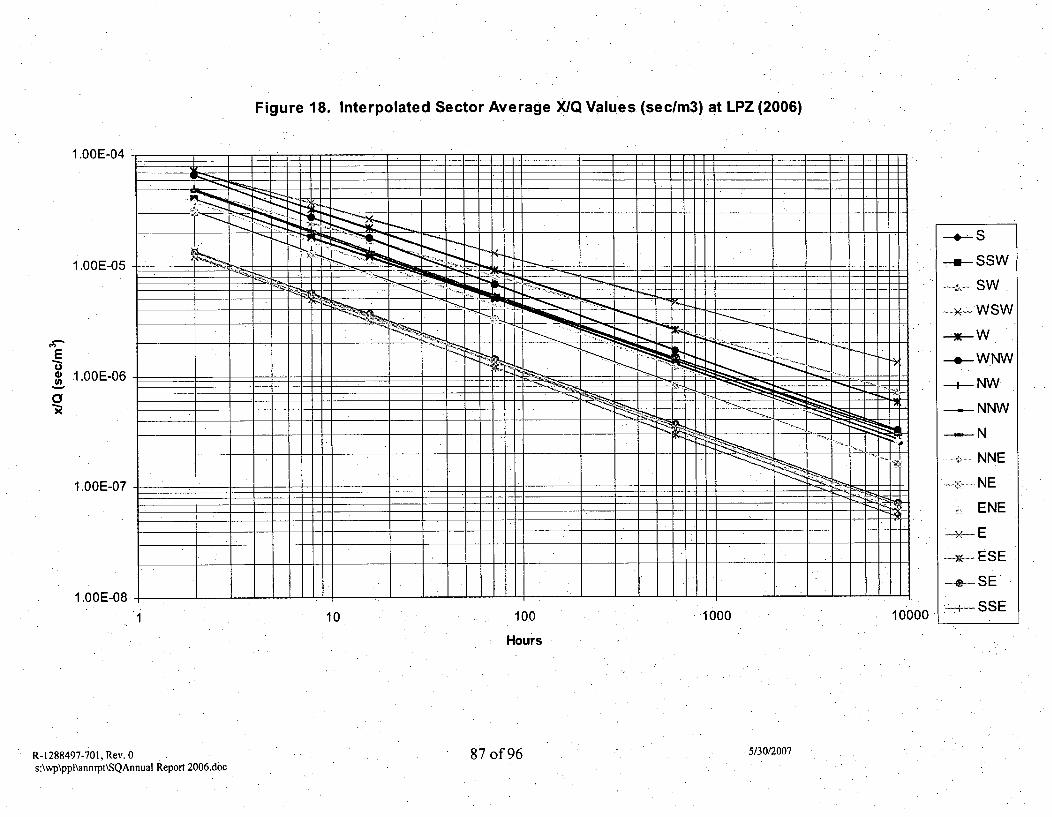
Figure 18. Interpolated Sector Average X/Q Values (seclm3) at LPZ (2006)
1.00E-04
1.OOE-05
E
.1.00E-06
a)1.OOE-06
1.00E-07
1 .00E-08
-- S
-.SSW. SW .
•WSW
W.
-.- WNW
-+- NW
--- NNW
- N
.. NNE
NE
ENE
-×-- E-~-•-ESE
-.- SE*
~-- SSE1 10 10.0 1000
Hours
10000
R-1288497-701, Rev. 0s:\wp\ppl\annrpt\SQAnnual Report 2006.doc
87 of 96 5/30/2007
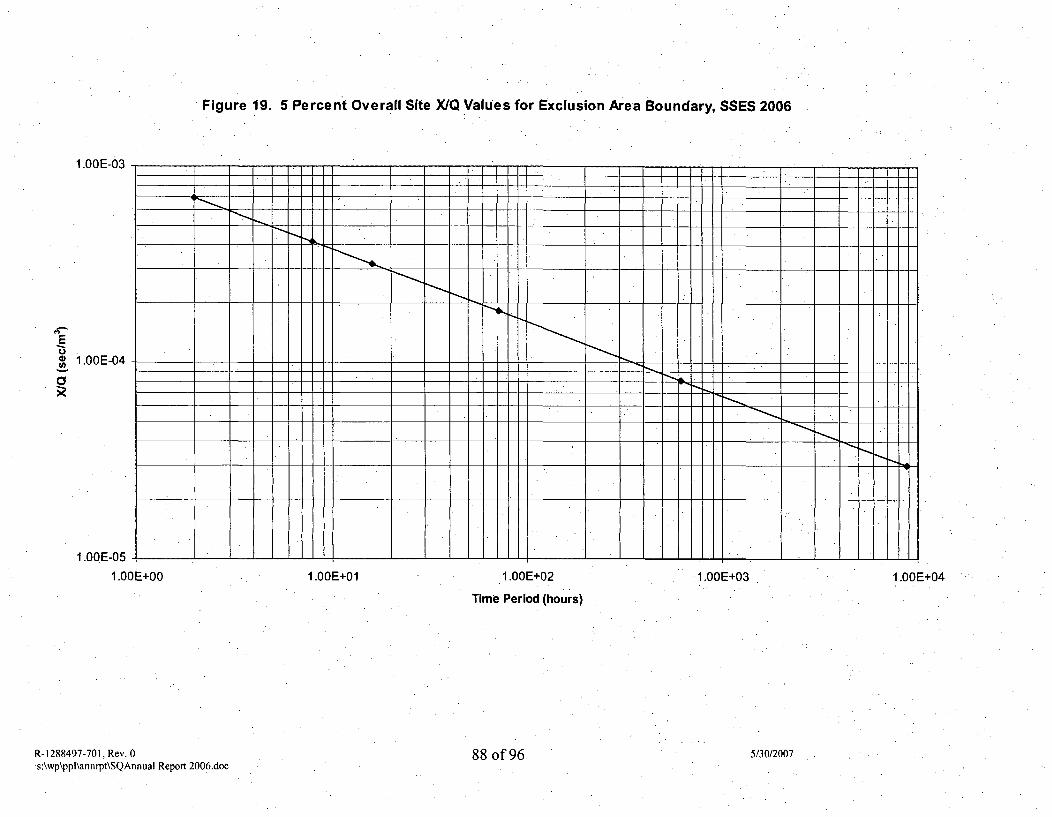
Figure 19. 5 Percent Overall Site XIQ Values for Exclusion Area Boundary, SSES 2006
1.OOE-03
1 1.00E-04
1.00E-05
1 .OOE+O0 1.00E+01 1.OOE+02 S1.OOE+03 1.OOE÷04
Time Period (hours)
R-1288497-701, Rev. 0s:\wp\ppl\annrpt\SQAnnual Report 2006.doc
88 of 96 5/30/2007
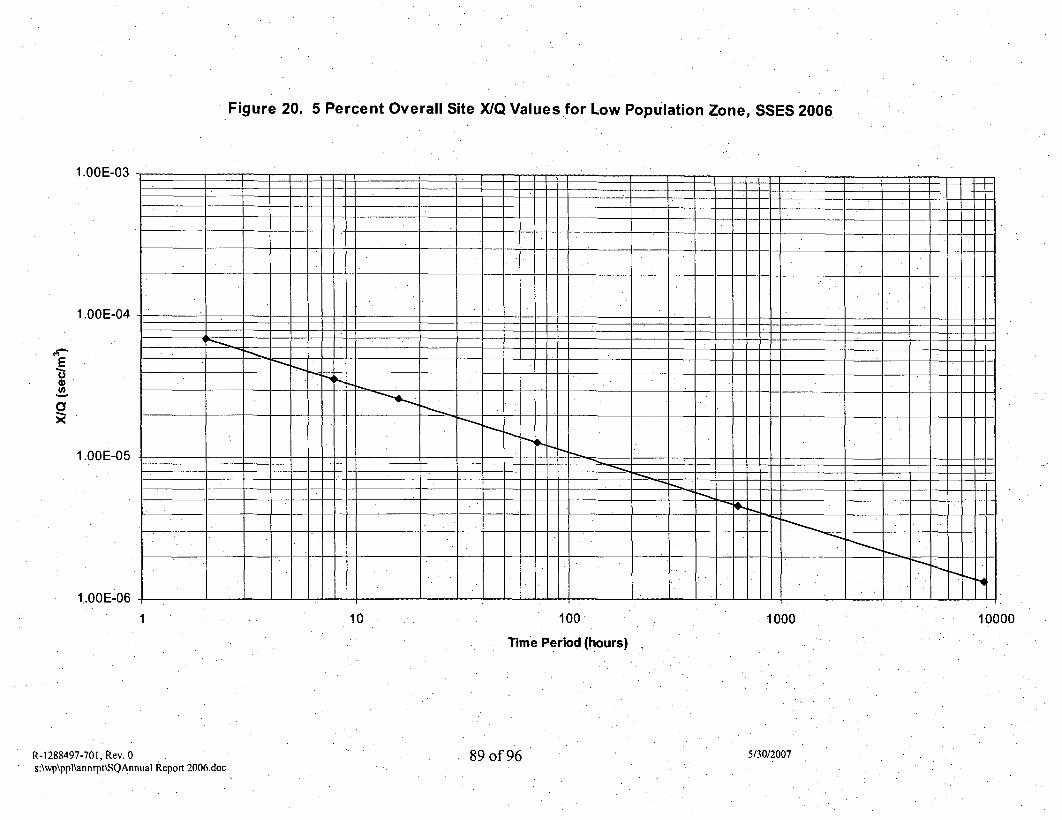
Figure 20. 5 Percent Overall Site X/Q Values for Low Population Zone, SSES 2006•
1.OOE-03 "
1.OOE-04
.E
1.OOE-05 -
1,00E-06 1
1 10 100 1000 10000
Time Period (hours)
88497-701 Rev. 0 RO nfOIh" 5/30/2007R-12
s:\wp\pp1\annrpt\SQArinua1 Report 2006.doc
APPENDIX A
SSES
METEOROLOGICAL INSTRUMENTATION
DESCRIPTION
R-1710010-701, Rev. 0s:\wp\ppl\annrpt\SQAnnual Report 2006.doc
90 of 96 5/30/2007
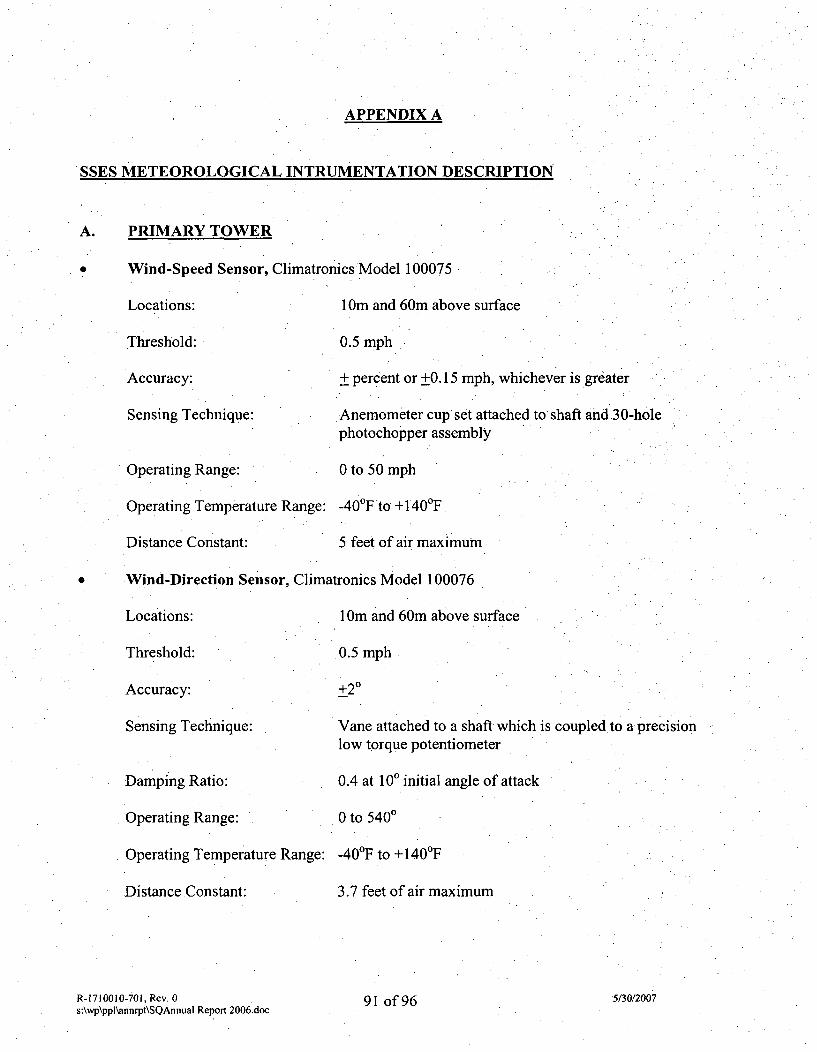
APPENDIX A
SSES METEOROLOGICAL INTRUMENTATION DESCRIPTION
A. PRIMARY TOWER
Wind-Speed Sensor, Climatronics Model 100075
Locations: I Om and 60m above surface
Threshold: 0.5 mph
Accuracy: ± percent or +0.15 mph, whichever is greater
Sensing Technique: Anemometer cup set attached to shaft and 30-holephotochopper assembly
Operating Range: 0 to 50 mph
Operating Temperature Range: -40°F to +I400F
Distance Constant: 5 feet of air maximum
'Wind-Direction Sensor, Climatronics Model 100076
Locations: I Om and 60m above surface
Threshold: 0.5 mph
Accuracy: +2°
Sensing Technique: Vane attached to a shaft which is coupled to a precisionlow torque potentiometer
Damping Ratio: 0.4 at 100 initial angle of attack
Operating Range: 0 to 5400
Operating Temperature Range: -40°F to +140°F
Distance Constant: 3.7 feet of air maximum
R-1710010-701, Rev. 0 91 of 96 5/30/2007s:\wp\ppl\annrpt\SQAnnuaI Report 2006.doc
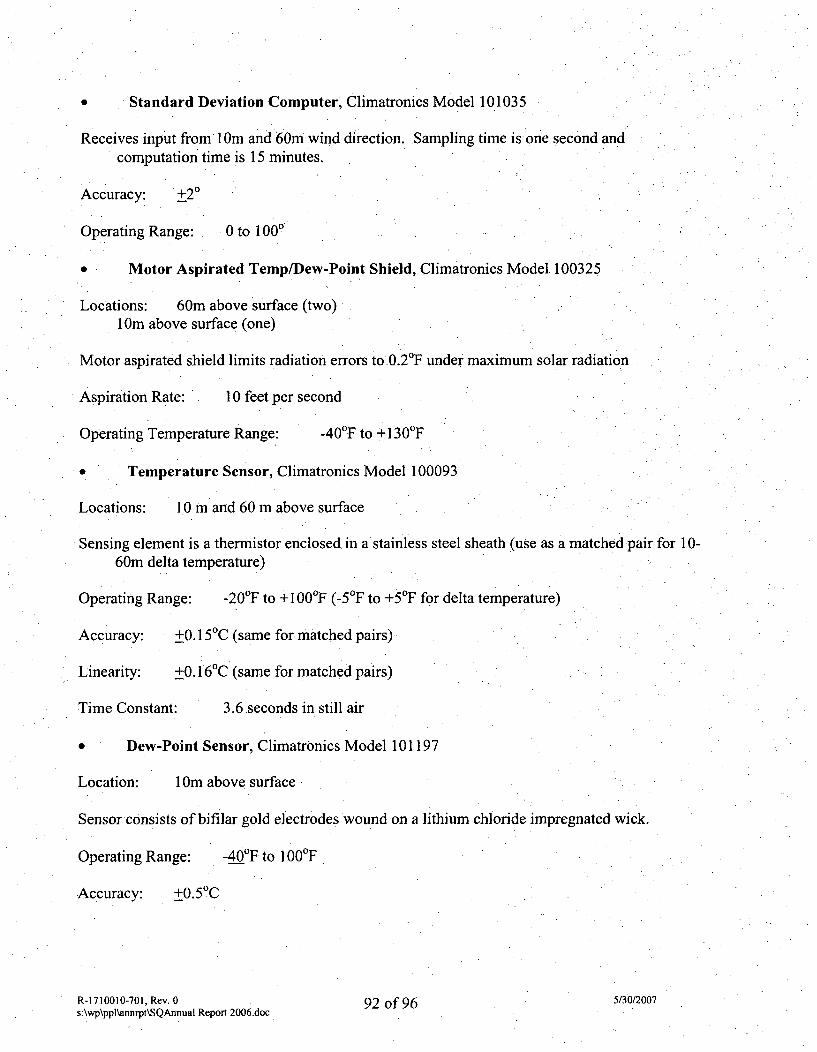
* Standard Deviation Computer, Climatronics Model 101035
Receives input from 1 m and 60m wind direction. Sampling time is one second andcomputation time is 15 minutes.
Accuracy: +20
Operating Range: 0 to 1000
* Motor Aspirated Temp/Dew-Point Shield, Climatronics Model 100325
Locations: 60m above surface (two)1 Om above surface (one)
Motor aspirated shield limits radiation errors to 0.20F under maximum solar radiation
Aspiration Rate: 10 feet per second
Operating Temperature Range: -40°F to +130°F
* Temperature Sensor, Climatronics Model 100093
Locations: 10 m and 60 m above surface
Sensing element is a thermistor enclosed in a stainless steel sheath (use as a matched pair for 10-60m delta temperature)
Operating Range: -20 0F to +I 000F (-5OF to +50F for delta temperature)
Accuracy: +0.1 50C (same for matched pairs)
Linearity: ±0.1 60C (same for matched pairs)
Time Constant: 3.6 seconds in still air
* Dew-Point Sensor, Climatronics Model 101197
Location: 1 Om above surface
Sensor consists of bifilar gold electrodes wound on a lithium chloride impregnated wick.
Operating Range: -40°F to I 00°F
Accuracy: +0.5 0C
R-1710010-701, Rev. 0 92 of 96 5/30/2007s:\wp\ppl\annrpt\SQAnnuaI Report 2006.doc
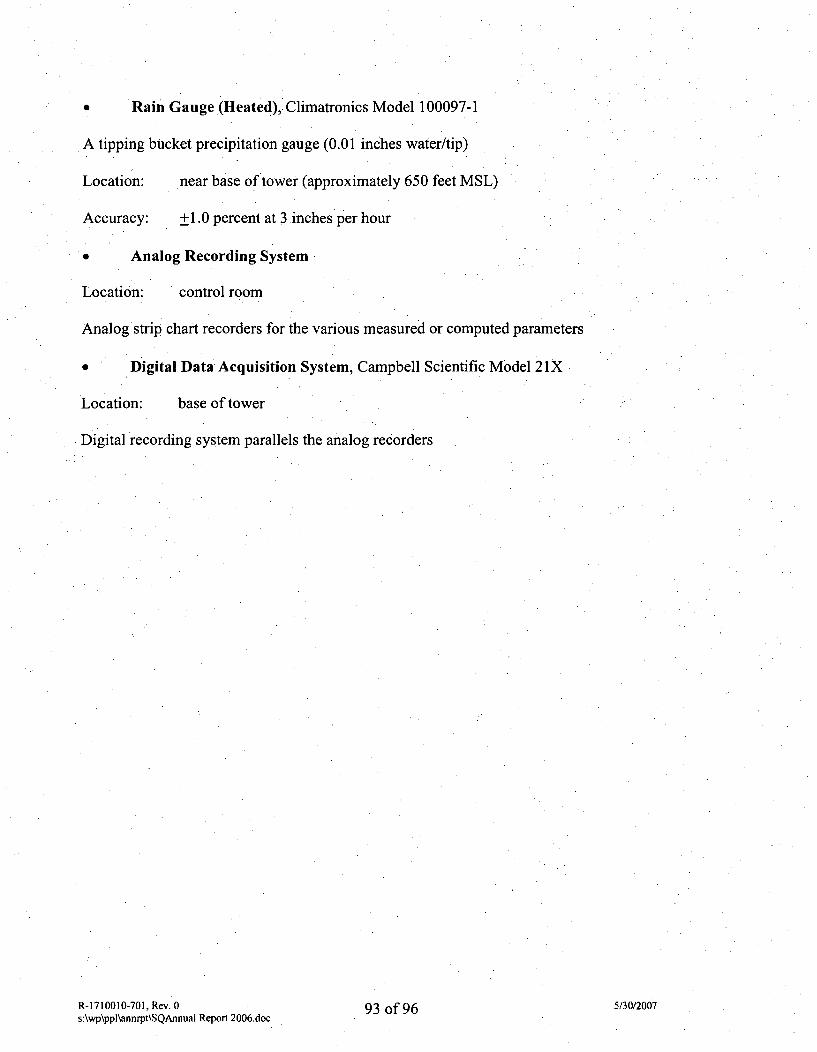
* •Rain Gauge :(Heated), Climatronics Model 100097-1
A tipping bucket precipitation gauge (0.01 inches water/tip)
Location: near base of tower (approximately 650 feet MSL)
Accuracy: +1.0 percent at 3 inches per hour
• Analog Recording System
Location: control room
Analog strip chart recorders for the various measured or computed parameters
• o Digital Data Acquisition System, Campbell Scientific Model 21X
Location: base of tower
Digital recording system parallels the analog recorders
R- 1710010-701, Rev. 0 QIrnf OA 5/30/2007s:\wp\ppl\annrpt\SQAnnuaI Report 2006.doc .J,..J •*,Jl .J•
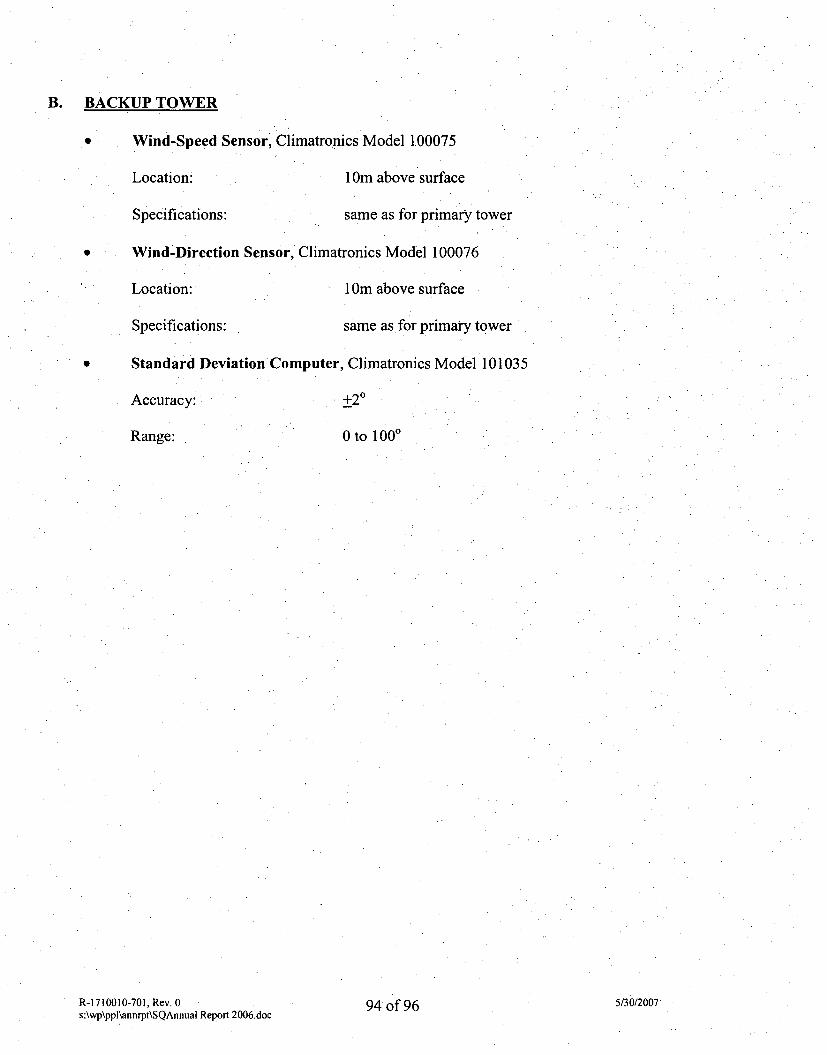
B. BACKUP TOWER
* Wind-Speed Sensor, Climatronics Model 1.00075
Location- 1 Om above surface
Specifications: same as for primary tower
* Wind-Direction Sensor, Climatronics Model 100076
' Location: I Om above surface
Specifications: same as for primary tower
* Standard Deviation Computer, Climatronics Model 101035
Accuracy: +2°
Range: 0 to 1000
R-1710010-701, Rev. 0 OA ,- rO, 5/30/2007s:\wp\ppl\annrpt\SQAnnuaI Report 2006.doc %7- lJ U
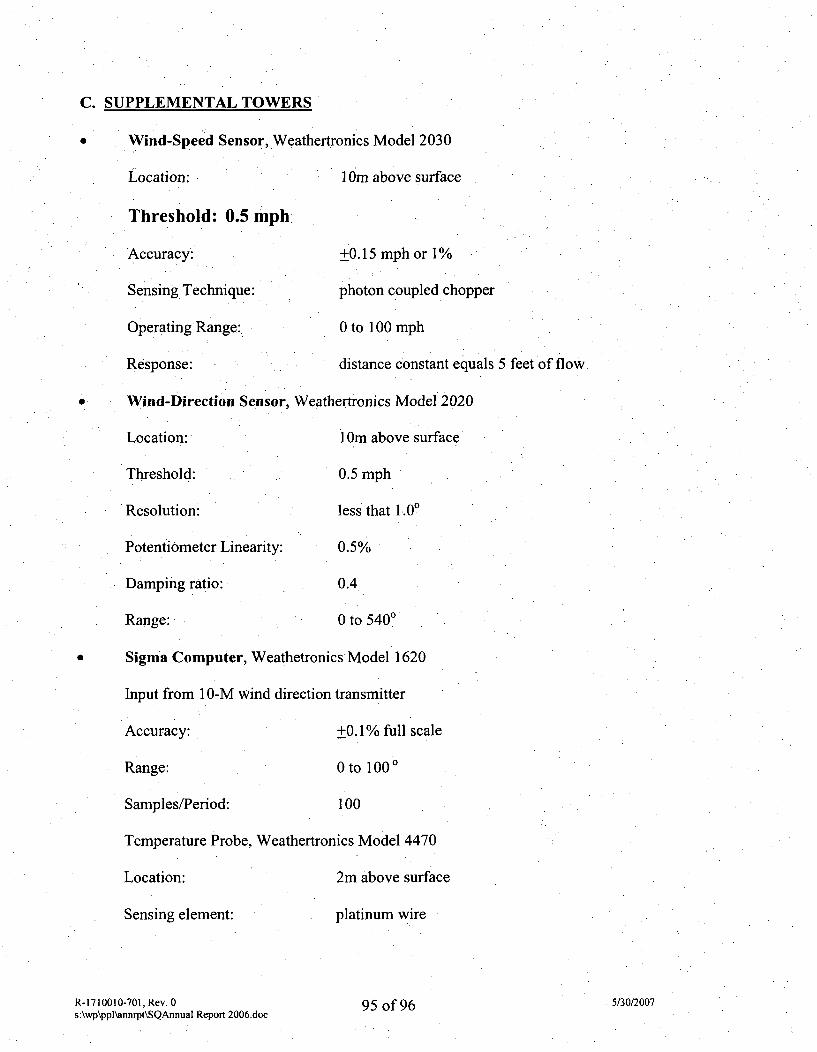
C. SUPPLEMENTAL TOWERS
Wind-Speed Sensor, Weathertronics Model 2030
Location: I Om above surface
Threshold: 0.5 mph.
Accuracy: +0.15 mph or 1%
Sensing Technique: photon coupled chopper
Operating Range: 0 to 100 mph
Response: distance constant equals 5 feet of flow.
* Wind-Direction Sensor, Weathertronics Model 2020
Location: I Om above surface
Threshold: 0.5 mph
Resolution: less that 1.00
Potentiometer Linearity: 0.5%
Damping ratio: 0.4
Range: 0 to 5400
* Sigma Computer, Weathetronics Model 1620
Input from 1 0-M wind direction transmitter
Accuracy: +0.1% full scale
Range: 0 to 100 0
Samples/Period: 100
Temperature Probe, Weathertronics Model 4470
Location: 2m above surface
Sensing element: platinum wire
R-1710010-701 Rev.0 5/30/2007s:\wp\pp1\annrpt\SQAnnua1 Report 2006.doc
VJUI•
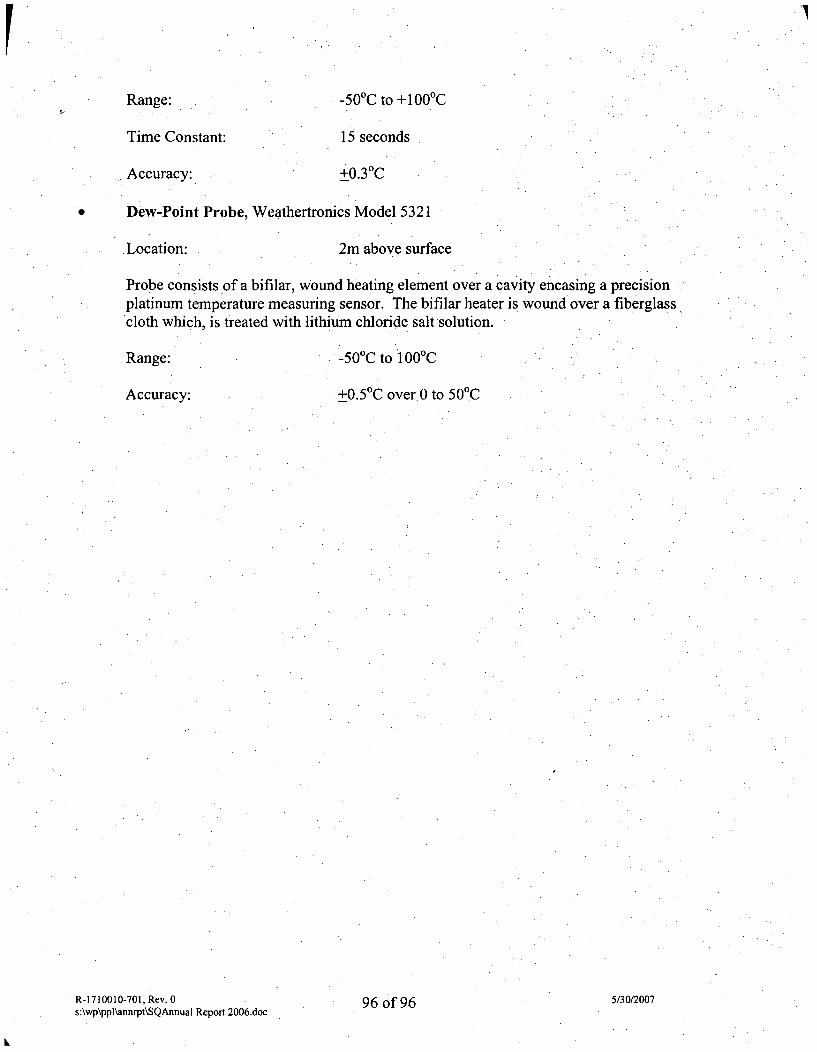
Range: -500C to +100 0C
Time Constant: 15 seconds
Accuracy: +0.3 0C
Dew-Point Probe, Weathertronics Model 5321
Location: 2m above surface
Probe consists of a bifilar, wound heating element over a cavity encasing a precisionplatinum temperature measuring sensor. The bifilar heater is wound over a fiberglasscloth which, is treated with lithium chloride salt solution.
Range: -500C to 1 00°C
Accuracy: +0.5 0C over 0 to 500C
R-1710010-701, Rev. 0s:\wp\ppl\annrpt\SQAnnuaI Report 2006 .doc
96 of 96 5/30/2007