Pittsburgh, PA 15213-3890 Software Engineering Institute Carnegie Mellon University Pittsburgh, PA...
28
Pittsburgh, PA 15213-3890 Software Engineering Institute Carnegie Mellon University Pittsburgh, PA 15213-3890 Sponsored by the U.S. Department of Defense © 2002 by Carnegie Mellon University Developing Enterprise- Wide Measures for Tracking Performance of Acquisition Organizations Wolfhart Goethert
-
date post
21-Dec-2015 -
Category
Documents
-
view
222 -
download
1
Transcript of Pittsburgh, PA 15213-3890 Software Engineering Institute Carnegie Mellon University Pittsburgh, PA...

Pittsburgh, PA 15213-3890
Software Engineering InstituteCarnegie Mellon UniversityPittsburgh, PA 15213-3890
Sponsored by the U.S. Department of Defense© 2002 by Carnegie Mellon University
Developing Enterprise-Wide Measures for Tracking Performance of Acquisition Organizations
Wolfhart Goethert

© 2002 by Carnegie Mellon University
Carnegie MellonSoftware Engineering Institute
Purpose of Overall Effort
Develop a methodology to define enterprise-wide measures that reflect the “health” of a government organization that supports acquisition.
Apply methodology to ensure alignment between the enterprise-level goals of an organization and the measures used to characterize that organization's performance.
Use these measures as a guide to their overall performance and performance improvement effort.

© 2002 by Carnegie Mellon University
Carnegie MellonSoftware Engineering Institute
Overview Outline
Methodology
Major components• BSC• GQ(I)M
Example use• Initial measurement areas• Indicators
Summary

Develop Strategic Goals
Mission VisionClarify mission & Vision statement
Strategic Goals
Derive Sub-Goals
Sub-Goals
Map Sub-Goals to each quadrant of the Balanced Score Card
Apply GQ(I)M to: - identify measurement areas - develop measurement goals - pose relevant questions - postulate indicators - identify data elements
For each BSC Quadrant
Data Elements
Module
Tro
ub
le R
epo
rts
Indicators
Balanced Scorecard
Internal Business• Sub-Goals
Learning & Growth• Sub-Goals
Customer• Sub-Goals
Financial• Sub-Goals
Internal Business• Sub-Goals
Learning & Growth• Sub-Goals
Customer• Sub-Goals
Financial• Sub-Goals
Methodology Overview

© 2002 by Carnegie Mellon University
Carnegie MellonSoftware Engineering Institute
Major Components
GQ(I)M• Align measures with goals; ensure measures selected will be used
Balanced Scorecard• Ensure set of measures provides coverage of all elements of performance; avoid hidden trade-offs
Process Model of Performance• Select measures that are most meaningful with respect to selected areas of performance; prefer outcome then output measures over process and input measures

A Balanced Scorecard Perspective on Performance
Source: A Management Guide for the deployment of strategic metrics, Ratheon
Ob
ject
ive
Me
asu
res
Ta
rge
tsIn
itia
tive
sCUSTOMER
How do our customers see us?
Ob
ject
ive
Me
asu
res
Ta
rge
tsIn
itia
tive
s
LEARNING andGROWTH
Can we continue to improve and create value?
Ob
ject
ive
Me
asu
res
Ta
rge
tsIn
itia
tive
sFINANCIAL
How do we look to shareholders?
Ob
ject
ive
Me
asu
res
Ta
rge
tsIn
itia
tive
s
INTERNAL BUSINESSPROCESS
What must we excel at?
Visionand
Strategy
Ob
ject
ive
Me
asu
res
Ta
rge
tsIn
itia
tive
sCUSTOMER
How do our customers see us?
Ob
ject
ive
Me
asu
res
Ta
rge
tsIn
itia
tive
s
LEARNING andGROWTH
Can we continue to improve and create value?
Ob
ject
ive
Me
asu
res
Ta
rge
tsIn
itia
tive
sFINANCIAL
How do we look to shareholders?
Ob
ject
ive
Me
asu
res
Ta
rge
tsIn
itia
tive
s
INTERNAL BUSINESSPROCESS
What must we excel at?
Visionand
Strategy
Visionand
Strategy

© 2002 by Carnegie Mellon University
Carnegie MellonSoftware Engineering Institute
Success Vs Progress Indicators
Success CriteriaGoal
Strategy to accomplish the goal
Progress Indicators
Success Indicators
Task 1Task 2Task 3
Task n
Tasks to Accomplish goal
••
Task 1Task 2Task 3
Task n
Tasks to Accomplish goal
••••
Analysis Indicators
80
2040
60
100
Tasks
Tes
t C
ase
sC
om
ple
te
FunctionsReporting Periods
Planned
Actual
1 2 3 4 1 2 3 4
%
Reporting Periods
80
204060
100

© 2002 by Carnegie Mellon University
Carnegie MellonSoftware Engineering Institute
Identifying Potential Measures: A Process Model of Performance
Inputs
Process
Outputs
Outcomes
Impact on customer or user
Products and services
Throughput, tasks
Resources consumed
Potential Measures

© 2002 by Carnegie Mellon University
Carnegie MellonSoftware Engineering Institute
Identifying Potential Measures: A Process Model of Performance
Inputs
Process
Outputs
Outcomes
Outcomes: trends in customer satisfaction survey data, number of defects reported after release
Outputs – number of new features released, resolution time for customer service calls
Inputs - dollars spent on customer service training, dollars spent on quality assurance
Process - number of work product inspections performed, number of tests performed
Goal: Increase Customer Satisfaction

© 2002 by Carnegie Mellon University
Carnegie MellonSoftware Engineering Institute
Balanced Scorecard Perspective: A Multi-dimensional view
Financial Perspective
Customer Perspective Internal Business Perspective
Innovation and Learning Perspective
Source: Kaplan and Norton, ”Putting the Balanced Scorecard to Work” Harvard Business Review, Sept-Oct 1993
VisionAnd
Strategy

© 2002 by Carnegie Mellon University
Carnegie MellonSoftware Engineering Institute
Defining Indicators
& Measures
Based Upon Goals
GOAL(s)
Question 1 Question 2 Question n• • •
SLOC Staff-hours Trouble Reports Milestone dates
Reporting Periods
Total SLOC Planned
Actual
Weeks
Tro
ub
le R
pts
Module

© 2002 by Carnegie Mellon University
Carnegie MellonSoftware Engineering Institute
Overview Outline
Methodology
Major components• BSC• GQ(I)M
Example use• Initial measurement areas• Indicators
Summary

© 2002 by Carnegie Mellon University
Carnegie MellonSoftware Engineering Institute
Organization
Example based on aggregate of several organizations with similar characteristics• Government agency consisting of 300 management,
administrative, and technical personnel• Development, maintenance and enhancement of
system components of fielded systems, and acquisition

© 2002 by Carnegie Mellon University
Carnegie MellonSoftware Engineering Institute
Use of Methodology - Example
Mission
Strategic Goals
Measurement Workshop
Purpose
Sub-Goals
- Clarify Mission and Vision- Develop Strategic Goals- Derive Sub-Goals- Map sub-goals to each quadrant of the BSC
Customer• Timeliness• Responsiveness• Communication• Relationship• Quality of products • Etc.
Develop, acquirer, and maintain integrated software-intensive systems
Financial• Funding stability • Delivered costs• Etc.
Internal Business• Quality
deficiencies • Available
resources• Etc.
Learning and Growth• Enhance staff
capability • Improvement quality• Etc.

© 2002 by Carnegie Mellon University
Carnegie MellonSoftware Engineering Institute
Success Criteria
Balanced Scorecard
Internal Business• Sub-Goals
Learning & Growth• Sub-Goals
Customer• Sub-Goals
Financial• Sub-Goals
Internal Business• Sub-Goals
Learning & Growth• Sub-Goals
Customer• Sub-Goals
Financial• Sub-Goals
BSC QuadrantStrategic SuccessSub-Goals Criteria
FinancialInternal Business Process
CustomerLearning and Growth
Success Criteria

© 2002 by Carnegie Mellon University
Carnegie MellonSoftware Engineering Institute
Typical Questions Related to Sub-Goals
Customers’ Viewpoint• What is important to our customer? What are the
customers’ “hot buttons”?• How do our customers evaluate timeliness?• What does the customer consider a quality product?
Are there any standards or goals currently set by the customer?
• How and what do our customers currently evaluate our organization?
• Etc.
© 2002 by Carnegie Mellon University
Carnegie MellonSoftware Engineering Institute
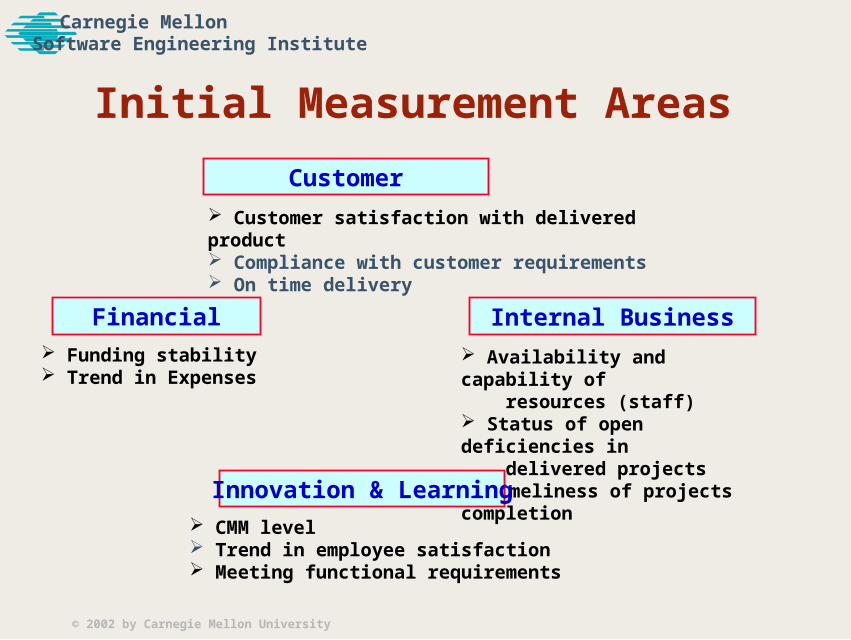
Initial Measurement Areas
Customer
Customer satisfaction with delivered product Compliance with customer requirements On time delivery
Internal Business
Availability and capability of resources (staff) Status of open deficiencies in delivered projects Timeliness of projects completion
Innovation & Learning CMM level Trend in employee satisfaction Meeting functional requirements
Financial Funding stability Trend in Expenses

© 2002 by Carnegie Mellon University
Carnegie MellonSoftware Engineering Institute
Measurement Areas to Indicators
INTERNAL BUS.
• Meas. Area
LEARNING & GROWTH
CUSTOMER• Meas. Area
FINANCIAL• Meas. Area
Meas. Area
Module
Tro
ub
le R
epo
rts
Indicators
GQ(I)M Methodology

© 2002 by Carnegie Mellon University
Carnegie MellonSoftware Engineering Institute
Internal BusinessStatus of Open Deficiencies in Delivered Projects
x < 30 30 < x 60 60 < x 90 x > 90
Number of DeficienciesThat Have Been Open x Days
Severity 1
Severity 2
Severity 3
Severity 4
Severity 5
SeverityLevels Totals
Totals
2 1
3 1
3 24 3 3 2
8 6 3 3
1
1 1
20 13 8 6
3
5
7
12
20
47

© 2002 by Carnegie Mellon University
Carnegie MellonSoftware Engineering Institute
Internal BusinessAvailability and Capability of Resources (Staff)
GOAL
# % # % # %
Entry Level
Journeyman
High Grade
Entry Level
Journeyman
High Grade
Entry Level
Journeyman
High Grade
FY 99 FY 00 FY 01
45%
15%
E&S
Tech
Other
40%
GOAL
GOAL

© 2002 by Carnegie Mellon University
Carnegie MellonSoftware Engineering Institute
Internal BusinessTimeliness of Project Completion
10 38%
6 46%
2 15%
Completed Projects in Reporting Period
Reporting Period
Nu
mb
er
of
Pro
jec
ts
0
15
10
5
20
25
10
15
20
5
Lat
eO
n T
ime
12 44%
15 56%
15 60%
10 40%
Period 1 Period 2 Period 3
on time or earlyexceeded original schedule by less than 10%exceeded original schedule by more than 10%

© 2002 by Carnegie Mellon University
Carnegie MellonSoftware Engineering Institute
Summary of Initial Results
Customer
Learning and
Growth
Financial
Internal BusinessProcess
Balanced ScorecardCustomer
Learning and
Growth
Financial
Internal BusinessProcess
Balanced ScorecardCustomerCustomer
Learning and
Growth
Learning and
Growth
FinancialFinancial
Internal BusinessProcess
Internal BusinessProcess
Balanced Scorecard
Funding stabilityTrend in Expenses
Avail. & capability of staffStatus of open deficienciesTimeliness of project completion
Trend in employee satisfactionMeeting functional requirementsCMM Level
Satisfied with delivered ProductCompliant with requirementsOn-time delivery
x < 30 30 < x 60 60 < x 90 x > 90
Number of DeficienciesThat Have Been Open x Days
Severity 1
Severity 2
Severity 3
Severity 4
Severity 5
SeverityLevels Totals
Totals
2 1
3 1
3 24 3 3 2
8 6 3 3
1
1 1
20 13 8 6
3
5
7
12
20
47
0
2
4
6
8
10
12
1 2 3 4 5SA/CMM Level
Nu
mb
er
of
Org
an
izat
ion
s
Total SystemsFull
CompliancePartial
Compliance
# % # %
Compliance with customer requirements
Travel
PurchasesMiscTraining
Personnel
ContractServices

© 2002 by Carnegie Mellon University
Carnegie MellonSoftware Engineering Institute
Indicator Documentatio
n
INDICATOR TEMPLATE
Objective
QuestionsVisual Display
Interpretation
Evolution
Assumptions
X-referenceProbing Questions
Input(s)Data Elements
Responsibilityfor Reporting
Form(s)Algorithm
80
2040
60
100
Measurement Goal #_____:INDICATOR TEMPLATE
Objective
QuestionsVisual Display
Interpretation
Evolution
Assumptions
X-referenceProbing Questions
Input(s)Data Elements
Responsibilityfor Reporting
Form(s)Algorithm
80
2040
60
100
Measurement Goal #_____:INDICATOR TEMPLATE
Objective
QuestionsVisual Display
Interpretation
Evolution
Assumptions
X-referenceProbing Questions
Input(s)Data Elements
Responsibilityfor Reporting
Form(s)Algorithm
80
2040
60
100
Measurement Goal # _____:
Documents the why, what, who, when, where, and how

© 2002 by Carnegie Mellon University
Carnegie MellonSoftware Engineering Institute
Overview Outline
Methodology
Major components• BSC• GQ(I)M
Example use• Initial measurement areas• Indicators
Summary

© 2002 by Carnegie Mellon University
Carnegie MellonSoftware Engineering Institute
Summary
The approach, using the BSC and GQ(I)M, provides a systematic way to obtain indicators and measures that reflect the health and performance of the organization.
The approach uses an organization’s vision and mission statements to identify and clarify strategic goals and sub-goals.
The sub-goals are mapped to the balanced scorecard.
The GQ(I)M methodology is then used to identify measures and indicators
We tried it; It worked; Now maturing methodology
Bottom Line

Develop Strategic Goals
Mission draft VisionClarify mission & Vision statement
Strategic Goals
Derive Sub-Goals
Sub-Goals
Map Sub-Goals to each quadrant of the Balanced Score Card
Apply GQ(I)M to: - identify measurement areas - develop measurement goals - pose relevant questions - postulate indicators - identify data elements
For each BSC Quadrant
Data Elements
Module
Tro
ub
le R
epo
rts
Indicators
Balanced Scorecard
Internal Business• Sub-Goals
Learning & Growth• Sub-Goals
Customer• Sub-Goals
Financial• Sub-Goals
Internal Business• Sub-Goals
Learning & Growth• Sub-Goals
Customer• Sub-Goals
Financial• Sub-Goals
Methodology

© 2002 by Carnegie Mellon University
Carnegie MellonSoftware Engineering Institute
Back-up Material

© 2002 by Carnegie Mellon University
Carnegie MellonSoftware Engineering Institute
Some Definitions
Performance Management“The use of performance measurement information to help set agreed-upon performance goals, allocate and prioritize resources, inform managers to either confirm or change current policy or program directions to meet those goals, and report on the success in meeting those goals.”
Performance Measurement“A process of assessing progress towards achieving predetermined goals, including information on [efficiency, quality, and] outcomes….
Source: “Serving the American Public: Best practices in performance measurement,” June 1997.