Pittsburgh, PA 15213-3890 CMMI Impact Interim Report 2.0 - Page 1 CMMI ® Sponsored by the U.S....
40
Pittsburgh, PA 15213-3890 CMMI Impact Interim Report 2.0 - Page 1 CMMI ® Sponsored by the U.S. Department of Defense © 2003 by Carnegie Mellon University Why Should I Switch to CMMI ® ? Initial Evidence about Impact and Value Added Dennis R. Goldenson Diane L. Gibson Robert W. Ferguson 19 November 2003
-
Upload
imogene-webster -
Category
Documents
-
view
213 -
download
0
Transcript of Pittsburgh, PA 15213-3890 CMMI Impact Interim Report 2.0 - Page 1 CMMI ® Sponsored by the U.S....

Pittsburgh, PA 15213-3890
CMMI Impact Interim Report 2.0 - Page 1
CMMI ®
Sponsored by the U.S. Department of Defense© 2003 by Carnegie Mellon University
Why Should I Switch to CMMI®? Initial Evidence about Impact and Value Added
Dennis R. GoldensonDiane L. GibsonRobert W. Ferguson
19 November 2003
© 2003 by Carnegie Mellon University CMMI Impact Interim Report - Page 2
CMMI ®
ContentsObjectives and review current work
Research on CMMI® Impact
Characterizing Impacts
Benefits of CMMI-based Process Improvement
Recently reported CMMI and CMM® results
Proposed future directions
© 2003 by Carnegie Mellon University CMMI Impact Interim Report - Page 3
CMMI ®
Overall ObjectivesProvide credible, objective evidence about organizations’ experiences with CMMI based process improvement.
Focus:• Impact and value added• Investment and costs incurred• Conditions of successful adoption, transition, and
documented improvement • Pitfalls and obstacles to successful adoption and use
Conduct objective studies that inform the development and evolution of the CMMI product suite

© 2003 by Carnegie Mellon University CMMI Impact Interim Report - Page 4
CMMI ®
Current WorkCollaborative case studies• Early adopters with credible quantitative evidence of impact and
benefits of CMMI
• Selected supplementary evidence
SEI Special Report• Demonstrating the Impact and Benefits of CMMI®:
An Update and Preliminary Results
• Based on case studies, supplementary materials, and comprehensive literature review
Track at 3rd Annual CMMI Technology Conference and User Group • 14 case study presentations & keystone summary presentation
• Roundtable panel with discussion of next steps

© 2003 by Carnegie Mellon University CMMI Impact Interim Report - Page 5
CMMI ®
Organizations
Conference Presenters OthersAccenture Boeing Ltd, Australia CMS Information Services, Inc. Bosch Gasoline SystemsLockheed Martin Management and Data Systems
Fort Sill Fire Support Software Engineering Center
Lockheed Martin Maritime Systems and Sensors – Undersea Systems
General Motors Corporation
Lockheed Martin Systems Integration J.P. Morgan Chase & Co.Motorola Global Software Group, India Sanchez Computer Associates,
Inc.Northrop Grumman Defense Enterprise Systems
Thales Air Traffic Management
Raytheon North Texas Software Engineering
Thales Research & Technology
Thales Training & Simulation
Siemens Information Systems Ltd, India
Plus 2 Anonymous

© 2003 by Carnegie Mellon University CMMI Impact Interim Report - Page 6
CMMI ®
ContentsObjectives and review current work
Research on CMMI® Impact
Characterizing Impacts
Benefits of CMMI-based Process Improvement
Recently reported CMMI and CMM® results
Proposed future directions

© 2003 by Carnegie Mellon University CMMI Impact Interim Report - Page 7
CMMI ®
Why Do We Need Objective Evidence? Increasing numbers of organizations are considering using CMMI models
Trustworthy evidence is essential for • Addressing skepticism about model-based process
improvement in general• Demonstrate the value of CMMI over its source models• Building commitment and obtaining resources within an
organization• Enhancing ongoing quantitative management • Providing input for improving organizational processes and
technologies• Comparing results with those of comparable organizations

© 2003 by Carnegie Mellon University CMMI Impact Interim Report - Page 8
CMMI ®
What is Legitimate Evidence of Impact?Evidence based on:• New processes or changes to existing processes due to
CMMI• Broadened organizational scope across disciplines
- Especially for software intensive systems • Process changes that are consistent with, but predate,
CMMI- Especially in organizations appraised early at higher
CMMI maturity levels• Recent evidence based on the SW-CMM
- Much of the same content is present in CMMI models- And, such evidence can be compelling to skeptics about
any CMM-based process improvement

© 2003 by Carnegie Mellon University CMMI Impact Interim Report - Page 9
CMMI ®
GeneralizabilityCase studies
• Offer a great deal of valuable detail and context
• Provide lessons learned which can be used to guide future improvement efforts
• Demonstrate what can happen under the right organizational and technical circumstances
• However, results from individual case studies cannot be generalized
Our task is to design studies that better reflect the experiences of the wider CMMI community

© 2003 by Carnegie Mellon University CMMI Impact Interim Report - Page 10
CMMI ®
ContentsObjectives and review current work
Research on CMMI® Impact
Characterizing Impacts
Benefits of CMMI-based Process Improvement
Recently reported CMMI and CMM® results
Proposed future directions

© 2003 by Carnegie Mellon University CMMI Impact Interim Report - Page 11
CMMI ®
ROI&
Cost-Benefit
Process Capability &
Organizational Maturity
Process Capability &
Organizational Maturity
COSTS • Investments • Expenses
BENEFITS• Process
Adherence• Cost • Schedule• Productivity• Quality• Customer
Satisfaction
Impacts: Costs and Benefits of CMMI

© 2003 by Carnegie Mellon University CMMI Impact Interim Report - Page 12
CMMI ®
Seven Kinds of Performance MeasuresFrom the previous set, we found examples of 7 different categories of performance measures
• Process Adherence• Cost• Schedule• Productivity• Quality• Customer Satisfaction• Return on Investment
© 2003 by Carnegie Mellon University CMMI Impact Interim Report - Page 13
CMMI ®
ContentsObjectives and review current work
Research on CMMI® Impact
Characterizing Impacts
Impact of CMMI-based Process Improvement
Recently reported CMMI and CMM® results
Proposed future directions
© 2003 by Carnegie Mellon University CMMI Impact Interim Report - Page 14
CMMI ®
Impact: Process Adherence and Cost of Quality
• Work product completion improved dramatically (CMS Information Services, Inc.)
• Exceeded goal for reduction in cost of poor quality (Motorola Global Software Group, India)
• Improved adherence to quantitative management practices (Raytheon North Texas Software Engineering)
• Reduced cost of poor quality from over 45 percent to under 30 percent (Siemens Information Systems Ltd, India)
• Used Measurement and Analysis to significantly reduce the cost of quality in one year (reported under non disclosure)
© 2003 by Carnegie Mellon University CMMI Impact Interim Report - Page 15
CMMI ®
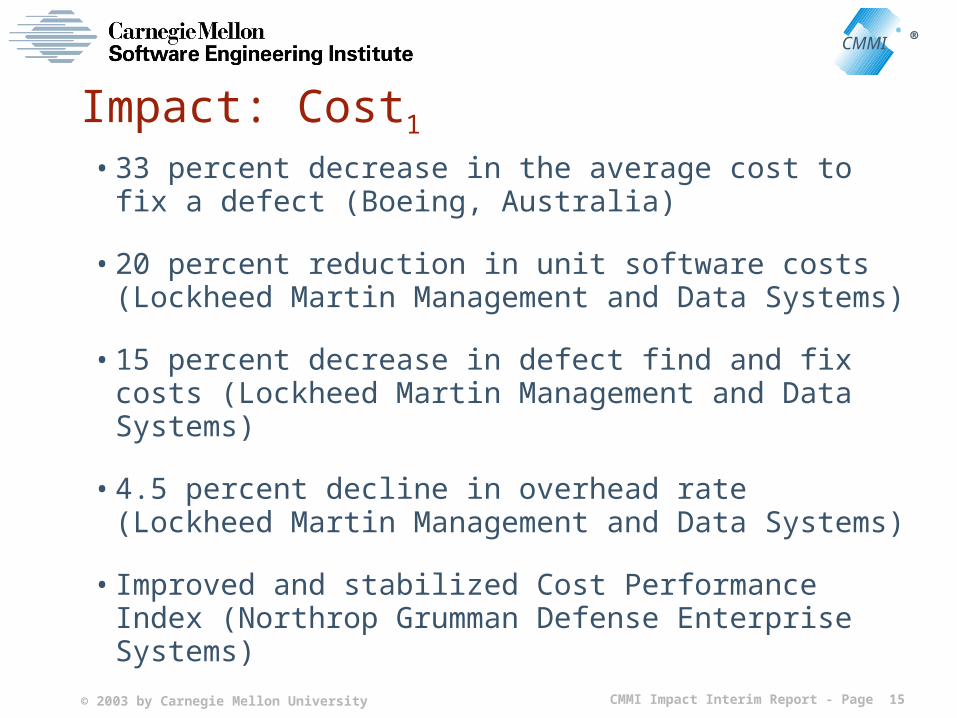
Impact: Cost1
• 33 percent decrease in the average cost to fix a defect (Boeing, Australia)
• 20 percent reduction in unit software costs (Lockheed Martin Management and Data Systems)
• 15 percent decrease in defect find and fix costs (Lockheed Martin Management and Data Systems)
• 4.5 percent decline in overhead rate (Lockheed Martin Management and Data Systems)
• Improved and stabilized Cost Performance Index (Northrop Grumman Defense Enterprise Systems)

© 2003 by Carnegie Mellon University CMMI Impact Interim Report - Page 16
CMMI ®
Impact: Cost2
• Increased accuracy in cost estimation (Raytheon North Texas Software Engineering)
• 5 percent improvement in average cost performance index with a decline in variation (Raytheon North Texas Software Engineering)- As the organization improved from SW-CMM level 4 to
CMMI level 5
• $2.1 Million in savings in hardware engineering processes (reported under non disclosure)

© 2003 by Carnegie Mellon University CMMI Impact Interim Report - Page 17
CMMI ®
Impact: Schedule1
• 50% reduction in release turn around time (Boeing, Australia)
• 60 percent reduction in work and fewer outstanding actions following pre-test and post-test audits (Boeing, Australia)
• Increased the percentage of milestones met from approximately 50 percent to approximately 95 percent (General Motors)
• Decreased the average number of days late from approximately 50 to fewer than 10 (General Motors)
• Increased through-put resulting in more releases per year (JP Morgan Chase)

© 2003 by Carnegie Mellon University CMMI Impact Interim Report - Page 18
CMMI ®
Impact: Schedule2
• Improved and stabilized Schedule Performance Index (Northrop Grumman Defense Enterprise Systems)
• Met every milestone (25 in a row) on time, with high quality and customer satisfaction (Northrop Grumman Defense Enterprise Systems)
• Reduced variation in schedule performance index (Raytheon North Texas Software Engineering)
• Reduced schedule variance over 20 percent (reported under non disclosure)
• Achieved 95 percent on time delivery (reported under non disclosure)

© 2003 by Carnegie Mellon University CMMI Impact Interim Report - Page 19
CMMI ®
Impact: Productivity• Improved productivity substantially, with “significantly more
rigorous engineering practices” due to CMMI (Fort Sill Fire Support Software Engineering Center)
• 30 percent increase in software productivity (Lockheed Martin Management and Data Systems)
• Improved software productivity (including reuse) from approximately 80 percent in 1992 baseline to over 140 percent at CMMI ML 5 (Lockheed Martin Systems Integration)
• 25 percent productivity improvement in 3 years (Siemens Information Systems Ltd, India)

© 2003 by Carnegie Mellon University CMMI Impact Interim Report - Page 20
CMMI ®
Impact: Quality1
• Reduced software defects substantially, with “significantly more rigorous engineering practices” due to CMMI(Fort Sill Fire Support Software Engineering Center)
• Reduced software-defects-per-million-delivered-SLOC by over 50 percent compared to defects prior to CMMI(Lockheed Martin Systems Integration)
• Reduced defect rate at CMMI ML5 approximately one third compared to performance at SW-CMM ML5 (Lockheed Martin Maritime Systems & Sensors – Undersea Systems)
• Met goal of 20 +/- 5 defects per KLOC (Northrop Grumman Defense Enterprise Systems)

© 2003 by Carnegie Mellon University CMMI Impact Interim Report - Page 21
CMMI ®
Impact: Quality2
• Only 2 percent of all defects found in the fielded system (Northrop Grumman Defense Enterprise Systems)
• Reduced identified defects from 6.6 per KLOC to 2.1 over 5 causal analysis cycles (Northrop Grumman Defense Enterprise Systems)
• Increased focus on quality by developers (Northrop Grumman Defense Enterprise Systems)
• Improved defect removal before test from 50 percent to 70 percent, leaving 0.35 post release defects per KLOC (Siemens Information Systems Ltd, India)
• 44 percent defect reduction following causal analysis cycle at maturity level 2 (reported under non disclosure)
© 2003 by Carnegie Mellon University CMMI Impact Interim Report - Page 22
CMMI ®
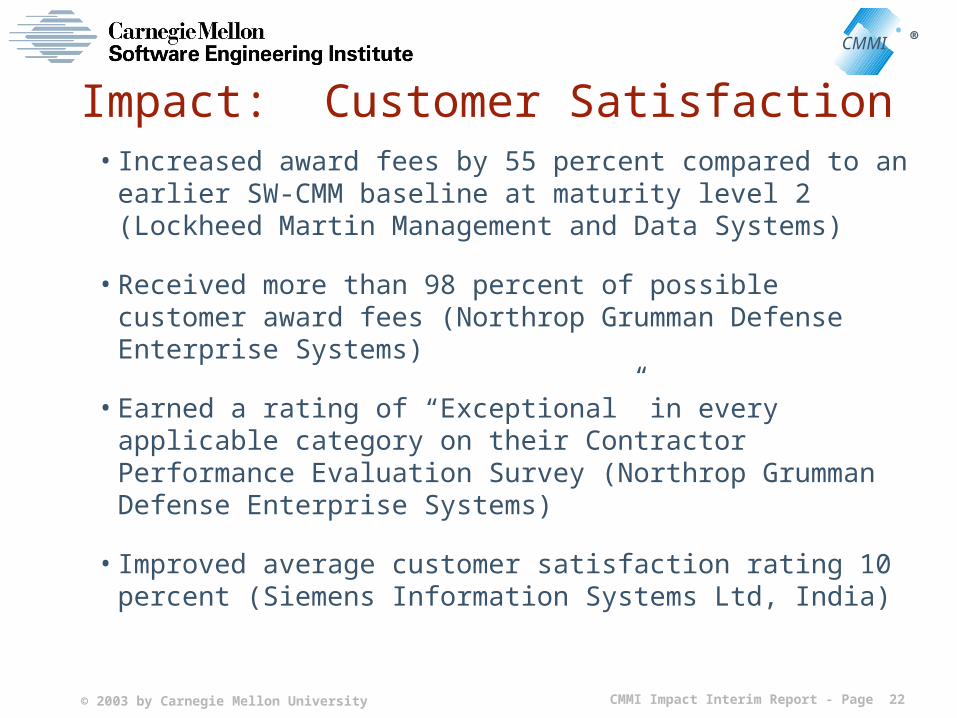
Impact: Customer Satisfaction• Increased award fees by 55 percent compared to an earlier
SW-CMM baseline at maturity level 2 (Lockheed Martin Management and Data Systems)
• Received more than 98 percent of possible customer award fees (Northrop Grumman Defense Enterprise Systems)
• Earned a rating of “Exceptional” in every applicable category on their Contractor Performance Evaluation Survey (Northrop Grumman Defense Enterprise Systems)
• Improved average customer satisfaction rating 10 percent (Siemens Information Systems Ltd, India)

© 2003 by Carnegie Mellon University CMMI Impact Interim Report - Page 23
CMMI ®
Impact: Return on Investment• 5:1 ROI for quality activities (Accenture)
• 13:1 ROI calculated as defects avoided per hour spent in training and defect prevention (Northrop Grumman Defense Enterprise Systems)
• Avoided $3.72M in costs due to better cost performance (Raytheon North Texas Software Engineering) - As the organization improved from SW-CMM level 4 to
CMMI level 5
• 2:1 ROI over 3 years (Siemens Information Systems Ltd, India)
• Processes for earlier defect detection, improved risk management, and better project control implemented after showing positive return on investment during pilot (Thales TT&S)

© 2003 by Carnegie Mellon University CMMI Impact Interim Report - Page 24
CMMI ®
ContentsObjectives and review current work
Research on CMMI® Impact
Characterizing Impacts
Benefits of CMMI-based Process Improvement
Recently reported CMMI and CMM® results
Proposed future directions

© 2003 by Carnegie Mellon University CMMI Impact Interim Report - Page 25
CMMI ®
CMMI and CMM Results The following are results from organizations who did not present at the 3rd Annual CMMI Technology Conference and User Group

© 2003 by Carnegie Mellon University CMMI Impact Interim Report - Page 26
CMMI ®
General Motors CorporationCMMI focus 2001
Goal is Integration of Supplier Work and GM Project Execution
Results:• Improved schedule – projects met milestones
and were fewer days late
Camping on a Seesaw: GM’s IS&S Process Improvement Approach. Hoffman, Moore & Schatz, SEPG 2003.
Schedule / cycle time
Improvements in:
© 2003 by Carnegie Mellon University CMMI Impact Interim Report - Page 27
CMMI ®
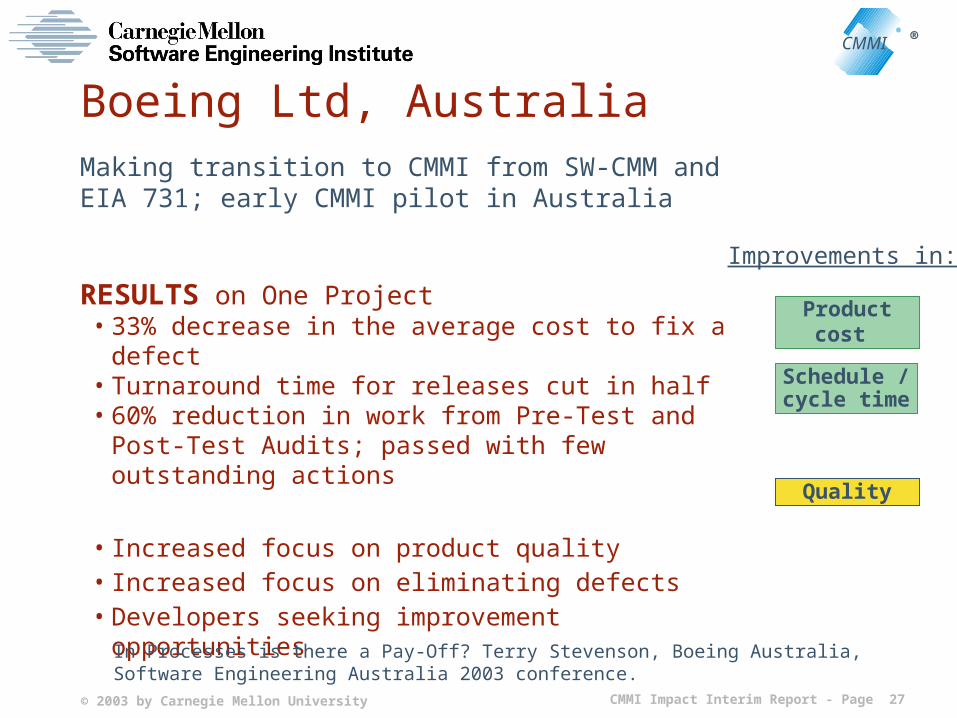
Boeing Ltd, Australia Making transition to CMMI from SW-CMM and EIA 731; early CMMI pilot in Australia
RESULTS on One Project• 33% decrease in the average cost to fix a defect• Turnaround time for releases cut in half• 60% reduction in work from Pre-Test and Post-
Test Audits; passed with few outstanding actions
• Increased focus on product quality• Increased focus on eliminating defects• Developers seeking improvement opportunities
Quality
Schedule / cycle time
Product cost
In Processes is there a Pay-Off? Terry Stevenson, Boeing Australia, Software Engineering Australia 2003 conference.
Improvements in:

© 2003 by Carnegie Mellon University CMMI Impact Interim Report - Page 28
CMMI ®
Thales ATMCMMI Level 4 helps THALES meet their business objectives.• Ability to see into the future with a known level of
confidence• Increasing number of processes under statistical
control• Measurement based process improvement
• Return on investment due to- earlier defect detection- improved risk management- better control of projects
CMMI® Level 4 Preparation: The Story of the Chicken and the Egg. Anne De Goeyse and Anne Sophie Luce, Thales ATM; and Annie Kuntzmann-Combelles, Q-Labs France, ESEPG 2003.
Predictability
Quality
Improvements in:

© 2003 by Carnegie Mellon University CMMI Impact Interim Report - Page 29
CMMI ®
Thales Training & Simulation• Began process improvement with SW-CMM in
1992; Level 3 achieved in 1996• Refocused on CMMI to broaden effort to systems
engineering
• Lessons Learned:- quarterly internal “CBA IPI like” assessments
measure progress and help avoid regression- experience gained during implementation of
SW-CMM was a key factor in CMMI success- data collected on software has shown
decreases in project cost and schedule variances as maturity increased Schedule /
cycle time
Product cost
Achieving CMMI level 2: Keys to success. Robert Richard. ESEPG 2003.
Improvements in:

© 2003 by Carnegie Mellon University CMMI Impact Interim Report - Page 30
CMMI ®
Thales Research & Technology
Getting Started with Process Improvement Using the CMMI®. Carol Marsh, Patrick Vigier. ESEPG 2003.
CMM data from another Thales Unit used by Thales Research & Technology as part of rationale to begin PI with CMMI.
Customer satisfaction
Product cost
Schedule / cycle time
Quality
Improvements in:

© 2003 by Carnegie Mellon University CMMI Impact Interim Report - Page 31
CMMI ®
Bosch Gasoline SystemsCMM based improvements• Predictability -- Internal On-Time Delivery
improved by 15%
• Less Rework – first pass yield improved by 10%• Product Quality – reduction in error cases in the
factory by one order of magnitude
Next Steps include • Move to CMMI and applying it to software, system
and hardware• Expand process improvement program to include
sales, hardware and component development
Critical success factors for improvement in a large embedded systems organisation. Wolfgang Stolz, Robert Bosch GmbH Gasoline Systems GS-EC/ESP and Hans-Jürgen Kugler, Q-Labs Software Engineering, ESEPG 2003.
- Rework
Predictability
Quality
Schedule / cycle time
Improvements in:
© 2003 by Carnegie Mellon University CMMI Impact Interim Report - Page 32
CMMI ®
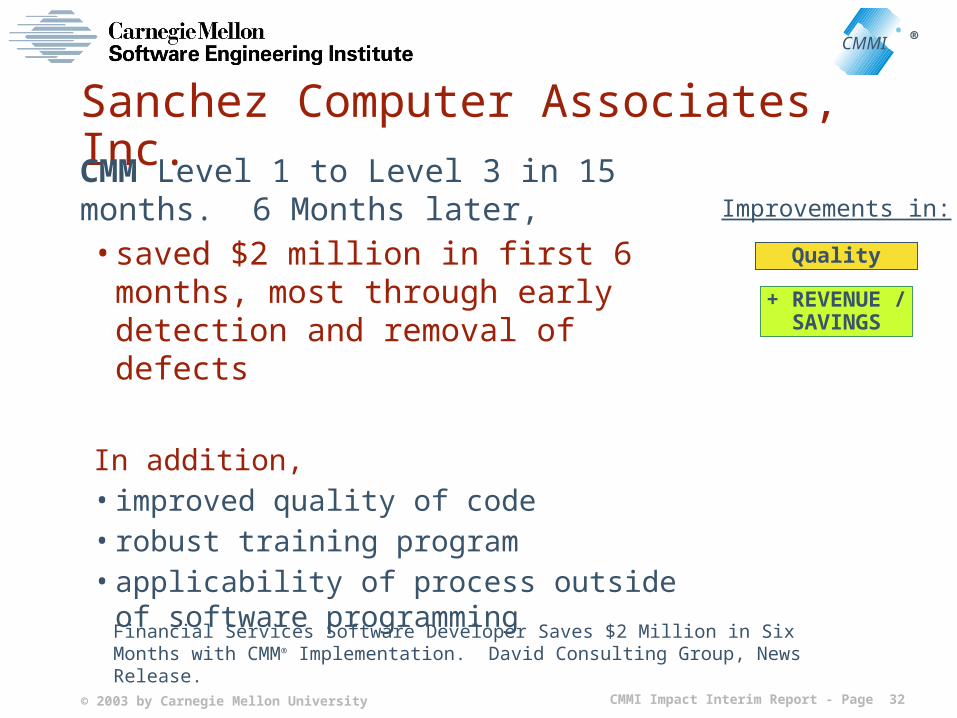
Sanchez Computer Associates, Inc.
CMM Level 1 to Level 3 in 15 months. 6 Months later,• saved $2 million in first 6 months, most
through early detection and removal of defects
In addition,• improved quality of code• robust training program• applicability of process outside of software
programming
Financial Services Software Developer Saves $2 Million in Six Months with CMM® Implementation. David Consulting Group, News Release.
Quality
+ REVENUE / SAVINGS
Improvements in:

© 2003 by Carnegie Mellon University CMMI Impact Interim Report - Page 33
CMMI ®
J.P. Morgan Chase & Co1st CMM success 2001
today, 28 teams at CMM Level 2
CMMI success – 1st team ML3 in 2003
Investment in PI = $4 million
Results:• Improved predictability of delivery schedule• Reduction of post-release defects• Reduced severity of post-release defects
And, from CMMI specifically• Increased through-put = more releases per year
Goal to achieve CMMI throughout organization
Predictability
Quality
Schedule / cycle time
With permission from presentation to the SEI, September 2003.
Improvements in:

© 2003 by Carnegie Mellon University CMMI Impact Interim Report - Page 34
CMMI ®
ContentsObjectives and review current work
Research on CMMI® Impact
Characterizing Impacts
Benefits of CMMI-based Process Improvement
Recently reported CMMI and CMM® results
Proposed future directions

© 2003 by Carnegie Mellon University CMMI Impact Interim Report - Page 35
CMMI ®
Proposed for FY2004 and Beyond1
Impact and benefits of systems engineering
• Processes with heritage in EIA 731 and precursors
• Organizational integration
Additional case studies
• In-depth collaboration with the SEI
• Self reported via the SEIR
Broadly based studies
• State-of-the-practice surveys of CMMI impact and transition
• Analyses using existing commercial databases
• Community benchmarking of process and performance

© 2003 by Carnegie Mellon University CMMI Impact Interim Report - Page 36
CMMI ®
Proposed for FY2004 and Beyond2
Related studies
• Research and development on costs and benefits of CMMI appraisal methods
• Guidance on calculating cost-benefit, cost effectiveness, ROI, and cost of quality
• CMMI adoption and impact in small and medium enterprises
Decision support
• Proactive guidance for Decision Analysis and Resolution• Combining computer modeling and simulation with
empirical results• Validating predictions empirically
Guidance on using measurement effectively
Technical Report, conference presentations and journal articles

© 2003 by Carnegie Mellon University CMMI Impact Interim Report - Page 37
CMMI ®
For more information or to discuss participation, contact:
Dennis R. Goldenson
Diane L. Gibson
Robert W. Ferguson
Software Engineering Institute
Pittsburgh, PA 15213

© 2003 by Carnegie Mellon University CMMI Impact Interim Report - Page 38
CMMI ®
Performance Measures Summary1
Of 20 organizations/cases:
Process Adherence: Five cases show improvements in process adherence and cost of quality
Cost: Five cases provide eight examples of cost-related benefits, including reductions in the cost to find and fix a defect, and overall cost savings
Schedule: Six cases (ten examples) show evidence of schedule-related benefits, including decreased time needed to complete tasks and increased predictability in meeting schedules
Productivity: Four cases provide evidence of increased productivity
Diane Gibson
If cases = organizations included in this series, then the number of examples should refer to the organization who provided an example, regardless of the # of examples an or has....ALTERNATIVEUse word Examples..... see next set, which includes my edits as well as the examples, including several from the same organization/case

© 2003 by Carnegie Mellon University CMMI Impact Interim Report - Page 39
CMMI ®
Performance Measures Summary2
Of 20 organizations/cases:
Quality: Six cases provide nine examples of measured improvements in quality, mostly related to reducing defects over time or by product life cycle
Customer Satisfaction: Three cases show four examples of improvements in customer satisfaction, including demonstration of customer satisfaction through award fees
Return on Investment: Five cases report positive returns on investment from their CMMI-based process improvement

© 2003 by Carnegie Mellon University CMMI Impact Interim Report - Page 40
CMMI ®
Cost of quality & ROI
Benefits / Savings / ImprovementsCosts
Process Capability or Maturity
Process Capability or Maturity
Investmentin
Improvement
OperationalCosts
Costs ofImprovement
Rework Effort
PredictabilityProductivity
Employee morale
Enhancedfunctionality
“ilities”
Processcompliance
Quality
Schedule / cycle time
Customer satisfaction
Product cost
+ REVENUE & SAVINGS
- COSTS &
EXPENSES