Piglet mortality in commercial piglet production herds · Piglet mortality in commercial piglet...
35
Swedish University of Agricultural Sciences Faculty of Veterinary Medicine and Animal Science Piglet mortality in commercial piglet production herds Lisa Persdotter Department of Animal Breeding and Genetics Examensarbete 328 Uppsala 2010 Master’s Thesis, 30 HEC Agriculture programme – Animal Science
Transcript of Piglet mortality in commercial piglet production herds · Piglet mortality in commercial piglet...
Swedish University of Agricultural Sciences
Faculty of Veterinary Medicine and Animal Science
Piglet mortality in commercial piglet production herds Lisa Persdotter
Department of Animal Breeding and Genetics
Examensarbete 328
Uppsala 2010
Master’s Thesis, 30 HEC
Agriculture programme – Animal Science

Swedish University of Agricultural Sciences
Faculty of Veterinary Medicine and Animal Science
Department of Animal Breeding and Genetics
Piglet mortality in commercial piglet production herds Smågrisdödlighet; förekomsten av dödfödda grisar samt smågrisdödlighet under diperioden
Lisa Persdotter
Supervisors:
Nils Lundeheim, SLU, Department of Animal Breeding and Genetics
Examiner:
Anna Wallenbeck, SLU, Department of Animal Breeding and Genetics
Credits: 30 HEC
Course title: Degree project in Animal Science
Course code: EX0578
Programme: Agriculture Programme - Animal Science
Level: Advanced, A2E
Place of publication: Uppsala
Year of publication: 2010
Name of series: Examensarbete 328 Department of Animal Breeding and Genetics, SLU
On-line publication: http://epsilon.slu.se
Key words: Swine, Sow, Stillbirth, Piglet mortality


5
Sammanfattning Dödfödda grisar och smågrisdödlighet under diperioden leder till både produktionsförlust och innebär dessutom försämrad djurvälfärd. Förluster orsakade av dödfödslar, smågrisar som kläms ihjäl av suggan och som svälter ihjäl kan förebyggas genom god skötsel, bra djurstallar och avelsurval. För att lyckas med detta krävs att riskfaktorer för smågrisdödlighet kan identifieras. Syftet med den här studien är att undersöka variationen i förekomsten av dödfödda smågrisar och dödligheten under digivningsperioden beroende på kullnummer, kullstorlek, säsong och besättning. Ett andra syfte är att fastställa om det finns någon upprepbarhet för suggor vad gäller förekomst av dödfödda smågrisar. Data erhölls från fyra kommersiella grisbesättningar, belägna i centrala Sverige, som använder sig av besättningsövervakningsprogrammet ‘PigWin Sugg’. Data analyserades med hjälp av programvaran SAS (2010). Analysen begränsades till information om grisningar under perioden juli 2006 och juni 2009, vilket gav ett underlag på 24289 grisningar. Antalet dödfödda smågrisar i en kull ökade med kullstorleken och med högre kullnummer men var oberoende av årstid. Ökningen av dödfödda smågrisar i högre kullnummer kan bero på ökad kullstorlek hos äldre suggor. Dödligheten under digivningsperioden visade inget signifikant samband till antalet dödfödda smågrisar men till antalet levandefödda smågrisar i kullen. Detta tyder på att kullar med många dödfödda kultingar inte per automatik medför hög dödlighet under digivningsperioden på grund av lägre kvalitet på de smågrisar som föds levande. Smågrisdödligheten under diperioden påvisade även en negativ korrelation mellan totala antalet födda smågrisar i en kull. Detta kan förklaras av att den individuella vikten vid födseln är lägre i större kullar och att smågrisarna på grund av det är känsligare än smågrisar med högre vikt vid födseln. Upprepbarheten för att en sugga får dödfödda smågrisar var låg och den påvisade upprepbarheten i studien beror sannolikt på miljöfaktorer.

6
7
Table of Contents 1. Introduction ...................................................................................................................................... 9 2. Literature review .......................................................................................................................... 10
2.1 Stillborn piglets ..................................................................................................................... 11 2.1.1 Classification of stillborn piglets ...................................................................................... 12 2.1.2 Litter size ................................................................................................................................ 12 2.1.3 Piglet weight ........................................................................................................................... 12 2.1.4 Parity number ........................................................................................................................ 13 2.1.5 Farrowing ................................................................................................................................ 13 2.1.6 Management ........................................................................................................................... 13 2.1.7 Genetic aspects ..................................................................................................................... 13
2.2 Piglet mortality of live born during the nursing period ................................................. 14 2.2.1 Litter size ................................................................................................................................ 15 2.2.2 Piglet weight ........................................................................................................................... 15 2.2.3 Body reservoirs ..................................................................................................................... 15 2.2.4 Temperature tolerance ........................................................................................................ 15 2.2.5 Starvation ................................................................................................................................ 15 2.2.6 Crushing .................................................................................................................................. 16 2.2.7 Management ........................................................................................................................... 16 2.2.8 Genetic aspects ..................................................................................................................... 17
3. Materials and methods .............................................................................................................. 18 3.1 Animals and data records ................................................................................................... 18 3.2 Calculations and statistical analyses .................................................................................. 20
3.2.1 Calculations and statistical analyses of stillborn piglets on litter level ............................. 21 3.2.2 Calculations and statistical analyses on batch level ............................................................. 22
4. Results ........................................................................................................................................ 22 4.1 Results, litter level ................................................................................................................ 22
4.1.1 Descriptive statistics ............................................................................................................ 22 4.1.2 Factors influencing litter size and piglet mortality ...................................................... 24 4.1.3 Correlations ............................................................................................................................ 27 4.1.4 Repeatability ........................................................................................................................... 28
4.2 Results, batch level ............................................................................................................... 29 4.2.1 Factors influencing piglet mortality during the nursing period ............................... 29 4.2.2 Correlations ............................................................................................................................ 29
5. Discussion ......................................................................................................................................... 30 5.1 Herd averages ....................................................................................................................... 30 5.2 The influence of litter size and parity number on the presence of stillborn piglets . 30 5.3 Influence of gestation length on the occurrence of stillborn piglets .......................... 31 5.4 The effect of season on stillborn piglets .......................................................................... 31 5.5 The influence of season, litter size, number of live-born and stillborn piglets on the
mortality during nursing period ....................................................................................... 32 5.6 Repeatability .......................................................................................................................... 32
6. Conclusion ....................................................................................................................................... 33 References .............................................................................................................................................. 34

8
9
1. Introduction Piglet mortality, i.e. stillborn piglets and piglet mortality among live born piglets during the nursing period leads to production loss, at the same time as it is an animal welfare concern. These losses, due to stillborn piglets, crushing and starvation, could be reduced by good management, facilities and genetic selection. To successfully decrease piglet mortality it’s necessary to identify associated risk factors (Correa et al., 2007). Several factors have been associated with piglet mortality, for example infectious diseases, gestation length, parity number, litter size, farrowing length, birth weight, dystocia, stress due to high environmental temperatures, human interference on the assistance of parturition, sow body condition and nutritional deficiencies (Borges et al., 2005). Selection in today’s breeding programmes in Sweden is focused on the improvement in the total number of live born piglets which leads to larger litters at birth. With larger litters comes an increased demand on the mothering ability of the sow to keep the piglets alive until weaning. Many farmers use cross-fostering to even out the size of the litters among the sows and to spread the burden of large litters(Lund et al., 2002). Since the heritability estimates for mortality traits are relatively low the potential for progress by selection is limited (Grandinson et al., 2002). The aim of this study was to investigate the effect of gestation length, parity number, litter size, season and herd on the frequency of stillborn piglets and piglet mortality among live born piglets during the nursing period. A second aim was to investigate if there was some repeatability for the occurrence of stillborn piglets within sow.
10
2. Literature review In some piglet producing herds the total piglet mortality is often as high as 20% (PigWin, 2008). This total piglet mortality is composed of two parts, stillborn piglets and mortality among live born piglets during the nursing period. Piglet mortality causes a major source of economic loss, but is also an ethical animal welfare problem. Pig breeding programs today often focus on selection for increased total number of born piglets with the intentions to improve litter size at weaning. However, large litters are often associated with high mortality rates; consequently a large litter of total born piglets at birth does not guarantee a large litter at weaning (Andersen et al., 2007; Canario et al., 2006; Grandinson et al., 2002; Lay et al., 2002). To be able to benefit from the selection for increased litter size at birth the breeders need to ensure that the sows are capable of raising such large litters successfully (Grandinson et al., 2002). The recording of piglet survival should be simple because the principle is simple, the piglet being either dead or alive, but since cross-fostering is used, individual records for each piglet’s survival linked to the birth mother and this makes the recording more complicated (Rydhmer et al., 2008). Foetal mortality and mortality of live born piglets during the nursing period are the most important causes of economical losses in a commercial piglet producing heard (Borges et al., 2005; Grandinson et al., 2002; Lay et al., 2002). Annual sow productivity is often measured as piglets weaned per sow per year. This trait is a combination of several fertility and lactation traits, such as ovulation rate, early embryonic survival, foetal survival until farrowing and during farrowing and piglet survival until weaning (Lund et al., 2002; Grandinson et al., 2002). Piglet mortality is also associated to indirect economic losses due to under utilization of equipment and infrastructure, such as half full farrowing pens (Correa et al., 2007). The selection for piglets that grow fast has given larger piglets and also larger sows but the sizes of the farrowing crates or farrowing pens are the same and this is an important concern for both well being and the productivity of the sow (Lay et al., 2002). Among all fully formed piglets at the end of gestation, piglet survival until weaning is on average 80% in Sweden. The average number of stillborn piglets and piglet mortality during the nursing period in Sweden is 7% and 15% respectively (PigWin, 2008). Selection for fast lean growth and increased litter size tend to decrease piglet survival (Knol et al., 2002; Canario et al., 2006). Approximately 30% of the stillborn piglets die due to pathogenic agents while the remaining 70% is because of factors such as pathologies in the uterus, the nutritional status of the sow, surrounding environment, management and genetic factors (Correa et al., 2007). The best way to examine the underlying biological mechanisms of stillborn piglets is post mortem examination of the stillborn piglets. This allows a categorization according to the estimated time of death relative to the moment of farrowing (Leenhouwers et al., 2003). Piglet producing farmers in Sweden, along with Norway and Switzerland, are no longer allowed to confine the sows at any stage of the production, including farrowing in contrast to most other European countries. Because of this piglet mortality is more dependent on the maternal abilities of the sow but also on the effort made by the farmer at the time of farrowing (Andersen et al., 2007). Farrowing is a critical period in most mammalian species with more than one offspring per litter (Correa et al., 2007). An understanding of the interactions between the environmental stressors and the biology of the piglet may lead to information to improve the survival during the nursing period (Lay et al., 2002).

11
2.1 Stillborn piglets Limiting or reducing the number of stillborn piglets requires knowledge about the major factors involved in the risk for a piglet to be stillborn (table 1). Table 1. Factors increasing the risk of stillborn piglets in a litter Factors References
Increasing parity number Borges et al., 2005
Canario et al., 2006
Correa et al., 2007
Cozler et al., 2002
Weber et al., 2009
Prolonged duration of partuition Borges et al., 2005
Canario et al., 2006
Rydhmer et al., 2008
Lack of birth assistance Cozler et al., 2002
Lucia Jr. et al., 2002
Premature rupturing of the umbilical cord Leenhouwers et al., 1999
Zalenski and Hacker, 1993
Increased litter size Borges et al., 2005
Weber et al., 2009
Birth in the last third of the birth order Leenhouwers et al., 1999
Zalenski and Hacker, 1993
Difference between piglet birth Canario et al., 2006
weight and litter average Cozler et al., 2002
Rydhmer et al., 2008
Individual birth weight of the piglet Canario et al., 2006
Lower body weight of the sow at farrowing Cozler et al., 2002
Male gender of the piglet Canario et al., 2006
Asphyxiation Knol et al., 2002
Leenhouwers et al., 1999
Zalenski and Hacker, 1993
Presence of a mummified foetus Correa et al., 2007
Sow genetic type Canario et al., 2006
Sow heamoglobin concentration Zalenski and Hacker, 1993
Farrowing season Correa et al., 2007
Disturbances from stockpersons Lay et al., 2002
Leenhouwers et al., 1999
12
2.1.1 Classification of stillborn piglets Various studies have different views on the classification of stillborn piglets. Most common is that stillborn piglets are those that are apparently normal but die shortly before or during the parturition (Lucia Jr. et al., 2002). To be absolutely sure and to validate if the piglet was dead or alive at birth an autopsy needs to be done. This is done by extracting the lungs and submerges them into a receptacle with water. If the lungs do not float in the water the piglets are classified as stillborn because this indicates that the piglets had not breathed and therefore died before parturition. The reason for the interest in this is because for example, death prior to farrowing may be associated with infection during pregnancy or placental insufficiency, whereas death during and immediately after farrowing is often the result of asphyxia arise during delivery (Leenhouwers et al., 2003). The foetuses become mummified when the skeleton has developed and the foetus dries in, often due to virus, but if there is bacteria in the uterus the foetuses becomes malodorous vaginal discharge. Prior to bone formation the foetuses reabsorb in the uterus and leave no trace of its existence (Dalin, SLU, personal communication). 2.1.2 Litter size Litter size has been shown to play a significant role on the probability both of stillborn piglets and mummifications. The difference in optimal litter size between different studies may be due to differences in management. Piglets from small (less than 6 piglets) or large (more than 12 piglets) litters have a higher risk of mortality than piglets from litters of 6 to 12 piglets (Borges et al., 2005; Canario et al., 2006; Correa et al., 2007; Lucia Jr. et al., 2002; Weber et al., 2009; Zaleski and Hacker, 1993). The risk of development of mummified foetus increases in a litter with more than 12 piglets (Borges et al., 2005) and the risk of stillborn piglets is higher in litters with at least one mummified foetus compared with litters with no mummified foetuses (Correa et al., 2007). The cause of stillborn piglets may be associated with different causes depending on if it appears in small or large litters. Stillborn piglets in small litters can be associated with foetus reabsorbing due to diseases such as parvovirus or other pathogenic agents. The increase in stillborn piglets with increasing litter size can be explained by the prolonged duration of parturition and sow uterine capacity (Correa et al., 2007; Leenhouwers et al., 1999; Weber et al., 2009). 2.1.3 Piglet weight Leenhouwers et al. (1999) found that litters with low weight variation among the piglets had a somewhat lower incidence of stillborn piglets than other litters. In a study made by Canario et al. (2006) it was found that light piglets had lower haemoglobin levels, greater plasma cortisol concentrations and larger adrenal weight in proportion to their body weight than heavy piglets. They also found signs of an altered adrenal function which is responsible for subnormal tissue differentiation and growth. Due to this there is an increased risk for death during the birth process. Litter size is often unknown before farrowing but to reduce the risk of having stillborn piglets assistance at farrowing in sows expected to give birth to large litters can help reducing losses from asphyxia.
13
2.1.4 Parity number The risk of stillborn piglets is higher in first parity sows and in sows with five or more parities (Borges et al., 2005; Canario et al., 2006; Correa et al., 2007). The association between parity number and the risk of stillborn piglets is commonly attributed to prolonged parturition and higher weight variation within the litter. This higher risk can be due to that sows with a parity greater than five may have a reduction in sow muscle tone after repeated farrowing and given this it is expected that older sows take longer to deliver the piglets, thus increasing the probability of dystocia and piglet mortality at birth (Canario et al., 2006; Correa et al., 2007; Lay et al., 2002; Lucia Jr. et al., 2002). The increased risks of stillborn piglets can according to Canario et al. (2006) also result from excessive fatness of old sows which makes the farrowing process slower. It has also been proven that sows in parity one and parity number five or higher have a higher risk of mummification in comparison to sows of parity 2-5 (Borges et al., 2005). The increased likelihood of stillborn piglets in the first parity sows might be due to insufficient size of the birth canal in the young gilts (Canario et al., 2006) and the generally higher risk of stillborn piglets in high parity sows may depend on the fact that they usually farrowing larger litters (Lucia Jr. et al., 2002). 2.1.5 Farrowing Prolonged farrowing duration lead to a higher risk of stillborn piglets compared with shorter farrowing duration. The unfavourable positive relationship between farrowing duration and probability of stillborn piglets are most certain associated with large litters. The probability of stillborn piglets are particularly increased in piglets born late in the farrowing due to this a greater risk of hypoxia, detachment of the placenta, occlusion or rupture of the umbilical cord (Borges et al., 2005; Canario et al., 2006; Cozler et al., 2002; Lay et al., 2002; Zaleski and Hacker, 1993). A numerically positive association could be expected in these cases between birth assistance and probability of stillborn piglets since assistance is given only in occasion of farrowing problems. Both oxytocin treatment and vaginal palpation are recommended to minimize the occurrence of stillborn piglets. In some studies it has been suggested that oxytocin treatment might be associated with a higher probability of stillborn piglets but it is most likely that the increased risk is due to that the treatment is used only in extreme situations when there is no possibility of success or that they may be conducted in the wrong way at the farms (Canario et al., 2006; Cozler et al., 2002; Lucia Jr. et al., 2002). 2.1.6 Management Cozler et al. (2002) showed that the proportion of litters with stillborn piglets decreased in cases of partial supervision which indicates that good supervision decreases the risk of stillborn piglets. To increase the replacement rate and restrict the number of piglet to no more than seven or eight piglets per litter could also lead to a decreased loss by stillborn piglets due to the fact that a smaller and there for relatively more efficient placenta seems to be of importance to reduce occurrence of mummified foetuses in a litter (Borges et al., 2005; Correa et al., 2007). 2.1.7 Genetic aspects In most studies where genetic aspects of piglet mortality have been studied, mortality has been analysed as the influence by the genes of the sow and the direct effect of the piglets genes has been assumed to be negligible. Thus the effect of the piglets genes has therefore only recently
14
been investigated (Canario et al., 2006; Grandinson et al., 2002; Knol et al., 2002; Leenhouwers et al., 2003; Lund et al., 2002; Rydhmer et al., 2008). Genetic effects on piglet survival can be expected from the biological mother through uterine effects, the viability of the piglets and an influence during the expulsion phase of the birth process. Genetic effect can also be due to the piglet itself through e.g. the length on the umbilical cord and its strength and the piglet’s resistance to asphyxiation (Knol et al., 2002; Roehe et al., 2009). Because the estimated heritability for mortality traits generally are relatively low (0.01-0.15) the progress trough genetic selection is limited. 2.2 Piglet mortality of live born during the nursing period In Sweden the mortality during the nursing period is approximately 17 %, but the average value may range from approximately 14 % among herds in the best quarter to 20 % among herds in the worst quarter (PigWin, 2008). Most of the total mortality after farrowing to weaning occurs during the first two to four days after birth (Andersen et al., 2007; Lay et al., 2002) and are caused by different factors (table 2). Table 2. Factors increasing the risk of mortality during the nursing period
Factors: References:
Starvation Andersen et al., 2007
Lay et al., 2002
Roehe et al., 2009
Crushing Andersen et al., 2007
Lay et al., 2002
Roehe et al., 2009
Weber et al., 2009
Environmental stressors, e.g. cold and diseases Roehe et al., 2009
Lay et al., 2002
Low birth weight Lay et al., 2002
Large litter size Lay et al., 2002
Prolonged duration of partuition Lay et al., 2002
Birth in the last part of the birth order Lay et al., 2002
Male gender of the piglet Lay et al., 2002
Sow behaviour Lay et al., 2002
Piglet behaviour Lay et al., 2002 An increased survival rate could be reached by an increased effort to protect the piglets within this period and therefore give the farmer more in return in terms of a higher quantity of piglets weaned (Andersen et al., 2007). Female piglets have been shown to have a low mortality frequency between birth and weaning and one explanation to this fact is that males suffer a greater susceptibility to farrowing stress due to a greater basal cortisol level (Canario et al., 2006; Lay et al., 2002). Litters with stillborn piglets will also have a higher mortality after farrowing, which indicates an overall lower viability of those litters in which stillborn piglets occur (Leenhouwers et al., 1999).
15
2.2.1 Litter size Large litters are often associated with large within-litter variation in piglet birth weight and small piglets, which are often associated with higher mortality during the nursing period due to crushing and starvation (Andersen et al., 2007; Lay et al., 2002; Quiniou et al., 2002; Weber et al., 2009). Piglets that are born late in the birth order have an increased risk of experience hypoxia and this increases the time spent between births and suckling which in turn is associated with hypothermia and reduced growth (Lay et al., 2002). 2.2.2 Piglet weight Litters with low average piglet birth weights generally suffer a higher mortality rate during the nursing period and it has been shown that the piglet’s individual birth weight is the most important factor affecting this mortality (Canario et al., 2006; Grandinson et al., 2002; Lay et al., 2002). This may be due to the fact that light piglets are in possession of less energy stores and are therefore more susceptible to cold which is a disadvantage when it comes to competing for a teat with the larger piglets in the litter (Lay et al., 2002). Quiniou et al. (2002) found that piglets weighing less than 1 kg at birth have a decreased chance of surviving to weaning and the piglets that do survive have a lower performance during the nursing period than the heavier piglets and the growth performance after weaning are also affected. 2.2.3 Body reservoirs Unlike other newborns, a piglet lack brown fat and relies on other thermoregulatory responses such as reduced blood flow to the periphery, shivering and increased metabolic rate. Due to the increased metabolic rate the importance of colostrum intake becomes critical because the newborn piglet utilizes its energy stores in 11 to 12 hours without colostrum intake. An additional problem is that the colostrum intake decreases with lower body weight (Lay et al., 2002). 2.2.4 Temperature tolerance Newborn piglets have a relatively high thermo-neutral zone due to a high upper critical temperature. Therefore heat stress is a rare problem but due to a high lower critical temperature cooler temperatures may cause problems. Since the piglets ability to tolerate cooler temperatures increases rapidly after birth this critical period is fairly short (Lay et al., 2002). The large heat loss the newborn piglets are subjected to during the transport to a teat or the creep area may be fatal for the piglets that are born weak, and small piglets often suffer a higher heat loss than the larger and more viable piglets (Andersen et al., 2007). 2.2.5 Starvation The risk for starvation is higher in larger litters. This increased risk can be related to the higher competition for teats. It is not uncommon that the numbers of functional teats are less than the number of piglets in the litter and to prevent starvation in large litters the farmers often use cross-fostering (Andersen et al., 2007; Lay et al., 2002; Quiniou et al., 2002; Weber et al., 2009).
16
Since piglets body reservoir is utilized in 11 to 12 hours it is very important that the piglets are fed colostrum. An additional problem is that the colostrum intake decreases with lower temperatures at the same time as the body reservoir decreases more rapidly with lower temperatures. The risk of starvation increases markedly when the body temperature of the piglet decreases, at the same time as the risk for crushing increases with lower body temperatures because the piglets stay close to the sow (Lay et al., 2002). 2.2.6 Crushing One important factor when it comes to piglet crushing may be the physical attributes of the sow. For example, a larger sow may have less control over her body in the given space (Lay et al., 2002) and sows in higher parity number sometimes has problems, compared with sows in lower parity numbers, with their legs which increase the risk of piglets being crushed (Lensink et al., 2009). It has also been shown that the risk of crushing at least one piglet increases with increasing litter size (Lensink et al., 2002). Outdoor housing has shown a higher proportion of piglets being crushed than indoor housing with farrowing crates (Roehe et al., 2009). Piglets that are weak because of low body temperature or low body weigh possess a higher risk of crushing by the sow, because of problems with orientation and locomotion caused by the lack of feed (Andersen et al., 2007; Lay et al., 2002). Andersen et al. (2007) demonstrated that piglets from sows in farrowing crates spend more time in the creep area compared with piglets from sows kept loose. The sows kept loose are often more active then the sows that are confined and the risk of the piglets being crushed will therefore be larger in loose housed environments. However, the incidence of crushing piglets in loose housed environments is to a large extent due to the level of maternal responsiveness and protectiveness of the sow (Andersen et al., 2007, Weber et al., 2009). In indoor housing the risk of crushing increases during the cold season compared with the warmer seasons. The increased risk of crushing during the cold season may depend on the fact that the piglets during their first day are weakened by the cool temperature in the pen and since the piglet spend almost all time at the sows teat they are more likely to be crushed (Lay et al., 2002; Weber et al., 2009). 2.2.7 Management The use of farrowing rails along all sides of the pen is a preventive measure to reduce the number of losses during the nursing period. The farrowing rails may prevent the sow from leaning towards the pen wall before lying down and thus avoid the crushing of the piglets (Andersen et al., 2007). Through helping the piglets and ensure that they obtained colostrums immediately after birth the risk of piglet mortality decreases in the litter. Cross-fostering is a common way for the farmers to help piglets in large litters get colostrum in time. Cross-fostering gives the best result if it is utilized early during the nursing period since cross-fostering later on can decrease the overall growth of the piglets (Lay et al., 2002). Other management factors such as vaccination procedures, hygiene and microclimate in the nest area of the piglets are known to affect the mortality during the nursing period (Andersen et al., 2007; Weber et al., 2009). The effects of roughage during the gestation have also been explored and it showed that piglet mortality is lower in herds providing moderate straw amounts. Moderate use of roughage also tended to reduce the number of stillborn piglets and these results may indicate some kind of positive digestive effects of the roughage. Also the roughage gives several positive effects on sow welfare, for example dry sow are reported to have a lower repeat breeding rate (Andersen et al., 2007).

17
2.2.8 Genetic aspects Genetic effects on piglet mortality during the nursing period can be expected from the biological mother, but there may also be an effect by the nurse sow in cases of cross-fostering. These effects are through differences in mothering ability e.g. milk quality and quantity, number of teats, aggressiveness and carefulness in lying down. Genetic effect can also be due to the piglet itself through e.g. differences in adaptive behaviour and body reserves (Knol et al., 2002; Roehe et al., 2009). Roehe et al. (2009) found that the direct genetic effects of the survival traits were higher under outdoor conditions than the literature based on indoor production, which may indicate that the survival traits have a higher influence under these conditions. The result can also be due to that the piglets are more protected by the use of farrowing crates at indoor housing. The occurrence of both maternal and direct genetic effects on piglet mortality indicates that both genes of the sow and the piglets are involved in the survival of the piglets (Leenhouwers et al., 2003; Roehe et al., 2009; Rydhmer et al., 2008). Rydhmer et al. (2008) reported a positive genetic correlation between gestation length and average birth weight and also between gestation length and growth rate. This indicates that piglets from late born litters with more time to develop in the uterus have the ability to grow more rapidly during the nursing period. At the same time is was showed that large litters are born earlier than small litters (Rydhmer et al., 2008).
18
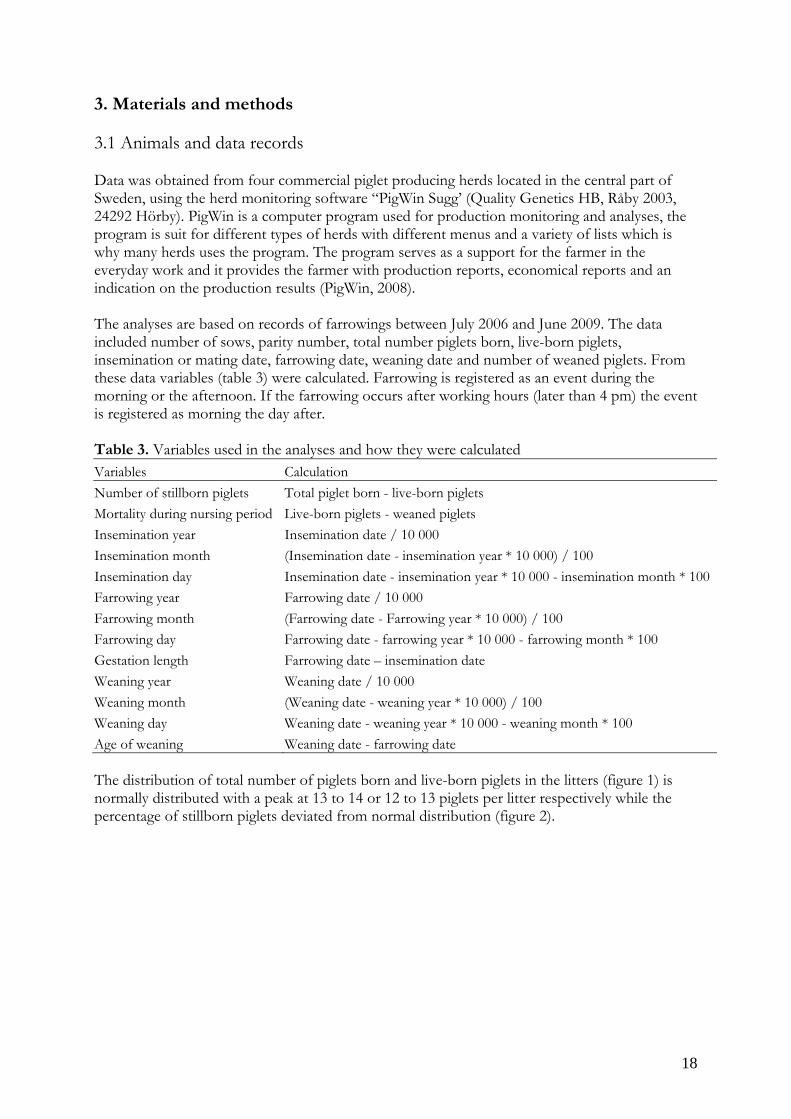
3. Materials and methods 3.1 Animals and data records Data was obtained from four commercial piglet producing herds located in the central part of Sweden, using the herd monitoring software “PigWin Sugg’ (Quality Genetics HB, Råby 2003, 24292 Hörby). PigWin is a computer program used for production monitoring and analyses, the program is suit for different types of herds with different menus and a variety of lists which is why many herds uses the program. The program serves as a support for the farmer in the everyday work and it provides the farmer with production reports, economical reports and an indication on the production results (PigWin, 2008). The analyses are based on records of farrowings between July 2006 and June 2009. The data included number of sows, parity number, total number piglets born, live-born piglets, insemination or mating date, farrowing date, weaning date and number of weaned piglets. From these data variables (table 3) were calculated. Farrowing is registered as an event during the morning or the afternoon. If the farrowing occurs after working hours (later than 4 pm) the event is registered as morning the day after. Table 3. Variables used in the analyses and how they were calculated Variables Calculation
Number of stillborn piglets Total piglet born - live-born piglets
Mortality during nursing period Live-born piglets - weaned piglets
Insemination year Insemination date / 10 000
Insemination month (Insemination date - insemination year * 10 000) / 100
Insemination day Insemination date - insemination year * 10 000 - insemination month * 100
Farrowing year Farrowing date / 10 000
Farrowing month (Farrowing date - Farrowing year * 10 000) / 100
Farrowing day Farrowing date - farrowing year * 10 000 - farrowing month * 100
Gestation length Farrowing date – insemination date
Weaning year Weaning date / 10 000
Weaning month (Weaning date - weaning year * 10 000) / 100
Weaning day Weaning date - weaning year * 10 000 - weaning month * 100
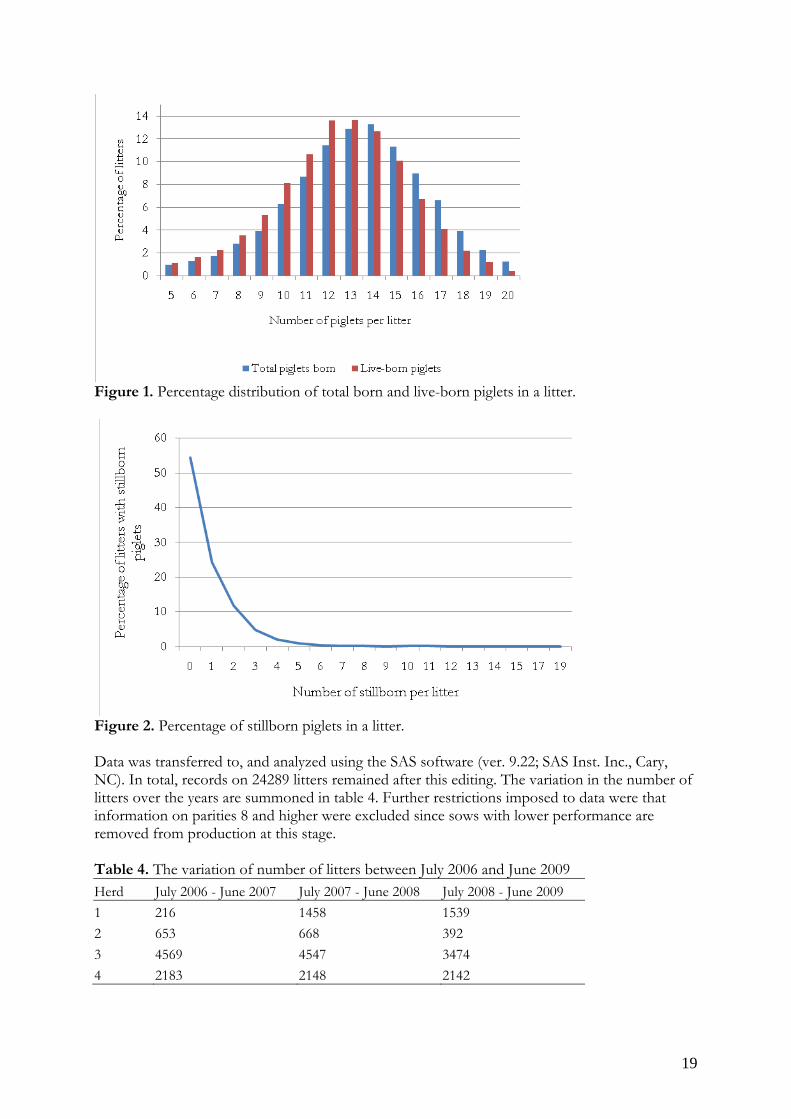
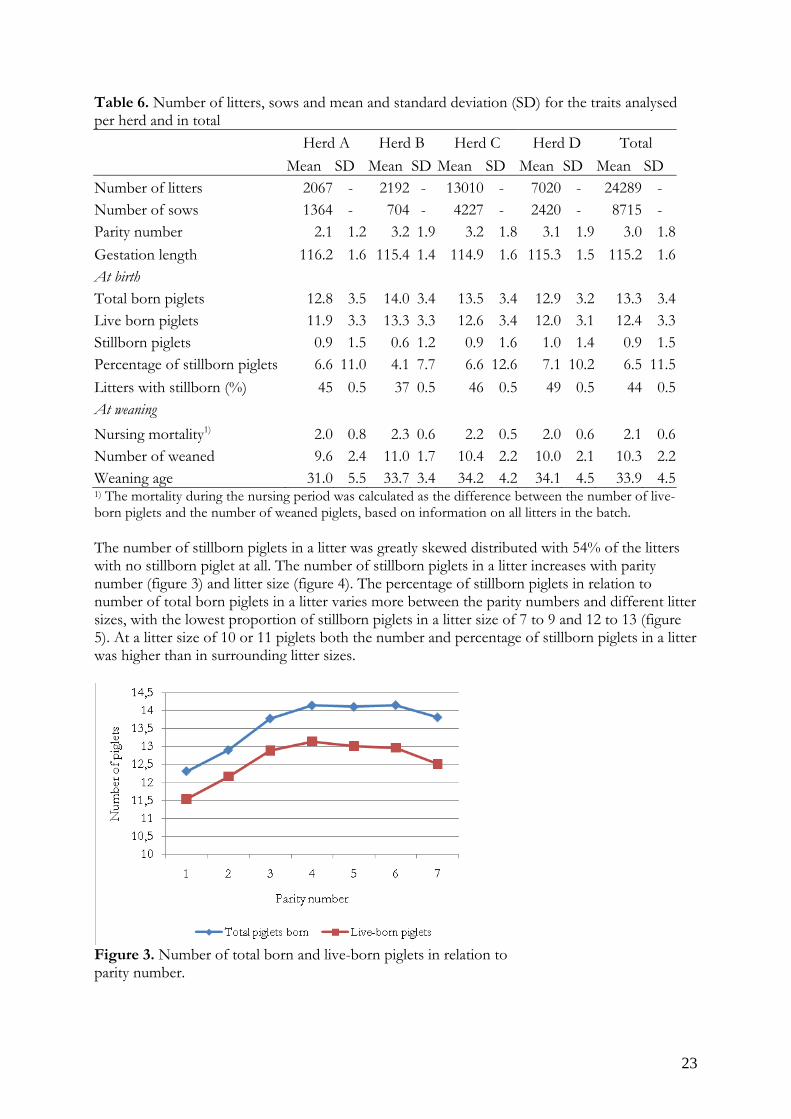
Age of weaning Weaning date - farrowing date The distribution of total number of piglets born and live-born piglets in the litters (figure 1) is normally distributed with a peak at 13 to 14 or 12 to 13 piglets per litter respectively while the percentage of stillborn piglets deviated from normal distribution (figure 2).
19
Figure 1. Percentage distribution of total born and live-born piglets in a litter.
Figure 2. Percentage of stillborn piglets in a litter. Data was transferred to, and analyzed using the SAS software (ver. 9.22; SAS Inst. Inc., Cary, NC). In total, records on 24289 litters remained after this editing. The variation in the number of litters over the years are summoned in table 4. Further restrictions imposed to data were that information on parities 8 and higher were excluded since sows with lower performance are removed from production at this stage. Table 4. The variation of number of litters between July 2006 and June 2009 Herd July 2006 - June 2007 July 2007 - June 2008 July 2008 - June 2009
1 216 1458 1539
2 653 668 392
3 4569 4547 3474
4 2183 2148 2142

20
Three out of four herds used sows of Landrace/Yorkshire crossbreed and boars of Hampshire, while one herd used sows of Yorkshire and boars of Landrace. One of the herds was a ‘sow pool’ and another herd started the production in 2007. Piglet production in a sow pool means that the sows are living in the pool’s central unit during most of the dry period (14 weeks per reproduction cycle), while the farrowing and piglet rearing takes place in the satellite units associated with the sow pool. In the individual satellite unit the houses are rebuilt to suit the farrowing and the sows are leased from the pool's central unit. The first sow pool in Sweden was started 1988 and one motive behind the creation of the sow pools has been a desire to keep small and medium-sized piglet producing herds and at the same time make the production more effective and in that way enhance their competitiveness (Olsson and Svendsen, 1993). The herds were all partly farrow-to-finnish herds, with one exception of the ‘sow pool’, with one, three, six or six and a half employees. Two of the herds had registered outbreaks of PMWS (Postweaning Multisystemic Wasting Syndrome) during the years 2006 to 2009 and one have had suspected PMWS piglets but no outbreak. The herd suspecting PMWS piglets started vaccinate sows. The recruitment percentage ranged from 27 to 47 (27, 40, 45, 47) between the herds. All herds fed the sows according to Swedish norms based on weight and litter size (Simonssons, 1995). They all used wet feed with the exception of one of the satellite units of the sow pool that used dry feed. One herd used feed for dry sows for dry sows and pregnant sows while feed for lactating sows were used during insemination and for lactating sows. Another herd used feed for lactating sows for the sows all the time. Piglet mortality during nursing period was, since cross-fostering of piglets were widely practiced, analyzed on batch level. Average values were calculated for each weaning date, within herd. Litters with recorded weaning age less than 28 days, or higher than 42 days, were excluded from these calculation, since 28 days is the shortest time according to Swedish legislation and if a period over 42 days are necessary something extraordinary has happened . This restriction resulted in that 907 litters were excluded from the analyses from the 32508 litters in the beginning. These constructed ‘batch-averages’ with 20 or more litters, were subjected to statistical analyses. In total, data on 461 batches were included in the analyses. 3.2 Calculations and statistical analyses
The total number of born piglets, live-born piglets and stillborn piglets were analyzed with a linear model even though stillborn piglets clearly are not normally distributed. The reason behind this decision is that the statistical analyzes of the stillborn piglets should have been too complicated for this level of degree project. The down side of using a linear model on a variable that are not normally distributed is that the standard deviation becomes large which makes it hard to detect significant results. The risk is that the statistic material is underestimated. Besides descriptive frequency and mean analyses, the statistical analyses were carried out using analysis of variance (PROC GLM; PROC MIXED), and calculation of residual correlations.

21
3.2.1 Calculations and statistical analyses of stillborn piglets on litter level Estimation of residual correlations between litter traits, associated with farrowing (total number piglets born, live-born piglets and stillborn piglets), the statistical model (PROC GLM) included the fixed effects of parity number and the effect herd-farrowing year-farrowing month combination. The litter traits, associated with farrowing (total number piglets born, live-born piglets and stillborn piglets), were analyzed with a statistical model (PROC MIXED) including the fixed effects of herd, parity, farrowing month, and the random effects of sow within herd, and herd-year-farrowing month combination within herd. To analyze the quantitative association (regression) between total number of piglets born in the litter and percentage of stillborn piglets, a statistical model (PROC MIXED) including the fixed effects of herd, parity, farrowing month, and regression on total piglets born, nested within parity number was applied. Also, the random effects of sow within herd, and herd-year-month combination within herd were included in the statistical model. The repeatability (Falconer and Mackay, 1996) gives information of the proportion of the variance of single measurements that is due to permanent or non-localized differences between individuals, both genetic and environmental. The repeatability of stillborn piglets of a sow were calculated, the question in mind were if a sow ‘always’ had few or many stillborn piglets and that the amount of stillborn piglets of a sow is repeated over parities. Repeatability for stillborn piglets was also calculated per herd where the sows were divided in to groups, due to parity number. Table 5 is an example from one of the herds original tables in SAS (2010), where the encircled figures were used in the analyses of repeatability. The groups of sows with stillborn piglets in parity two but no stillborn in parity one and sows with stillborn piglets in both parity one and two were summoned in one table. The same is valid for the sows with stillborn piglets in parity three but no stillborn piglets in parity two and sows with stillborn piglets in both parity two and three. In addition, the t-value for the repeatability of the sow when it comes to stillborn piglets in a litter were calculated out of the covariance parameter estimates of the sow divided with the covariance parameter estimates of the herd, sow and residual.

22
Table 5. Table of stillborn piglets in parity two and three for herd two Frequency
Percent
Row percent
Colum percent 0 1 Total
0 580 245 825
49..91 21.08 71.00
70.30 29.70
75.32 62.50
1 190 147 337
16.35 12.65 29.00
56.38 43.62
24.68 37.50
Total 770 392 1162
66.27 33.73 100.00 3.2.2 Calculations and statistical analyses on batch level The batch averages (mortality during the nursing period and number of weaned piglets) were analyzed according to a statistical model (PROC GLM) including the fixed effects of herd, weaning year within herd, weaning month, and the regression on average parity number in the batch. For calculation of residual correlations between the batch variables, associated with farrowing, the statistical model (PROC GLM) included the fixed effects of parity number and herd-farrowing year-farrowing month combination. 4. Results Levels of significance are presented conventionally where p > 0.05 are not significant (n.s), p ≤ 0.05 are presented with *, p ≤ 0.01 are presented with ** and p ≤ 0.001 are presented with ***. 4.1 Results, litter level 4.1.1 Descriptive statistics In total an average of total number piglets born was 13.3±3.4 (Mean ±standard deviation) with a (table 6). The corresponding average of live-born piglets and stillborn piglets were 12.4±3.3 and 0.9±1.5, respectively. The average mortality during the nursing period was 2.1± 0.6, with 10.3±2.2 piglets weaned at an average weaning age of 33.9±4.5 days. The average parity number was 3±1.8 and ranged between 2.1 to 3.2.
23
Table 6. Number of litters, sows and mean and standard deviation (SD) for the traits analysed per herd and in total
Herd A Herd B Herd C Herd D Total
Mean SD Mean SD Mean SD Mean SD Mean SD Number of litters 2067 - 2192 - 13010 - 7020 - 24289 - Number of sows 1364 - 704 - 4227 - 2420 - 8715 - Parity number 2.1 1.2 3.2 1.9 3.2 1.8 3.1 1.9 3.0 1.8
Gestation length 116.2 1.6 115.4 1.4 114.9 1.6 115.3 1.5 115.2 1.6At birth Total born piglets 12.8 3.5 14.0 3.4 13.5 3.4 12.9 3.2 13.3 3.4Live born piglets 11.9 3.3 13.3 3.3 12.6 3.4 12.0 3.1 12.4 3.3Stillborn piglets 0.9 1.5 0.6 1.2 0.9 1.6 1.0 1.4 0.9 1.5Percentage of stillborn piglets 6.6 11.0 4.1 7.7 6.6 12.6 7.1 10.2 6.5 11.5
Litters with stillborn (%) 45 0.5 37 0.5 46 0.5 49 0.5 44 0.5At weaning
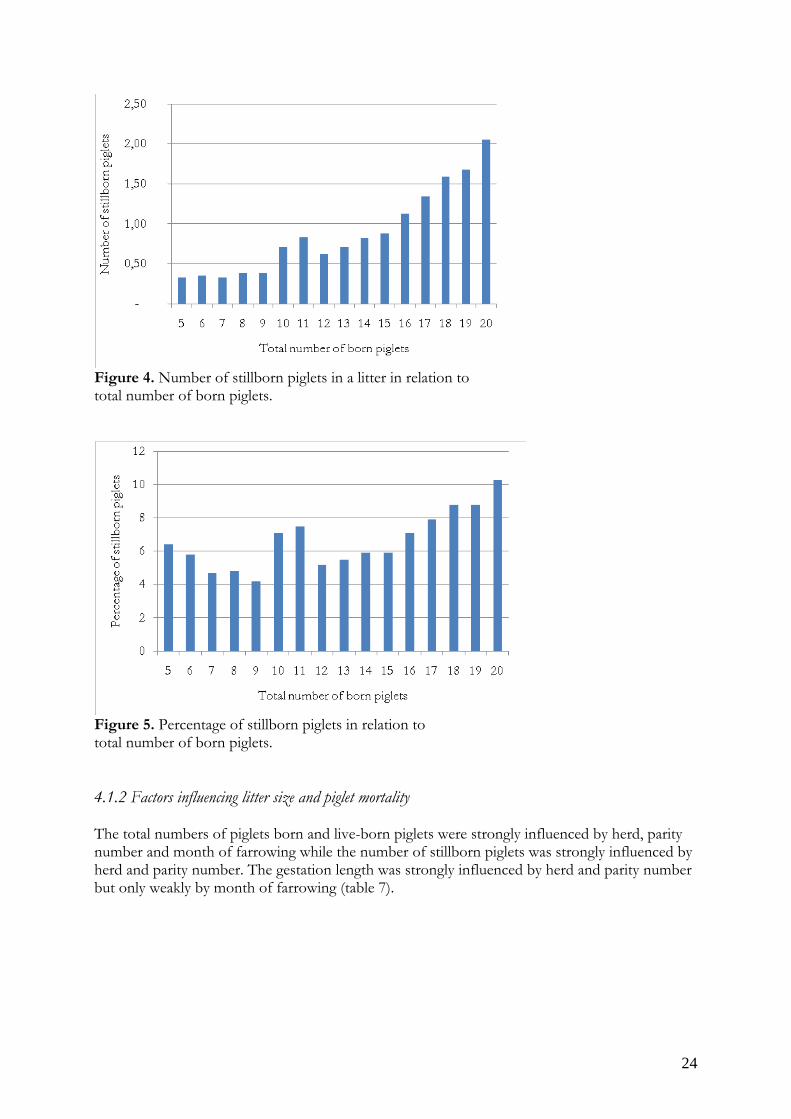
Nursing mortality1) 2.0 0.8 2.3 0.6 2.2 0.5 2.0 0.6 2.1 0.6Number of weaned 9.6 2.4 11.0 1.7 10.4 2.2 10.0 2.1 10.3 2.2Weaning age 31.0 5.5 33.7 3.4 34.2 4.2 34.1 4.5 33.9 4.51) The mortality during the nursing period was calculated as the difference between the number of live-born piglets and the number of weaned piglets, based on information on all litters in the batch. The number of stillborn piglets in a litter was greatly skewed distributed with 54% of the litters with no stillborn piglet at all. The number of stillborn piglets in a litter increases with parity number (figure 3) and litter size (figure 4). The percentage of stillborn piglets in relation to number of total born piglets in a litter varies more between the parity numbers and different litter sizes, with the lowest proportion of stillborn piglets in a litter size of 7 to 9 and 12 to 13 (figure 5). At a litter size of 10 or 11 piglets both the number and percentage of stillborn piglets in a litter was higher than in surrounding litter sizes.
Figure 3. Number of total born and live-born piglets in relation to parity number.
24
Figure 4. Number of stillborn piglets in a litter in relation to total number of born piglets.
Figure 5. Percentage of stillborn piglets in relation to total number of born piglets. 4.1.2 Factors influencing litter size and piglet mortality The total numbers of piglets born and live-born piglets were strongly influenced by herd, parity number and month of farrowing while the number of stillborn piglets was strongly influenced by herd and parity number. The gestation length was strongly influenced by herd and parity number but only weakly by month of farrowing (table 7).
25
Table 7. Level of significance of fixed effects
Herd Parity number Farrowing month
Gestation length *** *** *
Total born *** *** ***
Live-born *** *** ***
Number of stillborn *** *** n.s
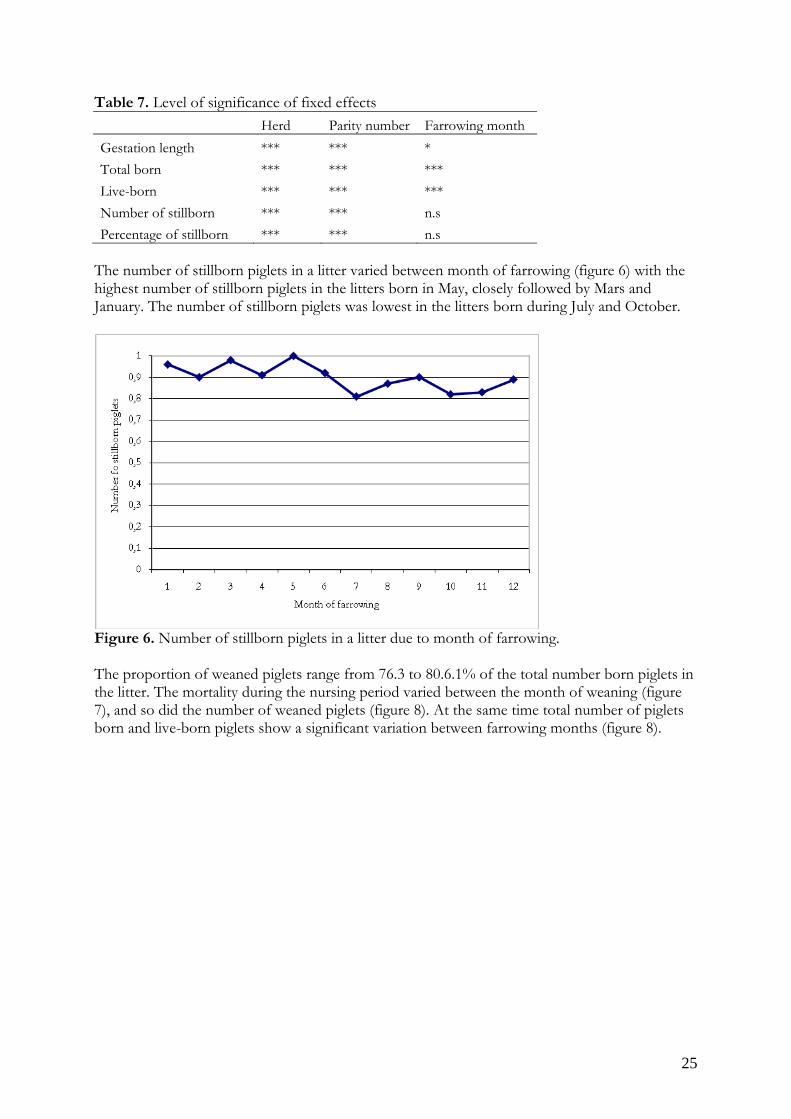
Percentage of stillborn *** *** n.s The number of stillborn piglets in a litter varied between month of farrowing (figure 6) with the highest number of stillborn piglets in the litters born in May, closely followed by Mars and January. The number of stillborn piglets was lowest in the litters born during July and October.
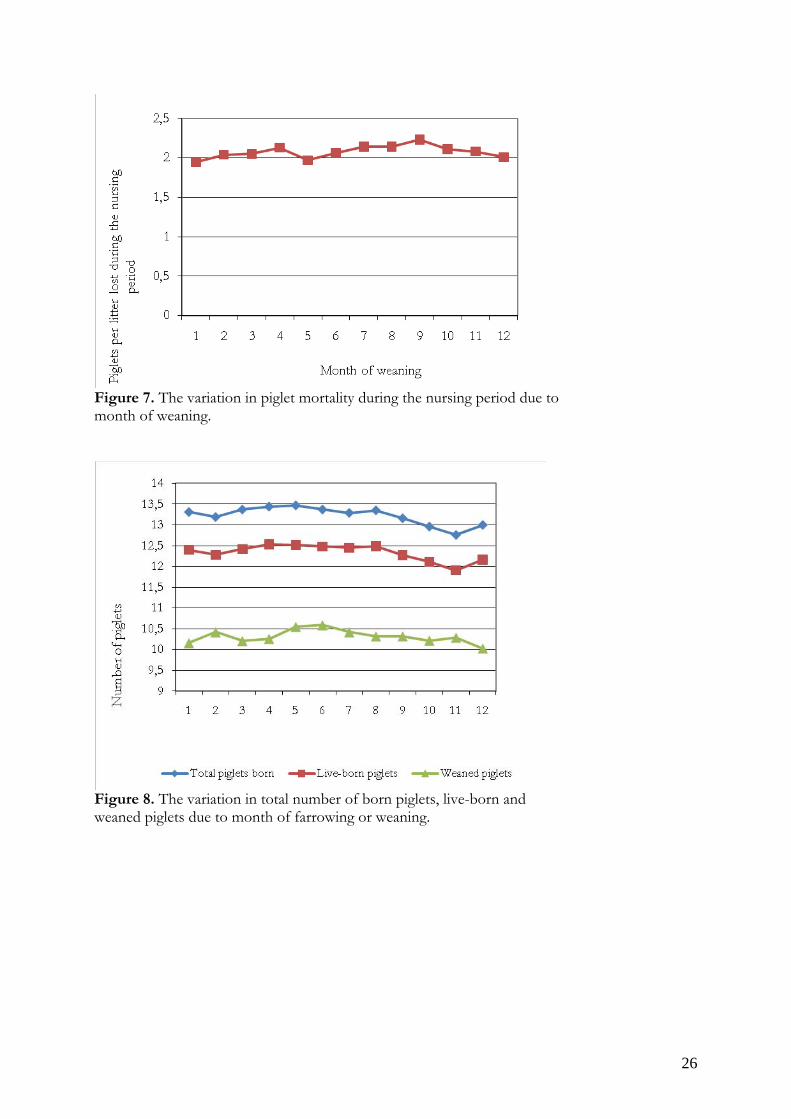
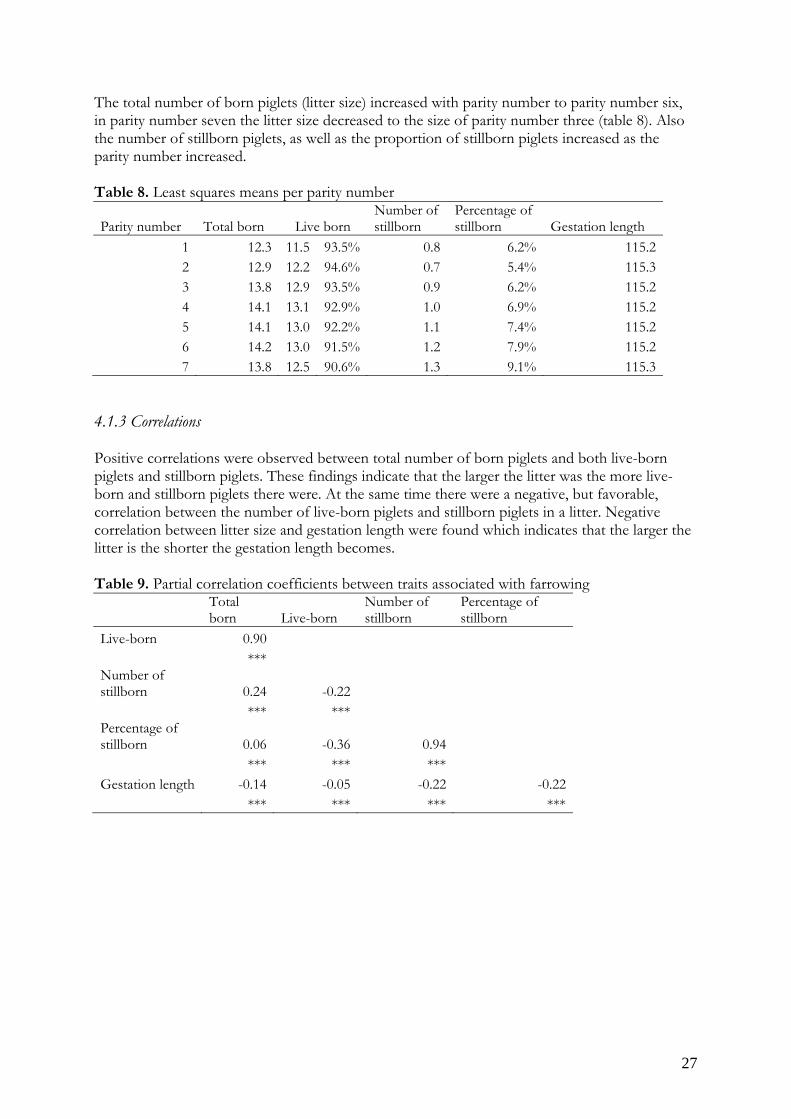
Figure 6. Number of stillborn piglets in a litter due to month of farrowing. The proportion of weaned piglets range from 76.3 to 80.6.1% of the total number born piglets in the litter. The mortality during the nursing period varied between the month of weaning (figure 7), and so did the number of weaned piglets (figure 8). At the same time total number of piglets born and live-born piglets show a significant variation between farrowing months (figure 8).
26
Figure 7. The variation in piglet mortality during the nursing period due to month of weaning.
Figure 8. The variation in total number of born piglets, live-born and weaned piglets due to month of farrowing or weaning.
27
The total number of born piglets (litter size) increased with parity number to parity number six, in parity number seven the litter size decreased to the size of parity number three (table 8). Also the number of stillborn piglets, as well as the proportion of stillborn piglets increased as the parity number increased. Table 8. Least squares means per parity number
4.1.3 Correlations Positive correlations were observed between total number of born piglets and both live-born piglets and stillborn piglets. These findings indicate that the larger the litter was the more live-born and stillborn piglets there were. At the same time there were a negative, but favorable, correlation between the number of live-born piglets and stillborn piglets in a litter. Negative correlation between litter size and gestation length were found which indicates that the larger the litter is the shorter the gestation length becomes. Table 9. Partial correlation coefficients between traits associated with farrowing
Total born Live-born
Number of stillborn
Percentage of stillborn
Live-born 0.90 *** Number of stillborn 0.24 -0.22 *** ***Percentage of stillborn 0.06 -0.36 0.94 *** *** ***Gestation length -0.14 -0.05 -0.22 -0.22
*** *** *** ***
Parity number Total born Live born Number of stillborn
Percentage of stillborn Gestation length
1 12.3 11.5 93.5% 0.8 6.2% 115.22 12.9 12.2 94.6% 0.7 5.4% 115.33 13.8 12.9 93.5% 0.9 6.2% 115.24 14.1 13.1 92.9% 1.0 6.9% 115.25 14.1 13.0 92.2% 1.1 7.4% 115.26 14.2 13.0 91.5% 1.2 7.9% 115.27 13.8 12.5 90.6% 1.3 9.1% 115.3

28
4.1.4 Repeatability There are a higher share of sows with stillborn piglets in parity two with stillborn piglets in parity one than sow with no stillborn piglets in parity one (table 10). The same is valid for sows with stillborn piglets in parity three where the probability of stillborn piglets in parity three is higher for sows that had stillborn piglets in parity two (table 11). Table 10. Associations for number of stillborn piglets between parity one and two within sow Stillborn in parity one Stillborn in parity two
No 34.0%
Yes 40.4% Table 11. Associations for number of stillborn piglets between parity two and three Stillborn in parity two Stillborn in parity three
No 39.3%
Yes 48.0% The estimated repeatability for the number of stillborn piglets from the covariance parameter estimates were low, t = 0.07.
29
4.2 Results, batch level 4.2.1 Factors influencing piglet mortality during the nursing period The numbers of weaned piglets was highly affected by the herd and year of weaning while the effect of weaning month was slightly weaker and parity number had no significant effect on the number of weaned piglets (table 12). Mortality during the nursing period was highly affected by the herd and parity number while the year of weaning only had a weak effect and the month of weaning had no significant effect. Table 12. Significance of effects influencing numbers weaned piglets and mortality during the nursing period
Weaned Mortality during nursing period
Herd *** ***
Weaning year *** * Weaning month ** n.s
Parity number n.s *** 4.2.2 Correlations The average number of weaned piglets per litter in the batch showed a strong positive correlation to the total number of piglets born and live-born piglets while there was a negative correlation to the number of stillborn piglets (table 13). The mortality during the nursing period showed a strong positive correlation to the number of live-born piglets, while the correlation to the total number of born piglets was slightly weaker and negative and there were no significant correlation to the number of stillborn piglets. Table 13: Partial correlation coefficient between numbers of weaned piglets, total number of born piglets, live-born piglets, stillborn piglets
Total born Live-bornNumber of stillborn
Weaned 0.45 0.54 -0.15 *** *** **
Nursing mortality -0.15 0.33 -0.07 ** *** n.s
30
5. Discussion In nature there are two strategies used by the animals to reproduce and spread their DNA. Ether the animals have few offspring and put a lot of effort and energy in their survival, or they have a large litter and the offspring is to a large extent left on its own. Sows give birth to large litter and therefore the sow put less energy in the survival of the piglet compared with females giving birth to fewer offspring which may leads to a higher mortality during the nursing period. 5.1 Herd averages The herds had an total average of 13.3 piglets born, 12.4 live-born piglets and 0.9 stillborn piglets per litter. In relation to the figures given by PigWin (2008) with 12.6 live-born piglets and 0.92 stillborn piglets per litter. The average mortality during the nursing period was 2.1 piglets per litter which is equivalent to 16.4 %. The four herds had 10.3 piglets weaned at an average weaning age of 33.9 days. The records in PigWin (2008) the mortality during the nursing period is 16.7 % in Sweden and the average age of weaning is 34 days. Altogether, when comparing the four herds included in this study with the figure given by PigWin (2008) the herds are representative of the herds in Sweden using PigWin to monitor the herd but since it is optional to use PigWin the figures cannot represent all Swedish herds. The average parity number for the four herds was 3 and ranged between 2.1 to 3.2. The cause of the low average parity number for one of the herds is that the production started in 2007, thus the herd was not in full production. In this study the total number of born piglets in a litter was lowest in the first parity. The total number of born piglets and live-born piglets increases from parity one to parity four. After parity four the increase in total number born piglets in a litter levels out but the number of live-born piglets decreases. The average litter size is normally distributed with a peak at 15 piglets per litter. As it was the farmers who registered the number of total born, live-born and weaned piglets in this study the number of stillborn piglets and piglet mortality during the nursing period may be overestimated or underestimated. The recording of piglet survival is in principle simple, but since there is no recording of cross fostering in ‘PigWin Sugg’ it is impossible to calculate the piglet mortality during nursing for each litter. Due to this mortality during nursing was calculated from the number of weaned piglets and the total number of born piglets, in the whole batch (all litters that were weaned the same day). 5.2 The influence of litter size and parity number on the presence of stillborn piglets The number of stillborn piglets in a litter was greatly skewed distributed with 54 % of the litters with no stillborn piglets and there was a variation in the occurrence of stillborn piglets between litters due to litter size and parity number. Significant positive correlations were observed between total number of born piglets and live-born and stillborn piglets and the number of stillborn piglets in a litter increased with litter size. The percentage of stillborn piglets in relation to number of total born piglets in a litter varied between the different litter sizes, with the lowest proportion of stillborn piglets in a litter size of 7 to 9. At a litter size of 10 or 11 piglets, the number and percentage of stillborn piglets in a litter was higher than in litters of other litter sizes. The increased number of stillborn piglets in larger

31
litters may depend on the fact that there are more piglets that can be stillborn since there are more piglets in the litter. The fact that the piglets are smaller in larger litters and may because of this not do as good during labour can be the reason for the increasing risk of stillborn piglets in larger litters (Canario et al., 2006). The peak of stillborn piglets at the litter size of 10 to 11 piglets is interesting but the underlying cause is unknown. In the present study the average number of stillborn piglets in a litter increases with parity, while the percentage of stillborn piglets in relation to total number of born piglets in a litter varies more between the parity numbers. The total number of born piglets increased with increasing parity to parity number six, in parity seven the litter size decreased to the size of parity three. Also the number of stillborn piglets, as well as the proportion of stillborn piglets increased as the parity number increased. The increased number of stillborn piglets in larger litters may depend on the fact that there are more piglets that can be stillborn since there are more piglets in the litter. This will however not explain the higher percentage of stillborn piglets in a litter. The higher percentage of stillborn piglets in a litter can be due to a reduction in sow muscle tone after repeated farrowing leading to an increasing probability of dystocia and piglet mortality at birth (Canario et al., 2006; Correa et al., 2007; Lay et al., 2002; Lucia Jr. et al., 2002).The increased risk of stillborn piglets in higher parity is conclusive with the results in pervious literature (Borges et al., 2005; Canario et al., 2006; Correa et al., 2007; Cozer et al., 2002; Weber et al., 2009). 5.3 Influence of gestation length on the occurrence of stillborn piglets A negative correlation was found between litter size and gestation length which indicates that the larger the litter is the shorter the gestation length becomes. The biological explanation behind the fact that larger litters leads to shorter gestation periods is that it is the piglets that induce the start of the farrowing. If there are a higher number of piglets in the litter the shorter the time is before the initiating threshold value of birth inducing hormones is reached (Sjaastad et al., 2003). The association with the gestation length was strongest for stillborn piglets and weakest for live-born piglets. The gestation length was strongly influenced by herd and parity number but only weakly by month of farrowing. The influence by herd may be due to differences in the registrations of the start of the farrowing process. Since the staff does not have the sows under supervision during the evening and night the sows farrowing during the night is registered the day after. The effect of parity number may depend on the experience of labour by the sow or the variation in litter size. In parity one the farrowing process is new for the sow and this may affect the piglets (Canario et al. 2006). During later parities the muscles in the sow uterus may not be as effective as before which may lead to longer farrowing periods (Lucia Jr. et al. 2002). The herd effect might be due to differences in registrations, management practices and routines before, during and after farrowing. 5.4 The effect of season on stillborn piglets The proportion of stillborn piglets (percentage of the total number of piglets born) was approximately the same during the whole year and the proportion of weaned piglets range from 76.4 to79.1 % over month of the total number born piglets in the litter. The number of stillborn piglets in a litter was highest during May, closely followed by Mars and January while the number of stillborn piglets was lowest in the litters born during July and October. According to Correa et al. (2007) the risk of having stillborn piglets in a litter increases if the sow is exposed to
32
temperatures over 30 °C in the final two weeks of gestation, this will however not explain the increased presence of stillborn piglets in the litters born during January, Mars and May. This increased risk may instead depend on other factors such as mycotoxins in the feed (Correa et al., 2007). 5.5 The influence of season, litter size, number of live-born and stillborn piglets on the mortality during nursing period The mortality during the nursing period varied between the month of weaning, and so did the number of weaned piglets. The variation due to month of weaning may be due to variations in feed quality over the year. The mortality during the nursing period showed a strong positive correlation to the number of live-born piglets, while the correlation to the total number of born piglets was slightly weaker and negative, and there were no significant correlation to the number of stillborn piglets. The correlations to the live-born piglets are as expected, the more live-born piglets there are the more piglets there are to be weaned. The negative correlation to the total number of born piglets in a litter may be explained by the decreased individual birth weight of the piglets in a large litter (Canario et al., 2006; Grandinson et al., 2002; Lay et al., 2002). Also the harder competition of the teats may play a role in the higher mortality during the nursing period. A piglet with nutritional deficiency is weaker and more disorientated than the other piglets and may therefore be crushed by the sow more easily. 5.6 Repeatability There were a higher share of sows with stillborn piglets in parity two with stillborn piglets in parity one than sow with no stillborn piglets in parity one. The same was valid for sows with stillborn piglets in parity three where the probability of stillborn piglets in parity three is higher for sows that had stillborn piglets in parity two. These results indicate that there is some repeatability of the occurrence of stillborn piglets of a sow. However the estimated repeatability for the number of stillborn piglets were low with a t-value of 0.07. This indicates that the repeatability of stillborn piglets within sow is low and that the repeatability above is more likely due to environmental factors than the genetics of the sow. The repeatability of the presence of stillborn piglets in a litter may according to Knol et al. (2002) also depend on the genetics of the piglet giving expression thought differences in piglet viability or the physical differences in i.e. body conditions of the piglet.

33
6. Conclusion
The number of stillborn piglets in a litter increased with larger litter size and higher parity number but was not affected of season. The mortality during the nursing period showed no significant correlations to the number of stillborn piglets, but to the number of live-born piglets in the litter. The mortality during the nursing period also varied between the months of weaning.
34
References
Andersen I. L., Tajet G. M., Haukvik I. A., Kongsrid S., Bøe K. E. (2007) Relationship between postnatal piglet mortality, environmental factors and management around farrowing in herds with loose-housed, lactating sows. Acta Agriculturae Scand, Section A 57, 38-45
Borges V. F., Bernardi M. L., Bortolozzo F. P., Wentz I. (2005) Risk factors for stillbirth and
foetal mummification in four Brazilian swine herds. Preventive Veterinary Medicine 70, 165-176 Canario L., Cantoni E., Le Bihan E., Caritez J. C., Billon Y., Bidanel J. P., Foulley J. L. (2006)
Between-breed variability of stillbirth and its relationship with sow and piglet characteristics. Journal of Animal Science 84, 3185-3196
Correa J. C. S., Alzina-López A., Rivera J. L. S. (2007) Evaluation of three models and risk factors
associated with stillborn piglets in Yucatan, Mexico. Téc Pecu Méx 45(2) 227-236 Dalin A-M. Swedish University of Agricultural Science, Faculty of Veterinary Medicine and
Animal Science, Department of Clinical Sciences. 2009-10-27. Falconer D. S., Mackay T. F. C. (1996) Introduction to Quantitative Genetics, Ed 4. Longmans
Green, Harlow, Essex, UK. Grandinson K., Lund M. S., Rydhmer L., Strandberg E. (2002) Genetic parameters for the piglet
mortality traits crushing, stillbirth and total mortality, and their relation to birth weight. Journal of Animal Science 52, 167-173
Knol E. F., Leenhouwers J. I., van der Lende T. (2002) Genetic aspects of piglet survival.
Livestock Production Sience 78, 47-55 Lay D. C., Matteri Jr. R. L., Carroll J. A., Fangman T. J., Safranski T. J. (2002) Preweaning
survival in swine. Journal of Animal Science 80, E74-E86 Le Cozler Y., Guyomarc’h C., Pichodo X., Quinio P-Y., Pellois H. (2002) Factors associated with
stillborn and mummifies piglets in high-prolific sows. Animal Research 51, 261-268 Leenhouwers J. I., van der Lende T., Knol E. F. (1999) Analysis of stillbirth in different lines of
pig. Livestock Production Science 57, 243-253 Leenhouwers J. I., Wissink P., van der Lende T., Paridaans H., Knol E. F. (2003) Stillbirth in the
pig in relation to genetic merit for farrowing survival. Journal of Animal Science 81, 2419-2424 Lensink B. J., Leruste H., De Bretagne T. (2009) Sow behaviour towards humans during standard
management procedures and their relationship to piglet survival. Applied Animal Behaviour Science 199, 151-157
Lucia Jr. T., Corrêa M. N., Deschamps J. C., Bianchi I., Donin M. A., Machado A. C., Meincke
W., Matheus J. E. M. (2002) Risk facorts for stillbirths in two swine farms in the south of Brazil. Preventive Veterinary Medicine 53, 285-292
Lund M. S., Puonti M., Rydhmer L., Jensen J. (2002) Relationship between litter size and
perinatal and pre-weaning survival in pigs. Animal Science 74, 217-222
35
Olsson A.C., Svendsen J. (1993) Erfarenheter av suggpooler. SLU Informationsrapporter, Allmänt
184. Alnarpskonferensen 1993. http://chaos.bibul.slu.se/sll/slu/slu_info_rapp_allm/IRA184/IRA184Z.HTM
Quiniou N., Dagorn J., Gaudré D. (2002) Variation of piglets’ birth weight and consequences on
subsequent performance. Livestock Production Science 78, 63-70 Roehe R., Shrestha N. P., Mekkawy W., Baxter E. M., Knap P. W., Smurthwaite K. M., Jarvis S.,
Lawrence A. B., Edwards S. A. (2009) Genetic analyses of piglet survival and individual birth weight on first generation data of a experiment for piglet survival under outdoor conditions. Livestock Science 121, 173-181
Rydhmer L., Lundeheim N., Canario L. (2008) Genetic correlations between gestation length,
piglet survival and early growth. Livestock Science 115, 287-293 SAS Institute Inc. 2010. SAS/STAT 9.22 User’s Guide. Cary, NC: SAS Institute Inc. Simonsson,A. 1995. Fodermedel till svin, 1995. SLU Info Rapporter Husdjur 77. SLU, Uppsala. Sjaastad Ø.V., Hove K., Sand O. (2003) Physiology of domestic animals. Scandinavian veterinary
press, Oslo. Weber R., Keil N. M., Fehr M., Horat R. (2009) Factors affecting piglet mortality in loose
farrowing systems on commercial farms. Livestock Science 124, 216-222 Zalenski H. M., Hacker R. R. (1993) Variables related to the progress of parturition and
probability of stillbirth in swine. Canodran Veterinary Journal 34, 109-113 PigWin
http://www.qgenetics.com/aciro/websidor/visasida.asp?idnr=gDUCYWACLfHKOYzTigH3UJvjGTJJ6lGGM04v11Pj8JYHGMi9SLpnTFFoV7G5
http://www.qgenetics.com/aciro/websidor/visasida.asp?idnr=Y3GdNrBaBveJH6z2CZKEOkXPTiEvQLJFETf0HcV1OY0ZBPInstjepFOr2IWn