PICO-PROFILE with PICO-T3PN Segments€¦ · TRIME PICO-PROFILE sensors can be easily connected to...
58
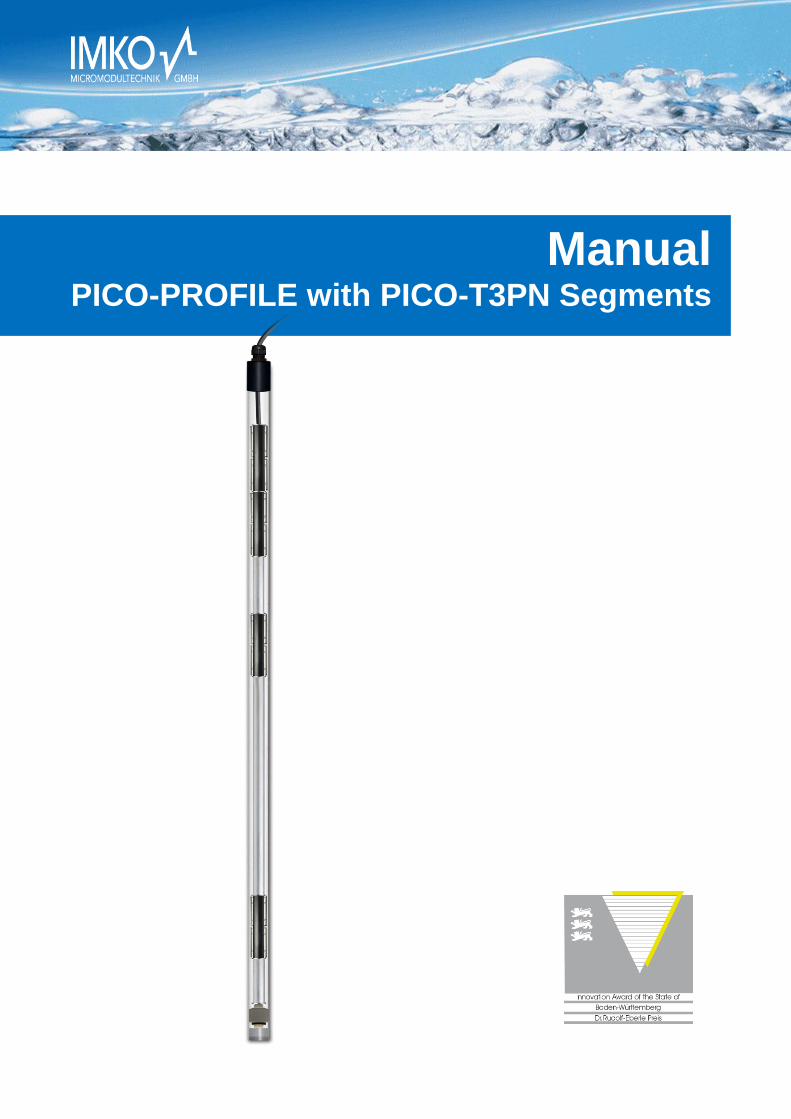
Manual PICO-PROFILE with PICO-T3PN Segments
Transcript of PICO-PROFILE with PICO-T3PN Segments€¦ · TRIME PICO-PROFILE sensors can be easily connected to...
Manual PICO-PROFILE with PICO-T3PN Segments

I:\publik\TECH_MAN\PICO-PROFILE\PICO-PROFILE-manual_eng+Pico-Conf+EC_Vers1_3.doc
2
Thank you for purchasing a IMKO instrument.
Should you have any queries please don’t hesitate to contact your local distributor or address directly to IMKO:
IMKO Micromodultechnik GmbH
Im Stoeck 2 D-76275 Ettlingen Germany Phone: +49-7243-5921-0 Fax: +49-7243-90856 E-mail: [email protected] Internet: http://www.imko.de
I:\publik\TECH_MAN\PICO-PROFILE\PICO-PROFILE-manual_eng+Pico-Conf+EC_Vers1_3.doc
3
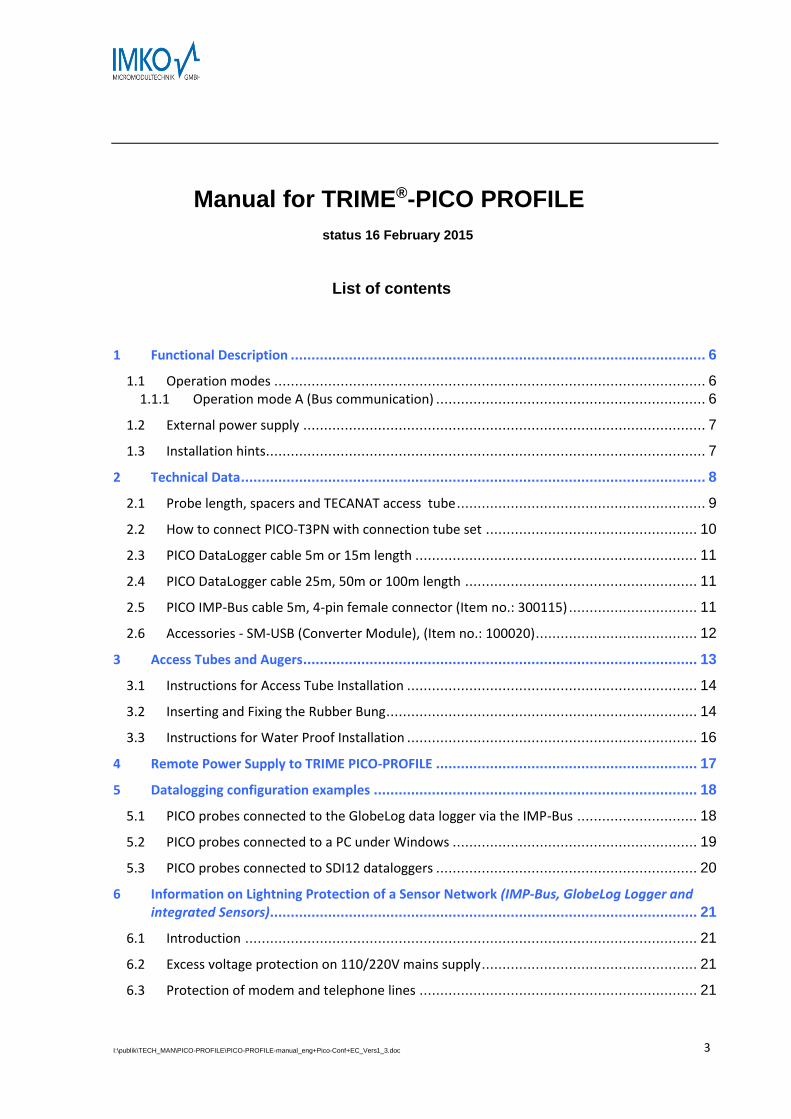
Manual for TRIME®-PICO PROFILE
status 16 February 2015
List of contents
1 Functional Description .................................................................................................... 6
1.1 Operation modes ........................................................................................................ 6 1.1.1 Operation mode A (Bus communication) ................................................................. 6
1.2 External power supply ................................................................................................. 7
1.3 Installation hints.......................................................................................................... 7
2 Technical Data ................................................................................................................ 8
2.1 Probe length, spacers and TECANAT access tube ............................................................ 9
2.2 How to connect PICO-T3PN with connection tube set ................................................... 10
2.3 PICO DataLogger cable 5m or 15m length .................................................................... 11
2.4 PICO DataLogger cable 25m, 50m or 100m length ........................................................ 11
2.5 PICO IMP-Bus cable 5m, 4-pin female connector (Item no.: 300115) ............................... 11
2.6 Accessories - SM-USB (Converter Module), (Item no.: 100020) ....................................... 12
3 Access Tubes and Augers ............................................................................................... 13
3.1 Instructions for Access Tube Installation ...................................................................... 14
3.2 Inserting and Fixing the Rubber Bung ........................................................................... 14
3.3 Instructions for Water Proof Installation ...................................................................... 16
4 Remote Power Supply to TRIME PICO-PROFILE ............................................................... 17
5 Datalogging configuration examples .............................................................................. 18
5.1 PICO probes connected to the GlobeLog data logger via the IMP-Bus ............................. 18
5.2 PICO probes connected to a PC under Windows ........................................................... 19
5.3 PICO probes connected to SDI12 dataloggers ............................................................... 20
6 Information on Lightning Protection of a Sensor Network (IMP-Bus, GlobeLog Logger and integrated Sensors)....................................................................................................... 21
6.1 Introduction ............................................................................................................. 21
6.2 Excess voltage protection on 110/220V mains supply .................................................... 21
6.3 Protection of modem and telephone lines ................................................................... 21
I:\publik\TECH_MAN\PICO-PROFILE\PICO-PROFILE-manual_eng+Pico-Conf+EC_Vers1_3.doc
4
6.4 Excess voltage protection for network modules by "SM-Blitz" ........................................ 21
6.5 Lightning protection on meteorological towers............................................................. 21
6.6 Installation instructions for SM BLITZ lightning protection modules ................................ 21
6.7 Conclusion ................................................................................................................ 22
7 TRIME PICO-T3PN theory .............................................................................................. 23
7.1 Introduction .............................................................................................................. 23
7.2 Measuring Field ......................................................................................................... 23
7.3 Measuring experiences .............................................................................................. 24
7.4 Summary .................................................................................................................. 24
8 Basic Calibration with the Calibration Set ....................................................................... 25
8.1 What is a basic calibration? ........................................................................................ 25
8.2 What are the benefits of the calibration set for the user? .............................................. 25 8.2.1 Calibration set for TRIME probes .......................................................................... 25
8.3 How to perform a basic calibration? ............................................................................ 26 8.3.1 Preparation of the glass beads .............................................................................. 26 8.3.2 Basic calibration procedure .............................................................................. 26 8.3.3 Material specific calibration ............................................................................... 27
9 TRIME WIN MONITOR ................................................................................................... 28
9.1 Installation ............................................................................................................... 28
9.2 Connect Trime-PICO to a PC ....................................................................................... 28
9.3 Operating the program .............................................................................................. 28
9.4 Explanation of measuring data .................................................................................... 34
9.5 File format ............................................................................................................... 35
10 Quick guide for the Software PICO-CONFIG ..................................................................... 36
10.1 Connection of the RS485 or the IMP-Bus to the SM-USB Module .................................... 36
10.2 Bus Configuration and Probe Scan ............................................................................... 38
10.3 Scan of connected PICO probes on the serial interface .................................................. 38
10.4 Configuration of Measure Mode ................................................................................. 39
10.5 Analogue outputs of the PICO probe ........................................................................... 39
10.6 Simulate Analog Output ............................................................................................. 40
10.7 Selection of the individual Calibration Curves ............................................................... 40
10.8 Test Run in Measurement Mode A .............................................................................. 41
10.9 Calibration Curves ..................................................................................................... 43
10.10 Creating a linear Calibration Curve for a specific Material .............................................. 47
10.11 Nonlinear calibration curves ....................................................................................... 47
11 Electrical Conductivity with TRIME Probes ...................................................................... 49

I:\publik\TECH_MAN\PICO-PROFILE\PICO-PROFILE-manual_eng+Pico-Conf+EC_Vers1_3.doc
5
11.1 The analysis of Soils for Electrical Conductivity ECTRIME ................................................... 50
11.2 ECTRIME Measurement Range for TRIME Probes ............................................................ 50
11.3 Measurement of Pore-Water-Conductivity or Salt-Content of Soils ................................. 51
11.4 Creation of a Moisture/ ECTRIME Diagram for a particular Soil ......................................... 54
12 Software Error codes .................................................................................................... 55
12.1 Software Errors which will be coded with 4 digits. ......................................................... 55
12.2 PICO Errors (Firmware errors) ..................................................................................... 57
I:\publik\TECH_MAN\PICO-PROFILE\PICO-PROFILE-manual_eng+Pico-Conf+EC_Vers1_3.doc
6
1 Functional Description The intelligent and compact TRIME PICO-PROFILE sensors are measurement devices for continuous and non-destructive determination of volumetric moisture. They are designed for stationary subterranean field use. A variety of installation options (greater depth, vertical or horizontal orientation) offer a wide range of applica-tions.
TRIME PICO-PROFILE systems require an external 7-24V/DC power supply. They are designed for connection to a data logger or a PC for monitoring and data logging purposes.
Your sensor is supplied ready for use and works in a wide range of standard soils. For further information please check the details under Section 6!
1.1 Operation modes
TRIME PICO-PROFILE systems are supplied with a RS485 or IMP-Bus interface and have no analogue outputs.
TRIME PICO-PROFILE sensors can be easily connected to an IMKO GlobeLogger (Operation mode A). A detailed description of how to select a specific operation mode for your application can be found below.
1.1.1 Operation mode A (Bus communication)
TRIME PICO-PROFILE systems can be connected directly to the RS485 bus or IMP-Bus (4-wire bus system), ei-ther via IMKO’s GlobeLog datalogger or via the SM-USB level converter module for use in conjunction with the TRIME WIN MONITOR data-logging software.
If multiple sensors are to be wired as a network, IMKO offers 3-port, 6-port and 12-port distribution modules. Please note that the IMP-Bus cable length and cable diameter must be properly matched as otherwise the en-ergy consumption of the TRIME sensors (100mA @ 12V/DC for 2..3s) may cause a drop in voltage. More infor-mation is available in Section 5.
Benefits:
Extremely low power consumption in field installations (with GlobeLogger)
Straightforward installation and simple wiring by virtue of pre-configured standard compo-nents (e.g. lightning protection, distribution modules…)
Systems are supplied ready for use
Cable length >1000m (with only 4 wires for all sensors)
For use with:
GlobeLogger
PC under Windows with the software TRIME WIN MONITOR, only with converter module SM-USB.
IMKO calibration and test software PICO-CONFIG (see page 27, Software download: www.imko.de) only with converter module SM-USB.

I:\publik\TECH_MAN\PICO-PROFILE\PICO-PROFILE-manual_eng+Pico-Conf+EC_Vers1_3.doc
7
1.2 External power supply
In the IMP-Bus the power to sensors can be supplied by battery, a complete solar system or mains power. For serial connection of a large number of sensors (up to 150 sensors) or very long IMP232-bus cables up to 1km it is advisable to use a power amplifier module (SM-23LV) or decentralised pow-er supply.
1.3 Installation hints
Please assure careful installation of the probes with close contact between rod and soil. It is important to avoid air pockets around the rods as the highest measuring sensitivity is directly around them.
Air pockets around the probe rods can reduce the measured moisture reading. Where saturated soils are involved, water-filled air pockets will result in an exaggerated reading.
IMKO supplies pre-drilling sets for an optimal preparation of the installation point avoiding compaction of soil otherwise caused by the insertion of the rods.
I:\publik\TECH_MAN\PICO-PROFILE\PICO-PROFILE-manual_eng+Pico-Conf+EC_Vers1_3.doc
8
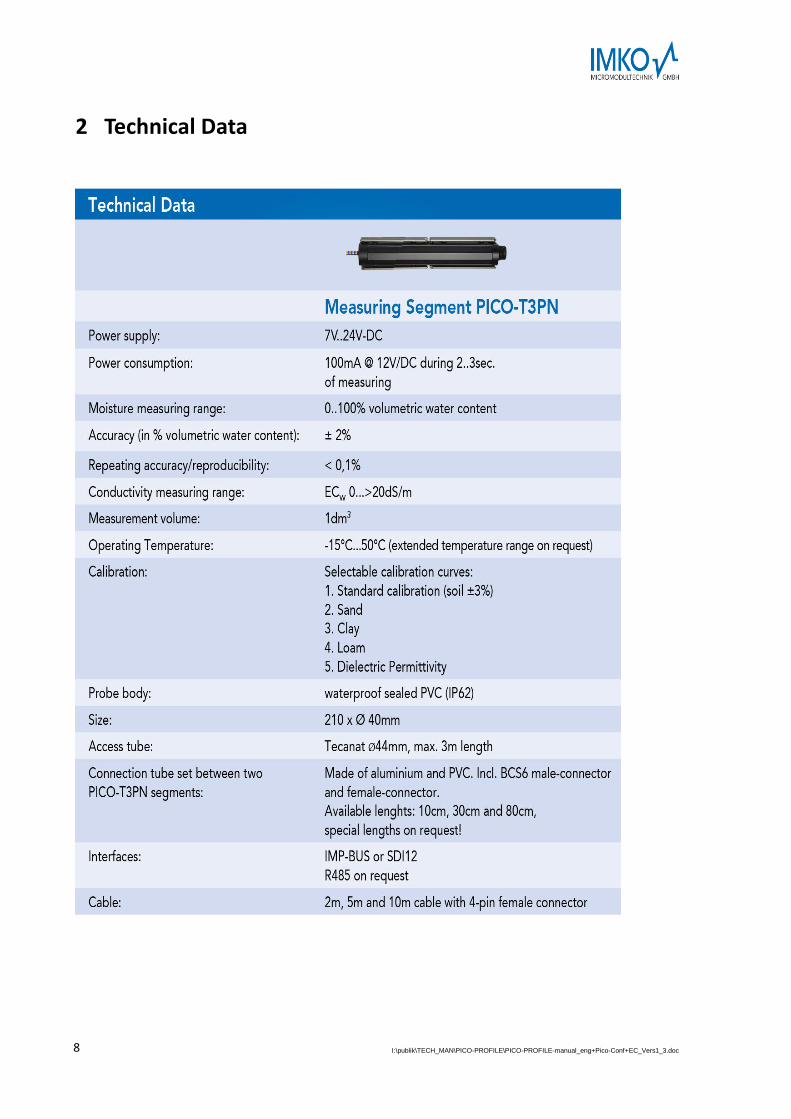
2 Technical Data
I:\publik\TECH_MAN\PICO-PROFILE\PICO-PROFILE-manual_eng+Pico-Conf+EC_Vers1_3.doc
9
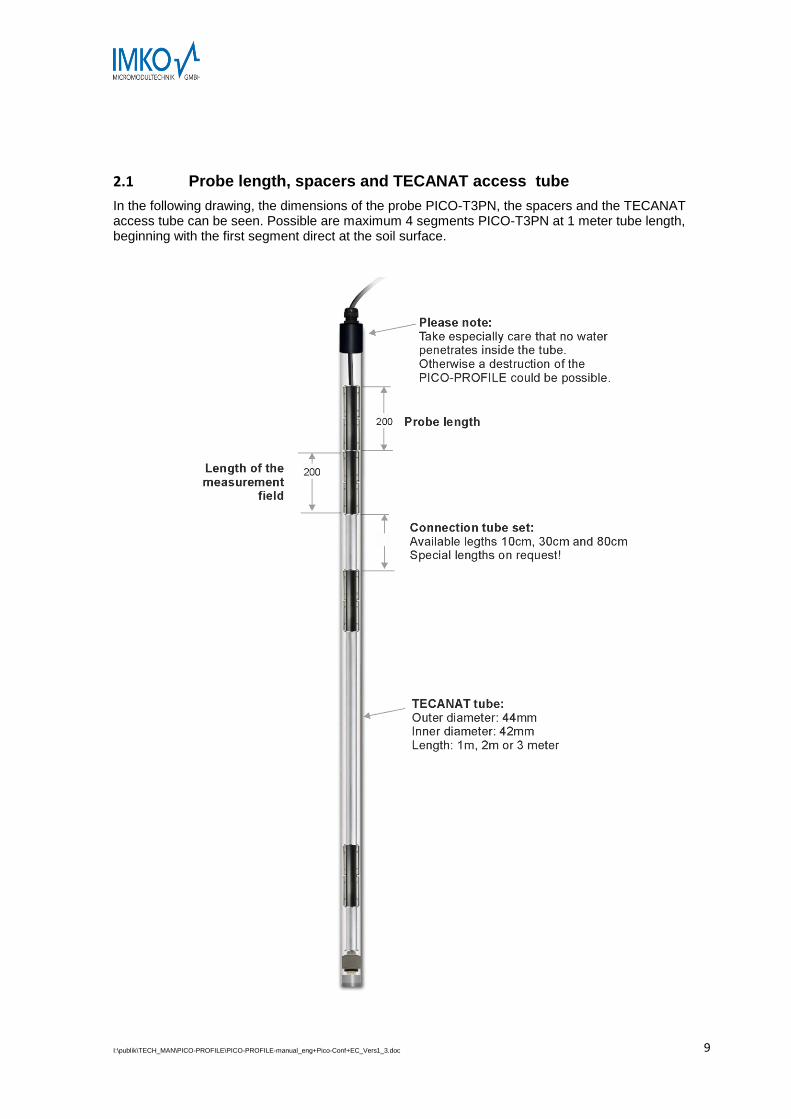
2.1 Probe length, spacers and TECANAT access tube
In the following drawing, the dimensions of the probe PICO-T3PN, the spacers and the TECANAT access tube can be seen. Possible are maximum 4 segments PICO-T3PN at 1 meter tube length, beginning with the first segment direct at the soil surface.
I:\publik\TECH_MAN\PICO-PROFILE\PICO-PROFILE-manual_eng+Pico-Conf+EC_Vers1_3.doc
10
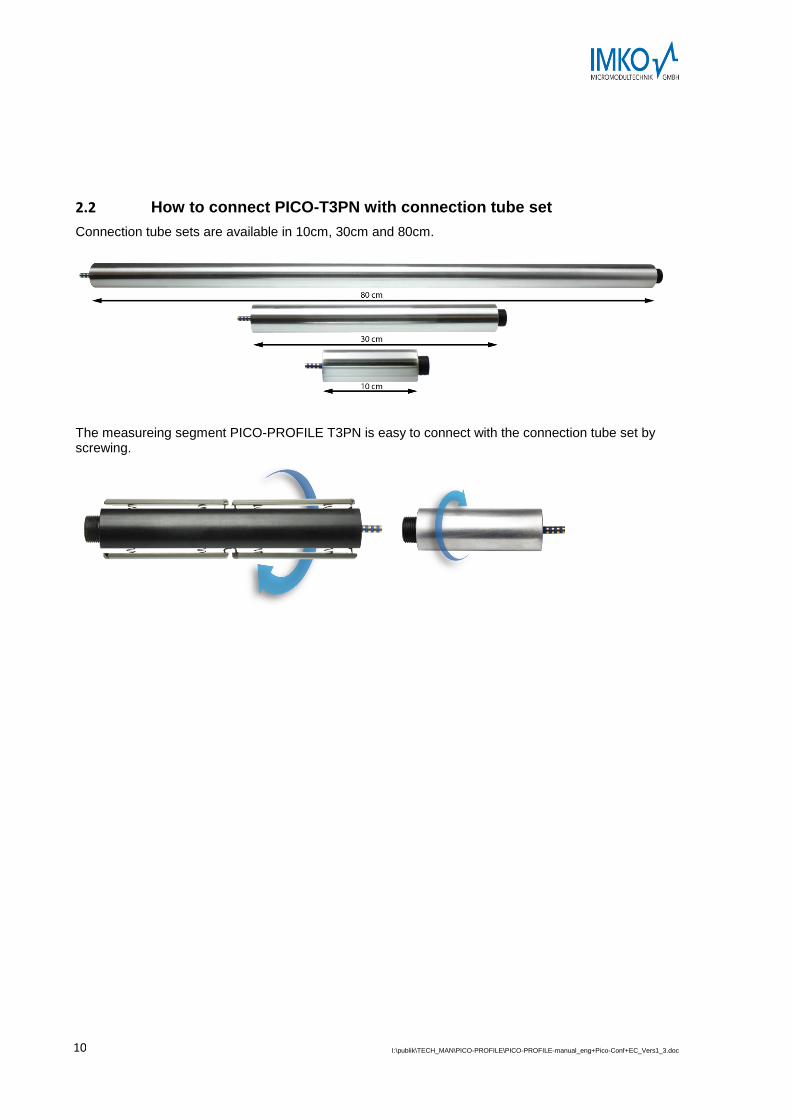
2.2 How to connect PICO-T3PN with connection tube set
Connection tube sets are available in 10cm, 30cm and 80cm.
The measureing segment PICO-PROFILE T3PN is easy to connect with the connection tube set by screwing.
I:\publik\TECH_MAN\PICO-PROFILE\PICO-PROFILE-manual_eng+Pico-Conf+EC_Vers1_3.doc
11
2.3 PICO DataLogger cable 5m or 15m length
Wiring:
Blank: Shield
Yellow: COM (IMP-Bus)
Grey: R/T (IMP-Bus)
Brown: GND
White: +Vs (+12VDC)
Blue: RS485B or SDI12 Data
Pink: RS485A
2.4 PICO DataLogger cable 25m, 50m or 100m length
For longer cable length it is necessary to use another cable:
Wiring:
Pink: Shield
Grey:
Violet:
White:
Blue: COM (IMP-Bus)
Green: R/T (IMP-Bus)
Black: GND
Red: +Vs (+12VDC)
Yellow: RS485B or SDI12 Data
Brown: RS485A
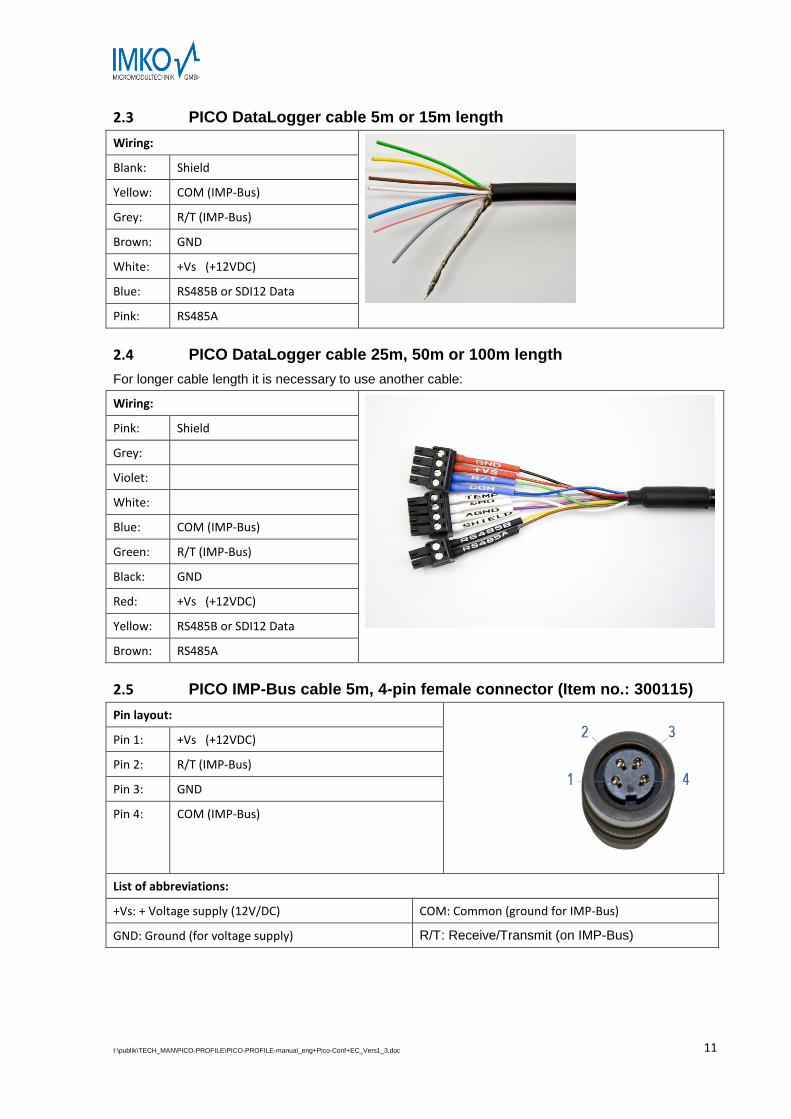
2.5 PICO IMP-Bus cable 5m, 4-pin female connector (Item no.: 300115)
Pin layout:
Pin 1: +Vs (+12VDC)
Pin 2: R/T (IMP-Bus)
Pin 3: GND
Pin 4: COM (IMP-Bus)
List of abbreviations:
+Vs: + Voltage supply (12V/DC) COM: Common (ground for IMP-Bus)
GND: Ground (for voltage supply) R/T: Receive/Transmit (on IMP-Bus)
I:\publik\TECH_MAN\PICO-PROFILE\PICO-PROFILE-manual_eng+Pico-Conf+EC_Vers1_3.doc
12
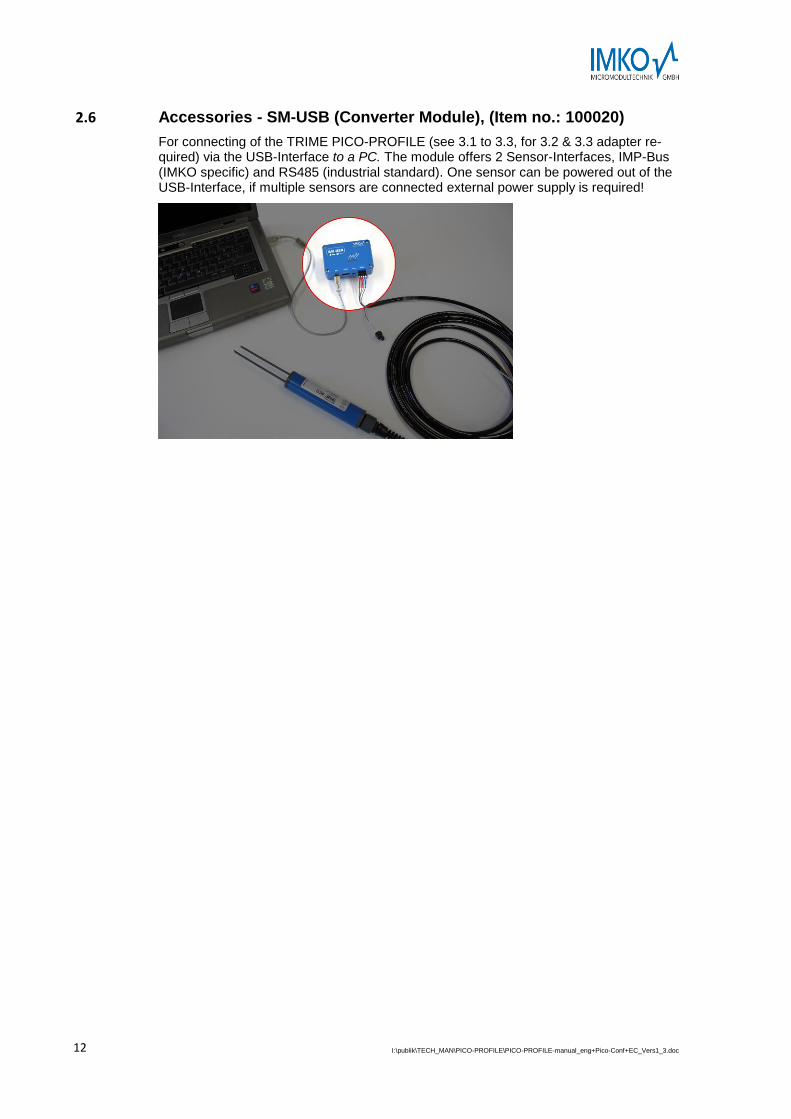
2.6 Accessories - SM-USB (Converter Module), (Item no.: 100020)
For connecting of the TRIME PICO-PROFILE (see 3.1 to 3.3, for 3.2 & 3.3 adapter re-quired) via the USB-Interface to a PC. The module offers 2 Sensor-Interfaces, IMP-Bus (IMKO specific) and RS485 (industrial standard). One sensor can be powered out of the USB-Interface, if multiple sensors are connected external power supply is required!
I:\publik\TECH_MAN\PICO-PROFILE\PICO-PROFILE-manual_eng+Pico-Conf+EC_Vers1_3.doc
13
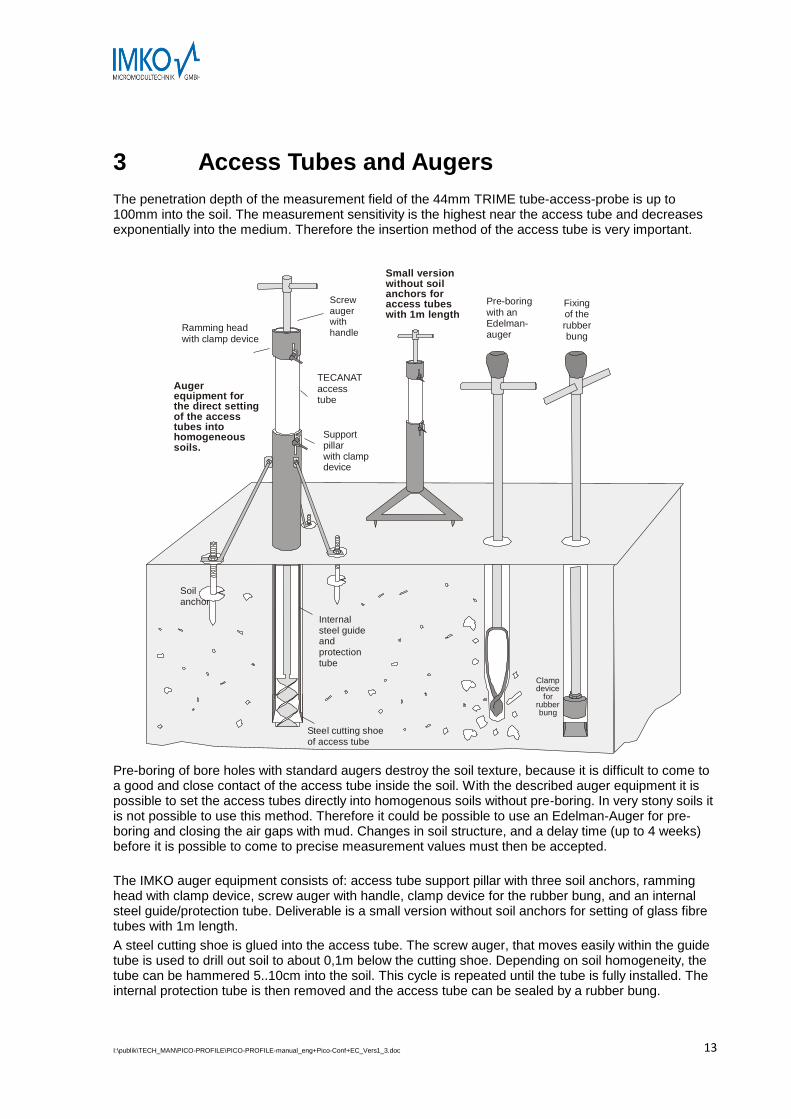
3 Access Tubes and Augers
The penetration depth of the measurement field of the 44mm TRIME tube-access-probe is up to 100mm into the soil. The measurement sensitivity is the highest near the access tube and decreases exponentially into the medium. Therefore the insertion method of the access tube is very important.
Auger equipment for the direct setting of the access tubes into homogeneous soils.
Small versionwithout soilanchors foraccess tubeswith 1m length
Pre-boringwith anEdelman-auger
Fixing of the rubberbung
TECANATaccesstube
Support pillarwith clamp device
Ramming headwith clamp device
Screw augerwith handle
Internal steel guideandprotection tube
Steel cutting shoeof access tube
Soilanchor
Clamp device
for rubber bung
Pre-boring of bore holes with standard augers destroy the soil texture, because it is difficult to come to a good and close contact of the access tube inside the soil. With the described auger equipment it is possible to set the access tubes directly into homogenous soils without pre-boring. In very stony soils it is not possible to use this method. Therefore it could be possible to use an Edelman-Auger for pre-boring and closing the air gaps with mud. Changes in soil structure, and a delay time (up to 4 weeks) before it is possible to come to precise measurement values must then be accepted.
The IMKO auger equipment consists of: access tube support pillar with three soil anchors, ramming head with clamp device, screw auger with handle, clamp device for the rubber bung, and an internal steel guide/protection tube. Deliverable is a small version without soil anchors for setting of glass fibre tubes with 1m length.
A steel cutting shoe is glued into the access tube. The screw auger, that moves easily within the guide tube is used to drill out soil to about 0,1m below the cutting shoe. Depending on soil homogeneity, the tube can be hammered 5..10cm into the soil. This cycle is repeated until the tube is fully installed. The internal protection tube is then removed and the access tube can be sealed by a rubber bung.
I:\publik\TECH_MAN\PICO-PROFILE\PICO-PROFILE-manual_eng+Pico-Conf+EC_Vers1_3.doc
14
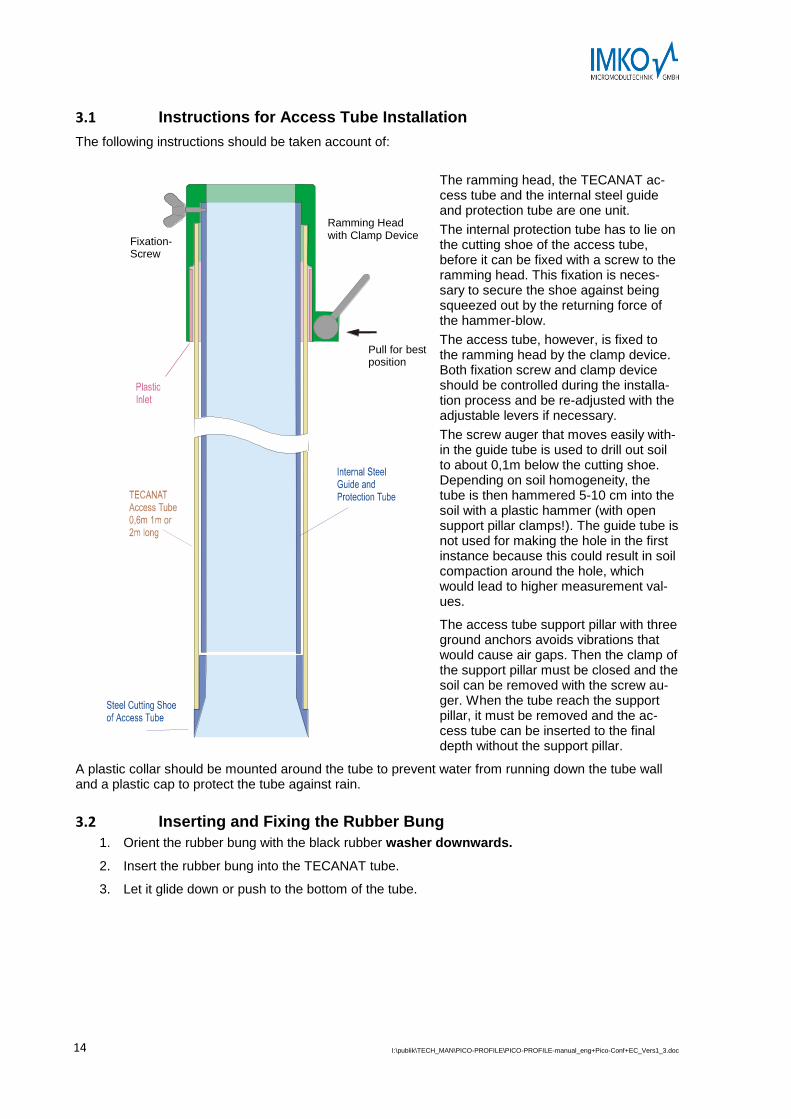
3.1 Instructions for Access Tube Installation
The following instructions should be taken account of:
The ramming head, the TECANAT ac-cess tube and the internal steel guide and protection tube are one unit.
The internal protection tube has to lie on the cutting shoe of the access tube, before it can be fixed with a screw to the ramming head. This fixation is neces-sary to secure the shoe against being squeezed out by the returning force of the hammer-blow.
The access tube, however, is fixed to the ramming head by the clamp device. Both fixation screw and clamp device should be controlled during the installa-tion process and be re-adjusted with the adjustable levers if necessary.
The screw auger that moves easily with-in the guide tube is used to drill out soil to about 0,1m below the cutting shoe. Depending on soil homogeneity, the tube is then hammered 5-10 cm into the soil with a plastic hammer (with open support pillar clamps!). The guide tube is not used for making the hole in the first instance because this could result in soil compaction around the hole, which would lead to higher measurement val-ues.
The access tube support pillar with three ground anchors avoids vibrations that would cause air gaps. Then the clamp of the support pillar must be closed and the soil can be removed with the screw au-ger. When the tube reach the support pillar, it must be removed and the ac-cess tube can be inserted to the final depth without the support pillar.
A plastic collar should be mounted around the tube to prevent water from running down the tube wall and a plastic cap to protect the tube against rain.
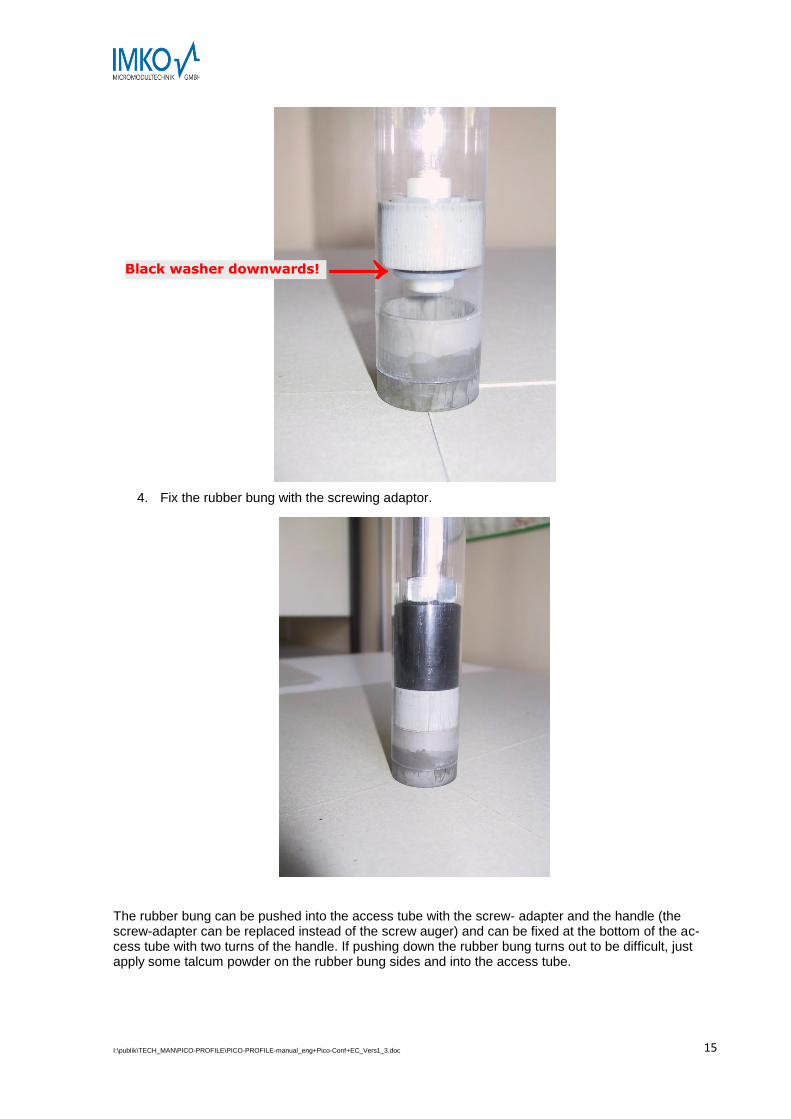
3.2 Inserting and Fixing the Rubber Bung
1. Orient the rubber bung with the black rubber washer downwards.
2. Insert the rubber bung into the TECANAT tube.
3. Let it glide down or push to the bottom of the tube.
Ramming Headwith Clamp Device
Pull for bestposition
Fixation-Screw
I:\publik\TECH_MAN\PICO-PROFILE\PICO-PROFILE-manual_eng+Pico-Conf+EC_Vers1_3.doc
15
4. Fix the rubber bung with the screwing adaptor.
The rubber bung can be pushed into the access tube with the screw- adapter and the handle (the screw-adapter can be replaced instead of the screw auger) and can be fixed at the bottom of the ac-cess tube with two turns of the handle. If pushing down the rubber bung turns out to be difficult, just apply some talcum powder on the rubber bung sides and into the access tube.
→ Black washer downwards!

I:\publik\TECH_MAN\PICO-PROFILE\PICO-PROFILE-manual_eng+Pico-Conf+EC_Vers1_3.doc
16
3.3 Instructions for Water Proof Installation
Attention! Risk of Distruction!
The TECANAT tube is made of highly water resistant material in order to warrant for a long life-span of the tube and the installed PICO-PROFILE probe. In spite of the robust construction, it is to ensure that no water can penetrate into the TECANAT tube. The rubber bang has to be installed correctly and the tube head has to be sealed very secure against water ingress.
Any damage caused by faulty installation is not covered by the warranty!

I:\publik\TECH_MAN\PICO-PROFILE\PICO-PROFILE-manual_eng+Pico-Conf+EC_Vers1_3.doc
17
4 Remote Power Supply to TRIME PICO-PROFILE The operation of TRIME sensors may cause problems when power has to be supplied via long cables. There are limitations to the maximum cable length depending on the cable diameter.
When power is supplied over long distance the maximum cable length depends on the cable cross section A, the supply voltage Vs and the number n of the sensors measuring simultaneously. Device-specific data also be applied to the formula:
Power consumption during measurements: Inorm = 100mA @ 12V/DC Power consumption at min. voltage: Imax = 175mA @ 7V/DC Supply voltage: Vs = 12V Minimum sensor voltage at circuit end: Vmin = 7V Wire cross section: A = 0,34mm² Specific electrical resistance of copper: = 0.0178Ω x mm² / m
Number of sensors: n = 1…
The maximum possible circuit length Imax can then be calculated in the following manner:
max
minmax
2
)(
In
VVAl s
Please see the following the following example: In the IMP232 environmental measurement system a bus cable with a wire cross section of A = 0.34 mm2 is normally used. We further assume that the power supply voltage is Vs =12 V and only one sensor is designated to measure. Thus n = 1.
m
Am
mm
VVmml 270
175.010356.0
)712(34.02
2
max
In the above calculation, no tolerance is included; for security reasons the calculated cable length should be reduced by 10% to obtain a realistic value.
In order to increase the maximum possible cable length several solutions are feasible.
1. Using cables with larger conductor diameters By using 6-core conductor cables instead of 4-core, the cable length can be doubled as two ex-tra cores can be used for power supply. Cables with conductors of larger diameters will further increase the maximum cable length possible.
2. Increasing the power supply voltage Power supply voltage can be increased up to 17V, thereby raising the maximum length from 270m to 540m in the example calculation above.
3. Installation of buffer batteries in the distributor Additional storage batteries close to the TRIME sensors, e.g. in the distributor, allow cable lengths up to 1km and enable simultaneous measurement of several sensors. However, this method requires an additional charging circuit for the buffer storage battery.
4. Installation of a voltage regulator at the distributor Voltage loss in the cable can be reduced with a 30V power supply and an installation of a volt-age regulator directly in front of the TRIME sensor, thus allowing circuit lengths of up to 1km.
Which solution is best suited mainly depends on the nature of the power supply of the measurement system:
Battery supply: solution 1 and possibly solution 3 should be considered, the latter being relatively ex-pensive.
Mains supply: solutions 1 and 2 could be combined, or, more expensive, solutions 2 or 4 could be cho-sen.
I:\publik\TECH_MAN\PICO-PROFILE\PICO-PROFILE-manual_eng+Pico-Conf+EC_Vers1_3.doc
18
5 Datalogging configuration examples PICO probes offer the possibility to use three different options for serial communication:
The robust and secure (opto-isolated) IMP-Bus for large area monitoring networks with cable length >500 meter,
the RS485 as an international standard serial interface for connection of PICO probes to standard PC´s, PDA´s and other computers,
or the SDI12 interface for direct connection to SDI12 dataloggers.
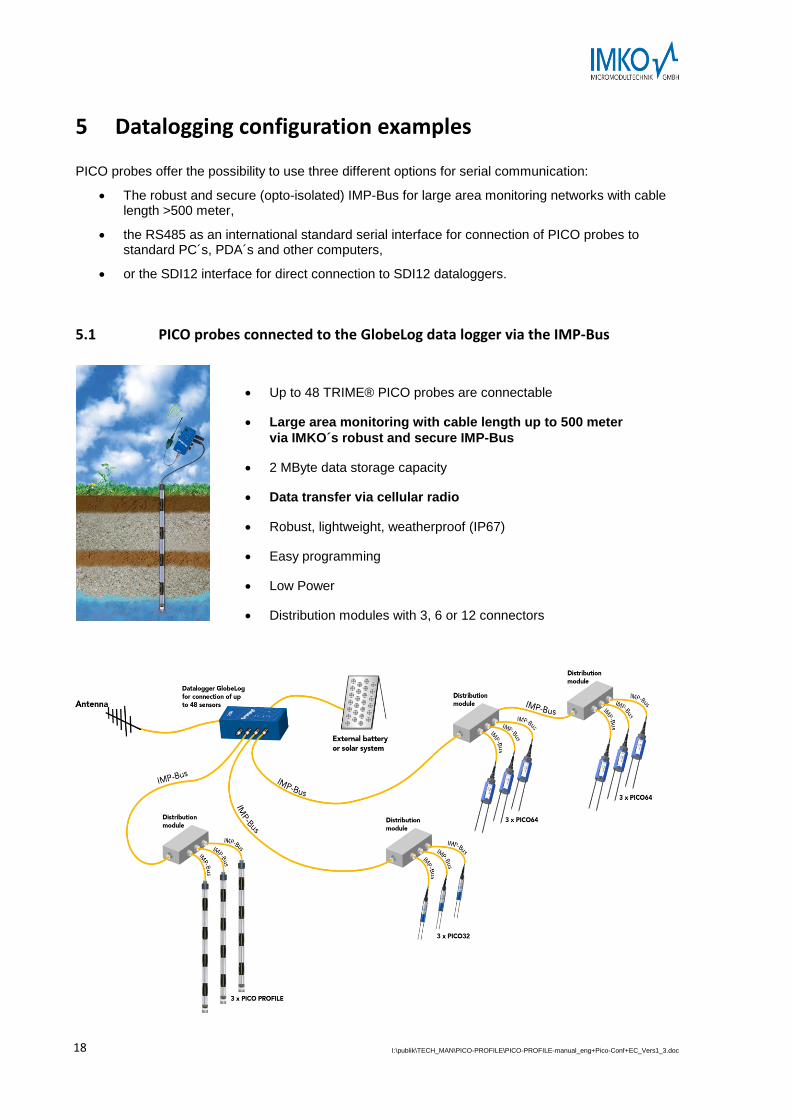
5.1 PICO probes connected to the GlobeLog data logger via the IMP-Bus
Up to 48 TRIME® PICO probes are connectable
Large area monitoring with cable length up to 500 meter
via IMKO´s robust and secure IMP-Bus
2 MByte data storage capacity
Data transfer via cellular radio
Robust, lightweight, weatherproof (IP67)
Easy programming
Low Power
Distribution modules with 3, 6 or 12 connectors
I:\publik\TECH_MAN\PICO-PROFILE\PICO-PROFILE-manual_eng+Pico-Conf+EC_Vers1_3.doc
19
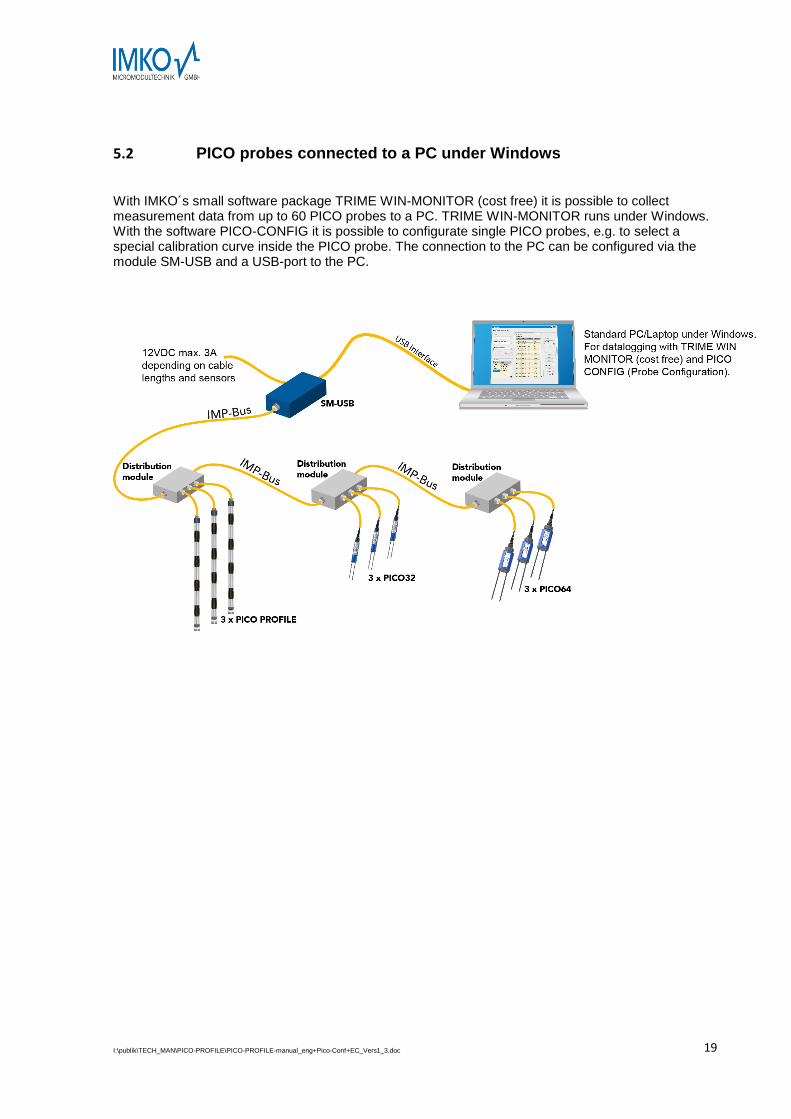
5.2 PICO probes connected to a PC under Windows
With IMKO´s small software package TRIME WIN-MONITOR (cost free) it is possible to collect measurement data from up to 60 PICO probes to a PC. TRIME WIN-MONITOR runs under Windows. With the software PICO-CONFIG it is possible to configurate single PICO probes, e.g. to select a special calibration curve inside the PICO probe. The connection to the PC can be configured via the module SM-USB and a USB-port to the PC.
I:\publik\TECH_MAN\PICO-PROFILE\PICO-PROFILE-manual_eng+Pico-Conf+EC_Vers1_3.doc
20
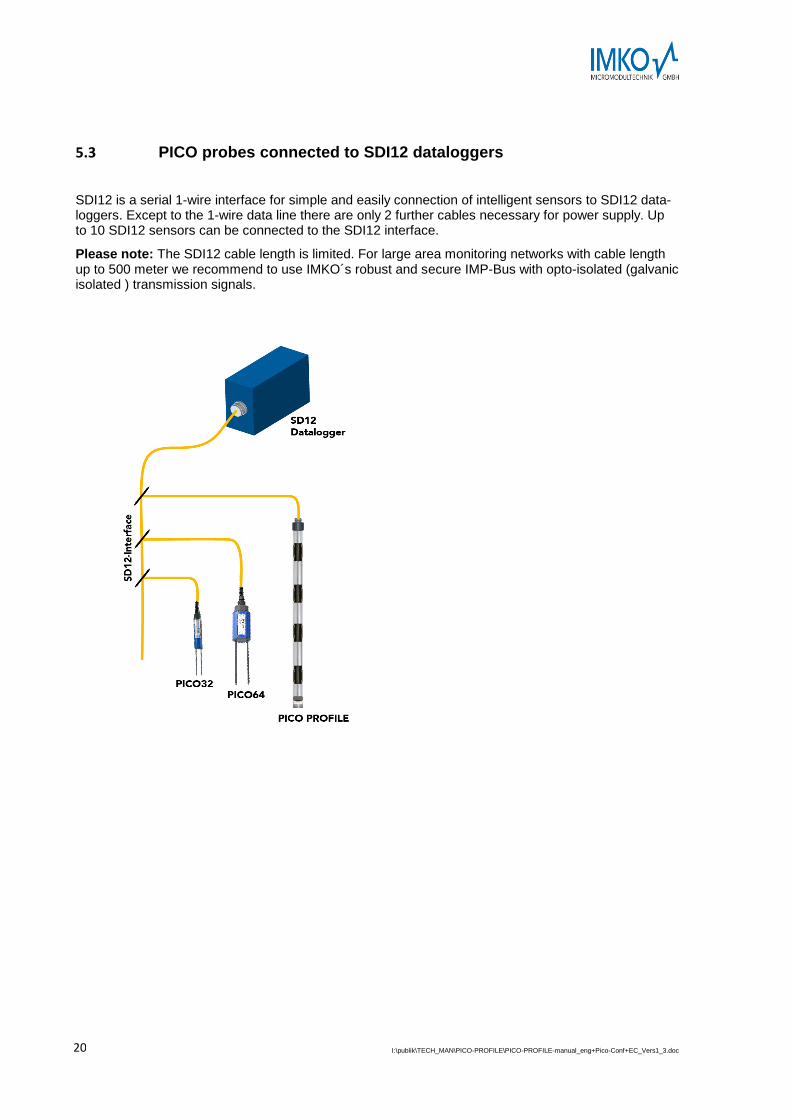
5.3 PICO probes connected to SDI12 dataloggers
SDI12 is a serial 1-wire interface for simple and easily connection of intelligent sensors to SDI12 data-loggers. Except to the 1-wire data line there are only 2 further cables necessary for power supply. Up to 10 SDI12 sensors can be connected to the SDI12 interface.
Please note: The SDI12 cable length is limited. For large area monitoring networks with cable length up to 500 meter we recommend to use IMKO´s robust and secure IMP-Bus with opto-isolated (galvanic isolated ) transmission signals.
I:\publik\TECH_MAN\PICO-PROFILE\PICO-PROFILE-manual_eng+Pico-Conf+EC_Vers1_3.doc
21
6 Information on Lightning Protection of a Sensor Network (IMP-Bus, GlobeLog Logger and integrated Sensors)
6.1 Introduction
Lightning strikes can cause considerable and costly damage to unprotected electronics. The equipment is often totally destroyed. A good number of users are not or only partially insured. Customers who have lightning pro-tection insurance must comply with defined clauses regarding lightning and excess voltage. Insurance compa-nies only cover the damage when compliance with the defined clauses has been proven. IMKO strongly rec-ommends adequate lightning / excess voltage protection equipment for environmental measurement systems.
6.2 Excess voltage protection on 110/220V mains supply
Lightning strikes in proximity to high-voltage transmission lines can cause excess voltage in the mains power supply which may result in damage of electronic components. Environmental measurement systems with 110/220V mains supply are at risk from this excess voltage. It may affect the whole system through the power supply unit and the central station (GlobeLog Logger or SM-USB). Excess voltage can even enter the measuring system through the data acquisition computer’s mains power supply. An excess voltage protection is highly recommended for all 110/220V devices connected to a sensor system
6.3 Protection of modem and telephone lines
Telephone lines are at risk from excess voltage. If a modem is connected to the measurement system the tele-phone line should also be protected by a lightning protection module.
6.4 Excess voltage protection for network modules by "SM-Blitz"
Excess voltage caused by lightning strokes in close proximity to the environmental measurement test system may enter the IMP-Bus transmission lines. Longer lines increase the risk of lightning strikes. Theoretically maxi-mum protection is achieved by installation of a lightning protection module (SM-Blitz) in front of each SM-Module. Lightning protection is not cheap but it is certainly worthwhile. A compromise should be found be-tween costs and the maximum-affordable protection, i.e. interconnection of adjacent SM-Modules to lightning protected groups.
6.5 Lightning protection on meteorological towers
SM-Modules installed on meteorological towers cannot be protected from lightning strikes. The field strength resulting from the electromagnetic fields and the associated accumulated energy will cause damage to the electronics. Two solutions to the problem:
Erect a higher lightning conductor close to the meteorological tower serving as a lightning conductor.
Install the measuring modules a number of metres away. Then all lines coming from the tower have to be protected by lightning protection modules.
6.6 Installation instructions for SM BLITZ lightning protection modules
Basically, there are two potential sources of risk in the field of environmental measurement technology: trans-mission lines and sensors or network devices. Lightning protection modules should always be installed at the beginning and at the end of a circuit in order to protect the electronics from excess voltage (Attention: SM-Blitz modules have a protected and an unprotected side).
The SM-BLITZ lightning protection module has to be grounded using a ground conductor with a wire cross- section of at least 6 mm2 screwed to the long side of the module. A 2-metre long grounding rod may serve as a ground conductor. Grounding is optimal when the grounding rod is in direct contact with ground water.

I:\publik\TECH_MAN\PICO-PROFILE\PICO-PROFILE-manual_eng+Pico-Conf+EC_Vers1_3.doc
22
6.7 Conclusion
Only limited protection against excess voltage is possible where natural phenomenon such as lightning strikes are concerned. Direct lightning strikes may cause damage nevertheless.
If you have any questions regarding lightning protection please do not hesitate to contact us.
Tel.: 0049 - (0)7243 - 5921-0
Fax: 0049 - (0)7243 – 90856
e-mail: [email protected]
I:\publik\TECH_MAN\PICO-PROFILE\PICO-PROFILE-manual_eng+Pico-Conf+EC_Vers1_3.doc
23
7 TRIME PICO-T3PN theory
7.1 Introduction
The measuring of soil water content with Time Domain Reflectometry is now a well established meth-od. However water content profiling is not possible with conventional TDR rod probes. The TRIME tube probe was developed for this reason.
Since 1994 the TRIME-T3 has found numerous applications in earth and environmental sciences, ful-filling even the most exacting requirements.
7.2 Measuring Field
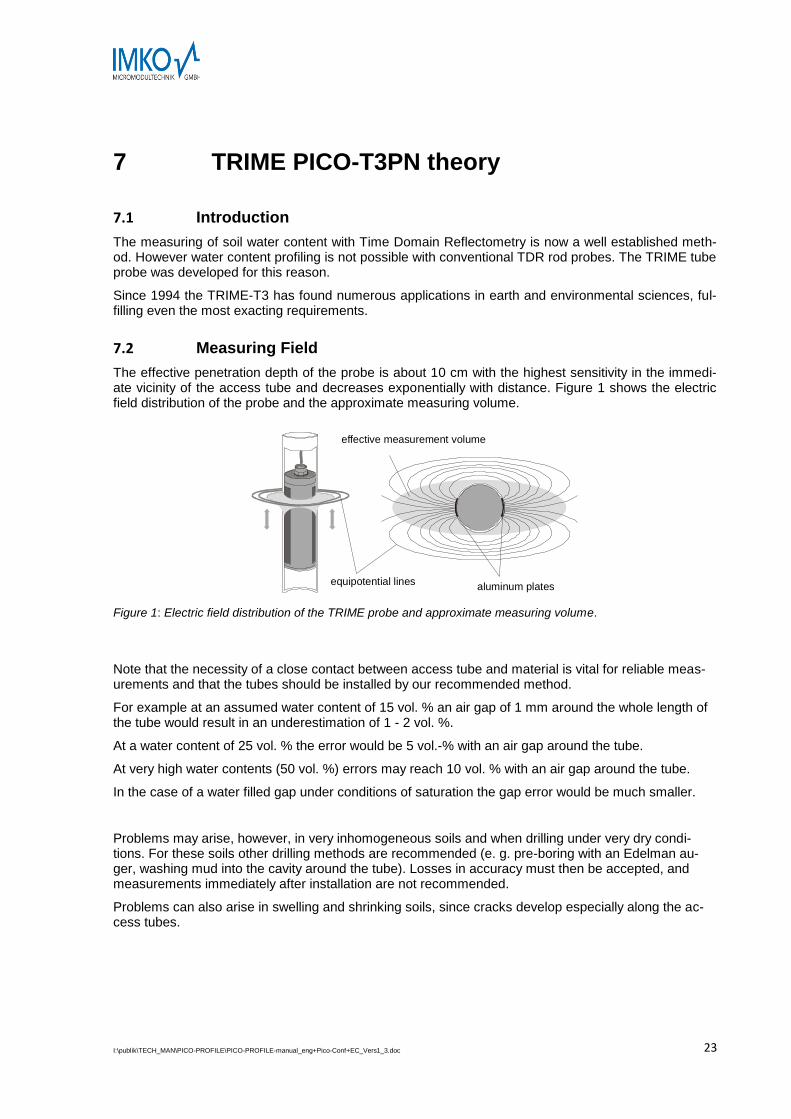
The effective penetration depth of the probe is about 10 cm with the highest sensitivity in the immedi-ate vicinity of the access tube and decreases exponentially with distance. Figure 1 shows the electric field distribution of the probe and the approximate measuring volume.
equipotential lines
effective measurement volume
aluminum plates
Figure 1: Electric field distribution of the TRIME probe and approximate measuring volume.
Note that the necessity of a close contact between access tube and material is vital for reliable meas-urements and that the tubes should be installed by our recommended method.
For example at an assumed water content of 15 vol. % an air gap of 1 mm around the whole length of the tube would result in an underestimation of 1 - 2 vol. %.
At a water content of 25 vol. % the error would be 5 vol.-% with an air gap around the tube.
At very high water contents (50 vol. %) errors may reach 10 vol. % with an air gap around the tube.
In the case of a water filled gap under conditions of saturation the gap error would be much smaller.
Problems may arise, however, in very inhomogeneous soils and when drilling under very dry condi-tions. For these soils other drilling methods are recommended (e. g. pre-boring with an Edelman au-ger, washing mud into the cavity around the tube). Losses in accuracy must then be accepted, and measurements immediately after installation are not recommended.
Problems can also arise in swelling and shrinking soils, since cracks develop especially along the ac-cess tubes.
I:\publik\TECH_MAN\PICO-PROFILE\PICO-PROFILE-manual_eng+Pico-Conf+EC_Vers1_3.doc
24
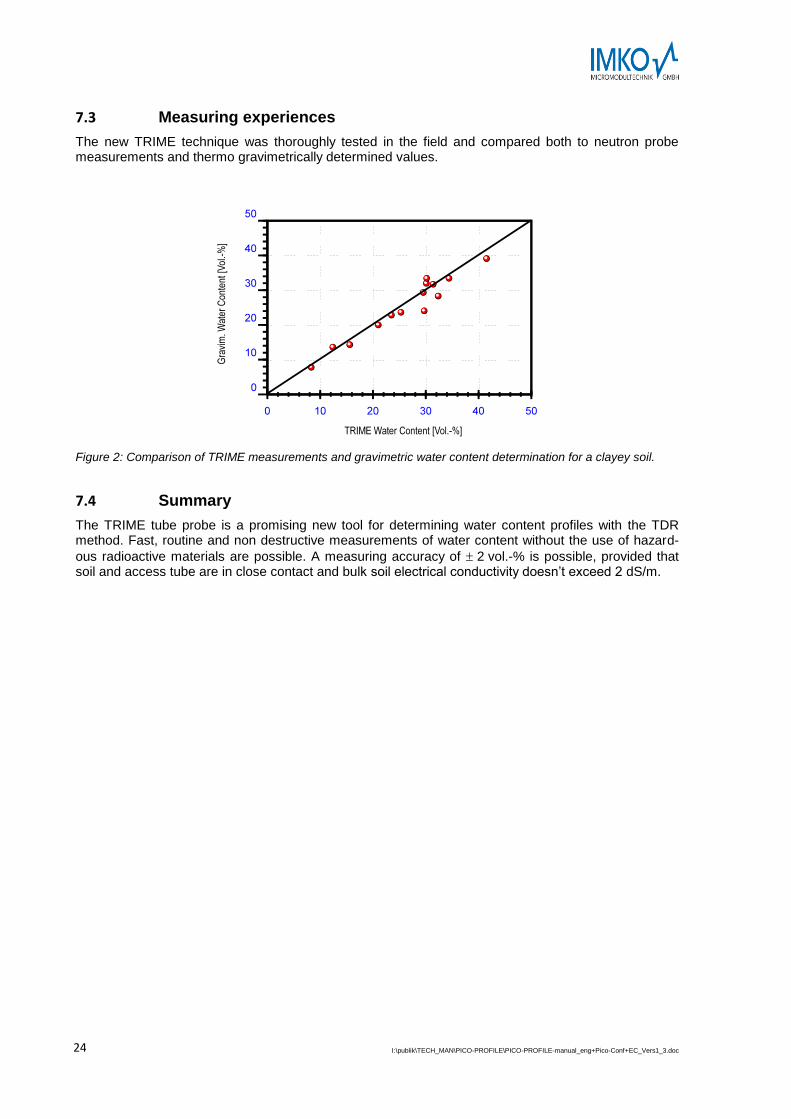
7.3 Measuring experiences
The new TRIME technique was thoroughly tested in the field and compared both to neutron probe measurements and thermo gravimetrically determined values.
Figure 2: Comparison of TRIME measurements and gravimetric water content determination for a clayey soil.
7.4 Summary
The TRIME tube probe is a promising new tool for determining water content profiles with the TDR method. Fast, routine and non destructive measurements of water content without the use of hazard-
ous radioactive materials are possible. A measuring accuracy of 2 vol.-% is possible, provided that soil and access tube are in close contact and bulk soil electrical conductivity doesn’t exceed 2 dS/m.
I:\publik\TECH_MAN\PICO-PROFILE\PICO-PROFILE-manual_eng+Pico-Conf+EC_Vers1_3.doc
25
8 Basic Calibration with the Calibration Set
8.1 What is a basic calibration?
Basic calibration serves to compensate the cable length and tolerances of the probe mechanics (thick-ness of the rod coating, rod length, etc.). After two measurements, one in dry and one in water- saturat-ed glass beads, the calibration data is calculated and stored in the TRIME sensor.
Every TRIME PICO-PROFILE sensor must be calibrated before it can supply proper measurement results. Basic calibration is carried out by IMKO in the factory prior to shipment.
8.2 What are the benefits of the calibration set for the user?
With the calibration set you can easily carry out basic calibration of your TRIME sensor yourself.
If defective probe rods must be changed, you can perform the required basic calibration your-self.
The calibration set cannot be used for establishing a material (soil) specific calibration. For this purpose a measurement dataset must be created for the specific material. The complementary calibration program TRIME-Tool is required to calculate the calibration data for this dataset and to download it to the TRIME PICO-PROFILE-Probe.
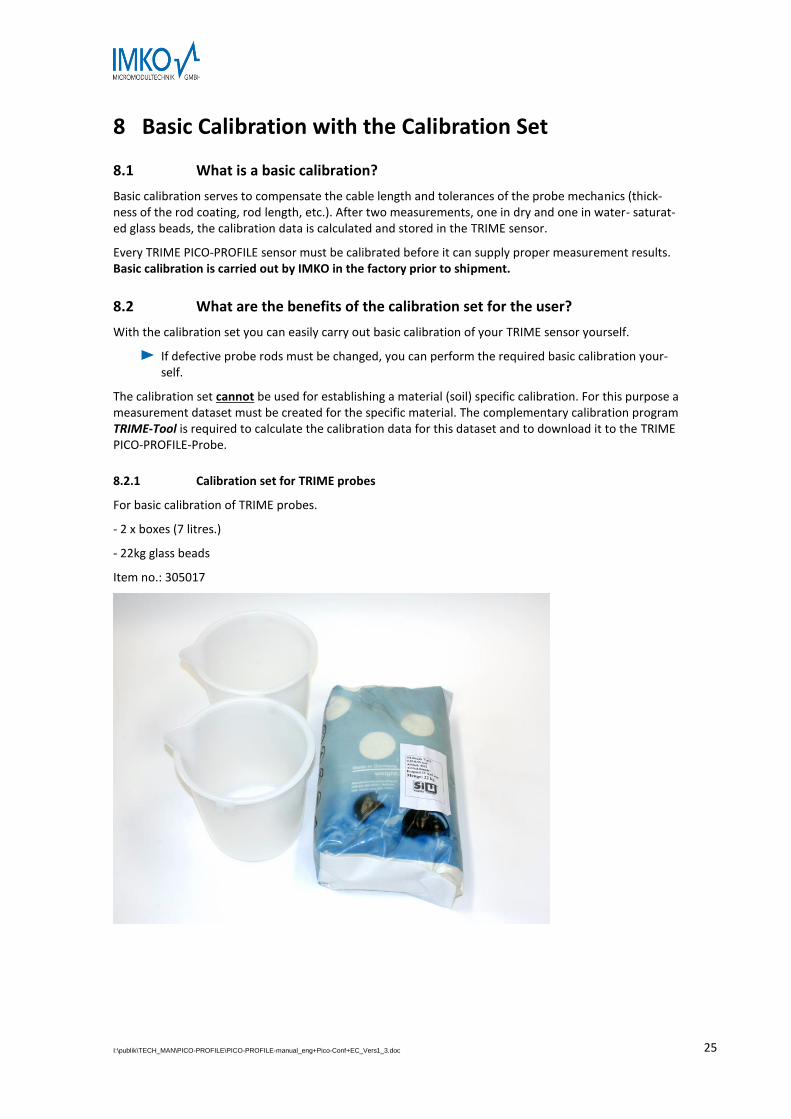
8.2.1 Calibration set for TRIME probes
For basic calibration of TRIME probes.
- 2 x boxes (7 litres.)
- 22kg glass beads
Item no.: 305017
I:\publik\TECH_MAN\PICO-PROFILE\PICO-PROFILE-manual_eng+Pico-Conf+EC_Vers1_3.doc
26
8.3 How to perform a basic calibration?
8.3.1 Preparation of the glass beads
The glass beads, supplied with the calibration set, have to be prepared first:
Fill up one bucket until the rods of the probe can be immersed completely. To obtain a consistent density, knock the bucket on the ground several times.
The density of the glass beads increases with frequent insertion of probes. Therefore the glass beads should be poured out into another bucket and poured back to achieve the original density.
Now the second bucket has to be filled with water in order to be able to fill in the glass beads without leaving air-bubbles. An additional precaution against air-bubbles is to stir slightly while filling in the glass beads. The container must now be knocked on the ground several times to obtain a consistent density. The surplus water must be poured out until the depth of the water film above the glass beads is less than 2mm.
The water-saturated glass beads should be in a temperature range between 20°C and 25°.
Attention: Water dissolves Na2O and K2O from glass which causes a rising pH-value
and higher electrical conductivity. New glass beads have to be washed intensively
with tap water!!!
1. Fill a bucket with water
2. Stir the beads under water to drive out all air bubbles
3. Pour out the water. This procedure should be done with new glass beads at least five times, each time with fresh water. If the glass beads have been in use for a prolonged period, three times is sufficient.
Please note that the electrical conductivity of the water-saturated glass beads medium
increases already after a few days storage. Therefore the glass beads must be washed again before the next calibration.
8.3.2 Basic calibration procedure
Basic calibration must be performed using the calibration program Pico-Config . Please read
the information about basic calibration with Pico-Config in chapter 12 of this document.
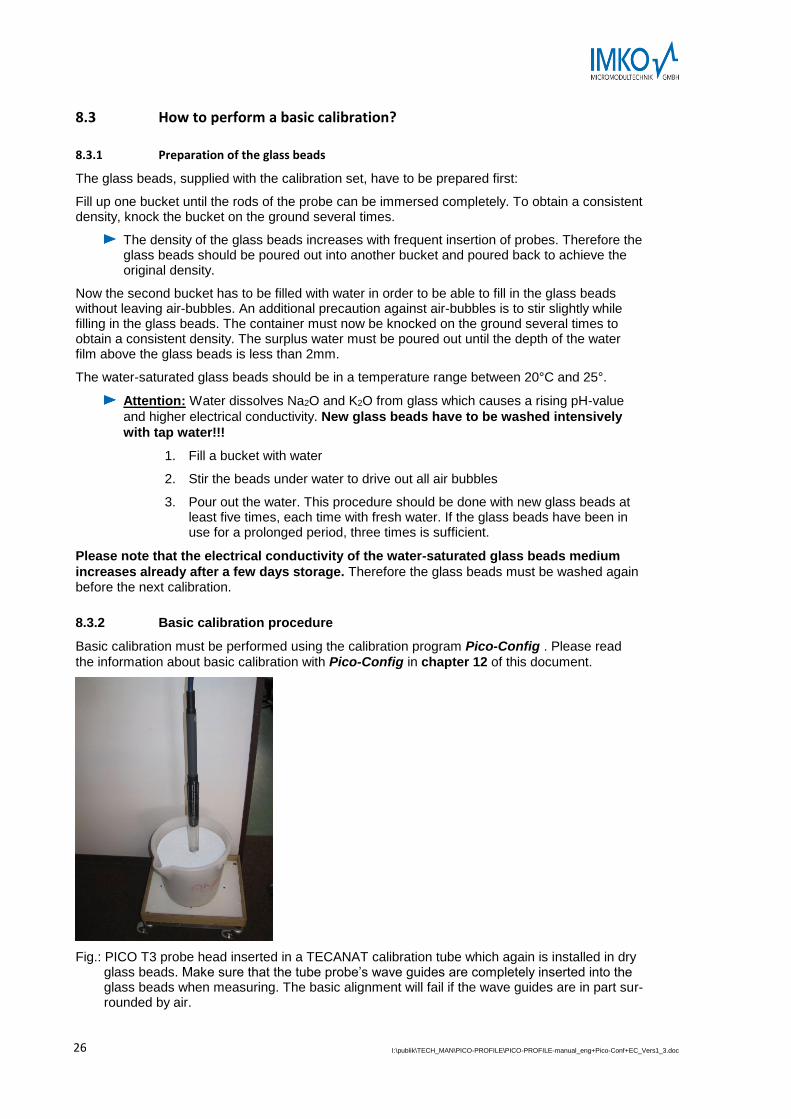
Fig.: PICO T3 probe head inserted in a TECANAT calibration tube which again is installed in dry glass beads. Make sure that the tube probe’s wave guides are completely inserted into the glass beads when measuring. The basic alignment will fail if the wave guides are in part sur-rounded by air.

I:\publik\TECH_MAN\PICO-PROFILE\PICO-PROFILE-manual_eng+Pico-Conf+EC_Vers1_3.doc
27
8.3.3 Material specific calibration
Your TRIME measuring system operates with a universal calibration for mineral soils as a standard.
The following parameters limit the application range of the universal calibration:
Clay content: >50%
Organic content: >10%
Bulk density: <1.1kg/dm³ or >1.7kg/dm³
Exceeding these limits may cause the tolerances given on page 5 to be overstepped.
Material-specific calibration is advisable if your soil is listed above or if you require accuracy down to the last digit. The PICO-CONFIG software is required for setting up a material-specific calibration (download under www.imko.de).
A test series with reference values is necessary for performing material-specific calibration (e.g. Oven drying at 105°C until weight is constant). The test series –and consequently the calibration– should include minimum and maximum moisture values. TRIME readings and reference values are compared in a table. The calibration coef-ficients must then be calculated and uploaded to the TRIME-device.
I:\publik\TECH_MAN\PICO-PROFILE\PICO-PROFILE-manual_eng+Pico-Conf+EC_Vers1_3.doc
28
9 TRIME WIN MONITOR
9.1 Installation
Download the file Trime_WinMonitor x.xxx.zip to the PC from IMKO website. Unzip the files Trime_WinMonitor_Setup.msi and Setup.exe from Trime_WinMonitor x.xxx.zip.
Double-click Trime_WinMonitor_Setup.msi and follow the instructions to install the software. After the instal-lation, Trime_WinMonitor should be seen on Start->Program menu and Desktop.
1 how to use
9.2 Connect Trime-PICO to a PC
If Trime-PICO is tested, it can be connected to a PC via RS485 bus or the IMP Bus with a the SM-USB module. Several Trime-PICO probes may be netted and tested on IMP bus or RS485.
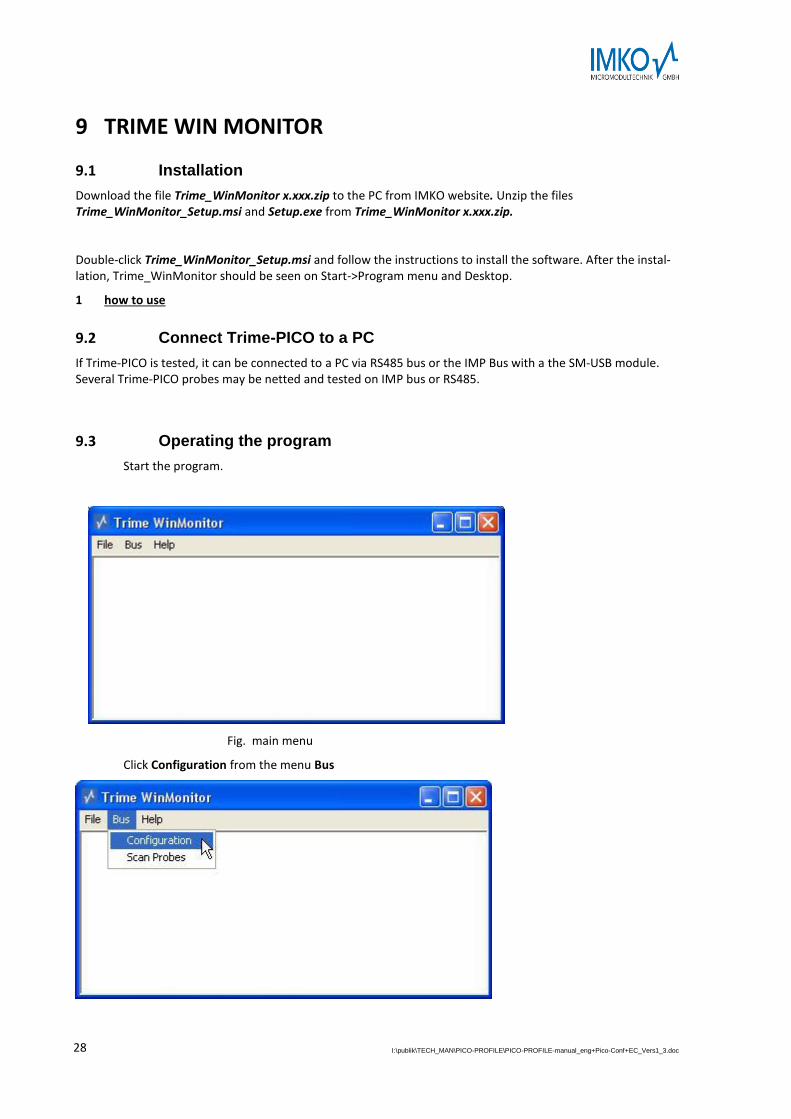
9.3 Operating the program
Start the program.
Fig. main menu
Click Configuration from the menu Bus
I:\publik\TECH_MAN\PICO-PROFILE\PICO-PROFILE-manual_eng+Pico-Conf+EC_Vers1_3.doc
29
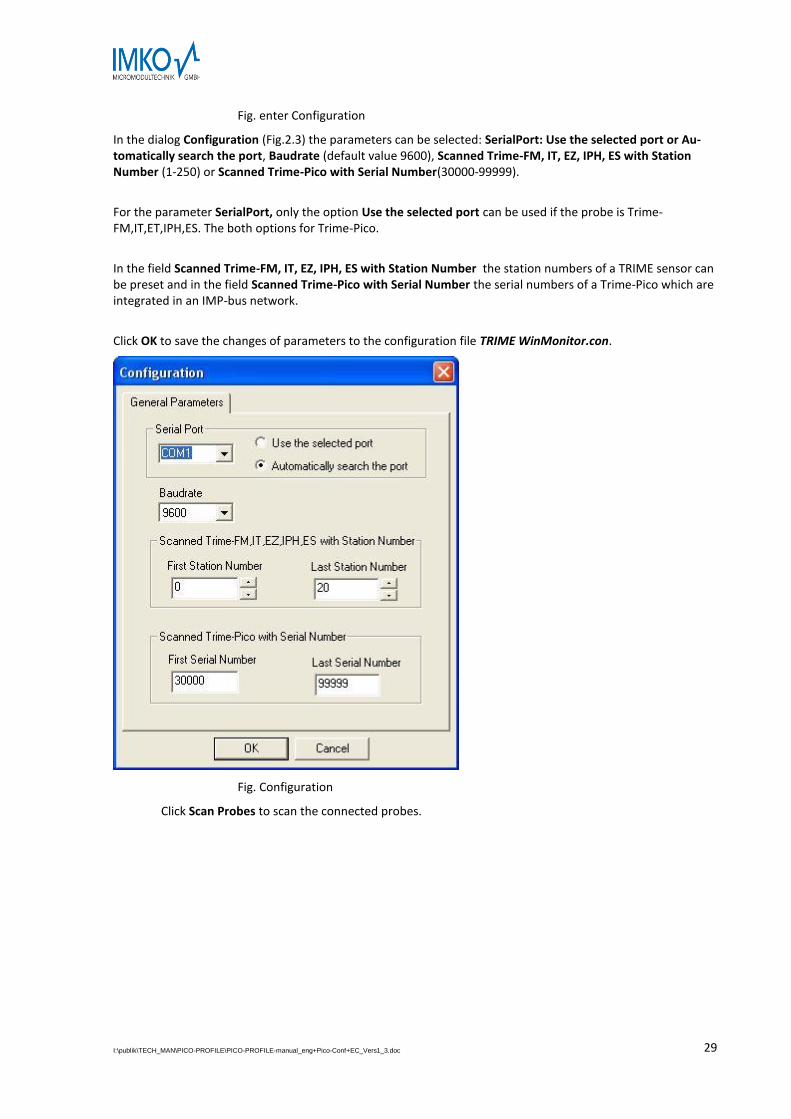
Fig. enter Configuration
In the dialog Configuration (Fig.2.3) the parameters can be selected: SerialPort: Use the selected port or Au-tomatically search the port, Baudrate (default value 9600), Scanned Trime-FM, IT, EZ, IPH, ES with Station Number (1-250) or Scanned Trime-Pico with Serial Number(30000-99999).
For the parameter SerialPort, only the option Use the selected port can be used if the probe is Trime-FM,IT,ET,IPH,ES. The both options for Trime-Pico.
In the field Scanned Trime-FM, IT, EZ, IPH, ES with Station Number the station numbers of a TRIME sensor can be preset and in the field Scanned Trime-Pico with Serial Number the serial numbers of a Trime-Pico which are integrated in an IMP-bus network.
Click OK to save the changes of parameters to the configuration file TRIME WinMonitor.con.
Fig. Configuration
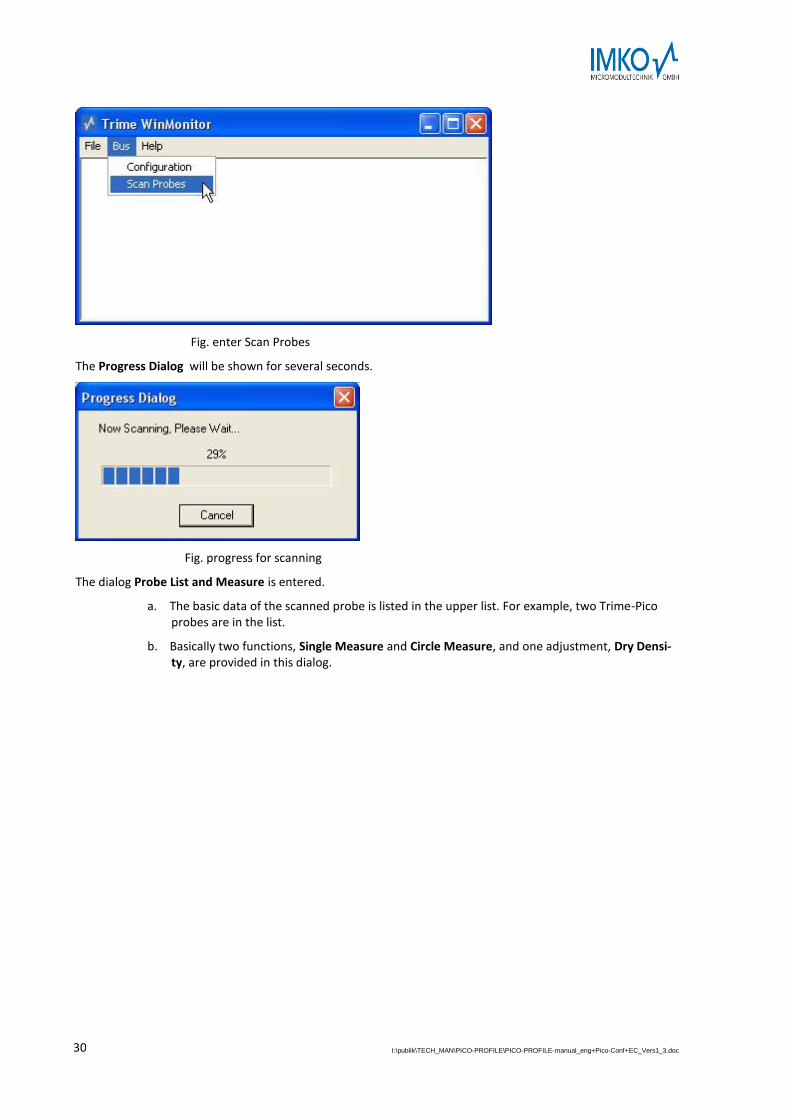
Click Scan Probes to scan the connected probes.
I:\publik\TECH_MAN\PICO-PROFILE\PICO-PROFILE-manual_eng+Pico-Conf+EC_Vers1_3.doc
30
Fig. enter Scan Probes
The Progress Dialog will be shown for several seconds.
Fig. progress for scanning
The dialog Probe List and Measure is entered.
a. The basic data of the scanned probe is listed in the upper list. For example, two Trime-Pico probes are in the list.
b. Basically two functions, Single Measure and Circle Measure, and one adjustment, Dry Densi-ty, are provided in this dialog.
I:\publik\TECH_MAN\PICO-PROFILE\PICO-PROFILE-manual_eng+Pico-Conf+EC_Vers1_3.doc
31
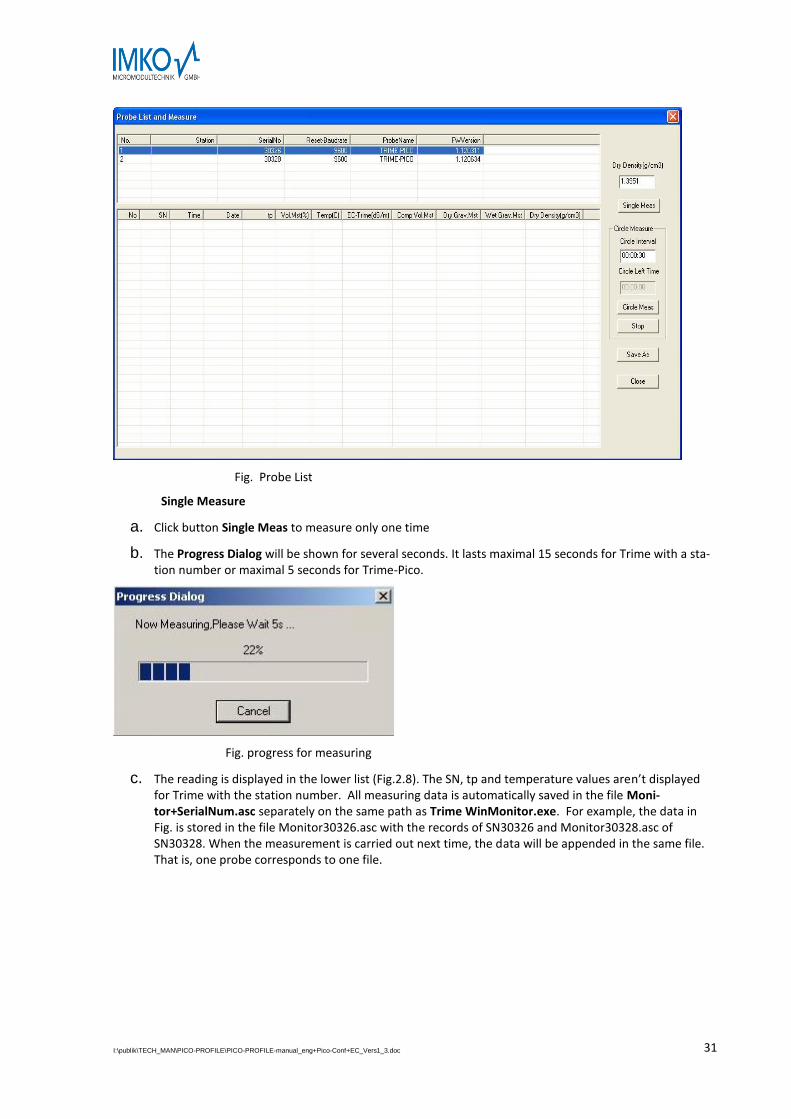
Fig. Probe List
Single Measure
a. Click button Single Meas to measure only one time
b. The Progress Dialog will be shown for several seconds. It lasts maximal 15 seconds for Trime with a sta-tion number or maximal 5 seconds for Trime-Pico.
Fig. progress for measuring
c. The reading is displayed in the lower list (Fig.2.8). The SN, tp and temperature values aren’t displayed for Trime with the station number. All measuring data is automatically saved in the file Moni-tor+SerialNum.asc separately on the same path as Trime WinMonitor.exe. For example, the data in Fig. is stored in the file Monitor30326.asc with the records of SN30326 and Monitor30328.asc of SN30328. When the measurement is carried out next time, the data will be appended in the same file. That is, one probe corresponds to one file.
I:\publik\TECH_MAN\PICO-PROFILE\PICO-PROFILE-manual_eng+Pico-Conf+EC_Vers1_3.doc
32
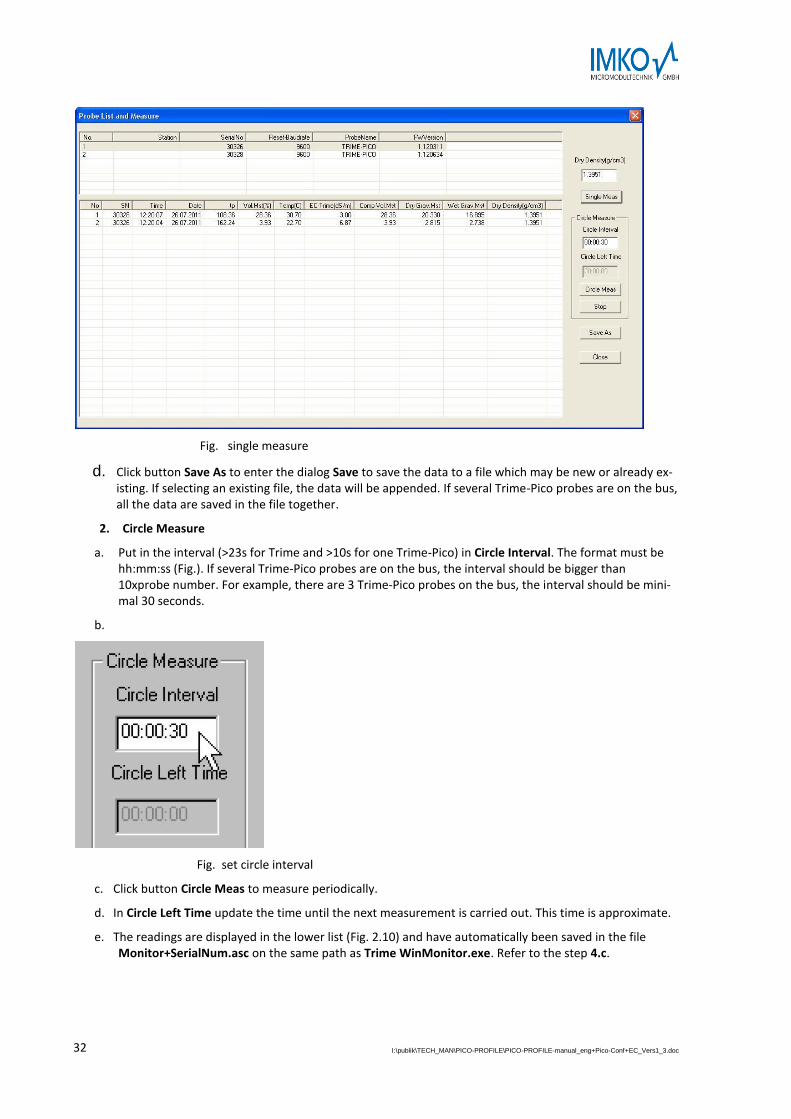
Fig. single measure
d. Click button Save As to enter the dialog Save to save the data to a file which may be new or already ex-isting. If selecting an existing file, the data will be appended. If several Trime-Pico probes are on the bus, all the data are saved in the file together.
2. Circle Measure
a. Put in the interval (>23s for Trime and >10s for one Trime-Pico) in Circle Interval. The format must be hh:mm:ss (Fig.). If several Trime-Pico probes are on the bus, the interval should be bigger than 10xprobe number. For example, there are 3 Trime-Pico probes on the bus, the interval should be mini-mal 30 seconds.
b.
Fig. set circle interval
c. Click button Circle Meas to measure periodically.
d. In Circle Left Time update the time until the next measurement is carried out. This time is approximate.
e. The readings are displayed in the lower list (Fig. 2.10) and have automatically been saved in the file Monitor+SerialNum.asc on the same path as Trime WinMonitor.exe. Refer to the step 4.c.
I:\publik\TECH_MAN\PICO-PROFILE\PICO-PROFILE-manual_eng+Pico-Conf+EC_Vers1_3.doc
33
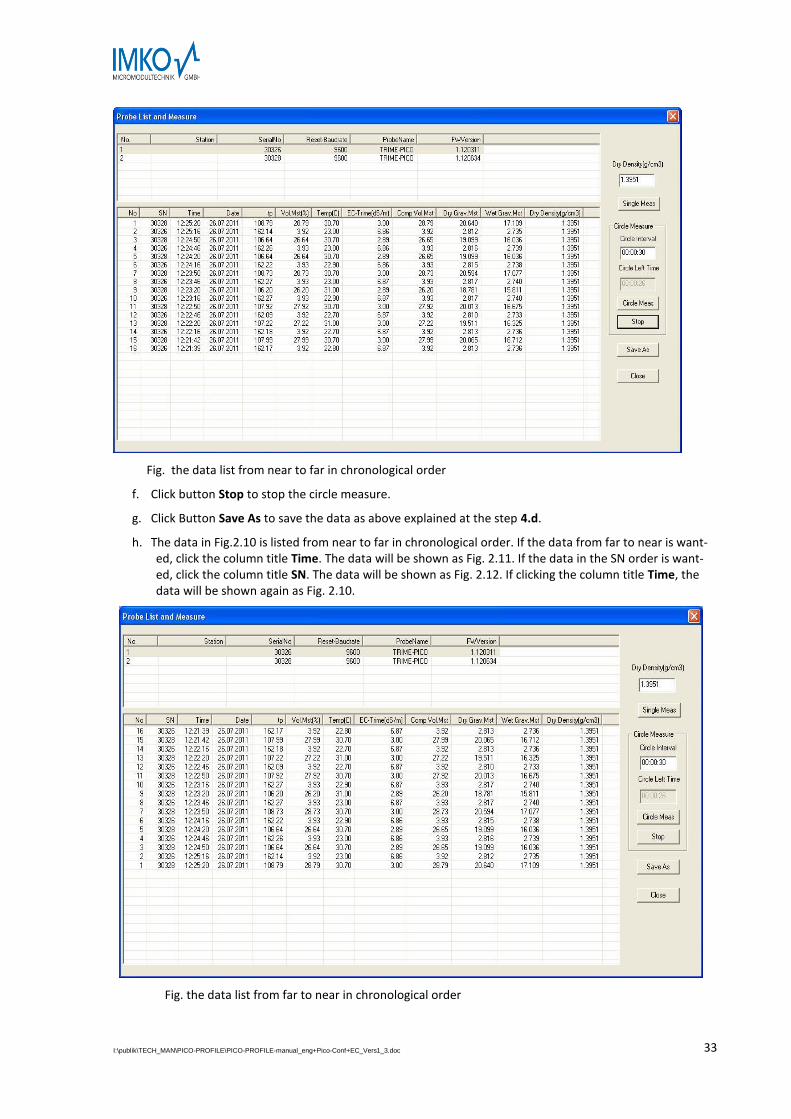
Fig. the data list from near to far in chronological order
f. Click button Stop to stop the circle measure.
g. Click Button Save As to save the data as above explained at the step 4.d.
h. The data in Fig.2.10 is listed from near to far in chronological order. If the data from far to near is want-ed, click the column title Time. The data will be shown as Fig. 2.11. If the data in the SN order is want-ed, click the column title SN. The data will be shown as Fig. 2.12. If clicking the column title Time, the data will be shown again as Fig. 2.10.
Fig. the data list from far to near in chronological order
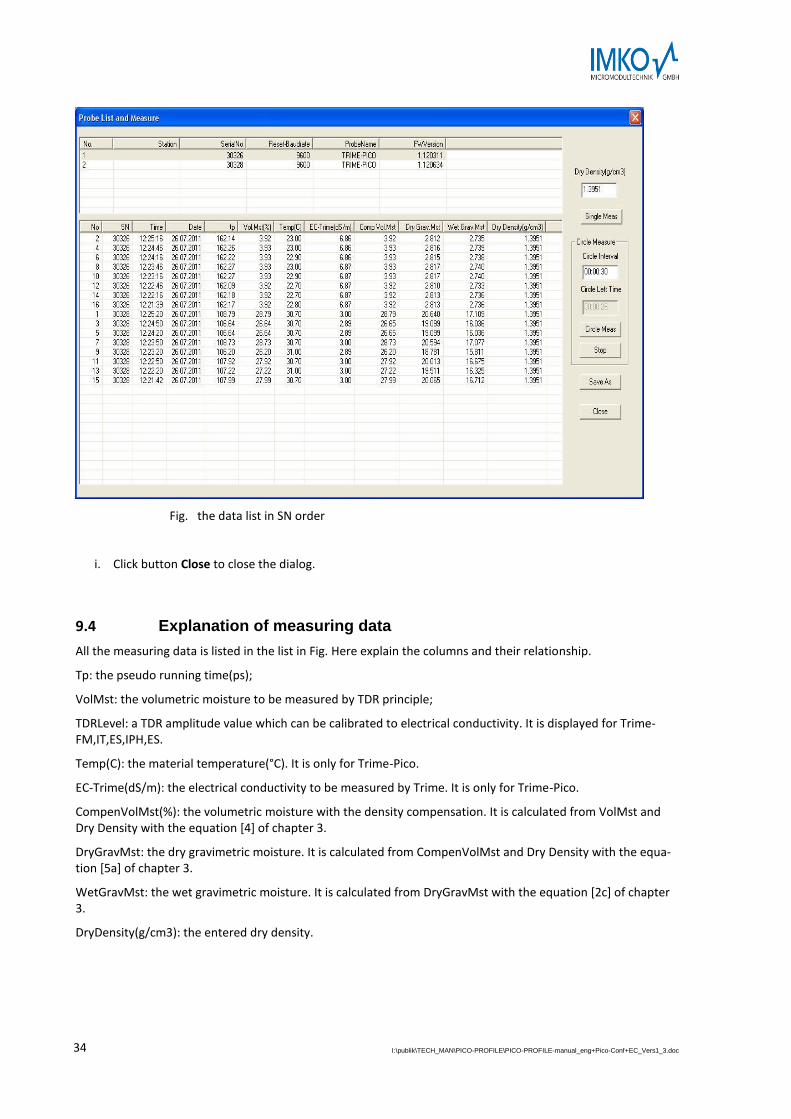
I:\publik\TECH_MAN\PICO-PROFILE\PICO-PROFILE-manual_eng+Pico-Conf+EC_Vers1_3.doc
34
Fig. the data list in SN order
i. Click button Close to close the dialog.
9.4 Explanation of measuring data
All the measuring data is listed in the list in Fig. Here explain the columns and their relationship.
Tp: the pseudo running time(ps);
VolMst: the volumetric moisture to be measured by TDR principle;
TDRLevel: a TDR amplitude value which can be calibrated to electrical conductivity. It is displayed for Trime-FM,IT,ES,IPH,ES.
Temp(C): the material temperature(°C). It is only for Trime-Pico.
EC-Trime(dS/m): the electrical conductivity to be measured by Trime. It is only for Trime-Pico.
CompenVolMst(%): the volumetric moisture with the density compensation. It is calculated from VolMst and Dry Density with the equation [4] of chapter 3.
DryGravMst: the dry gravimetric moisture. It is calculated from CompenVolMst and Dry Density with the equa-tion [5a] of chapter 3.
WetGravMst: the wet gravimetric moisture. It is calculated from DryGravMst with the equation [2c] of chapter 3.
DryDensity(g/cm3): the entered dry density.
I:\publik\TECH_MAN\PICO-PROFILE\PICO-PROFILE-manual_eng+Pico-Conf+EC_Vers1_3.doc
35
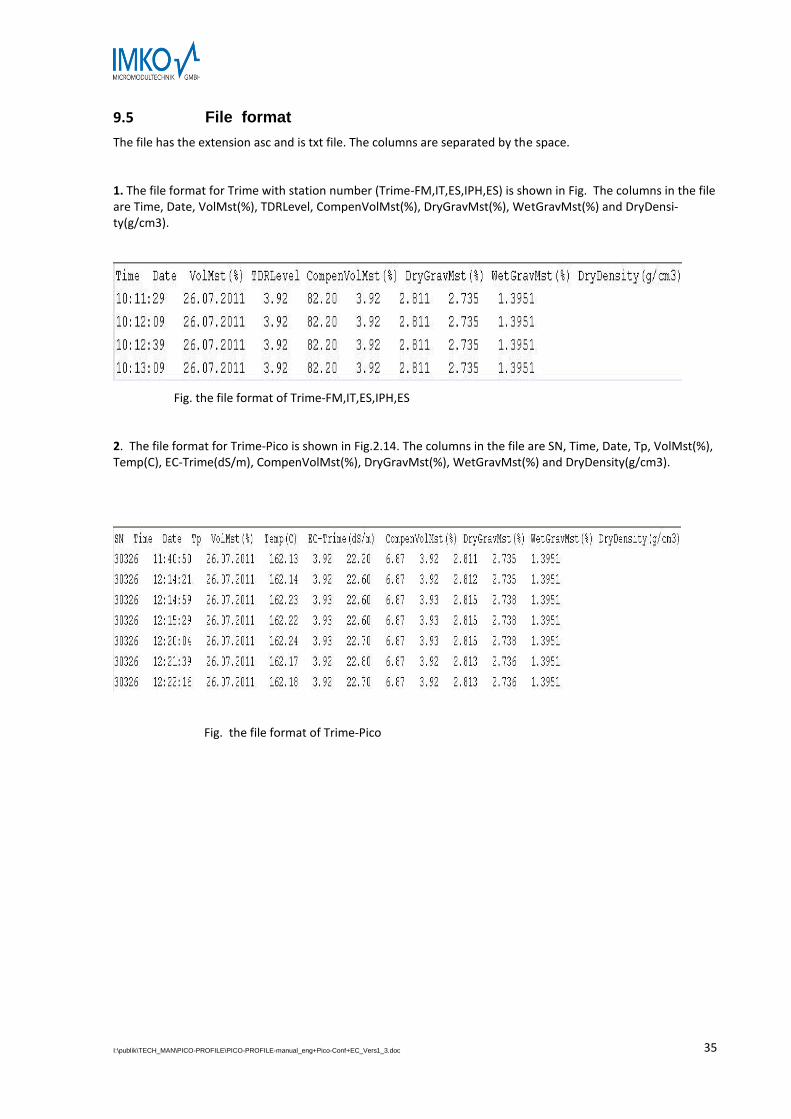
9.5 File format
The file has the extension asc and is txt file. The columns are separated by the space.
1. The file format for Trime with station number (Trime-FM,IT,ES,IPH,ES) is shown in Fig. The columns in the file are Time, Date, VolMst(%), TDRLevel, CompenVolMst(%), DryGravMst(%), WetGravMst(%) and DryDensi-ty(g/cm3).
Fig. the file format of Trime-FM,IT,ES,IPH,ES
2. The file format for Trime-Pico is shown in Fig.2.14. The columns in the file are SN, Time, Date, Tp, VolMst(%), Temp(C), EC-Trime(dS/m), CompenVolMst(%), DryGravMst(%), WetGravMst(%) and DryDensity(g/cm3).
Fig. the file format of Trime-Pico
I:\publik\TECH_MAN\PICO-PROFILE\PICO-PROFILE-manual_eng+Pico-Conf+EC_Vers1_3.doc
36
10 Quick guide for the Software PICO-CONFIG
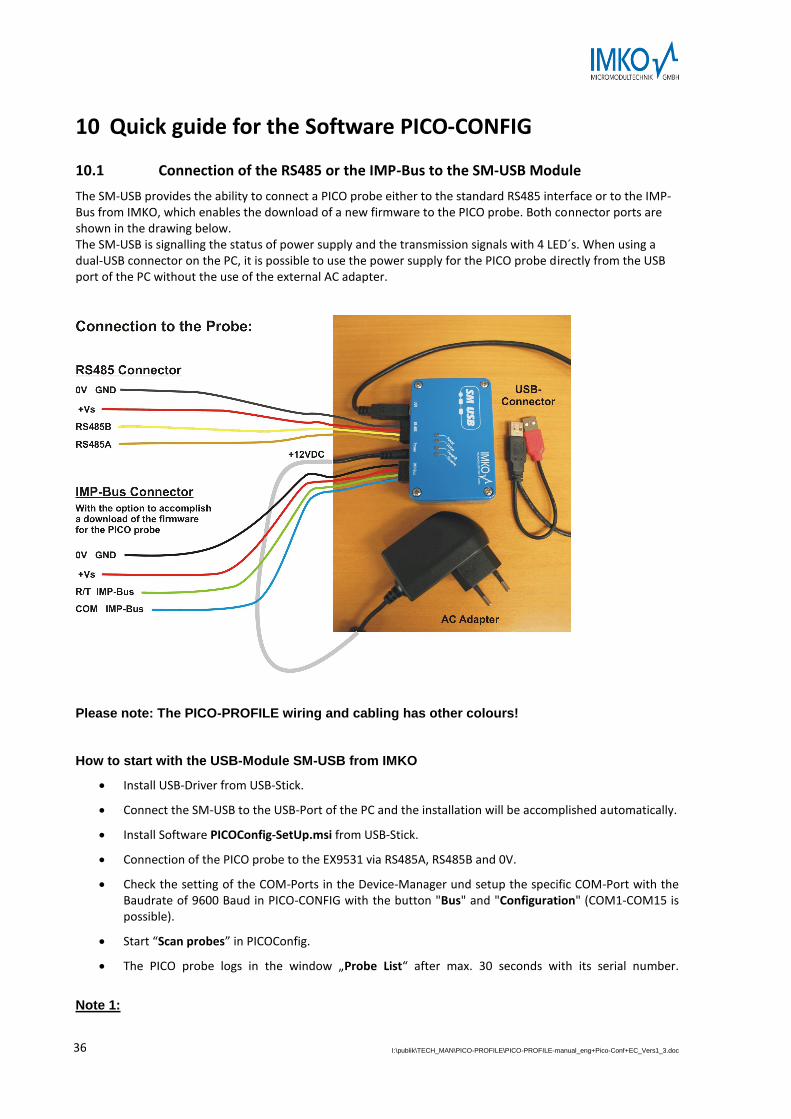
10.1 Connection of the RS485 or the IMP-Bus to the SM-USB Module
The SM-USB provides the ability to connect a PICO probe either to the standard RS485 interface or to the IMP-Bus from IMKO, which enables the download of a new firmware to the PICO probe. Both connector ports are shown in the drawing below. The SM-USB is signalling the status of power supply and the transmission signals with 4 LED´s. When using a dual-USB connector on the PC, it is possible to use the power supply for the PICO probe directly from the USB port of the PC without the use of the external AC adapter.
Please note: The PICO-PROFILE wiring and cabling has other colours!
How to start with the USB-Module SM-USB from IMKO
Install USB-Driver from USB-Stick.
Connect the SM-USB to the USB-Port of the PC and the installation will be accomplished automatically.
Install Software PICOConfig-SetUp.msi from USB-Stick.
Connection of the PICO probe to the EX9531 via RS485A, RS485B and 0V.
Check the setting of the COM-Ports in the Device-Manager und setup the specific COM-Port with the Baudrate of 9600 Baud in PICO-CONFIG with the button "Bus" and "Configuration" (COM1-COM15 is possible).
Start “Scan probes” in PICOConfig.
The PICO probe logs in the window „Probe List“ after max. 30 seconds with its serial number.
Note 1:
I:\publik\TECH_MAN\PICO-PROFILE\PICO-PROFILE-manual_eng+Pico-Conf+EC_Vers1_3.doc
37
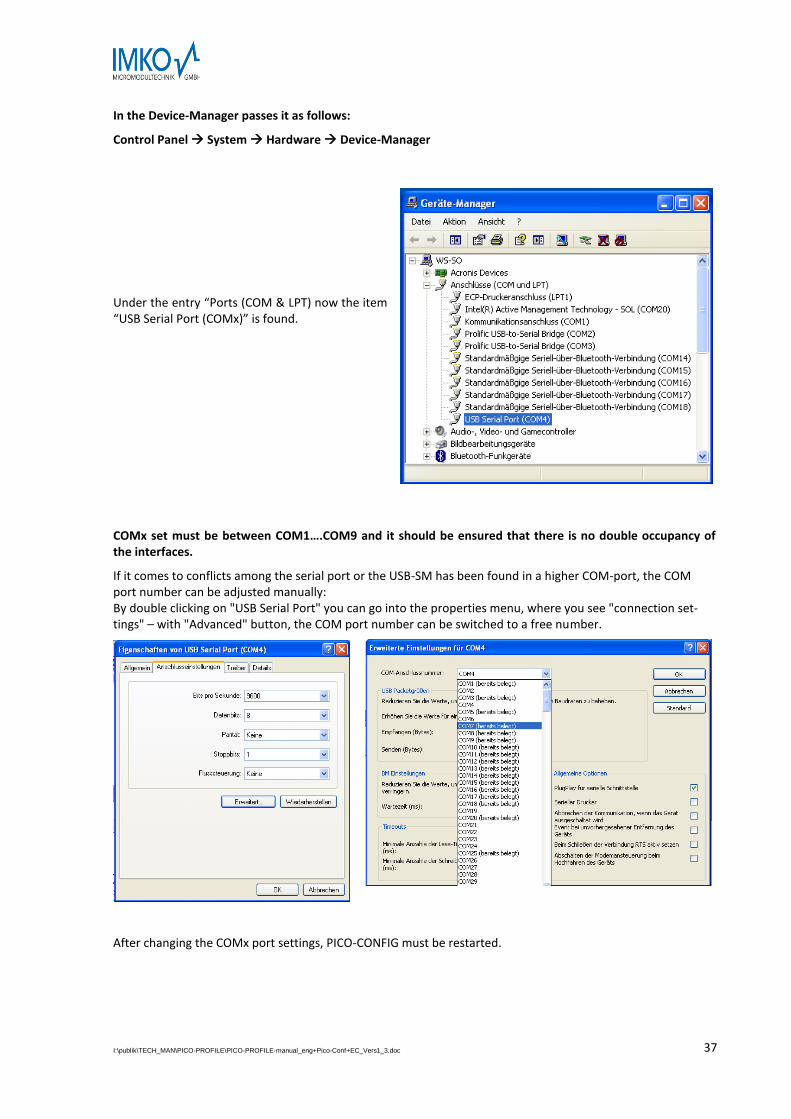
In the Device-Manager passes it as follows:
Control Panel System Hardware Device-Manager
Under the entry “Ports (COM & LPT) now the item “USB Serial Port (COMx)” is found.
COMx set must be between COM1….COM9 and it should be ensured that there is no double occupancy of the interfaces.
If it comes to conflicts among the serial port or the USB-SM has been found in a higher COM-port, the COM port number can be adjusted manually: By double clicking on "USB Serial Port" you can go into the properties menu, where you see "connection set-tings" – with "Advanced" button, the COM port number can be switched to a free number.
After changing the COMx port settings, PICO-CONFIG must be restarted.
I:\publik\TECH_MAN\PICO-PROFILE\PICO-PROFILE-manual_eng+Pico-Conf+EC_Vers1_3.doc
38
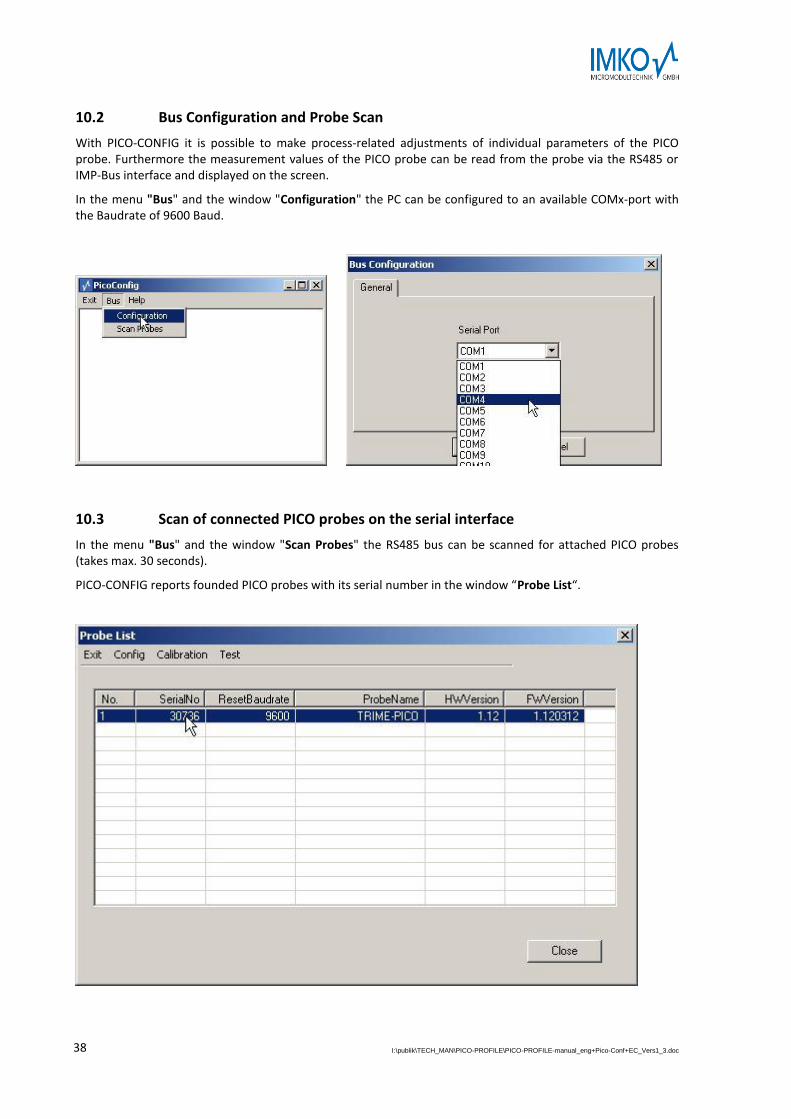
10.2 Bus Configuration and Probe Scan
With PICO-CONFIG it is possible to make process-related adjustments of individual parameters of the PICO probe. Furthermore the measurement values of the PICO probe can be read from the probe via the RS485 or IMP-Bus interface and displayed on the screen.
In the menu "Bus" and the window "Configuration" the PC can be configured to an available COMx-port with the Baudrate of 9600 Baud.
10.3 Scan of connected PICO probes on the serial interface
In the menu "Bus" and the window "Scan Probes" the RS485 bus can be scanned for attached PICO probes (takes max. 30 seconds).
PICO-CONFIG reports founded PICO probes with its serial number in the window “Probe List“.
I:\publik\TECH_MAN\PICO-PROFILE\PICO-PROFILE-manual_eng+Pico-Conf+EC_Vers1_3.doc
39
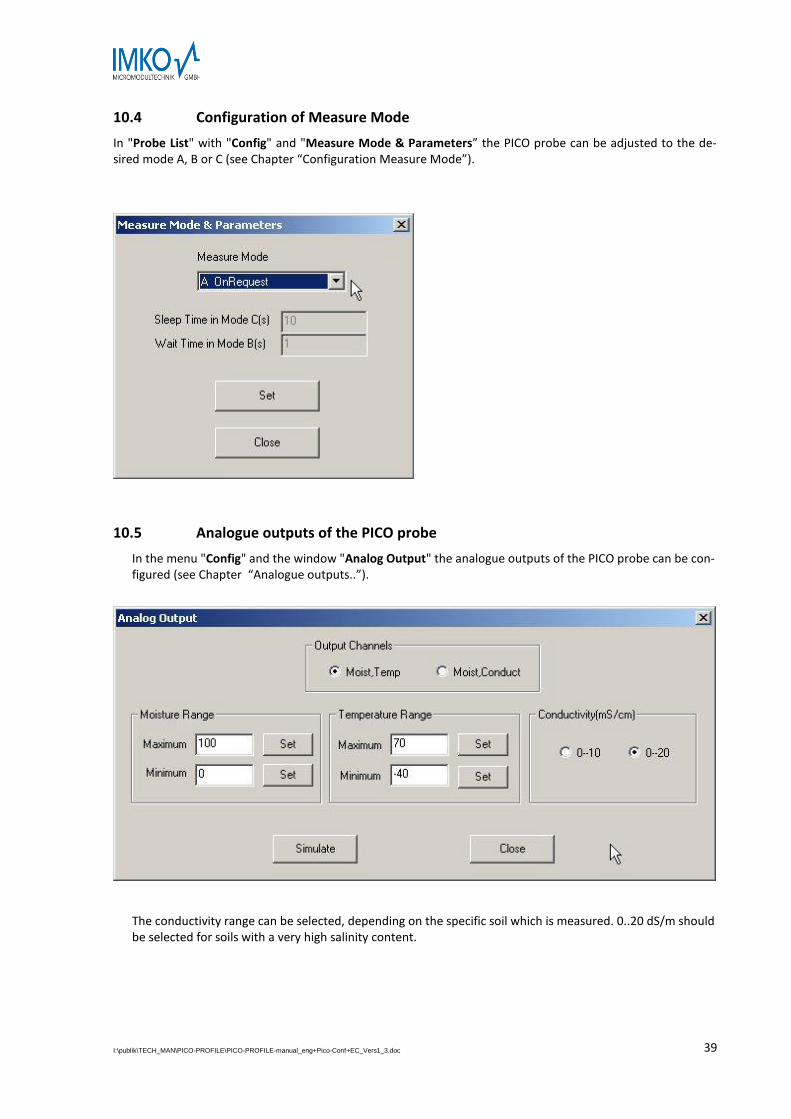
10.4 Configuration of Measure Mode
In "Probe List" with "Config" and "Measure Mode & Parameters” the PICO probe can be adjusted to the de-sired mode A, B or C (see Chapter “Configuration Measure Mode”).
10.5 Analogue outputs of the PICO probe
In the menu "Config" and the window "Analog Output" the analogue outputs of the PICO probe can be con-figured (see Chapter “Analogue outputs..”).
The conductivity range can be selected, depending on the specific soil which is measured. 0..20 dS/m should be selected for soils with a very high salinity content.
I:\publik\TECH_MAN\PICO-PROFILE\PICO-PROFILE-manual_eng+Pico-Conf+EC_Vers1_3.doc
40
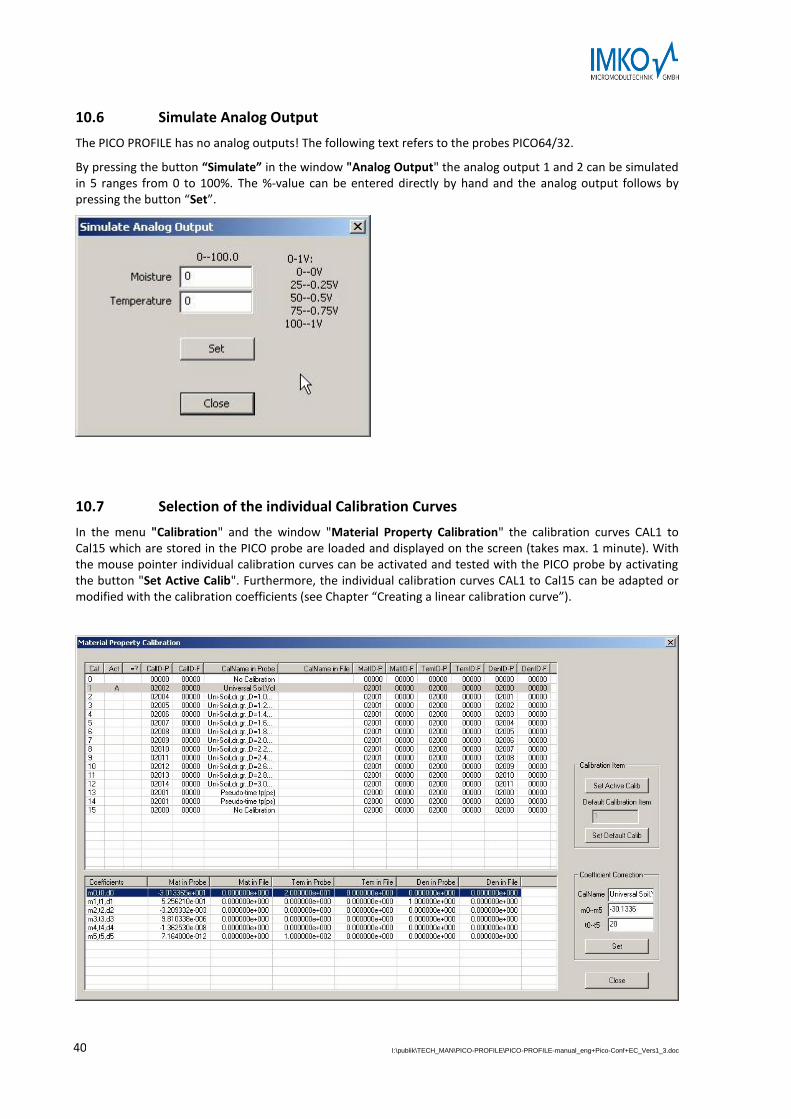
10.6 Simulate Analog Output
The PICO PROFILE has no analog outputs! The following text refers to the probes PICO64/32.
By pressing the button “Simulate” in the window "Analog Output" the analog output 1 and 2 can be simulated in 5 ranges from 0 to 100%. The %-value can be entered directly by hand and the analog output follows by pressing the button “Set”.
10.7 Selection of the individual Calibration Curves
In the menu "Calibration" and the window "Material Property Calibration" the calibration curves CAL1 to Cal15 which are stored in the PICO probe are loaded and displayed on the screen (takes max. 1 minute). With the mouse pointer individual calibration curves can be activated and tested with the PICO probe by activating the button "Set Active Calib". Furthermore, the individual calibration curves CAL1 to Cal15 can be adapted or modified with the calibration coefficients (see Chapter “Creating a linear calibration curve”).
I:\publik\TECH_MAN\PICO-PROFILE\PICO-PROFILE-manual_eng+Pico-Conf+EC_Vers1_3.doc
41
The desired and possibly altered calibration curve (Cal1. .15) which is activated after switching on the probes power supply can be adjusted with the button "Set Default Calib”.
The coefficients m1 = 0.0581 and m0 = -4.05 for individual calibration curves can be entered and adjusted di-rectly by hand and are stored in the probe by pressing the “Set” button.
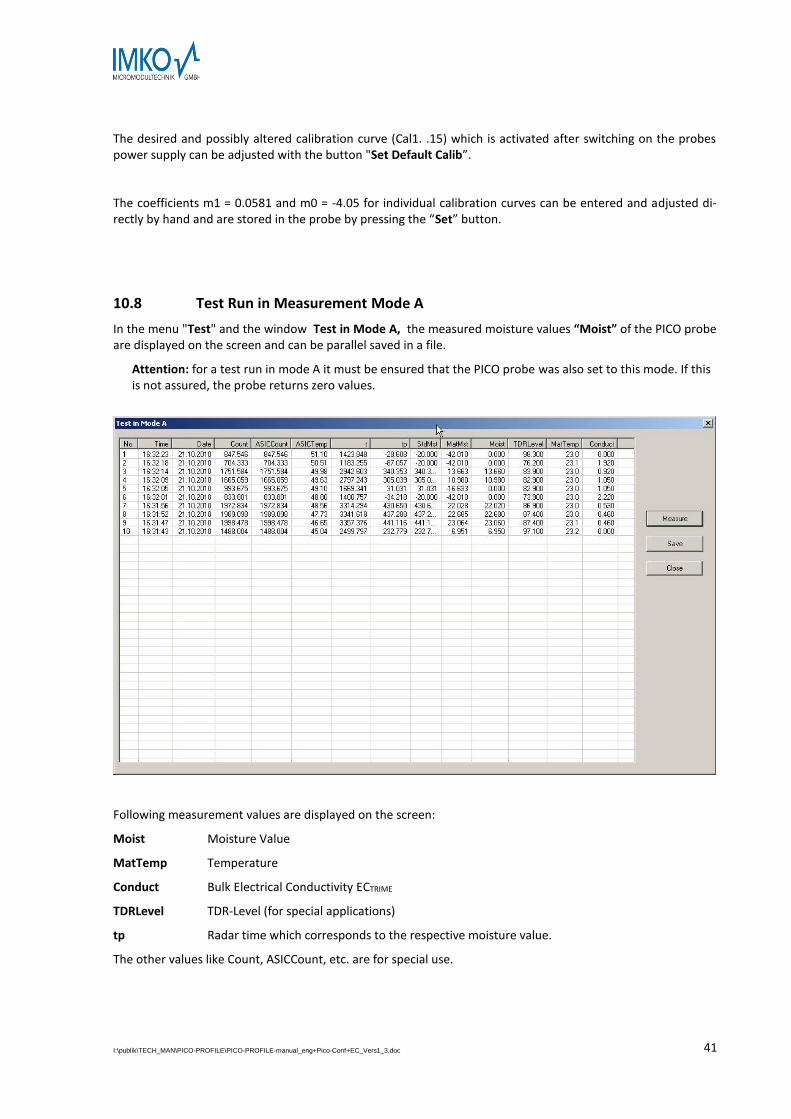
10.8 Test Run in Measurement Mode A
In the menu "Test" and the window Test in Mode A, the measured moisture values “Moist” of the PICO probe are displayed on the screen and can be parallel saved in a file.
Attention: for a test run in mode A it must be ensured that the PICO probe was also set to this mode. If this is not assured, the probe returns zero values.
Following measurement values are displayed on the screen:
Moist Moisture Value
MatTemp Temperature
Conduct Bulk Electrical Conductivity ECTRIME
TDRLevel TDR-Level (for special applications)
tp Radar time which corresponds to the respective moisture value.
The other values like Count, ASICCount, etc. are for special use.

I:\publik\TECH_MAN\PICO-PROFILE\PICO-PROFILE-manual_eng+Pico-Conf+EC_Vers1_3.doc
42
By clicking „Save“ the recorded data is saved in a text file in the following path: \PICO-CONFIG.exe-Pfad\MD\Dateiname
The name of the text file TestMeas+SN+yyyymmddHHMMSS.sts is assigned automatically with the serial number of the probe (SN) and date and time.
The data in the text file can be evaluated with Windows-EXCEL.
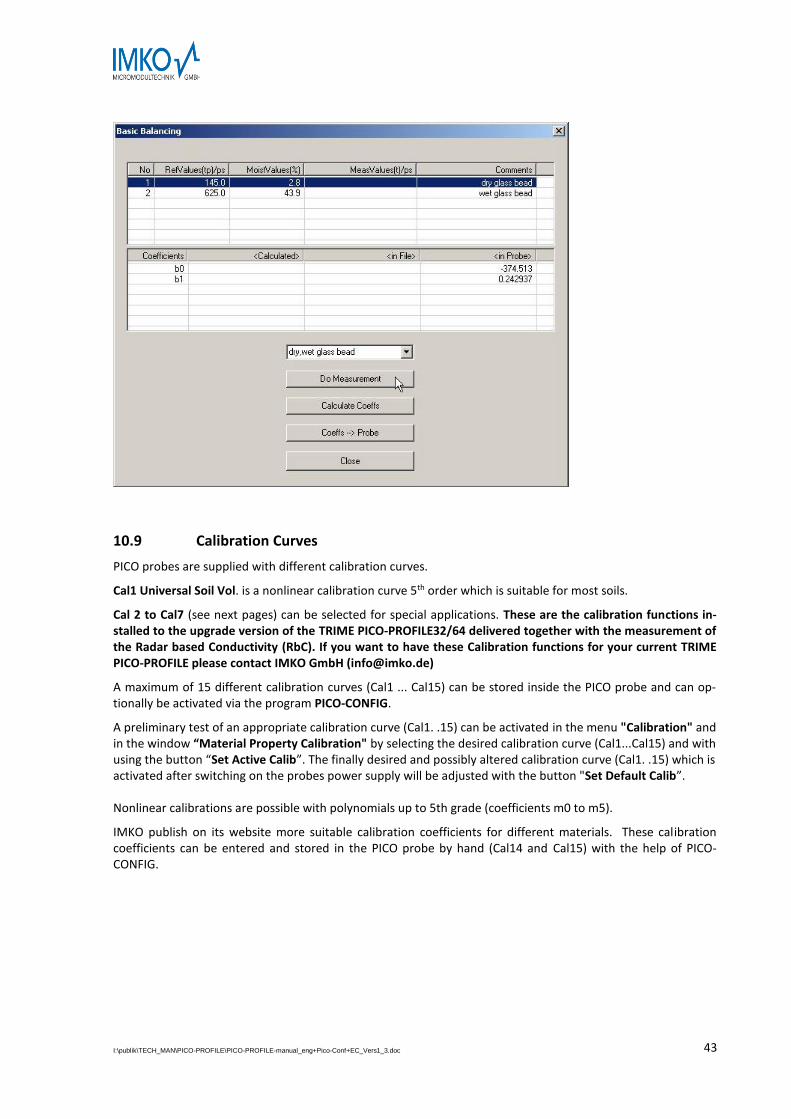
Basic Balancing in Glass Beads
PICO probes are identical and manufactured precisely. After an exchange of a probe rod it is nevertheless ad-visable to verify the calibration and to check the basic calibration and if necessary to correct it with a “Basic Balancing”.
With a “Basic Balancing” two reference calibration measurements are to be carried out with known set-points ("RefValues"). For the reference media, dry and wet glass beads should be used. Attention: Before performing a “Basic Balancing” it must be ensured that the PICO probe was set to “Measure Mode” A. If this is not assured, the probe returns zero values. After a “Basic Balancing” the PICO probe has to be set to “Measure Mode” B or C again.
In the menu "Calibration" and the window "Basic Balancing" the two set-point values of the radar time tp are displayed with 145ps and 625ps.
Reference set-point A: tp=145ps in dry glass beads. The first set-point can be activated with the mouse pointer by clicking to No.1. By activating the button "Do Measurement" the PICO probe determines the first reference set-point in dry glass beads. In the column „MeasValues“ the measured raw value of the radar time t is displayed.
Reference set-point B: tp=625ps in wet glass beads. The PICO probe head has to be completely covered with wet glass beads. The second set-point can be activated with the mouse pointer by clicking to No.2. By activating the button "Do Measurement" the PICO probe determines the second reference set-point in wet glass beads. In the column „MeasValues“ the measured raw value of the radar time t is also displayed.
By activating the button „Calculate Coeffs“ and „Coeffs Probe“ the alignment data is calculated automatical-ly and is stored in the PICO probe non-volatile. With a “Test run” (in Mode A) the radar time tp of the PICO probe should be now 145ps in dry and 625ps in wet glass beads.
I:\publik\TECH_MAN\PICO-PROFILE\PICO-PROFILE-manual_eng+Pico-Conf+EC_Vers1_3.doc
43
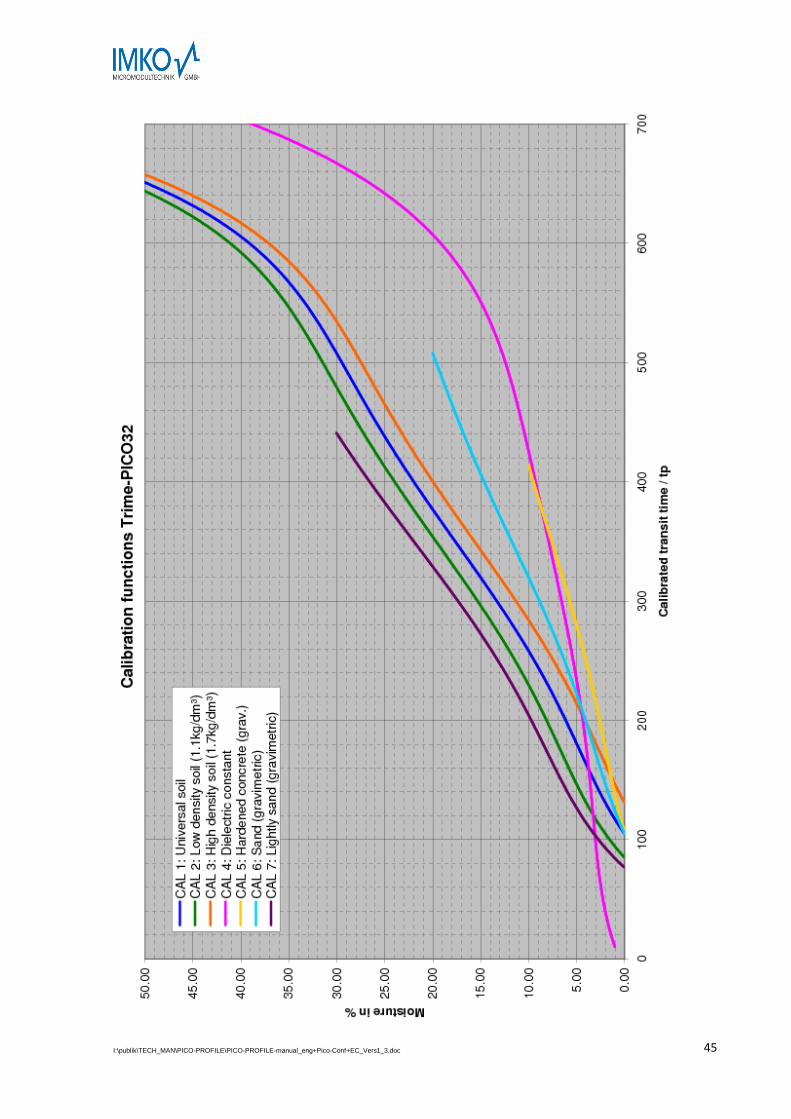
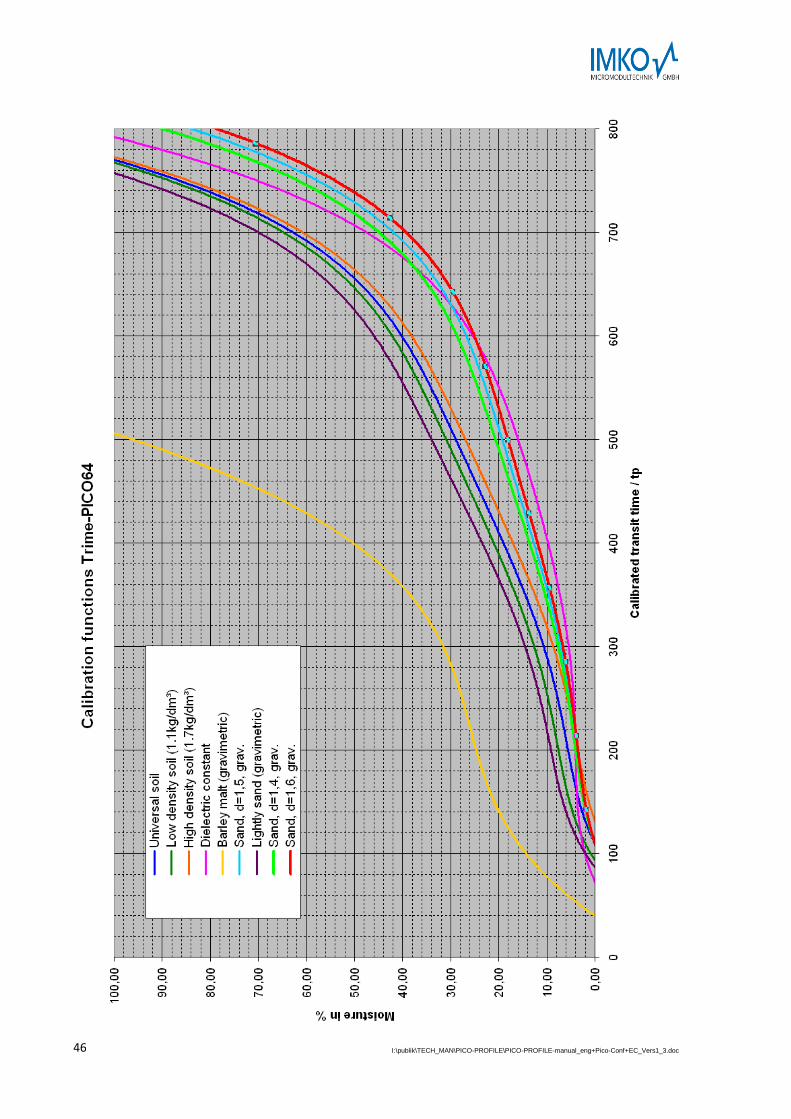
10.9 Calibration Curves
PICO probes are supplied with different calibration curves.
Cal1 Universal Soil Vol. is a nonlinear calibration curve 5th order which is suitable for most soils.
Cal 2 to Cal7 (see next pages) can be selected for special applications. These are the calibration functions in-stalled to the upgrade version of the TRIME PICO-PROFILE32/64 delivered together with the measurement of the Radar based Conductivity (RbC). If you want to have these Calibration functions for your current TRIME PICO-PROFILE please contact IMKO GmbH ([email protected])
A maximum of 15 different calibration curves (Cal1 ... Cal15) can be stored inside the PICO probe and can op-tionally be activated via the program PICO-CONFIG.
A preliminary test of an appropriate calibration curve (Cal1. .15) can be activated in the menu "Calibration" and in the window “Material Property Calibration" by selecting the desired calibration curve (Cal1...Cal15) and with using the button “Set Active Calib”. The finally desired and possibly altered calibration curve (Cal1. .15) which is activated after switching on the probes power supply will be adjusted with the button "Set Default Calib”. Nonlinear calibrations are possible with polynomials up to 5th grade (coefficients m0 to m5).
IMKO publish on its website more suitable calibration coefficients for different materials. These calibration coefficients can be entered and stored in the PICO probe by hand (Cal14 and Cal15) with the help of PICO-CONFIG.

I:\publik\TECH_MAN\PICO-PROFILE\PICO-PROFILE-manual_eng+Pico-Conf+EC_Vers1_3.doc
44
Next page: The following charts (Cal.1 .. 15) show different selectable calibration curves which are stored inside the PICO probe. On the y-axis the gravimetric moisture Moist (or Dielectric-Constant Epsilon) is shown. On the x-axis depend-ing on the calibration curve the associated radar time tp in picoseconds is shown. With the software PICO-CONFIG the radar time tp is shown on the screen parallel to the moisture value Moist.
I:\publik\TECH_MAN\PICO-PROFILE\PICO-PROFILE-manual_eng+Pico-Conf+EC_Vers1_3.doc
45
I:\publik\TECH_MAN\PICO-PROFILE\PICO-PROFILE-manual_eng+Pico-Conf+EC_Vers1_3.doc
46
I:\publik\TECH_MAN\PICO-PROFILE\PICO-PROFILE-manual_eng+Pico-Conf+EC_Vers1_3.doc
47
10.10 Creating a linear Calibration Curve for a specific Material
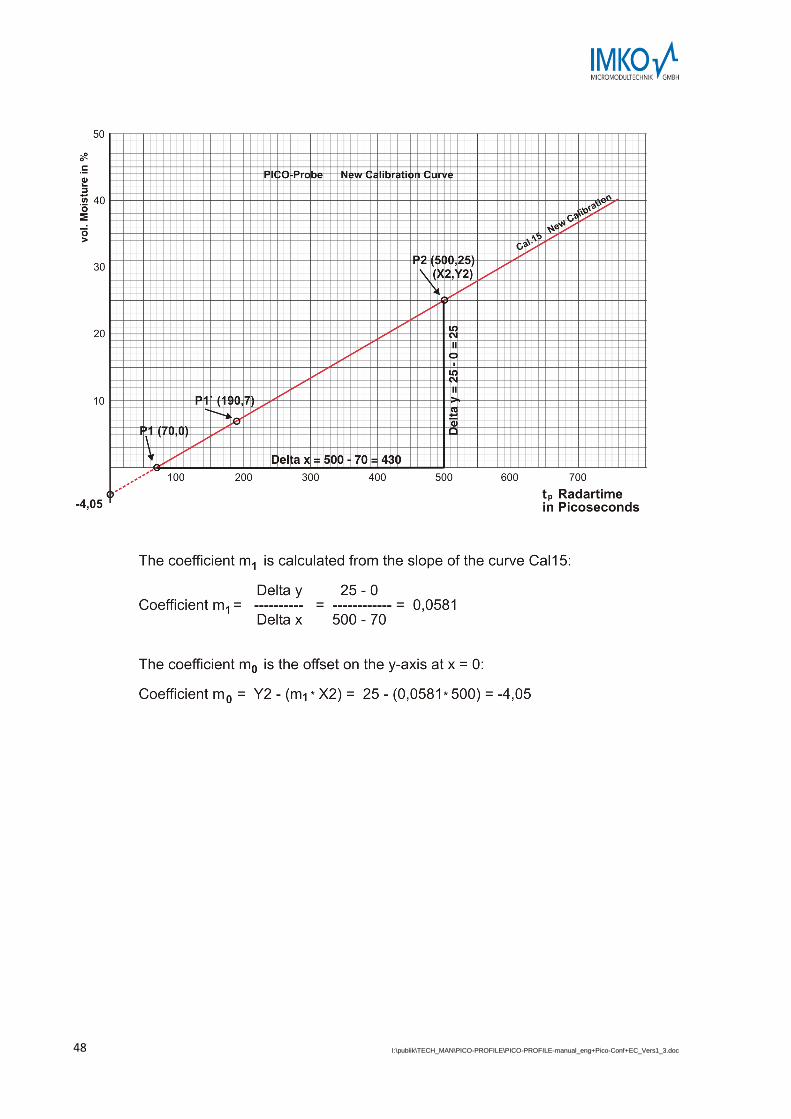
The calibration curves Cal1 to Cal15 can be easily created or adapted for a specific soil with the help of PICO-CONFIG. Therefore, two measurement points need to be identified with the probe. Point P1 at dried soil and point P2 at moist soil where the points P1 and P2 should be far enough apart to get a best possible calibration curve. The moisture content of the soil at point P1 and P2 can be determined with laboratory measurement methods (oven drying). It is to consider that sufficient material is measured to get a representative value.
Under the menu "Calibration" and the window "Material Property Calibration" the calibration curves CAL1 to Cal15 which are stored in the PICO probe are loaded and displayed on the screen (takes max. 1 minute). With the mouse pointer individual calibration curves can be tested with the PICO-probe by activating the button "Set Active Calib". The measurement of the moisture value Moist with the associated radar time tp at point P1 and P2 is started using the program PICO-CONFIG in the sub menu "Test" and "Test in Mode A".
Step 1: The radar pulse time tp of the probe is measured with dried soil. It is recommended to detect multiple measurement values for finding a best average value for tp. The result is the first calibration point P1 (e.g. 70/0). I.e. 70ps (picoseconds) of the radar pulse time tp corresponds to 0% moisture content of the material. But it would be also possible to use a higher point P1´ (e.g. 190/7) where a tp of 190ps corresponds to a mois-ture content of 7%. The gravimetric or volumetric moisture content of the material, e.g. 7% has to be deter-mined with laboratory measurement methods (oven drying). Step 2: The radar pulse time tp of the probe is measured with moist material. Again, it is recommended to detect multiple measurement values of tp for finding a best average value. The result is the second calibration point P2 with X2/Y2 (e.g. 500/25). I.e. tp of 500ps corresponds to 25% moisture content. The gravimetric or volumetric moisture content of the material, e.g. 25% has to be determined with laboratory measurement methods (oven drying). Step 3: With the two calibration points P1 and P2, the calibration coefficients m0 and m1 can be determined for the specific soil (see next page).
Step 4: The coefficients m1 = 0.0581 and m0 = -4.05 (see next page) for the calibration curve Cal15 can be en-tered directly by hand and are stored in the probe by pressing the button “Set”. The name of the calibration curve can also be entered by hand. The selected calibration curve (e.g. Cal15) which is activated after switching on the probes power supply will be adjusted with the button "Set Default Calib”.
Attention: Use “dot” as separator (0.0581), not comma !
10.11 Nonlinear calibration curves
PICO probes can also work with non-linear calibration curves with polynomials up to 5th grade. Therefore it is necessary to calibrate with 4…8 different calibration points. To calculate nonlinear coefficients for polynomials up to 5th grade, the software tool TRIME-WinCal from IMKO can be used (on request). It is also possible to use any mathematical program like MATLAB for finding a best possible nonlinear calibration curve with suitable coefficient parameters m0 to m5.
The following diagram shows a sample calculation for a linear calibration curve with the coefficients m0 and m1 for a specific soil or material.
I:\publik\TECH_MAN\PICO-PROFILE\PICO-PROFILE-manual_eng+Pico-Conf+EC_Vers1_3.doc
48
I:\publik\TECH_MAN\PICO-PROFILE\PICO-PROFILE-manual_eng+Pico-Conf+EC_Vers1_3.doc
49
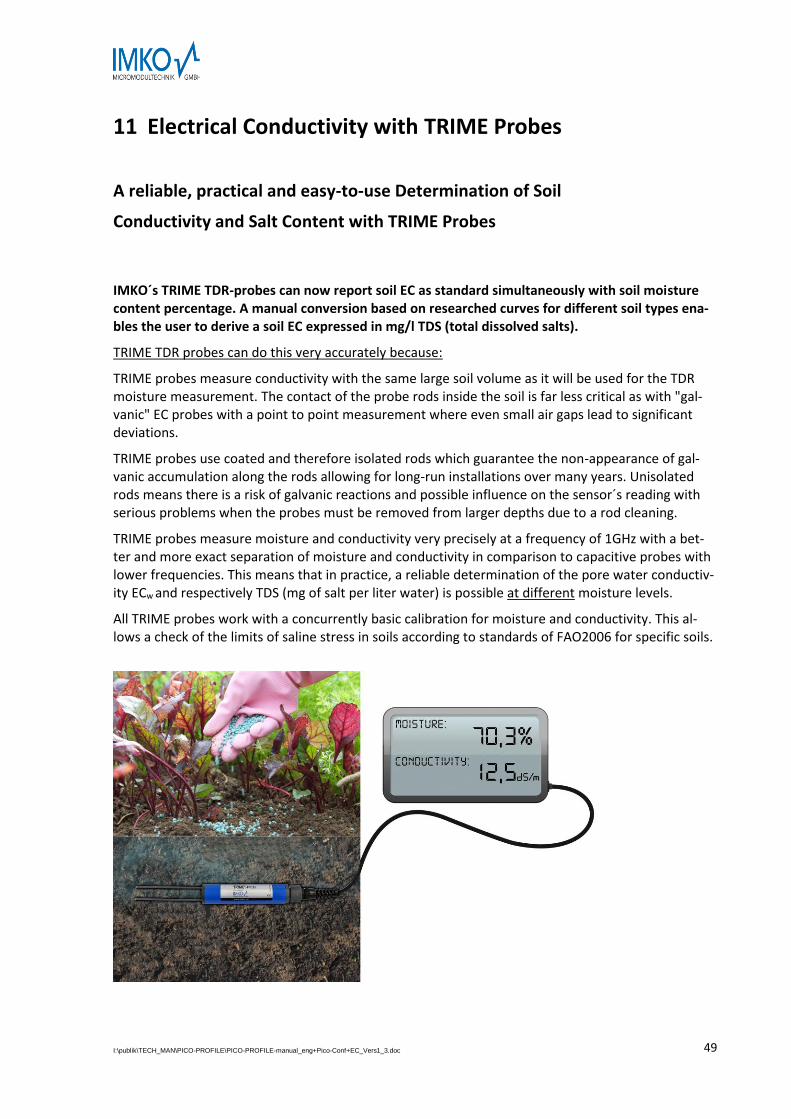
11 Electrical Conductivity with TRIME Probes
A reliable, practical and easy-to-use Determination of Soil
Conductivity and Salt Content with TRIME Probes
IMKO´s TRIME TDR-probes can now report soil EC as standard simultaneously with soil moisture content percentage. A manual conversion based on researched curves for different soil types ena-bles the user to derive a soil EC expressed in mg/l TDS (total dissolved salts).
TRIME TDR probes can do this very accurately because:
TRIME probes measure conductivity with the same large soil volume as it will be used for the TDR moisture measurement. The contact of the probe rods inside the soil is far less critical as with "gal-vanic" EC probes with a point to point measurement where even small air gaps lead to significant deviations.
TRIME probes use coated and therefore isolated rods which guarantee the non-appearance of gal-vanic accumulation along the rods allowing for long-run installations over many years. Unisolated rods means there is a risk of galvanic reactions and possible influence on the sensor´s reading with serious problems when the probes must be removed from larger depths due to a rod cleaning.
TRIME probes measure moisture and conductivity very precisely at a frequency of 1GHz with a bet-ter and more exact separation of moisture and conductivity in comparison to capacitive probes with lower frequencies. This means that in practice, a reliable determination of the pore water conductiv-ity ECw and respectively TDS (mg of salt per liter water) is possible at different moisture levels.
All TRIME probes work with a concurrently basic calibration for moisture and conductivity. This al-lows a check of the limits of saline stress in soils according to standards of FAO2006 for specific soils.
I:\publik\TECH_MAN\PICO-PROFILE\PICO-PROFILE-manual_eng+Pico-Conf+EC_Vers1_3.doc
50
11.1 The analysis of Soils for Electrical Conductivity ECTRIME
Notes and Disclaimer: The analysis of electrical conductivity is an immensely complex subject. This resume is not intended as a study document in soil science nor does it discuss the technical complexities of the devices used. For agricultural and horticultural soils, the measurement of Electrical Conductivity is an immensely important measurement. Electrical Conductivity measures the amount of total dissolved salts (TDS) or total dissolved ions in water. To complicate matters, some ions such as Sodium and Chloride will contribute more to EC than oth-ers such as Phosphorus and Potassium. Plants require nutrients such as Nitrogen, Phosphorus, Potassium, Magnesium in large quantities hence they are called major nutrients and also smaller amounts of elements such as Iron, Manganese , Molybdenum and these are called micro nutrients or sometimes referred to as trace metals. Fertilisers are supplied to plants as compounds for example Ammonium Nitrate which supplies Nitrogen in the form of Nitrate or Ammonium. Micro-organisms will break down these compounds so they are more readily available for uptake by the plants. Levels of some ions such as Chlorides are less desirable and in great quantities can be harmful to plant growth. The quantity of ions or salts in a soil is of huge importance. Too much or too few nutrients will create a re-striction in plant growth.
Measurement of EC in water is relatively straightforward. An EC probe (usually platinum) is inserted in the wa-ter and a reading in mS/cm is reported on the meter’s display. This is relatively easy because water is a homog-enous medium. Soil on the other hand is not and this has caused great difficulties when trying to measure its conductivity. To work around this, the analysis on agricultural and horticultural soils has been carried out by mixing a volume of soil and a volume of water and measuring the EC on the suspension or filtered extract. Dif-ferent countries and different regulatory bodies have specified methodologies and in general results have been good enough to use for fertilisation recommendations and programmes. This analysis was generally carried out by a laboratory and whereas results were and are reliable the method is slow, time consuming and expensive. Over the years manufacturers have tried to come up with solutions whereby an instrument could be used di-rectly in soils without having to resort to laboratories. The EC reported by these instruments is referred to soil bulk electrical conductivity. Whereas there has been some success, there are so many influential variables such as temperature, soil moisture and granular composition that results have not been adequate for reliable fertili-sation studies. Mostly soil bulk conductivity was of academic rather than practical interest.
IMKO has studied the subject in detail and has come up with a breakthrough. By using coated rods and meas-uring over the length of the probes, all TRIME probes can now accurately report what IMKO calls ECTRIME. This measurement takes account of soil moisture and conductivity by volume. Because soil moisture is so important in the calculation of EC, all different TRIME probes now incorporate TDR calibration curves for a selection of soils. Special graphs have been constructed so that the user can convert the ECTRIME reading to grams/litre of dissolved salt. So far curves are available for sandy and loam soils and it is intended to produce a handful of curves to cover most situations. At this moment in time, conversion of ECTRIME to mg/l TDS is done manually. IMKO hopes that this breakthrough whereby a TDR instrument can be used to derive a true soil EC measure-ment will become the new standard for soil fertilisation analyses.
11.2 ECTRIME Measurement Range for TRIME Probes
All PICO probes work with a concurrently basic calibration for moisture and conductivity. This allows a check of the limits of saline soils according to standards of FAO2006 for specific soils.
Measurement Range Conductivity for PICO64, PICO32, T3-IPH, PICO-PROFILE
0…10dS/m ECTRIME (here is, depending on moisture content ECw >20dS/m)

I:\publik\TECH_MAN\PICO-PROFILE\PICO-PROFILE-manual_eng+Pico-Conf+EC_Vers1_3.doc
51
All TRIME probes have a linear ECTRIME calibration curve with two calibration points. This ensures an equal be-haviour of a TRIME probe type (e.g. PICO32).
Calibration Point1: Dry glass beads = 0dS/m ECTRIME
Calibration Point2: Saturated glass beads with water ECw 5dS/m = 5dS/m ECTRIME
With dry glass beads (not air!) it is ensured that the conductivity range of dry soils starts with nearly 0dS/m. The calibration at point2 was performed with glass beads and water which was adjusted with salt to a pore water conductivity of ECw = 5dS/m at a temperature of 23°C.
11.3 Measurement of Pore-Water-Conductivity or Salt-Content of Soils
The possible salt stress depends on soil type and plant species and can be roughly classified: Slight salinization: 1-3g of salt per liter Average salinity: 3-5g salt / liter Strong salinity: 5-10g salt / liter Very high salinity: > 10 g salt / liter
The conversion of the salt content in grams of salt per liter water (TDS Total-Dissolved-Salts) into the pore wa-ter conductivity of ECw happens with: Salt content in grams of salt per liter of water TDS = 0.64 * ECw An ECw = 5mS/cm result thus with 3.2 grams of salt per liter (pore) water ECw can be determined with a laboratory conductivity meter. 1dS/m = 1mS/cm
A determination of the pore water conductivity or salinity of soils and sand at different moisture values is pos-sible by using a Moisture/ ECTRIME diagram for the PICO32 or PICO64. With measuring moisture and ECTRIME , the pore water conductivity (or TDS salt content in grams salt per liter) of the soil can be determined by using the individual pore water water curves.
The below displayed Moisture/ ECTRIME charts were created for sand and a loamy soil.
We recommend the creation of a separate Moisture/ ECTRIME diagram for the intended soil in the designated ranges of salinity.
I:\publik\TECH_MAN\PICO-PROFILE\PICO-PROFILE-manual_eng+Pico-Conf+EC_Vers1_3.doc
52
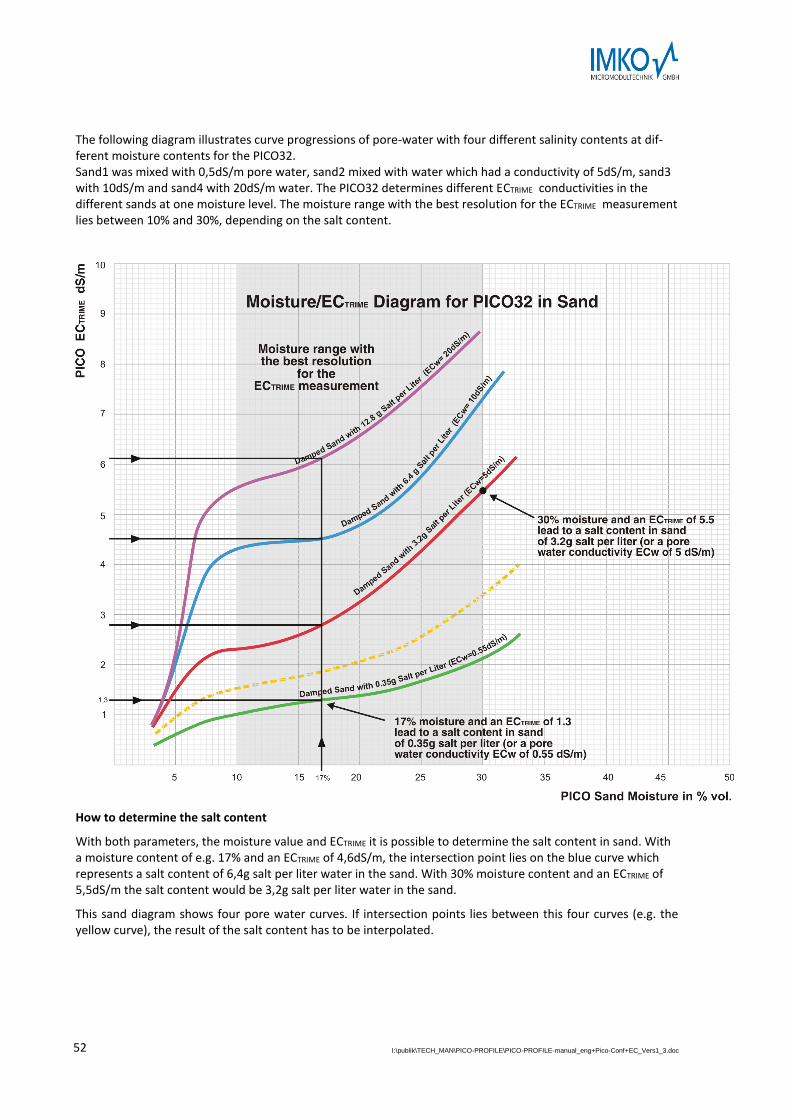
The following diagram illustrates curve progressions of pore-water with four different salinity contents at dif-ferent moisture contents for the PICO32. Sand1 was mixed with 0,5dS/m pore water, sand2 mixed with water which had a conductivity of 5dS/m, sand3 with 10dS/m and sand4 with 20dS/m water. The PICO32 determines different ECTRIME conductivities in the different sands at one moisture level. The moisture range with the best resolution for the ECTRIME measurement lies between 10% and 30%, depending on the salt content.
How to determine the salt content
With both parameters, the moisture value and ECTRIME it is possible to determine the salt content in sand. With a moisture content of e.g. 17% and an ECTRIME of 4,6dS/m, the intersection point lies on the blue curve which represents a salt content of 6,4g salt per liter water in the sand. With 30% moisture content and an ECTRIME of 5,5dS/m the salt content would be 3,2g salt per liter water in the sand.
This sand diagram shows four pore water curves. If intersection points lies between this four curves (e.g. the yellow curve), the result of the salt content has to be interpolated.
I:\publik\TECH_MAN\PICO-PROFILE\PICO-PROFILE-manual_eng+Pico-Conf+EC_Vers1_3.doc
53
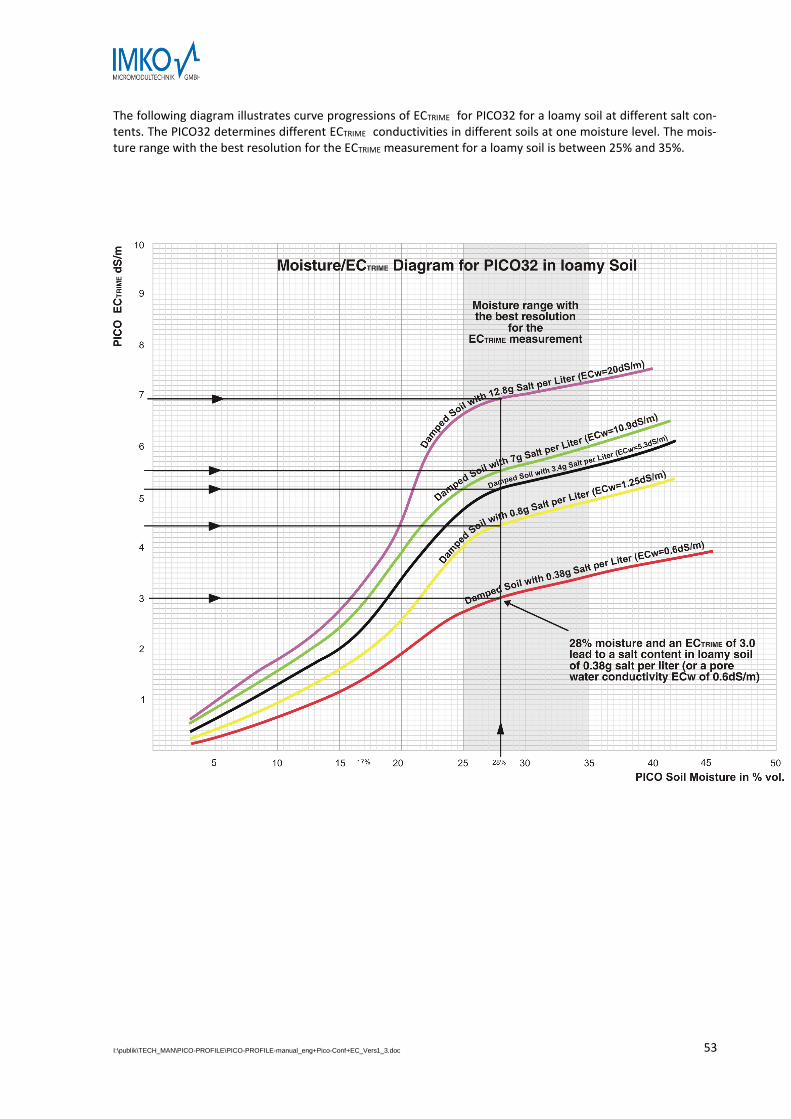
The following diagram illustrates curve progressions of ECTRIME for PICO32 for a loamy soil at different salt con-tents. The PICO32 determines different ECTRIME conductivities in different soils at one moisture level. The mois-ture range with the best resolution for the ECTRIME measurement for a loamy soil is between 25% and 35%.

I:\publik\TECH_MAN\PICO-PROFILE\PICO-PROFILE-manual_eng+Pico-Conf+EC_Vers1_3.doc
54
11.4 Creation of a Moisture/ ECTRIME Diagram for a particular Soil
The following description shows a possible way to create a Moisture/ ECTRIME diagram for a particular soil:
Take a soil sample and determine the salt content with a laboratory method. (e.g. determine ECw of the soil/water saturation extract).
Dry the soil sample to 0% moisture. Cut it into small pieces and grind the soil so that it can be moistened by hand as evenly as possible (eg with a water spray pump).
Moisten the soil evenly with a pore water solution for example 2.56g of salt per liter (equivalent to ECw= 4dS/m) to the first measurement point (e.g 2.5% moisture). Take into account, that the soil already contains salt. I.e. were already 1g of salt per liter in the soil, you put a curve for a pore water conductivity record of 2.56 g + 1g salt = 3.56g per liter (ECw= 5.5 dS/m). Compact the soil in a plastic bowl (no metal and not too small!) so that it largely corresponds to the natural density. Concerning the insertion of the PICO-probe rods for measurement, it is recommended to perform sev-eral measurements per point in order to form an average value for each moisture and ECTRIME value. It is im-portant to ensure that the measuring field is not disturbed around the rods, eg by previous punctures.
Moisten the soil more, as homogeneous as possible with the pore water solution ECw= 4dS/m to eg 5% mois-ture. Again compact the soil in a plastic bowl so that it largely corresponds to the natural density. Concerning the insertion of the PICO-probe rods for measurement, it is recommended to perform several measurements per point in order to form an average value for each moisture and ECTRIME value. It is important to ensure that the measuring field is not disturbed around the rods, eg by previous punctures.
Take more moisture and ECTRIME values, up to soil saturation.
Create the pore-water curve for example for 3.56g salt/liter (ECw=5.5dS/m) with the added moisture and ECTRIME values.
Take up several curves for different pore water contents.
If the soil sample is already too heavily loaded with salt, a washing out of the ions would be possible, but with-out the lost of the fine fraction. After a subsequent drying and crushing of the soil, the Moisture/ ECTRIME dia-gram can be established with a lower salt content. It is also possible to use distilled water for obtaining the lowest curve.
Note: The effort for a Moisture/ ECTRIME diagram is not negligible. IMKO has the hope to establish with the ECTRIME process an easier, faster, better and generally accepted determination of the salt contamination of soils. In future IMKO plans to provide or publish different Moisture/ ECTRIME curves for standard soils. We ex-pect to cover nearly most soils with about 4-5 diagrams.
I:\publik\TECH_MAN\PICO-PROFILE\PICO-PROFILE-manual_eng+Pico-Conf+EC_Vers1_3.doc
55
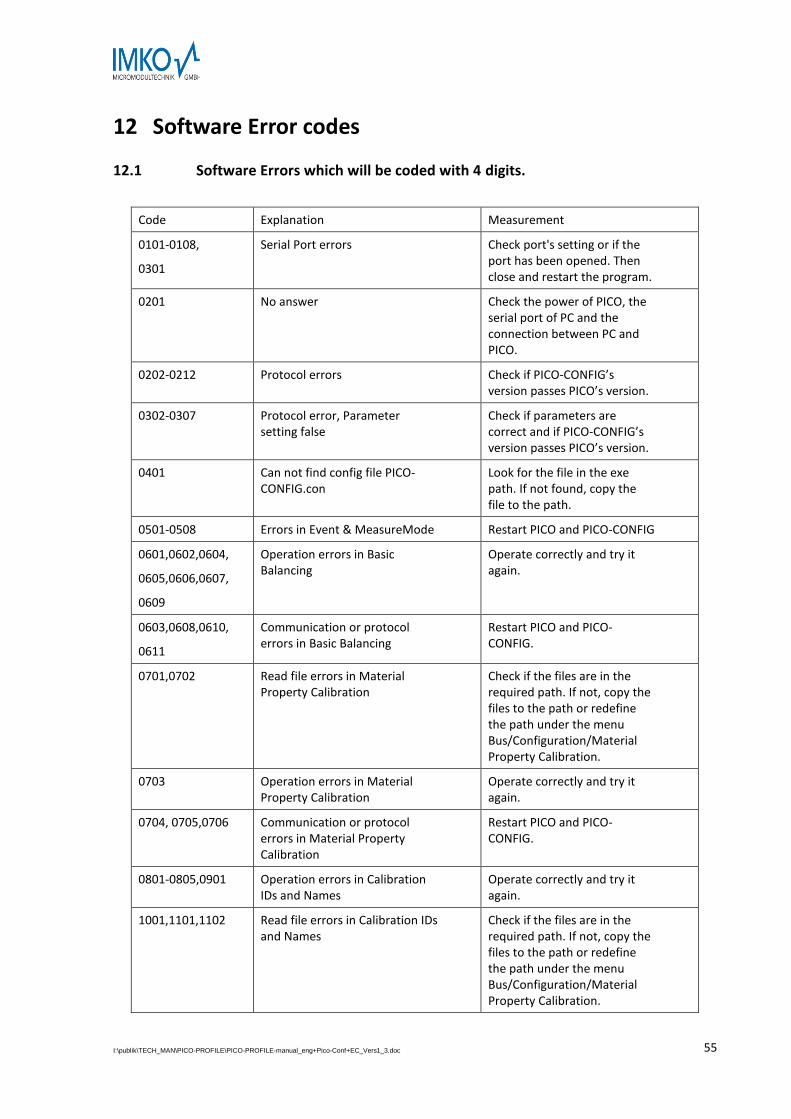
12 Software Error codes
12.1 Software Errors which will be coded with 4 digits.
Code Explanation Measurement
0101-0108,
0301
Serial Port errors Check port's setting or if the port has been opened. Then close and restart the program.
0201 No answer Check the power of PICO, the serial port of PC and the connection between PC and PICO.
0202-0212 Protocol errors Check if PICO-CONFIG’s version passes PICO’s version.
0302-0307 Protocol error, Parameter setting false
Check if parameters are correct and if PICO-CONFIG’s version passes PICO’s version.
0401 Can not find config file PICO-CONFIG.con
Look for the file in the exe path. If not found, copy the file to the path.
0501-0508 Errors in Event & MeasureMode Restart PICO and PICO-CONFIG
0601,0602,0604,
0605,0606,0607,
0609
Operation errors in Basic Balancing
Operate correctly and try it again.
0603,0608,0610,
0611
Communication or protocol errors in Basic Balancing
Restart PICO and PICO-CONFIG.
0701,0702 Read file errors in Material Property Calibration
Check if the files are in the required path. If not, copy the files to the path or redefine the path under the menu Bus/Configuration/Material Property Calibration.
0703 Operation errors in Material Property Calibration
Operate correctly and try it again.
0704, 0705,0706 Communication or protocol errors in Material Property Calibration
Restart PICO and PICO-CONFIG.
0801-0805,0901 Operation errors in Calibration IDs and Names
Operate correctly and try it again.
1001,1101,1102 Read file errors in Calibration IDs and Names
Check if the files are in the required path. If not, copy the files to the path or redefine the path under the menu Bus/Configuration/Material Property Calibration.

I:\publik\TECH_MAN\PICO-PROFILE\PICO-PROFILE-manual_eng+Pico-Conf+EC_Vers1_3.doc
56
1201, 1203 Operation errors in Test Operate correctly and try it again.
1202 Communication or protocol errors in Test
Restart PICO and PICO-CONFIG.
1301 Write file error in Test Check file path and try it again. If failed, restart PICO-CONFIG.
4001-4002,
4101-4106,4201
Read file or write file errors Check the files and try again.
4301-4303 Intenal calculating errors Restart PICO-CONFIG and try again.Otherwise contact IMKO.
I:\publik\TECH_MAN\PICO-PROFILE\PICO-PROFILE-manual_eng+Pico-Conf+EC_Vers1_3.doc
57
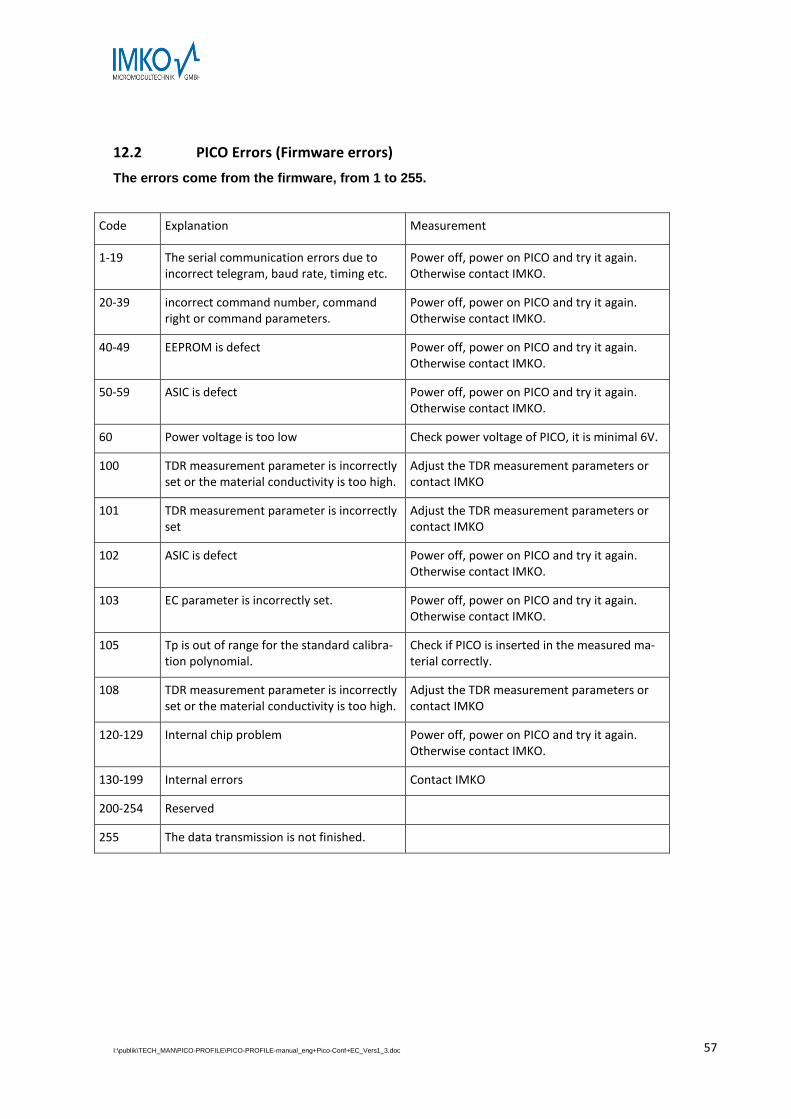
12.2 PICO Errors (Firmware errors)
The errors come from the firmware, from 1 to 255.
Code Explanation Measurement
1-19 The serial communication errors due to incorrect telegram, baud rate, timing etc.
Power off, power on PICO and try it again. Otherwise contact IMKO.
20-39 incorrect command number, command right or command parameters.
Power off, power on PICO and try it again. Otherwise contact IMKO.
40-49 EEPROM is defect Power off, power on PICO and try it again. Otherwise contact IMKO.
50-59 ASIC is defect Power off, power on PICO and try it again. Otherwise contact IMKO.
60 Power voltage is too low Check power voltage of PICO, it is minimal 6V.
100 TDR measurement parameter is incorrectly set or the material conductivity is too high.
Adjust the TDR measurement parameters or contact IMKO
101 TDR measurement parameter is incorrectly set
Adjust the TDR measurement parameters or contact IMKO
102 ASIC is defect Power off, power on PICO and try it again. Otherwise contact IMKO.
103 EC parameter is incorrectly set. Power off, power on PICO and try it again. Otherwise contact IMKO.
105 Tp is out of range for the standard calibra-tion polynomial.
Check if PICO is inserted in the measured ma-terial correctly.
108 TDR measurement parameter is incorrectly set or the material conductivity is too high.
Adjust the TDR measurement parameters or contact IMKO
120-129 Internal chip problem Power off, power on PICO and try it again. Otherwise contact IMKO.
130-199 Internal errors Contact IMKO
200-254 Reserved
255 The data transmission is not finished.

Precise Moisture Measurement
in hydrology, forestry, agriculture, environmental and earth science,
civil engineering, as well as individual applications!