PI System 2010 PI Analytics PI for Office 2010 Managed PI Software + Services.

PI World 2020 Lab
PI Meets BI

2 | P a g e
OSIsoft, LLC 1600 Alvarado Street San Leandro, CA 94577 USA Tel: (01) 510-297-5800 Web: http://www.osisoft.com © 2020 by OSIsoft, LLC. All rights reserved. OSIsoft, the OSIsoft logo and logotype, Analytics, PI ProcessBook, PI DataLink, ProcessPoint, Asset Framework (AF), IT Monitor, MCN Health Monitor, PI System, PI ActiveView, PI ACE, PI AlarmView, PI BatchView, PI Vision, PI Data Services, Event Frames, PI Manual Logger, PI ProfileView, PI WebParts, ProTRAQ, RLINK, RtAnalytics, RtBaseline, RtPortal, RtPM, RtReports and RtWebParts are all trademarks of OSIsoft, LLC. All other trademarks or trade names used herein are the property of their respective owners. U.S. GOVERNMENT RIGHTS Use, duplication or disclosure by the U.S. Government is subject to restrictions set forth in the OSIsoft, LLC license agreement and as provided in DFARS 227.7202, DFARS 252.227-7013, FAR 12.212, FAR 52.227, as applicable. OSIsoft, LLC. Published: May 20, 2020

Table of Contents
Contents Table of Contents .................................................................................................................................................................... 3
1. Introduction .................................................................................................................................................................... 7
1.1 Learning Objectives and Problem Statement ......................................................................................................... 7
1.2 The Wind Generation Fleet ..................................................................................................................................... 7
1.3 The PI Tools ............................................................................................................................................................. 9
1.3.1 The PI Integrator for Business Analytics ......................................................................................................... 9
1.3.2 The PI SQL Client (for OLEDB, ODBC, or JDBC) ................................................................................................ 9
1.3.3 Which tool should I use? ............................................................................................................................... 10
2. Wind Turbine Overview Report .................................................................................................................................... 11
2.1 Objective ............................................................................................................................................................... 11
2.2 Tasks ...................................................................................................................................................................... 11
3. Wind Turbine Data: PI Integrator Asset View ............................................................................................................... 14
3.1 Overview ............................................................................................................................................................... 14
3.2 Create an Asset View for Wind Turbine metadata ............................................................................................... 14
3.2.1 Create the Search Shape ............................................................................................................................... 16
3.2.2 Modify the View ............................................................................................................................................ 20
3.2.3 Publish the View ............................................................................................................................................ 21
3.3 Create an Asset View for Wind Turbine Process Data .......................................................................................... 22
3.3.1 Create the Search Shape ............................................................................................................................... 23
3.3.2 Modify the View ............................................................................................................................................ 24
3.3.3 Publish the View ............................................................................................................................................ 26
4. Wind Turbine Data: PI SQL Client Element Model ........................................................................................................ 27
4.1 Overview ............................................................................................................................................................... 27
4.2 Connect to the AF Server ...................................................................................................................................... 27
4.2.1 Create a Catalog and Schema for the Report ............................................................................................... 27
4.3 Create a Template-Specific Data Model for the Wind Turbine ............................................................................ 28
4.4 Enhance the Data Objects ..................................................................................................................................... 32
4.4.1 Execute Predefined Queries .......................................................................................................................... 32
4.4.2 Update the Turbine Information View .......................................................................................................... 33
4.4.3 Create a view from the Table-Valued Function ............................................................................................ 34

4 | P a g e
5. Wind Turbine Report .................................................................................................................................................... 36
5.1 Overview ............................................................................................................................................................... 36
5.2 Tasks ...................................................................................................................................................................... 36
5.3 Create a new Power BI Report .............................................................................................................................. 36
5.3.1 Option 1 – Connect the report to PI Integrator Data .................................................................................... 37
5.3.2 Option 2 – Connect the report to PI SQL Client Data .................................................................................... 38
5.4 Connect the two tables ......................................................................................................................................... 41
5.5 Add Visuals to the Report ..................................................................................................................................... 44
5.5.1 Create a Funnel Chart to show Energy by Wind Farm .................................................................................. 44
5.5.2 Create Gauges to Show Availability and Capacity Factor ............................................................................. 45
5.5.3 Add a trend showing Power over time ......................................................................................................... 47
5.5.4 Create a new measure for combined power ................................................................................................ 47
5.5.5 Add a date slicer ............................................................................................................................................ 48
5.6 Create a tooltip page to show more details.......................................................................................................... 49
5.6.1 Create and format the page .......................................................................................................................... 50
5.6.2 Add visuals to the tooltip page ..................................................................................................................... 51
5.6.3 Configure the power trend to use the tooltip page ...................................................................................... 51
6. Wind Turbine Downtime: PI Integrator Event View ..................................................................................................... 53
6.1 Overview ............................................................................................................................................................... 53
6.2 Tasks ...................................................................................................................................................................... 53
6.3 Create a new Event View ...................................................................................................................................... 53
6.4 Modify and Publish the View ................................................................................................................................ 55
7. Incorporate Downtime Data into the Report ............................................................................................................... 57
7.1 Overview ............................................................................................................................................................... 57
7.2 Identify the Tasks .................................................................................................................................................. 57
7.3 Add the Downtime Data to the Report ................................................................................................................. 57
7.4 Connect the Downtime Table to the Model ......................................................................................................... 57
7.5 Create a Chart of Downtime by Wind Farm .......................................................................................................... 58
7.6 Create a Date Table ............................................................................................................................................... 58
7.6.1 Add Date Column to Turbine Data 1h Summary........................................................................................... 60
7.6.2 Add Date Column to the Turbine Downtime Table ...................................................................................... 60
7.6.3 Link the Date Table ....................................................................................................................................... 60
7.7 Wind Turbine Running Performance: PI Integrator Event View (Sampled) .......................................................... 61
7.8 Overview ............................................................................................................................................................... 61

5 | P a g e
7.9 Tasks ...................................................................................................................................................................... 61
7.10 Create a new Event View ...................................................................................................................................... 61
7.11 Configure the Event View to publish sampled data .............................................................................................. 63
8. Incorporate the Running Data into the Report ............................................................................................................. 65
8.1 Overview ............................................................................................................................................................... 65
8.2 Tasks ...................................................................................................................................................................... 66
8.3 Add the Turbine Running Data.............................................................................................................................. 66
8.4 Create a drillthrough report page for Wind Farm Details ..................................................................................... 67
8.5 Add a line chart showing Capacity Factor vs Wind Speed .................................................................................... 68
8.5.1 Group Wind Speed values into bins .............................................................................................................. 69
8.5.2 Normalize the performance measurement .................................................................................................. 70
8.6 Add a title and test drillthrough ............................................................................................................................ 71
8.7 Copy and sync the date slicer ............................................................................................................................... 73
8.8 Continue building the report ................................................................................................................................ 73
9. Appendix: Wind Turbine Downtime: PI SQL Client Event Frame Model ...................................................................... 76
9.1 Overview ............................................................................................................................................................... 76
9.2 Create a Template-Specific Data Model for the Downtime Event........................................................................ 76
9.3 Update the Turbine Downtime View .................................................................................................................... 77
10. Appendix: Wind Turbine Running Performance: PI SQL Client Model ..................................................................... 79
10.1 Overview ............................................................................................................................................................... 79
10.2 Create a Template-Specific Data Model for the Running Event ........................................................................... 79
10.3 Get Sampled Data for the Wind Turbine .............................................................................................................. 80
10.4 Update the Turbine Running Data View ............................................................................................................... 82
11. Appendix: Linking dates ............................................................................................................................................ 85
11.1.1 Link the Date Table ....................................................................................................................................... 87
12. Appendix: PI SQL Framework: All Queries ................................................................................................................ 89
12.1 Wind Turbine_GetSampledValues ........................................................................................................................ 89
12.2 Wind Turbine_GetSampledValues ........................................................................................................................ 90
12.3 Turbine Information .............................................................................................................................................. 91
12.4 Turbine Data 1h Summary .................................................................................................................................... 93
12.5 Turbine Downtime ................................................................................................................................................ 93
12.6 Turbine Running Data ........................................................................................................................................... 94
Save the Date! ................................................................................................................... Error! Bookmark not defined.

6 | P a g e

7 | P a g e
1. Introduction
1.1 Learning Objectives and Problem Statement
Integrating the PI System with Business Intelligence (BI) tools is an effective way to use your process data for reporting and analytics. BI client tools offer the ability to run retrospective analyses on a much larger set of your real-time PI System data. BI helps you learn from operational behaviors and patterns, identifying dependencies and correlations of various factors within your operations.
In this lab, we will showcase two tools for connecting your Business Intelligence tool of choice to your PI Data: the PI Integrator for Business Analytics and the PI SQL Client. Using each tool, we will show how to access PI data in three different ways:
1. Retrieving PI Data for assets over time
2. Retrieving Event Frame summary information
3. Retrieving PI Data within the time range of an Event Frame
1.2 The Wind Generation Fleet
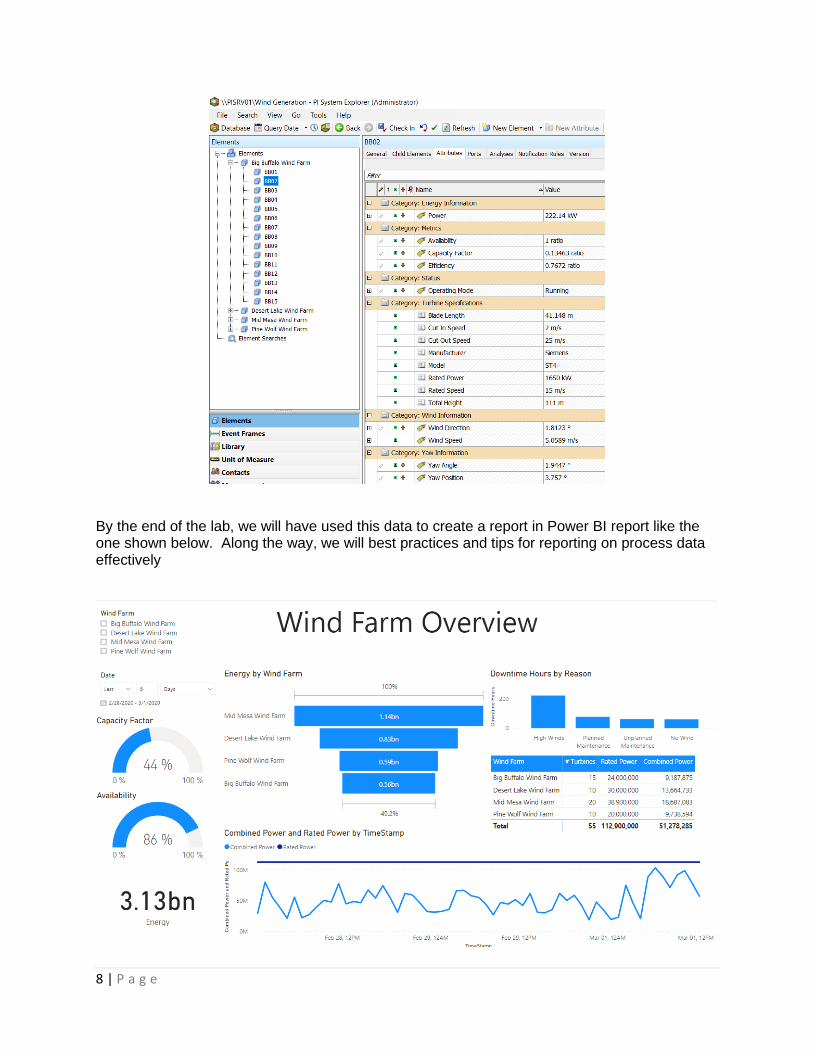
For this lab, we will be using a simulated Wind Generation dataset consisting of 55 Wind Turbines across 4 Wind Farms. You can view this by opening PI System Explorer (PSE) and navigating to the Wind Generation AF Database.
Each of the turbines is built from the same AF element template, Wind Turbine, which can be viewed in the Library under Element Templates. Each turbine has a variety of data associated with it, including PI Point real-time values and metadata such as manufacturer information.
8 | P a g e
By the end of the lab, we will have used this data to create a report in Power BI report like the one shown below. Along the way, we will best practices and tips for reporting on process data effectively

9 | P a g e
1.3 The PI Tools
There are many ways to extract PI System data depending on your needs. In this lab we will focus on the two tools best suited to creating datasets that can easily be brought into your Business Intelligence program of choice
1.3.1 The PI Integrator for Business Analytics
PI Integrator for Business Analytics presents PI System data perfectly suited to business intelligence tools including, but not limited to, Tableau, Tibco Spotfire, QlikView, and Microsoft Power BI for reporting and analytics.
Native time-series data, asset context, and event context are exposed through web-configured views. Data are dimensionally modeled, cleansed, and presented with appropriate metadata so that BI tools can properly browse, query, and consume PI System data seamlessly. Data can also be directly integrated and loaded into data warehouse platforms. PI Integrator for Business Analytics eliminates the need for programming or SQL expertise and manages the complete data lifecycle, including access, updates, and data provenance.
1.3.2 The PI SQL Client (for OLEDB, ODBC, or JDBC)
PI SQL Client is a PI Developer Technology that offers data access to the PI System using SQL queries. There are three flavors to allow queries using OLEDB, ODBC, and JDBC, although the principals of operation are the same across the three. The PI SQL Client uses a cost-based optimizer to provide the most performant queries of the SQL-based data access tools.
💡
Note
Developer Technologies products are available for download from the OSIsoft Customer Portal Products page at no charge. You can develop applications using the Developer Technologies tools and your PI Server. If you do not have access to a PI Server, you can obtain development licenses for the PI Server through membership in the PI Developers Club. For details, see PI Developers Club FAQ. Deployment of an application into production requires a PI System Access (PSA) license. This is a runtime license that enables end users to access PI System data, including time series data in PI Data Archive and asset metadata in PI AF Server, using any of the Developer Technologies. For more information or questions, contact your Account Manager. In case of technical issues with the PSA license, use the OSIsoft Customer Portal Contact Us page.

10 | P a g e
1.3.3 Which tool should I use?
As you will see in this lab, both tools can produce similar datasets, so the choice on which tool to use will vary but may depend on some of the following factors.
In general, the PI Integrator provides a great platform for creating and updating structured datasets used for wide-audience reporting, data science and machine learning, and data warehousing use cases.
The PI SQL Framework, on the other hand, excels at targeted and varied reporting, where the data is accessed by a smaller group of people. Its flexibility also makes it a great choice for rapid development without requiring additional infrastructure
SQL familiarity
The PI Integrator provides a configuration-based approach to building the dataset that does not require any programming or SQL expertise.
The PI SQL Client requires the author to have some SQL familiarity, but also provides examples and wizards to help guide users. Those with SQL expertise can take advantage of additional functionality to create advanced queries.
Data set size and Audience
The PI Integrator publishes data to an external location on a schedule, and so it can handle large data sets that are frequently accessed by many individuals. Since the data only needs to be extracted once into the target system, no additional load is placed on the PI System when users access the data.
The PI SQL Client accesses data on-demand from the PI System, so expensive queries may put an additional load on the PI System. By executing the queries on-demand, however, the PI SQL Client provides a more flexible approach which may be beneficial during development.
Requirements to integrate with external datasets
When using the PI Integrator, additional datasets can be incorporated in the target system, such as a Data Lake or Data Warehouse.
When using the PI SQL Client, additional datasets can be incorporated in the client tool, such as Power BI.
User access to the PI System
The PI Integrator publishes data to external targets, so no end-users require direct access to the data.
The PI SQL Client requires that the querying system have access to the PI System.

11 | P a g e
2. Wind Turbine Overview Report
2.1 Objective
The objective of Sections 3, 4, and 5 is to publish calculated asset data in one-hour intervals using both
the PI Integrator and PI SQL Client. This data will then be used create a report showing the performance
of the Wind Farms over a configurable time range. After building the data sets, the class members may
choose which data set (PI Integrator or PI SQL Client) to use for building the report.
2.2 Tasks
• PI Integrator
o Create an Asset View for Wind Turbine metadata
o Create an Asset View for Wind Turbine process data
• PI SQL Client
o Create a Catalog and Schema for holding report queries
o Create a template-specific data model for the Wind Turbine
o Create a view from the Table-Valued Functions
• Power BI
o Import data from one of the sources
o Transform the data as necessary
o Join the metadata and process data tables
o Build a report page
o Create additional measures
2.3 Preparing the Environment
Before beginning the class, it is important to backfill the data. This is accomplished within PI System Explorer.
First, open PI System Explorer from the desktop
In the title of the window (at the top), you should see \\PISRV01\Wind Generation. If you do not see this, it means that you are in a different database. Click the
Database button in the menu and choose Wind Generation

12 | P a g e
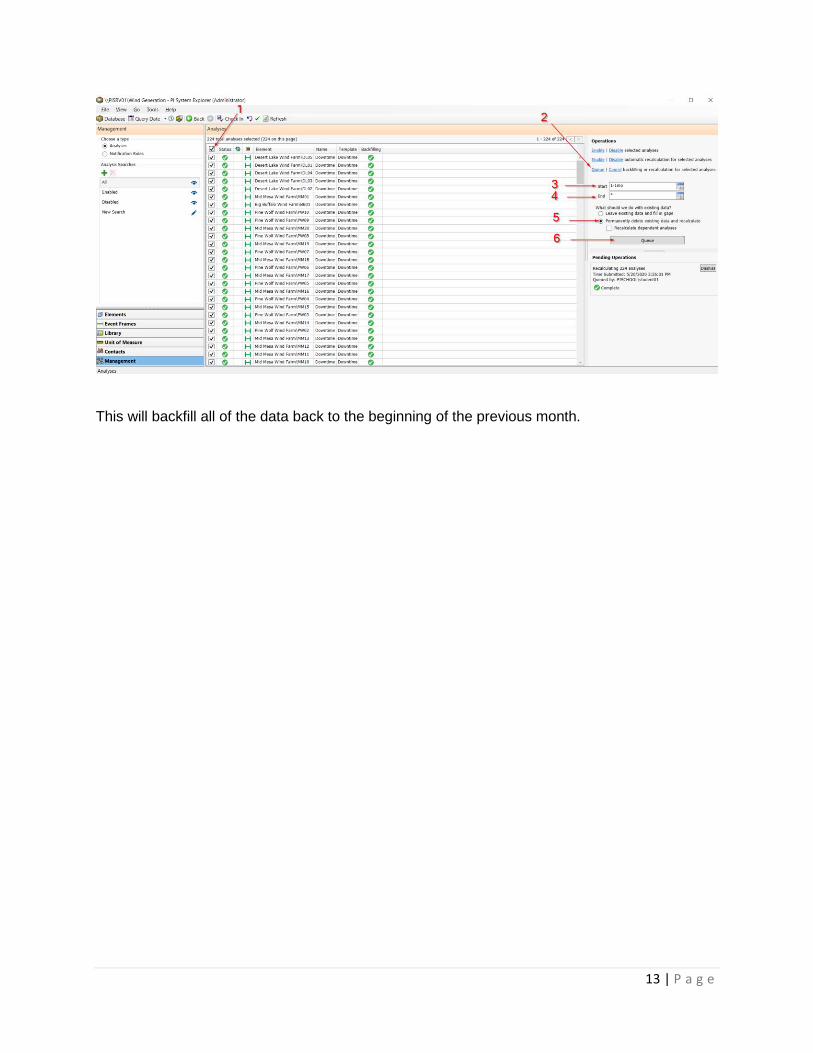
Next, navigate to the Management section of PI System Explorer (bottom left)
From here, click the check mark in the column heading to select all of the analyses, then click Queue on the right hand operations panel and fill in the following options
• Start: 1-1mo
• End: *
• Permanently delete existing data and recalculate
Click the Queue button to complete
13 | P a g e
This will backfill all of the data back to the beginning of the previous month.

14 | P a g e
3. Wind Turbine Data: PI Integrator Asset View
3.1 Overview
In the PI Integrator, a view is a modeled description of the PI System data you want to analyze.
• Asset views organize data around your assets and allow you to make comparisons between assets.
• Event views organize data around event frames and allow you to detect patterns in the event frames.
• Streaming views organize data around your assets and allow you to make this data available in near real time for predictive analytics.
In this section, two Asset Views will be created – one for Wind Turbine metadata, and the other for Wind Turbine process data. Since the metadata for the Wind Turbine is static, we will separate it from the changing process data so that the two views can be published on different schedules.
3.2 Create an Asset View for Wind Turbine metadata
The wind turbines have several attributes that contain static metadata, as shown below. In addition, each Wind Turbine also belongs to a specific Wind Farm. This is the information that will be captured in the first Asset View that we create.
First, open Google Chrome and navigate to the PI Integrator webpage:
https://pisrv01.pischol.int:444
15 | P a g e
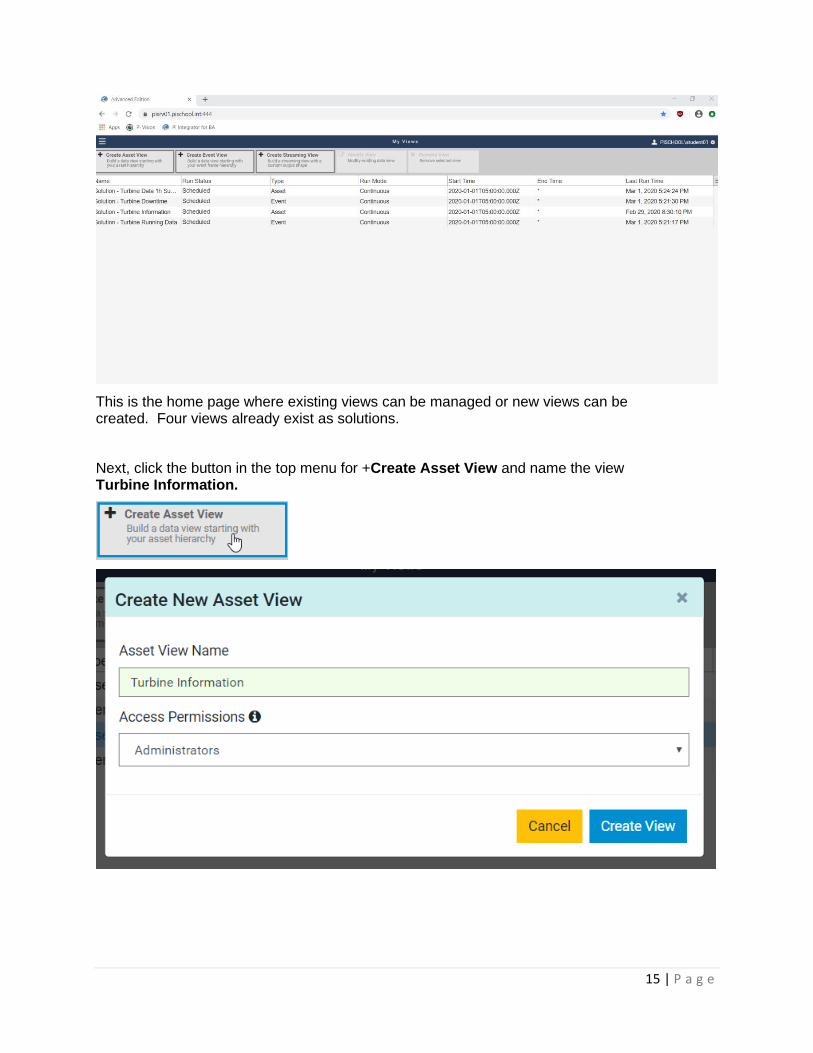
This is the home page where existing views can be managed or new views can be created. Four views already exist as solutions.
Next, click the button in the top menu for +Create Asset View and name the view Turbine Information.
16 | P a g e
3.2.1 Create the Search Shape
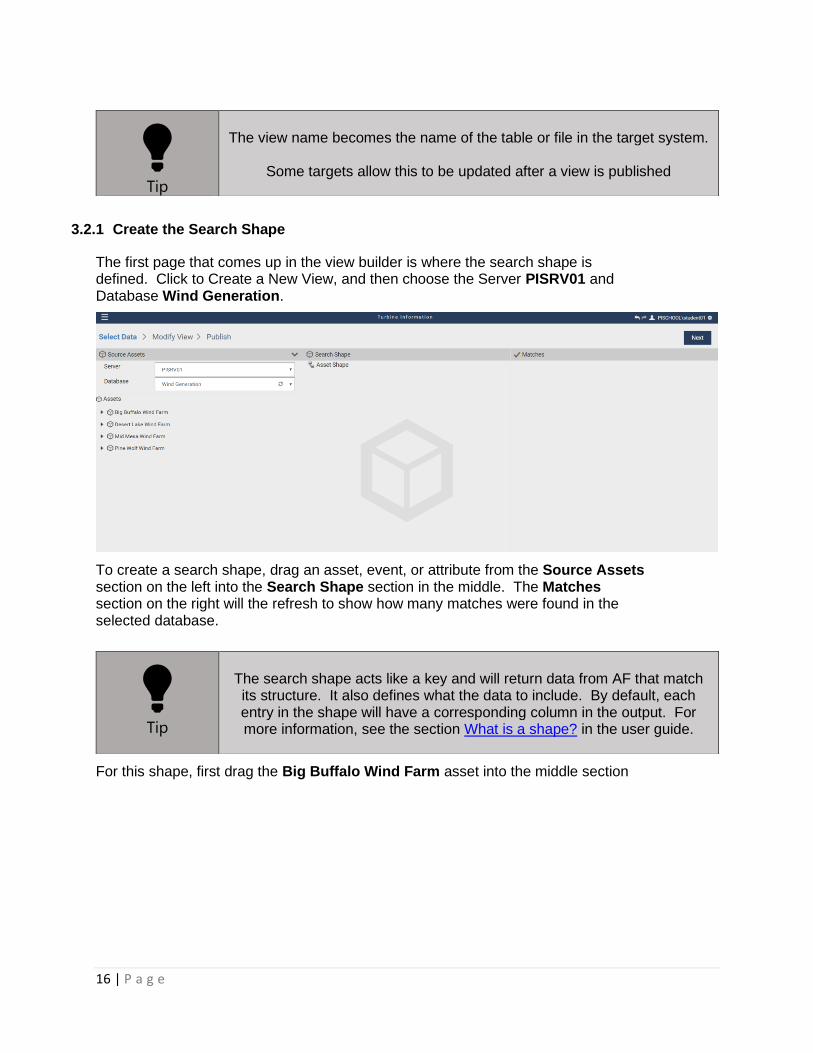
The first page that comes up in the view builder is where the search shape is defined. Click to Create a New View, and then choose the Server PISRV01 and Database Wind Generation.
To create a search shape, drag an asset, event, or attribute from the Source Assets section on the left into the Search Shape section in the middle. The Matches section on the right will the refresh to show how many matches were found in the selected database.
For this shape, first drag the Big Buffalo Wind Farm asset into the middle section
💡
Tip
The view name becomes the name of the table or file in the target system.
Some targets allow this to be updated after a view is published
💡
Tip
The search shape acts like a key and will return data from AF that match its structure. It also defines what the data to include. By default, each entry in the shape will have a corresponding column in the output. For more information, see the section What is a shape? in the user guide.
17 | P a g e
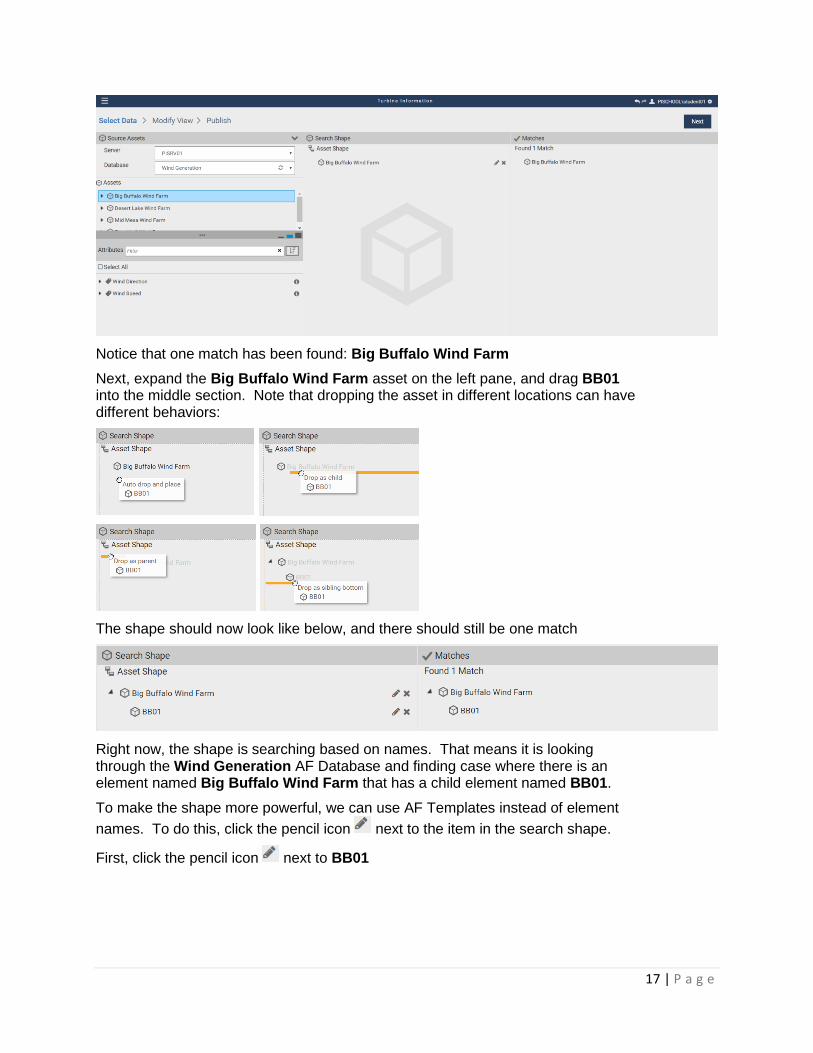
Notice that one match has been found: Big Buffalo Wind Farm
Next, expand the Big Buffalo Wind Farm asset on the left pane, and drag BB01 into the middle section. Note that dropping the asset in different locations can have different behaviors:
The shape should now look like below, and there should still be one match
Right now, the shape is searching based on names. That means it is looking through the Wind Generation AF Database and finding case where there is an element named Big Buffalo Wind Farm that has a child element named BB01.
To make the shape more powerful, we can use AF Templates instead of element
names. To do this, click the pencil icon next to the item in the search shape.
First, click the pencil icon next to BB01

18 | P a g e
In the dialog that appears, uncheck Asset Name and check Asset Template. Choose the template Wind Turbine and click Save
Note that the shape now has 15 Matches. It is now finding all of the turbines within the Big Buffalo Wind Farm.
Repeat this process to use the Wind Farm template instead of Big Buffalo Wind Farm.
Now that the search shape is matching the needed assets, it is time to add the desired attributes to the shape. As with the assets, these are dragged and dropped from the left pane. Once an asset is selected, its attributes will be displayed underneath. If there are many attributes, it can be helpful to group by category
✔
Best Practice
When creating a shape, use templates instead of names wherever possible.

19 | P a g e
For this example, drag the Turbine Specifications category onto the Wind Turbine in the shape.
Just like with assets, these attributes are used in the filtering process. If an element does not have one of the attributes, then it will not be matched.
💡
Tip
Although we won’t use it in this lab, the attributes can be modified like the
assets and can be marked as optional.
If marked as optional, they will not be part of the matching criteria, which is useful when derived templates are used.
At this point, the shape is complete. Click Next to continue to the Modify View page.

20 | P a g e
3.2.2 Modify the View
Using the information from the search shape and its matches, this page governs how the data will be published. Additional columns can be added, existing columns can be modified, and data range can be specified.
Since this view is publishing static data, set the sampling rate to 1 day by clicking Edit Value Mode and choosing 1 days and click Save Changes.
💡
Tip
It’s often best to use Interpolate with tag data. If Exact is chose, then all
attributes must have a compressed value in the archive that exactly matches the timestamp, which is often not the case.
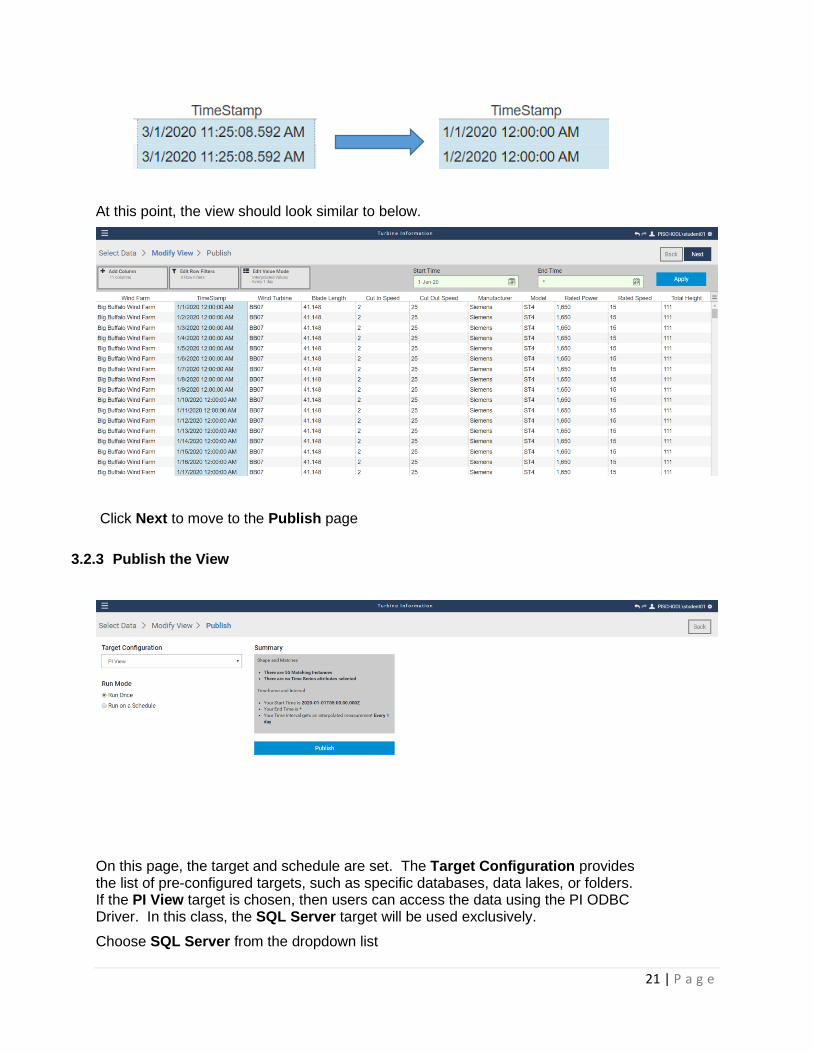
Notice that the TimeStamps do not have clean values. This is because the Start Time is *-8h. Set the Start Time to 1-Jan-20 and notice that the timestamps are now much neater.
21 | P a g e
At this point, the view should look similar to below.
Click Next to move to the Publish page
3.2.3 Publish the View
On this page, the target and schedule are set. The Target Configuration provides the list of pre-configured targets, such as specific databases, data lakes, or folders. If the PI View target is chosen, then users can access the data using the PI ODBC Driver. In this class, the SQL Server target will be used exclusively.
Choose SQL Server from the dropdown list

22 | P a g e
For the Run Mode, choose to Run on a Schedule, and have the view Recur every 1 day. Doing this will ensure that any changes to the asset structure can be reflected in the published data.
Click Publish to create the dataset. On the home page, look for the new view Turbine Information. Its Run Status will update to Publishing and then to Scheduled once the data has been published.
3.3 Create an Asset View for Wind Turbine Process Data
Now that we have a view created for the Turbine metadata, the next step is to create a view for the process data. In this example, we will publish summary data at intervals of one hour.
✔
Best Practice
Don’t sample data more frequently than necessary. Instead, tailor the data
sets to the intended use case.
In a monthly or weekly report, hourly summaries (avg, total, min, max) often provide enough time resolution while using fewer resources.

23 | P a g e
This will follow the same process as the previous section to capture the following data. For this lab, the Availability and Efficiency are kept as ratio for simplicity and will be represented as percentages using the built-in functionality of Power BI.
3.3.1 Create the Search Shape
Again, navigate to the PI Integrator home page and click Create Asset View.
Name this view Turbine Data 1h Summary.
Create a new shape, again choosing Server PISRV01 and Database Wind Generation. Since the previous view already includes the name of the Wind Farm, we can skip adding that to our shape. Instead, add BB01 to the search shape and modify it to use the template Wind Turbine instead of its name.

24 | P a g e
Now, add the following attributes into the search shape
Verify that the view has still found all 55 Matches and click Next
3.3.2 Modify the View
In this view, the goal is to publish summary information at one hour intervals. For this data, each existing column will be configured to publish out an average value over the interval, and an additional column will be created to totalize power, which gives energy over that interval.
To begin, click Edit Value Mode and choose to sample values every 1 hour.
As before, update the Start Time to 1-Jan-20 and click Apply.
The view is now retrieving interpolated values at 1-hour intervals. The next steps will change the columns to perform a summary calculation instead of retrieving the interpolated value.
Click the Availability column. Notice the Column Details pane appears on the right

25 | P a g e
Change the Data Content from Value to Average
Click Apply Changes at the bottom. The column is now calculating an average over the 1-hour interval.
Repeat this process for Capacity Factor, Efficiency, Power, and Yaw Angle.
✔
Best Practice
Summary calculations are most accurate when performed at this stage. If
needed, add additional columns to perform other summaries.
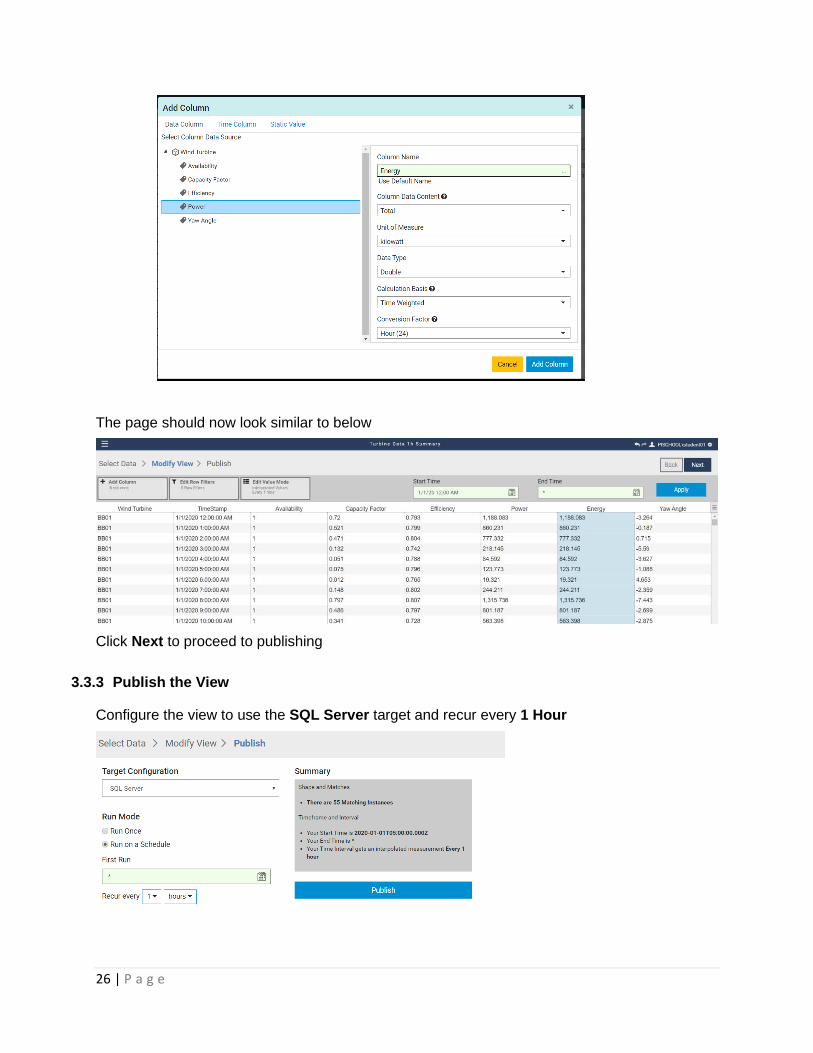
To create Energy (a total of Power), click Add Column on the top left. This brings up a window to add additional columns. Choose the Power attribute, a Data Content of Total, and set the Conversion Factor to Hour (24). Name this column Energy. This column will now contain the total kWh over the interval.
26 | P a g e
The page should now look similar to below
Click Next to proceed to publishing
3.3.3 Publish the View
Configure the view to use the SQL Server target and recur every 1 Hour

27 | P a g e
4. Wind Turbine Data: PI SQL Client Element Model
4.1 Overview
In this section, two datasets will be created like those published in Section 3 – one for Wind Turbine metadata, and the other for Wind Turbine process data.
Queries written for the PI SQL Client can be executed from any application supporting OLEDB, ODBC, or JDBC as long as the computer has the appropriate driver installed. For authoring, the PI SQL Commander Lite application will be used, as it is tightly integrated with the PI SQL Client and includes wizards and sample queries to aid development.
4.2 Connect to the AF Server
Open PI SQL Commander Lite and right click on PI SQL Client under OLEDB Data Sources and click Connect. Fill in the AF Server PISRV01 and choose AF Database Wind Generation from the dropdown
4.2.1 Create a Catalog and Schema for the Report
Since there may be many use cases for querying the database, it is helpful to create Catalogs and Schemas to keep related queries organized. An additional Catalog Solution already exists, and contains the solutions for this lab.
💡
Tip
For authoring purposes, there is no difference between OLEDB and
ODBC, as they are just translation layers that interface with the Real Time Query Processing (RTQP) engine on the AF server.
28 | P a g e
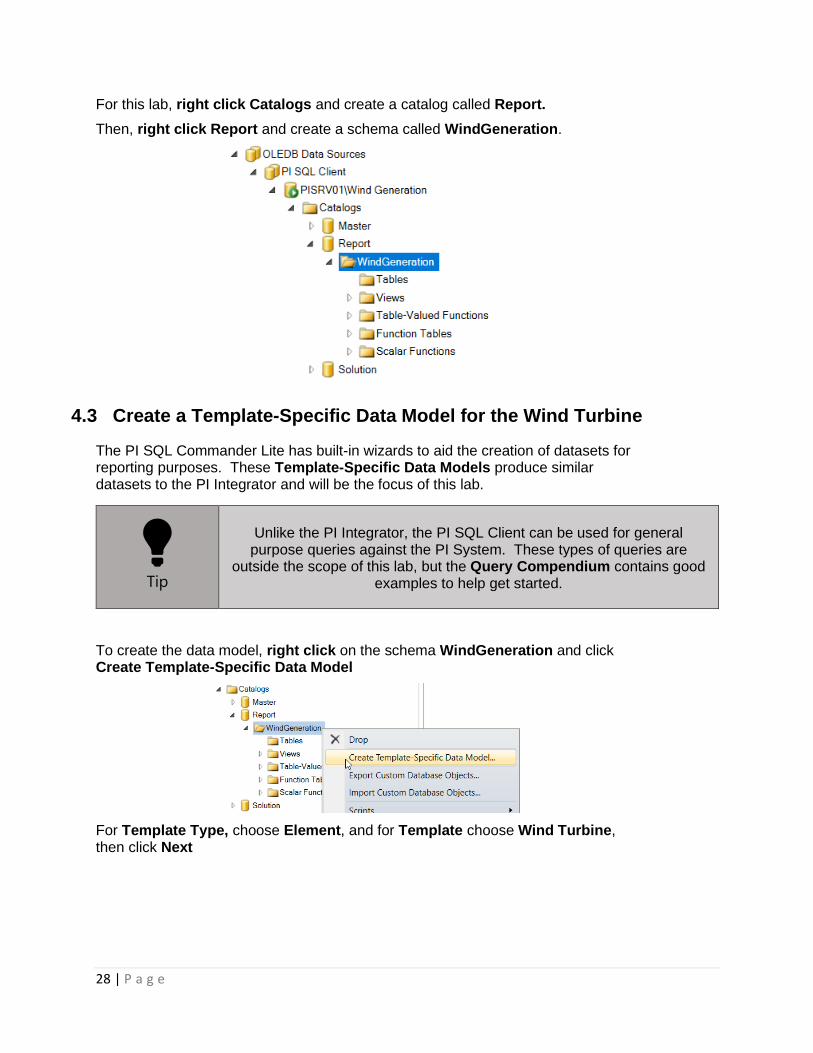
For this lab, right click Catalogs and create a catalog called Report.
Then, right click Report and create a schema called WindGeneration.
4.3 Create a Template-Specific Data Model for the Wind Turbine
The PI SQL Commander Lite has built-in wizards to aid the creation of datasets for reporting purposes. These Template-Specific Data Models produce similar datasets to the PI Integrator and will be the focus of this lab.
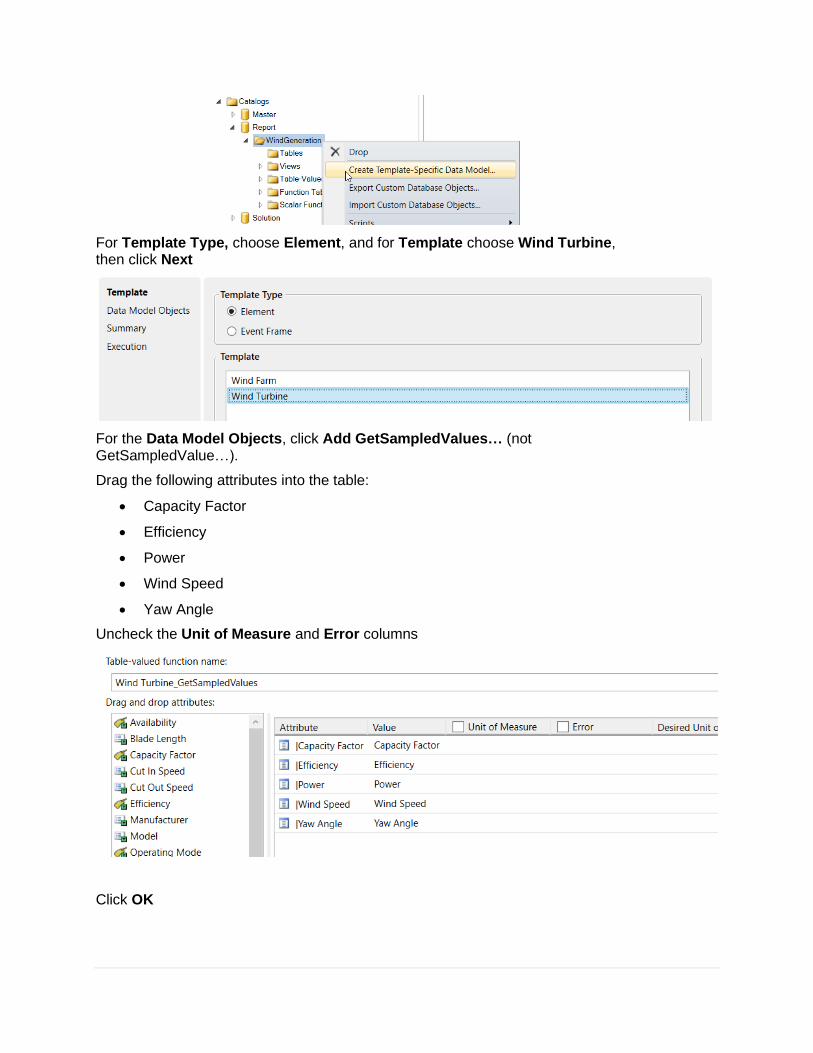
To create the data model, right click on the schema WindGeneration and click Create Template-Specific Data Model
For Template Type, choose Element, and for Template choose Wind Turbine, then click Next
💡
Tip
Unlike the PI Integrator, the PI SQL Client can be used for general purpose queries against the PI System. These types of queries are
outside the scope of this lab, but the Query Compendium contains good examples to help get started.

29 | P a g e
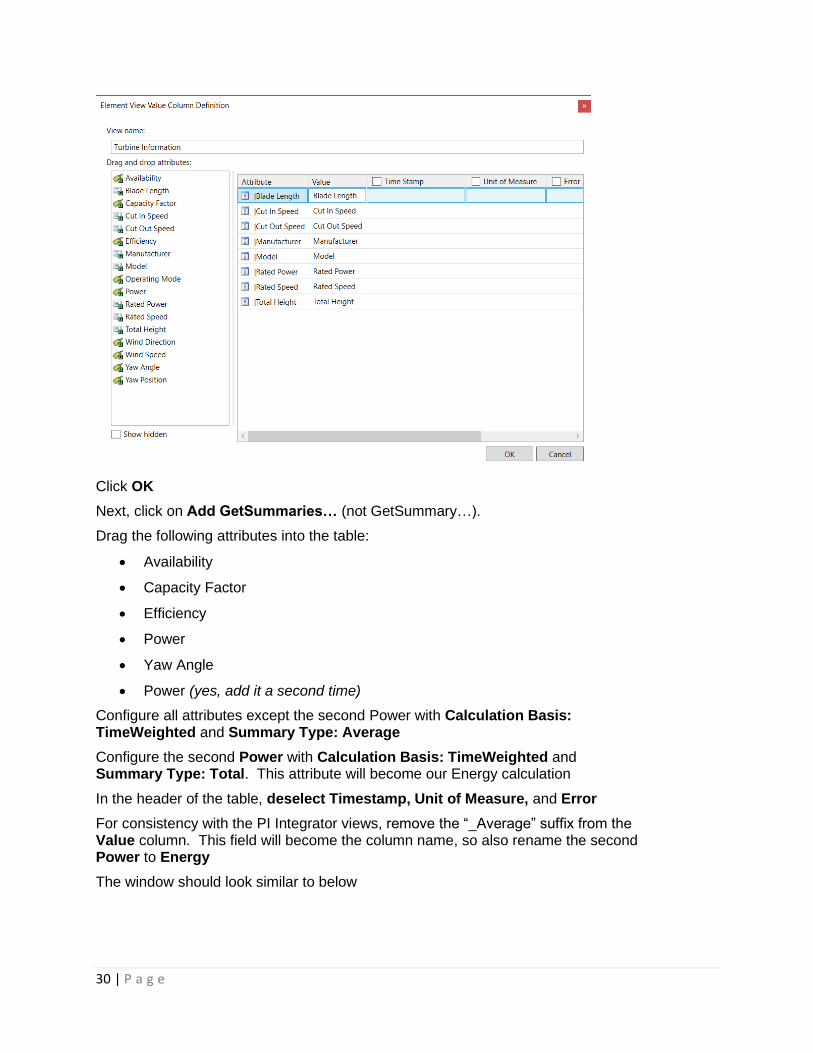
The next page is where the Data Model Objects are specified. In this stage, an Element View will be added to capture the turbine metadata and a Get Summaries call will be used to get aggregate data.
For the Data Model Objects, first click Add Element View. This will open a column definition window.
Set the View Name to Turbine Information
Select the metadata attributes (using Ctrl+click) and drag them into the main pane.
In the header of the table, deselect Timestamp, Unit of Measure, and Error
The window should look similar to the below image. The name of the Wind Farm (the parent element) is not included at this stage but will be added in later steps.
30 | P a g e
Click OK
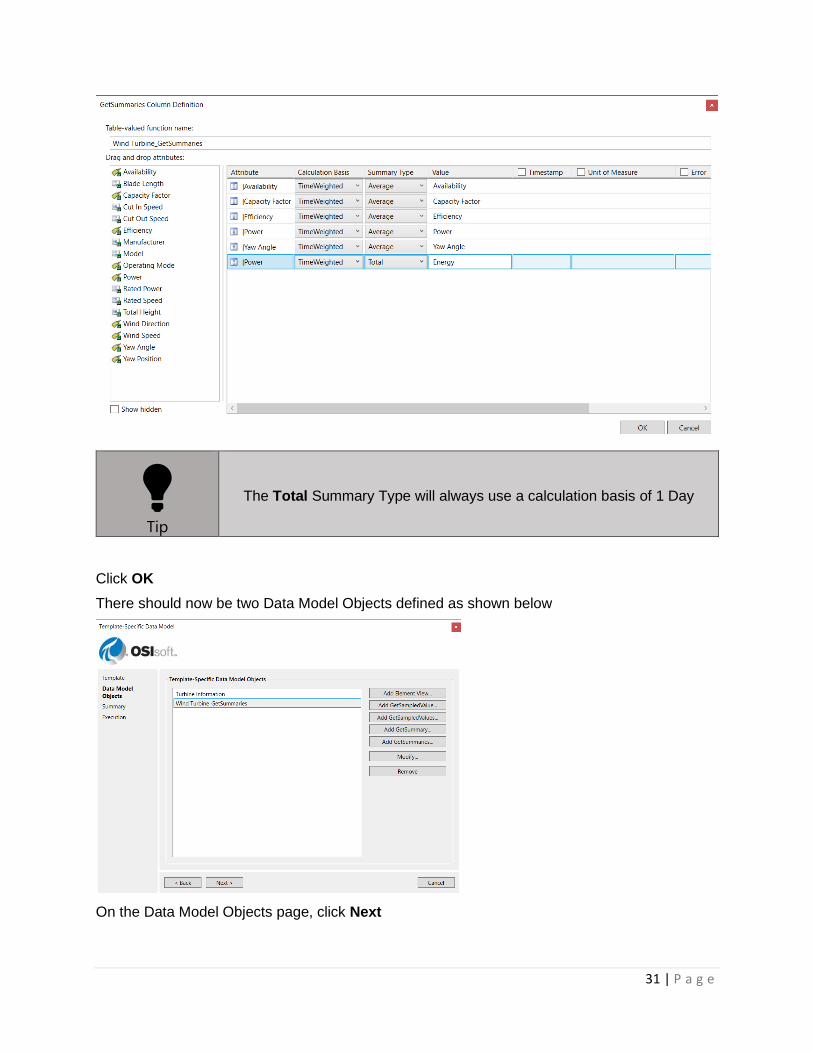
Next, click on Add GetSummaries… (not GetSummary…).
Drag the following attributes into the table:
• Availability
• Capacity Factor
• Efficiency
• Power
• Yaw Angle
• Power (yes, add it a second time)
Configure all attributes except the second Power with Calculation Basis: TimeWeighted and Summary Type: Average
Configure the second Power with Calculation Basis: TimeWeighted and Summary Type: Total. This attribute will become our Energy calculation
In the header of the table, deselect Timestamp, Unit of Measure, and Error
For consistency with the PI Integrator views, remove the “_Average” suffix from the Value column. This field will become the column name, so also rename the second Power to Energy
The window should look similar to below
31 | P a g e
💡
Tip
The Total Summary Type will always use a calculation basis of 1 Day
Click OK
There should now be two Data Model Objects defined as shown below
On the Data Model Objects page, click Next

32 | P a g e
This brings up a summary page that shows the query that will be executed. Click Execute to create the objects
💡
Tip
This query can be built and executed without using the wizard. The
statements within the query can also be executed individually without creating the Data Model Objects.
At this stage, the two data objects should be listed within WindGeneration as shown below:
💡
Tip
A copy of the resulting query is stored in the following file, and can be
executed if you ran into any issues.
C:\PI World\Solutions\PI SQL Client\4.3 - Create Initial Data Model.sql
4.4 Enhance the Data Objects
4.4.1 Execute Predefined Queries
PI SQL Commander Lite makes it easy to see a sample query for most objects by Right Clicking and choosing Execute Predefined Query. Do this for the View and Table-Valued Function (TVF) to see the result.
Two pieces of information are missing from our data:
1. The Turbine Information does not include the Wind Farm
2. The Wind Turbine_GetSummaries returns Energy in kWd instead of kWh
33 | P a g e
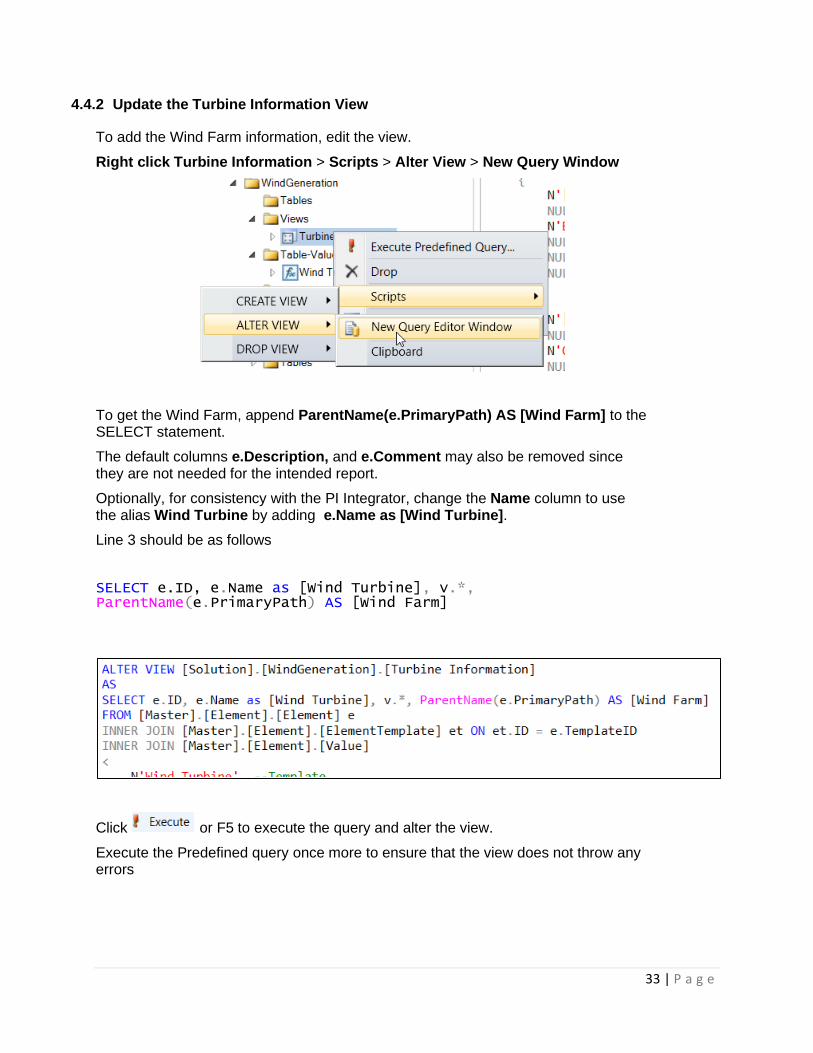
4.4.2 Update the Turbine Information View
To add the Wind Farm information, edit the view.
Right click Turbine Information > Scripts > Alter View > New Query Window
To get the Wind Farm, append ParentName(e.PrimaryPath) AS [Wind Farm] to the SELECT statement.
The default columns e.Description, and e.Comment may also be removed since they are not needed for the intended report.
Optionally, for consistency with the PI Integrator, change the Name column to use the alias Wind Turbine by adding e.Name as [Wind Turbine].
Line 3 should be as follows
SELECT e.ID, e.Name as [Wind Turbine], v.*, ParentName(e.PrimaryPath) AS [Wind Farm]
Click or F5 to execute the query and alter the view.
Execute the Predefined query once more to ensure that the view does not throw any errors
34 | P a g e
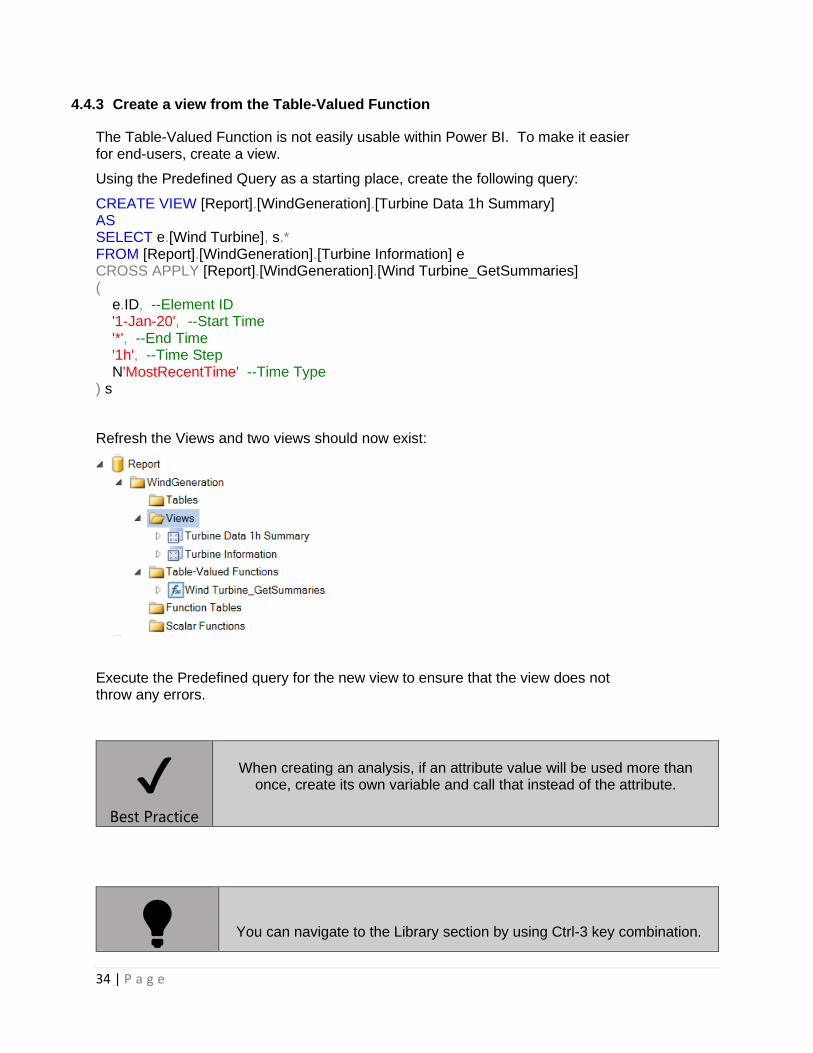
4.4.3 Create a view from the Table-Valued Function
The Table-Valued Function is not easily usable within Power BI. To make it easier for end-users, create a view.
Using the Predefined Query as a starting place, create the following query:
CREATE VIEW [Report].[WindGeneration].[Turbine Data 1h Summary] AS SELECT e.[Wind Turbine], s.* FROM [Report].[WindGeneration].[Turbine Information] e CROSS APPLY [Report].[WindGeneration].[Wind Turbine_GetSummaries] ( e.ID, --Element ID '1-Jan-20', --Start Time '*', --End Time '1h', --Time Step N'MostRecentTime' --Time Type ) s
Refresh the Views and two views should now exist:
Execute the Predefined query for the new view to ensure that the view does not throw any errors.
✔
Best Practice
When creating an analysis, if an attribute value will be used more than
once, create its own variable and call that instead of the attribute.
💡
You can navigate to the Library section by using Ctrl-3 key combination.

35 | P a g e
Tip

36 | P a g e
5. Wind Turbine Report
5.1 Overview
This section will detail creating a report in Power BI using the data prepared in Sections 3 or 4. Students may choose to use either the dataset published by the PI Integrator or the views created for the PI SQL Client.
5.2 Tasks
• Create a new Power BI Report
o Connect the report to PI Integrator Data
o Connect the report to PI SQL Client Data
• Transform the data as necessary
• Join the metadata and process data tables
• Build a report page
• Create additional measures
5.3 Create a new Power BI Report
To build the report, first open Power BI Desktop.
On the splash screen, choose Get Data.

5.3.1 Option 1 – Connect the report to PI Integrator Data
After choosing Get data, a new screen appears to assist with the data source connection. To bring this up in the future, click on Get data in the ribbon
To use the data published by the PI Integrator, choose SQL Server database from the list.
On the database connection screen, choose:
Server: PISRV01
Database: PI_World
Data Connectivity Mode: Import

38 | P a g e
Click OK to move to the Navigator Window.
In this window, choose the two tables that we created before: Turbine Data 1h Summary and Turbine Information
After selecting these two tables, click Transform Data.
It is important that the Turbine Information table be filtered to return only the latest result. If Load was clicked, don’t worry, just click Transform Data from the Home tab of the ribbon
This opens the query editor window.
At this stage, select Turbine Information from the list of queries on the left.
Choose the dropdown on the TimeStamp column > Date/Time Filters > IsLatest
Now the table will include only the latest result. Click Close & Apply from the Home tab of the ribbon to return to the report
5.3.2 Option 2 – Connect the report to PI SQL Client Data
Click on Get data in the ribbon.
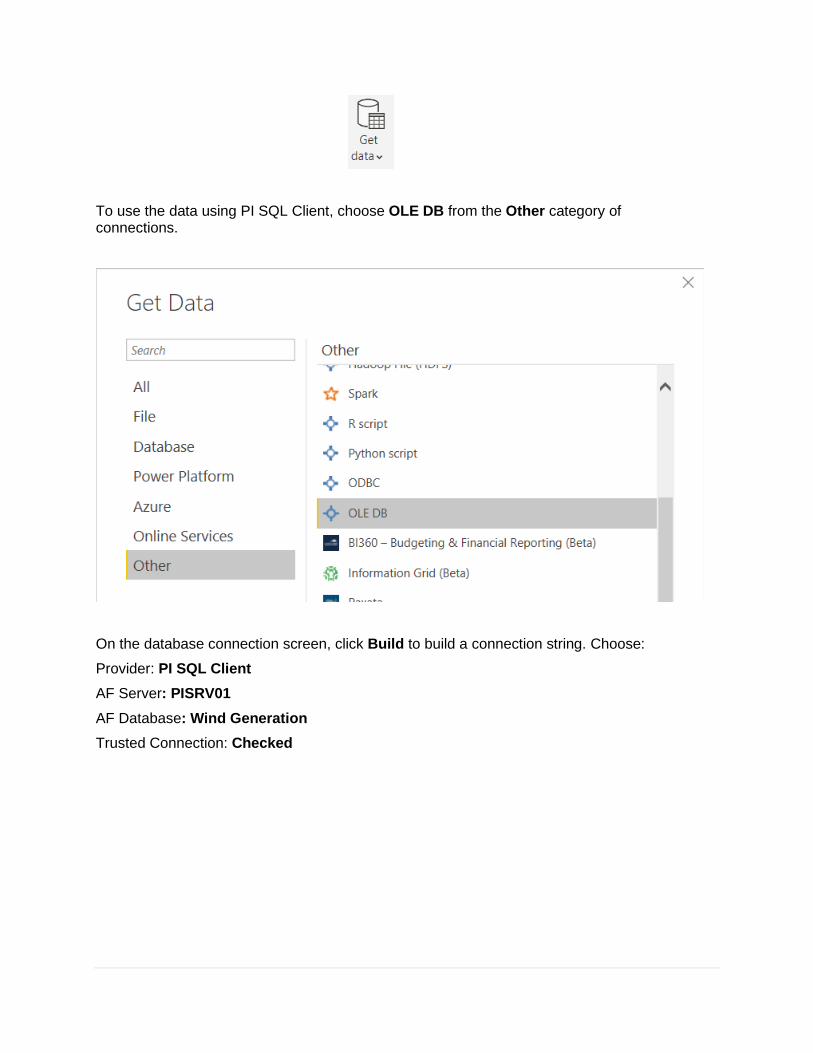
To use the data using PI SQL Client, choose OLE DB from the Other category of connections.
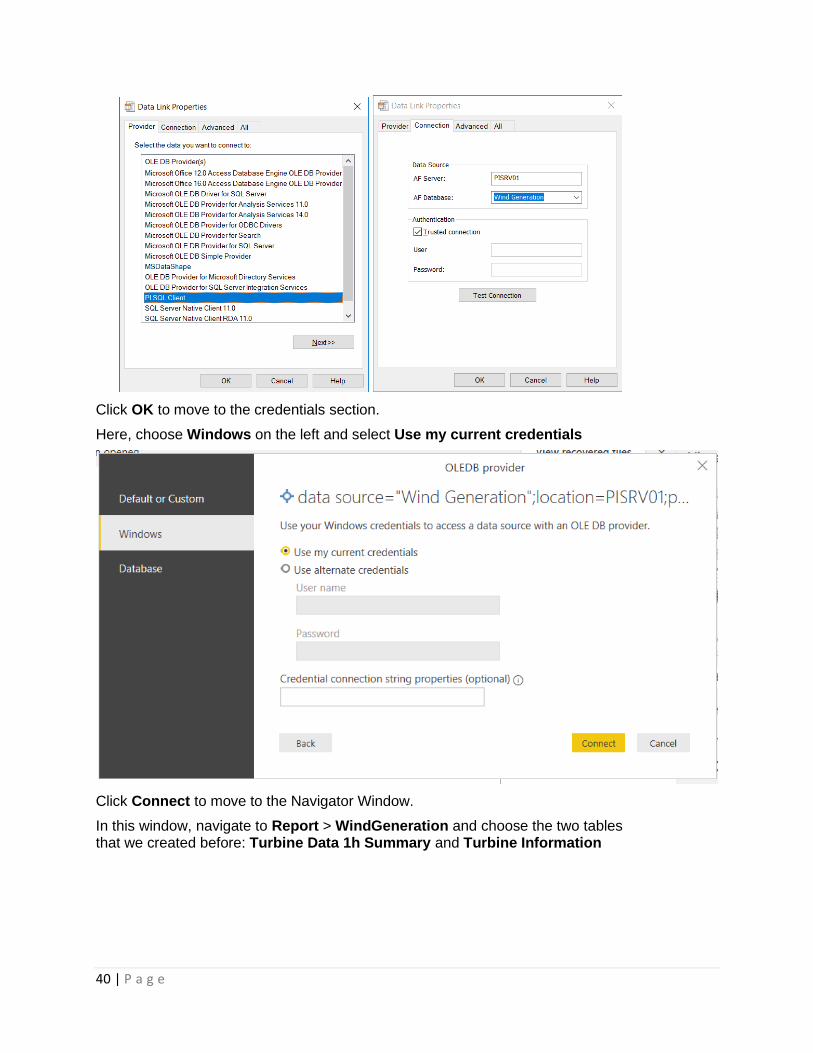
On the database connection screen, click Build to build a connection string. Choose:
Provider: PI SQL Client
AF Server: PISRV01
AF Database: Wind Generation
Trusted Connection: Checked
40 | P a g e
Click OK to move to the credentials section.
Here, choose Windows on the left and select Use my current credentials
Click Connect to move to the Navigator Window.
In this window, navigate to Report > WindGeneration and choose the two tables that we created before: Turbine Data 1h Summary and Turbine Information
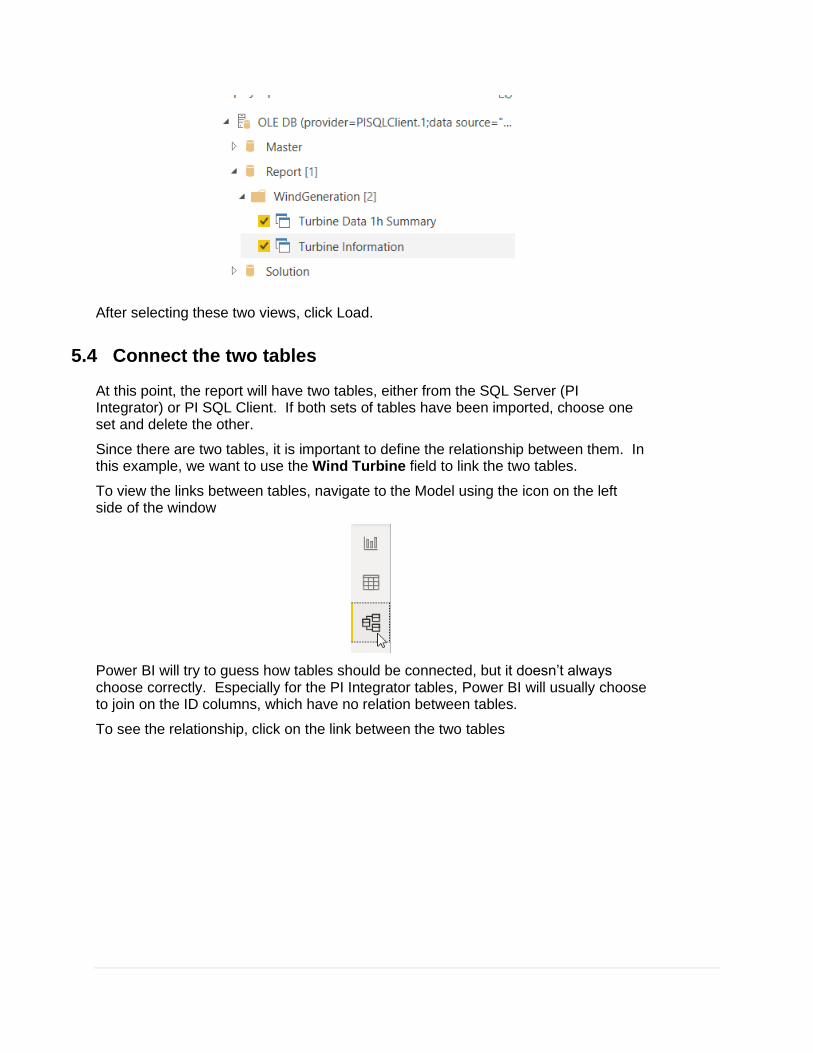
After selecting these two views, click Load.
5.4 Connect the two tables
At this point, the report will have two tables, either from the SQL Server (PI Integrator) or PI SQL Client. If both sets of tables have been imported, choose one set and delete the other.
Since there are two tables, it is important to define the relationship between them. In this example, we want to use the Wind Turbine field to link the two tables.
To view the links between tables, navigate to the Model using the icon on the left side of the window
Power BI will try to guess how tables should be connected, but it doesn’t always choose correctly. Especially for the PI Integrator tables, Power BI will usually choose to join on the ID columns, which have no relation between tables.
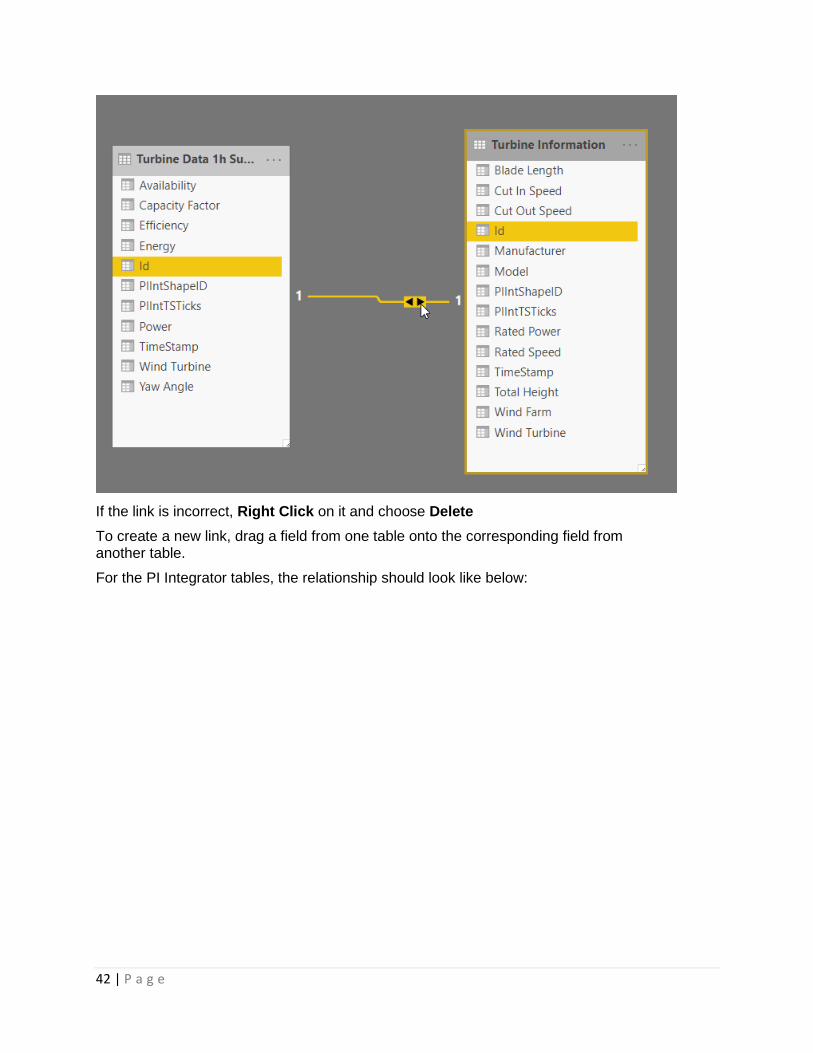
To see the relationship, click on the link between the two tables
42 | P a g e
If the link is incorrect, Right Click on it and choose Delete
To create a new link, drag a field from one table onto the corresponding field from another table.
For the PI Integrator tables, the relationship should look like below:

For the PI SQL Client, the relationship should look like below:
Since the directionality of the relationship is such that filters applied to the Turbine Information table affect the Turbine Data 1h Summary, but not vice-versa, it is important that users do not use the Wind Turbine field from the 1h data table for

44 | P a g e
filtering. To ensure this doesn’t happen, the column can be hidden from the report view.
Right Click and choose Hide in report view for the Wind Turbine in the table Turbine Data 1h Summary
5.5 Add Visuals to the Report
Start by adding a Title. From the Home tab of the ribbon, choose Text Box.
Set the font size to 36
Type Wind Generation Overview
5.5.1 Create a Funnel Chart to show Energy by Wind Farm
Click on the Funnel Chart under Visualizations to add a funnel chart to the report.
For Group, add the Wind Farm from Turbine Information by dragging and dropping
For the Values, add the Energy field from Turbine Data 1h Summary
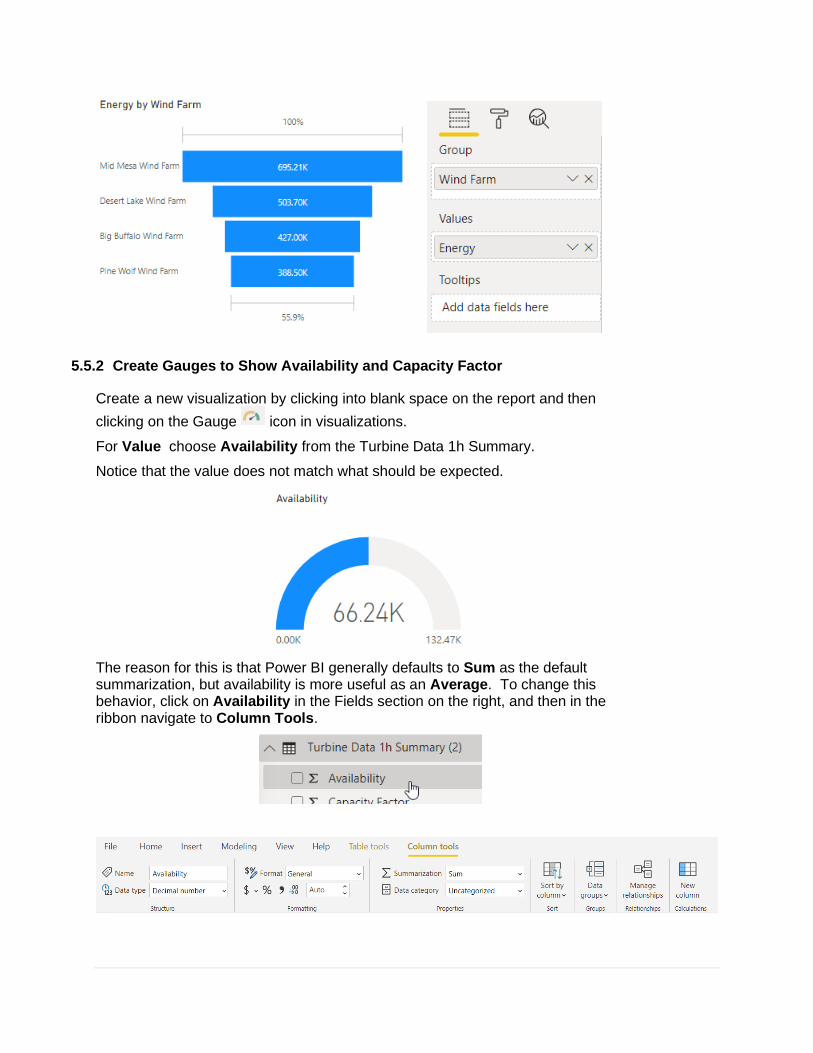
5.5.2 Create Gauges to Show Availability and Capacity Factor
Create a new visualization by clicking into blank space on the report and then
clicking on the Gauge icon in visualizations.
For Value choose Availability from the Turbine Data 1h Summary.
Notice that the value does not match what should be expected.
The reason for this is that Power BI generally defaults to Sum as the default summarization, but availability is more useful as an Average. To change this behavior, click on Availability in the Fields section on the right, and then in the ribbon navigate to Column Tools.

46 | P a g e
In the center, change the Summarization to Average and set the Format to Percentage. By publishing the data as a ratio, Power BI can convert the data to a percentage. This helps Power BI choose default ranges for gauges and add the percent symbol (%) to the values.
Notice, however, that the data in the Gauge has not changed, but the title has updated to Sum of Availability.
Changing the default summarization in Power BI does not alter existing visualizations. To do this, click the dropdown on the value and choose Average
The visual now shows an appropriate Availability
Repeat this process to add Capacity Factor to the report page
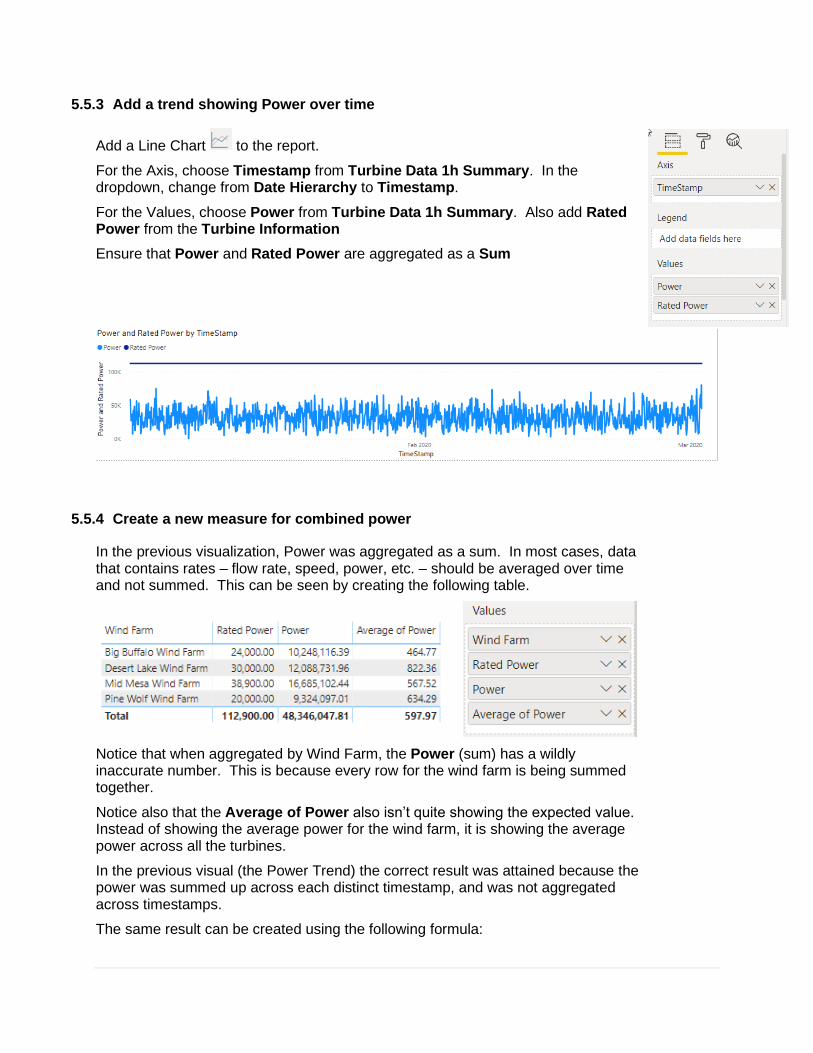
5.5.3 Add a trend showing Power over time
Add a Line Chart to the report.
For the Axis, choose Timestamp from Turbine Data 1h Summary. In the dropdown, change from Date Hierarchy to Timestamp.
For the Values, choose Power from Turbine Data 1h Summary. Also add Rated Power from the Turbine Information
Ensure that Power and Rated Power are aggregated as a Sum
5.5.4 Create a new measure for combined power
In the previous visualization, Power was aggregated as a sum. In most cases, data that contains rates – flow rate, speed, power, etc. – should be averaged over time and not summed. This can be seen by creating the following table.
Notice that when aggregated by Wind Farm, the Power (sum) has a wildly inaccurate number. This is because every row for the wind farm is being summed together.
Notice also that the Average of Power also isn’t quite showing the expected value. Instead of showing the average power for the wind farm, it is showing the average power across all the turbines.
In the previous visual (the Power Trend) the correct result was attained because the power was summed up across each distinct timestamp, and was not aggregated across timestamps.
The same result can be created using the following formula:
48 | P a g e
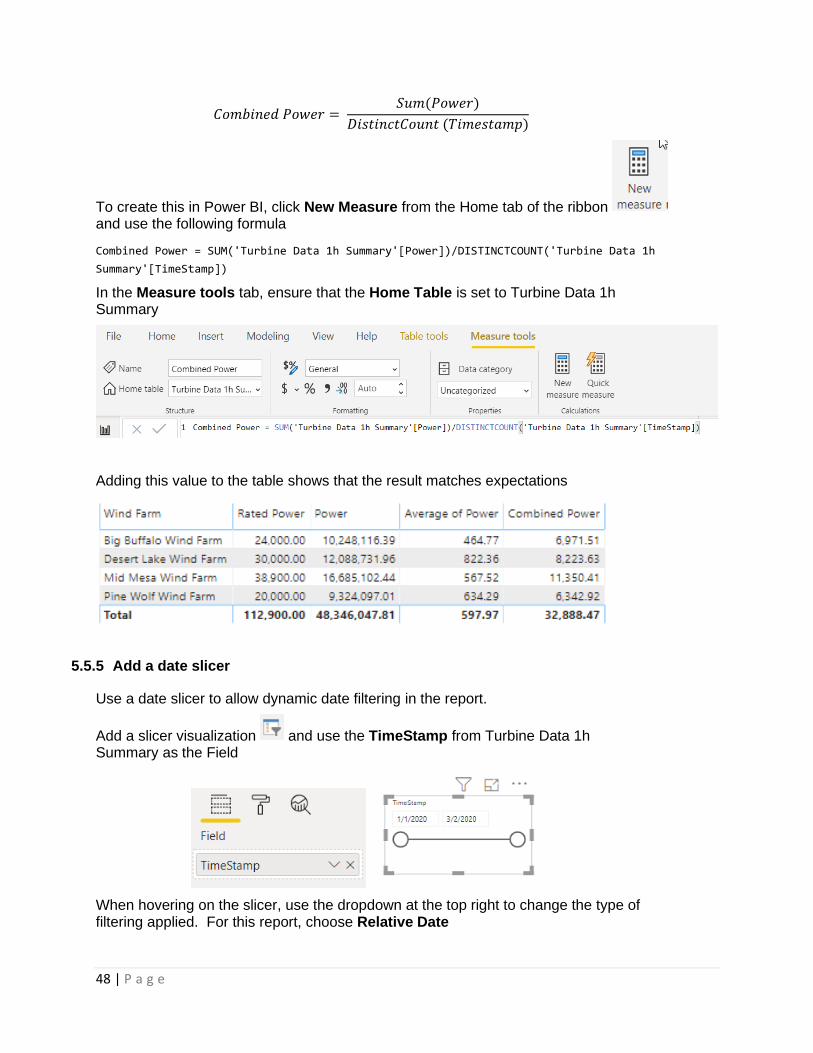
𝐶𝑜𝑚𝑏𝑖𝑛𝑒𝑑 𝑃𝑜𝑤𝑒𝑟 = 𝑆𝑢𝑚(𝑃𝑜𝑤𝑒𝑟)
𝐷𝑖𝑠𝑡𝑖𝑛𝑐𝑡𝐶𝑜𝑢𝑛𝑡 (𝑇𝑖𝑚𝑒𝑠𝑡𝑎𝑚𝑝)
To create this in Power BI, click New Measure from the Home tab of the ribbon and use the following formula
Combined Power = SUM('Turbine Data 1h Summary'[Power])/DISTINCTCOUNT('Turbine Data 1h
Summary'[TimeStamp])
In the Measure tools tab, ensure that the Home Table is set to Turbine Data 1h Summary
Adding this value to the table shows that the result matches expectations
5.5.5 Add a date slicer
Use a date slicer to allow dynamic date filtering in the report.
Add a slicer visualization and use the TimeStamp from Turbine Data 1h Summary as the Field
When hovering on the slicer, use the dropdown at the top right to change the type of filtering applied. For this report, choose Relative Date

Set the slicer to show the Last 7 Days. The report will now update to show the selected time range
5.6 Create a tooltip page to show more details
Tooltip pages can be used to show detailed information in a custom view. Once created, these pages can be added to visuals, and will replace the default tooltip. For this exercise, a tooltip page will be created that shows a detailed breakdown of each wind farm’s contribution to the total power.

50 | P a g e
5.6.1 Create and format the page
First, create a new report page by clicking the New Page icon in the bottom of the screen. Name this page Wind Farm Tooltip
Next, configure the page as a tooltip page. To do this, click on the background and
then click on the Format icon in the Visualizations pane on the right
Under the Page information section, set the slider for Tooltip to On
Under the Page size section, choose Tooltip from the type dropdown
To make formatting easier, set the Page View to Actual Size in the View tab of the ribbon
To ensure users do not navigate directly to this page, right click the page tab in the bottom of the screen and choose Hide Page

5.6.2 Add visuals to the tooltip page
Add a Stacked Bar Chart to the page, and configure it as follows:
• Axis: Wind Farm from Turbine Information
• Legend: Wind Farm from Turbine Information
• Value: Combined Power from Turbine Data 1h Summary
In the Format section, turn off the Legend and Title and turn on the Data Labels
5.6.3 Configure the power trend to use the tooltip page
On the Wind Generation Overview report page, click on the Power Trend visual.
In the Format section, turn on the Tooltip and choose
• Type: Report page
• Page: Wind Farm Tooltip
Once this is done, the tooltip page should appear when hovering over the trend.
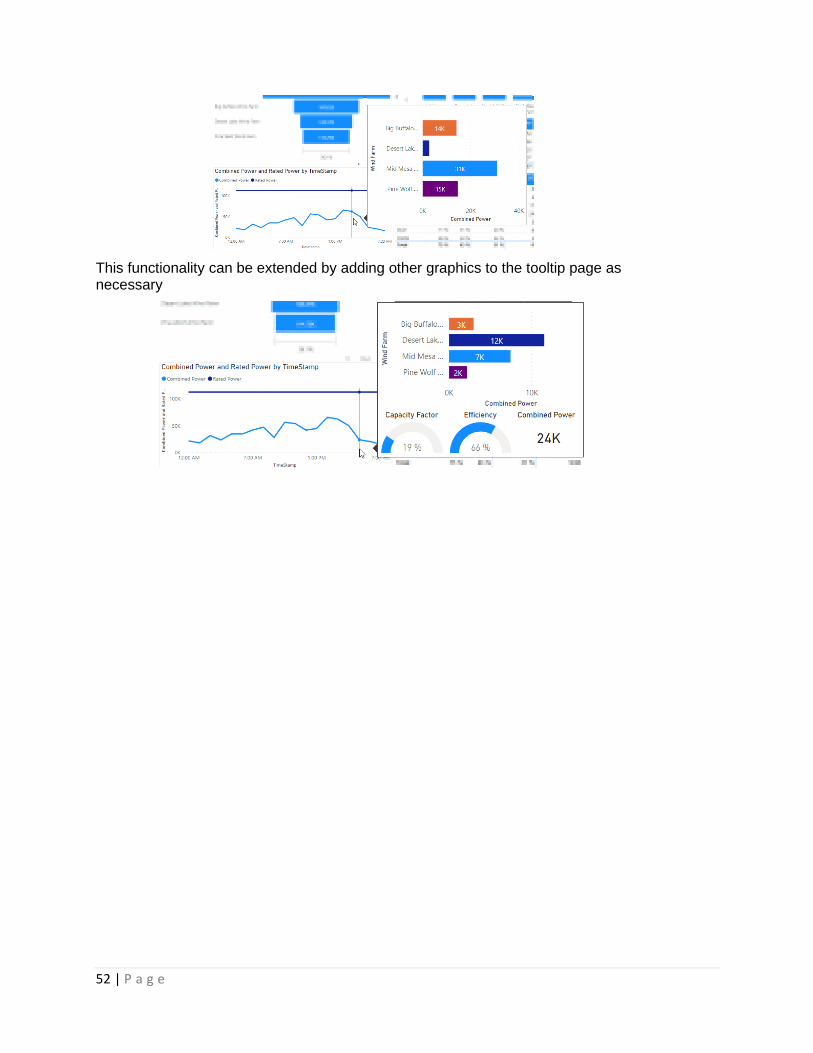
52 | P a g e
This functionality can be extended by adding other graphics to the tooltip page as necessary
6. Wind Turbine Downtime: PI Integrator Event View
6.1 Overview
So far, the published data has focused on data coming directly from assets. Often, Event Frames can provide valuable information for reports that may be difficult to include otherwise.
In this section, downtime events will be prepared using the PI Integrator, and will be incorporated into the report in the next section. Steps for the PI SQL Client are included in the Appendix.
6.2 Tasks
• Create a new Event View
• Configure the Event View shape
• Set up the publishing schedule
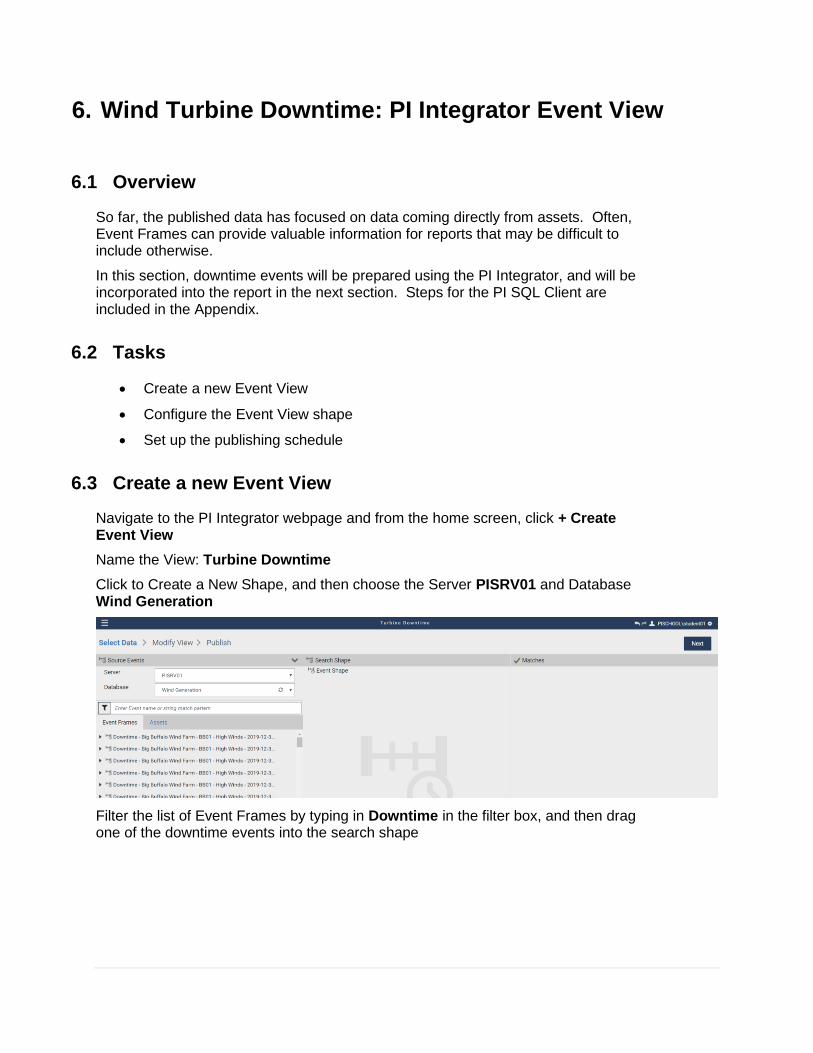
6.3 Create a new Event View
Navigate to the PI Integrator webpage and from the home screen, click + Create Event View
Name the View: Turbine Downtime
Click to Create a New Shape, and then choose the Server PISRV01 and Database Wind Generation
Filter the list of Event Frames by typing in Downtime in the filter box, and then drag one of the downtime events into the search shape

54 | P a g e
Expand the downtime Event in the left pane to show the referenced element. Add this element into the Event Shape
Add the attribute for Reason (click on the event frame to bring up its attributes), and configure the shape so that both the Event and the Element are matched using templates instead of the names
Click Next to go to the Modify View Page
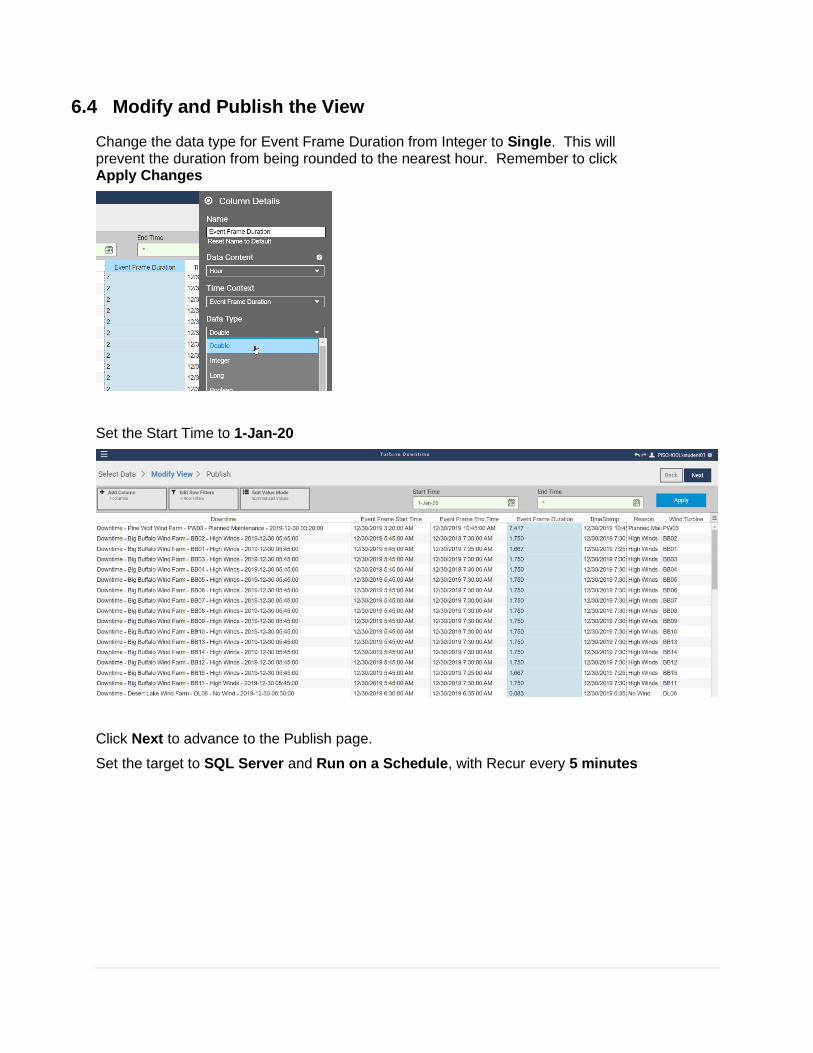
6.4 Modify and Publish the View
Change the data type for Event Frame Duration from Integer to Single. This will prevent the duration from being rounded to the nearest hour. Remember to click Apply Changes
Set the Start Time to 1-Jan-20
Click Next to advance to the Publish page.
Set the target to SQL Server and Run on a Schedule, with Recur every 5 minutes
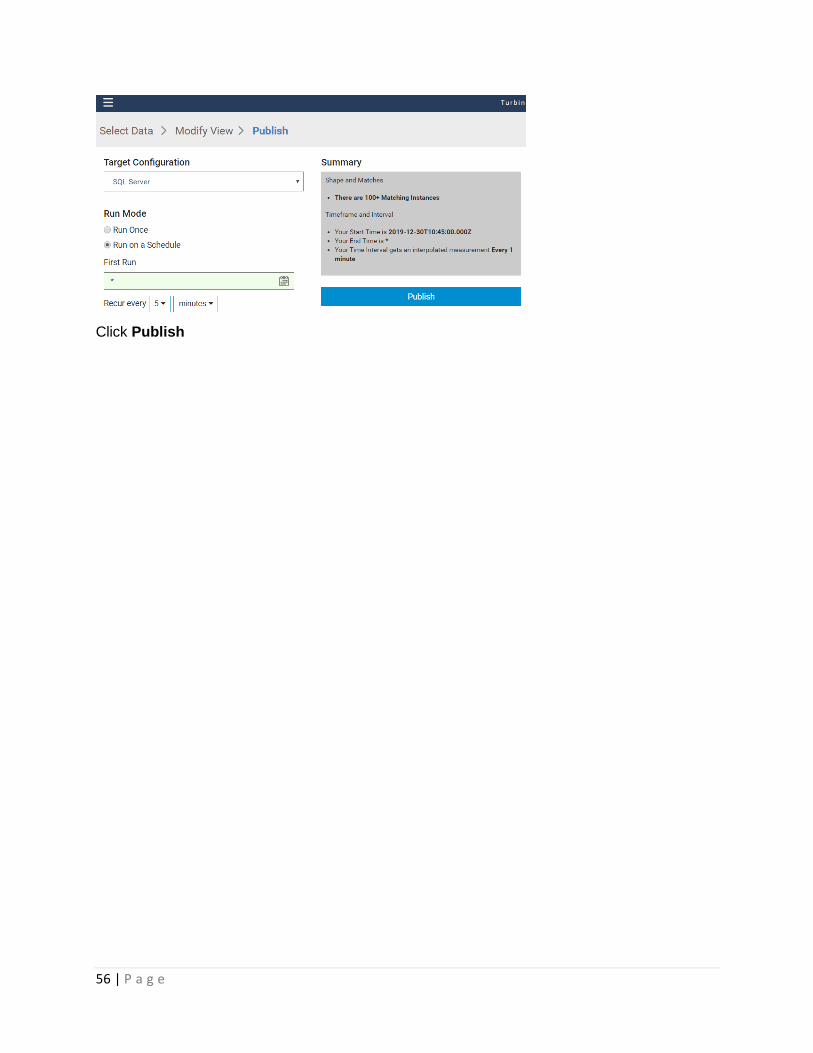
56 | P a g e
Click Publish
7. Incorporate Downtime Data into the Report
7.1 Overview
In this section, the downtime information will be incorporated into the report.
7.2 Identify the Tasks
• Add the downtime data to Power BI, either from the PI SQL Client or PI Integrator
• Add a relationship to Join the Turbine Downtime table to the Turbine Information table
• Create a chart to show downtime for each wind farm
• Create a Date Table to allow filtering of all data
• Create a Tooltip page to show extra detail
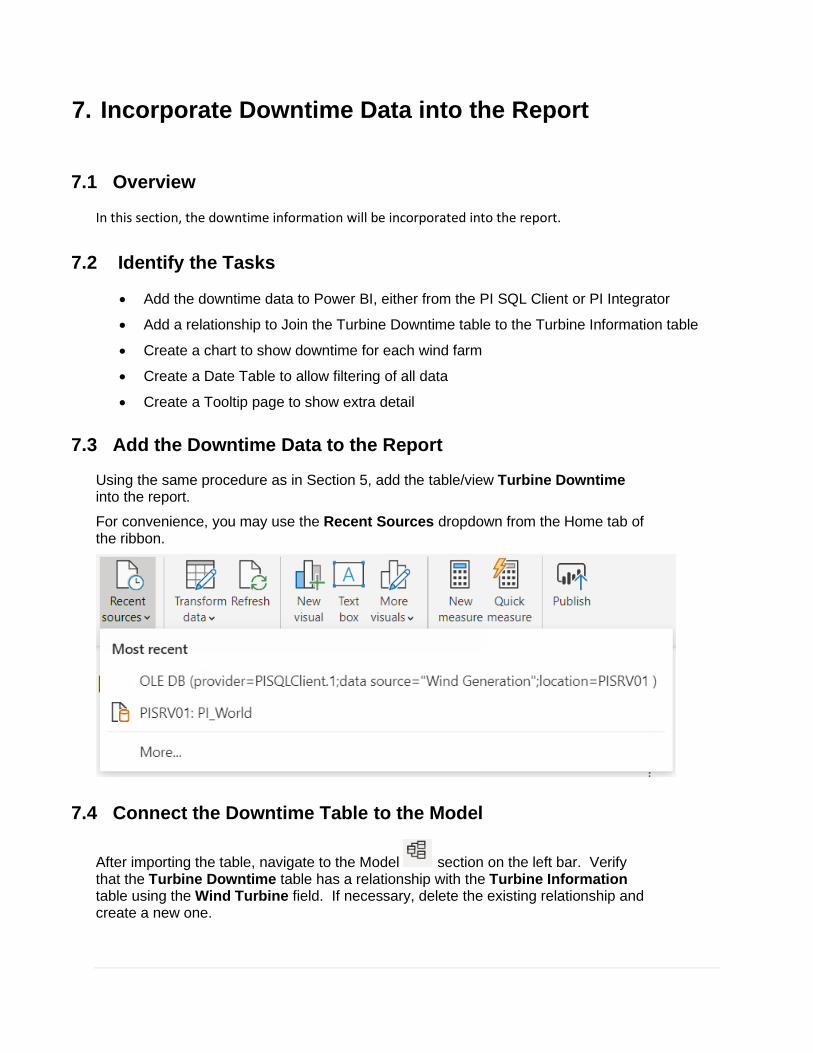
7.3 Add the Downtime Data to the Report
Using the same procedure as in Section 5, add the table/view Turbine Downtime into the report.
For convenience, you may use the Recent Sources dropdown from the Home tab of the ribbon.
7.4 Connect the Downtime Table to the Model
After importing the table, navigate to the Model section on the left bar. Verify that the Turbine Downtime table has a relationship with the Turbine Information table using the Wind Turbine field. If necessary, delete the existing relationship and create a new one.

58 | P a g e
7.5 Create a Chart of Downtime by Wind Farm
In the Report View, add a Clustered Column Chart with the following fields:
Axis: Wind Farm from Turbine Information
Values: Duration from Turbine Downtime
Notice that the duration is properly split between the four wind farms.
7.6 Create a Date Table
Adjust the date slicer to choose a different date range. Notice that the Downtime duration in the previous chart does not update.

This happens because the slicer is configured with the Timestamp from the Turbine Data 1hr Summary table, and so it does not affect the Turbine Downtime table.
To create a date slicer that will alter all the tables, it is best to create a separate Date Table.
First, enter the Data section by clicking the icon on the left side.
In the Ribbon, click on the Table Tools tab and choose New Table
Enter the following definition for the table:
Date = Calendar( Date(2020, 1, 1), TODAY())
Hit Enter
This will create a table with dates from 1-Jan-2020 to Today.
This table can now be joined to any table that has date data.
To make the joining process smoother, add a date column to both the Turbine Data 1h Summary and Turbine Downtime tables

60 | P a g e
7.6.1 Add Date Column to Turbine Data 1h Summary
To add a date column, click Transform Data in the ribbon to open the query editor.
Select the Table Turbine Data 1h Summary from the left.
Select the TimeStamp Column
In the Ribbon, navigate to the Add Column tab and choose Date > Date Only
This will create a column called Date
7.6.2 Add Date Column to the Turbine Downtime Table
For event frame tables, the process is similar. Unlike the timed data, summary event frames only have a start and end time, not individual timestamps. A robust approach for this type of linking is included in the Appendix, but for this lab, the Start Time will be used.
Follow the above procedure to create a Date column from the Start Time
7.6.3 Link the Date Table
Create relationships between the Date table and the other tables.

Now, update the Date slicer to use the Date column from the date table, and watch as the Duration updates properly .
7.7 Wind Turbine Running Performance: PI Integrator Event View (Sampled)
7.8 Overview
In the previous sections, the data sets have focused on summarized data and events to capture an overview of the data while sampling as infrequently as possible. Some analysis, however, requires high resolution data that has not been summarized.
In the PI System, Event Frames have been configured to track when each wind turbine is running (without curtailments or downtime). In this section, a data set for Wind Turbine Running Performance will be created, with high resolution data published at five-minute intervals while the events are active. This data will then be used to track the operating characteristics of the wind turbines.
Steps for the PI SQL Client are included in the Appendix.
7.9 Tasks
• Create a new Event View
• Configure the Event View to publish sampled data
• Set up the publishing schedule
7.10 Create a new Event View
Navigate to the PI Integrator webpage and from the home screen, click + Create Event View
Name the View: Turbine Running Data
62 | P a g e
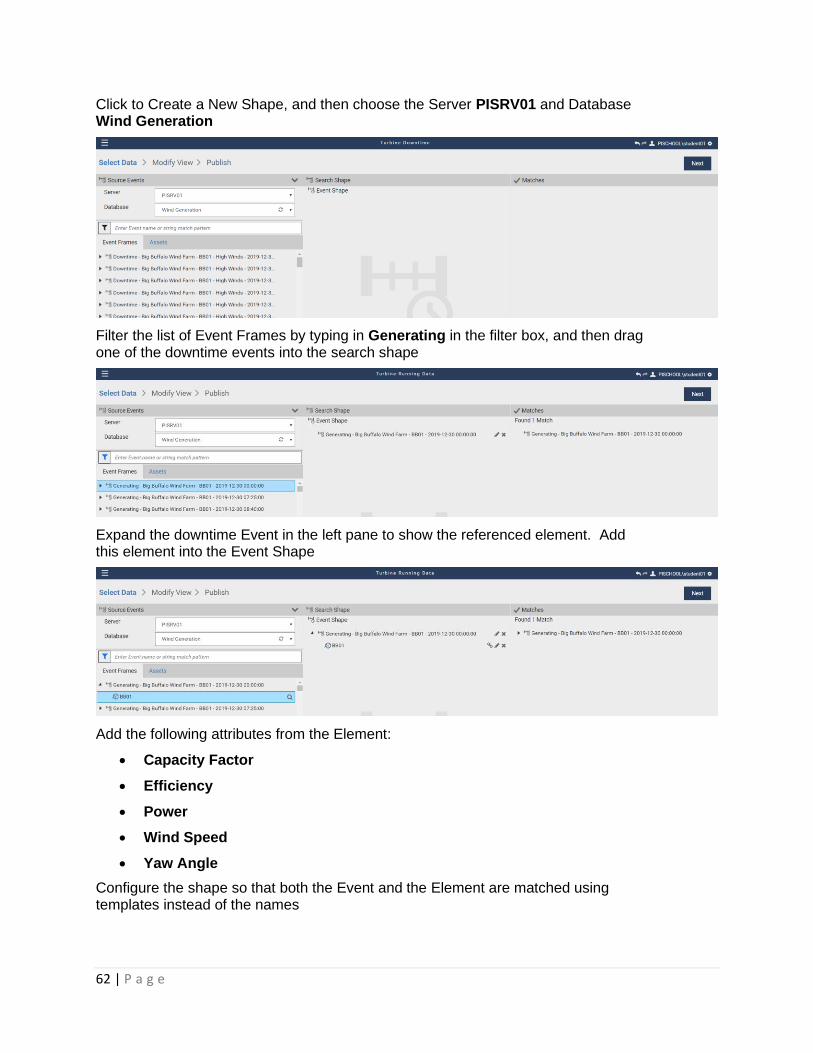
Click to Create a New Shape, and then choose the Server PISRV01 and Database Wind Generation
Filter the list of Event Frames by typing in Generating in the filter box, and then drag one of the downtime events into the search shape
Expand the downtime Event in the left pane to show the referenced element. Add this element into the Event Shape
Add the following attributes from the Element:
• Capacity Factor
• Efficiency
• Power
• Wind Speed
• Yaw Angle
Configure the shape so that both the Event and the Element are matched using templates instead of the names
Click Next to go to the Modify View Page
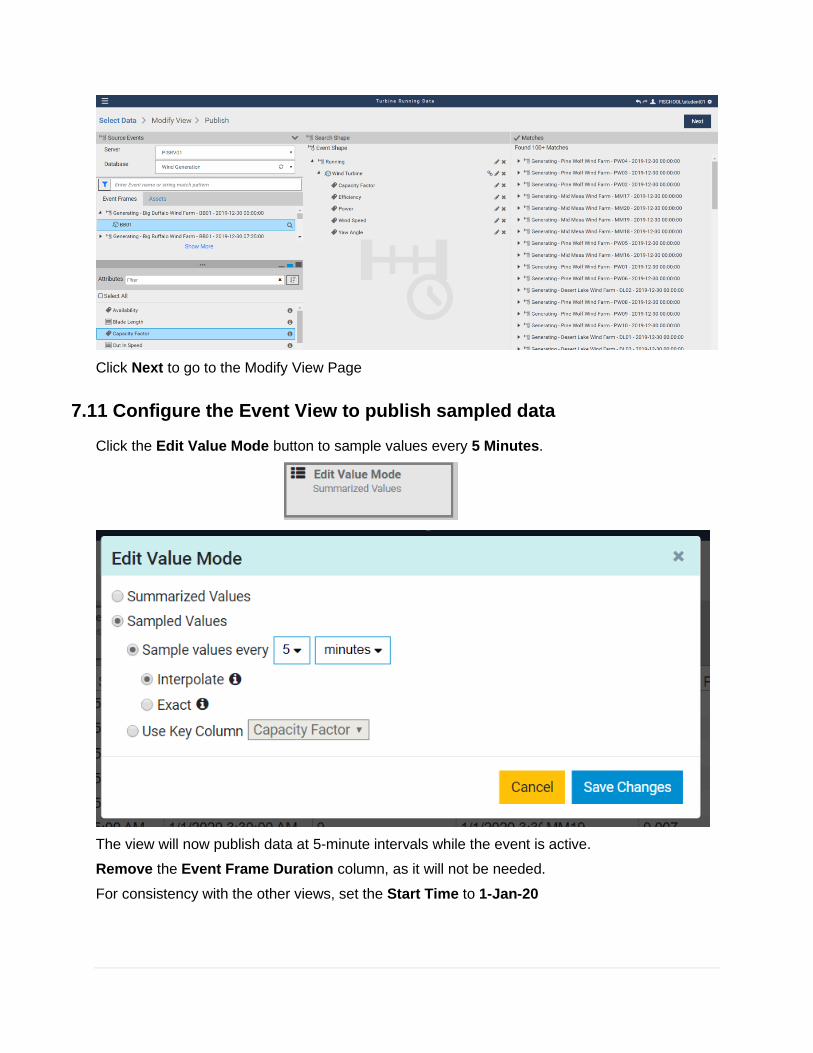
7.11 Configure the Event View to publish sampled data
Click the Edit Value Mode button to sample values every 5 Minutes.
The view will now publish data at 5-minute intervals while the event is active.
Remove the Event Frame Duration column, as it will not be needed.
For consistency with the other views, set the Start Time to 1-Jan-20

64 | P a g e
Click Next to advance to the Publish page.
Set the target to SQL Server and Run on a Schedule, with Recur every 5 minutes
Click on Publish
8. Incorporate the Running Data into the Report
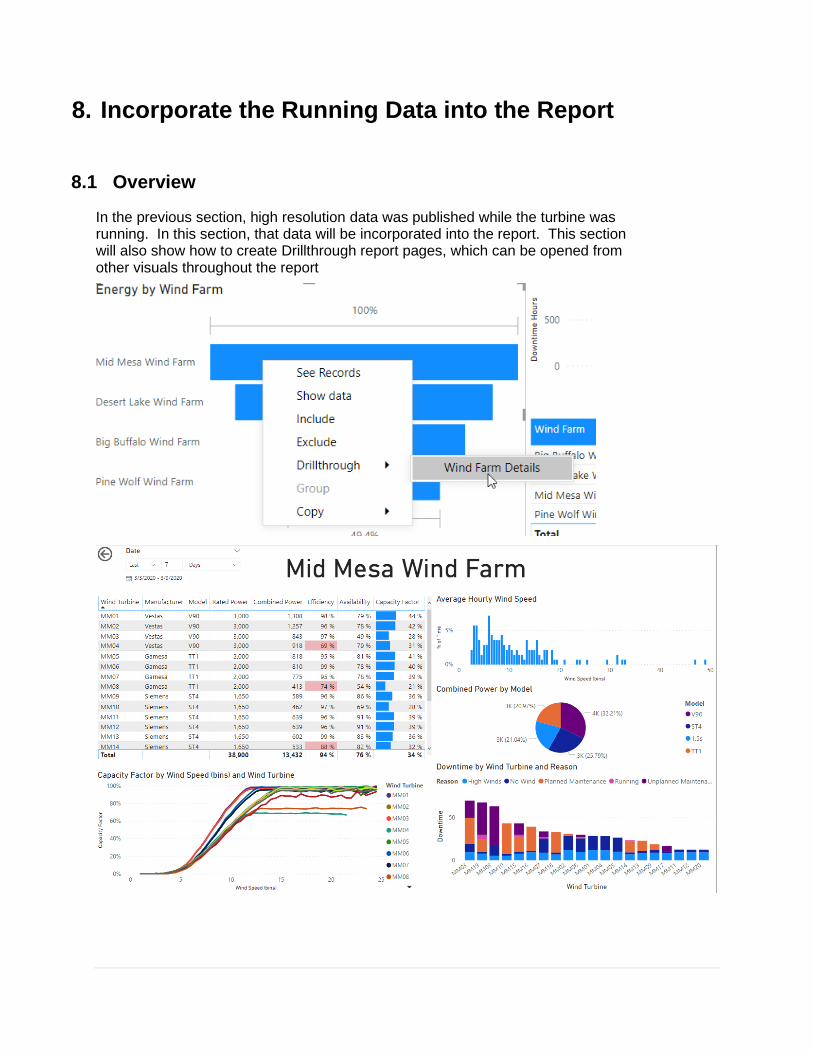
8.1 Overview
In the previous section, high resolution data was published while the turbine was running. In this section, that data will be incorporated into the report. This section will also show how to create Drillthrough report pages, which can be opened from other visuals throughout the report

66 | P a g e
8.2 Tasks
• Load the Turbine Running Data
• Create a new report page for Wind Farm Details
• Set the page to use Drillthrough
• Add visuals to the report page
8.3 Add the Turbine Running Data
Using the same procedure as in Section 5, add the table/view Turbine Running Data into the report.
For convenience, you may use the Recent Sources dropdown from the Home tab of the ribbon.
In order to join this table into the data model, follow the steps from Section 7.6.1 to add a Date column based on the Timestamp.
Join Turbine Running Data to Date on the Date field
Join Turbine Running Data to Turbine Information on the Wind Turbine field

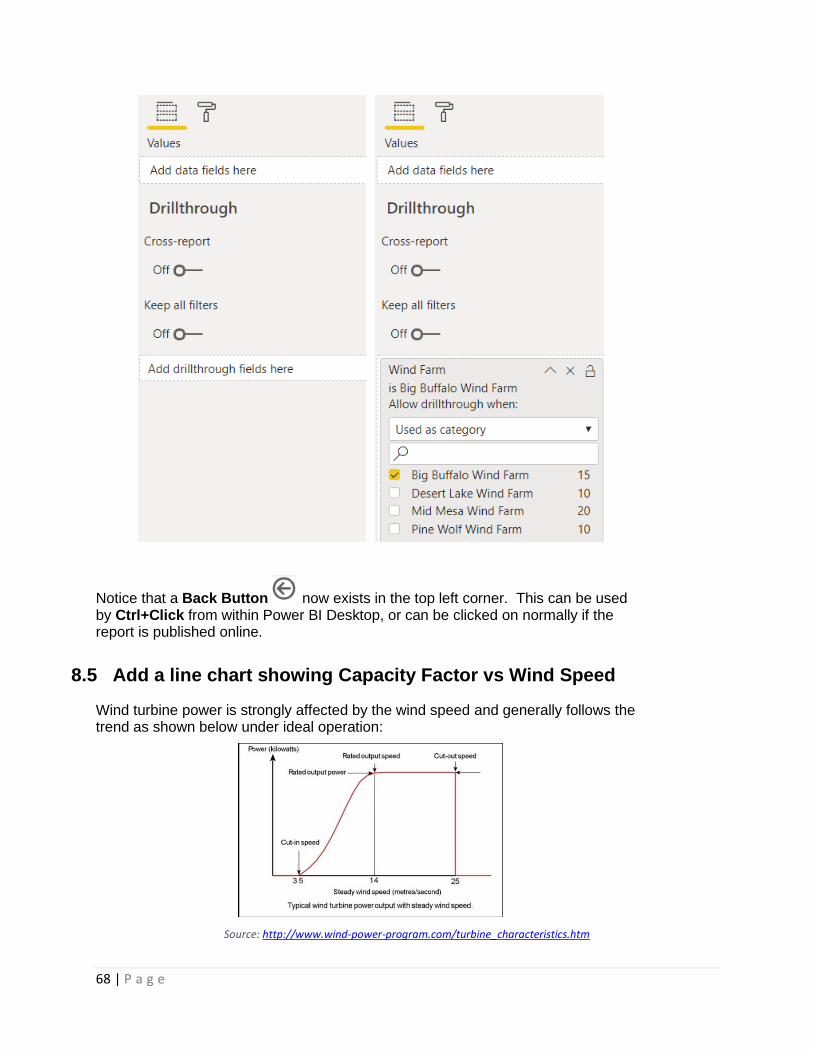
8.4 Create a drillthrough report page for Wind Farm Details
Create a new report page by clicking the New Page icon in the bottom of the screen. Name this page Wind Farm Details.
On the Visualizations pane on the right, drag Wind Farm from Turbine Information onto the Drillthrough fields. This configures drillthrough to this page from any visual that uses the Wind Farm as a category.
Ensure the Keep all filters is Off. This will prevent additional filtering of the page
68 | P a g e
Notice that a Back Button now exists in the top left corner. This can be used by Ctrl+Click from within Power BI Desktop, or can be clicked on normally if the report is published online.
8.5 Add a line chart showing Capacity Factor vs Wind Speed
Wind turbine power is strongly affected by the wind speed and generally follows the trend as shown below under ideal operation:
Source: http://www.wind-power-program.com/turbine_characteristics.htm

With the high-resolution running data available, create a line chart to show this trend for the wind
turbines in each farm.
First, add a line chart to the page and populate as follows:
• Axis: Wind Speed from Turbine Running Data
• Legend: Wind Turbine from Turbine Information
• Values: Power from Turbine Running Data (make sure the summarization is set to Average)
This should create the following trend for the turbines within Big Buffalo Wind Farm
This shows the expected power curve, but a few improvements could be implemented to address the
following shortcomings:
1. The trend is noisy and makes the different turbines difficult to distinguish from one another
2. Using Power for the values makes it difficult to distinguish between a poorly performing turbine
and a turbine with a lower rated power.
8.5.1 Group Wind Speed values into bins
To address shortcoming 1 above, Power BI has the functionality to create groups (or bins) from a given
column.
To configure the line chart to use Wind Speed bins instead of the raw Wind Speed value, Right Click on
Wind Speed in the Fields section and choose New Group

70 | P a g e
Set the Bin Size to 0.5 to create bins with a width of 0.5 m/s and click OK
This creates a new field named Wind Speed (bins) which can be used as the axis for the line chart
8.5.2 Normalize the performance measurement
To address shortcoming 2, first notice how the chart appears when showing a wind farm that has many
different models. To do this, change the drillthrough field Wind Farm to Mid Mesa Wind Farm. Note,
you may need to deselect all visuals by clicking in the backgroud to get this to show.

The turbines in this wind farm have Rated Powers between 1500 kW and 3000 kW, which makes it
difficult to see which turbines are underperforing.
To solve this, the power could be shown as a percentage of the Rated Power. For this case, the
calculation has already been performed in the PI System, and is available as the Capacity Factor. If this
were not already in place, a new measure could have been created.
Update the chart to use Capacity Factor for Values instead of Power. Remember to set the
summarization to Average and format the column to Percentage
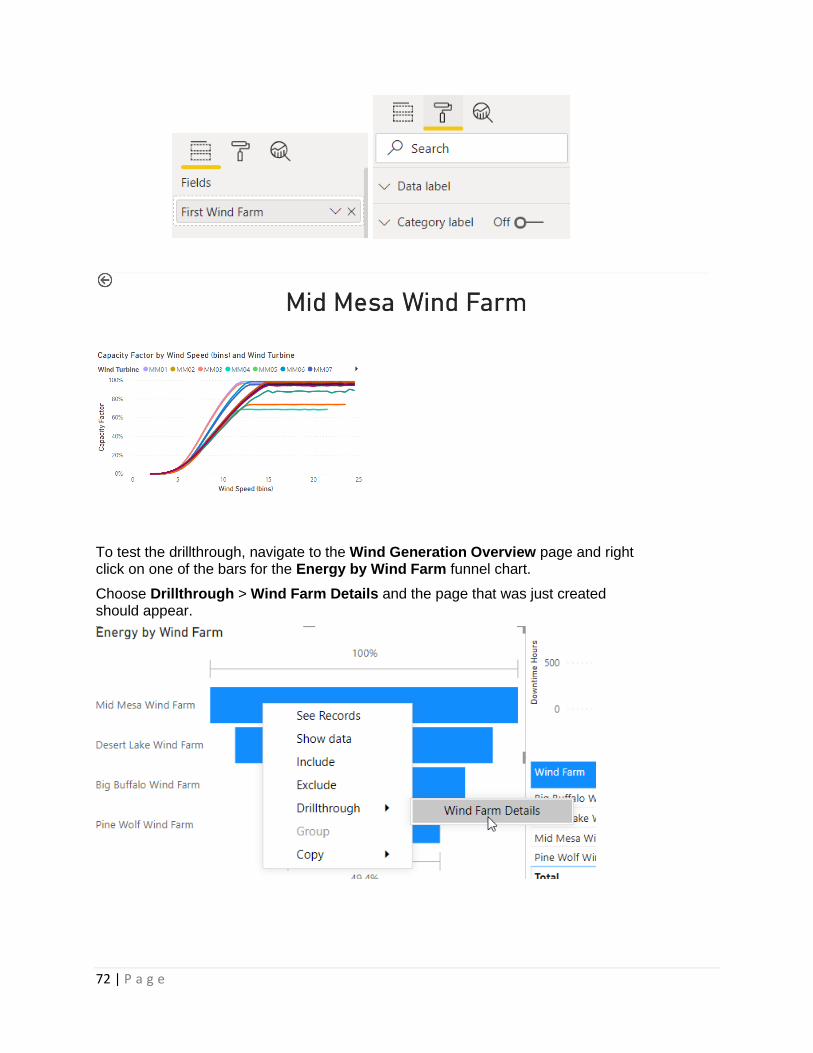
8.6 Add a title and test drillthrough
Add a title to the page by adding a value card using the field Wind Farm from Turbine Information. Position this at the top of the page and in the Format section turn off the Category label.
72 | P a g e
To test the drillthrough, navigate to the Wind Generation Overview page and right click on one of the bars for the Energy by Wind Farm funnel chart.
Choose Drillthrough > Wind Farm Details and the page that was just created should appear.
8.7 Copy and sync the date slicer
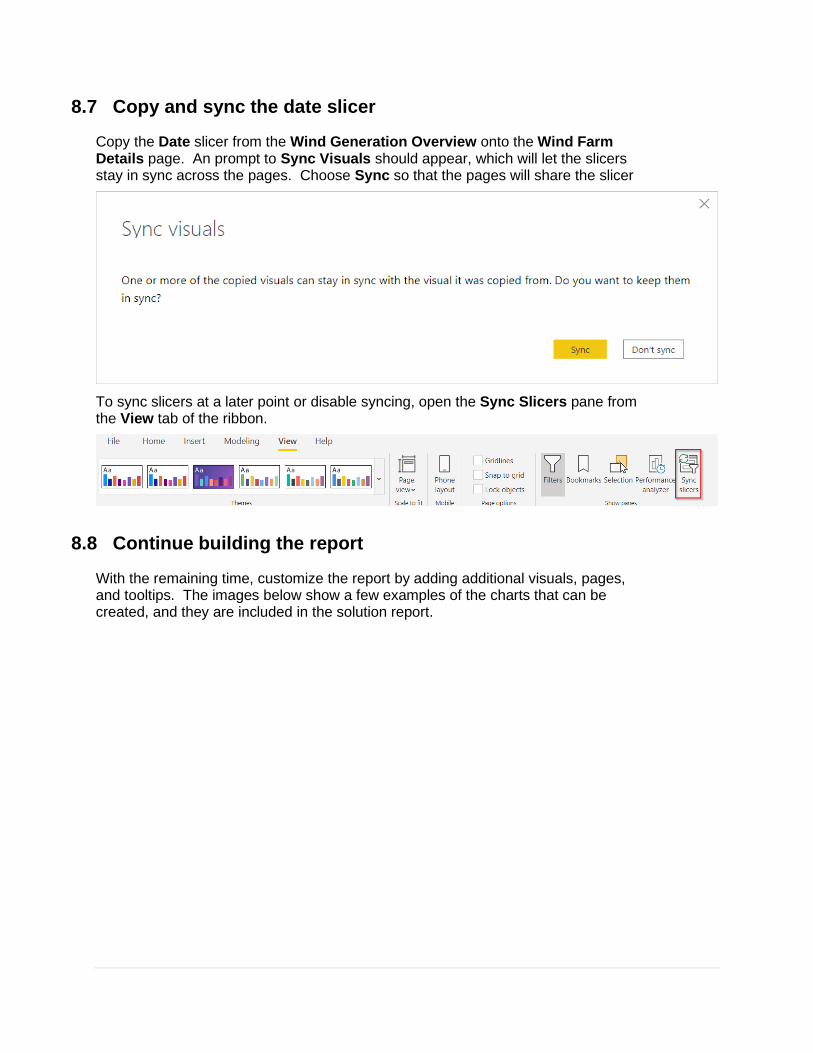
Copy the Date slicer from the Wind Generation Overview onto the Wind Farm Details page. An prompt to Sync Visuals should appear, which will let the slicers stay in sync across the pages. Choose Sync so that the pages will share the slicer
To sync slicers at a later point or disable syncing, open the Sync Slicers pane from the View tab of the ribbon.
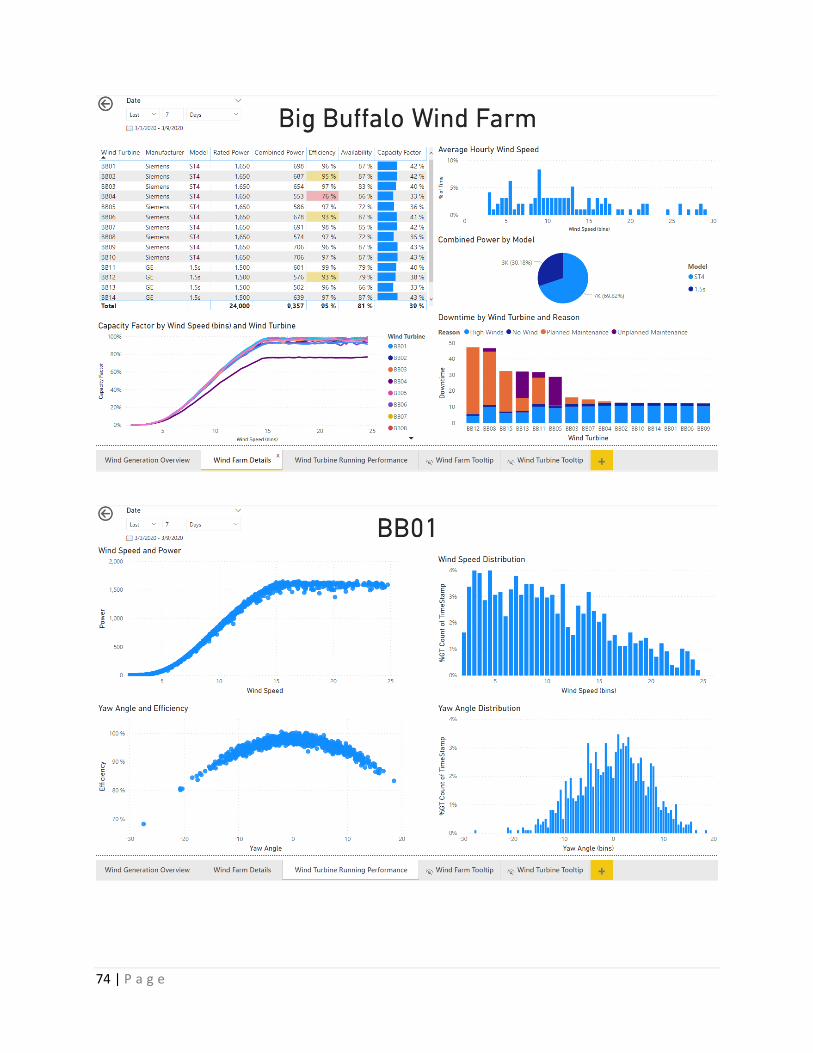
8.8 Continue building the report
With the remaining time, customize the report by adding additional visuals, pages, and tooltips. The images below show a few examples of the charts that can be created, and they are included in the solution report.
74 | P a g e


76 | P a g e
9. Appendix: Wind Turbine Downtime: PI SQL Client Event Frame Model
9.1 Overview
This section will prepare the downtime event summaries using PI SQL Client.
9.2 Create a Template-Specific Data Model for the Downtime Event
Open PI SQL Commander Lite and navigate to the Report > WindGeneration schema.
To create the data model, right click on the schema WindGeneration and click Create Template-Specific Data Model
For Template Type, choose Event Frame, and for Template choose Downtime, then click Next
On the next page, click to Add Event Frame View. This will open a column definition window.
Set the View Name to Turbine Downtime
Select the Reason attribute and drag it into the table.
In the header of the table, deselect Timestamp, Unit of Measure, and Error
The window should look similar to below

Click OK
There should now be one Data Model Object defined. Click Next to proceed to the summary page, and click Execute to create the view.
At this stage, a new view should be listed within WindGeneration as shown below:
9.3 Update the Turbine Downtime View
As with the Turbine Information view, the Turbine Downtime view does not have all the required information by default. Specifically, it is missing a Wind Turbine column and a Duration column.
To add this information, we will edit the view
Right click Turbine Downtime > Scripts > Alter View > New Query Window
In the query, modify line 3 to include ef.PrimaryReferencedElement as [Wind Turbine]
To include the downtime, modify line 3 to also include Double(ef.Duration, Hour) as Duration
The full statement should be as follows:
SELECT ef.ID, ef.Name, ef.Description, v.* , ef.PrimaryReferencedElement as [Wind Turbine] , Double(ef.Duration, Hour) as Duration , ef.StartTime , ef.EndTime

78 | P a g e
Click or F5 to execute the query and alter the view.
Execute the Predefined query once more to ensure that the view does not throw any errors

10. Appendix: Wind Turbine Running Performance: PI SQL Client Model
10.1 Overview
This section will prepare a view of the running events with 5-minute sampled data using PI SQL Client.
10.2 Create a Template-Specific Data Model for the Running Event
This section will create a view of the event frames using the Running template.
Open PI SQL Commander Lite and navigate to the Report > WindGeneration schema.
To create the data model, right click on the schema WindGeneration and click Create Template-Specific Data Model
For Template Type, choose Event Frame, and for Template choose Running, then click Next
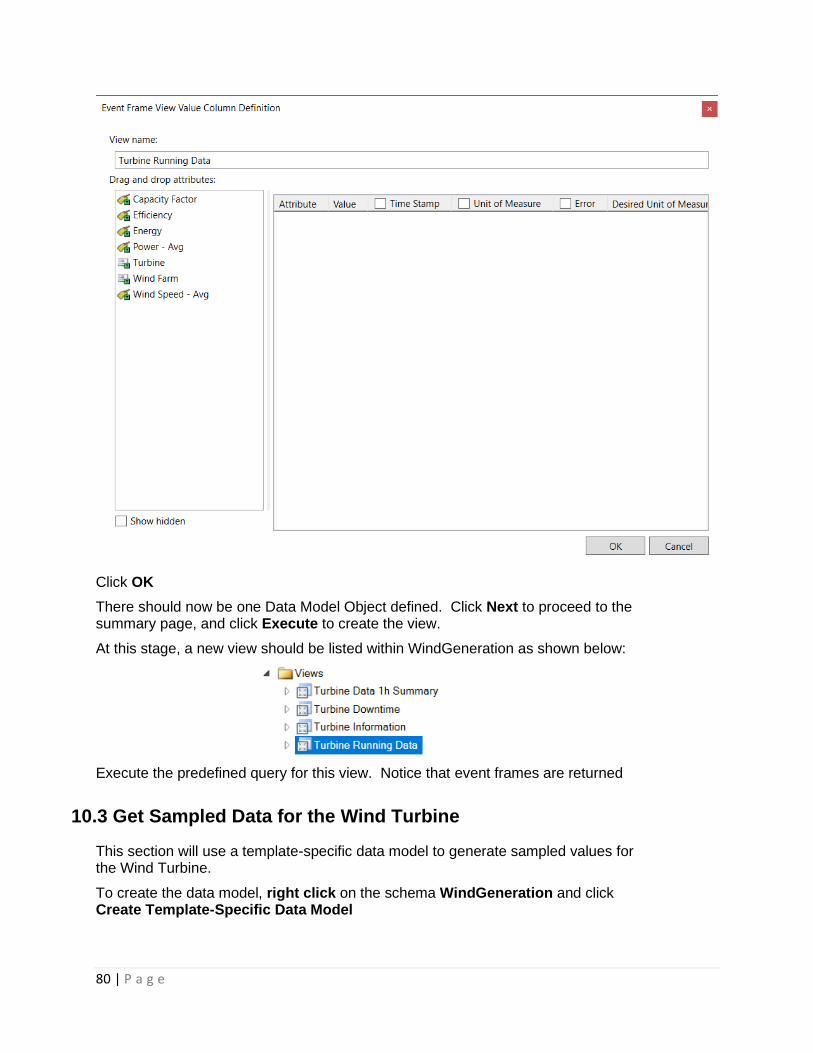
On the next page, click to Add Event Frame View. This will open a column definition window.
Set the View Name to Turbine Running Data
In the header of the table, deselect Timestamp, Unit of Measure, and Error
For this example, do not add any attributes. The next section will describe how data will be populated.
80 | P a g e
Click OK
There should now be one Data Model Object defined. Click Next to proceed to the summary page, and click Execute to create the view.
At this stage, a new view should be listed within WindGeneration as shown below:
Execute the predefined query for this view. Notice that event frames are returned
10.3 Get Sampled Data for the Wind Turbine
This section will use a template-specific data model to generate sampled values for the Wind Turbine.
To create the data model, right click on the schema WindGeneration and click Create Template-Specific Data Model
For Template Type, choose Element, and for Template choose Wind Turbine, then click Next
For the Data Model Objects, click Add GetSampledValues… (not GetSampledValue…).
Drag the following attributes into the table:
• Capacity Factor
• Efficiency
• Power
• Wind Speed
• Yaw Angle
Uncheck the Unit of Measure and Error columns
Click OK

82 | P a g e
There should now be one Data Model Objects defined. On the Data Model Objects page, click Next to proceed to the summary page and click Execute to create the object.
At this stage, the a new Table-Valued function should exist as shown below:
10.4 Update the Turbine Running Data View
In this section, the Turbine Running Data view will be altered so that 5-minute sampled data is added for each event.
First, execute the predefined query for Wind Turbine_GetSampledValues
Notice the structure of the query. The CROSS APPLY creates sampled data for each Element ID over a time range defined by a start time, an end time, and a time step.
This CROSS APPLY will be used to create 5-minute data for each of the event frames.
To add this information, we will edit the view
Right click Turbine Running Data > Scripts > Alter View > New Query Window
Modify the query as follows:
• Update line 3 to the following:
SELECT ef.ID, ef.Name, ef.Description, ef.PrimaryReferencedElement as [Wind Turbine], s.*
• Include the Cross Apply, using the
o ef.PrimaryReferencedElementID
o ef.StartTime
o ef.EndTime

CROSS APPLY [Solution].[WindGeneration].[Wind Turbine_GetSampledValues] ( ef.PrimaryReferencedElementID, --Element ID ef.StartTime, --Start Time ef.EndTime, --End Time '5m' --Time Step ) s
The final query should be as follows:
ALTER VIEW [Solution].[WindGeneration].[Turbine Running Data] AS SELECT ef.ID, ef.Name, ef.Description, ef.PrimaryReferencedElement as [Wind Turbine], s.* FROM [Master].[EventFrame].[EventFrame] ef INNER JOIN [Master].[EventFrame].[EventFrameTemplate] eft ON eft.ID = ef.TemplateID CROSS APPLY [Solution].[WindGeneration].[Wind Turbine_GetSampledValues] ( ef.PrimaryReferencedElementID, --Element ID ef.StartTime, --Start Time ef.EndTime, --End Time '5m' --Time Step ) s
WHERE ef.Template = N'Running' OR eft.InheritancePath LIKE N'\Running\%' AND ef.StartTime >= '1-Jan-20'
Click or F5 to execute the query and alter the view.
Execute the Predefined query for the view to ensure there are no errors.

84 | P a g e
11. Appendix: Linking dates
Since events may span many days, neither the start time nor the end time are suitable for converting to a date.
Instead, the solution is to create a linking table that will have separate rows for each day an event frame is active.
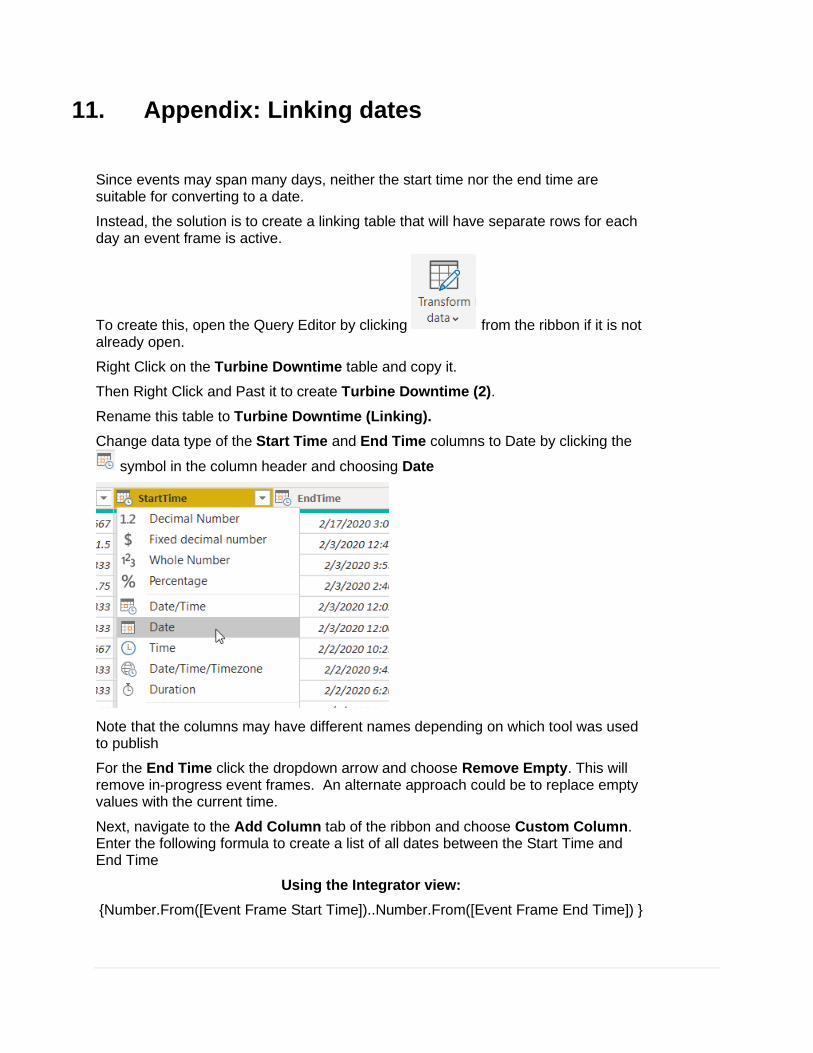
To create this, open the Query Editor by clicking from the ribbon if it is not already open.
Right Click on the Turbine Downtime table and copy it.
Then Right Click and Past it to create Turbine Downtime (2).
Rename this table to Turbine Downtime (Linking).
Change data type of the Start Time and End Time columns to Date by clicking the
symbol in the column header and choosing Date
Note that the columns may have different names depending on which tool was used to publish
For the End Time click the dropdown arrow and choose Remove Empty. This will remove in-progress event frames. An alternate approach could be to replace empty values with the current time.
Next, navigate to the Add Column tab of the ribbon and choose Custom Column. Enter the following formula to create a list of all dates between the Start Time and End Time
Using the Integrator view:
{Number.From([Event Frame Start Time])..Number.From([Event Frame End Time]) }
86 | P a g e
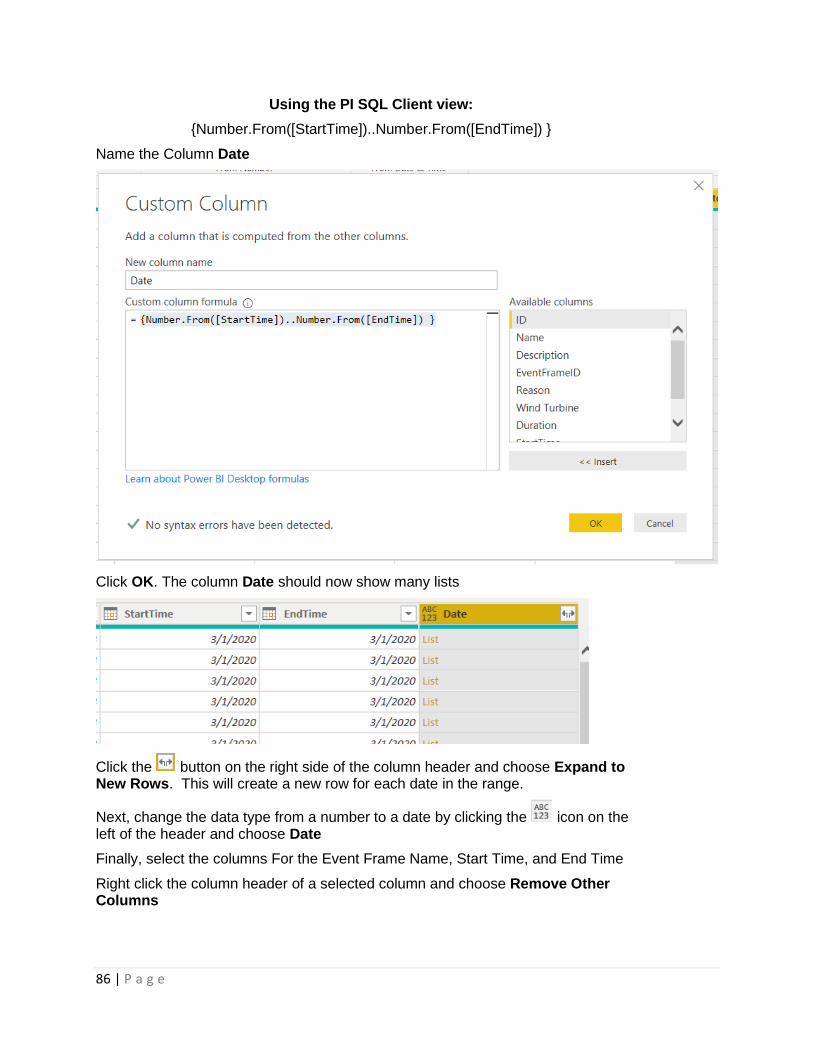
Using the PI SQL Client view:
{Number.From([StartTime])..Number.From([EndTime]) }
Name the Column Date
Click OK. The column Date should now show many lists
Click the button on the right side of the column header and choose Expand to New Rows. This will create a new row for each date in the range.
Next, change the data type from a number to a date by clicking the icon on the left of the header and choose Date
Finally, select the columns For the Event Frame Name, Start Time, and End Time
Right click the column header of a selected column and choose Remove Other Columns
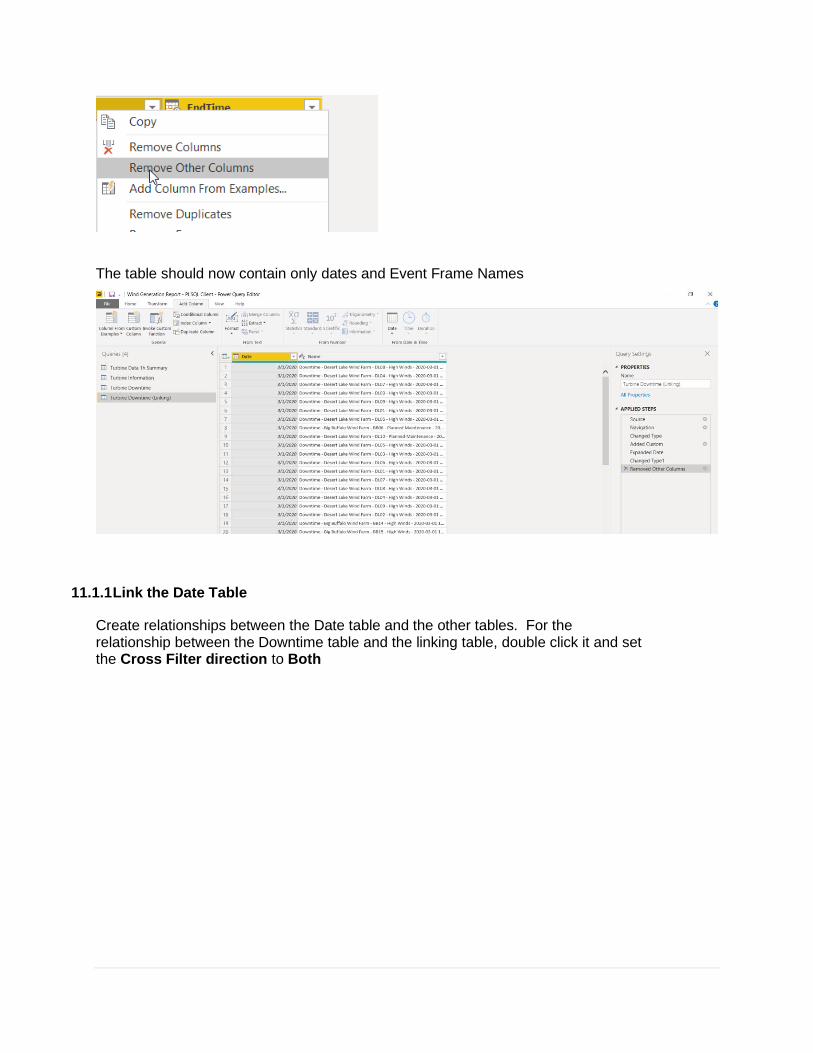
The table should now contain only dates and Event Frame Names
11.1.1 Link the Date Table
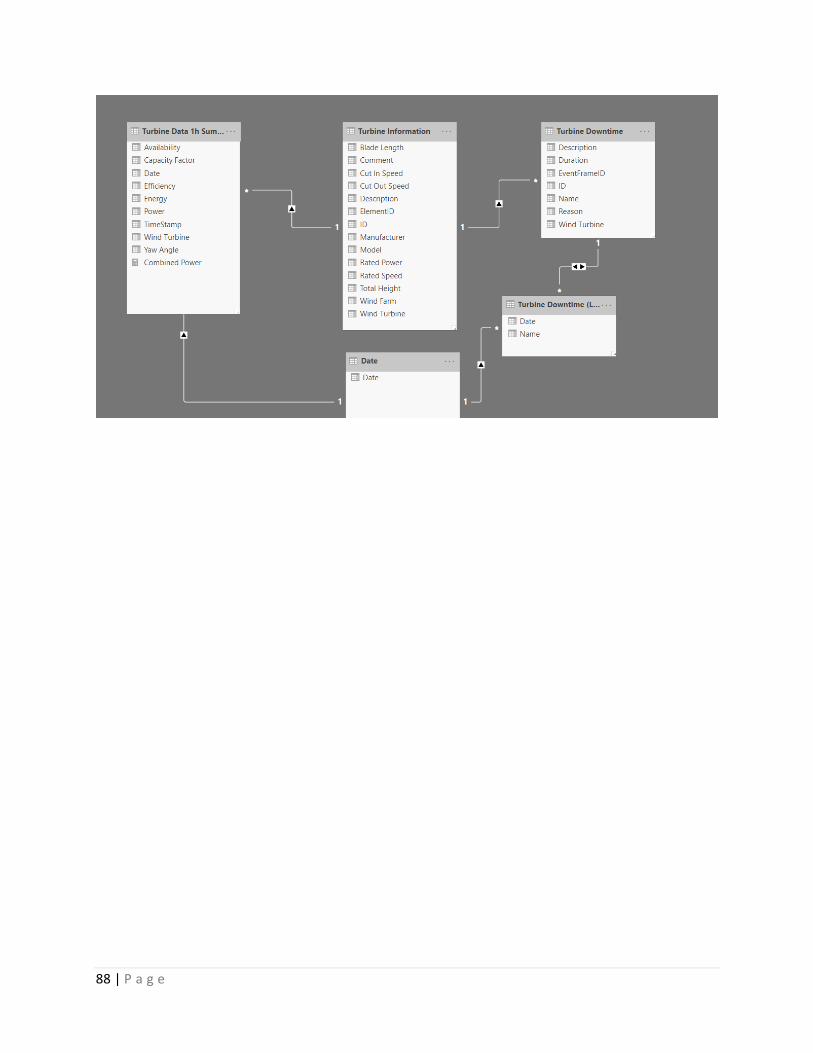
Create relationships between the Date table and the other tables. For the relationship between the Downtime table and the linking table, double click it and set the Cross Filter direction to Both
88 | P a g e

12. Appendix: PI SQL Framework: All Queries
For reference, all PI SQL Framework Queries used in this lab are included below. Before executing, replace [Report].[WindGeneration] with the appropriate catalog and schema if they differ.
12.1 Wind Turbine_GetSampledValues
CREATE FUNCTION [Report].[WindGeneration].[Wind Turbine_GetSampledValues] ( @ElementID Guid, @StartTime DateTime, @EndTime DateTime, @TimeStep String ) AS SELECT * FROM [Master].[Element].[GetSampledValues] < N'Wind Turbine', --Template { N'|Capacity Factor', -- AttributeTemplatePath N'Capacity Factor', -- ValueColumnName NULL, -- UnitOfMeasureColumnName NULL, -- ErrorColumnName NULL -- UnitOfMeasure }, { N'|Efficiency', N'Efficiency', NULL, NULL, NULL }, { N'|Power', N'Power', NULL, NULL, NULL }, { N'|Wind Speed', N'Wind Speed', NULL, NULL,
90 | P a g e
NULL }, { N'|Yaw Angle', N'Yaw Angle', NULL, NULL, NULL } > ( @ElementID, @StartTime, @EndTime, @TimeStep )
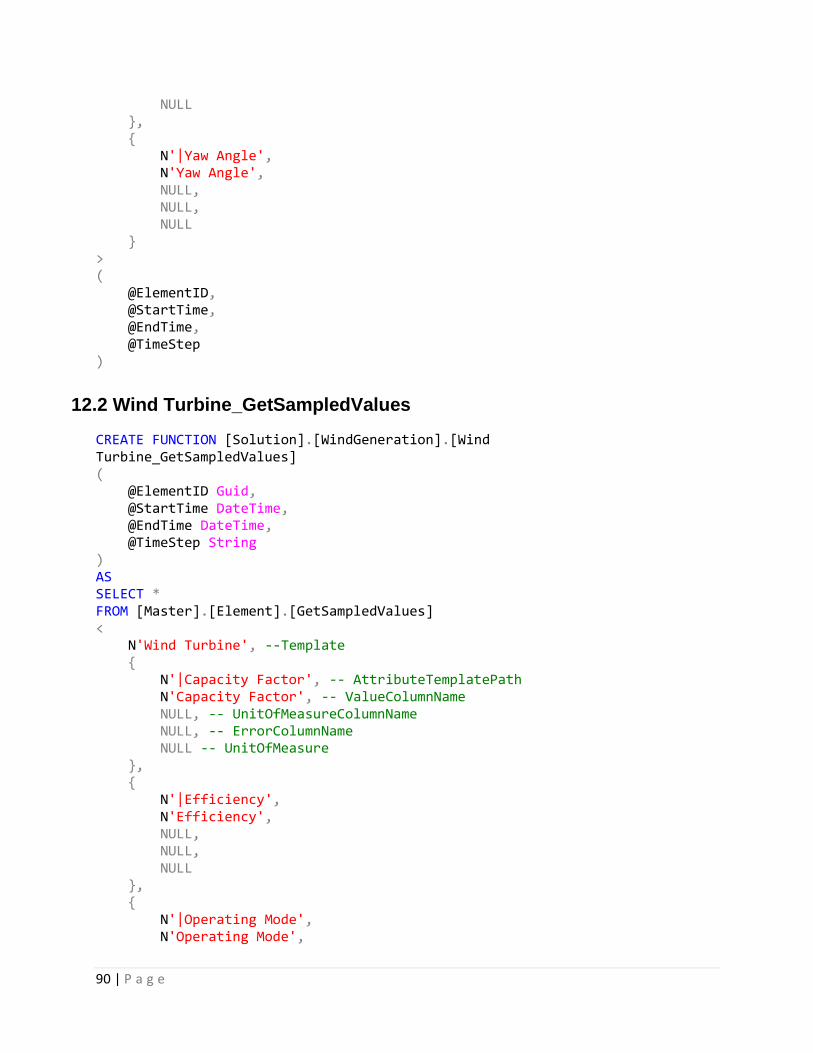
12.2 Wind Turbine_GetSampledValues
CREATE FUNCTION [Solution].[WindGeneration].[Wind Turbine_GetSampledValues] ( @ElementID Guid, @StartTime DateTime, @EndTime DateTime, @TimeStep String ) AS SELECT * FROM [Master].[Element].[GetSampledValues] < N'Wind Turbine', --Template { N'|Capacity Factor', -- AttributeTemplatePath N'Capacity Factor', -- ValueColumnName NULL, -- UnitOfMeasureColumnName NULL, -- ErrorColumnName NULL -- UnitOfMeasure }, { N'|Efficiency', N'Efficiency', NULL, NULL, NULL }, { N'|Operating Mode', N'Operating Mode',
NULL, NULL, NULL }, { N'|Power', N'Power', NULL, NULL, NULL }, { N'|Wind Speed', N'Wind Speed', NULL, NULL, NULL }, { N'|Yaw Angle', N'Yaw Angle', NULL, NULL, NULL } > ( @ElementID, @StartTime, @EndTime, @TimeStep )
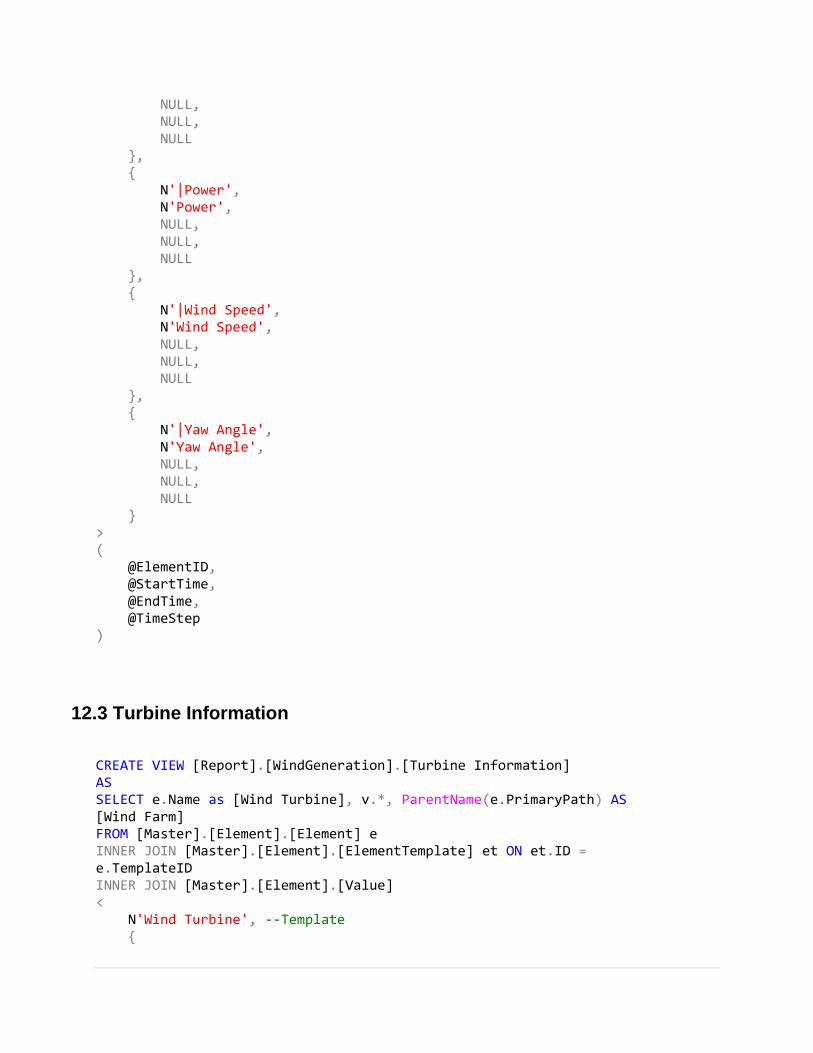
12.3 Turbine Information
CREATE VIEW [Report].[WindGeneration].[Turbine Information] AS SELECT e.Name as [Wind Turbine], v.*, ParentName(e.PrimaryPath) AS [Wind Farm] FROM [Master].[Element].[Element] e INNER JOIN [Master].[Element].[ElementTemplate] et ON et.ID = e.TemplateID INNER JOIN [Master].[Element].[Value] < N'Wind Turbine', --Template {
92 | P a g e
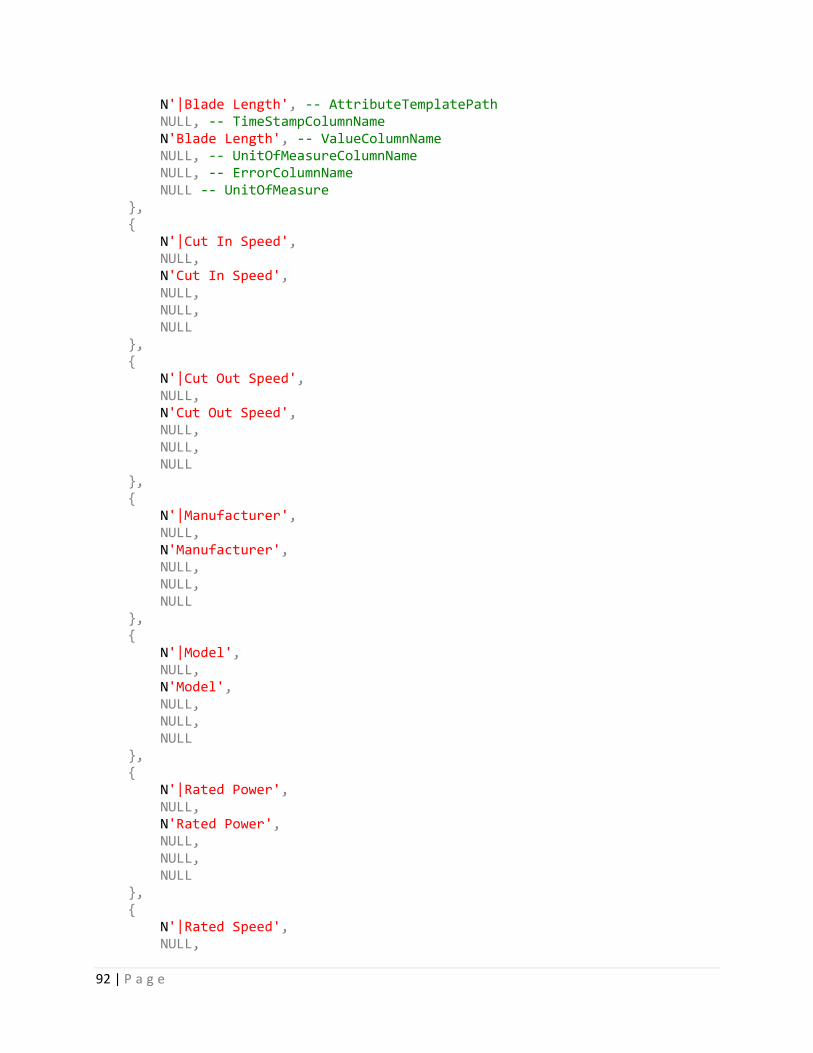
N'|Blade Length', -- AttributeTemplatePath NULL, -- TimeStampColumnName N'Blade Length', -- ValueColumnName NULL, -- UnitOfMeasureColumnName NULL, -- ErrorColumnName NULL -- UnitOfMeasure }, { N'|Cut In Speed', NULL, N'Cut In Speed', NULL, NULL, NULL }, { N'|Cut Out Speed', NULL, N'Cut Out Speed', NULL, NULL, NULL }, { N'|Manufacturer', NULL, N'Manufacturer', NULL, NULL, NULL }, { N'|Model', NULL, N'Model', NULL, NULL, NULL }, { N'|Rated Power', NULL, N'Rated Power', NULL, NULL, NULL }, { N'|Rated Speed', NULL,

N'Rated Speed', NULL, NULL, NULL }, { N'|Total Height', NULL, N'Total Height', NULL, NULL, NULL } > v ON e.ID = v.ElementID WHERE e.Template = N'Wind Turbine' OR et.InheritancePath LIKE N'\Wind Turbine\%'
12.4 Turbine Data 1h Summary
CREATE VIEW [Report].[WindGeneration].[Turbine Data 1h Summary] AS SELECT e.[Wind Turbine], s.* FROM [Report].[WindGeneration].[Turbine Information] e CROSS APPLY [Report].[WindGeneration].[Wind Turbine_GetSummaries] ( e.ID, --Element ID '1-Jan-20', --Start Time '*', --End Time '1h', --Time Step N'MostRecentTime' --Time Type ) s
12.5 Turbine Downtime
CREATE VIEW [Report].[WindGeneration].[Turbine Downtime] AS SELECT ef.Name , ef.PrimaryReferencedElement as [Wind Turbine] , Double(ef.Duration, Hour) as Duration , ef.StartTime , ef.EndTime , v.* FROM [Master].[EventFrame].[EventFrame] ef INNER JOIN [Master].[EventFrame].[EventFrameTemplate] eft ON eft.ID = ef.TemplateID INNER JOIN [Master].[EventFrame].[Value] < N'Downtime', --Template
94 | P a g e
{ N'|Reason', -- AttributeTemplatePath NULL, -- TimeStampColumnName N'Reason', -- ValueColumnName NULL, -- UnitOfMeasureColumnName NULL, -- ErrorColumnName NULL -- UnitOfMeasure } > v ON ef.ID = v.EventFrameID WHERE ef.Template = N'Downtime' OR eft.InheritancePath LIKE N'\Downtime\%'
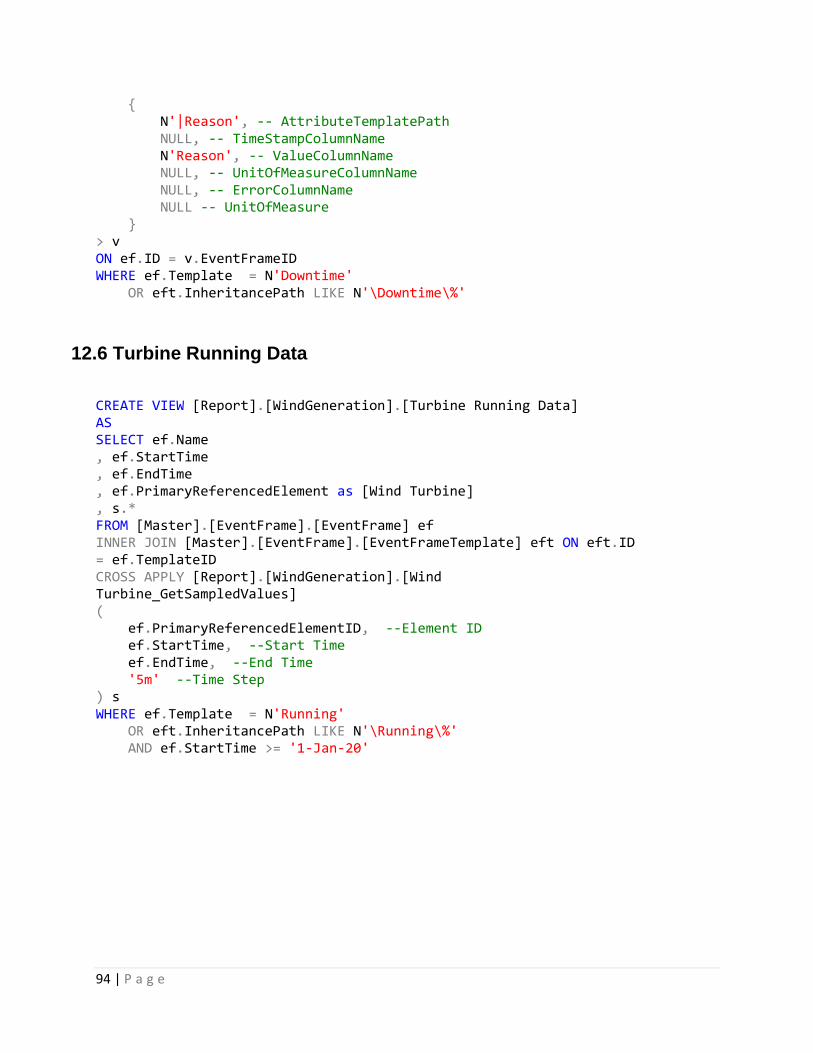
12.6 Turbine Running Data
CREATE VIEW [Report].[WindGeneration].[Turbine Running Data] AS SELECT ef.Name , ef.StartTime , ef.EndTime , ef.PrimaryReferencedElement as [Wind Turbine] , s.* FROM [Master].[EventFrame].[EventFrame] ef INNER JOIN [Master].[EventFrame].[EventFrameTemplate] eft ON eft.ID = ef.TemplateID CROSS APPLY [Report].[WindGeneration].[Wind Turbine_GetSampledValues] ( ef.PrimaryReferencedElementID, --Element ID ef.StartTime, --Start Time ef.EndTime, --End Time '5m' --Time Step ) s WHERE ef.Template = N'Running' OR eft.InheritancePath LIKE N'\Running\%' AND ef.StartTime >= '1-Jan-20'

© Copyright 2020
OSIsoft, LLC