PHYTATE AND ZINC EFFECTS ON THE CHROMIUM SHERRY ANN …
76
L PHYTATE AND ZINC EFFECTS ON THE CHROMIUM NUTRITIONAL STATUS OF THE GROWING RAT by SHERRY ANN HENLEY, B.S. A THESIS IN FOOD AND NUTRITION Submitted to the Graduate Faculty of Texas Tech University in Partial Fulfillment of the Requirements for the Degree of MASTER OF SCIENCE IN HOME ECONOMICS Approved I 1 I August, 1983
Transcript of PHYTATE AND ZINC EFFECTS ON THE CHROMIUM SHERRY ANN …

L
PHYTATE AND ZINC EFFECTS ON THE CHROMIUM
NUTRITIONAL STATUS OF THE GROWING RAT
by
SHERRY ANN HENLEY, B.S.
A THESIS
IN
FOOD AND NUTRITION
Submitted to the Graduate Faculty of Texas Tech University in
Partial Fulfillment of the Requirements for
the Degree of
MASTER OF SCIENCE
IN
HOME ECONOMICS
Approved
I
1 Acc~pted I
August, 1983
' /' I ~-
~~ \ r· { I ~
ACKNOWLEDGEMENTS
I would like to express my sincere appreciation to Dr. Barbara
Stoecker for her guidance, understanding, and patience during the
course of this research. I also wish to thank Dr. S. P. Yang and
Dr. Charles Garner for serving as committee members and providing
encouragement, advice, and suggestions on my research and education.
Support by U.S.D.A. competitive research grant # 59-2486-0-1-
480-0 and the Graduate School is greatly appreciated. I would also
like to thank Dr. Kathryn Keirn for technical assistance and advice
in the area of chromium research and animal care and surgery.
A very special thanks goes to my husband, Raymond Runyan, for
his scientific advice and expertise as well as his support and
patience. I am also grateful to my parents, Mr. and Mrs. Henley,
and to Mrs. Patricia Runyan for their encouragement and support
throughout my education.
ii

TABLE OF CONTENTS
ACKNOWLEDGEMENTS . . • • . . . . . • • • • • • • • • • • • • ii
LIST OF TABLES • • . . . . • • • • • • • • • • • • • • • • • vi
LIST OF FIGURES • • • • • • • • • • • • • • • • • • • • • • vii
I. INTRODUCTION • • • • • • • • • • • • • • • • • • 1
II. REVIEW OF LITERATURE • • • • • • • • • • • • • • • • 3
Chromium . . . . . . . . . . . . . . . . . . . 3
Chemistry • • • • • • • • • • • • • 4
Biochemistry and Mode of Action • • • • 5
Metabolism • • • . . . . • • • . . . • • 7
Physiological Role of Chromium • . • • • 11
Requirements and Nutritional Assessment • • • • • • • • • • . . . . . 14
• Phytic Acid • • • • • • • • • • . . . . . 16
Chemistry . . . . . . . . . . . . . . . 16
Biochemistry and Occurrence . . . . . . 17
Nutritional Implications . • • • • • 18
III. MATERIALS AND METHODS • • • • • • • • • . . . . 21
Experiment One . • • . . • • • • • • • • • 21
Animals and Diets • • • • • • • • • • • 21
IVGTT • • • • • • • • • • • • • • • • • 22
Glucose Determination • • • • • • • • • 22
Insulin Assay . . . . . . . . . . . . . 23
iii
IV.
Chromium Analysis
Phytate Analysis •
• • • • • • • • • • •
. . . . . . . • • • •
Experiment Two • • • • . . . • • • • • • • • •
Animals . . . . . . . . . . . . . . . . IVGTT • • • • • • • • • • • • • • • • •
Glucose Determination . . . . . . . . . Insulin Assay . .
Chromium Analysis
. . . . . . . . . . .
. . . . . . . . . . . Experiment Three • • • • • • • • • • • . . . .
Animals • • • • • • • • • • • • • • • •
OGTT •• . . . . . . . . • • . . . . • •
Glucose Determination . . . . . . . . . Insulin Assay . . . . . . . . . . . . . Chromium Analysis . . . . . . . . . . . Phytate Analysis • • • • • . . . . . . .
Statistical Analysis • • • . . . . . . . . . . RESULTS . . . . . . . . . . . . . . . . . . . . . .
24
24
26
26
27
27
27
27
28
28
29
29
29
30
30
30
33
Experiment One • . • • • . . . • • . • . • • • 33
Growth Rates • . . . • • • . • • • . • • 33
Dietary Analysis •
Glucose and Insulin
iv
• • • • • • • • • • •
• • • • • • • • • •
33
33

Experiment Two • . • . . • • • • • • • . . . . Growth Rates • • • • • . . . . . . . . . Dietary Analysis • . . . . . . . . . . . Tissue Analysis . . . . . . . . . . . . Glucose and Insulin • • • • • • • • • •
Experiment Three . • • . . . . . . . . . . . . Growth Rates . • • • . . . . . . . . . . Dietary Analysis . . . . . . . . . . Glucose and Insulin . . . . . . . . . .
v. DISCUSSION . • • • • • • . . . • • • • . . . . . Growth Rates . • • • . . . . . • • • • • . . . Diet and Tissue Analysis • • . . • • • • • • •
Glucose and Insulin . . . . . . . . . . . . .
VI. SUMMARY AND CONCLUSIONS • • • • • • • • • • • • • •
REFERENCES • • . . . . . • • • • • • • • • • • • • • • • • •
APPENDICES • . . . . . . . . • • • • • • • • • • • • • • • •
A.
B.
PROGRAM SPECIFICATIONS USED WITH THE FLAMELESS ATOMIC ABSORPTION SPECTROPHOTOMETER . . . . . . . .
COMPOSITION OF MINERAL MIX . . . . .
v
34
34
34
34
35
35
35
35
36
51
51
52
53
57
59
66
67
68

LIST OF TABLES
1. COMPOSITION OF BASAL DIET FOR EXPERIMENTS ONE AN'D TWO • • . • . • • . • • • • • • • • • • • · 31
2. COMPOSITION OF BASAL DIET FOR EXPERIMENT THREE . . . . 32
3. PHYTATE AN'D CHROMIUM CONTENT OF DIETS FOR EXPERIMENT ONE . . . . . . . . . . . . . . . . . . . . . . . . 39
4. PLASMA GLUCOSE REMOVAL RATES FOR EXPERIMENT ONE 40
5. INSULIN VALUES FOR EXPERIMENT ONE . . . . . 41
6. CHROMIUM CONTENT OF DIET AND LIVER FOR EXPERIMENT TWO • • • • • • . . • . • • . • . • • . • · • • · 43
7 . PLASMA GLUCOSE REMOVAL RATES FOR EXPERIMENT TWO 44
8. GLUCOSE AN'D INSULIN VALUES FOR EXPERIMENT TWO . . 45
9. PHYTATE AN'D CHROMIUM CONTENT OF DIETS FOR EXPERIMENT THREE . . . . . . . . . . . . . . . . . . . . 47
10. GLUCOSE VALUES FROM OGTT FOR EXPERIMENT THREE 48
11. GLUCOSE INCREMENT FROM OGTT FOR EXPERIMENT THREE 49
12. INSULIN VALUES FROM OGTT FOR EXPERIMENT THREE . . . 50
vi

LIST OF FIGURES
1. Mean body weight for groups during Experiment One • . • . . . . . . • . . . . . . . . • . . . • . • 38
2. Mean body weight for groups during Experiment Two . . • . . • • . • • . . . . . . . . . . . • . . . 42
3. Mean body weight for groups during Experiment Three . . • . . . . . . . . . . . . . . . . . • . • • 46
•
vii

CHAPTER I
INTRODUCTION
The investigation of essential trace element requirements for
man and laboratory animals began in the seventeenth centurv with iron
and is continuing today with trace elements such as chromium.
Chromium, a subject of nutritional research since the 1950's,
has been found to be essential both for man and some laboratory
animals.
Chromium is involved in carbohydrate metabolism, with glucose
tolerance impairment being the main deficiency indicator. However,
chromium is also involved in protein and lipid metabolism.
Nutritional assessment of chromium status has been hampered bv
chromium analysis techniques and differences in bioavailability of
the various forms of chromium.
Some world-wide health problems have been related to decreased
bioavailability of minerals by binding to chelating agents such as
phytate. Phytate is found priMarily in grains and legumes and poses
the biggest problem in those populations consuming grains and legumes
as their staple diet. Therefore, the possibility of chromium being
bound and made unavailable by phytate is of concern to both the
scientific community and to the public sector.
The problem of phytate as a chelating agent for various trace
elements is still controversial as is the problem of trace element
interactions. The goal of this research was to assess the effect, if
1

2
any, of phytate or zinc on the chromium nutritional status of the
growing rat. Specific objectives include the following:
1. To produce and measure a chromium sufficiency and deficiency
as assessed by plasma glucose removal rates from an
intravenous glucose tolerance test and by glucose and
insulin curves from an oral glucose tolerance test.
2. To determine if sodium phytate added to a semipurified,
chromium deficient diet will bind remaining chromium and
further increase a chromium deficiency.
3. To determine if excess zinc, added to chromium deficient and
adequate diets, will affect chromium nutritional status as
measured by glucose removal rates and liver chromium
concentration.

CHAPTER II
REVIEW OF LITERATURE
Chromium
The immediate history of chromium research began in 1955 with
the observation by Mertz and Schwarz (1955) that rats fed a 30%
Torula yeast diet developed an impairment of glucose tolerance as
measured by intravenous glucose tolerance tests. Feeding vitamin E,
sulfur amino acids, factor 3, or selenium, all of which protect the
liver, did not prevent development of glucose intolerance (Schwarz
and Mertz, 1957). Addition of brewers' yeast to the diets, however,
did prevent the glucose intolerance and a glucose tolerance factor
was postulated (GTF) (Mertz & Schwarz, 1959). Chromium (III) was
identified as the component responsible for GTF's metabolic action
(Schwarz and Mertz, 1959).
Depletion of this essential trace element, chromium, has been
associated with impaired growth, decreased survival, fasting
hyperglycemia and glycosuria, elevated serum cholesterol, and aortic
plaques (Schroeder and Balassa, 1965; Schroeder, 1968 and 1969; Mertz
et al., 1974). Jeejeebhoy et al., (1977) indicated chromium
deficiency was also characterized by peripheral neuropathy, negative
nitrogen balance, and a decreased respiratory quotient.
Chromium is involved in protein, lipid and carbohydrate
metabolism as an essential element for optimal insulin activity in
all insulin-dependent systems tested (Roginski and Mertz, 1969;
Mertz, 1969). A decreased sensitivity of peripheral tissue to
exogenous or endogenous insulin resulted in "the hypothesis that
3
4
chromium acts as a cofactor in the initiation of peripheral insulin
action" (Mertz et al., 1974). Those groups at highest risk for
chromium deficiency have been identified as the aged, diabetics,
offspring or siblings of diabetics, pregnant women, and malnourished
children (Hambidge, 1974; Boyle et al., 1977; and Saner, 1980).
Chemistry
Chromium is a transition element in the first series and can
occur in every oxidation state from -2 to +6; however, the most
common states are ground state 0, +2, +3, and +6 (Mertz, 1967,
1969). Trivalent chromium is the most stable form of the element as
well as the most biologically active form (Mertz 1967, 1969).
Chromium(III) has a strong propensity to form coordination compounds,
complexes, and chelates (Mertz, 1967, 1969). Ligands coordinated
with chromium(III) have a very slow rate of exchange. Possible •
complexes include the following: water, ammonia, urea,
ethylene-diamine, halides, sulfate, and anions of various organic
acids (Mertz, 1967, 1969; Saner, 1980). The coordination number of
chromium(III) is 6 with an octahedron formation (Mertz, 1969).
Theoretically, slow ligand exchange would make chromium(III)
complexes more suitable in a structured role as a cofactor for
binding hormones to receptors or stabilizing proteins and less
suitable as active sites for enzymes which require a fast exchange of
ligands (Mertz, 1969). With time, alkaline conditions, and
temperature in the physiological range, coordinated compounds of
chromium(III) and water are hydrolyzed to hydroxo groups and form
polynuclear elated complexes (Mertz, 1967, 1969; Saner, 1980). This
5
process, referred to as alation, causes chromium complexes to
precipitate out of solution as chromium hydroxides and become
biologically ineffective (Mertz, 1967, 1969; Saner, 1980). However,
olation is prevented or reversed if chromium(III) compounds are
coordinated with stabilizing ligands (Mertz, 1969). Reversal of
alation is not likely under physiological conditions since the time
required is great.
Biochemistry and Mode of Action
The degree of biological activity of chromium(III) depends on
the type of compound in which it is found (Mertz, 1969; Saner, 1980).
There are two categories of compounds. The first includes simple
chromium compounds with chloro, aqua, or acetate groups or complexes
with amino acids, sugar, organic acids, or vitamins (Saner, 1980).
Natural chromium complexes found in plants and animals, including
brewers' yeast, fall into the second category and exhibit higher
biological activity than the first category of simple chromium
compounds (Saner, 1980). The second category of compounds is
referred to as "glucose tolerance factor" or GTF (Hertz et al.,
1974).
The structure of purified GTF prepared from yeast has been
postulated as a di-nicotinato, triamino acid, Cr(III) complex with
glycine, cysteine, and glutamic acid. Mass spectrometry was used as
the method of analysis (Toepfer et al., 1977). Synthetic GTF
compounds were formulated and found to have equal or better
insulin-potentiating activity in vitro than GTF frorn brewers' yeast
but thejr intestinal absorption was poor and placental transport was

6
lacking (Hertz et al., 1969, 1974). The synthetic GTF complexes did,
however, demonstrate more biological activity in vivo than simple
chromium compounds (Mertz et al., 1974). Synthetic GTF complexes
have been found to have different organ distribution than simple
chromium salts or GTF from brewers' yeast (Hertz and Roginski, 1971;
Mertz et al., 1974). Tuman and Daisy (1977) compared the effects of
GTF from brewers' yeast and synthetic GTF by injecting genetically
diabetic mice intraperitoneally with one of the two chromium
compounds. A reduction of high blood glucose levels, triglycerides,
and cholesterol were measured in both the synthetic and natural GTF
groups. The synthetic GTF, however, had a much more rapid onset of
blood glucose lowering effects than did GTF from brewers' yeast
(Tuman and Daisy, 1978).
Schroeder et al. (1963) tested the effect of chromium, cadmium
and lead on the growth and survival of laboratory animals to evaluate
toxicity and essentiality effects. The same study indicated that
simple chromium(III) salts (5 ppm) added to the drinking water of
male rats fed a low chromium diet increased growth rates, mature
weights and survival rates up to 510 days.
Several in vitro studies using epididymal fat tissue from rats
indicated that chromium significantly increased the effect of insulin
on the incorporation of glucose into the cell (Nertz et al., 1961;
Mertz and Roginski, 1963; Campbell and Mertz, 1963). Another in
vitro studv using polarographic techniques suggested that chromium,
as part nf a ternary complex, initiated the formation of disulfide
linkages between the intra-chain disulfide of insulin and
7
sulfhydryl groups of the mitochondrial membrane (Christian et al.,
1963). More information was obtained from additional in vitro
studies using D-galactose, a nonutilizable sugar requiring insulin
for cell uptake, as a substrate. The rate of entry of the sugar into
rat epididymal fat pad was only slightly increased with insulin but
greatly increased with insulin and chromium and it demonstrated dose
response characteristics (Mertz and Roginski, 1963; Mertz, 1967).
Similar effects were shown during other in vitro experiments using
glucose transport into isolated rat lens (Mertz, 1979) and
insulin-dependent mitochondrial swelling (Campbell and Mertz, 1963).
Metabolism
Chromium metabolism differs from that of other trace minerals
because of its dependence on the chemical form of the element (Mertz,
1976; Saner, 1980). Studies on chromium metabolism involve
intestinal absorption, transportation within the body, tissue levels
and distribution and excretion.
Absorption of an oral dose of trivalent chromium salts bv rats
fell within the range of 0.5 to 3.0% (Visek et al., 1963; Mertz, et
al. 1965; Mertz, 1969; Mertz and Roginski, 1971) whereas normal human
subjects were found to absorb 0.3 to 1.3~ of an oral dose of chromium
salts (Donaldson and Barreras, 1966; Saner, 1980). Research with
GTF, however, indicated that 10-25r of GTF chromium from brewers'
veast was absorbed (Mertz, 1975; Saner, 1980). Absorption of
chromium(III) from orally administered physiological doses is verv
low regardless of the amount of dose given or chromiuM nutritional
status (Mertz, 1965, 1967; Toepfer, 1977). The low absorption rate

8
is partially attributed to the tendency of chromium(III) salts to
elate in neutral or basic solutions such as those found in the small
intestine (Donaldson and Barreras, 1966; Visek et a1., 1953).
In vivo and in vitro studies with rats, using chelating agents,
found that the primary absorption site of chromium was in the jejunum
or mid section of the small intestine with Jesser amounts absorbed in
the ileum and duodenum (Chen et al., 1973). A number of substances
influence the absorption of chromium. Those that depress chromium
absorption include: zinc, iron, manganese, calcium, and titanium.
Glutamate and penicillamine enhance the absorption of chromium (Mertz
and Roginski, 1971). Zinc apparently competes for the same
absorptive sites in the intestional mucosa as chromium. Hahn and
Evans (1975) found a decreased absorption and intestinal mucosal
f 51c h d · · d · h · · d f · · content o r w en a m1n1stere w1t z1nc to z1nc- e 1c1ent
animals. In the same study there was a decreased absorption and
intestinal mucosal content of 65 zn when administered with chromium to
zinc-deficient animals (Hahn and Evans, 1975). Since chromium and
zinc were also eluted in the same mucosal supernatant fraction from
animals in the above experiment, the authors hypothesized that the
same ligand may bind both metals causing competition in absorption
(Hahn and Evans, 1975).
Once absorbed chromium(III) is bound to transferrin,
a S-globulin, which also transports iron (Hopkins, 1964). Of the 2-3
mg of transferrin per ml of serum, 30% is saturated with iron and the
remainder is available for chromium(III) and other trace mineral
transport (Hopkins, 1964). The mechanism for control of cellular
chromium transport has not been established; however, Lifschitz et
al. (1980) have postulated that thyroid hormone may play a role in
chromium transport. Their study with 51cr and parathyroidectomized
rat h d · f d · f · 51c · · h s s owe un1 orm epress1on o t1ssue:serum r rat1os w1t
complete reversal on replacement with thyroxin (Lifschitz et al.,
1980).
The placental transfer of simple chromium salts vs. brewers'
yeast chromium was studied in the rat (Mertz et al., 1969).
9
Placental transport of chromium(III) was found to occur only with GTF
as opposed to 2 ppm chromium salts added to drinking water (Mertz et
al., 1969).
Hopkins investigated the distribution of physiological amounts
of injected 51crc13
and observed that on the fourth day after
administration spleen, kidney, testis, and epididymis retained the
highest percentage (104-200%) and heart, lung, pancreas, and brain
retained the least (10-31%) with other tissues having intermediate
values (Hopkins, 1965). 51
chromium(III) has a rapid blood clearance,
whereas other organs retain 51chromium(III) much longer, which
suggests there is no equilibrium between tissue and blood chromium
levels (Hopkins, 1962). The highest concentration of chromium, given
as GTF from brewers' yeast, was found in liver tissue which suggests
that the liver may be the site of the specific pool of biologically
important chromium in animal or man (Mertz and Roginski, 1971).
Jain et al. (1981) recently found liver 51
chromium in the rat to be
SO to 100% exchangeable, further supporting the liver as a
physiological poo] and regulator of chromium metabolism. As mentioned
10
previously, there was a different tissue distribution for
chromium(III) salts and GTF chromium with onlv the GTF form
concentrating in the liver.
Chemical analyses of postmortem tissues for chromium (Schroeder
et al., 1962) revealed a decreasing tissue chromium concentration
with increasing age in the U.S. Tissue chromium concentrations of
adults in the U.S. were much lower than those in the Far East, Mid
East and Africa (Hambidge, 1974) as well as lower than in some wild
animals (Schroeder, 1968; Hambidge, 1974).
Chromium administered either orally or intrRvenously is excreted
primarily by the kidney with only small amounts being excreted
through the feces from bile or through the skin (Hopkins, 1965;
Donaldson and Barreras, 1966; Donaldson and Rennert, 1981). There
was an exponential decrease with time in renal clearance of
intravenously administered 51crc13
(Donaldson and Rennert, 1981).
Assessment of urinary chromium excretion under specifically
controlled conditions may reflect the chromium status of an
individual (G~rson and Saner, 1978). Schroeder (1968), Gurson and
Saner (1978) and Rabinowitz (1980) all reported an increase over
fasting of urinary chromium concentration following an oral glucose
challenge in normal adult humans. In contrast, Davidson et al.
(1974) and Vanderlinde et al. (1979) reported either no change or a
decrease in urinary chromium concentration following a glucose
challenge. Gtirson and Saner (1978) have observed a significant
positive relationship between urinary chromium and creatinine
concentration and recommend the use of the Cr/Cre ratio as a valuable

11
criterion in the evaluation of chromium nutrition. Anderson et al.
(1983), however, recently reported that urinary chromium excretion
may not be a good indicator of chromium nutritional status but that
it appeared to be a good indicator of chromium intake. The same
studv also suggested that absorption of supplemental inorganic
chromium was similar to the absorption of chromium from normal
dietary sources (Anderson et al., 1983).
Physiological Role of Chromium
Chromium deficiency may cause insulin resistance,
hyperinsulinemia, impaired glucose tolerance, and hyperlipidemia all
of which were reversed by chromium supplementation (Riales and
Albrink, 1981). Early studies demonstrated the effect of a glucose
challenge on both chromium deficient and supplemented animals as
measured by glucose tolerance tests (Schwarz and Mertz, 1959) with a
reversal of symptoms in deficient animals when chromium was added
at 2 or 5 ppm chromium(III) in the drinking water (Underwood, 1977).
Current research, however, is involved with evaluating serum chromium
response to a glucose load by normal and chromium deficient subjects.
For example, Rabinowit~ et al. (1980) reported that in most normal
subjects, plasma chromium levels increased following a glucose
challenge, along with Liu and Morris (1978) who reported an increase
in serum chromium but only after supplementation with GTF chromium.
Davidson and Burt (1973) and Pekarek et al. (1975), however, found
that serum chromium concentration fell in response to either an oral
or intravenous glucose challenge. Vanderlinde et al. (1979), using
the most current ultratrace techniques such as neutron activation or

12
flameless atomic absorption spectroscopy, found no significant change
between fasting and two hour post prandial serum chromium
concentrations in normal subjects with values at the very edge of
detection limits.
In vitro and in vivo chromium deficient systems have shown a
.decreased glucose uptake in response to doses of insulin. Higher
doses of insulin are required by chromium deficient systems to obtain
responses si~ilar to those of chromium sufficient controls
(Underwood, 1977). On the other hand there is no difference in
glucose uptake response between groups in the absence of insulin,
which suggests that an increased plasma chromium response to the
ingestion of glucose is an indirect one that occurs through
stimulation of insulin secretion (Mertz et al., 1974). These results
may suggest two possibilities concerning plasma chromium levels after
fasting and in the fed state: 1) an increased plasma chromium
increment following a glucose or insulin load indicates an adequate
chromium body pool; 2) lack of an increment may indicate a deficient
chromium body pool (Mertz et al., 1974).
Glucose tolerance impairment, as a symptom of kwashiorkor,
has in some cases responded dramatically to chromium supplementation,
as seen in those cases of infant protein-calorie malnutrition in
Jordan, Nigeria, and Turkey (Hopkins et al., 1968; Gurson and Saner,
1971). Malnourished infants in Egypt, however, showed no effect from
chromium supplementation and their tissue chromium levels were normal
indicating their glucose intolerance was not due to a chromium
deficiency (Underwood, 1978).
13
Two patients on long-term total parenteral nutrition exhibited
glucose intolerance, neuropathy, weight loss and low hair
concentration~ all of which responded to supplementation with either
150 ~g or 250 ug of chromium as Crc13
daily (Jeejeebhoy et al., 1977;
Freund, 1979).
Recent studies with elderly and non-insulin dependent diabetic
subjects, using chromium-rich brewers' yeast in the experimental
group and Torula yeast as a control elicited improved glucose
tolerance and decreased total lipids in the brewers' yeast group for
both elderly and diabetic subjects (Offenbacher and Pi-Sunyer, 1980).
Insulin output also decreased with improved glucose tolerance which
indicates these elderly people may have had a marginal chromium
deficiency that could be reversed with a chromium-rich source such as
brewers' yeast (Offenbacher and Pi-Sunyer, 1980). Other studies with
elderly or diabetic subjects have achieved similar results with
repletion requiring greater lengths of time than in the infant PCM
patients (Underwood, 1977).
Mertz (1979) strongly recommends that chromium supplementation
studies include measurement of effect on insulin levels since insulin
may be more directly related to chromium response than glucose. Liu
and Abernathy's (1982) recent results support this theory. In a
group of college subjects, they found the group with low insulin
levels had a significantly higher relative chromium response
(RCR is defined as 1-hour serum chromium level/fasting serum chromium
level x 100) than did the group with high insulin levels (Liu and
Abernathy, 1982). The higher RCR in the low insulin group indicated

14
normal glucose tolerance and supported the use of the RCR as an
assessment tool for chromium nutritional status (Liu and Abernathy,
1982).
R~quirements and Nutritional Assessment
The Food and Nutrition Board of the National Academy of Sciences
has not established a Recommended Dietary Allowance for chromium, but
it has listed an estimated Safe and Adequate Intake as 50-200 pg per
day (Food and Nutrition Board, 1980). Available data (Toepfer et
al., 1973; Wolf et al., 1974; Kumpulainen and Koivistoinen, 1977) on
total chromium content of foods may not be nutritionally valuable due
to recent advances in chromium analysis methodology and to differing
bioavailability of the various forms of chromium (Underwood, 1977).
Toepfer et al. (1973), using the glucose oxidation procedure in
the presence of rat epididymal tissue and insulin, found no
significant relationship between total chromium and biologically
active chromium in food. Chromium content of foods has been shown to
decrease with processing, especially in sugar and flour (Wolf et al.,
1974).
Previous data on serum and urine chromium concentrations have
been revised with the use of more advanced ultratrace techniques.
For example, in 1966 human serum chromium concentration was reported
as 23 ng per ml whereas current values are in the range of 0.1 ng per
ml (Donaldson and Rennert, 1981). The range for 24 hour urinary
chromium excretion was reported as 150 ~g per day (Underwood, 1977)
in 1966 and as 0.22 pg per 24 hours in 1983 (Anderson et al., 1983).
15
Evaluation of chromium nutritional status in man is difficult
due to the inadequacy of analytical methods (Saner, 1980). The
intravenous glucose tolerance test has been used to measure chromium
deficiency in laboratory animals on controlled diets as
expressed by glucose removal rate after administration of a glucose
load (Mertz et al., 1965), but the test is valid onlv under -- .
controlled laboratory conditions since response to glucose load could
be an indicator of disease symptoms as well as other trace element
deficiencies.
Plasma chromium levels do not accurately reflect chromium
status because plasma chromium is probably in equilibrium with the
physiological chromium pools only in response to elevated insulin
levels in the blood (Mertz, 1979).
The diagnosis of inadequate chromium stores is promoted by
simultaneous findings of elevated insulin levels and responses, or
glucose tolerance impairment, or both (Mertz, 1979). Chromium
supplementation of individuals with little or no chromium response
who subsequently demonstrate an increased chromium response to a
glucose load further supports diagnosis of inadequate chromium stores
(Mertz, 1979). Liu and Abernathy's (1982) RCR is a possible tool for
use in assessing chromium nutritional status.
Due to a high consumption of refined carbohydrates in this
country, it has been postulated that the American diet contains
inadequate amounts of chromium (Schroeder, 1968; Underwood, 1977).
The current estimate for chromium content in Western diets is 50 to
16
100 ~g/day, with some otherwise adequate diets supplying only
5 ~g/day (Food and Nutrition Board, 1980).
Phytic Acid
Phytates from plants represent a complex class of naturally
occurring compounds that can significantly influence the functional
and nutritional properties of foods, especially trace mineral
bioavailability (Erdman and Forbes, 1977; Davies, 1979; Maga, 1982).
Phytate is an organic factor which can bind essential minerals to
form insoluble and indigestible complexes in the lumen of the
intestinal tract ·and prevent their absorption (Davies 1979; Erdman
and Forbes, 1977). Increased awareness of certain health problems,
such as diverticulosis, colon cancer, elevated blood cholesterol
levels, and increased insulin resistance and/or glucose intolerance
in adult onset diabetes, has led to an increased emphasis on
consumption of whole grains and legumes, which are high in natural
fiber and phytate (Davies, 1979). Rising prices of animal protein
have also influenced consumption of grains and legumes.
Chemistry
Phytic acid (myo-inositol 1,2,3,5/4,6-hexakis dihydrogen
phosphate) is the chief storage form of phosphorus in all plant seeds
with natural legumes and cereal grains having the highest
concentrations (Oberleas, 1983; Maga, 1982). At a pH of 7.4, in
vitro, the phytate ion bound metals in the following decreasing
++ ++ ++ ++ ++ +++ ++ order: Cu , Zn , Ni , Co , Mn , Fe , and Ca (\rohra et al.,
1965). Of the phytate-mineral complexes tested, ferric ion was least
17
soluble in acid, zinc was least soluble in slightly acid solutions,
and the remaining five were least soluble in slightly alkaline
conditions (Oberleas, 1983). The chemical structure of phytic acid
is continually questioned due to the many isomeric forms of the
phosphate groups within the compound (Erdman and Forbes, 1977).
Biochemistry and Occurrence
In legumes, phytate is distributed uniformly throughout the
plant and is associated with the protein, while in cereal grains, it
is contained in both the bran and germ (Maga, 1982; Oberleas, 1983).
Corn, however, contains phytate primarily in the germ (Maga, 1982;
Oberleas, 1982). Several other types of food items have also been
analyzed for phytate content. Essentially no phytate was found in
bananas, celery, citrus fruits, lettuce, mushrooms, onions, or prunes
with trace amounts in apples, broccoli, carrots, and green beans
(Harland and Harland, 1980). Artichokes, figs, potatoes, and
strawberries contained moderate amounts, while cereals, legumes and
nuts contained the highest concentration of phytate (Harland and
Harland, 1980). Corn, rice, and wheat had a phytate concentration of
approximately 1%, while defatted sesame meal was found to contain
from 1.4 to 5.2% phytate (Erdman and Forbes, 1977; Maga, 1982).
Phvtate in wheat, rice, brood beans, castor, and sesame occured
mainly as mixed potassium-magnesium salts associated with protein in
the kernel (Erdman and Forbes, 1977; Reddy et al., 1980). Soybeans,
however, contained phytate as a calcium-magnesium-potassium salt
(Reddy~~., 1982).

18
Processes for removing phytate from soy protein have been
developed but are not yet used commercially (Hartman, 1979). Reddy
et al. (1982), in their review and discussion of methods for removal
of phytate, suggest that methods are not yet feasible on a commercial
scale. Methods commonly used in food processing form insoluble
protein-phytic-acid-mineral complexes (Forbes et al., 1979).
Phytic acid is not degraded by normal cooking procedures;
however, heating in acid or alkaline solutions will degrade the
molecule (Maga, 1982; Oberleas, 1983). Phytase, a natural component
of cereal grains, does faciltate the breakdown of phytate (Oberleas,
1983). Hydrolysis of phytate by phytase has been shown in yeast
leavening, with both added and natural phytase (Oberleas, 1983).
Studies of phytate content in leavened and unleavened bread have
correlated clinical zinc deficiency with consumption of unleavened
bread in Middle Eastern countries (Oberleas, 1983).
Nutritional Implications
Monogastric animals such as man have a very low phytase activity
in the digestive tract and, therefore, are not able to completely
cleave certain minerals from the phytate complex (Erdman and Forbes,
1977). Research on phytate-chromium interaction indicated that
phytate significantly decreased chromium transport through the rat
intestine both in vitro and in vivo (Chen et al., 1973). Fasted - - --animals, in the above study, absorbed chromium faster than did the
nonfasted animals (Chen et al., 1973). Davies and Nightingale (1975)
demonstrated a similar effect measuring zinc instead of chromium.
19
One study, using a 1% phytate diet, showed inhibition of growth and
decreased absorption of iron, copper, manganese, and zinc whether the
diet was supplemented or unsupplemented with zinc (Davies and
Nightingale, 1975).
Phytate-zinc interaction studies have indicated: 1) a high
calcium diet with phytate decreased the bioavilability of zinc
(Morris and Ellis, 1980; Nahapetian and Young, 1980); and 2) a
phytate to zinc molar ratio of 10 or less is optimum for humans
(Oberleas and Harland, 1981). Reduction of zinc bioavailability is
the most critical problem associated with phytic acid; however,
decreased iron utilization has also been shown by some, but not all,
researchers (Maga, 1982). Not all studies with iron and phytate,
though, haveshown decreased iron availability (Maga, 1982). Animal
studies with iron and phytate indicate a high biological availability
of monoferric phytate, the major form of iron in wheat (Morris and
Ellis, 1976). Hunter (1981), using sodium phytate up to 4% of the
diet, showed no difference in iron absorption between controls and
iron deficient rats but did suggest that effects of phytate may
depend on method of administration as well as length of time of
phytate administration.
Fiber may have an independent role from that of phytate in
binding minerals and making them unavailable for absorption
(Nahapetian and Young, 1980; Godara et al., 1981). The addition of
7% bran (12 mg phytate/roll) to wheat bread decreased iron absorption
by a factor of 2 (Bjorn-Rasmussan, 1974). Reinhold et al. (1975);
Ismail-Beigi et al. (1977) and Maga (1982) demonstrated that fiber
·zo
produces a separate or even additional effect to that of phytate;
totally dephytinized whole Meal bread and bran showed an enhanced
ability, compared to non-dephytinized bread, to bind calcium, zinc
and iron. Purified cellulose, without phytate, added to a purified
diet resulted in significant decreases of serum calcium, inorganic
phosphorus, and iron levels (Godara et al., 1981).
CHAPTER III
MATERIALS AND METHODS
Experiment One
Animals and Diets
Fifty 21-day-old, male Sprague-Dawley rats were fed variations of
the 30% Torula yeast low chromium diet outlined in Table 1. All
diets contained 12.5% digestible protein. 1 Sodium phytate was added
to the diet of one group at 1.38% (0.8% phytate) and to another group
at 2.08% (1.2% phytate). Two parts per million chromium as chromic
chloride (CrC13
·6H20) was added to the diet used as the adequate
chromium/Torula yeast diet. A second adequate chromium diet was made
2 by substituting brewers' yeast for Torula yeast in the basal diet.
Added phytate and chromium replaced sucrose in the basal diet.
Sodium content was equivalent in all diets, based on total amount in
sodium phytate.
Once a week all animals were given the basal diet without
phytate to which was added 2.5 times the magnesium, manganese, iron,
zinc, and copper contained in the regular diet. The animals were
fasted for 12 hours overnight, then given 20 g of the mineral
supplemented diet without phytate for 24 hours. At the end of the 24
hours, any remaining food was then removed and the regular diet
refed.
1sigma Chemical Company, St. Louis, MO.
2united States Biochemical, Cleveland, OH.
21
•

22
All animals were housed individually in plastic shoe-box cages
Rnd fed ad libitum from ceramic feed cups. Distilled, deionized
water in glass bottles with glass sipper tubes was provided. Animals
were weighed weekly.
IVGTT
Intravenous glucose tolerance tests (TVGTT) were performed
during weeks 5, 8, and 14 of the study. After a 14 to 16 hour fast,
50 mg glucose per 100 g body weight as a 25% glucose solution was
injected into the tail vein of the unanesthesized animal using a 27
gauge, ~ inch needle. Restraining cages were used to hold the
animals during glucose injection and blood collection. Blood was
collected from the tip of the tail in heparinized, 1 ~1 capillary
tubes immediately before (0 time) and 10, 20, 30, and 40 minutes
after the glucose load. The blood was centrifuged and the plasma
removed immediately after blood collection to be analyzed for glucose
on the same day.
Glucose Determination
The glucose in 20 ~1 of plasma was determined by a coupled
1 enzymatic colorimetric procedure . A 4 ml aliquot of a mixture of
horseradish peroxidase (E.C. 1.11.1.7) and glucose oxidase (E.C.
1.1.3.4) enzymes and o-dianisidine was added to the serum. The
following coupled reactions produced a brown color (oxidized
0 -dianisidine) proportional to the original glucose concentration:
1Technical bulletin 510, Sigma Chemical Company~ St. Louis.

23
1. Glucose oxidase Gluconic Acid + H
2o2
2. Peroxidase Oxidized o-Diansidine
After 45 minutes, absorption at 445 nm was measured in a
spectrophotometer.
Glucose removal rates were determined from the glucose tolerance
tests. The log of the increment above fasting was calculated against
time and the formula
log cl c2 K = X 2.3
t2 tl
was applied, where K is a constant and C is the blood glucose
increment value at time t (Duncan, 1956).
Insulin Assay
Insulin response to a glucose load was measured during week 15
of the study using the same procedures for blood collection used for
the IVGTT. However, blood was drawn only at 10 minutes after fasting
for the insulin assav. A radioimmunoassay (RIA) kit1
was utilized to
measure plasma insulin. Samples o~ the unknown and standard insulin
solutions were incubated for 6 hours with suspended insulin binding
reagent. 125 I-labelled insulin was added and the samples incubated
for an additional 18 hours. The insoluble antigen-antibody complex
was separated from the soluble free insulin by centrifugation.
Radioactivity was counted in the precipitate for both standards and
unknowns.
1Arnersham Corporation, Arlington Heights, TL.
24
Chromium Analysis
Chro~ium content of the diets was determined by flameless atonic
1 absorption spectrophotometry . Samples (150 mg) were weighed into
borosilicate glass tubes and placed in a sealed coil muffle furnace.
The temperature was raised 50°C per hour starting at 100°C up to
300oC; the temperature was then set at 500°C for 24 hours. The
samples were then removed from the muffle furnace and cooled. 50 wl
of H2o2 , distilled H20, and concentrated nitric acid were added to
samples and blanks and allowed to evaporate to dryness in a dry bath
at 100°C. Samples were then returned to the muffle furnace and ashed
at 500°C until all samples were white. After removing from the
muffle furnace and cooling, samples were diluted with lN hydrochloric
acid and analyzed on the flameless atomic absorption
spectrophotometer. All samples were measured in a linear range of
0-10 ppb chromium. Samples above that range were diluted with 1 N
HCl to the appropriate range. Chromium standards of 2 and 5 ppb were
made from a Certified Atomic Absorption Standard Reference Solution2
in 1 N hydrochloric acid. Program specifications for the
instrument are listed in the Appendices.
Phytate Analysis
An ion-exchange method for phytic acid analysis, developed by
Ellis and Harris (1982) as an improvement of the Harland and Oberleas
1Perkin-Elmer Zeeman 5000 with HCA 400 Programer, Perkin Elmer Corp., Norwalk, Conn.
? -Fisher Scientific Company, Fair Lawn, N.J.

25
method (1977), was utilized with one modification. Samples (2 g) of
dried material were extracted for 2 hr at room temperature with 40 ml
of 2.4% HCl. The mixture was centrifuged and then vacuum filtered
through Whatman No. 41 filter paper. The filtrate was refrigerated
for no more than 1 week. The 0.7 x 15.0 em columns were packed with
0.5 g of 200-400 mesh AG1-X8 anion exchange resin (chloride form) in
a deionized water slurry. Before use, the columns were washed with
10 rnl of 0.7 M NaCl to assure chloride saturation of the resin and
then with two column volumes of deionized water. One ml of the
sample extract was mixed with 1 ml of EDTA-NaOH solution, diluted to
30 ml with deionized water, and applied to the column. The sample
container was rinsed, and the column was washed with 15 ml of
deionized water to elute most of the inorganic phosphate. The
remaining inorganic phosphate was eluted with 15 ml 0.1 M NaCl. The
phytate was then eluted from the column with 15 ml of 0.7 M NaCl and
collected in a 100-ml micro-Kjeldahl flask. To the digestion flask,
was added 0.5 ml of concentrated H2so4 , 3.0 ml concentrated HN03
and
two glass beads. The mixture was digested on mediu~ heat until
active boiling ceased and a cloud of thick yellow vapors appeared in
the neck of the flask. The flasks were heated for 5 more minutes on
medium heat, 5 minutes on low heat, and then allowed to cool.
Deionized water (15 ml) was added, and the flasks were placed in a
boiling water bath for 15 min. The contents of the digestion flask
were quantitatively transferred to a 50 ml volumetric flask. The
phosphorus in the digest was determined by a modification of the
Fiske-Subbarow (19~5) method. The digest was diluted to about 35 ml
26
1 with deionized water, then 2 ml of molybdate solution were added and
the contents mixed. Next 1 ml of sulfonic acid reagent was added and
the 50 Ml flask was made to volume with deionized water. After
standing 10 to 15 minutes, the color was read at 640 nm on a Bausch
and Lomb spectrophotometer. The phytic acid values were calculated
from the organic phosphorus by assuming that one molecule of phytic
acid contained six molecules of phosphorus (1 mg phytate = 28.2% P).
Experiment Two
Animals
Thirty weanling, female Sprague-Dawley rats from dams maintained
on a low chromium, Torula yeast based diet were used in this second
experiment. The animals were fed the 30% Torula yeast low-chromium
diet outlined in Table 1. All diets contained 12.5% digestible
protein. Five parts per million chromium as chromic chloride was
added to the diets of the adequate chromium groups. Zinc
concentration was doubled (compared to the NAS-NRC recommendations)
in the diet of one low chromium group. Both copper and zinc were
doubled in one low chromium and one adequate chromium group.
The animals were housed individually in suspended galvanized
mesh cages and fed ad libitum from ceramic feed cups. Distilled,
deionized water in glass bottles with glass sipper tubes was
provided. Animals were weighed once weeklv.
1Modification: The molvbdate solution was acid stabilized as in the original method by Harland and Oberleas (1977).
27
IVGTT
IVGTT were performed during weeks 4 and 8 utilizing the
procedures described for Experiment One.
Glucose Determination
The glucose in 10 ~1 of plasma was determined using the Beck~an
Glucose Analyzer 2 with an Oxygen Electrode. The sample volume was
manually pipetted into enzyme reagent 1 in a cup containing an
electrode responsive to oxygen concentration. 8-D-glucose from the
sample combined with dissolved oxygen from the solution, according to
the reaction:
8-D-Glucose + 02
glucose oxidase 1
. . d 0 G ucon1c ac1 + H
2 2
In the reaction, oxygen was consumed at the same rate as glucose
reacted to form gluconic acid. The instrument provided a direct
readout of mg glucose per 100 ml. Glucose removal rates were
determined with the same formula as applied in Experiment One.
Insulin Assay
Plasma insulin levels were analyzed by radioimrnunassay during
week 9 of the study as described under Experiment One.
Chromium Analysis
Diets were analyzed for chromium concentration utilizing the
same procedure described under Experiment One.
1Glucose oxidase reagent, Fisher Scientific Co., Fair Lawn, N.J.

28
Liver chromium concentration was also analyzed using a similar
procedure as for diets, with several additional treatments. After
sacrifice, the liver was removed, rinsed in distilled water and
frozen immediately. Using only glass instruments for slicing the
tissue, samples (250 mg) were weighed into new borosilicate glass
tubes and freeze dried for 24 hours. The samples were re-weighed
and ashed in the muffle furnace as previously described.
Experiment Three
Animals
Forty-eight, weanling male Sprague-Dawley rats were fed a 32%
Torula yeast low chromium diet as outlined in Table 2. All diets
contained 13.3% digestible protein. Sodium phytate was added to the
diet of a low chromium and of an adequate chromium group. Sodium
content was equivalent in all diets. Extra zinc was added to the
mineral mix to equal 129 mg Zn per kg diet and a phytate:zinc molar
ratio of 8:1. Two parts per million chromium as chromic chloride was
added to the diet for the adequate chromium groups. Added phytate
and chromium replaced sucrose in the basal diet. Once weekly (~4
hours) starting week 4, the phytate groups were fed equivalent but
non-phytate containing diets.
Animals were housed in pairs in plastic-shoe-box cages. Animals
were fed ad libitum except for the non-phytate groups which were
restricted to 12 g a day per animal during week 4 and the first 3
days of week 5. Distilled water in glass or plastic bottles with
glass sipper tubes was provided on all cages. Animals were weighed
once weekly.

29
OGTT
An oral glucose tolerance test was performed during week 6.
After a 14 to 16 hour fast, 200 mg glucose per 100 g body weight in a
50% glucose solution was intubated into the stomach using an 18 gauge
intubation needle. Each animal was wrapped loosely in a small towel
with the tail free and held by the researcher with one arm, leaving
the other free to collect blood from the tail veins. Blood was
collected from the tip of the tail in EDTA-coated 1 ml capillary
tubes immediately before (0 time) and 30, 60, and 120 minutes after
the glucose load. The blood was centrifuged, and the plasma was
removed immediately and frozen for insulin and glucose
determinations.
Glucose Determination
Plasma glucose was determined using the Beckman Glucose Analyzer
as described for Experiment Two.
Insulin Assay
Another RIA kit 1 , found to have improved precision compared to
the kit used in Experiment One, was utilized for the insulin assay.
All plasma samples analyzed for glucose were also analyzed for
insulin. Samples of the unknown, standards, and control solutions
Here incubated for 16 hours at 4°C with specific anti-insulin
antiserum and 125I-labelled insulin. Bound and free radiolabeled
insulin were separated by adding double antibody and polyethylene
1cambridge Medical Diagnostics, Inc., Billerica,~~.
30
glycol, which precipitated the antigen-antibody complexes. Samples
were incubated for 10 min at room temperature and centrifuged, and
the precipitate was counted. By counting the radioactivity in the
precipitate for both standards and unknowns, a standard curve was
constructed and values were calculated for all samples.
Chromium Analysis
The same method was employed to analyze the diets for chromium
content as described under Experiment One.
Phytate Analysis
Diets were analyzed for phytate content as described under
Experiment One.
Statistical Analysis
The Statistical Analysis System (S.A.S.) was used to determine
basic statistics (mean, standard error of the mean, range and
variance) and to compare differences among group means. A general
linear model (GLM) and a Duncan's Multiple Range Test were also
utilized at the 0.05 alpha level to determine significant differences
among groups. A repeated measures design was done crossing dietary
group with time to determine the differences within groups over time
for glucose tolerance.
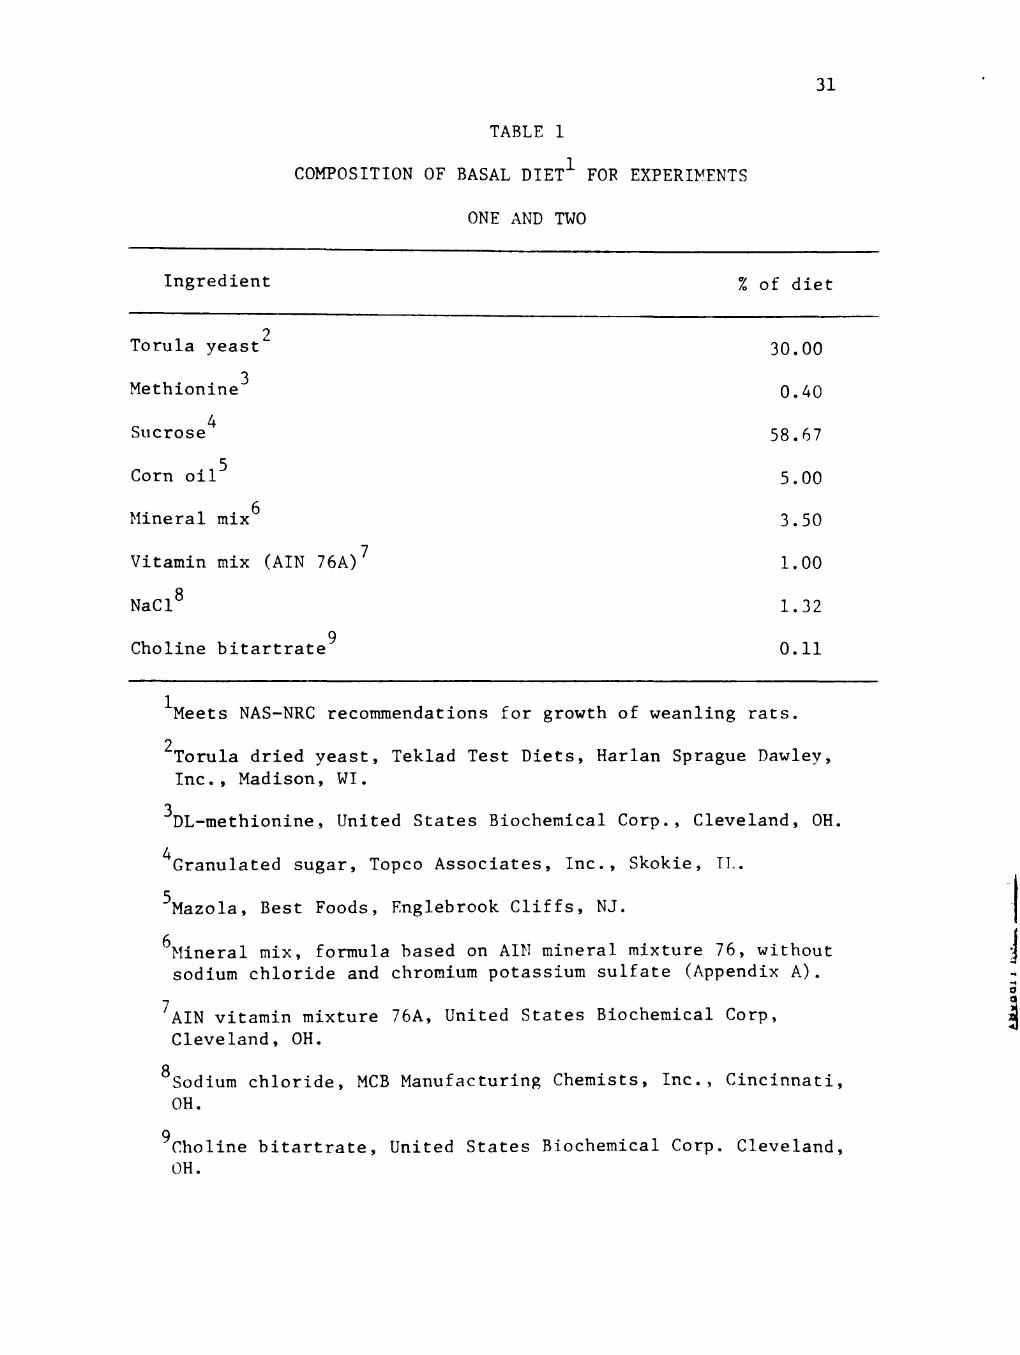
31
TABLE 1
COMPOSITION OF BASAL DIETl FOR EXPERI'!-'fENTS
ONE AND TWO
Ingredient % of diet
2 Torula yeast
Methionine 3
4 Sucrose
Corn oil5
Hineral mix6
Vitamin mix (AIN 76A) 7
NaC18
Choline bitartrate9
30.00
0.40
58.67
5.00
3.50
1.00
1.32
0.11
1Meets NAS-NRC recommendations for growth of weanling rats.
2rorula dried yeast, Teklad Test Diets, Harlan Sprague Dawley, Inc., Madison, WI.
3DL-methionine, United States Biochemical Corp., Cleveland, OH.
4 Granulated sugar, Topco Associates, Inc., Skokie, IL.
5 Mazola, Best Foods, Englebrook Cliffs, NJ.
6Hineral mix, formula based on AIN mineral mixture 76, without sodium chloride and chromium potassium sulfate (Appendix A).
7AIN vitamin mixture 76A, United States Biochemical Corp, Cleveland, OH.
8 sodium chloride, MCB Manufacturing Chemists, Inc., Cincinnati, OH.
9r.holine bitartrate, United States Biochemical Corp. Cleveland, OH.

32
TABLE 2
COMPOSITION OF BASAL DIETl FOR EXPERIMENT THREE
Ingredient
2 Torula yeast
M h . • 3 et 10n1ne
4 Dextrose
5 Cornstarch
Corn oil6
Mineral mix7
Vitamin mix8
Choline bitartrate10
% of diet
32.10
0.40
30.00
26.60
5.00
3.50
1.00
1.29
0.11
1Meets NAS-NRC recommendations for growth of weanling rats.
2Torula dried yeast, Teklad Test Diets, Harlan Sprague Dawley, Inc., WI 53713.
3DL-methionine, United States Biochemical Corp., Cleveland, OR.
4 Dextrose, Corn Products Company International, Englewood Cliffs, NJ.
5 Corn starch, United States Biochemical Corp., Cleveland, OH.
6 Mazola, Best Foods, Englebrook Cliffs, NJ.
7Mineral mix, formula based on AIN mineral mixture 76, without sodium chloride and chromium potassium sulfate (Appendix A).
8AIN vitamin mixture 76A, United States Biochemical Corp., Cleveland, OR.
9sodium chloride, MCB Manufacturing Chemists, Inc., Cincinnati, OH.
10choline bitartrate, United States Biochemical Corp. Cleveland, OH.
CHAPTER IV
RESULTS
Experiment One
Growth Rates
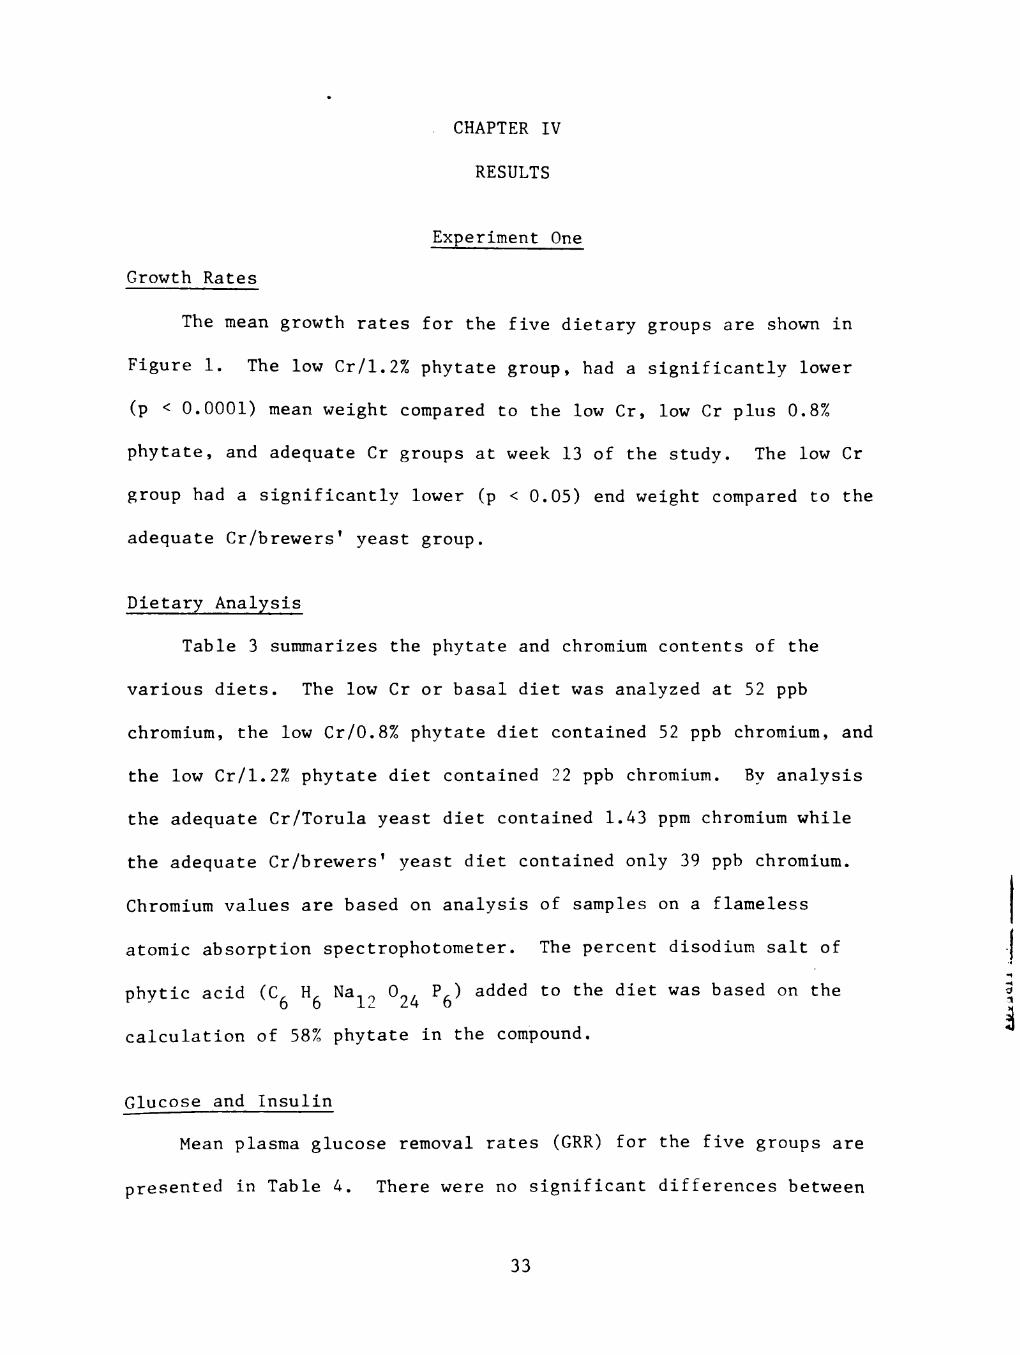
The mean growth rates for the five dietary groups are shown in
Figure 1. The low Cr/1.2% phytate group, had a significantly lower
(p < 0.0001) mean weight compared to the low Cr, low Cr plus 0.8%
phytate, and adequate Cr groups at week 13 of the study. The low Cr
group had a significantly lower (p < 0.05) end weight compared to the
adequate Cr/brewers' yeast group.
Dietary Analysis
Table 3 summarizes the phytate and chromium contents of the
various diets. The low Cr or basal diet was analyzed at 52 ppb
chromium, the low Cr/0.8% phytate diet contained 52 ppb chromium, and
the low Cr/1.2% phytate diet contained 22 ppb chromium. By analysis
the adequate Cr/Torula yeast diet contained 1.43 ppm chromium while
the adequate Cr/brewers' yeast diet contained only 39 ppb chromium.
Chromium values are based on analysis of samples on a flameless
atomic absorption spectrophotometer. The percent disodium salt of
phytic acid (c6
H6
Na12
o24
P6
) added to the diet was based on the
calculation of 58% phytate in the compound.
Glucose and Insulin
Mean plasma glucose removal rates (GRR) for the five groups are
presented in Table 4. There were no significant differences between
33
I .f ~

34
groups based on GRR at week 5 or 14. At week 8 the low Cr/1.2%
phytate group had a significantly higher (p < 0.05) GRR compared to
the other four groups. Only the low Cr and adequate Cr/brewers'
yeast groups showed a significant decrease (p < 0.05) in GRR from
week 5 to week 14. Insulin values, shown on Table 5, indicated a
significantly lower level (p < 0.05) in the low Cr/1.2% phytate group
as compared with all other groups.
Experiment Two
Growth Rates
Mean growth rates for the five groups are shown in Figure 2.
There were no significant differences between groups based on mean.
body weights. Growth rates of animals from Experiment One are not
comparable to those from Experiment Two since the former were male
and the latter female rats.
Dietary Analysis
The low Cr groups contained from 36 ppb to 49 ppb chromium as
indicated in Table 6. By analysis with flameless atomic absorption
spectoscropy, the adequate chromium group contained 1.62 ppm and the
adequate Cr plus Zn and Cu group contained 1.91 ppm chromium.
Tissue Analysis
Mean chromium concentrations in the liver are also expressed in
Table 6. There were no significant differences between groups based
on liver chromium concentrations.
35
Glucose and Insulin
Mean plasma GRR for the five groups are outlined in Table 7.
There were no significant differences between groups on either the
first or second glucose tolerance test. There was a significant
decrease (p < 0.05) in GRR with time only in the low Cr plus Zn and
Cu group. Insulin and glucose:insulin ratios, measured from plasma
collected 10 minutes after a glucose load showed no significant
differences (Table 8).
Experiment Three
Growth Rates
Figure 3 represents the mean growth rates for the four dietary
groups. There were no significant differences between mean body
weights of the four groups at the beginning or the end of the study.
The mean weights of the animals on this experiment were comparable to
the mean weights of the animals on Experiment One which were also
males.
Dietary Analysis
Table 9 summarizes the phytate and chromium content of the four 1 ·I . diet groups. The low Cr groups were analyzed as 62 and 37 ppb
chromium while the adequate chromium groups were analyzed as 1.74 and
2.29 ppm chromium. Total phytate by analysis in the low Cr/1.0%
phytate diet was 1.21% and 1.22% in the adequate Cr/1.0% phytate diet.
36
Glucose and Insulin
Mean plasma glucose values from the oral glucose tolerance test
(OGTT) are shown in Table 10. There were no significant differences
between groups at the fasting, 30 or 60 minute times; however, there
was a trend (p < 0.06) toward an effect of phytate at the 30 minute
time with the low Cr/1.0% phytate group having the highest glucose
value (171 mg/dl) and the adequate Cr group the lowest glucose value
(153 mg/dl). At the 120 minute time there was a significant effect
(p < 0.0001) of a Cr-phytate interaction and an effect (p < 0.01) of
phytate. The low Cr/1.0% phytate diet had the lowest glucose value
(98 mg/dl) at the one hundred and twenty minute time.
Table 11 shows the glucose increment which is based on the value
at each point on the glucose curve minus the fasting glucose value
(mg/dl). There was a significant effect (p < 0.04) of phytate at the
30 minute increment, but no effect was seen at the 60 or 120 minute
time period.
Insulin values from the OGTT are presented in Table 12. At
fasting, there was a significant effect (p < 0.004) due to.phytate
and the interaction of phytate and chromium (p < 0.05). There was no
significant difference between groups for the 30 minute insulin
values. The 60 minute values indicated a significant effect
(p < 0.002) due to chromium with the adequate Cr group without
phytate having the highest insulin level (12.9 ~U/ml) and the low
Cr/1.0% phytate group the lowest level (8.6 ~U/ml). At 120 minutes
there was a significant effect (p < 0.02) due to phytate and a trend
{p < 0.06) toward an effect of chromium. The adequate Cr group had
37
the highest level of insulin (8.8 ~U/ml) and the low Cr/1.0% phytate
group the lowest level of insulin (5.1 ~U/rnl).
400
350
300
250 ...-
O'l ---+.J ....1:: Oi 200 .,... <l)
::s: ~
'"0 0 co
150
100
50
0
-----LO¥J Cr /Tor yst Low Cr/Tor yst + 0.8% phy Low Cr/Tor yst + 1.2% phy
.. .. .. ... ..
•' •' ..
38
•'
.. ······· ..
/
/ ,/ Adeq Cr/Tor yst
Adeq Cr/brws' yst ...... ,....... . .,' •...•............... . . ,..· / . . ., . / .,. ., .,
••• / flllll',. . / /,. /
/ ,/ / /~
.. ·· /. / .. · . ~
... ····· /./ ,~'"' . "' .· / / .· / '/ .· /"
• ,/ '7
. / "' .· ./ ," ~""' .·· / / ~' . . / , .. · ./ / ---... I / ,. .,-:' / / .,.,
.... /,/ / .. /. '/ // : /q
.... ;; / .. · 11 ,""/
.... i., ..,-" .· i'l ,
.. ·· i I / . •/ // .··• .~I .· .; / . .; / . / .. / /
: I / ,• I ~
: I , :' I ,.,
/I /" •• I
•· I / . "/ -~
'Z~ ;' 7/
~~
1 2 3 4 5 6 7 8 9 10 11 1 2 13
Time 1n ~leeks
Figure 1. Mean body weight for groups during Experiment One.
39
TABLE 3
PHYTATE AND CHROMIUM CONTENT OF DIETS FOR EXPERIMENT ONE
1 % Phytate containing
compound added to diet
Phytate from analysis
% of diet
")
Chromiurn"-
Diet
Low Cr/Torula yeast
Low Cr/Torula yeast plus 0.8% phytate
Low Cr/Torula yeast plus 1.2% phytate
3 Adequate Cr/Torula yeast
Adequate Cr/brewers' yeast
0.00
1.38
2.07
0.00
0.00
0.29
1.00
1.44
0.29
0.29
content ppb
52
52
22
1430
39
1The disodium salt of phytic acid; 58% phytate by calculation.
2chromium analysis on Perkin-Elmer 5000 Atomic-AbsorptionSpectrophotometer with Graphite Furnace and Zeeman background Correction (Appendix B).
3 Two parts per million chromium added to the diet as chromic chloride.

TABLE 4
PLASMA GLUCOSE REMOVAL RATES 1 FOR EXPERIMENT ONE
Group
Low Cr/Torula yeast
Low Cr/Torula yeast plus 0.8% phytate
Low Cr/Torula yeast plus 1.2% phytate
Adequate Cr/Torula yeast
Adequate Cr/brewers' yeast
(5)
(5)
(4)
(5)
(3)
1st GTT \~eek 5
5.4±1.2x
5.1±0.4
7.0±1.5
5.0±0.9
4.4±0.3x
N
(8)
(10)
(8)
(6)
(10)
2nd GTT Week 8
3.2±0.4ay
3.9±0.5a
6.4±1.lb
3.6±0.6a
3.3±0.2ay
N
(10)
(8)
(7)
(10)
(9)
1 Glucose removal rate expressed as mg/dl/min. + S.E.M.
2N is equal to sample size.
40
3rd GTT Week 14
2.6±0.2y
3.5±0.2
4.0±0.6
3.1±0.3
3.0±0.3y
abMeans with different superscript letters in the same column are significantly different (p < 0.05).
xyMeans with different superscript letters in the same row are significantly different (p < 0.05).
I f

TABLE 5
INSULIN VALUES FOR EXPERIMENT ONE
Group
Low Cr/Torula yeast
Low Cr/Torula yeast plus 0.8i, phytate
Low Cr/Toru1a yeast plus 1.2% phytate
Adequate Cr/Torula yeast
Adequate Cr/brewers' yeast
1N . 1 1 . 1s equa to samp e s1ze.
2rnsulin expressed as mean ± S.E.M.
(10)
(10)
(5)
(10)
(9)
41
Insulin2
~U/ml
32.8±2.1a
30.3±4.Ra
+ b 12.9_1.7
27.9±4.2a
36.2±5.8a
abMeans with different superscript letters in the same column are significantly different (p < 0.05).
I f l 1
300
250
200
.,.... 150 (])
3
100
50
..
0
.. .. · ..
, . .. ······ .
1 2
Low Cr -·-·-·-·-- Low Cr + Zn & Cu ··················· Low Cr + Zn --------- Adeq Cr + Zn ----- Adeq Cr
3 4 5
Time 1n Weeks
6 7 8
Figure 2. Mean body weight for groups during Experiment Two.
42
43
TABLE 6
CHROMIUM CONTENT OF DIET AND LIVER FOR EXPERIMENT TWO
Chromium content1
of diet Ch
. 1,2 ronnum content
Diet
Low Cr
Low Cr plus Zn and Cu
Low Cr plus Zn
3 Adequate Cr plus Zn and Cu
Adequate cr3
ppb
44
49
36
6010
7420
of liYer N ppb
(6)
(6)
(5)
(6)
(6)
17.55:tl. 7
17.89:t2.87
18.42:t2.19
19.06:t2.85
16.19:tl.34
1chromium analysis on Perkin-Elmer 5000 Atomic-AbsorptionSpectrophotometer with Graphite Furnace and Zeeman background Correction (Appendix B).
2chromium content of liver expressed as means :t S.E.M.
3Five parts per million chromium added to the diet as chromium chloride.

TABLE 7
PLASMA GLUCOSE REMOVAL RATESl FOR EXPERIHENT TWO
Group
Low Cr
Low Cr plus Zn and Cu
Low Cr plus Zn
Adequate Cr plus Zn and Cu
Adequate Cr
(6)
(6)
(5)
(6)
(6)
1st GTT Week 4
3.5±0.3
3.7±0.3x
2.7±0.5
4.1±0.4
3.8±0.4
N
(5)
(5)
(4)
(6)
(6)
1 Glucose removal rate expressed as rng/dl/rnin. + S.E.M.
2N is equal to sample size.
44
2nd GTT \-leek 8
3.9±0.6
2.4±0.3y
2.3±0.2
2.9±0.4
3.4±0.5
xyMeans with different superscript letters in the same row are significantly different (p < 0.05).

)
TARLE 8
GLUCOSE AND INSULIN VALUES1
FOR EXPERIMENT T\.JO
Group
Low Cr
Low Cr plus Zn and Cu
Low Cr plus Zn
Adequate Cr plus Zn and Cu
Adequate Cr
(6)
(6)
(5)
(6)
(6)
Insulin lJU/ml
87.0±22.1
107.5±36.9
117.0±31.2
117.7±17.3
82.0±19.4
45
Glucose: insulin ratio
3.6±0.8
3.5±0.8
2.6±0.6
2.2±0.4
3.3±0.8
1 Values for insulin and glucose:insulin ratio are expressed as means ± S.E.M. Values are not significantly different.
2N is equal to the sample size.

+.J -'=
300
250
200
.~ 150 Q)
3
>, ""0 0
a:l
100
50
0
---············ ·······--------
Low Cr Low Cr + 1.0% phy Adeq Cr Adeq Cr + 1.0% phy
,
.. ········ __,. .. ·· _,., ... ··· .,.. .... / .. - / ... ·· ~~/ .·· ,~/
,"'/ ,, ,~ / .,, / .,., /
/'/ //
// //'
.·· /'/ .... // .... // .. ·· / ... ·· ~/ .. ~~ .·· ~ .. ··· // .· / .. ·· ~'/ .· / .... -'/ .· // .·· ~/ .. · // .· // .. · ~ .... <!'~ .· ~/
.··"""' ~~ ·""' .............
~
1 2 3 4 5 6 7 8
Time 1n Weeks
46
Figure 3. Mean body weight for groups during Experiment Three.
47
TABLE 9
PHYTATE AND CHROMIUM CONTENT OF DIETS FOR EXPERIMENT THREE
% Phytate containing Phvtate
compound "from analysis Diet added to diet % of diet
Chromium1
content ppb
Low Cr 0.00 0.23 62
Low Cr 1.0% phytate 1.72 1.21 37
')
Adequate Cr._ 1.0% phytate 1.72 1.22 1737
Adequate Cr 0.00 0.22 2287
1chromium analysis on Perkin-Elmer 5000 Atomic-AbsorptionSpectrophotometer with Graphite Furnace and Zeeman background Correction (Appendix B).
2 Two parts per million chromium added to the diet as chromium chloride.

TATILE 10
GLUCOSE VALUES1
' 2 FROM OGTT FOR EXPERIHEt-!T THREE
Diet
Low Cr
Low Cr/1.0% phytate
Adequate Cr/1.0% phytate
Adequate Cr
Fasting 30 Min
90±3.6 159±6.0
80±3.0 171±4.9
83±2.3 160±6.0
82±2.4 153±3.5
1 Glucose expressed as mg/dl ± S.E.M.
2 There were 12 samples per group.
60 min
159±3.5
160±5.3
151±7.0
156±6.0
48
120 min
a 120±3.8
b 98~3.0
b 104±2.8
b 104±2.3
abMeans with different superscript letters in the same column are significantly different (p < 0.05).

TABLE 11
GLUCOSE INCREMENT1
'2
FROM OGTT FOR EXPERIMENT THREE
Diet
Low Cr
Low Cr/1.0% phytate
Adequate Cr/1.0% phytate
Adequate Cr
30 Min
69±6.7a
90±7.3b
77:t8.0ab
71::4.8ab
60 min 120 min
68:t5.0 22:t4.6
80:t6.8 17±3.8
67::8.2 2l:t3. 7
74:t6.9 21±3.7
49
1Glucose increment = fasting value - 30, 60, or 120 min value ± S.E.M.
2 There were 12 samples per group.
abMeans with different superscript letters in the same column are significantly different (p < 0.05).

TABLE 12
INSULIN VALUES 1 FROM OGTT FOR EXPERIMENT THREE
Diet
Low Cr
Low Cr/1.0% phytate
Adequate Cr/1.0% phytate
Adequate Cr
Fasting
5.8±l.la
5.1±0.7a
4.3±0.7a
8.3±0.Sb
30 Min
12.5±1.9
16.7±1.2
13.4±1.2
16.2±1.3
1Insulin values expressed as ~U/ml + S.E.M.
2 There were 12 samples per group.
60 min
9.3±0.8a
8.6±0.9a
11.0±1.2ab
12.9±0.8b
50
120 min
ab 6.8±0.7
b 5.1±0.8
+ ab 6.3_1.0
8.8±0.9a
abMeans with different superscript letters in the same column are significantly different (p < 0.05).
CHAPTER V
DISCUSSION
Growth Rates
The growth rates at week 5 of male rats fed the Torula yeast
based diet on Experiment One and Three were below the average for
male Sprague-Dawley rats (National Academy of Sciences-NRC, 1978).
The growth rate of the brewers' yeast group however was above the
average. The mean growth rates of animals on the Torula yeast based
diets were also below the growth rate of animals fed chow in this
lab. Female rats on Experiment Two, fed the same Torula yeast based
diet as those animals on Experiment One, were slightly above the
average for female Sprague-Dawley rats at week 5. Since the female
rat has a slower growth rate and smaller mature weight than the male,
the diet may not meet protein requirements for maximum growth of the
male rat. The unpalatability of the diet may also have contributed
to the poor growth rate. The low Cr/1.2% phytate group displayed an
extremely poor growth rate which may be due to a toxic effect of
sodium phytate. Animals in this group had a high mortality rate
(30%) compared to the other groups (0%) on the study. At autopsy the
kidneys of the low Cr/1.2~ phytate group appeared gray, mottled, and
enlarged. The kidneys of the rats in the 1.0% phytate groups on
Experiment Three had a similar but less severe mottled appearance.
Pathological microscopic examination was made of kidnev tissue from
animals in the adequate CR/1.0~ phytate group and the adequate Cr
group (without phytate) from Experiment Three. Calcium deposits and
severe nephrosis were f6und in the kidneys of the phytate group and
51
52
minimal or focal damage was seen in the kidneys of the non-phytate
group.
Diet and Tissue Analysis
All of the low Cr diets in Experiment One, Two and Three were
below 100 ppb chroMium, the level expected to produce a chromium
deficiency (Schroeder et al., 1963; Mertz, 1969). Samples of the
positive control diets tested showed some variation in concentration
from the amount of chromium added to the diet. The variation may be
due to uneven distribution of chromium in the mixing process and the
small quantity (0.150 g) used for analysis. However, the larger the
number of random samples tested the closer the mean was to the
expected value of 2.1 ppm for Experiment One and Three and 5.1 ppm for
Experiment Two.
Liver chromium concentration was measured in Experiment Two to
determine if chromium deficient animals would have a lower chromium
concentration, indicating the liver as a physiological pool for
chromium. The results, no significant difference between groups, do
not support or refute this hypothesis since there were no significant
differences between groups on the IVGTT. The liver chromium
concentrations from Experiment Two (16 to 19 ppb) were similar to
those (8 to 13 ppb) reported by Jain et al. (1981). The same studv
by Jain et al., (1981) also reported no significant difference
between groups for liver chromium concentration or glucose tolerance.
However, using a tracer technique in combination with chromium
analysis on the same study, Jain et al., (1981) calculated liver
chromium as 55~ exchangeable in the Cr sttpplemented group, 46~ in the

53
control group and 27% in the chromium deprived group. The results of
that study indicated the liver is a physiological pool for chromium,
but determination of absolute Cr levels and a radiotracer technique
together were needed to demonstrate those differences in the
physiological chromium pool.
The flameless atomic absorption spectrophotometer with Zeemen
background correction and a low temperature ashing method have
improved the sensitivity of chromium analysis over previous methods
used. Bovine liver powder, a standard reference material from the
National Bureau of Standards, was analyzed and 95% of the certified
value was recovered (84 ng/g out of 88 ± 12 ng/g).
Glucose and Insulin
Intravenous glucose tolerance tests (IVGTT) were performed
during Experiment One and Two to determine glucose removal rates
(GRR). In previous studies feeding a chromium deficient diet
resulted in a low GRR (Mertz, 1976). A removal rate below 2.5
mg/dl/min is considered a low or subnormal value while 4.0 to 4.5
mg/dl/min is considered normal or chromium adequate (Schroeder et
al., 1963; Mertz, 1969). Although the results presented in Tables 4
and 7 were not significantly different at any of the IVGTT, the low
Cr/Torula Yeast group on Experiment One, week 14, had a low GRR of
2.6, which may indicate inadequate chromium nutrition. Likewise in
Experiment Two the low Cr plus Zn and the low Cr plus Zn and Cu
groups had a low GRR. In general the low Cr groups in Experiment Two
had lower GRR than in Experiment One at week 8. The lower GRR on
Experiment Two may have been due to decreased chromium stores of
54
these rats since the dams had been maintained from weaning on a
chromium deficient diet. The dams kept on the Cr deficient diet
produced smaller and fewer pups per litter, as well as fewer litters
compared to dams on lab chow. Also the rats used in Experiment Two
were female and data are not available to compare the GRR of the male
and female rat.
The adequate Cr groups on Experiment One and Two did not have a
significantly higher GRR than the low Cr groups. The GRR were also
less than 4.0 mg/dl/min which indicated that the level of chromium in
the "adequate Cr" diet was not high enough to maintain normal glucose
tolerance. The form of chromium in the diet may have been bound or
alated during or before ingestion by the animals. Other studies have
demonstrated normal glucose tolerance by adding inorganic chromium to
the drinking water (2 to 5 ppm) (Schroeder, 1966; Jain et al., 1981);
however, previous studies in this lab produced low GRR with addition
of chromium to the water.
Brewers' yeast has been considered one of the best sources of
GTF chromium (Mertz et al., 1974); however, some brewers' yeast may
not be a good source of available chromium (Mertz, 1983) as evidenced
in Experiment One by the brewers' yeast group which demonstrated a
significant decrease in GRR from week 5 to week 14 with a final GRR
of 3.0 mg/dl/min.
The GRR of groups in Experiment One and Two tended to decrease
across time with the low Cr/Torula yeast, brewers' yeast and low Cr
plus Zn and Cu groups showing a significant difference (p < 0.05).
This effect has been partially attributed to an age-related decline of

55
islet secretory capacity (Reaven et al., 1983). This same studv
indicated that plasma insulin levels were lowest and insulin
stimulated glucose utilization highest in calorie-restricted rats.
The same considerations may apply to the low Cr/1.2% phytate group
which had decreased food consumption, significantly lower insulin
levels, and significantly higher GRR compared to all other groups
during week 8 of Experiment One.
Mertz (1979) indicated that measurement of insulin values may be
a better indicator of differences in chromium status and possibly
more direct than measurement of glucose since the postulated role of
chromium is cofactor for insulin-receptor binding. Mertz (1979) also
indicated that chromium supplementation may correct either elevated
insulin levels or abnormal glucose tolerance or both.
On Experiment Three only the low Cr group at 120 minutes had
significantly higher glucose values. The fact that the highest
glucose increment was in the low Cr/1.0% phytate group may indicate
that chromium or some other trace element involved in insulin
metabolism was bound (unabsorbed). Insulin values in the low Cr
groups, though, were higher than the levels in the adequate Cr groups
instead of lower as expected. Statistically there was a greater
effect of phytate than of chromium or of the interaction between
phytate and chromium. A significant effect of phytate was seen at
the fasting and 120 minute insulin, at the 30 and 120 min glucose,
and on the 30 minute glucose increment. There was a significant
effect of the interaction of phytate and chromium at fasting insulin
and at the 120 minute glucose levels. A significant effect of
chromium on insulin levels was seen only at the 60 minute time
period.
56
Considering the toxicity effects observed in the kidneys of the
phytate groups there may be an indirect influence on insulin
production or secretion in the phytate group not measured by this
study. Since neither the glucose nor the insulin levels were
consistently higher in the low Cr groups, the chromium levels in the
adequate Cr groups may not have been high enough or bioavailable
enough to produce normal glucose tolerance.
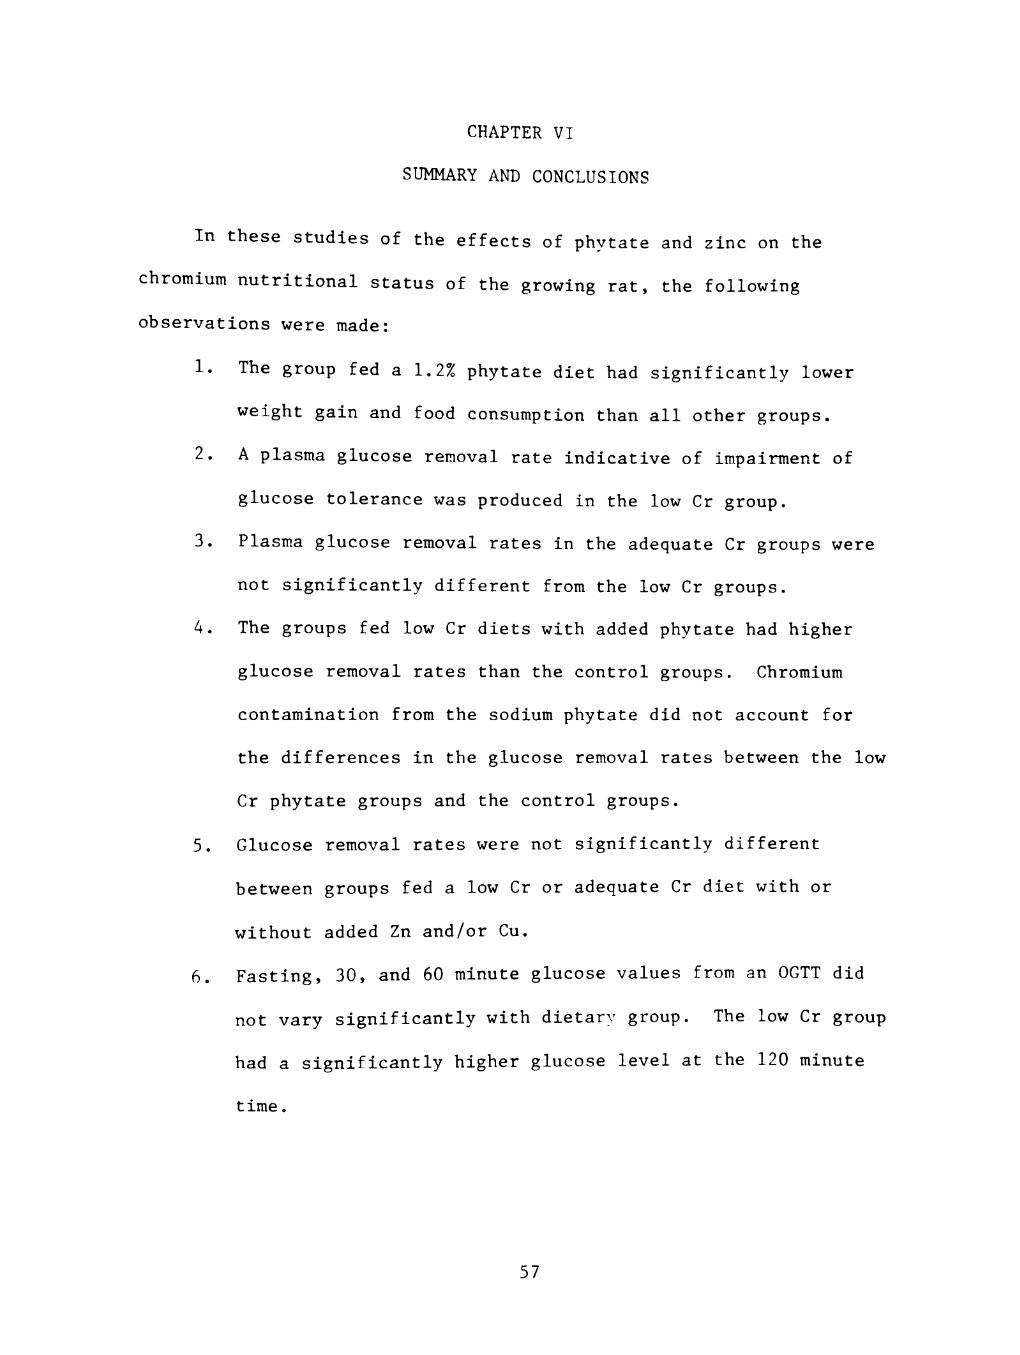
CHAPTER VI
SUMMARY AND CONCLUSIONS
In these studies of the effects of phytate and zinc on the
chromium nutritional status of the growing rat, the following
observations were made:
1. The group fed a 1.2% phytate diet had significantly lower
weight gain and food consumption than all other groups.
2. A plasma glucose removal rate indicative of impairment of
glucose tolerance was produced in the low Cr group.
3. Plasma glucose removal rates in the adequate Cr groups were
not significantly different from the low Cr groups.
4. The groups fed low Cr diets with added phytate had higher
glucose removal rates than the control groups. Chromium
contamination from the sodium phytate did not account for
the differences in the glucose removal rates between the low
Cr phytate groups and the control groups.
5. Glucose removal rates were not significantly different
between groups fed a low Cr or adequate Cr diet with or
without added Zn and/or Cu.
o. Fasting, 30, and 60 minute glucose values from an OGTT did
not vary significantly with dietary group. The low Cr group
had a significantly higher glucose level at the 120 minute
time.
57

58
The following conclusions were drawn from the three studies:
1. Sodium phytate fed at a 1.0% or higher level in the diet may
produce a toxic effect on the kidney of the rat.
2. Zinc, fed at twice the recommended levels does not affect
chromium nutritional status as measured by glucose renoval
rates and liver chromium concentration.
3. Phytate exerted a greater effect on glucose and insulin
values from an OGTT than did chromium.

REFERENCES
Anderson, R. A., M. M. Polansky, N. A. Bryden, K. Y. Patterson, C. Veillon, and W. H. Glinsmann. Effects of chromium supplementation on urinary Cr excretion of human subjects and correlation of Cr excretion with selected clinical parameters. J. Nutr. 113:276, 1983.
Bjorn-Rasmussen, E. Iron absorption from wheat bread: influence of various amounts of bran. Nutr. Metabol. 16:101, 1974.
Boyle, E., Jr., B. Mondschein, and H. H. Dash. Chromium depletion in the pathogenesis of diabetes and atherosclerosis. South. Med. J. 70:1449, 1977.
Campbell, W. J., and W. Mertz. Interation of insulin and chromium (III) on mitochondrial swelling. Am. J. Physiol. 204:1028, 1963.
Chen, N. S. C., A. Tsai, and I. A. Dyer. Effect of chelating agents on Cr absorption in rats. J. Nutr. 103:1182, 1973.
Christian, G. D.,~· C. Knoblock, W. C. Purdy, and W. Mertz. A polarographic study of chromium-insulin-mitochondrial interaction. Biochem. Biophys. Acta 66:420, 1963.
Davidson, I. W. F., and F. T. Burt. Physiological changes in plasma chromium of normal and pregnant women. Amer. J. Obstet. Gynecol. 116:601, 1973.
Davidson, I. W. F., R. T. Burt, and J. C. Parker. Renal excretion of trace elements: chromium and copper. Proc. Soc. Exptl. Biol. Med. 147:720, 1974.
Davies, N. T., and R. Nightingale. The effects of phytate on intestinal absorption and secretion of zinc, and whole-body retention of zinc, copper, iron, and manganese in rats. Br. J. Nutr. 34:243, 1975.
Davies, N. T. Anti-nutrient factors affecting mineral utilization. Proc. Nutr. Soc. 38:121, 1979.
Donaldson, D. L., and o. M. Rennert. Chromium metabolism by the kidney. Anal. Clin. Lab. Sci. 11(5):377, 1981.
Donaldson, R. M., and R. F. Barreras. Intestional absorption of trace quantities of chromium. J. Lab. Clin. Med. 68:484, 1966.
59

60
Duncan, L. J. P. The intravenous glucose tolerance test. Quart. J. Exptl. Physiol. 41:85, 1956.
Ellis, R., and E. R. Morris. Improved Ion-exchange phytate method. Cereal Chern. 60:121, 1983.
Erdman, J. W., Jr., and R. M. Forbes. Mineral bioavailability from phytate-containing foods. Food Prod. Development 11(10):46, 1977.
Food and Nutrition Board. Recommended dietary allowances. 9th revised ed. Wash. D.C.:Natl. Acad. Sci., 1980.
Forbes, R. M., K. E. Weingartner, H. M. Parker, R. R. Bell, and J. W. Erdman, Jr. Bioavailability to rats of zinc, magnesium, and calcium in casein-, egg-, and soy-protein diets. J. Nutr. 109: 1652, 1979.
Freund, H., S. Atamian, and J. E. Fischer. Chromium deficiency during total parenteral nutrition. JAMA 241:496, 1979.
Godara, R., A. P. Kaur, and C. M. Bhat. Effect of cellulose incorporation in a low fiber diet on fecal excretion and serum levels of calcium, phosphorus, and iron in adolescent girls. Am. J. Clin. Nutr. 34:1083, 1981.
Gurson, C. T., and G. Saner. Effects of chromium on glucose utilization in marasmic protein-calorie malnutrition. Am. J. Clin. Nutr. 24:1313, 1971.
Glirson, C. T., and G. Saner. The effect of glucose loading on urinary excretion of chromium in normal adults, in individuals from diabetic families and in diabetics. Am. J. Clin. Nutr. 31:1158, 1978.
Hahn, C. J., and G. W. Evans. Absorption of trace metals in the zinc-deficient rat. Am. J. Physiol. 228:1020, 1975.
Hambidge, K. M. Chromium nutrition in man. Am. J. Clin. Nutr. 33:57, 1980.
H 1 d B F nd D. Oberleas. A modified method for phytate ar an, •• , a analysis using an ion-exchange procedure: application to textured vegetable proteins. Cereal Chern. 54:827, 1977.
Harland, B. F., and J. Harland. Fermintative reduction of phytate in rye, white, and whole wheat breads. Cereal Chem. 47(3): 226, 1980.
Hartman, G. H., Jr. Removal of phytate from soy protein. J. Am. Oilseed Chem. Soc. 46:731, 1979.

61
Hopkins, L. L., Jr., and K. Schwarz. Chromium(III) binding to serum specifically siderophilin. Biochem. Biophys. Acta. 90:484, 1964.
'
Hopkins, L. L., Jr. Distribution in the rat of physiological amounts of injected chromium 51 (III) with time. Am. J. Physiol. 209:731, 1965.
Hopkins, L. L., Jr., 0. Ransome-Kuti, and A. S. Majaj. Improvement of impaired carbohydrate metabolism by chromium(III) in malnourished infants. Am. J. Clin. Nutr. 21:203, 1968.
Hunter, J. E. phytate.
Iron availability and absorption in rats fed sodium J. Nutr. 111:841, 1981.
Jain, R., R. L. Verch, S. Wallace, and R. A. Peabody. Tissue chromium exchange in the rat. Am. J. Clin. Nutr. 34:2199, 1981.
Jeejeebhoy, K. N., R. C. Chu, E. B. Marliss, G. R. Greenberg, and A. Bruce-Robertson. Chromium deficiency, glucose intolerance, and neuropathy reversed by chromium supplementation, in a patient receiving long-term total parenteral nutrition. Am. J. Clin. Nutr. 30:531, 1977.
Kraintz, T., and R. V. Talmadge. Distribution of radioactivity following intravenous administration of trivalent chromium 51 in the rat and rabbit. Proc. Soc. Exp. Biol. Med. 81:490, 1952.
Kumpulainen, and Koivistoinen. Chromium content of some Finnish cereals determined by atomic absorption spectrophotometry. Acta Agric. Scand. 27:35, 1977.
Lifschitz, M. L., S. Wallach, R. A. Peabody, R. L. Verc~ and R. Agrawal. Radiochromium distribution in thyroid and parathyroid deficiency. Am. J. Clin. Nutr. 33:57, 1980.
Liu, V. J. K., and J. S. Morris. indicator of chromium status.
Relative chromium response as an Am. J. Clin. Nutr. 31:972, 1978.
Li V J K a d R P Abernathy Chromium and insulin in young u, •.• , n • • • subjects with normal glucose tolerance. Am. J. Clin. Nutr. 35:661, 1982.
Maga, Joseph A. Reviews. Phytate: its chemistry, occurance, food interactions, nutritional significance, and methods of analysis. J. Agric. Food Chern. 39:1, 1982.
Mertz, W., and K. Schwarz. Impaired intravenous glucose tolerance as an early sign of dietary necrotic liver degeneration. Arch. Biochem. Biophys. 58:504, 1955.
62
Mertz, W., and K. Schwarz. Relation of glucose tolerance factor to impaired intravenous glucose tolerance of rats on stock diets. Am. J. Physiol. 196:614, 1959.
Mertz, W., E. E. Roginski, and K. Schwarz. Effect of trivalent chromium on glucose uptake by epididymal fat tissue of rats. J. Biol. Chern. 236:318, 1961.
Mertz, W., and E. E. Roginski. The effect of trivalent chromium on galactose entry in rat epididymnal fat tissue. J. Biol. Chern. 238:868, 1963.
Mertz, W., E. E. Roginski, and R. C. Reba. Biological activity and fate of trace quantities of intravenous chromium III in the rat. Am. J. Physiol. 209:489, 1965.
Mertz, W. Biological role of chromium. Fed. Proc. 26:186, 1967.
Mertz, W., E. E. Roginski, F. J. Feldman, and D. E. Thurman. Dependence of chromium transfer into the rat embryo on the chemical form. J. Nutr. 99:363, 1969.
Mertz, W. Chromium occurrence and function in biological systems. Physiol. Rev. 49:163, 1969.
Mertz, W., and E. E. Roginski. Chromium metabolism: the glucose tolerance factor. In: Newer trace elements in nutrition, edited by W. Mertz and W. E. Cornatzer, New York, Marcel Decker, 1971, pp. 123-153.
Mertz, W. The newer essential trace elements, chromium, tin, vanadium, nickel, and silicon. Proc. Nutr. Soc. 33:307, 1974.
Mertz, W., E. W. Toepfer, E. E. Roginski, and M. M. Polansky. Present knowledge of the role of chromium. Fed. Proc. 33:2275, 1974.
Mertz, W. Effects and metabolism of glucose tolerance factor. Nutr. Rev. 33(5):129, 1975.
M t W Chromium and its relation to carbohydrate metabolism. er z, . Med. Clin. North Am. 60(4):739, 1976.
M t W Chromium-An Overview. In: Chromium in Nutrition and. er z, • Metabolism, edited by D. Shapcott and J. Hubert, North Holland Press, 1979, pp. 1-255.
Mertz, W. Nutrition Institute, U.S.D.A., Beltsville, MD. 1983, personal communication.
Morris, E. R., and R. Ellis. Isolation of monoferric phytate from wheat bran and its biological value as an iron source to the rat. J. Nutr. 106:753, 1976.
63
Morris, E. R., and R. Ellis. Effect of dietary phytate/zinc molar ratio on growth and bone zinc response of rats fed semipurified diets. J. Nutr. 110:1037, 1980.
h 14 Na apetian, A., and V. R. Young. Metabolism of C-phytate in rats: effects of low and high dietary calcium intakes. J. Nutr. 110:1458, 1980.
National Research Council. Nutrient Requirements of Laboratory Animals. 3rd edition, Washington, D.C., National Academy of Sciences, 1978, pp. 1-172.
Oberleas, D., and B. Harland. Phytate content of foods: effect on dietary zinc bioavailability. J. Am. Diet. A. 79:433, 1981.
Oberleas, D. Phytate content in cereals and legumes and methods of determination. Cereal Foods World 28:352, 1983.
Offenbacher, E. G., and F. X. Pi-Sunuer. Beneficial effect of chromium-rich yeast on glucose tolerance and blood lipids in elderly subjects. Diabetes 29:919, 1980.
Pekarek, R. S., E. C. Hauer, E. J. Rayfield, R. W. Wannemacher, and W. R. Beisel. Relationship between serum chromium concentrations and glucose utilization in normal and infected subjects. Diabetes 24:350, 1975.
Rabinowitz, M. B., S. R. Tevin, and H. C. Gonick. chromium status in diabetic and normal men. 355, 1980.
Comparisons of Metabolism 29(4):
Railes, R., and M. J. Albrink. Effect of chromium chloride supplementation on glucose tolerance and serum lipids including high-density lipoprotein of adult men. Am. J. Clin. Nutr. 34:2670, 1981.
Reddy, N. R., S. K. Sathe, and D. K. Salunkhe. Phytates in legumes and cereals. In: Advances in Food Research, edited by.C. 0. Chichester, E.JM. Mrak, and G. F. Stewart. Academic Press, N.Y., 1982, pp. 1-92.
Reinhold, J. G., F. Ismail-Beigi, and B. Faradji. Fibre vs. phytate as determinant of the availability of calcium, zinc, and iron of breadstuffs. Nutr. Rep. Internat. 12(2):75, 1975.
Roginski, E. E., and W. Mertz. Effects of chromium(III) supplementation on glucose and amino acid metabolism in rats fed a low protein diet. J. Nutr. 97:525, 1969.
\/Saner, G. Chromium in nutrition and disease. 1980:4-49.
New York: Liss,
64
Schroeder, H. A., J. J. Balassa, and I. H. Tipton. Abnormal trace metals in man. J. Chronic Diseases 15:941, 1962.
Schroeder, H. A., W. H. Vinton, Jr., and J. Balassa. Effects of chromium, cadmium and lead on the growth and survival of rats. J. Nutr. 80:48, 1963.
Schroeder, H. A., and J. J. Balassa. Influence of chromium, cadmium, and lead in rat aortic lipids and circulating cholesterol. Amer. J. Physiol. 209:433, 1965.
Schroeder, H. A. Cadmium, chromium, and cardiovascular disease. Circulation 35:570, 1967.
Schroeder, H. A. The role of chromium in mammalian nutrition. Am. J. Clin. Nutr. 21:230, 1968.
Schroeder, H. A. Serum cholesterol and glucose levels in rats fed refined and less refined sugars and chromium. J. Nutr. 97: 242, 1969.
Schwarz, K., and W. Mertz. A glucose tolerance factor and its differentiation from factor 3. Arch. Biochem. Biophys. 72: 515, 1957.
Schwarz, K., and W. Mertz. Chromium(III) and the glucose tolerance factor. Arch. Biochem. Biophys. 85:292, 1959.
Toepfer, E. W., W. Mertz, E. E. Roginski, and M. M. Polansky. Chromium in foods in relation to biological activitv. J. Agr. Food Chern. 21(1):69, 1973.
Toepfer, E. W., W. Mertz, M. M. Polansky, E. E. Roginski, and W. R. Wolf. Preparation of chromium-containing material of GTF activity from brewer's yeast extracts and by synthesis. J. Agric. Food Chern. 25:162, 1977.
V Tuman, R. W., and R. J. Daisy. Metabolic effects of the glucose tolerance factor (GTF) in normal and genetically diabetic mice. Diabetes 26:820, 1977.
v Tuman, R. W., J. T. Bilbo, and R. J. Daisy. Comparison and effects of natural and synthetic glucose tolerance factor in normal and genetically diabetic mice. Diabetes 27:49, 1978.
Underwood, E. J. Chromium. In: Trac€ elements in human and animal nutrition, 4th edition, New York, Academic Press. 1977, pp. 258-270.
Underwood, E. J. Changes in trace metals in protein or energy restriction. J. Human Nutr. 32:253, 1978.
Vanderlinde, R. E., F. G. Kayne, G. Komar, M. J. Simmons, J. Y.
65
Bon, and R. T. Lavine. Serum and urine levels of chromium. In: Chromium in nutrition and metabolism, edited by D. Shapcott, and J. Hubert. New York, Elsevier/North-Holland, 1979, pp. 43-48.
Visek, H. J., I. B. Whitney, U. S. G. Kuhn, and C. L. Cornar. Metabolism of chromium-51 by animals as influnced by chemical state. Proc. Soc. Exp. Biol. Med. 84:610, 1963.
Vohra, P., G. A. Gray, and F. H. Kratzer. Phytic-acid-rnetal complexes. Proc. Soc. Exp. Biol. Med. 120:447, 1965.
~Jashko, M. E., and E. W. Rice. Determination of glucose by an improved enzymatic procedure. Clin. Chern. 7:542, 1961.
VJolf, W. R., W. Mertz, and R. Masironi. Determination of chromium in refined and unrefined sugars by oxygen plasma ashing flarneless atomic absorption. J. Agric. Food Chern. 22:1037, 1974.

APPENDICES
66
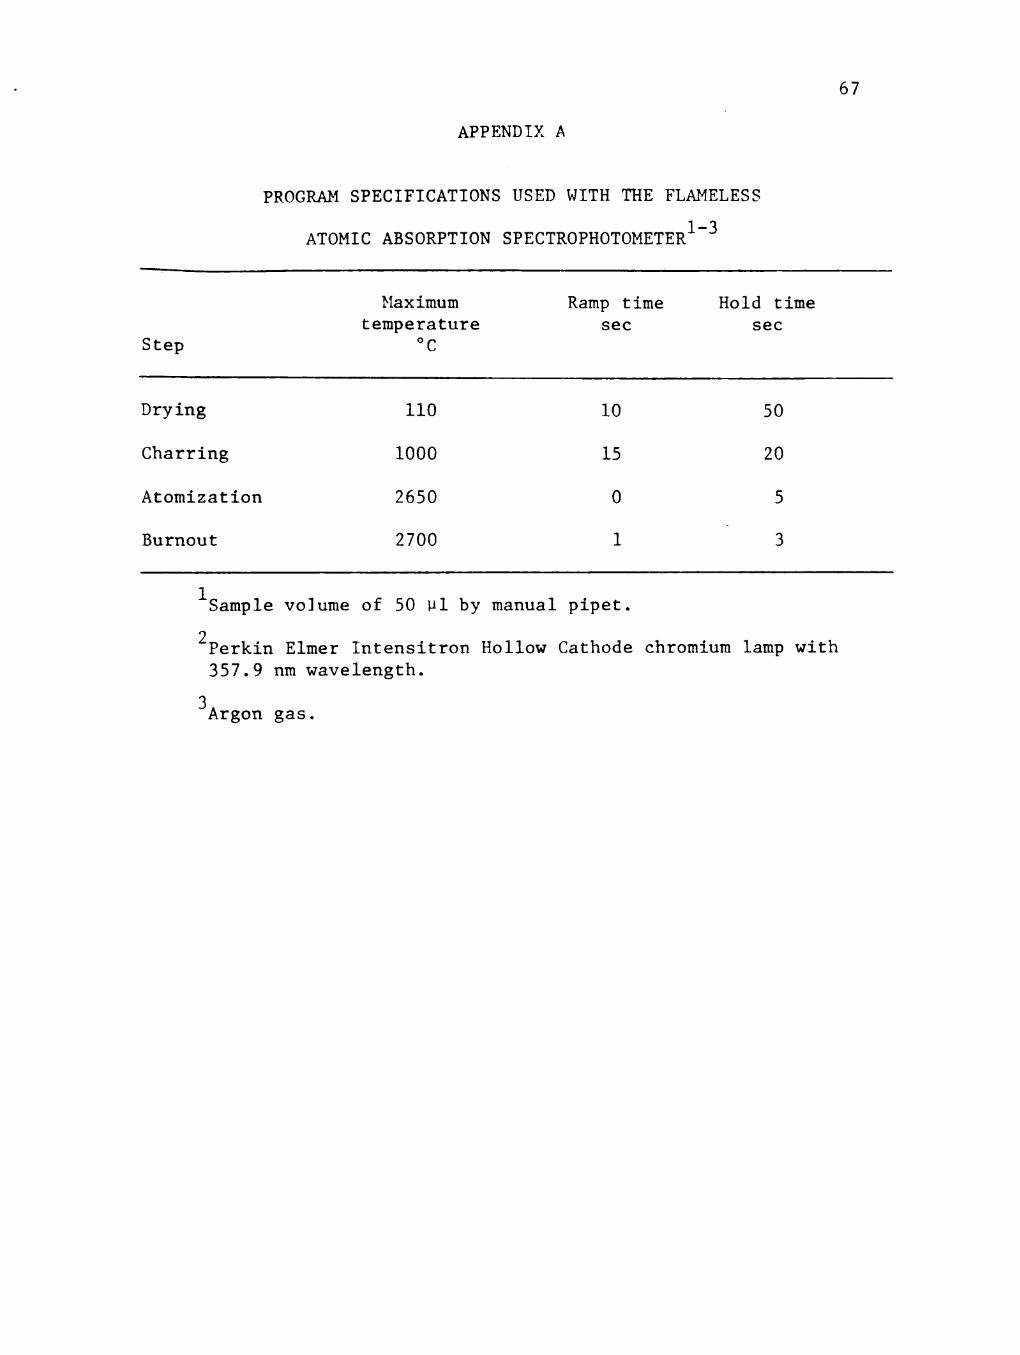
Step
Drying
Charring
Atomization
Burnout
APPENDIX A
PROGRAM SPECIFICATIONS USED WITH THE FLAMELESS
ATOMIC ABSORPTION SPECTROPHOTOMETER1- 3
Haximum temperature
oc
110
1000
26SO
2700
Ramp time sec
10
lS
0
1
Hold time sec
so
20
s
3
1 Sample volume of SO ~1 by manual pipet.
2Perkin Elmer Intensitron Hollow Cathode chromium lamp with 3S7.9 nm wavelength.
3 Argon gas.
67
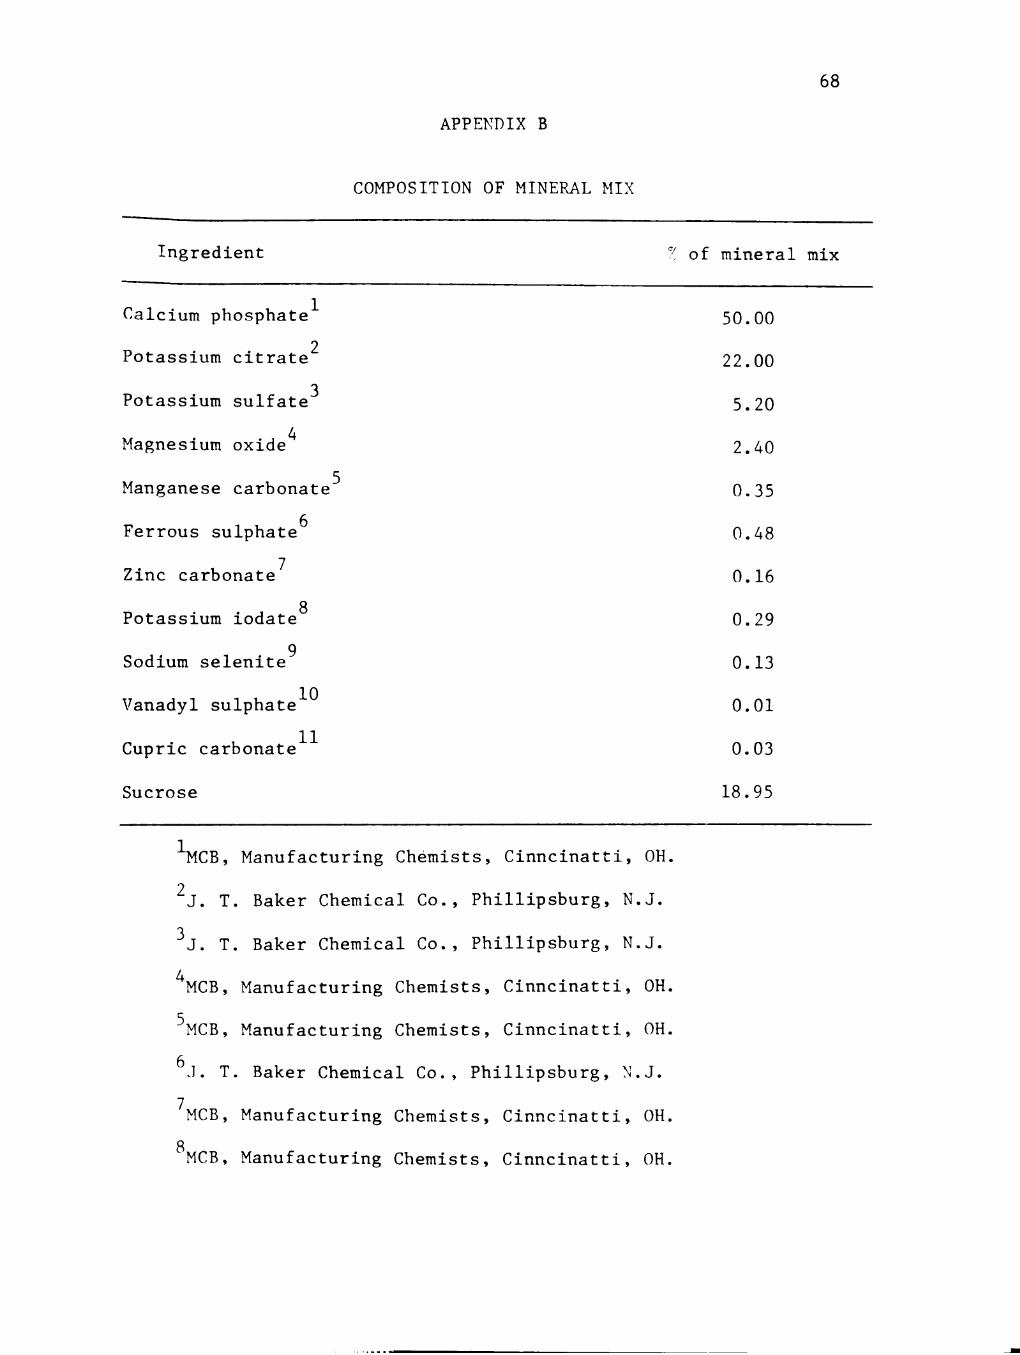
68
APPE~DIX B
COMPOSITION OF MINERAL HIX
Ingredient ( of mineral mix
1 Calcium phosphate
Potassium citrate2
Potassium sulfate3
M . . d 4 agnes1um oxl e
5 Manganese carbonate
6 Ferrous sulphate
Zinc carbonate 7
P . . d 8 otasslum lO ate
Sodium selenite9
10 Vanadyl sulphate
C . b 11 upr1c car onate
Sucrose
1MCB, Manufacturing Chemists, Cinncinatti, OH.
2]. T. Baker Chemical Co. , Phillipsburg, N.J.
3J. T. Baker Chemical Co. , Phillipsburg, N.J.
4MCB, Manufacturing Chemists, Cinncinatti, OH.
5MCB, Manufacturing Chemists, Cinncinatti, OH.
6J. T. Baker Chemical Co., Phillipsburg, ~.J. 7
MCB, Manufacturing Chemists, Cinncinatti, OH.
8MCB, Manufacturing Chemists, Cinncinatti, OH.
50.00
22.00
5.20
2.40
0.35
0.48
0.16
0.29
0.13
0.01
0.03
18.95
69
a 'Sigma Chemical Company, St. Louis, MO.
10BDH Chemicals, Ltd., Poole England.
11MCB, Manufacturing Chemists, Cinncinatti, OH .
.. ··-~-·.·------------


![Low-phytate wholegrain bread instead of high-phytate ...risk of maternal and child mortality [–46]. Iron deficiency and iron deficiency anemia is a major global health problem, especially](https://static.fdocuments.us/doc/165x107/5ff83448f2a2a9700843c871/low-phytate-wholegrain-bread-instead-of-high-phytate-risk-of-maternal-and-child.jpg)