Physiologic, health, and production responses of dairy...
11
5562 J. Dairy Sci. 99:5562–5572 http://dx.doi.org/10.3168/jds.2015-10621 © American Dairy Science Association ® , 2016. ABSTRACT This study compared physiological, health, and productive parameters in dairy cows supplemented or not with Omnigen-AF (OMN; Phibro Animal Health, Teaneck, NJ) during the transition period. Thirty- eight nonlactating, multiparous, pregnant Holstein × Gir cows were ranked by body weight (BW) and body condition score (BCS), and assigned to receive (n = 19) or not (CON; n = 19) OMN at 56 g/cow daily (as-fed basis) beginning 35 d before expected date of calving. Before calving, cows were maintained in single drylot pen with ad libitum access to corn silage, and received (as-fed basis) 3 kg/cow daily of a concentrate. After calving, cows were moved to an adjacent drylot pen, milked twice daily, offered (as-fed basis) 35 kg/cow daily of corn silage, and individually received a concen- trate formulated to meet their nutritional requirements after both milkings. Cows received OMN individually as top-dressing in the morning concentrate feeding. Before calving, cow BW and BCS were recorded weekly and blood samples were collected every 5 d beginning on d −35 relative to expected calving date. After calv- ing and until 46 d in milk, BW and BCS were recorded weekly, individual milk production was recorded, and milk samples were collected daily for total solids and somatic cell count analyses. Blood was sampled daily from 0 to 7 d in milk, every other day from 9 to 21 d in milk, and every 5 d from 26 to 46 d in milk. On 30 and 46 d in milk, cows were evaluated for endometritis via cytobrush technique, based on % of polymorphonuclear (PMN) cells in 100 total cell count (PMN + endome- trial cells). On 48.7 ± 1.6 d in milk, 9 cows/treatment received a lipopolysaccharide (LPS) injection (0.25 μg/ kg of BW), and blood was sampled hourly from −2 to 8 h, at 12-h intervals from 12 to 72 h, and at 24-h in- tervals form 96 to 120 h relative to LPS administration. No treatment differences were detected on BW, BCS, serum concentrations of cortisol, fatty acids, insulin, glucose, haptoglobin, cortisol, and insulin-like growth factor-I. Cows receiving OMN had greater milk yield (30.3 vs. 27.1 kg/d) and percentage of PMN cells in endometrial cell population (12.2 vs. 3.9%) compared with CON cows. After LPS administration, cows receiv- ing OMN had greater mean serum haptoglobin (212 vs. 94 μg/mL), as well as greater serum concentration of tumor necrosis factor α at 1, 2, and 3 h relative to LPS injection compared with CON cows. In conclusion, OMN supplementation during the transition period en- hanced innate immunity parameters and increased milk production in dairy cows. Key words: inflammation, milk production, Omnigen- AF, transition cows INTRODUCTION During the transition period, dairy cows experience physiological changes associated with parturition and onset of lactation that impair their immune function (Mallard et al., 1998; Drackley, 1999). These include increased lipolysis, altered insulin-glucose and soma- trotopic axes, as well as heightened inflammatory and acute phase reactions (Grummer, 1995; Sheldon et al., 2001). Consequently, transition dairy cows are highly susceptible to metabolic and infectious diseases that di- rectly affect their lactation productivity and well-being (Goff and Horst, 1997; Mallard et al., 1998). Hence, management strategies that modulate physiology and enhance immunocompetence of transition dairy cows are warranted to optimize profitability in dairy produc- tion systems (Overton and Waldron, 2004). Omnigen-AF (OMN; Phibro Animal Health, Te- aneck, NJ) is a patented proprietary branded prod- uct shown to modulate innate and adaptive immune function in ruminants and other livestock species. For example, OMN supplementation enhanced innate im- munity parameters in sheep administered dexametha- sone (Wang et al., 2007) and in blood leukocytes from Holstein heifers (Ryman et al., 2013). Wang et al. Physiologic, health, and production responses of dairy cows supplemented with an immunomodulatory feed ingredient during the transition period $ 3 %UDQGmR 5 ) &RRNH 1 ) 1 &RUUi 0 % 3LFFROR 5 *HQQDUL 7 /HLYD DQG - / 0 9DVFRQFHORV 1 *São Paulo State University, Department of Animal Production, Botucatu 18168-000, Brazil †Eastern Oregon Agricultural Research Center, Oregon State University, Burns 97720 Received November 10, 2015. Accepted March 3, 2016. 1 Corresponding authors: [email protected] and [email protected] #895
Transcript of Physiologic, health, and production responses of dairy...

5562
J. Dairy Sci. 99:5562–5572http://dx.doi.org/10.3168/jds.2015-10621© American Dairy Science Association®, 2016.
ABSTRACT
This study compared physiological, health, and productive parameters in dairy cows supplemented or not with Omnigen-AF (OMN; Phibro Animal Health, Teaneck, NJ) during the transition period. Thirty-eight nonlactating, multiparous, pregnant Holstein × Gir cows were ranked by body weight (BW) and body condition score (BCS), and assigned to receive (n = 19) or not (CON; n = 19) OMN at 56 g/cow daily (as-fed basis) beginning 35 d before expected date of calving. Before calving, cows were maintained in single drylot pen with ad libitum access to corn silage, and received (as-fed basis) 3 kg/cow daily of a concentrate. After calving, cows were moved to an adjacent drylot pen, milked twice daily, offered (as-fed basis) 35 kg/cow daily of corn silage, and individually received a concen-trate formulated to meet their nutritional requirements after both milkings. Cows received OMN individually as top-dressing in the morning concentrate feeding. Before calving, cow BW and BCS were recorded weekly and blood samples were collected every 5 d beginning on d −35 relative to expected calving date. After calv-ing and until 46 d in milk, BW and BCS were recorded weekly, individual milk production was recorded, and milk samples were collected daily for total solids and somatic cell count analyses. Blood was sampled daily from 0 to 7 d in milk, every other day from 9 to 21 d in milk, and every 5 d from 26 to 46 d in milk. On 30 and 46 d in milk, cows were evaluated for endometritis via cytobrush technique, based on % of polymorphonuclear (PMN) cells in 100 total cell count (PMN + endome-trial cells). On 48.7 ± 1.6 d in milk, 9 cows/treatment received a lipopolysaccharide (LPS) injection (0.25 μg/kg of BW), and blood was sampled hourly from −2 to 8 h, at 12-h intervals from 12 to 72 h, and at 24-h in-tervals form 96 to 120 h relative to LPS administration.
No treatment differences were detected on BW, BCS, serum concentrations of cortisol, fatty acids, insulin, glucose, haptoglobin, cortisol, and insulin-like growth factor-I. Cows receiving OMN had greater milk yield (30.3 vs. 27.1 kg/d) and percentage of PMN cells in endometrial cell population (12.2 vs. 3.9%) compared with CON cows. After LPS administration, cows receiv-ing OMN had greater mean serum haptoglobin (212 vs. 94 μg/mL), as well as greater serum concentration of tumor necrosis factor α at 1, 2, and 3 h relative to LPS injection compared with CON cows. In conclusion, OMN supplementation during the transition period en-hanced innate immunity parameters and increased milk production in dairy cows.Key words: inflammation, milk production, Omnigen-AF, transition cows
INTRODUCTION
During the transition period, dairy cows experience physiological changes associated with parturition and onset of lactation that impair their immune function (Mallard et al., 1998; Drackley, 1999). These include increased lipolysis, altered insulin-glucose and soma-trotopic axes, as well as heightened inflammatory and acute phase reactions (Grummer, 1995; Sheldon et al., 2001). Consequently, transition dairy cows are highly susceptible to metabolic and infectious diseases that di-rectly affect their lactation productivity and well-being (Goff and Horst, 1997; Mallard et al., 1998). Hence, management strategies that modulate physiology and enhance immunocompetence of transition dairy cows are warranted to optimize profitability in dairy produc-tion systems (Overton and Waldron, 2004).
Omnigen-AF (OMN; Phibro Animal Health, Te-aneck, NJ) is a patented proprietary branded prod-uct shown to modulate innate and adaptive immune function in ruminants and other livestock species. For example, OMN supplementation enhanced innate im-munity parameters in sheep administered dexametha-sone (Wang et al., 2007) and in blood leukocytes from Holstein heifers (Ryman et al., 2013). Wang et al.
Physiologic, health, and production responses of dairy cows supplemented with an immunomodulatory feed ingredient during the transition period
1 1
*São Paulo State University, Department of Animal Production, Botucatu 18168-000, Brazil†Eastern Oregon Agricultural Research Center, Oregon State University, Burns 97720
Received November 10, 2015.Accepted March 3, 2016.1 Corresponding authors: [email protected] and
#895
Journal of Dairy Science Vol. 99 No. 7, 2016
IMMUNOMODULATORY FEED TO TRANSITION DAIRY COWS 5563
(2009) supplemented OMN to transition Jersey cows, and reported increased blood leukocytes concentrations and mRNA expression of proinflammatory cytokines in supplemented versus nonsupplemented cows. Collec-tively, these results are suggestive of heightened innate immunity when OMN is supplemented, although the effects of this feed additive on metabolic, health, and productive responses of transition dairy cows still war-rants investigation.
Based on this rationale, we hypothesized that OMN supplementation to dairy cows will optimize metabolic and innate immune responses during the transition pe-riod, resulting in enhanced milk production. Therefore, this experiment compared physiological, health, and productive parameters in dairy cows supplemented or not with OMN before calving and during early lacta-tion.
MATERIALS AND METHODS
This experiment was conducted at the São Paulo State University, Lageado Experimental Station, lo-cated in Botucatu, São Paulo, Brazil. The animals used were cared for in accordance with acceptable practices and experimental protocols reviewed and approved by the São Paulo State University Animal Ethics Com-mittee.
Animals and Diets
Thirty-eight nonlactating, multiparous, pregnant Holstein × Gir cows (initial mean ± SE; BW = 638 ± 12 kg, BCS = 3.33 ± 0.08) were ranked by parity, BW, and BCS (Wildman et al., 1982) in a decreasing order and alternatingly assigned to receive (n = 19) or not (CON; n = 19) 56 g/cow daily (as-fed basis) of OMN beginning 35 d before expected date of calving. This allocation procedure was adopted to ensure that both treatment groups had similar parity, BW, and BCS at the beginning of the experiment (OMN-supplemented cows = 3.3 ± 0.3 parities, 656 ± 16 kg of BW, and 3.19 ± 0.11 of BCS; CON cows = 3.2 ± 0.3 parities, 628 ± 16 kg of BW, and 3.15 ± 0.12 of BCS). According to the manufacturer, OMN contains a mixture of ac-tive dried Saccharomyces cerevisiae, dried Trichoderma longibrachiatum fermentation product, niacin, vitamin B12, riboflavin-5-phosphate, d-calcium pantothenate, choline chloride, biotin, thiamine monohydrate, pyri-doxine hydrochloride, menodione dimethylpyrimidinol bisulfate, folic acid, calcium aluminosilicate, sodium aluminosilicate, diatomaceous earth, calcium carbon-ate, rice hulls, and mineral oil (full formulation is pro-prietary).
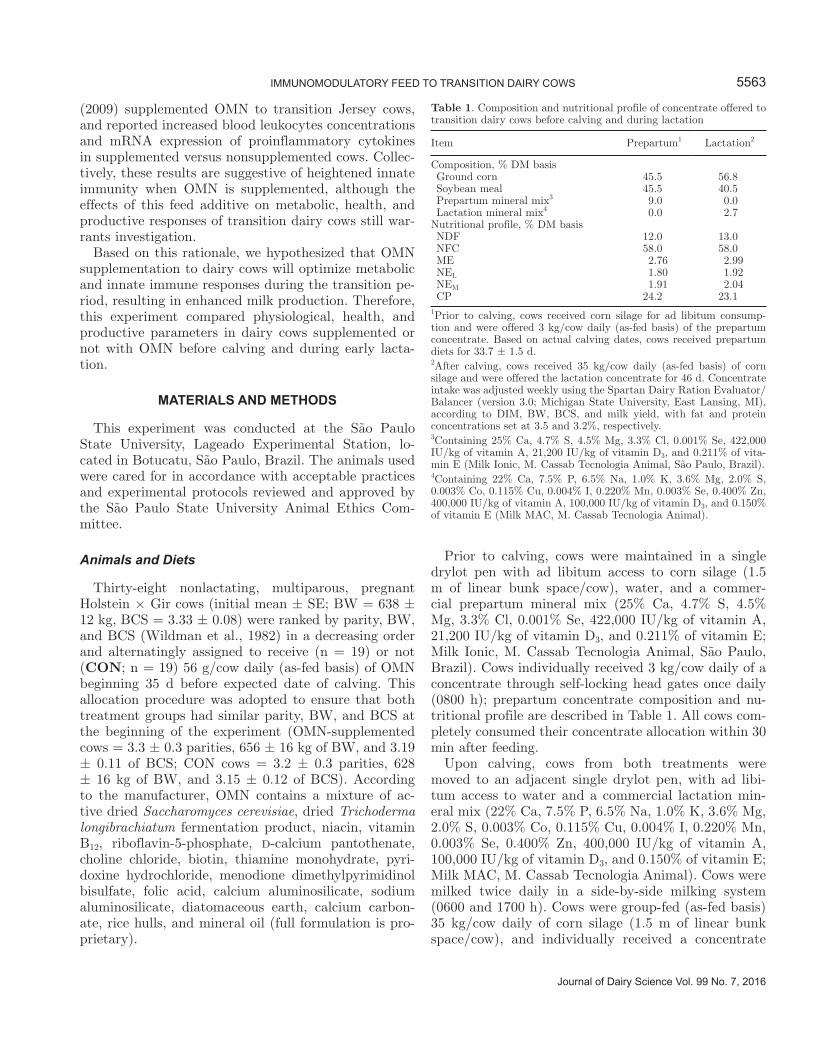
Prior to calving, cows were maintained in a single drylot pen with ad libitum access to corn silage (1.5 m of linear bunk space/cow), water, and a commer-cial prepartum mineral mix (25% Ca, 4.7% S, 4.5% Mg, 3.3% Cl, 0.001% Se, 422,000 IU/kg of vitamin A, 21,200 IU/kg of vitamin D3, and 0.211% of vitamin E; Milk Ionic, M. Cassab Tecnologia Animal, São Paulo, Brazil). Cows individually received 3 kg/cow daily of a concentrate through self-locking head gates once daily (0800 h); prepartum concentrate composition and nu-tritional profile are described in Table 1. All cows com-pletely consumed their concentrate allocation within 30 min after feeding.
Upon calving, cows from both treatments were moved to an adjacent single drylot pen, with ad libi-tum access to water and a commercial lactation min-eral mix (22% Ca, 7.5% P, 6.5% Na, 1.0% K, 3.6% Mg, 2.0% S, 0.003% Co, 0.115% Cu, 0.004% I, 0.220% Mn, 0.003% Se, 0.400% Zn, 400,000 IU/kg of vitamin A, 100,000 IU/kg of vitamin D3, and 0.150% of vitamin E; Milk MAC, M. Cassab Tecnologia Animal). Cows were milked twice daily in a side-by-side milking system (0600 and 1700 h). Cows were group-fed (as-fed basis) 35 kg/cow daily of corn silage (1.5 m of linear bunk space/cow), and individually received a concentrate
Table 1. Composition and nutritional profile of concentrate offered to transition dairy cows before calving and during lactation
Item Prepartum1 Lactation2
Composition, % DM basis Ground corn 45.5 56.8 Soybean meal 45.5 40.5 Prepartum mineral mix3 9.0 0.0 Lactation mineral mix4 0.0 2.7Nutritional profile, % DM basis NDF 12.0 13.0 NFC 58.0 58.0 ME 2.76 2.99 NEL 1.80 1.92 NEM 1.91 2.04 CP 24.2 23.11Prior to calving, cows received corn silage for ad libitum consump-tion and were offered 3 kg/cow daily (as-fed basis) of the prepartum concentrate. Based on actual calving dates, cows received prepartum diets for 33.7 ± 1.5 d.2After calving, cows received 35 kg/cow daily (as-fed basis) of corn silage and were offered the lactation concentrate for 46 d. Concentrate intake was adjusted weekly using the Spartan Dairy Ration Evaluator/Balancer (version 3.0; Michigan State University, East Lansing, MI), according to DIM, BW, BCS, and milk yield, with fat and protein concentrations set at 3.5 and 3.2%, respectively.3Containing 25% Ca, 4.7% S, 4.5% Mg, 3.3% Cl, 0.001% Se, 422,000 IU/kg of vitamin A, 21,200 IU/kg of vitamin D3, and 0.211% of vita-min E (Milk Ionic, M. Cassab Tecnologia Animal, São Paulo, Brazil).4Containing 22% Ca, 7.5% P, 6.5% Na, 1.0% K, 3.6% Mg, 2.0% S, 0.003% Co, 0.115% Cu, 0.004% I, 0.220% Mn, 0.003% Se, 0.400% Zn, 400,000 IU/kg of vitamin A, 100,000 IU/kg of vitamin D3, and 0.150% of vitamin E (Milk MAC, M. Cassab Tecnologia Animal).

5564 BRANDÃO ET AL.
Journal of Dairy Science Vol. 99 No. 7, 2016
through self-locking head gates immediately after both milkings. Lactation concentrate composition and nu-tritional profile are described in Table 1. Concentrate offer was adjusted weekly throughout the experimental period using the Spartan Dairy Ration Evaluator/Balancer (version 3.0; Michigan State University, East Lansing, MI), according to DIM, BW, BCS, and milk yield, with fat and protein concentrations set at 3.5 and 3.2%, respectively. Concentrate offered during the initial 3 d of lactation was adjusted as previously reported, but with milk yield of 20 kg/cow daily. All cows completely consumed their concentrate allocation within 30 min after feeding.
Prior to and through 46 d after calving, OMN was offered in the amount (56 g/cow daily; as-fed basis) recommended by the manufacturer (Phibro Animal Health) and used in previous research (Wang et al., 2009; Ryman et al., 2013), top-dressed daily into the morning concentrate feeding of each OMN-supplement-ed cow. Samples of the offered corn silage, prepartum, and lactation concentrates were collected every 2 wk, pooled into one sample, and analyzed for nutrient con-tent via wet chemistry procedures by a bromatology laboratory (3rlab, Belo Horizonte, Brazil). Calculations of ME, NEL, and NEM used the equation proposed by the NRC (2001). Concentration of DM was 38.4% in corn silage, 90.1% in prepartum concentrate, and 89.0% in lactation concentrate. Nutritional profile (DM basis) of corn silage was 53% NDF, 33% NFC, 2.24 Mcal/kg of ME, 1.39 Mcal/kg of NEL, 1.39 Mcal/kg of NEM, and 8.1% CP.
Sampling
Cows were monitored daily during the entire experi-mental period for incidence of health disorders such as retained placenta or mastitis, as well as incidence of morbidity or mortality by trained personnel (Lima et al., 2012). Throughout the experimental period, cows were weighed on a platform scale (Precision Balanças; Tupã, SP, Brazil), and BCS was assessed according to Wildman et al. (1982) by the same 2 evaluators that were blinded to distribution of cows across treatments.
Precalving. Cow BW and BCS were scheduled to be recorded once weekly (d −35, −28, −21, −14, and −7) relative to expected calving date (d 0). Blood samples were also scheduled to be collected every 5 d beginning on d −25 relative to expected calving date (d −25, −20, −15, −10, and −5), immediately before concen-trate feeding (0800 h). Based on actual calving dates, OMN-supplemented and CON cows were assigned to treatments and experimental procedures on d 35.3 ± 2.3 and 32.1 ± 2.2 d before calving, respectively. Hence, day of BW and BCS assessment or blood collection
relative to actual calving date was rounded into the nearest prescheduled sampling date.
Postcalving. Cows were evaluated for BW and BCS immediately after calving (d 0). Beginning the day after calving, BW and BCS were recorded weekly, whereas individual milk production was recorded daily until d 46 of lactation. Milk samples were collected daily from each cow during the morning milking of the day (50 mL), and analyzed for SCC via flow cytometry (AOAC, 1990) with a Somacount 300 instrument (Bentley In-struments Inc., Chaska, MN) and for TS content using infrared spectrometry (method 972.16; AOAC Interna-tional, 1999) by a commercial laboratory (Clínica do Leite, Universidade de São Paulo, Piracicaba, Brazil). Milk samples were also expected to be analyzed for fat and protein concentrations via infrared spectrometry (method 972.16; AOAC International, 1999); however, technical issues with samples and assays prevented yield of valid results. Blood samples were collected daily from d 0 to 7 of lactation, every other day from d 9 to 21 of lactation, and every 5 d from d 26 to 46 of lactation, immediately before morning concentrate feeding (0600 h). On d 30 and 46, cows were evaluated for endometritis via cytobrush technique (VWR Can-Lab, Mississauga, Ontario, Canada) according to the procedures reported by Dubuc et al. (2010). Slides for cytological examination were prepared by rolling the cytobrush on a clean glass microscope slide, immediate-ly stained with a panoptic stain (Insta-Prov; Newprov, Pinhais, PR, Brazil), and stored at room temperature until further analysis. Each slide was examined at 400× magnification to perform a differential cell count of 100 cells by a single observer as described by Dubuc et al. (2010). Results are reported as percentage of PMN cells within 100 total cell count (PMN + endometrial cells).
LPS Challenge
At the end of the experiment, 9 cows were randomly selected from each treatment group, and assigned to an LPS challenge. These cows (n = 18) continued to receive OMN or CON treatments during the LPS chal-lenge period, whereas nonselected cows (n = 20) were removed from the experiment. On d 46, OMN-supple-mented cows assigned to the LPS challenge had 578 ± 17 kg of BW, 3.00 ± 0.13 of BCS, 3.1 ± 0.7 parities, 33.5 ± 1.8 kg/d of milk yield, and 36.8 ± 1.8 kg/d of 12% TS-corrected milk. On d 46, CON cows assigned to the LPS challenge had 575 ± 19 kg of BW, 3.16 ± 0.19 of BCS, 3.2 ± 0.7 parities, 31.3 ± 1.3 kg/d of milk yield, and 35.5 ± 1.0 kg/d of 12% TS-corrected milk.
Selected cows received an intravenous bolus dose of bacterial LPS (0.25 μg/kg of BW, Escherichia coli O111:B4, Sigma-Aldrich Brasil Ltda., São Paulo, Bra-

Journal of Dairy Science Vol. 99 No. 7, 2016
IMMUNOMODULATORY FEED TO TRANSITION DAIRY COWS 5565
zil) on d 48.7 ± 1.6 of lactation. Bacterial LPS was dissolved into 10 mL of 0.9% saline immediately before challenge and administered via 10-mL sterile syringes according to cow BW (average full BW obtained on d 46 of lactation and immediately before LPS administra-tion). Cow vaginal temperature was recorded every 10 min from −2 to 120 h relative to LPS administration with a Hobo Water Temp Pro V2 data logger (Onset Company, Bourne, MA). Each data logger was at-tached to a controlled internal drug-releasing device (CIDR, Zoetis, São Paulo, SP, Brazil) that did not contain hormones and was inserted intravaginally in each cow. A Hobo Water Temp Pro V2 data logger (Onset Company) was also kept in the drylot pen, in the shade, were cows were maintained during the LPS challenge to record environmental temperature, relative humidity, and temperature-humidity index (THI; Wil-lard et al., 2003). Blood samples were collected hourly from −2 to 8 h, at 12-h intervals from 12 to 72 h, and at 24-h intervals form 96 to 120 h relative to LPS administration.
Blood Analysis
All blood samples were obtained from either the coc-cygeal vein or artery into commercial blood collection tubes (Vacutainer, 10 mL; Becton Dickinson, Franklin Lakes, NJ), placed immediately on ice, centrifuged at 3,000 × g at 4°C for 30 min for serum collection, and stored at −20°C on the same day of collection. Pre- and postcalving samples were analyzed for serum concentra-tions of glucose (colorimetric kit #G7521; Pointe Sci-entific Inc., Canton, MI), fatty acids (colorimetric kit HR Series NEFA – 2; Wako Pure Chemical Industries Ltd. USA, Richmond, VA), haptoglobin (colorimetric assay; Cooke and Arthington, 2013), IGF-I, cortisol, and insulin (chemiluminescent enzyme immunoassay, Immulite 1000; Siemens Medical Solutions Diagnostics, Los Angeles, CA). Samples collected during the LPS challenge were analyzed for haptoglobin (colorimetric assay; Cooke and Arthington, 2013) and tumor necrosis factor α (TNFα; bovine-specific commercial ELISA kit; RayBiotech Inc., Norcross, GA). The intra- and interassay coefficient of variation were, respectively, 4.1 and 5.8% for glucose, 2.6 and 0.9% for TNFα, 6.1 and 9.8% for fatty acids, 2.5 and 6.8% for haptoglobin, 4.6 and 5.9% for cortisol, and 3.6 and 4.6% for insulin. Se-rum IGF-I concentration was analyzed within a single assay, and the intra-assay coefficient of variation was 6.1%.
Statistical Analysis
Sample size was based on previous research from our group with a similar experimental design (Leiva et al.,
2015). Quantitative and binary data were analyzed, re-spectively, with the MIXED and GLIMMIX procedures of SAS (version 9.3; SAS Institute Inc., Cary, NC), us-ing cow as the experimental unit and cow (treatment) as random variable. Moreover, binary data (percentage of time that cows had vaginal temperature ≥39.1°C) were analyzed with a binomial distribution and logit link function. The model statement used for analysis of BW and BCS change, as well as initial, postcalving, and final BCS and BW during the experiment contained the effects of treatment. The model statement used for analysis of weekly BW and BCS contained the effects of treatment, week, and the resultant interaction. The model statement used for analysis of daily milk pro-duction, daily concentrate intake, vaginal temperature, cytobrush results, and serum variables contained the ef-fects of treatment, day (or hour for the LPS challenge), and the resultant interaction. Daily milk production was also analyzed according to percentage of PMN cells during the experiment, and this model contained the effects of treatment, PMN ranking (≥6 or <6% PMN cells), day, and the resultant interactions. In addition, previous 305-d mature-equivalent milk yield from each cow was included as covariate for all analysis of daily milk production and composition evaluated herein (Ya-sui et al., 2014b). The specified term for the repeated statements was week for BCS and BW, hour for LPS variables, and day for the remaining analysis, with cow (treatment) as subject. The covariance structure used for all repeated statements was compound symmetry, which provided the best fit for these analyses according to the Akaike information criterion. Significance was set at P ≤ 0.05, and tendencies were determined if P > 0.05 and ≤0.10. Results were separated using LSD, and are reported as least squares means according to treatment effects if no interactions were significant, or according to the highest-order interaction detected.
RESULTS AND DISCUSSION
No treatment × day or week interactions were de-tected (P ≥ 0.36) for BW, BCS, and serum variables during pre- and postcalving. Nevertheless, cows used in our experiment experienced the BW, BCS, and physi-ological changes associated with calving and beginning of lactation (Vazquez-Añon et al., 1994; Jorritsma et al., 2003) according to the day effects (P < 0.01) detected herein for BW, BCS, and serum concentra-tions of cortisol, haptoglobin, fatty acids, glucose, and IGF-I that were similar to the outcomes described by Leiva et al. (2015). In addition, no incidence of retained placenta, clinical mastitis, morbidity, or mortality was detected during the experiment.
5566 BRANDÃO ET AL.
Journal of Dairy Science Vol. 99 No. 7, 2016
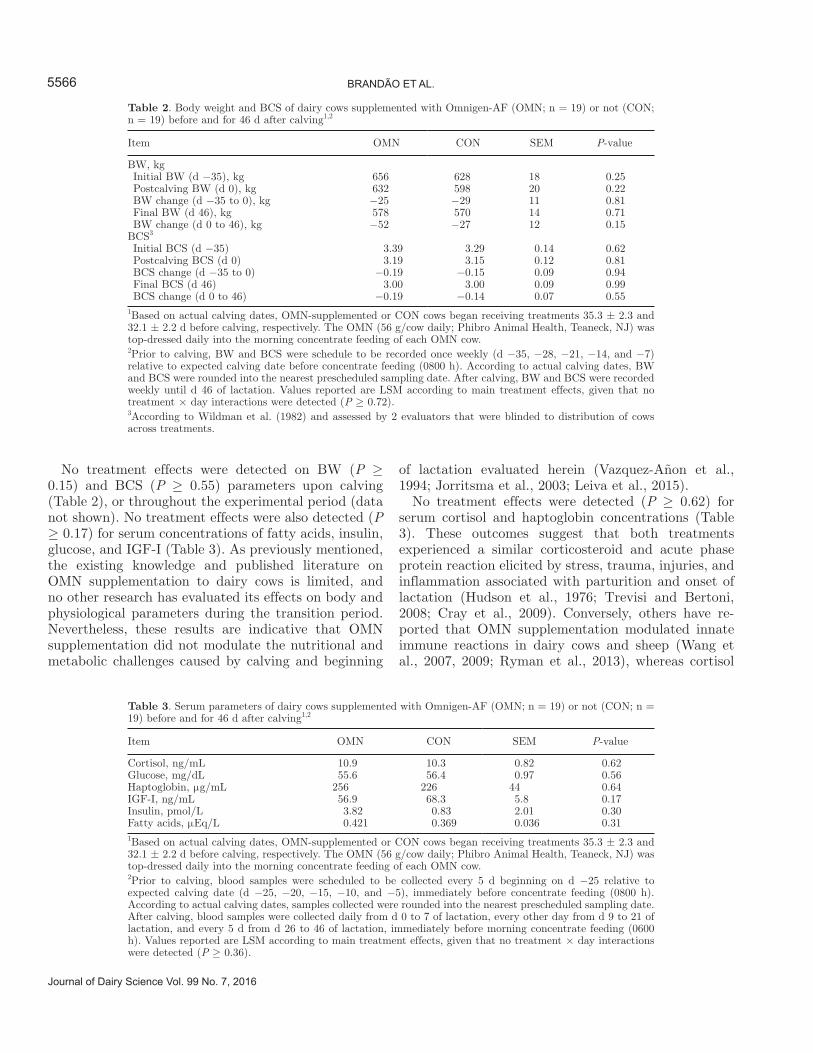
No treatment effects were detected on BW (P ≥ 0.15) and BCS (P ≥ 0.55) parameters upon calving (Table 2), or throughout the experimental period (data not shown). No treatment effects were also detected (P ≥ 0.17) for serum concentrations of fatty acids, insulin, glucose, and IGF-I (Table 3). As previously mentioned, the existing knowledge and published literature on OMN supplementation to dairy cows is limited, and no other research has evaluated its effects on body and physiological parameters during the transition period. Nevertheless, these results are indicative that OMN supplementation did not modulate the nutritional and metabolic challenges caused by calving and beginning
of lactation evaluated herein (Vazquez-Añon et al., 1994; Jorritsma et al., 2003; Leiva et al., 2015).
No treatment effects were detected (P ≥ 0.62) for serum cortisol and haptoglobin concentrations (Table 3). These outcomes suggest that both treatments experienced a similar corticosteroid and acute phase protein reaction elicited by stress, trauma, injuries, and inflammation associated with parturition and onset of lactation (Hudson et al., 1976; Trevisi and Bertoni, 2008; Cray et al., 2009). Conversely, others have re-ported that OMN supplementation modulated innate immune reactions in dairy cows and sheep (Wang et al., 2007, 2009; Ryman et al., 2013), whereas cortisol
Table 2. Body weight and BCS of dairy cows supplemented with Omnigen-AF (OMN; n = 19) or not (CON; n = 19) before and for 46 d after calving1,2
Item OMN CON SEM P-value
BW, kg Initial BW (d −35), kg 656 628 18 0.25 Postcalving BW (d 0), kg 632 598 20 0.22 BW change (d −35 to 0), kg −25 −29 11 0.81 Final BW (d 46), kg 578 570 14 0.71 BW change (d 0 to 46), kg −52 −27 12 0.15BCS3 Initial BCS (d −35) 3.39 3.29 0.14 0.62 Postcalving BCS (d 0) 3.19 3.15 0.12 0.81 BCS change (d −35 to 0) −0.19 −0.15 0.09 0.94 Final BCS (d 46) 3.00 3.00 0.09 0.99 BCS change (d 0 to 46) −0.19 −0.14 0.07 0.551Based on actual calving dates, OMN-supplemented or CON cows began receiving treatments 35.3 ± 2.3 and 32.1 ± 2.2 d before calving, respectively. The OMN (56 g/cow daily; Phibro Animal Health, Teaneck, NJ) was top-dressed daily into the morning concentrate feeding of each OMN cow.2Prior to calving, BW and BCS were schedule to be recorded once weekly (d −35, −28, −21, −14, and −7) relative to expected calving date before concentrate feeding (0800 h). According to actual calving dates, BW and BCS were rounded into the nearest prescheduled sampling date. After calving, BW and BCS were recorded weekly until d 46 of lactation. Values reported are LSM according to main treatment effects, given that no treatment × day interactions were detected (P ≥ 0.72).3According to Wildman et al. (1982) and assessed by 2 evaluators that were blinded to distribution of cows across treatments.
Table 3. Serum parameters of dairy cows supplemented with Omnigen-AF (OMN; n = 19) or not (CON; n = 19) before and for 46 d after calving1,2
Item OMN CON SEM P-value
Cortisol, ng/mL 10.9 10.3 0.82 0.62Glucose, mg/dL 55.6 56.4 0.97 0.56Haptoglobin, μg/mL 256 226 44 0.64IGF-I, ng/mL 56.9 68.3 5.8 0.17Insulin, pmol/L 3.82 0.83 2.01 0.30Fatty acids, μEq/L 0.421 0.369 0.036 0.311Based on actual calving dates, OMN-supplemented or CON cows began receiving treatments 35.3 ± 2.3 and 32.1 ± 2.2 d before calving, respectively. The OMN (56 g/cow daily; Phibro Animal Health, Teaneck, NJ) was top-dressed daily into the morning concentrate feeding of each OMN cow.2Prior to calving, blood samples were scheduled to be collected every 5 d beginning on d −25 relative to expected calving date (d −25, −20, −15, −10, and −5), immediately before concentrate feeding (0800 h). According to actual calving dates, samples collected were rounded into the nearest prescheduled sampling date. After calving, blood samples were collected daily from d 0 to 7 of lactation, every other day from d 9 to 21 of lactation, and every 5 d from d 26 to 46 of lactation, immediately before morning concentrate feeding (0600 h). Values reported are LSM according to main treatment effects, given that no treatment × day interactions were detected (P ≥ 0.36).

Journal of Dairy Science Vol. 99 No. 7, 2016
IMMUNOMODULATORY FEED TO TRANSITION DAIRY COWS 5567
and haptoglobin are major components of the innate immune system (Carroll and Forsberg, 2007). However, these research efforts focused on leukocyte-specific vari-ables, including mRNA expression of proinflammatory cytokines and L-selectin (Wang et al., 2007, 2009), as well as oxidative stress and phagocytic activity upon a pathogenic challenge (Ryman et al., 2013). Although the present experiment did not evaluate leukocyte mRNA and activity variables, the lack of treatment effects on cortisol and haptoglobin reported herein sug-gest that the potential cell-based immune benefits of OMN supplementation (Wang et al., 2007, 2009; Ry-man et al., 2013) did not modulate the neuroendocrine stress and acute phase protein reactions triggered by calving and beginning of lactation.
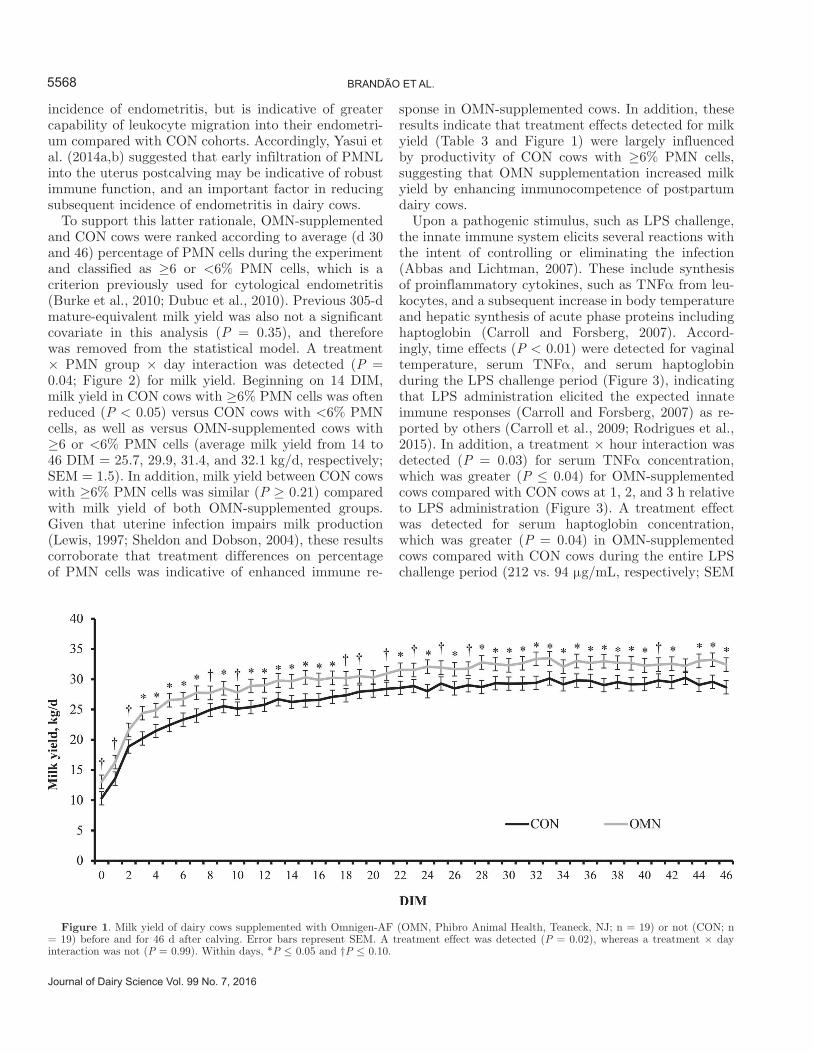
Previous 305-d mature-equivalent milk yield was not a significant covariate for daily milk yield (P = 0.37) and constituents (P ≥ 0.51) in the present experiment; therefore, this variable was removed from the statistical models. Cows supplemented with OMN had greater (P = 0.02) milk yield compared with CON cows (Table 4). No differences were detected (P ≥ 0.12) for milk TS con-centration and SCC, whereas OMN-supplemented cows tended (P = 0.07) to have greater 12% TS-corrected milk compared with CON cohorts (Table 4). To our knowledge, no other published research evaluated milk yield in dairy cows supplemented or not with OMN during the transition period. The lack of a treatment × day interaction (P = 0.99) for milk yield indicates that OMN-supplemented cows produced more milk as soon as lactation started and such difference persisted until 46 DIM (Figure 1), suggesting that the produc-tive benefits of OMN supplementation are associated with its pre- and postpartum supplementation. It is important to note that milk production is directly af-fected by feed intake (NRC, 2001), which was not fully assessed in the present experiment. Corn silage intake
was not evaluated but was provided at the same lim-ited daily rate to OMN-supplemented and CON cows during lactation. Concentrate was provided equally to OMN-supplemented and CON cows before calving, and postpartum concentrate DMI was similar (P = 0.37) among treatments (7.6 vs. 8.0 kg/d on as-fed basis for CON and OMN-supplemented cows, respectively; SEM = 0.35). Moreover, serum concentrations of glucose, fatty acids, insulin, and IGF-I are typical markers of nutrient intake in dairy cattle (Butler, 2003) and did not differ (P ≥ 0.17) between OMN-supplemented and CON cows (Table 3). Hence, results from this experi-ment indicate that the effects of OMN supplementation on milk yield of transition dairy cows appear to be independent of the metabolic parameters evaluated herein.
Cows receiving OMN had greater (P = 0.04) per-centage of PMN cells in endometrium cell population compared with CON cows (12.2 vs. 3.9%, respectively; SEM = 2.9). Others have used the cytobrush technique and subsequent PMN cell count as indicators of en-dometritis in dairy cattle (Dubuc et al., 2010; Madoz et al., 2014) and positively associated PMN cell count with plasma haptoglobin concentrations and decreased milk yield (Burke et al., 2010). In the present experi-ment, however, OMN-supplemented cows had greater milk production and similar serum haptoglobin con-centrations compared with CON cows, despite treat-ment differences in PMN cells. One of the cell-based immune benefits attributed to OMN is to increase L-selectin mRNA expression in leukocytes (Wang et al., 2007; Ryman et al., 2013), an adhesion molecule that allows leukocytes to migrate from capillaries into infected tissues to phagocytize and kill bacteria (Ab-bas and Lichtman, 2007). Therefore, one can speculate that the greater percentage of PMN cells detected in OMN-supplemented cows does not represent increased
Table 4. Milk production parameters of dairy cows supplemented with Omnigen-AF (OMN; n = 19) or not (CON; n = 19) before and for 46 d after calving1,2
Item OMN Control SEM P-value
Milk yield, kg/d 30.3 27.1 0.9 0.02Milk TS, % 14.4 15.0 0.3 0.1212% TS-corrected milk, kg/d 36.1 33.3 1.2 0.07SCC, cells/mL 326 450 114 0.451Based on actual calving dates, OMN-supplemented or CON cows began receiving treatments 35.3 ± 2.3 and 32.1 ± 2.2 d before calving, respectively. The OMN (56 g/cow daily; Phibro Animal Health, Teaneck, NJ) was top-dressed daily into the morning concentrate feeding of each OMN cow.2Individual milk production was recorded daily until d 46 of lactation. Milk samples were collected daily from each cow during both milkings of the day and combined into one daily sample (50 mL from each milking), which was analyzed for SCC via flow cytometry (AOAC, 1990) with a Somacount 300 instrument (Bentley Instruments Inc., Chaska, MN) and for TS content using infrared spectrometry (method 972.16; AOAC International, 1999) by a commercial laboratory (Clínica do Leite, Universidade de São Paulo, Piracicaba, Brazil). Values reported are LSM according to main treatment effects, given that no treatment × day interac-tions were detected (P ≥ 0.64).
5568 BRANDÃO ET AL.
Journal of Dairy Science Vol. 99 No. 7, 2016
incidence of endometritis, but is indicative of greater capability of leukocyte migration into their endometri-um compared with CON cohorts. Accordingly, Yasui et al. (2014a,b) suggested that early infiltration of PMNL into the uterus postcalving may be indicative of robust immune function, and an important factor in reducing subsequent incidence of endometritis in dairy cows.
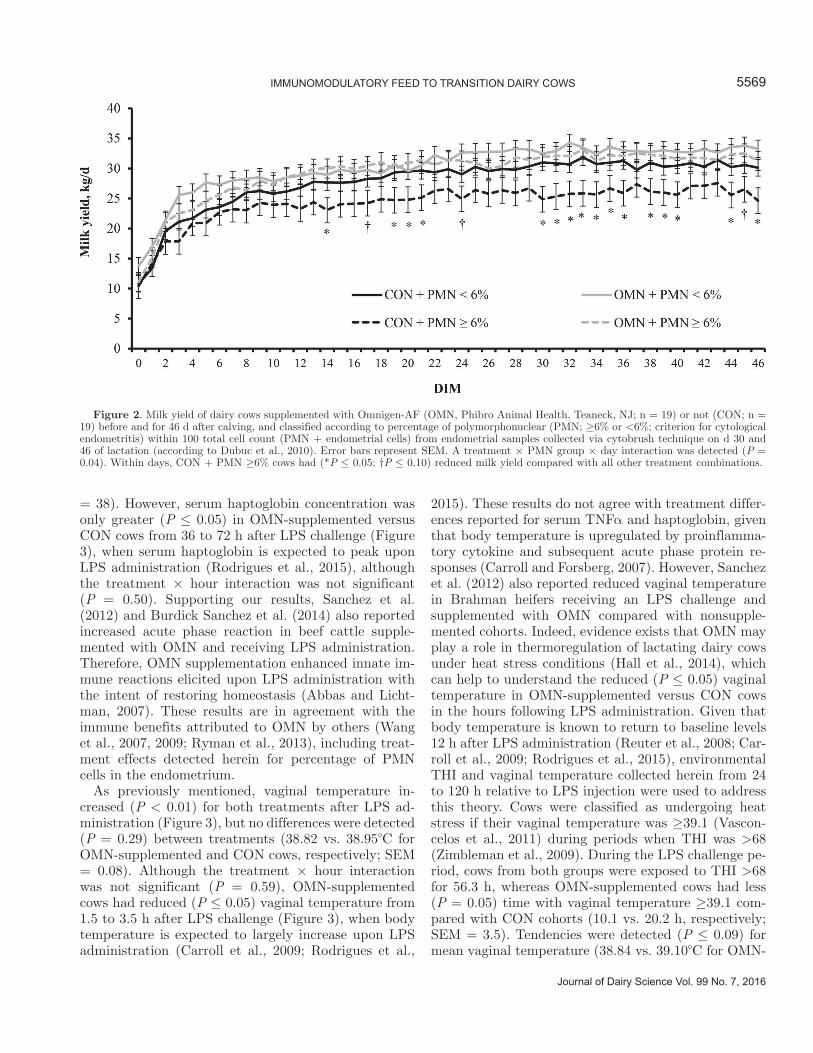
To support this latter rationale, OMN-supplemented and CON cows were ranked according to average (d 30 and 46) percentage of PMN cells during the experiment and classified as ≥6 or <6% PMN cells, which is a criterion previously used for cytological endometritis (Burke et al., 2010; Dubuc et al., 2010). Previous 305-d mature-equivalent milk yield was also not a significant covariate in this analysis (P = 0.35), and therefore was removed from the statistical model. A treatment × PMN group × day interaction was detected (P = 0.04; Figure 2) for milk yield. Beginning on 14 DIM, milk yield in CON cows with ≥6% PMN cells was often reduced (P < 0.05) versus CON cows with <6% PMN cells, as well as versus OMN-supplemented cows with ≥6 or <6% PMN cells (average milk yield from 14 to 46 DIM = 25.7, 29.9, 31.4, and 32.1 kg/d, respectively; SEM = 1.5). In addition, milk yield between CON cows with ≥6% PMN cells was similar (P ≥ 0.21) compared with milk yield of both OMN-supplemented groups. Given that uterine infection impairs milk production (Lewis, 1997; Sheldon and Dobson, 2004), these results corroborate that treatment differences on percentage of PMN cells was indicative of enhanced immune re-
sponse in OMN-supplemented cows. In addition, these results indicate that treatment effects detected for milk yield (Table 3 and Figure 1) were largely influenced by productivity of CON cows with ≥6% PMN cells, suggesting that OMN supplementation increased milk yield by enhancing immunocompetence of postpartum dairy cows.
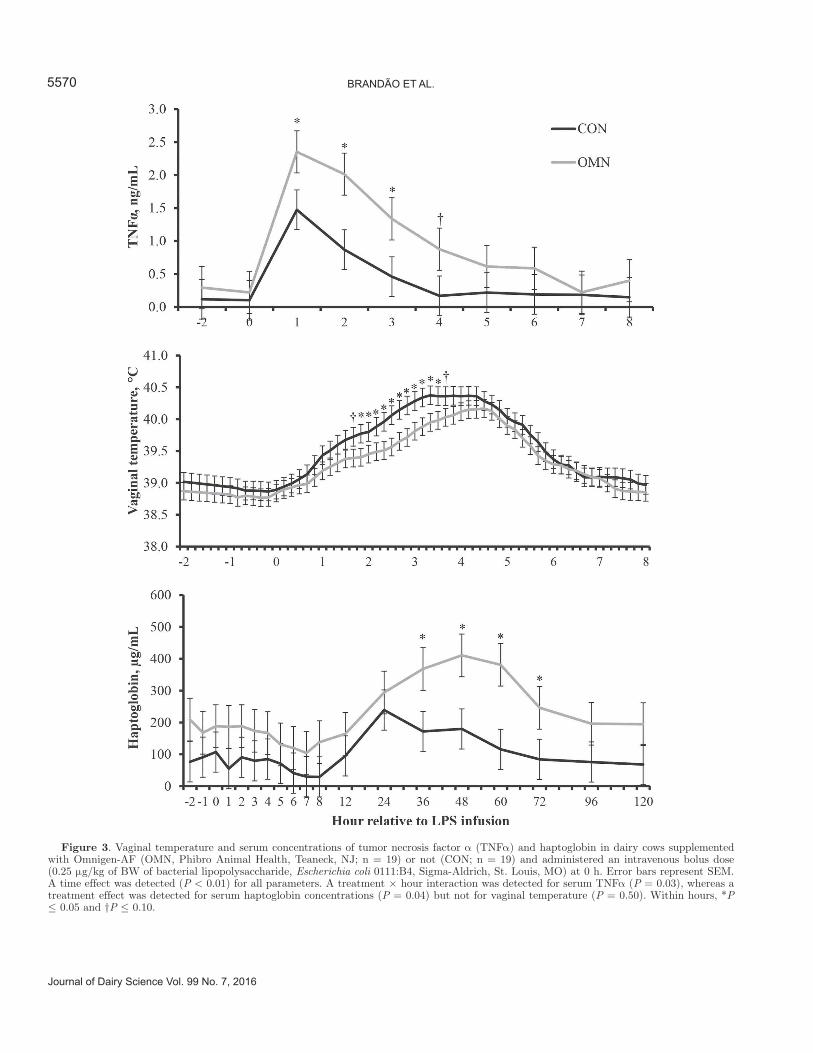
Upon a pathogenic stimulus, such as LPS challenge, the innate immune system elicits several reactions with the intent of controlling or eliminating the infection (Abbas and Lichtman, 2007). These include synthesis of proinflammatory cytokines, such as TNFα from leu-kocytes, and a subsequent increase in body temperature and hepatic synthesis of acute phase proteins including haptoglobin (Carroll and Forsberg, 2007). Accord-ingly, time effects (P < 0.01) were detected for vaginal temperature, serum TNFα, and serum haptoglobin during the LPS challenge period (Figure 3), indicating that LPS administration elicited the expected innate immune responses (Carroll and Forsberg, 2007) as re-ported by others (Carroll et al., 2009; Rodrigues et al., 2015). In addition, a treatment × hour interaction was detected (P = 0.03) for serum TNFα concentration, which was greater (P ≤ 0.04) for OMN-supplemented cows compared with CON cows at 1, 2, and 3 h relative to LPS administration (Figure 3). A treatment effect was detected for serum haptoglobin concentration, which was greater (P = 0.04) in OMN-supplemented cows compared with CON cows during the entire LPS challenge period (212 vs. 94 μg/mL, respectively; SEM
Figure 1. Milk yield of dairy cows supplemented with Omnigen-AF (OMN, Phibro Animal Health, Teaneck, NJ; n = 19) or not (CON; n = 19) before and for 46 d after calving. Error bars represent SEM. A treatment effect was detected (P = 0.02), whereas a treatment × day interaction was not (P = 0.99). Within days, *P ≤ 0.05 and †P ≤ 0.10.
Journal of Dairy Science Vol. 99 No. 7, 2016
IMMUNOMODULATORY FEED TO TRANSITION DAIRY COWS 5569
= 38). However, serum haptoglobin concentration was only greater (P ≤ 0.05) in OMN-supplemented versus CON cows from 36 to 72 h after LPS challenge (Figure 3), when serum haptoglobin is expected to peak upon LPS administration (Rodrigues et al., 2015), although the treatment × hour interaction was not significant (P = 0.50). Supporting our results, Sanchez et al. (2012) and Burdick Sanchez et al. (2014) also reported increased acute phase reaction in beef cattle supple-mented with OMN and receiving LPS administration. Therefore, OMN supplementation enhanced innate im-mune reactions elicited upon LPS administration with the intent of restoring homeostasis (Abbas and Licht-man, 2007). These results are in agreement with the immune benefits attributed to OMN by others (Wang et al., 2007, 2009; Ryman et al., 2013), including treat-ment effects detected herein for percentage of PMN cells in the endometrium.
As previously mentioned, vaginal temperature in-creased (P < 0.01) for both treatments after LPS ad-ministration (Figure 3), but no differences were detected (P = 0.29) between treatments (38.82 vs. 38.95°C for OMN-supplemented and CON cows, respectively; SEM = 0.08). Although the treatment × hour interaction was not significant (P = 0.59), OMN-supplemented cows had reduced (P ≤ 0.05) vaginal temperature from 1.5 to 3.5 h after LPS challenge (Figure 3), when body temperature is expected to largely increase upon LPS administration (Carroll et al., 2009; Rodrigues et al.,
2015). These results do not agree with treatment differ-ences reported for serum TNFα and haptoglobin, given that body temperature is upregulated by proinflamma-tory cytokine and subsequent acute phase protein re-sponses (Carroll and Forsberg, 2007). However, Sanchez et al. (2012) also reported reduced vaginal temperature in Brahman heifers receiving an LPS challenge and supplemented with OMN compared with nonsupple-mented cohorts. Indeed, evidence exists that OMN may play a role in thermoregulation of lactating dairy cows under heat stress conditions (Hall et al., 2014), which can help to understand the reduced (P ≤ 0.05) vaginal temperature in OMN-supplemented versus CON cows in the hours following LPS administration. Given that body temperature is known to return to baseline levels 12 h after LPS administration (Reuter et al., 2008; Car-roll et al., 2009; Rodrigues et al., 2015), environmental THI and vaginal temperature collected herein from 24 to 120 h relative to LPS injection were used to address this theory. Cows were classified as undergoing heat stress if their vaginal temperature was ≥39.1 (Vascon-celos et al., 2011) during periods when THI was >68 (Zimbleman et al., 2009). During the LPS challenge pe-riod, cows from both groups were exposed to THI >68 for 56.3 h, whereas OMN-supplemented cows had less (P = 0.05) time with vaginal temperature ≥39.1 com-pared with CON cohorts (10.1 vs. 20.2 h, respectively; SEM = 3.5). Tendencies were detected (P ≤ 0.09) for mean vaginal temperature (38.84 vs. 39.10°C for OMN-
Figure 2. Milk yield of dairy cows supplemented with Omnigen-AF (OMN, Phibro Animal Health, Teaneck, NJ; n = 19) or not (CON; n = 19) before and for 46 d after calving, and classified according to percentage of polymorphonuclear (PMN; ≥6% or <6%; criterion for cytological endometritis) within 100 total cell count (PMN + endometrial cells) from endometrial samples collected via cytobrush technique on d 30 and 46 of lactation (according to Dubuc et al., 2010). Error bars represent SEM. A treatment × PMN group × day interaction was detected (P = 0.04). Within days, CON + PMN ≥6% cows had (*P ≤ 0.05; †P ≤ 0.10) reduced milk yield compared with all other treatment combinations.
5570 BRANDÃO ET AL.
Journal of Dairy Science Vol. 99 No. 7, 2016
Figure 3. Vaginal temperature and serum concentrations of tumor necrosis factor α (TNFα) and haptoglobin in dairy cows supplemented with Omnigen-AF (OMN, Phibro Animal Health, Teaneck, NJ; n = 19) or not (CON; n = 19) and administered an intravenous bolus dose (0.25 μg/kg of BW of bacterial lipopolysaccharide, Escherichia coli 0111:B4, Sigma-Aldrich, St. Louis, MO) at 0 h. Error bars represent SEM. A time effect was detected (P < 0.01) for all parameters. A treatment × hour interaction was detected for serum TNFα (P = 0.03), whereas a treatment effect was detected for serum haptoglobin concentrations (P = 0.04) but not for vaginal temperature (P = 0.50). Within hours, *P ≤ 0.05 and †P ≤ 0.10.
Journal of Dairy Science Vol. 99 No. 7, 2016
IMMUNOMODULATORY FEED TO TRANSITION DAIRY COWS 5571
supplemented and CON cows, respectively; SEM = 0.11) and percentage of time with vaginal temperature was ≥39.1 (18.3 vs. 36.7% for OMN-supplemented and CON cows, respectively; SEM = 8.0) when THI was >68. Collectively, these results imply that OMN sup-plementation affected thermoregulation of dairy cows under heat stress, which may help explain treatment differences in vaginal temperature within 4 h after LPS. Nevertheless, our experiment was not designed to properly evaluate these variables, and further research is warranted to elucidate potential thermoregulatory capabilities of OMN.
In conclusion, supplementing OMN to transition dairy cows did not affect metabolic and acute phase protein responses triggered by calving and beginning of lactation, but increased milk yield, percentage of PMN cells in the endometrium, as well as TNFα and haptoglobin response upon LPS administration. More-over, evidence exists that OMN supplementation af-fected thermoregulation of dairy cows under heat stress conditions, although research is still warranted to fully validate this theory. Additional research is also needed to evaluate the effects of supplemental OMN on health, reproductive, and productive responses of dairy cows in different management scenarios, including Holstein cows within TMR-based feeding systems. Nevertheless, our experiment indicated that the OMN supplementa-tion enhanced immunocompetence of transition dairy cows, resulting in increased performance. Hence, OMN supplementation during the transition period appears to be an effective approach to improve cow welfare and productivity in dairy production systems.
ACKNOWLEDGMENTS
The Fundação de Amparo à Pesquisa do Estado de São Paulo (São Paulo, Brazil) provided financial sup-port for A. P. Brandão (grant # 2015/05536-1) and T. Leiva (grant # 2014/14512-6).
REFERENCES
Abbas, A. K., and A. H. Lichtman. 2007. Cellular and Molecular Im-munology. 6th ed. Saunders Co., Philadelphia, PA.
AOAC. 1990. Official Method of Analysis. 15th ed. AOAC, Arlington, VA.
AOAC International. 1999. Official Method of Analysis. 16th ed. AOAC Int., Arlington, VA.
Burdick Sanchez, N. C., J. O. Buntyn, J. A. Carroll, T. Wistuba, K. DeHann, S. E. Sieren, S. J. Jones, and T. B. Schmidt. 2014. Enhancement of the acute phase response to lipopolysaccharide in feedlot steers supplemented with OmniGen-AF. J. Anim. Sci. 92(E-Suppl. 2):37–38.
Burke, C. R., S. Meier, S. McDougall, C. Compton, M. Mitchell, and J. R. Roche. 2010. Relationships between endometritis and meta-bolic state during the transition period in pasture-grazed dairy cows. J. Dairy Sci. 93:5363–5373.
Butler, W. R. 2003. Energy balance relationships with follicular devel-opment, ovulation and fertility in postpartum dairy cows. Livest. Prod. Sci. 83:211–218.
Carroll, J. A., and N. E. Forsberg. 2007. Influence of stress and nutri-tion on cattle immunity. Vet. Clin. Food. Anim. 23:105–149.
Carroll, J. A., R. R. Reuter, C. C. Chase Jr., S. W. Coleman, D. G. Riley, D. E. Spiers, J. D. Arthington, and M. L. Galyean. 2009. Profile of the bovine acute-phase response following an intravenous lipopolysaccharide challenge. Innate Immun. 15:81–89.
Cooke, R. F., and J. D. Arthington. 2013. Concentrations of hapto-globin in bovine plasma determined by ELISA or a colorimetric method based on peroxidase activity. J. Anim. Physiol. Anim. Nutr. (Berl.) 97:531–536.
Cray, C., J. Zaias, and N. H. Altman. 2009. Acute phase response in animals: A review. Comp. Med. 59:517–526.
Drackley, J. K. 1999. Biology of dairy cows during the transition pe-riod: The final frontier? J. Dairy Sci. 82:2259–2273.
Dubuc, J., T. F. Duffield, K. E. Leslie, J. S. Walton, and S. J. LeBlanc. 2010. Risk factors for postpartum uterine diseases in dairy cows. J. Dairy Sci. 93:5764–5771.
Goff, J. P., and R. L. Horst. 1997. Physiological changes at parturi-tion and their relationship to metabolic disorders. J. Dairy Sci. 80:1260–1268.
Grummer, R. R. 1995. Impact of changes in organic nutrient metabo-lism on feeding the transition dairy cow. J. Anim. Sci. 73:2820–2833.
Hall, L. W., F. A. Rivera, F. Villar, J. D. Chapman, N. M. Long, and R. J. Collier. 2014. Evaluation of OmniGen-AF in lactating heat-stressed Holstein cows. Page 16 in 25th Annual Florida Ruminant Nutrition Symposium. Accessed Oct. 15, 2015. http://dairy.ifas.ufl.edu/rns/2014/2014_proceedings.pdf#page=30.
Hudson, S., M. Mullford, W. G. Whittlestone, and E. Payne. 1976. Bo-vine plasma corticoids during parturition. J. Dairy Sci. 59:744–746.
Jorritsma, R., T. Wensing, T. A. M. Kruip, P. L. A. M. Vos, and J. P. T. M. Noordhuizen. 2003. Metabolic changes in early lactation and impaired reproductive performance in dairy cows. Vet. Res. 34:11–26.
Leiva, T., R. F. Cooke, A. P. Brandao, R. S. Marques, and J. L. M. Vasconcelos. 2015. Effects of rumen-protected choline supplemen-tation on metabolic and performance responses of transition dairy cows. J. Anim. Sci. 93:1896–1904.
Lewis, G. S. 1997. Uterine health and disorders. J. Dairy Sci. 80:984–994.
Lima, F. S., M. F. Sá Filho, L. F. Greco, and J. E. P. Santos. 2012. Effects of feeding rumen-protected choline on incidence of diseases and reproduction of dairy cows. Vet. J. 193:140–145.
Madoz, L. V., M. J. Giuliodori, A. L. Migliorisi, M. Jaureguiberry, and R. L. de la Sota. 2014. Endometrial cytology, biopsy, and bacteriol-ogy for the diagnosis of subclinical endometritis in grazing dairy cows. J. Dairy Sci. 97:195–201.
Mallard, B. A., J. C. Dekkers, M. J. Ireland, K. E. Leslie, S. Sharif, C. Lacey Vankampen, L. Wagter, and B. N. Wilkie. 1998. Alteration in immune responsiveness during the peripartum period and its ramification on dairy cow and calf health. J. Dairy Sci. 81:585–595.
NRC. 2001. Nutrient Requirements of Dairy Cattle. 7th rev. ed. Natl. Acad. Sci., Washington, DC.
Overton, T. R., and M. R. Waldron. 2004. Nutritional management of transition dairy cows: Strategies to optimize metabolic health. J. Dairy Sci. 87(Suppl. 13):E105–E119.
Reuter, R. R., J. A. Carroll, J. W. Dailey, B. J. Cook, and M. L. Galy-ean. 2008. Effects of dietary energy source and level and injection of tilmicosin phosphate on immune function in lipopolysaccharide-challenged beef steers. J. Anim. Sci. 86:1963–1976.
Rodrigues, M. C., R. F. Cooke, R. S. Marques, S. A. Arispe, D. H. Keisler, and D. W. Bohnert. 2015. Effects of oral meloxicam ad-ministration to beef cattle receiving lipopolysaccharide adminis-tration or vaccination against respiratory pathogens. J. Anim. Sci. 93:5018–5027.
Ryman, V. E., S. C. Nickerson, F. M. Kautz, D. J. Hurley, L. O. Ely, Y. Q. Wang, and N. E. Forsberg. 2013. Effect of dietary supple-
5572 BRANDÃO ET AL.
Journal of Dairy Science Vol. 99 No. 7, 2016
mentation on the antimicrobial activity of blood leukocytes iso-lated from Holstein heifers. Res. Vet. Sci. 95:969–974.
Sanchez, N. C., J. A. Carroll, J. D. Chapman, T. H. Welsh, R. C. Vann, and R. D. Randel. 2012. OmniGen-AF supplementation modulates the physiological and acute phase response of Brahman heifers to an endocrine challenge. J. Anim. Sci. 90(Suppl. 3):221.
Sheldon, I. M., and H. Dobson. 2004. Postpartum uterine health in cattle. Anim. Reprod. Sci. 82–83:295–306.
Sheldon, I. M., D. E. Noakes, A. Rycroft, and H. Dobson. 2001. Acute phase protein responses to uterine bacterial contamination in cat-tle after calving. Vet. Rec. 148:172–175.
Trevisi, E., and G. Bertoni. 2008. Aspirin and Health Research Prog-ress. Nova Science Publishers, Hauppauge, NY.
Vasconcelos, J. L. M., R. F. Cooke, D. T. G. Jardina, F. L. Aragon, M. B. Veras, S. Soriano, N. Sobreira, and A. B. Scarpa. 2011. Associa-tions among milk production and rectal temperature on pregnancy maintenance in lactating recipient dairy cows. Anim. Reprod. Sci. 127:140–147.
Vazquez-Añon, M., S. Bertics, M. Luck, R. R. Grummer, and J. Pin-heiro. 1994. Peripartum liver triglyceride and plasma metabolites in dairy cows. J. Dairy Sci. 77:1521–1528.
Wang, Y., S. B. Puntenney, J. L. Burton, J. L. Forsberg, and N. E. Forsberg. 2007. Ability of a commercial feed additive to modulate expression of innate immunity in sheep immunosuppressed with dexamethasone. Animal 1:945–951.
Wang, Y. Q., S. B. Puntenney, J. L. Burton, and N. E. Forsberg. 2009. Use of gene profiling to evaluate the effects of a feed additive on immune function in periparturient dairy cattle. J. Anim. Physiol. Anim. Nutr. (Berl.) 93:66–75.
Wildman, E. E., G. M. Jones, P. E. Wagner, R. L. Boman, H. F. Troutt, and T. N. Lesch. 1982. A dairy cow body condition scoring system and its relationship to selected production characteristics. J. Dairy Sci. 65:495–501.
Willard, S., S. Gandy, S. Bowers, K. Graves, A. Elias, and C. Whis-nant. 2003. The effects of GnRH administration post-insemination on serum concentrations of progesterone and pregnancy rates in dairy cattle exposed to mild summer heat stress. Theriogenology 59:1799–1810.
Yasui, T., J. A. A. McArt, C. M. Ryan, R. O. Gilbert, D. V. Nydam, F. Valdez, K. E. Griswold, and T. R. Overton. 2014b. Effects of chromium propionate supplementation during the periparturient period and early lactation on metabolism, performance, and cy-tological endometritis in dairy cows. J. Dairy Sci. 97:6400–6410.
Yasui, T., K. McCann, R. O. Gilbert, D. V. Nydam, and T. R. Over-ton. 2014a. Associations of cytological endometritis with energy metabolism and inflammation during the periparturient period and early lactation in dairy cows. J. Dairy Sci. 97:2763–2770.
Zimbleman, R. B., R. P. Rhoads, L. H. Baumgard, and R. J. Collier. 2009. Revised temperature humidity index (THI) for high produc-ing dairy cows. J. Dairy Sci. 92(E-Suppl. 1):347. (Abstr.)