Interspace/Under-canopy Foraging Patterns of Beef...
78
Interspace/Under-canopy Foraging Patterns of Beef Cattle in Sagebrush Communities: Implications to Sage-grouse Nesting Habitat by Kevin A. France A THESIS submitted to Oregon State University In partial fulfillment of the requirements for the degree of Master of Science Presented September 9, 2005 Commencement June 2006
Transcript of Interspace/Under-canopy Foraging Patterns of Beef...
Interspace/Under-canopy Foraging Patterns of Beef Cattle in Sagebrush Communities: Implications to Sage-grouse Nesting Habitat
by Kevin A. France
A THESIS
submitted to
Oregon State University
In partial fulfillment of the requirements for the
degree of
Master of Science
Presented September 9, 2005 Commencement June 2006

AN ABSTRACT OF THE THESIS OF
Kevin A. France for the degree of Master of Science in Rangeland Resources presented on September 9, 2005. Title: Interspace/Under-canopy Foraging Patterns of Beef Cattle in Sagebrush Communities: Implications to Sage-grouse Nesting Habitat. Abstract approved:
Chad S. Boyd David C. Ganskopp
Livestock grazing has been indirectly related to sage-grouse (Centrocercus
urophasianus) declines in the western United States and southern Canada; however,
there is a lack of scientific research that directly relates the two. Our objective was
to investigate the influence of livestock herbivory on sage-grouse nesting habitat by
determining the spatial aspects of cattle forage selection patterns and possible
changes in screening cover as forage utilization increases. An eighteen-day,
replicated, small pasture trial was conducted in the summers of 2003 and 2004. This
trial (trial 1) was developed to initially examine a null hypothesis that cattle foraged
on interspace and under sagebrush canopy grasses with equivalent frequencies. If
that hypothesis was deemed invalid, we hoped to determine the level of forage
utilization at which cattle began to differentially access grasses adjacent to and
under sagebrush canopies (Artemisia L. spp.). Understory grasses provide important
cover for nesting sage-grouse. Four pastures (6.1 to 6.5 ha) were fenced in a

Wyoming big sagebrush (Artemisia tridentata ssp. wyomingensis) community and
each stocked with 3 to 4 yearling heifers (mean 385 kg). Within each pasture we
randomly selected 30 sagebrush plants, marked a perennial grass tussock under the
canopy of each sagebrush, and a second grass tussock of the same species in the
adjoining interspace. Grass plants were checked every second day after turnout and
given a grazed or un-grazed score. Shrub measurements (height, area, volume, and
angle of accessibility of the under-canopy plants) were taken for each sagebrush to
evaluate the influence of shrub morphology on grazing occurrence of under-canopy
grasses. Visual obstruction for potential nest sites was evaluated using a modified
Robel pole viewed from 2m to document changes in obstruction with increasing
herbaceous utilization. Changes in standing crop and utilization (by weight) were
assessed weekly by clipping 20 random 1-m² plots in each pasture. Grazing of
under-canopy plants was negligible at light to moderate levels of utilization (e.g. <
10% of under-canopy plants were grazed when 30% of the standing crop was
utilized). At utilization levels >35%, under-canopy plants were used with increasing
frequency (P<0.0001). Logistic regression indicated angle of accessibility (P
<0.0001) was the only shrub morphology variable influencing grazing occurrence of
under-canopy grasses. As angles increased grazing susceptibility increased. Visual
obstruction decreased over time, but consistently across all strata. We erroneously
anticipated a strata X utilization interaction as the herbaceous level was grazed and
trampled by the cows (p = 0.9995). Possible explanations include 1.) ephemeral leaf
fall from sagebrush and the grazing effects on the removal of the herbaceous
component coincided, 2.) the physical and foraging activities of cattle affected all
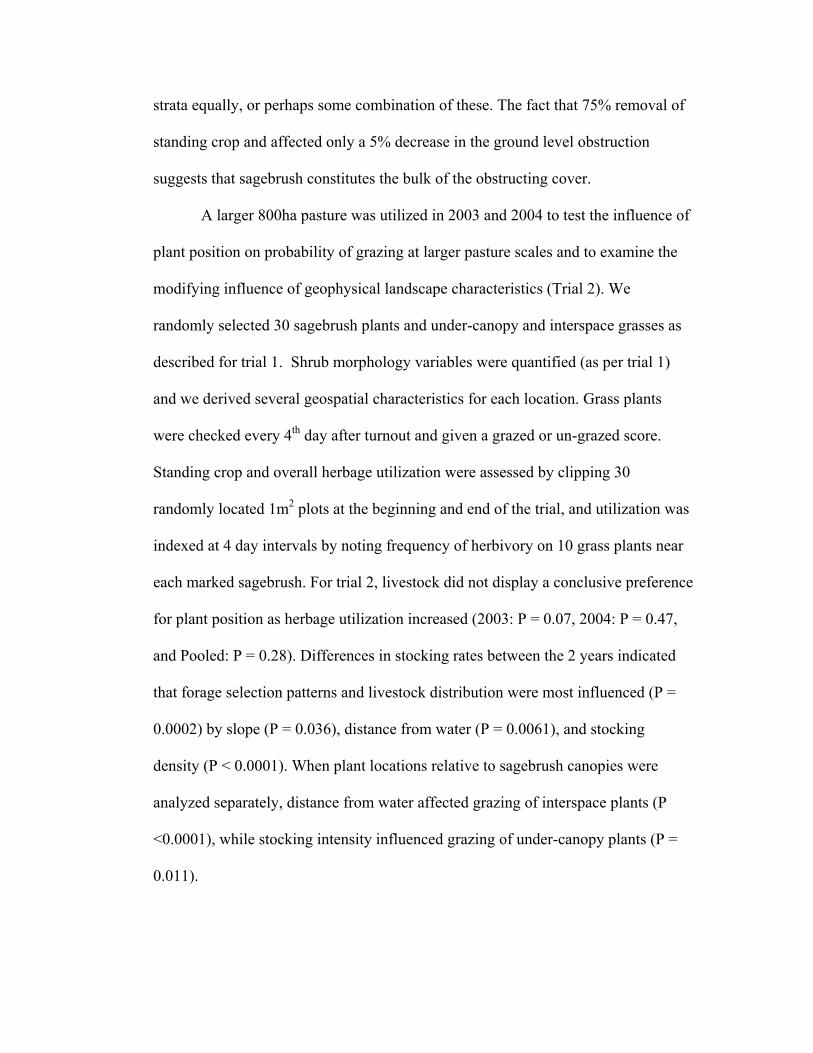
strata equally, or perhaps some combination of these. The fact that 75% removal of
standing crop and affected only a 5% decrease in the ground level obstruction
suggests that sagebrush constitutes the bulk of the obstructing cover.
A larger 800ha pasture was utilized in 2003 and 2004 to test the influence of
plant position on probability of grazing at larger pasture scales and to examine the
modifying influence of geophysical landscape characteristics (Trial 2). We
randomly selected 30 sagebrush plants and under-canopy and interspace grasses as
described for trial 1. Shrub morphology variables were quantified (as per trial 1)
and we derived several geospatial characteristics for each location. Grass plants
were checked every 4th day after turnout and given a grazed or un-grazed score.
Standing crop and overall herbage utilization were assessed by clipping 30
randomly located 1m2 plots at the beginning and end of the trial, and utilization was
indexed at 4 day intervals by noting frequency of herbivory on 10 grass plants near
each marked sagebrush. For trial 2, livestock did not display a conclusive preference
for plant position as herbage utilization increased (2003: P = 0.07, 2004: P = 0.47,
and Pooled: P = 0.28). Differences in stocking rates between the 2 years indicated
that forage selection patterns and livestock distribution were most influenced (P =
0.0002) by slope (P = 0.036), distance from water (P = 0.0061), and stocking
density (P < 0.0001). When plant locations relative to sagebrush canopies were
analyzed separately, distance from water affected grazing of interspace plants (P
<0.0001), while stocking intensity influenced grazing of under-canopy plants (P =
0.011).

In summary, cattle use of under-story plants was minimal until herbage
utilization exceeded about 35% utilization for trial 1. Livestock grazing at
“moderate” levels would reduce impacts on screening cover for sage-grouse nesting
habitat. At larger pasture scales there are management opportunities for modifying
livestock distribution to reduce grazing impacts within critical sage-grouse nesting
habitat.

©Copyright by Kevin A. France September 9, 2005
All Rights Reserved

Interspace/Under-canopy Foraging Patterns of Beef Cattle in Sagebrush Communities: Implications to Sage-grouse Nesting Habitat
by Kevin A. France
A THESIS
submitted to
Oregon State University
In partial fulfillment of the requirements for the
degree of
Master of Science
Presented September 9, 2005 Commencement June 2006

Master of Science thesis of Kevin A. France presented on September 9, 2005. APPROVED: Co-Major Professor, representing Rangeland Resources Co-Major Professor, representing Rangeland Resources Head of the Department of Rangeland Resources Dean of the Graduate School I understand that my thesis will become part of the permanent collection of Oregon State University libraries. My signature below authorizes release of my thesis to any reader upon request.
Kevin A. France, Author
ACKNOWLEDGEMENTS
I would like to extend great appreciation to Chad Boyd and David Ganskopp
and their families for all of their support and input into this project. Without your
support this would have never been accomplished. A special thanks to Oregon
Cattlemen’s Association for their insight into the needed research. Thanks to the
employee’s of Oregon State University, Rangeland Resources department and ARS
in Burns, Oregon for their support and use of facilities. Thank you all very much.

CONTRIBUTION OF AUTHORS
Drs. Chad Boyd and David Ganskopp assisted with experimental design, data
collection, writing, and editing of all chapters.
Dustin Johnson assisted with data collection and editing. Joanna Hurlbert assisted
with data collection.

TABLE OF CONTENTS
Page
CHAPTER 1: ............................................................................................................. 1
GENERAL INTRODUCTION ..............................................................................1
Objectives ...........................................................................................................6
BIBLIOGRAPHY ..................................................................................................7
CHAPTER 2: ........................................................................................................... 10
ABSTRACT .........................................................................................................10
INTRODUCTION................................................................................................11
MATERIALS AND METHODS .........................................................................15
Study Sites ........................................................................................................15
Trial 1 ...........................................................................................................16
Vegetation.................................................................................................17
Project Design ..........................................................................................18
Plant Position............................................................................................19
Shrub Morphology....................................................................................20
Vegetation.................................................................................................24
Project Design ..........................................................................................25
Data Analysis....................................................................................................26
Trial 1 ...........................................................................................................26
Plant position effects on grazing ..............................................................26
Shrub morphology effects on under-canopy grazing ...............................27
Visual Obstruction....................................................................................28
Trial 2 ...........................................................................................................29
RESULTS AND DISCUSSION ..........................................................................30
Trial 1 ...............................................................................................................30
Utilization .....................................................................................................31

Plant position effects on grazing ..................................................................32
Shrub morphology effects on under-canopy grazing ...................................35
Visual Obstruction........................................................................................37
TABLE OF CONTENTS (Continued)
Page
BIBLIOGRAPHY ................................................................................................49
CHAPTER 3: ........................................................................................................... 52
GENERAL CONCLUSION.................................................................................52
BIBLIOGRAPHY ................................................................................................56
APPENDICIES ........................................................................................................ 61
Appendix 1: Flow chart for analysis of trial 2 data, life-test analysis and survival regression analysis utilized to determine the effects of plant location, stocking density, and geophysical variables at the Northern Great Basin Experimental Range, Oregon in 2003 and 2004. .......................................62
Appendix 2: Percent visual obstruction for strata 1-13 with the 4 sampling days at Foster Flat, Oregon in 2004. Significant changes were observed with changes in visual obstruction across all strata with increasing pasture utilization (P = 0.0001).........................................................................................63
Appendix 3: Vegetation characteristics for Foster Flat, Oregon in 2004. Sagebrush canopy cover and density was 17.1% ± 0.3 and 3209 ± 36.6 plants/hectare, respectively. Herbaceous cover for the site was 9.0% ± 0.01…..64

LIST OF FIGURES
Figure Page 1. Four fenced pastures established for trial 1 at Foster Flat, Oregon, in
which livestock grazed for 18 days for assessments of under-canopy and interspace utilization of grass tussocks in a Wyoming big sagebrush environment in 2003 and 2004. ................................................... 17
2. Permanently marked paired under-canopy and interspace tussocks
which were checked every second day to monitor grazing occurrence and determine preference of location on the Foster Flat, Oregon study area in 2003 and 2004. ........................................................................ 20
3. Angle of accessibility measurement to assess the vulnerability of
under-canopy grass to herbivory. Measurements were taken at the beginning of the trial for 2003 and 2004 at Foster Flat, Oregon. ................. 21
4. Modified robel pole 1 m used to measure visual obstruction of
potential nesting sites at each sagebrush plot for 2004 at Foster Flat, Oregon. ......................................................................................................... 22
5. The 800ha pasture with 30 randomly selected plots (white dots)
which were used to locate the sagebrush and paired grass plants plot for trial 2 at the Northern Great Basin Experimental Range, Oregon in 2003 and 2004. ......................................................................................... 24
6. Percent utilization by weight and days elapsed among the 4 pastures
at Foster Flat, Oregon in 2003 and 2004 in trial 1(R2 = 0.93) (P < 0.0001).......................................................................................................... 32
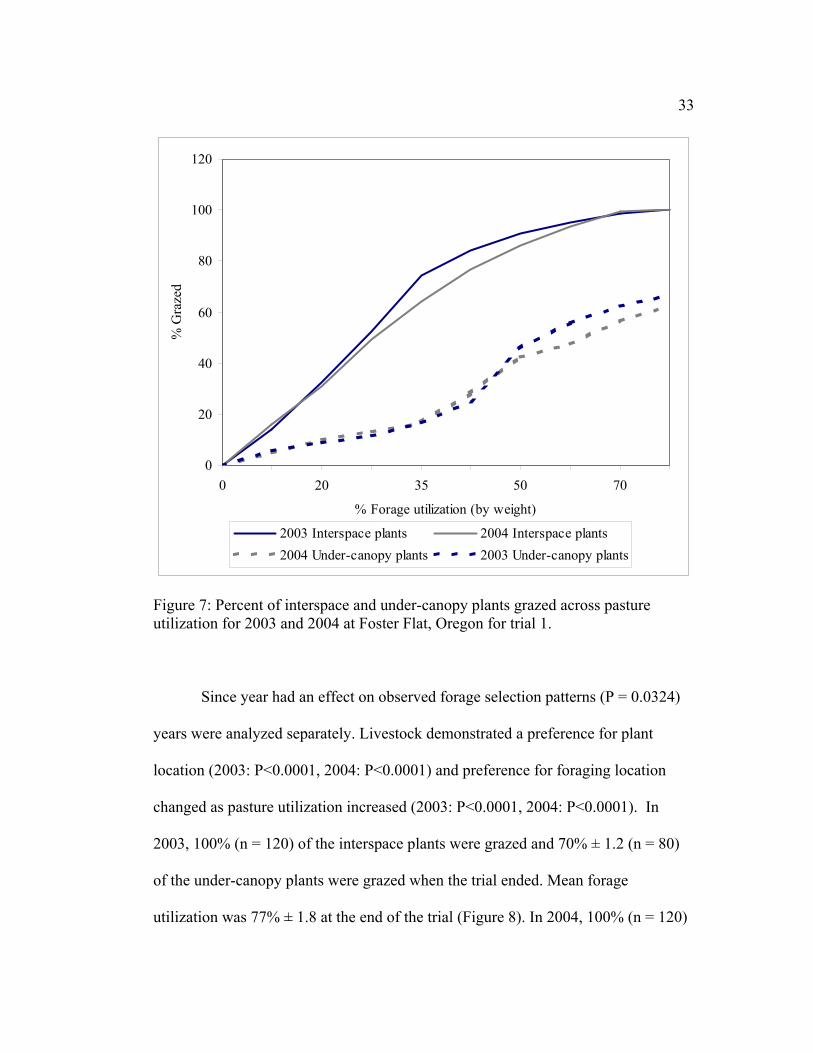
7. Percent of interspace and under-canopy plants grazed across pasture
utilization observed for 2003 and 2004 at Foster Flat, Oregon for trial 1. ................................................................................................................... 33
LIST OF FIGURES (Continued)
Figure Page 8. Percent visual obstruction for the unobstructed view for the 4
sampling intervals across 13 strata (1 being the bottom and 13 being the top) of the Robel pole at Foster Flat, Oregon in 2004. ........................... 38
9. Percent visual obstruction for the random view for the 4 sampling
intervals across the 13 strata (1 being the bottom and 13 being the top) of the Robel pole at Foster Flat, Oregon in 2004.................................. 39
10. Life-test analysis of grass plants for trial 2 with different stocking
rates (2003 180 cows, 2004 60 cows) at the Northern Great Basin Experimental Range, Oregon for 2003 and 2004. ........................................ 41
11. Life-test analysis evaluating cattle preference for interspace or under-
canopy grass tussocks in an 800ha pasture on the Northern Great Basin Experimental Range, near Burns, Oregon in 2003............................. 42
12. Life-test analysis evaluating cattle preference for interspace or under-
canopy grass tussocks in an 800ha pasture at the Northern Great Basin Experimental Range, near Burns, Oregon in 2004............................. 43
13. Life-test analysis evaluating cattle preference for interspace or under-
canopy grass tussocks in an 800ha pasture on the Northern Great Basin Experimental Range, near Burns, Oregon with pooled data from 2003 and 2004...................................................................................... 44
INTERSPACE/UNDER-CANOPY FORAGING PATTERNS OF BEEF CATTLE IN SAGEBRUSH COMMUNITIES: IMPLICATIONS TO SAGE-
GROUSE NESTING HABITAT
CHAPTER 1:
GENERAL INTRODUCTION
While herbivory is not a new disturbance to sagebrush/steppe communities
(Artemisia L. spp.) within the Great Basin (Burkhardt 1996), introduction of
domestic livestock to the region in the late 1800’s had a profound impact on the
system’s ecology (Miller et al. 1994). Historical grazing practices consisted of
unregulated season-long use combined with excessive stocking rates (Young and
Sparks 1985). These practices resulted in dramatic alterations in sagebrush
communities including an increase in non-native plants (Young et al. 1976),
decrease in forbs and perennial grasses (Young et al. 1976), altered fire regimes
(Whisenant 1990), and an increase in sagebrush density (Miller et al. 1994). Grazing
management practices have improved substantially over time (Laycock et al. 1996).
Present day management challenges include overcoming problems resulting from
historical grazing practices (e.g. non-native plants) as well as facing new
management difficulties like developing grazing strategies complementary to the
needs of wildlife.
Historically, sage-grouse (Centrocercus urophasianus) inhabited most of the
sagebrush communities in the western US and western provinces of Canada
(Klebenow 1985, Connelly and Braun 1997, Crawford et al. 2004). However, since
European settlement 40% of these shrub-steppe communities have been extirpated

2 (Braun et al. 1977, and Wisdom et al. 2002). Coinciding with the loss of sagebrush
communities, sage-grouse populations have declined to 50% of historic estimates
over the past 50 years (Connelly and Braun 1997). Reductions in sage-grouse
populations have been associated with historic and current habitat degradation
(Miller and Eddleman 2001), and have prompted an increased interest in defining
impacts of land management practices on habitat quality for this species. Habitat
modification and degradation have been associated with changes in fire regimes,
excessive livestock grazing, increases in non-native plants, conversion to cropland,
seeded pastures, roads and energy development, and other land alterations
(Klebenow 1970, Braun and Beck 1996, Beck and Mitchell 2000). Fire suppression
in high elevation sagebrush communities has contributed to western juniper
(Juniperus occidentalis Hook.) encroachment, and more frequent fire return
intervals at lower elevations have fostered invasions by annual grasses (Miller et al.
1994, Miller and Eddleman 2001).
Some speculate that livestock grazing has negatively impacted sage-grouse
populations by decreasing residual cover, reducing forage quality and quantity, and
lowering nesting success for sage-grouse (Sveum 1998, Gregg 1992) and other
ground nesting birds ((e.g. western meadow lark (Sturnella neglecta), common
nighthawk (Chordeiles minor), common poorwill (Phalaenoptilus nuttallii), horned
lark (Eremophila alpestris), hermit thrush (Catharus guttartus), vesper lark
(Poaecetes gramineus), savannah sparrow (Passerculus sandwichensis), song
sparrow (Melospiza melodia) and white crowned sparrows (Zonotrichia

3 leucophyrs)) (Guthery 1996). Sage-grouse typically nest beneath sagebrush that are
40-80cm tall (Gregg et al. 1994, Connelly et al. 2000, Crawford et al. 2004).
Additional cover from adjacent herbaceous vegetation can increase nest
concealment and decrease predation rates (Sveum et al. 1998, Watters et al. 2002).
Bunnell et al. (2004) found that nest selection in Utah was correlated with higher
amounts of canopy cover and taller vertical cover provided by grasses and forbs.
Sage-grouse generally nest from March through April (Sveum et al. 1998), which is
usually before current year herbage growth and livestock turnout. Consequently,
current year’s nesting cover typically consists of shrubs and residual vegetation
from the previous growing season.
Sage-grouse inhabit a wide range of environments, both temporally (i.e.
seasonally) and spatially. They utilize sagebrush habitat for nesting, brood rearing,
and wintering (Sveum et al. 1998), and these same areas are grazed by livestock.
While many speculate that recent sage-grouse declines are related to livestock
grazing (Gregg et al. 1994, Delong et al. 1995, Connelly and Braun 1997), there is
no direct experimental evidence relating the two. Previous research suggests near-
nest herbage is important for sage-grouse nest concealment, and declines in
abundance of this vegetation result in a higher frequency of nest predation (Gregg et
al. 1994, Watters et al. 2002). In fact, sage-grouse tend to select nest sites with the
highest amounts of sagebrush cover and tallest and densest herbaceous cover (Gregg
1992, Sveum et al. 1998). Gregg et al. (1994) reported that tall residual cover
(mainly perennial grasses) was greater at successful nests than unsuccessful nests,

4 and that cover of bunchgrasses within a 1-m radius of the nest site was positively
related to nest success. The relationship between distance from the nest and
concealing grass cover has not been investigated for successful vs. unsuccessful
nests.
Indirect evidence suggests livestock grazing can have both positive and
negative effects on nesting and brood rearing success for ground nesting birds
(Guthery 1996). For example, grazing can attract sage-grouse to densely vegetated
communities by opening habitat, stimulating forb growth (Severson and Urness
1994), and increasing the abundance of sagebrush leaves (Vale 1975). Sagebrush
leaves are important because they constitute 90% of sage-grouse diets during winter
months (Evans 1986). Excessive grazing, however, may predispose ground nesting
bird clutches to predation (Errington 1993) and result in trampling of nests (Paine et
al. 1996). Heavy grazing can reduce herbaceous cover needed for sage-grouse
nesting success (Gregg 1992) and increase annual grass and weed invasions (Beck
and Mitchell 2000).
In the Great Basin, sagebrush ecosystems are most frequently associated
with bluebunch wheatgrass (Pseudoroegneria spicata (Pursh) A. Love), Thurber
needlegrass (Stipa thurberiana Piper), squirreltail (Sitantion hystix (Nutt.) J.G. Sm.),
and many other grasses and forbs (Barler and Mickell 1983, Shumer and Anderson
1986). Within these ecosystems, distribution of herbaceous under-story vegetation is
generally sparse and heterogeneous. Livestock forage selection is usually dependent
upon relative plant availability and bunchgrass structure (Ganskopp et al. 1992,
5 Ganskopp and Rose 1992). Forage selection patterns of livestock in sagebrush-
dominated communities have not been related to the spatial distribution of grass
plants (e.g. interspace vs. under sagebrush canopy) or sagebrush morphology.
The utility of short-term and small-scale experiments is to provide insight
into cause and effect relationships affecting large-scale systems (Gardner et al.
2001). However, research at small scales has been questioned for its applicability at
larger management scales. Some view short-term studies as having limited
application for predicting processes in large-scale systems; though, studies in
smaller-scale systems usually uncover patterns sooner than in larger-scale systems
(Gardner et al. 2001). The need for large-scale studies is related to current
management practices involving livestock and wildlife management at landscape
scales. Landscape scale environmental variables like slope, aspect, distance from
water, and vegetation may influence the distribution and behavior of grazing
animals (Bailey et al. 1996, Gillen et al. 1984, Kie and Boroski 1996, Owens et al.
1991, Pinchak et al. 1991, Senft et al. 1985). Small-scale studies may not exhibit the
effects of landscape level variables on animal behavior because environmental
variability is reduced.
The objective of this study was to relate grazing intensity/duration with
grazing of under-canopy and interspace grasses. A second, landscape-scale study
was used to relate grazing intensity/duration, geospatial, and site-specific variables
with grazing of under-canopy and interspace grasses.

6 Objectives
1) Use small scale pastures (6 ha) to document the relative rates of utilization by
cattle of interspace and under-canopy perennial bunchgrasses.
2) Determine the influence of sagebrush morphology on the occurrence of grazing
by cattle on under-story perennial bunchgrasses.
3) Quantify possible changes in visual obstruction of potential sage-grouse nest sites
with increasing herbaceous utilization in zones from ground level to a 1-m height.
4) Determine the influence of several geospatial characteristics and stocking
pressure on the relationship between bunchgrass position (interspace vs. under-
canopy) and grazing occurrence at larger pasture scales (up to 800+ha).
7
BIBLIOGRAPHY
Barler, J.R. and C.M. Mickell. 1983. Habitat differences between basin and Wyoming big sagebrush in contiguous population Artemisia tridentate, Utah. Journal of Range Management. 36:450-454. Beck, J.L. and D.L. Mitchell. 2000. Influences of livestock grazing on sage-grouse habitat. Wildlife Society Bulletin. 28:993-1002. Braun, C.E., T. Britt, and R.O. Wallestad. 1977. Guidelines for maintenance of sage grouse habitats. Wildlife Society Bulletin. 5:99-106. Braun, C.E. and T.D. Beck. 1996. Effect of research on sage-grouse management. Transactions of the North American wildlife and natural resources conference. 61:429-436. Bunnell, K.D., J.T. Flinders, D.L. Mitchell, and J.H. Warder. 2004. Occupied and unoccupied sage grouse habitat in Strawberry Valley Utah. Journal of Range Management. 57:524-531. Burkhardt, J.W. 1996. Herbivory in the intermountain West. University of Idaho. Forest, Wildlife and Range Experimental Station Bulletin. 58. Connelly, J.W. and C.E. Braun. 1997. Long-term changes in sage grouse Centrocercus urophasianus populations in western North America. Wildlife Biology. 3:229-234. Connelly, J.W., M.A. Schroeder, A.R. Sands, and C.E. Braun. 2000. Guidelines for management of sage-grouse populations and habitat. Wildlife Society Bulletin. 28:967-985. Crawford, J.A., R.A. Olson, N.E. West, J.C. Mosley, M.A. Schroeder, T.D. Whitson, R.F. Miller, M.A. Gregg, and C.S. Boyd. 2004. Ecology and management of sage-grouse and sage-grouse habitat. Journal of Range Management. 57:2-19 Delong, A.K., J.A. Crawford, and D.C. Delong Jr. 1995. Relationships between vegetational structure and predation of artificial sage grouse nests. Journal of Wildlife Management. 59:88-92. Errington, P.L. 1933. The nesting and the life equation of the Wisconsin bobwhite. Wilson Bulletin. 45:122-132.

8 Evans, C.C. 1986. The relationship of cattle grazing to sage-grouse use of meadow habitat in the Sheldon National Wildlife Refuge. Masters thesis. University of Nevada, Reno, NV. Ganskopp, D.G. Angell, R. and J. Rose. 1992. Response of cattle to cured reproductive stems in a caespitose grass. Journal of Range Management. 45:401-404. Ganskopp, D.G., and J. Rose. 1992. Bunchgrass basal area affects selection of plants by cattle. Journal of Range Management. 45:538-541. Gardner, R. H., W. M. Kemp, V. S. Kennedy, and J. E. Petersen, editors. 2001. Scaling relations in experimental ecology. Columbia University Press, New York, New York, USA. 352 pp. ISBN 0231114990. Gregg, M.A. 1992. Habitat use and selection of nesting habitat by sage-grouse in Oregon. M.S. thesis. Oregon State University, Corvallis, OR. Gregg, M.A., J.A. Crawford, M.S. Drut, and A.K. Delong. 1994. Vegetational cover and predation of sage grouse nests in Oregon. Journal of Wildlife Management. 58:162-166. Guthery, F.S. 1996. Upland gamebirds. Pages 59-69 in P. R. Krausman, editior. Rangeland wildlife. The society for range management, Denver, CO. USA. Klebenow, D.A. 1970. Sage grouse versus sagebrush control in Idaho. Journal of Range Management. 23:396-400. Laycock, W., A.D. Loper, F.W. Obermiller, L. Smith, S.R. Swason, P.J. Urness and M. Vavra. 1996. Grazing on public lands. Council for Agriculture science and technology task force. Rep. No. 129. Ames, IA. Miller, R.F., T. Svejcar, and N.E. West. 1994. Implications of livestock grazing in the Intermountain sagebrush region: plant composition, p.101-146. In: M. Vavra, W.A. Laycock, and R.D. Pieper (eds.). Ecological Implications of Livestock Herbivory in the Western Society for Range Management. Denver, Colo. Miller, R.F. and L.L Eddleman. 2001. Spatial and temporal changes of sage grouse habitat in the sagebrush biome. Oregon State University Agricultural Experiment Station, Technical Bulletin 151. Paine, L., Undersander, D.J., Sample, D.W., Bartelt, G.A., and T.A. Schatteman. 1996. Cattle trampling of simulated ground nests in rotationally grazed pastures. Journal of Range Management. 49:294-299.

9 Severson, K.E., and P.J. Urness. 1994. Livestock grazing: A tool to improve wildlife habitat. p232-249. In: M. Vavra, W.A. Laycock, and R.D. Pieper (eds.). Ecological Implications of Livestock Herbivory in the Western Society for Range Management. Denver, Colorado. Shumer, M.L. and Anderson J.G. 1986. Gradient analysis of vegetation dominated by 2 subspecies of big sagebrush. Journal of Range Management. 39:1156-1611. Sveum, C.M., D. Edge, and J.A. Crawford. 1998. Nesting habitat selection by sage grouse in south-central Washington. Journal of Range Management. 51:265-269. Vale, T.R. 1975. Presettlement vegetation in the sagebrush-grass area in the intermountain west. Journal of Range Management. 28:32-36. Watters, M.E., T.L. McLash, C.L. Aldridge, R.M. Brigham. 2002. The effect of vegetation structure on predation of artificial sage-grouse nests. Ecoscience. 9: 314-319. Whisenant, S.G. 1990. Changing fire frequencies on Idaho’s river plains: Ecological and management implications. Pg 4-10 In Proceedings Cheatgrass invasion shrub die-off and other aspects of shrub biology and management. USDA Forest Service Technical Report. 276. Wisdom, M.J., M.M. Rowland, B.C. Wales, M.A. Hemstrom, W.J. Hann, M.G. Raphael, R.S. Holthausen, R.A. Gravenmier, and T.D. Rich. 2002. Modeled effects of sagebrush-steppe restoration on greater sage-grouse in the interior Columbia basin, U.S.A. Conservation Biology. 16:1223-1231. Young, J.A., R.A. Evans, and J. Major. 1972. Alien plants in the great basin. Journal of Range Management. 25:194-201. Young, J.A., R.A. Evans and P.T. Tueler. 1976. Great Basin plant communities-pristine and grazed. Pages 187-215 In R. Elston and P. Headrick (eds.) Holocene environmental change in the Great Basin. Nevada Archeology Survey. Research Paper No. 6, University of Nevada, Reno. 5:194-201. Young, J.A. and B.A. Sparks. 1985. Cattle in the cold desert. Utah State University Press, Logan.
10 CHAPTER 2:
Interspace/Under-CNOPY FORAGING PATTERNS OF BEEF CATTLE IN SAGEBRUSH COMMUNITIES: IMPLICATIONS TO SAGE-GROUSE
NESTING HABITAT
ABSTRACT
Livestock grazing has been indirectly related to sage-grouse (Centrocercus
urophasianus) declines in the western United States and southern Canada; however,
there is a lack of scientific research that directly relates the two. Our objectives were
to investigate the influence of livestock grazing on sage-grouse nesting habitat by
determining forage selection patterns of cattle, the effects of shrub morphology on
under-canopy grazing occurrence, and possible changes in screening cover as forage
utilization increases. An eighteen-day, replicated, small pasture trial was conducted
in the summers of 2003 and 2004 (trial 1). Grazing of under-canopy grass tussocks
was negligible at light to moderate levels of utilization (e.g. < 10% of under-canopy
plants were grazed when 30% of the standing crop was utilized). At utilization
levels >35%, under-canopy tussocks were used with increasing frequency
(P<0.0001). Logistic regression indicated that angle of accessibility (P <0.0001) was
the only shrub morphology variable influencing grazing occurrence of under-canopy
grasses. As angles increased grazing susceptibility increased. Visual obstruction
decreased over time, but the decline was consistent across all strata to a height of 1-
m. We expected a strata X period interaction as the herbaceous vegetation level was
grazed and trampled by cattle, but this interaction did not occur (p = 0.9995).

11 Removal of 75% of the standing crop affected only a 5% decrease in ground level
obstruction suggesting that sagebrush constituted the bulk of screening cover.
A larger 800ha pasture was utilized in 2003 and 2004 to test the influence of
plant position relative to sagebrush canopies on the probability of grazing at larger
pasture scales and to examine the modifying influence of geophysical characteristics
(Trial 2). Livestock did not display a conclusive preference based on plant position
as pasture utilization increased (2003: P = 0.07, 2004: P = 0.47, Pooled: P = 0.28).
Slope (P = 0.036), distance from water (P = 0.0061), and stocking density (P <
0.0001) affected the likelihood of forage selection across the pasture. In 2003, the
mean herbage utilization as indexed by standing crop at the end of trial was 66%
with a total 288 AUM’s. In 2004, the mean herbage utilization by weight was 45%
with a total of 144 AUM’s.
In summary, cattle use of under-story plants was minimal until herbage
utilization exceeded about 35% utilization for trial 1. That being the case, livestock
grazing at “moderate” levels would have little effect on herbaceous screening cover.
This work suggests management practices for modifying livestock distribution that
could decrease forage utilization within critical sage-grouse nesting habitat.
INTRODUCTION
Because sage-grouse (Centrocercus urophasianus) depend upon sagebrush
communities (Artemisia L. spp.) (Klebenow 1970, Braun et al. 1977, Connelly et al.
1991, Gregg 1992, Sveum et al. 1998), there is a need to determine the effects of

12 livestock grazing on sagebrush and its associated herbaceous vegetation.
Maintaining nesting success is critical to sustaining sage-grouse populations over
time (Bunnell et al. 2004, Crawford et al. 2004). In spite of high reproductive
potential, sage-grouse often exhibit low reproductive success due to nest failures
(Crawford et al. 2004). Predation is a leading cause of low nest success, and habitat
quality is inversely correlated with predation rates (Braun and Beck 1996, Sveum et
al. 1998, Crawford et al. 2004). Sage-grouse generally nest under sagebrush plants
(Sveum et al. 1998). Nest site selection is related to key structural features such as
shrub canopy cover, shrub height, and residual bunchgrass screening cover, all of
which have been correlated positively with nest success (Gregg 1992, Gregg et al.
1994). Research in eastern Oregon (Gregg et al. 1994) suggests successful nests are
associated with increased canopy cover of medium height (40-80 cm) sagebrush,
and bunchgrasses in the surrounding 3-m2 area. Management guidelines for sage-
grouse habitat recommended a 15-25% shrub canopy cover and >15% grass/forb
cover at nest sites (Connelly et al. 2000, Connelly et al. 1991, Delong et al. 1995).
Coyotes (Canis latrans), avian, and small mammal species are the main nest
predators, however, adequate vegetation cover (sagebrush and bunchgrasses)
provides visual, scent, and physical barriers that may decrease nest susceptibility to
predation (Gregg 1992, Crawford et al. 2004). Livestock grazing has been indirectly
implicated as one of the factors promoting sage-grouse declines in the western
United States and southern Canada (Sveum et al. 1998, Gregg 1992). There is
however, a lack of scientific evidence directly relating the two. At present, there is a
13 need to describe forage extraction patterns of livestock grazing in the various
sagebrush/steppe communities with respect to the needs of sage-grouse.
Historically, sage-grouse inhabited most of the sagebrush communities in the
western U.S. and western provinces of Canada (Klebenow 1985, Connelly and
Braun 1997, Crawford et al. 2004). Since European settlement, 40% of these shrub-
steppe communities have been extirpated range-wide (Braun et al. 1977, Wisdom et
al. 2002), and sage-grouse populations have dwindled to 50% of their historic
estimate over the past 50 years (Connelly and Braun 1997). Reductions in sage-
grouse populations have been associated with both historic and current habitat
degradation (Miller and Eddleman 2001) including changes in fire regimes,
excessive livestock grazing, increases in non-native plant species, conversions to
cropland, seeded pastures, roads and energy development, and other land alterations
(Klebenow 1970, Braun and Beck 1996, Beck and Mitchell 2000, Crawford et al.
2004).
Livestock grazing has occurred in sagebrush communities for over a century
(Young et al. 1976, Laycock et al. 1996), but no study has directly assessed the
effects of livestock grazing on sage-grouse habitat and/or population dynamics.
Historic over-use of sagebrush communities by livestock brought about increases in
sagebrush abundance, decreases in perennial grasses, and increases in non-native
annual grasses (Young et al. 1972). In the past 50 years, grazing management and
the condition of sagebrush communities have improved (Laycock et al. 1996), and
research suggests that livestock grazing can be compatible with the maintenance of
14 perennial grasses and forbs in sagebrush habitat (Miller et al. 1994, Bork et al.
1998). Excessive grazing however, can lead to decreases in perennial grasses and
forbs, increases in non-native annual grasses, and increases in shrub density and
abundance (Bork et al. 1998).
Tussock grasses are distributed throughout the interspaces and under
canopies of sagebrush with no reported spatial trend or pattern. In these
communities, forage selection by cattle is usually dependent upon relative plant
availability and bunchgrass structure (Ganskopp et al. 1992, Ganskopp and Rose
1992). Specific foraging patterns by beef cattle in sagebrush communities,
particularly interspace versus under-canopy grass plants, have not been investigated.
Small-scale studies have been criticized for their relevance at larger-scale
management levels (Gardner et al. 2001). Large-scale studies are increasing as
emerging technologies like GIS systems facilitate analyses. Fuhlendorf and Engle
(2001) illustrated that traditional grazing management encourages uniform
utilization of forages across the landscape. Such practices if carried to extremes
could have detrimental effects on wildlife habitat. The use of heterogeneous grazing
could increase biodiversity across the landscape. Tools to increase heterogeneity
include: water placement, herding, drift fences, and strategic salt and mineral
placement (Gillen et al. 1984, Bailey et al. 1996, Ganskopp 2001). Geospatial
characteristics such as slope, aspect, topography, and distance from water have also
been shown to effect livestock distribution and forage selection (Bailey et al. 1996,
15 Gillen et al. 1984, Kie and Boroski 1996, Owens et al. 1991, Pinchak et al. 1991,
Senft et al. 1985).
The objectives of this study were: 1) quantify cattle selection of interspace
and under-canopy grasses at small pasture scales, 2) assess the influence of
sagebrush morphology on the likelihood of under-canopy grazing by cattle, 3)
quantify the affects of cattle grazing on nest site visibility, and 4) assess forage
selection patterns of cattle at a landscape scale to evaluate the effects of geospatial
variation, shrub morphology, and stocking rate on grazing behavior. We
hypothesized 1) that forage selection would be affected by interspace/under-canopy
location as forage utilization increased, 2) that shrub morphology would affect
under-canopy plant grazing occurrence, 3) that visual obstruction would decrease in
lower strata but not higher strata as forage utilization increased, and 4) that
geospatial characteristics and stocking rates would influence foraging patterns at
landscape scales.
MATERIALS AND METHODS
Study Sites
Two study sites were chosen for the trials. The first (trial 1) was used to
investigate hypotheses 1 through 3. The second site (trial 2) was chosen to represent
large-scale management scenarios and used to evaluate hypothesis 4. Both trials
were conducted after the cessation of herbaceous growth within each season.
16 Trial 1
The small pasture study site was conducted on an intensively grazed setting
100km south of Burns, Oregon, near Foster Flat (42.98 N, 119.25 W). Elevation
was approximately 1525m with a mean annual precipitation of 26.8cm (Anderson et
al. 1998). Property is presently seasonal rangeland administered by the Bureau of
Land Management and the site is sage-grouse nesting habitat (Willis 2004). Four
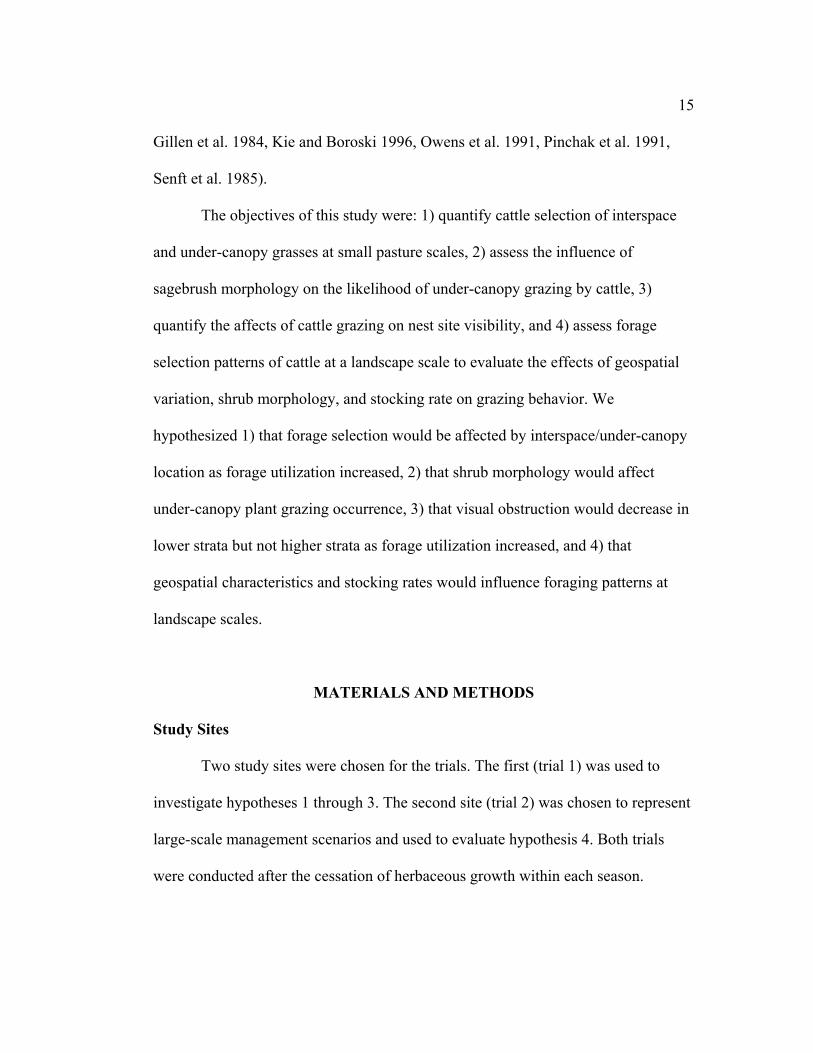
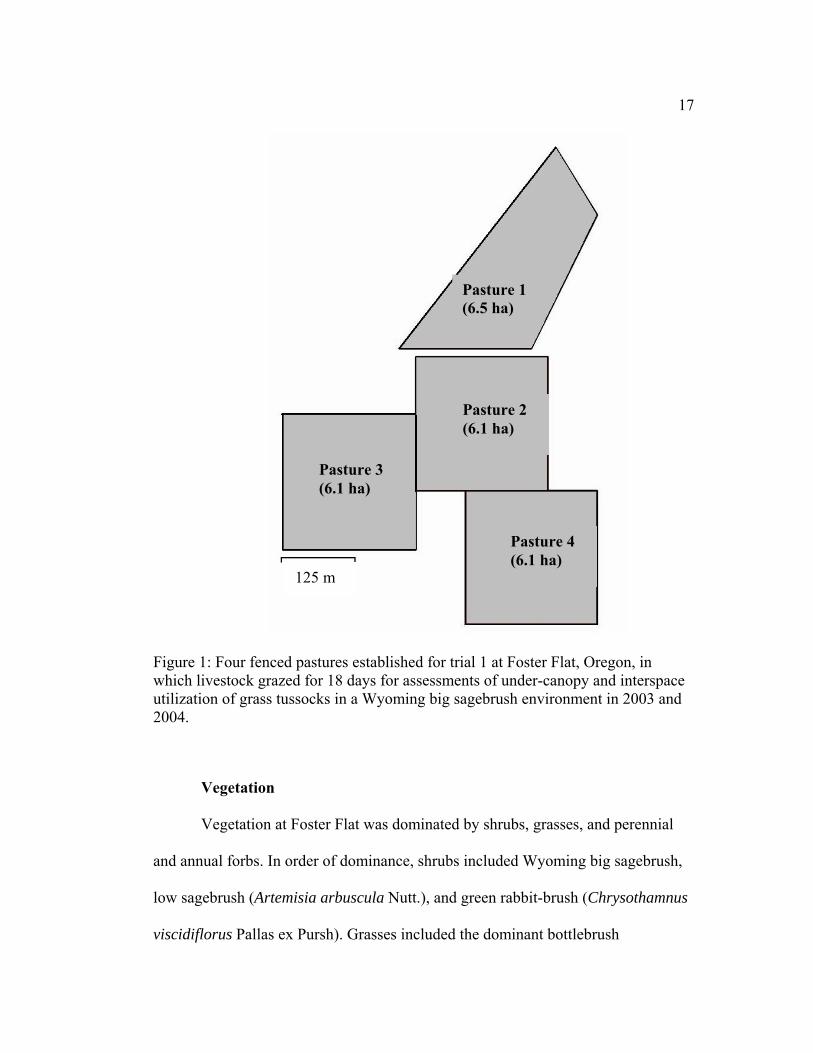
pastures were established in a Wyoming big sagebrush (Artemisia tridentata Nutt.
ssp. wyomingensis Beetle and Young)/bottlebrush squirreltail (Sitantion hystix
(Nutt.) J.G. Sm.) community (Figure 1). Pastures ranged from 6.1 to 6.5 ha.
Standing crop and forage utilization were measured by clipping 20 randomly
located 1-m2 plots in each pasture at weekly intervals. The first clipping indexed
initial standing crop, and subsequent data was used to measure herbage utilization as
the study progressed. Stocking rate was based on the initial standing crop and the
number of cattle needed to deplete the forage in a 16-18 day window. Four yearling
heifers (325 kg) were stocked in each pasture for 18 days in 2003 from July 07 –
July 25, and 3 yearling heifers were stocked in each pasture for 18 days in 2004
from July 20 – August 06.
17
Pasture 1(6.5 ha)
Pasture 2 (6.1 ha)
Pasture 3 (6.1 ha)
Pasture 4 (6.1 ha)
125 m
Figure 1: Four fenced pastures established for trial 1 at Foster Flat, Oregon, in which livestock grazed for 18 days for assessments of under-canopy and interspace utilization of grass tussocks in a Wyoming big sagebrush environment in 2003 and 2004.
Vegetation
Vegetation at Foster Flat was dominated by shrubs, grasses, and perennial
and annual forbs. In order of dominance, shrubs included Wyoming big sagebrush,
low sagebrush (Artemisia arbuscula Nutt.), and green rabbit-brush (Chrysothamnus
viscidiflorus Pallas ex Pursh). Grasses included the dominant bottlebrush

18 squirreltail, and the subordinates Thurbers needlegrass (Stipa thurberiana Piper),
bluebunch wheatgrass (Pseudoroegneria spicata (Pursh) A. Love), and Sandberg’s
bluegrass (Poa secunda J. Presl). Associated dominant perennial forbs included low
pussytoes (Antennaria diamorpha (Nutt.) Torr. & Gray), largeflower hawksbeard
(Crepis occidentalis Nutt.), velvet lupine (Lupinus leucophyllus Dougle. ex Lindl.),
and longleaf phlox (Phlox longifolia Nutt.). The dominant annual forbs included
maiden blue eyed Mary (Collinsia parviflora Lindl.), western tansymustard
(Descurainia pinnata (Walt.) Britt.), and fireweed (Epilobium spp. L.).
One 80 X 50 m (0.4 ha) macro-plot was used to quantify community
composition in each pasture. Five, 50-m transects spaced at 20-m intervals were
used to measure shrub canopy cover by the line intercept method (Canfield 1941).
Sagebrush density was measured by counting the number of plants rooted within a 2
x 50m belt transect centered over each of the 50-m transects. Five, 50-m transects
(per pasture) spaced at 20-m intervals were used to quantify herbaceous cover.
Herbaceous cover was measured using twenty-five Daubenmire frames (20cm x
50cm,) spaced every 1-m per transect.
Project Design
The study was replicated in 2003 and 2004 with grazing commencing on
July 7th and 20th, respectively. Trials began at the end of the growing season for the
herbaceous community. Project design was a randomized complete block (n = 4)
with 2 treatments (interspace and under-canopy grasses) (Figure 1). Thirty

19 randomly generated UTM coordinates were derived for each of the 4 pastures (n =
120) to select sagebrush plants. Coordinates were then located in the field with a
GPS unit and the nearest suitable sagebrush chosen (>40-cm in height).
Plant Position
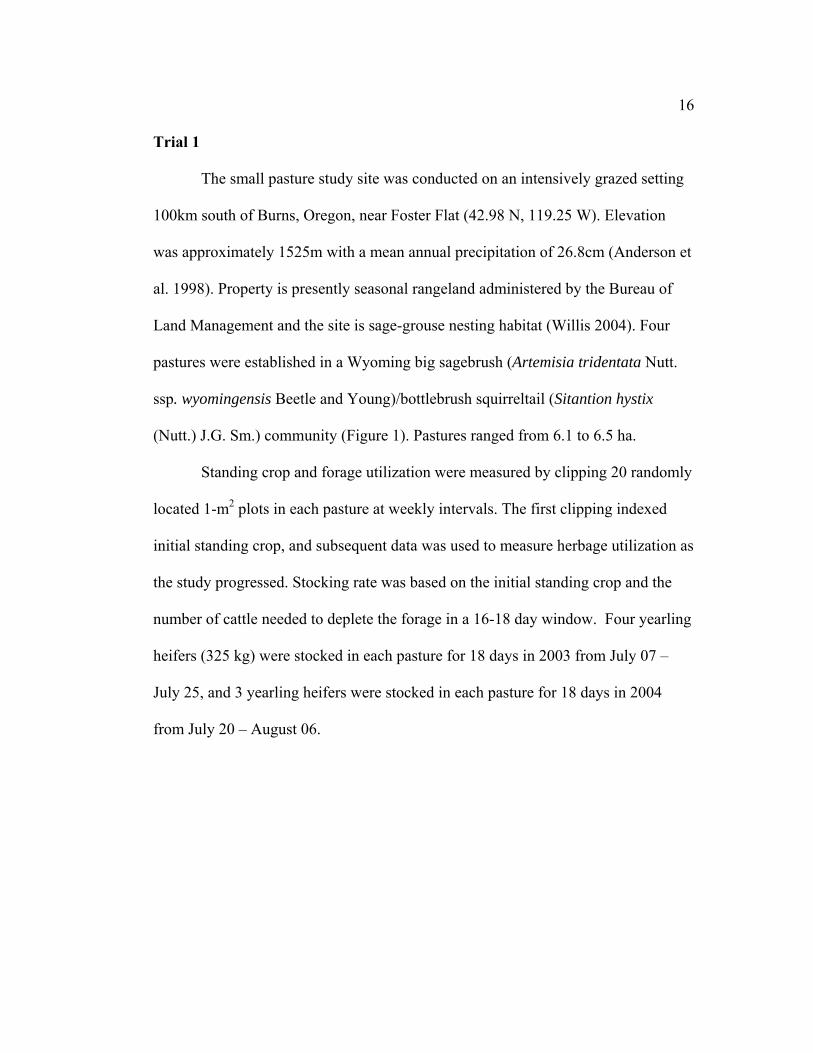
Paired grass tussocks were marked at each sagebrush plant. We randomly
selected one perennial tussock fully contained under the dripline of the sagebrush
(under-canopy), and then selected the closest plant of the same species in the
adjacent interspace between shrubs. Both plants were marked with white landscape
rock near the tussock base (Figure 2). After livestock turn out (July 7th or 20th), grass
plants were checked every second day and given a grazed (1) or un-grazed (0) score.
20
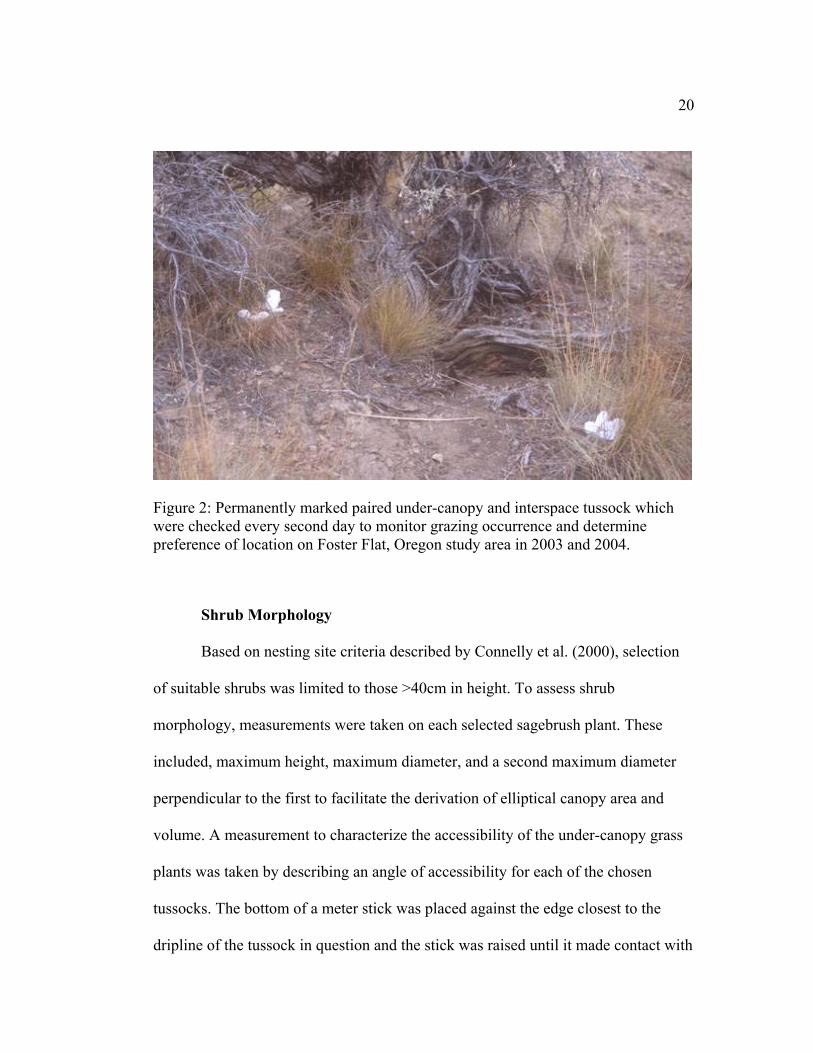
Figure 2: Permanently marked paired under-canopy and interspace tussock which were checked every second day to monitor grazing occurrence and determine preference of location on Foster Flat, Oregon study area in 2003 and 2004.
Shrub Morphology
Based on nesting site criteria described by Connelly et al. (2000), selection
of suitable shrubs was limited to those >40cm in height. To assess shrub
morphology, measurements were taken on each selected sagebrush plant. These
included, maximum height, maximum diameter, and a second maximum diameter
perpendicular to the first to facilitate the derivation of elliptical canopy area and
volume. A measurement to characterize the accessibility of the under-canopy grass
plants was taken by describing an angle of accessibility for each of the chosen
tussocks. The bottom of a meter stick was placed against the edge closest to the
dripline of the tussock in question and the stick was raised until it made contact with

21 sagebrush foliage or twigs (Y). We then measured, a.) the ground distance from the
point of canopy interception to the base of the grass plant (X), and b.) the distance
vertically from contact point to the ground (Z). These 2 lengths provided ground (X)
and height (Z) measures and the tan-1 function was used to determine the angle of
accessibility (α) (Figure 3).
(α)
(Z)
(X)
(Y)
Figure 3: Angle of accessibility measurement to assess the vulnerability of under-canopy grasses to herbivory. Measurements were taken at the beginning of the trial for 2003 and 2004 at Foster Flat, Oregon.
Visual Obstruction
In 2004, we used a modified Robel pole (Robel et al. 1970) to estimate
visual obstruction in the vicinity of each sagebrush plant (n = 120). The pole was 1-
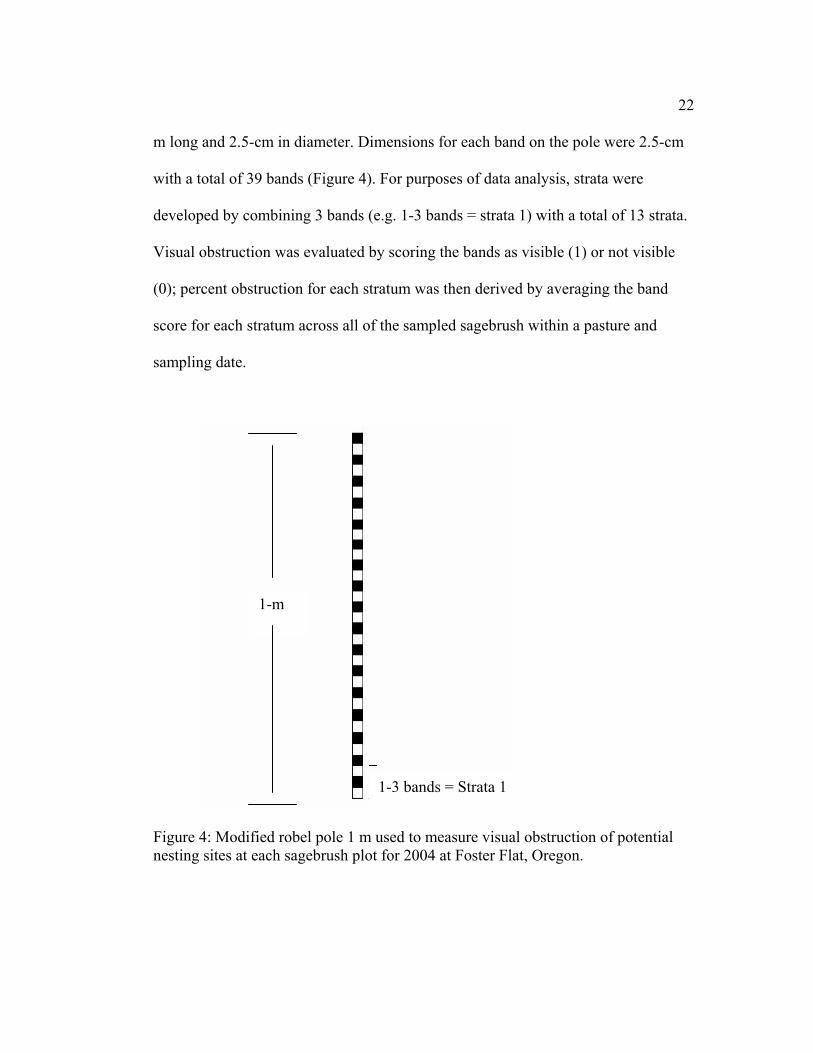
22 m long and 2.5-cm in diameter. Dimensions for each band on the pole were 2.5-cm
with a total of 39 bands (Figure 4). For purposes of data analysis, strata were
developed by combining 3 bands (e.g. 1-3 bands = strata 1) with a total of 13 strata.
Visual obstruction was evaluated by scoring the bands as visible (1) or not visible
(0); percent obstruction for each stratum was then derived by averaging the band
score for each stratum across all of the sampled sagebrush within a pasture and
sampling date.
1-m
1-3 bands = Strata 1
Figure 4: Modified robel pole 1 m used to measure visual obstruction of potential nesting sites at each sagebrush plot for 2004 at Foster Flat, Oregon.

23
The pole was located at a marked position at the base of each sagebrush, and
2 sighting positions were established in the interspace 2 m from the pole. The
azimuth for the first position was randomly selected and the second position was in
an interspace locale where the view was unobstructed by intervening sagebrush. The
latter was an attempt to discount the influence of additional sagebrush and focus the
measurement on just the herbaceous component of the community. Visual
obstruction measurements were sighted from a height of 50cm, which approximates
a coyote’s eye level. All positions (viewing angles) were permanently marked with
rebar and visual obstruction measurements were repeated at weekly intervals during
the 2004 field season.
Trial 2
The study site for trail 2 was located 72km west of Burns, Oregon on the
Northern Great Basin Experimental Range (NGBER) (119° 43’W, 43° 29’ N).
Elevation was approximately 1500m with a mean annual precipitation of 26.8cm
(Anderson et al. 1998). The study site was located in a 800ha pasture (Figure 5).
Relative to site 1, this area had a more variable physical environment with respect to
slope, distance from water, aspect, topography, and plant communities. Stocking
rates were different between years. In 2003, 180 cows grazed the 800 ha pasture for
48 days, and in 2004, 60 cows utilized the pasture for 72 days. These values
translated to 288 animal unit months (AUM’s) for 2003 and 144 AUM’s for 2004.

24
Elevation (m)
100 m
Figure 5: The 800ha fenced pasture with 30 randomly selected plots (white dots) which were used to locate the sagebrush and paired grass plants plot for trial 2 at the Northern Great Basin Experimental Range, Oregon in 2003 and 2004.
Vegetation
Plant communities within the 800ha pasture were characterized by a
scattered western juniper (Juniperus occidentalis Hook.) overstory across about
60% of the pasture. Shrub dominants included Wyoming, mountain (Artemisia

25 tridentata Nutt. spp vaseyana (Rydb.) Beetle), basin (Artemisia tridentata Nutt. spp.
tridentata) and low sagebrush. Dominant under-story grasses included bluebunch
wheatgrass, Idaho fescue, and sandberg’s bluegrass; dominant forbs included
Antennaria spp., Agoseris spp., and Crepis spp.
Project Design
Selection criteria and measurements for sagebrush/grass plants were
identical to trial 1. We located thirty sagebrush and paired grass plants within the
pasture, which were utilized for both years (2003 and 2004). For each paired plot we
determined site-specific characteristics including elevation, horizontal distance from
stock water, slope, aspect, and elevation above or below stock water extracted from
digital elevation models using GIS. Other independent quantitative measurements
included: angle of accessibility for grasses beneath shrubs, shrub height, shrub
canopy area and volume, herbage production, and days elapsed from the beginning
of the trial until interspace and/or under-canopy grasses were defoliated. Qualitative
variables included: the species of grass at each location, and grazed or un-grazed
status of tussocks by sampling date. Additional parameters included: animal unit
days elapsed (stocking density X days in pasture) until plants were grazed,
frequency of utilization derived from a 10-plant pace transect at each sampling site,
and an overall estimate of herbage utilization across the pasture.
Standing crop measurements for the pasture were acquired by clipping 1, 1-
m2 plot near each of the 30-paired plots. Standing crop data were collected 1 day
26 prior to livestock turn out and immediately after the cattle exited the pasture. The
difference between initial and final clipping was used to characterize the level of
herbage utilization within year.
A second index of utilization was determined every 4th day of the grazing
periods. A random direction of travel was chosen from each designated shrub and a
10-pace transect was conducted. At each pace, we scored the nearest perennial
grass as grazed or un-grazed. This data indexed the progression of herbage
utilization across the study pasture over time (e.g. 8 plants grazed out of 10 = 80%
grazed).
Data Analysis
Trial 1
Plant position effects on grazing
Analysis of variance (Montgomery 1991) was used to test the null
hypothesis that foraging behavior was independent of plant location over time. Data
were analyzed using a repeated measures analysis of variance with 4 blocks
(pastures, n = 4, df = 3) and 2 treatments, or plant positions (under-canopy or
interspace, n = 2, df = 1), and 9 sampling days (n = 9, df = 8) as a repeated factor.
The response variable was the number of plants, by position, that were grazed
within a block on each sampling day of the trial. Treatment effects were tested with
the block X treatment error term (df = 5). Day effects and the day X treatment
interaction were tested with the residual error term (df = 10). Model and treatment

27 effects were considered significant at P ≤ 0.05. If significant main or interaction
effects were found, mean separations at the appropriate level were accomplished
with the Least Significant Difference Means (LS Means) (SAS 1999) procedure at α
= 0.10. Analyses were conducted for the pooled data across the 2 sampling seasons
and if year was significant separate analyses were conducted for each year.
The model used in analysis of variance for plant position effects on grazing
occurrence was:
Formula 1:
Grazed = β0 + β1Year + β2Location + β3Day + β4Location x Day + β5Year x Location + β6Year x Day + β7Year x Location x Day.
Shrub morphology effects on under-canopy grazing
The relationship between shrub morphology and grazing of under-canopy
grasses was examined using logistic and step-wise regression (SAS 1999) testing
the null hypothesis that shrub morphology does not influence cattle use of under-
canopy grasses. Individual shrubs and associated grass tussocks were considered
experimental units. Logistic regression was used to model end-of-trial grazing
scores (0 or 1) for under-story grasses based on shrub morphology variables (i.e.
height, elliptical crown area, volume, and angle of accessibility). Significance was
accepted at P ≤ 0.05. Analyses were conducted for the pooled data across the 2
sampling seasons and if year was significant separate analyses were conducted for
each year.

28
The model used in the logistic regression for shrub morphology effects on
grazing occurrence of under-canopy plants was:
Formula 2:
Under-canopy grazed = β0 + β1year + β2shrub height + β3volume + β4area + β5angle of accessibility.
Visual Obstruction
Repeated measures analysis of variance (Montgomery 1991) was used to test
the null hypothesis that visual obstruction was independent of changes in
herbaceous utilization by cattle over time. Data were analyzed using 4 blocks
(pastures, n = 4, df = 3) with 13 treatments or visual obstruction strata by viewing
position (1 bottom – 13 top of Robel pole) (n = 13, df = 12), and 4 sampling days (n
= 4, df = 3) as a repeated factor. The response variable was visual obstruction,
which was percent obstruction for each stratum within sampling period. Treatment
effects were tested with the block X treatment error term (df = 16). Day effects and
the day X treatment interaction were tested with the residual error term (df = 16).
Model and treatment effects were considered significant at P ≤ 0.05. Analyses were
conducted for the pooled data which included random views (potentially influenced
by other shrubs) and unobstructed views (only affected by the sampled shrub and
intervening herbaceous components) to separate the influence of shrub from
herbaceous components on percent visual obstruction. If location was significant
separate analyses were conducted for each view.
The model used in the analysis of variance for visual obstruction was:
29 Formula 3:
Visual Obstruction = β0 + β1Pasture + β2Utilization + β3Strata + β4Unobstructed/Random Location + β5Pasture x Utilization + β6Pasture x Strata + β7Utilization x Strata + β 8Fixed/Random x Pasture + β9Fixed/Random x Utilization + β10Fixed/Random X Strata + β11Pasture x Utilization x Strata + β12Fixed/Random x Pasture x Utilization x Strata.
Trial 2
Grazing preference for interspace/under-canopy tussocks was determined by
visual inspection of life-test and survival regression analyses of under-canopy and
interspace plants until the end of the trial (Cox and Oakes 1984). The life-test
procedure allowed for a comparison of survival curves between stocking rates and
tussock locations. Survival regression analysis provided a method to analyze plants
that were not grazed by the end of the trial in which these subjects could be
censored and analyzed with the grazed times (Cox and Oakes 1984). The Cox
proportional hazards model (survival regression) was used to evaluate the effect of
explanatory variables on survival times of plants and to test the null hypothesis that
geo-physical/environmental variables and stocking rates do not influence grazing
selection. Backward elimination was then used on the survival regression analysis to
identify important prognostic factors from the large number of explanatory
variables. Day grazed for both under-canopy and interspace plants functioned as the
response variable and was analyzed using presence (1) or absence (0) of grazing as
an indicator variable. Independent explanatory variables included: angle of
accessibility, canopy area, canopy volume, shrub height, elevation, slope, aspect,

30 horizontal proximity of stock water, elevation relative to water, standing crop
measures, end-of-trial pasture utilization, mean rate of utilization for each site
derived from changes of pace transect scores across time, and animal unit days
elapsed until a plant was grazed. Data were pooled and analyzed across all years and
locations to assess the predictive utility of the models among a variety of
environments and stocking rates. If year or location were significant, separate
analyses were conducted. Statistical significance was accepted at P≤ 0.1. Appendix
1 outlines the statistical design for trial 2.
The regression analysis of the survival data based on the Cox proportional
hazards model was:
Formula 4:
Day Grazed * Grazed (0) = β0 + β1Location + β2Angle of accessibility+ β3Shrub height + β4Shrub area + β5Shrub volume + β6Slope + β7Aspect + β8Elevation + β9Water elevation + β10Distance from water + β11Production + β12Pasture utilization + β13Utilization index + β14AUDays
RESULTS AND DISCUSSION
Trial 1
In 2003, precipitation for the calendar year was 24.8 cm (93% of the 40 year
average) (NOAA 2003) and initial above ground herbaceous production was 182 kg
(dry matter)/ha ± 2.76. In 2004, precipitation for the calendar year was 17.2 cm
(64% of the 40 year average) (NOAA 2004) and above ground herbaceous
production was 103 kg (dry matter)/ha ± 1.77. Sagebrush canopy cover and density

31 for the site was 17.1% ± 0.3 and 3209 ± 36.6 plants/hectare, respectively.
Herbaceous cover for the site was 9.0% ± 0.01 (Appendix 3).
Utilization
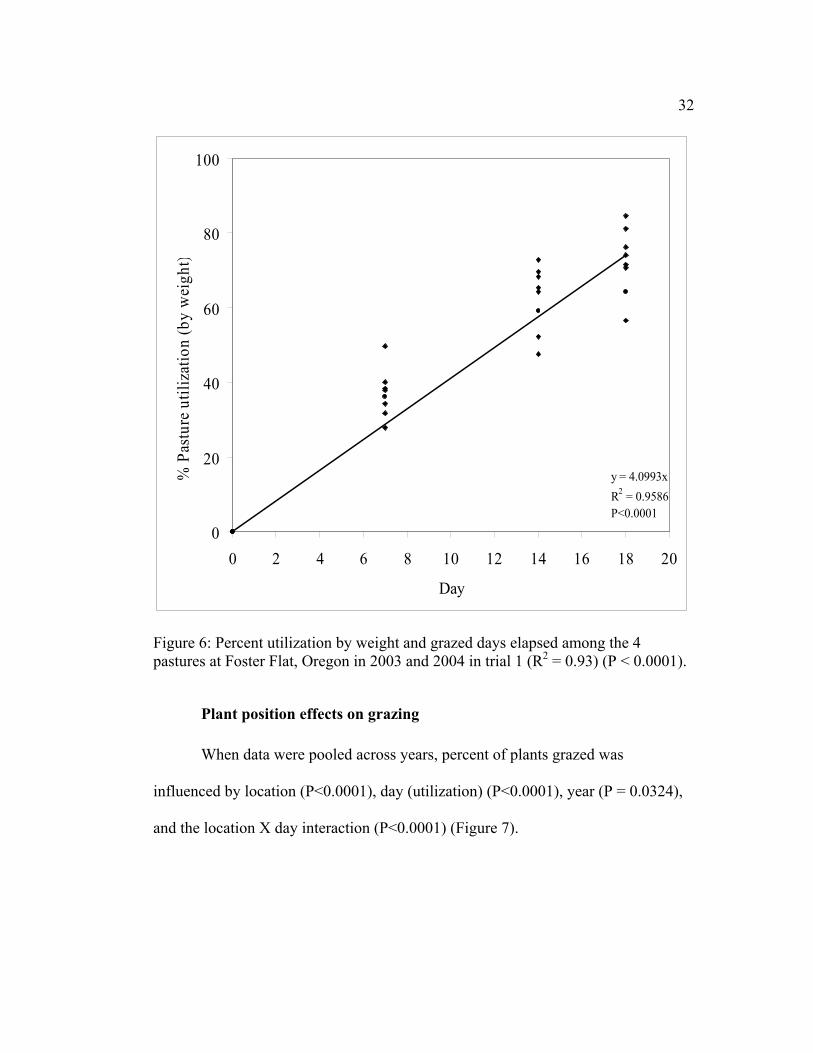
Herbage utilization increased in a linear fashion over time and was similar
across both pastures and years (R2 = 0.93). Livestock were removed from the
pastures at approximately the 75% ± 1.35 utilization level in both years (Figure 6).
32
y = 4.0993xR2 = 0.9586P<0.0001
0
20
40
60
80
100
0 2 4 6 8 10 12 14 16 18 20
Day
% P
astu
re u
tiliz
atio
n (b
y w
eigh
t)
Figure 6: Percent utilization by weight and grazed days elapsed among the 4 pastures at Foster Flat, Oregon in 2003 and 2004 in trial 1 (R2 = 0.93) (P < 0.0001).
Plant position effects on grazing
When data were pooled across years, percent of plants grazed was
influenced by location (P<0.0001), day (utilization) (P<0.0001), year (P = 0.0324),
and the location X day interaction (P<0.0001) (Figure 7).
33
0
20
40
60
80
100
120
0 20 35 50 70
% Forage utilization (by weight)
% G
raze
d
2003 Interspace plants 2004 Interspace plants2004 Under-canopy plants 2003 Under-canopy plants
Figure 7: Percent of interspace and under-canopy plants grazed across pasture utilization for 2003 and 2004 at Foster Flat, Oregon for trial 1.
Since year had an effect on observed forage selection patterns (P = 0.0324)
years were analyzed separately. Livestock demonstrated a preference for plant
location (2003: P<0.0001, 2004: P<0.0001) and preference for foraging location
changed as pasture utilization increased (2003: P<0.0001, 2004: P<0.0001). In
2003, 100% (n = 120) of the interspace plants were grazed and 70% ± 1.2 (n = 80)
of the under-canopy plants were grazed when the trial ended. Mean forage
utilization was 77% ± 1.8 at the end of the trial (Figure 8). In 2004, 100% (n = 120)

34 of the interspace plants were grazed and 62.5% ± 0.2 (n = 75) of the under-canopy
plants were grazed when the trial ended. Mean herbage utilization was 71% ± 1.1 at
the end of the trial (Figure 7).
Year effects may be partially explained by the fact that herbage production
was different between the 2 years (182 kg/ha vs. 103 kg/ha). This disparity may
have affected forage selection patterns between years to some degree. Additionally,
in 2003, livestock were taken from a habitat similar to Foster Flat, while in 2004
livestock were moved from a more productive meadow hay pasture. Forage
selection patterns may have also been influenced by previous grazing experiences
potentially contributing to a year effect. We believe that statistical differences in
foraging patterns between years had minimal biological significance given that
inflection points of the response curves were similar between years (Figures 7).
The data suggest a threshold beyond which cattle shift forage selection from
more accessible interspace plants to under-canopy plants. For both years this
threshold occurred at approximately 35% herbage utilization (Figure 7). At this
inflection point the slope of the relationship between grazing frequency and pasture
utilization increased for under-canopy and decreased for interspace plants. At the
35% herbage utilization level, available forage in the interspaces was probably
becoming limited because 70-90% of those plants were grazed. Our interpretation of
the location by day interaction (P < 0.0001) is that animals began to show
preference for under-canopy plants by about day 6 of the trials. These data suggest
that at moderate levels of utilization (<35%) grazing would have negligible impacts
35 on under-canopy grasses, and by extension would have minimal effects on under
canopy cover because foraging was largely limited to interspace plants.
Shrub morphology effects on under-canopy grazing
For pooled analyses (2003 and 2004), the likelihood of grazing under-
canopy plants was associated positively with angle of accessibility (P<0.0001, β =
0.046) and results were similar between years (P = 0.3122). No other shrub
morphology variables contributed to the likelihood of under-canopy grazing (P >
0.05). The mean angle of accessibility for shrubs within the Foster Flat environment
was 68.5° ± 0.3. Classification table output indicated that the logistic regression
equation correctly classified plants as grazed or not grazed 65% of the time (i.e. of
47 plants not grazed our model successfully assigned 30 plants to the correct
category and 17 were incorrectly assigned a grazed score. Similarly, of 193 plants
that were grazed, the model was correct for 125 shrubs and erroneous in 68
instances) (Table 1).
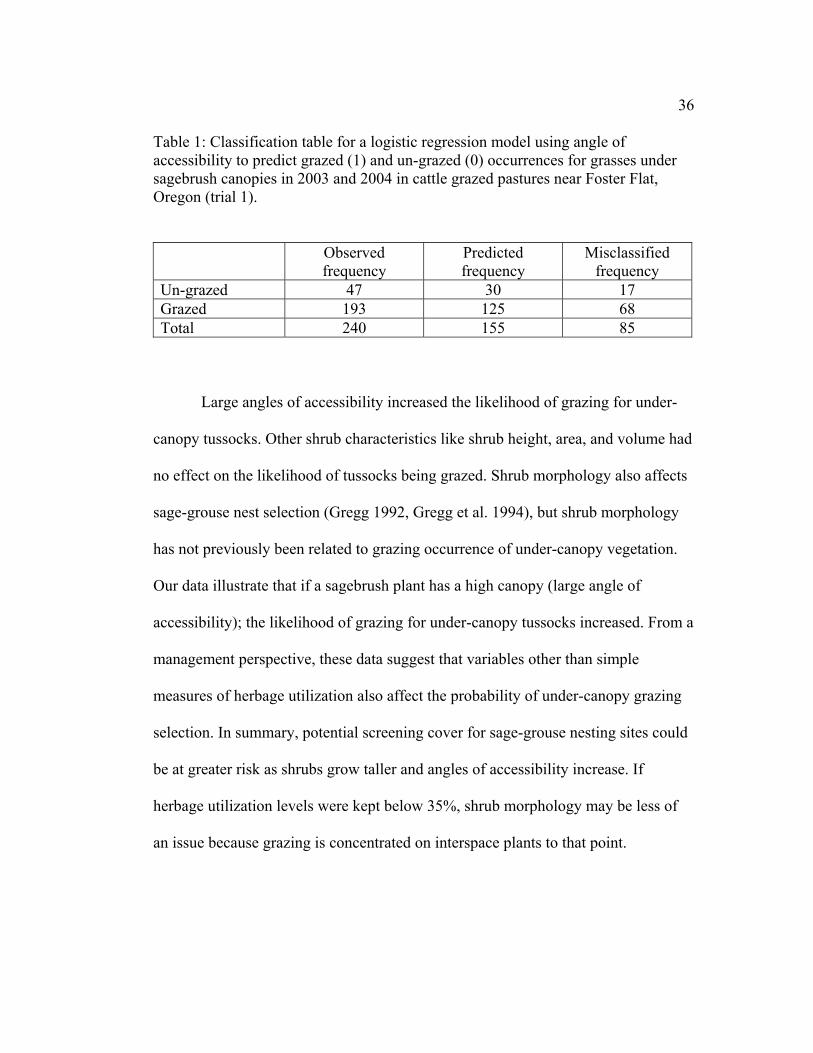
36 Table 1: Classification table for a logistic regression model using angle of accessibility to predict grazed (1) and un-grazed (0) occurrences for grasses under sagebrush canopies in 2003 and 2004 in cattle grazed pastures near Foster Flat, Oregon (trial 1). Observed
frequency Predicted frequency
Misclassified frequency
Un-grazed 47 30 17 Grazed 193 125 68 Total 240 155 85
Large angles of accessibility increased the likelihood of grazing for under-
canopy tussocks. Other shrub characteristics like shrub height, area, and volume had
no effect on the likelihood of tussocks being grazed. Shrub morphology also affects
sage-grouse nest selection (Gregg 1992, Gregg et al. 1994), but shrub morphology
has not previously been related to grazing occurrence of under-canopy vegetation.
Our data illustrate that if a sagebrush plant has a high canopy (large angle of
accessibility); the likelihood of grazing for under-canopy tussocks increased. From a
management perspective, these data suggest that variables other than simple
measures of herbage utilization also affect the probability of under-canopy grazing
selection. In summary, potential screening cover for sage-grouse nesting sites could
be at greater risk as shrubs grow taller and angles of accessibility increase. If
herbage utilization levels were kept below 35%, shrub morphology may be less of
an issue because grazing is concentrated on interspace plants to that point.
37
Visual Obstruction
Analysis of the pooled data (both unobstructed and random locations kept in
the model) indicated that visual obstruction varied by location (P<0.0001).
Accordingly, data were analyzed separately. Results of the location analyses suggest
visual obstruction was affected by pasture (P<0.0001 unobstructed, P<0.0001
random), strata (P<0.0001 unobstructed, P<0.0001 random), and herbage utilization
(P<0.0001 unobstructed, P<0.0001 random) main effects, with a pasture X strata
(P<0.0001 unobstructed, P<0.0001 random,) interaction. As utilization increased
there was no interaction with strata (P = 0.9995 unobstructed, P = 0.9995 random)
suggesting that all strata were affected equally over time when viewed from either
position (Figure 8 and 9).
The lowermost 4 strata (totaling 30cm) included herbaceous inputs from
grasses, forbs, standing litter, and shrubs, and visual obstruction ranged from 30-
50% for both locations. We expected a decrease in obstruction measures in the
lower strata as herbage utilization increased, however, the magnitude of change was
similar across all strata, however, as our trial advanced. Sagebrush obviously
contributed the majority of screening for the upper strata, which ranged from 10-
20% visual obstruction. Appendix 2 outlines changes in percent visual obstruction
across the 4 sampling dates and as herbage utilization levels increased across time,
the changes in visual obstruction decreased consistently across all strata from both
viewing positions. Observed differences between viewing locations could be related
to the influence of additional shrub contributions. The unobstructed view eliminated

38 the effects of additional shrubs on visual obstruction; as a result, percent visual
obstruction was lower in the middle strata compared to the random view (Figures 8
and 9).
0
10
20
30
40
50
60
70
1 2 3 4 5 6 7 8 9 10 11 12 13
Visual obstruction strata
% O
bstru
ctio
n
Day 1
Day 7
Day 14
Day 18
Figure 8: Percent visual obstruction for the unobstructed view for the 4 sampling times across the 13 strata (1 being the bottom and 13 being the top) of the Robel pole at Foster Flat, Oregon in 2004.

39
0
10
20
30
40
50
60
70
1 2 3 4 5 6 7 8 9 10 11 12 13
Visual obstruction strata
% O
bstru
cted
Day 1Day 7Day 14Day 18
Figure 9: Percent visual obstruction for the random view for the 4 sampling times across the 13 strata (1 being the bottom and 13 being the top) of the Robel pole at Foster Flat, Oregon in 2004.
Our hypothesis was that we would experience a strata X sampling time
interaction as the herbaceous level was grazed and trampled by the cows proved to
be incorrect. This interaction did not occur for either location (P = 0.9995
unobstructed, P = 0.9995 random). Possible explanations include 1.) ephemeral leaf
fall from sagebrush and the grazing removal of the herbaceous component
coincided, 2.) the physical and foraging activities of cattle affected all strata equally,
or perhaps some combination of these factors. Additionally, the fact that we
removed 75% of standing crop and affected only a 5% decrease in lower level

40 obstruction suggests that sagebrush constituted the bulk of the obstructing cover in
the Foster Flat environment.
In some environments intervening herbaceous vegetation may be critical for
providing nesting cover; however, the influences of herbaceous vegetation at the
Foster Flat environment did not appear to be as valuable to screening cover as
sagebrush. The relative importance of sagebrush and associated herbage may differ
on more productive sites if herbaceous vegetation provides a higher proportion of
screening cover (relative to the contribution of sagebrush).
Trial 2
In 2003, precipitation for the calendar year was 18.0cm (67% of the 40-year
average) and standing crop averaged 383.8 kg (dry matter)/ha ± 1.1. In 2004,
precipitation for the calendar year was 22.5cm (84% of the 40-year average) and
standing crop averaged 401.3 kg (dry matter)/ha ± 0.9. In 2003, the mean herbage
utilization as indexed by standing crop at the end of trial was 66% with a total 288
AUM’s. In 2004, the mean herbage utilization by weight was 45% with a total of
144 AUM’s. In 2003, a total of 22 under-canopy plants and 29 interspace plants
were grazed compared to 13 under-canopy plants and 23 interspace plants grazed in
2004.
Life-test analyses indicated forage selection patterns varied between years,
perhaps due to between-year disparity in stocking density (Wilcoxon chi-squared P
value = 0.0002) (Figure 10). These between year differences suggest that stocking
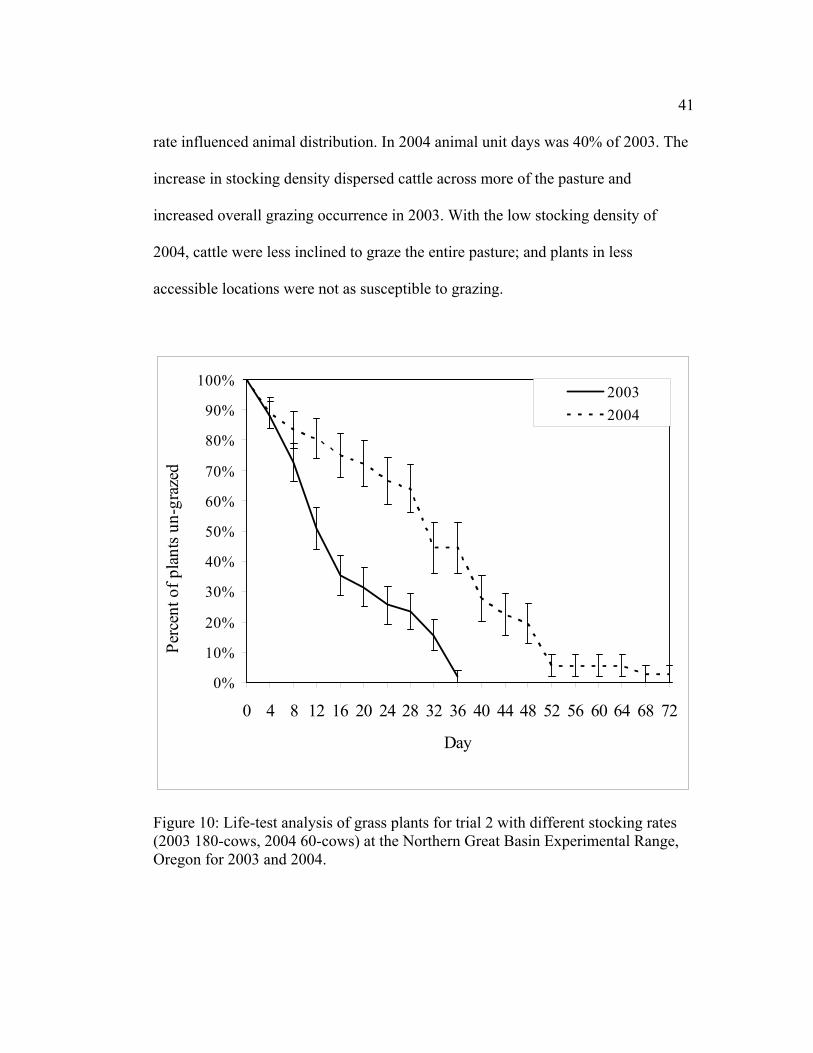
41 rate influenced animal distribution. In 2004 animal unit days was 40% of 2003. The
increase in stocking density dispersed cattle across more of the pasture and
increased overall grazing occurrence in 2003. With the low stocking density of
2004, cattle were less inclined to graze the entire pasture; and plants in less
accessible locations were not as susceptible to grazing.
0%
10%
20%
30%
40%
50%
60%
70%
80%
90%
100%
0 4 8 12 16 20 24 28 32 36 40 44 48 52 56 60 64 68 72
Day
Perc
ent o
f pla
nts u
n-gr
azed
20032004
Figure 10: Life-test analysis of grass plants for trial 2 with different stocking rates (2003 180-cows, 2004 60-cows) at the Northern Great Basin Experimental Range, Oregon for 2003 and 2004.

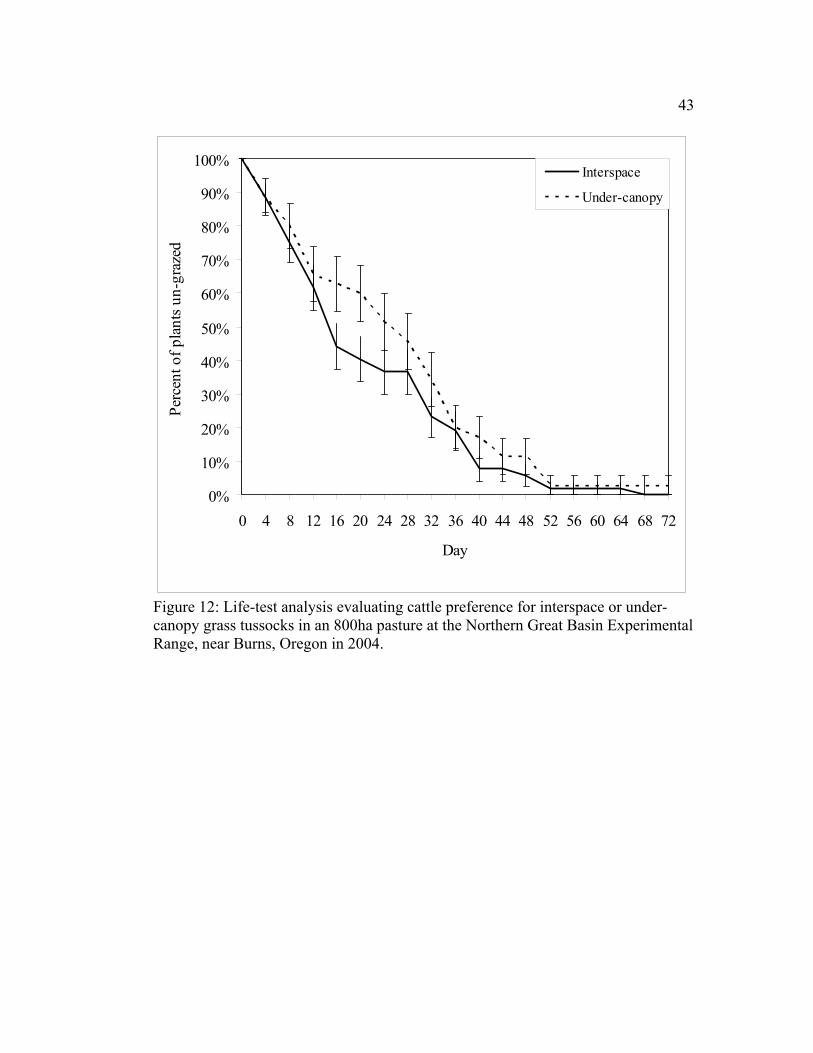
42 Life-test analyses indicated plant location relative to sagebrush canopies
influenced forage selection in 2003 (2003-Wilcoxon chi-squared P = 0.0767) but not
in 2004 when fewer cattle were present (2004-Wilcoxon chi-squared P = 0.4672)
(Figure 11 and Figure 12) or when years were pooled (Wilcoxon chi-squared P
value = 0.2856) (Figure 13).
0%
10%
20%
30%
40%
50%
60%
70%
80%
90%
100%
0 4 8 12 16 20 24 28 32 36 40
Day
Per
cent
of p
lant
s un-
graz
ed
Interspace
Under-canopy
Figure 11: Life-test analysis evaluating cattle preference for interspace or under-canopy grass tussocks in an 800ha pasture on the Northern Great Basin Experimental Range, near Burns, Oregon in 2003.
43
0%
10%
20%
30%
40%
50%
60%
70%
80%
90%
100%
0 4 8 12 16 20 24 28 32 36 40 44 48 52 56 60 64 68 72
Day
Perc
ent o
f pla
nts u
n-gr
azed
Interspace
Under-canopy
Figure 12: Life-test analysis evaluating cattle preference for interspace or under-canopy grass tussocks in an 800ha pasture at the Northern Great Basin Experimental Range, near Burns, Oregon in 2004.

44
0%
10%
20%
30%
40%
50%
60%
70%
80%
90%
100%
0 4 8 12 16 20 24 28 32 36 40 44 48 52 56 60 64 68 72
Day
Perc
ent o
f pla
nts u
n-gr
azed
InterspaceUnder-canopy
Figure 13: Life-test analysis evaluating cattle preference for interspace or under-canopy grass tussocks in an 800ha pasture on the Northern Great Basin Experimental Range, near Burns, Oregon with pooled data from 2003 and 2004. Forage patterns were probably more influenced by geospatial and
environmental variables in 2004 with fewer cattle present than in 2003.
Interspace/under-canopy patterns observed during trial 1 were not as evident in trial
2. Environmental influences may have a greater influence on stock distribution and
foraging patterns at landscape scales than under-canopy/interspace positions of
grass tussocks in more intensively grazed environments. Results may have differed
if our sample size was larger and observations taken more frequently. Our small
45 sample size of 30 locations within a 800 hectare area may not have had sufficient
resolution to consistently detect disparities in forage selection patterns.
When data were pooled across years, survival regression analysis indicated
slope (P = 0.04, β = -0.03), distance from water (P = 0.07, β = -0.0006), and
stocking density (P = 0.0009, β = -0.0003) affected whether a grass would be grazed
whereas year had no effect (P = 0.37). As slope and distance from water increased
the likelihood of being grazed decreased. As animal unit days (stocking density)
increased the likelihood of being grazed increased.
Though tussock location was not significant in the regression analysis (P =
0.29), further investigation was warranted to determine if geophysical, shrub
morphology, or stocking density influenced forage selection at larger scales.
Separate analysis on interspaces and under-canopy tussocks indicated stocking
density (animal unit days) was correlated positively with the likelihood that under-
canopy tussocks would be grazed (P=0.01, β = 0.0003) in both years. Distance from
water was correlated negatively with grazing occurrence of interspace plants
(P<0.0001, β = -0.001) in both years. These findings suggest that as herbage
availability decreases in the interspaces under-canopy plants become more likely to
be grazed.
Herbage utilization by cattle in large pastures containing sage-grouse nesting
habitat is probably affected by both stocking density and distance from water. When
years were analyzed separately, no explanatory variables were significant for either
under-canopy or interspace tussocks. With pooled data, however, degrees of
46 freedom were doubled and the range of stocking rate indices was expanded. Both
effects strengthened analyses and our explanatory powers.
Because pastures were not replicated within years, the application of those
findings to other environments is somewhat limited. Results do illustrate, however,
that several factors influence the spatial grazing patterns of cattle at landscape
scales. The contributing variables in this study included: slope, distance from water,
and stocking density, all of which have been previously related to cattle distribution,
(Gillen et al. 1984, Ganskopp 2001).
The difference in forage selection patterns between our smaller pastures and
the large-pasture study illustrates that several variables must be acknowledged when
evaluating cattle grazing impacts on potential sage-grouse nesting habitat. Because
cattle are not encouraged to travel extreme distances to forage when stocking rates
were moderate, distant vegetation may be essentially immune to grazing. With
increased stocking rates or duration of grazing, however, the likelihood of herbage
removal envelops more of the pasture. Water placement may also be used to alter
grazing impacts across larger pastures (Ganskopp 2001) and shift cattle use to less
critical portions of the landscape.
CONCLUSIONS
There is a lack of information directly relating livestock grazing with sage-
grouse declines and/or habitat deterioration. Previous to this study, livestock forage
selection patterns had not been evaluated within sagebrush communities. It is known
47 that herbaceous cover can positively affect sage-grouse nesting success by providing
visual, scent, and physical barriers to nest predation (Gregg 1992, Gregg et al.
1994). Removal of herbage has been assumed to decrease screening cover and
increase nest vulnerability to predation. Our results suggest that cattle-use of under-
canopy tussocks was minimal until standing crop utilization exceeded about 35%.
We saw a cattle preference for interspace plants until a large proportion of those
plants were grazed and cattle began to seek vegetation beneath sagebrush canopies.
That being the case, management that restricts herbage utilization to less than 35%,
could be used to help sustain nest-screening cover beneath sagebrush for our site.
The mechanism responsible for the change in forage selection from interspace to
under-canopy bunchgrasses was related to the limited availability of forage in the
interspaces. Once these plants become limited cattle are forced to seek out
vegetation under the canopies of sagebrush. This utilization threshold will vary and
is most likely dependent upon sagebrush density, sagebrush arrangement,
bunchgrass structure, and forage production.
Sagebrush morphology, primarily through its affect on angle of accessibility,
contributed to whether a grass tussock would be grazed or un-grazed. As angles
increased the vulnerability of under-canopy grasses increased. Because angle of
accessibility is related to sagebrush structure, managers should perhaps encourage
development of sagebrush with spreading umbrella like canopies. If indeed sage-
grouse select nest sites with low angles of accessibility grazing would be less likely
to affect under-canopy vegetation. Research is needed to relate nest site selection to

48 indices of sagebrush morphology, plus methods to increase the development of
sagebrush with umbrella like canopies.
In our study, the bulk of visual obstruction was provided by sagebrush.
Changes in visual obstruction occurred in all strata as herbage utilization
progressed. This suggests that sagebrush was the most important screening
vegetation for potential nest sites within our environment. Our data imply that
forage utilization levels approaching 70% had minimal effects on screening cover at
our site. Past efforts suggested the herbaceous component was an important source
of screening cover and its presence enhanced nesting success (Gregg et al. 1994).
We suggest, however, that in arid locations sagebrush constitutes the bulk of the
screening vegetation.
Forage selection patterns in our large pasture trial did not precisely mimic
those seen with our smaller scale grazing trial. However, the large pasture trial
supports past research on various facets of livestock distribution and variables
affecting forage selection. Slope, distance from water, and animal unit days
(stocking density) most affected forage selection at the landscape scales in our
study. Distance from water influenced the likelihood of interspace forage selection
as plants were less likely to be grazed if they were at greater distances from water.
Increased stocking intensity elevated the likelihood of under-canopy forage
selection. These data suggest that by understanding the influences of environmental
variability and management factors, the effects of livestock herbivory can
potentially be reduced. Water location is critical with cattle remaining within about
49 a 1.6-km radius of water. By manipulating access to water locations, managers can
to some degree control use of herbaceous vegetation in expansive pastures.
An understanding of various aspects of livestock grazing behavior as they
respond to forage and landscape characteristics should allow us to minimize grazing
affects on known sage-grouse nesting habitat. Moderate levels of utilization
combined with effective distribution tools will help reduce grazing impacts.
BIBLIOGRAPHY
Bailey, D.W., J.E. Gross, E.A. Laca, L.R. Rittenhouse, M.B. Coughenour, D.M. Swift, and P.L. Sims. 1996. Mechanisms that result in large herbivore grazing distribution patterns. Journal of Range Management. 49:386-400. Bork, E.W., N.E. West, and J.W. Walker. 1998. Cover components on long-term seasonal sheep grazing treatments in three-tip sagebrush steppe. Journal of Range Management. 51:293-300. Braun, C.E., T. Britt, and R.O. Wallestad. 1977. Guidelines for maintenance of sage grouse habitats. Wildlife Society Bulletin. 5:99-106. Braun, C.E. and T.D. Beck. 1996. Effect of research on sage-grouse management. Transactions of the North American wildlife and natural resources conference. 61:429-436. Bunnell, K.D., J.T. Flinders, D.L. Mitchell, and J.H. Warder. 2004. Occupied and unoccupied sage grouse habitat in Strawberry Valley Utah. Journal of Range Management. 57:524-531. Canfield, R. H. 1941. Application of the line intercept method in sampling range vegetation. Journal of Forestry 39:388-394. Connelly, J.W., W.L. Wakkinen, A.P. Apa, and K.P Reese. 1991. Sage-grouse use of nest sites in Southeastern Idaho. Journal of Wildlife Management. 55:521-524. Connelly, J.W., M.A. Schroeder, A.R. Sands, and C.E. Braun. 2000. Guidelines for management of sage-grouse populations and habitat. Wildlife Society Bulletin. 28:967-985.
50 Cox, D.R. and D. Oakes. 1984. Analysis of survival data. London: Chapman and Hall. Crawford, J.A., R.A. Olson, N.E. West, J.C. Mosley, M.A. Schroeder, T.D. Whitson, R.F. Miller, M.A. Gregg, and C.S. Boyd. 2004. Ecology and management of sage-grouse and sage-grouse habitat. Journal of Range Management. 57:2-19. Delong, A.K., J.A. Crawford, and D.C. Delong Jr. 1995. Relationships between vegetational structure and predation of artificial sage grouse nests. Journal of Wildlife Management. 59:88-92. Fuhlendorf, S.D, and D.M. Engle. 2001. Restoring heterogeneity on rangelands: Ecosystem management based on evolutionary grazing patterns. Bioscience. 51:625-632. Ganskopp, D.G. Angell, R. and J. Rose. 1992. Response of cattle to cured reproductive stems in a caespitose grass. Journal of Range Management. 45:401-404. Ganskopp, D.G., and J. Rose. 1992. Bunchgrass basal area affects selection of plants by cattle. Journal of Range Management. 45:538-541. Ganskopp, D.G. 2001. Manipulating cattle distribution with salt and water in large arid-land pastures: A GIS/GPS assessment. Applied Animal Behavior Science. 73:251-262. Gillen, R.L., W.L. Krueger, and R.F. Miller. 1984. Cattle distribution on mountain rangeland in northeastern Oregon. Journal of Range Management. 37:549-553. Gregg, M.A. 1992. Habitat use and selection of nesting habitat by sage-grouse in Oregon. M.S. thesis. Oregon State University, Corvallis, OR. Gregg, M.A., J.A. Crawford, M.S. Drut, and A.K. Delong. 1994. Vegetational cover and predation of sage grouse nests in Oregon. Journal of Wildlife Management. 58:162-166. Kie J.B. and B.B. Boroski. 1996. Cattle distribution habitats and diets in the Sierra Nevada’s of California. Journal of Range Management. 49:482-488. Klebenow, D.A. 1970. Sage grouse versus sagebrush control in Idaho. Journal of Range Management. 23:396-400.

51 Laycock, W., A.D. Loper, F.W. Obermiller, L. Smith, S.R. Swason, P.J. Urness and M. Vavra. 1996. Grazing on public lands. Council for Agriculture science and technology task force. Rep. No. 129. Ames, IA. Miller, R.F., T. Svejcar, and N.E. West. 1994. Implications of livestock grazing in the Intermountain sagebrush region: plant composition, p.101-146. In: M. Vavra, W.A. Laycock, and R.D. Pieper (eds.). Ecological Implications of Livestock Herbivory in the Western Society For Range Management. Denver, Colo. N.O.A.A. (National Oceanic and Atmospheric Administration). 2003-2004. Climatological data annual summary, Oregon. Owens, M.L., K.L. Launchbaugh, and J.W. Holloway. 1991. Pasture characteristics affecting spatial distribution of utilization by cattle in mixed brush communities. Journal of Range Management. 44:118-123. Pinchak, W.E., M.A. Smith, R.H. Hart, and J.W. Waggoner Jr. 1991. Beef cattle distribution patterns on foothill range. Journal of Range Management. 44:267-275. Robel, R.J., J.N. Briggs, A.D. Dayton, and L.C. Hulbert. 1970. Relationships between visual obstruction measurements and weight of grassland vegetation. Journal of Range Management. 23:295-297. SAS Institute Inc. 1999. SAS procedures guide, release 8.0. Cary, N.C. Senft, R.L., L.R. Rittenhouse, and R.G. Woodmeasee. 1985. Factors influencing patterns of cattle grazing behavior on shortgrass steppe. Journal of Range Management. 38:82-95. Sveum, C.M., D. Edge, and J.A. Crawford. 1998. Nesting habitat selection by sage grouse in south-central Washington. Journal of Range Management. 51:265-269. Willis, M. 2004. Personal Communication. Young, J.A., R.A. Evans, and J. Major. 1972. Alien plants in the great basin. Journal of Range Management. 25:194-201. Young, J.A., R.A. Evans and P.T. Tueler. 1976. Great Basin plant communities-pristine and grazed. Pages 187-215 In R. Elston and P. Headrick (eds.) Holocene environmental change in the Great Basin. Nevada Archeology Survey. Research Paper No. 6, University of Nevada, Reno. 5:194-201.

52 CHAPTER 3:
GENERAL CONCLUSION
The objective of this research was to provide needed information about
livestock grazing effects on sage-grouse nesting habitat. There is little information
detailing effects of livestock grazing on sage-grouse population dynamics and their
associated habitat. Because nesting success is a key component for recruitment of
sage-grouse (Braun and Beck 1996), and nest success has been positively linked
with herbaceous cover (Gregg et al. 1994), a study documenting forage extraction
patterns of cattle in sagebrush communities was needed. Our findings suggested that
cattle would have little effect on under-canopy nesting cover in arid sites if
conservative cattle management is employed. Suggested practices include grazing to
moderate levels of utilization and using cattle distribution tools such as
manipulating watering locations to retard removal of screening herbaceous cover in
critical sage-grouse nesting habitat.
Our results suggest that cattle use of under-story plants was minimal until
pasture herbage utilization exceeded about 35% utilization (by weight). Cattle
exhibited an initial preference for interspace plants until forage availability
decreased in those areas. Subsequently cattle began to seek herbage directly under
sagebrush canopies. Unmanaged grazing could therefore decrease screening cover at
potential nest sites. If herbage utilization does not exceed 35%, under-canopy
vegetation should largely be maintained. These results can help land managers

53 develop grazing plans that minimize cattle impacts on herbaceous cover critical to
nesting sage-grouse and other ground nesting birds.
We found shrub morphology, specifically angle of accessibility, affected
forage selection of under-canopy grass tussocks. As angles increased the
vulnerability of under-canopy grass plants increased. Sites beneath sagebrush that
have large angles of accessibility may be more vulnerable to cattle grazing.
Although angle of accessibility is related to sagebrush structure, range and wildlife
managers have not developed any techniques for shaping shrubs. Our findings on
the screening capacity of herbaceous components did not conform with
expectations, as grazing effects were not limited to the lower strata containing the
grasses and forbs. On our sites, the bulk of visual obstruction was provided by
sagebrush, and significant changes in visual obstruction were detected at all height
strata when herbage utilization levels approached 75%, implying that sagebrush
constituted the bulk of screening cover. In arid sites, like our study area, nest
success may be more affected by sagebrush cover than the herbaceous component.
In our smaller pasture study there was a distinct preference by cattle for
interspace tussocks at low to moderate utilization levels. Patterns of herbage
utilization in our large pasture study differed somewhat from this finding. This lack
of parity between trials may have been related to our small sample size of 30
locations within an 800 hectare pasture, diminishing our capacity to detect forage
selection patterns. A more frequent sampling schedule of perhaps every second day
might have helped by increasing degrees of freedom.

54 Even though livestock did not display a consistent preference for tussock
location relative to sagebrush canopies in the 800ha pasture, forage selection was
influenced by several landscape variables. These findings agreed with other efforts
describing livestock distribution and landscape characteristics affecting habitat use
and foraging behavior. Slope, distance from water, and animal unit days (stocking
intensity) all affected distribution and grazing behavior at landscape scales. Distance
from water was linked with the likelihood of foraging on interspace tussocks.
Grazing was obviously less likely when tussocks were further from water. Stocking
density and duration were positively correlated with the use of under-canopy
tussocks.
Of these landscape characteristics, water availability or access to stock water
and stocking intensity fall under the potential control of managers. By controlling
access to water, one could assert a high degree of control over potential cattle
grazing in extensive landscapes. As pasture utilization increases, however, cattle are
forced to seek vegetation further from water. Pairing moderate stocking intensities
with restricted water availability may decrease the distribution of cattle and could
potentially limit utilization in nesting habitat. Significant under-canopy/interspace
foraging patterns were probably not consistently detected in our larger scale study
because of the overriding influence of landscape variables.
Our findings are perhaps most relevant to the arid extremes of sage-grouse
habitat, and results of similar studies might vary substantially in more mesic or
moist environments. While interspace/under-canopy forage selection patterns were

55 clearly evident, there is a need to replicate this study across all of the sagebrush
alliances. Our intensive effort occurred in a Wyoming big sagebrush site, and while
sage-grouse nest within this habitat, mountain big sagebrush sites may be more
preferred by sage-grouse. Shrubs in most instances will most likely provide
significant amounts of screening cover. Sites with higher annual forage production
may be more dependent upon herbaceous screening cover and herbivory may have a
more significant effect.
In closing, there is a need for additional short and long-term studies to
elucidate the effects of herbivory on sage-grouse nest site selection and success.
Future studies should examine effects of livestock presence and their accompanying
herbage utilization patterns on nest site selection and recruitment.

56
BIBLIOGRAPHY
Anderson E.W., Borman M.M, and W.C. Krueger. 1998. The ecological provinces of Oregon. Oregon agricultural experimental station. Pp. 38-46. Bailey, D.W., J.E. Gross, E.A. Laca, L.R. Rittenhouse, M.B. Coughenour, D.M. Swift, and P.L. Sims. 1996. Mechanisms that result in large herbivore grazing distribution patterns. Journal of Range Management. 49:386-400. Barler, J.R. and C.M. Mickell. 1983. Habitat differences between basin and Wyoming big sagebrush in contiguous population Artemisia tridentate, Utah. Journal of Range Management. 36:450-454. Beck, J.L. and D.L. Mitchell. 2000. Influences of livestock grazing on sage-grouse habitat. Wildlife Society Bulletin. 28:993-1002. Bork, E.W., N.E. West, and J.W. Walker. 1998. Cover components on long-term seasonal sheep grazing treatments in three-tip sagebrush steppe. Journal of Range Management. 51:293-300. Braun, C.E., T. Britt, and R.O. Wallestad. 1977. Guidelines for maintenance of sage grouse habitats. Wildlife Society Bulletin. 5:99-106. Braun, C.E. and T.D. Beck. 1996. Effect of research on sage-grouse management. Transactions of the North American wildlife and natural resources conference. 61:429-436. Bunnell, K.D., J.T. Flinders, D.L. Mitchell, and J.H. Warder. 2004. Occupied and unoccupied sage grouse habitat in Strawberry Valley Utah. Journal of Range Management. 57:524-531. Burkhardt, J.W. 1996. Herbivory in the intermountain West. University of Idaho. Forest, Wildlife and Range Experimental Station Bulletin. 58. Canfield, R. H. 1941. Application of the line intercept method in sampling range vegetation. Journal of Forestry 39:388-394. Connelly, J.W., W.L. Wakkinen, A.P. Apa, and K.P Reese. 1991. Sage-grouse use of nest sites in Southeastern Idaho. Journal of Wildlife Management. 55:521-524. Connelly, J.W. and C.E. Braun. 1997. Long-term changes in sage grouse Centrocercus urophasianus populations in western North America. Wildlife Biology. 3:229-234.
57 Connelly, J.W., M.A. Schroeder, A.R. Sands, and C.E. Braun. 2000. Guidelines for management of sage-grouse populations and habitat. Wildlife Society Bulletin. 28:967-985. Cox, D.R. and D. Oakes. 1984. Analysis of survival data. London: Chapman and Hall. Crawford, J.A., R.A. Olson, N.E. West, J.C. Mosley, M.A. Schroeder, T.D. Whitson, R.F. Miller, M.A. Gregg, and C.S. Boyd. 2004. Ecology and management of sage-grouse and sage-grouse habitat. Journal of Range Management. 57:2-19. Delong, A.K., J.A. Crawford, and D.C. Delong Jr. 1995. Relationships between vegetational structure and predation of artificial sage grouse nests. Journal of Wildlife Management. 59:88-92. Errington, P.L. 1933. The nesting and the life equation of the Wisconsin bobwhite. Wilson Bulletin. 45:122-132. Evans, C.C. 1986. The relationship of cattle grazing to sage-grouse use of meadow habitat in the Sheldon National Wildlife Refuge. Masters thesis. University of Nevada, Reno, NV. Fuhlendorf, S.D, and D.M. Engle. 2001. Restoring heterogeneity on rangelands: Ecosystem management based on evolutionary grazing patterns. Bioscience. 51:625-632. Ganskopp, D.G. Angell, R. and J. Rose. 1992. Response of cattle to cured reproductive stems in a caespitose grass. Journal of Range Management. 45:401-404. Ganskopp, D.G., and J. Rose. 1992. Bunchgrass basal area affects selection of plants by cattle. Journal of Range Management. 45:538-541. Ganskopp, D.G. 2001. Manipulating cattle distribution with salt and water in large arid-land pastures: A GIS/GPS assessment. Applied Animal Behavior Science. 73:251-262. Gardner, R. H., W. M. Kemp, V. S. Kennedy, and J. E. Petersen, editors. 2001. Scaling relations in experimental ecology. Columbia University Press, New York, New York, USA. 352 pp. ISBN 0231114990. Gillen, R.L., W.L. Krueger, and R.F. Miller. 1984. Cattle distribution on mountain rangeland in northeastern Oregon. Journal of Range Management. 37:549-553.

58 Gregg, M.A. 1992. Habitat use and selection of nesting habitat by sage-grouse in Oregon. M.S. thesis. Oregon State University, Corvallis, OR. Gregg, M.A., J.A. Crawford, M.S. Drut, and A.K. Delong. 1994. Vegetational cover and predation of sage grouse nests in Oregon. Journal of Wildlife Management. 58:162-166. Guthery, F.S. 1996. Upland gamebirds. Pages 59-69 in P. R. Krausman, editior. Rangeland wildlife. The society for range management, Denver, CO. USA. Kie J.B. and B.B. Boroski. 1996. Cattle distribution habitats and diets in the Sierra Nevada’s of California. Journal of Range Management. 49:482-488. Klebenow, D.A. 1970. Sage grouse versus sagebrush control in Idaho. Journal of Range Management. 23:396-400. Klebenow, D.A. 1985. Habitat management of sage-grouse in Nevada. World Pheasant Association Journal. 10:34-46. Laycock, W., A.D. Loper, F.W. Obermiller, L. Smith, S.R. Swason, P.J. Urness and M. Vavra. 1996. Grazing on public lands. Council for Agriculture science and technology task force. Rep. No. 129. Ames, IA. Miller, R.F., T. Svejcar, and N.E. West. 1994. Implications of livestock grazing in the Intermountain sagebrush region: plant composition, p.101-146. In: M. Vavra, W.A. Laycock, and R.D. Pieper (eds.). Ecological Implications of Livestock Herbivory in the Western Society For Range Management. Denver, Colo. Miller, R.F. and L.L Eddleman. 2001. Spatial and temporal changes of sage grouse habitat in the sagebrush biome. Oregon State University Agricultural Experiment Station, Technical Bulletin 151. Montgomery, D.C. 1991. Design and analysis of experiments. John Wiley and Sons, New York, N.Y. N.O.A.A. (National Oceanic and Atmospheric Administration). 2003-2004. Climatological data annual summary, Oregon. Owens, M.L., K.L. Launchbaugh, and J.W. Holloway. 1991. Pasture characteristics affecting spatial distribution of utilization by cattle in mixed brush communities. Journal of Range Management. 44:118-123.

59 Paine, L., Undersander, D.J., Sample, D.W., Bartelt, G.A., and T.A. Schatteman. 1996. Cattle trampling of simulated ground nests in rotationally grazed pastures. Journal of Range Management. 49:294-299. Pinchak, W.E., M.A. Smith, R.H. Hart, and J.W. Waggoner Jr. 1991. Beef cattle distribution patterns on foothill range. Journal of Range Management. 44:267-275. Robel, R.J., J.N. Briggs, A.D. Dayton, and L.C. Hulbert. 1970. Relationships between visual obstruction measurements and weight of grassland vegetation. Journal of Range Management. 23:295-297. SAS Institute Inc. 1999. SAS procedures guide, release 8.0. Cary, N.C. Senft, R.L., L.R. Rittenhouse, and R.G. Woodmeasee. 1985. Factors influencing patterns of cattle grazing behavior on shortgrass steppe. Journal of Range Management. 38:82-95. Severson, K.E., and P.J. Urness. 1994. Livestock grazing: A tool to improve wildlife habitat. p232-249. In: M. Vavra, W.A. Laycock, and R.D. Pieper (eds.). Ecological Implications of Livestock Herbivory in the Western Society For Range Management. Denver, Colo. Shumer, M.L. and Anderson J.G. 1986. Gradient analysis of vegetation dominated by 2 subspecies of big sagebrush. Journal of Range Management. 39:1156-1611. Sveum, C.M., D. Edge, and J.A. Crawford. 1998. Nesting habitat selection by sage grouse in south-central Washington. Journal of Range Management. 51:265-269. Watters, M.E., T.L. McLash, C.L. Aldridge, R.M. Brigham. 2002. The effect of vegetation structure on predation of artificial sage-grouse nests. Ecoscience. 9: 314-319. Whisenant, S.G. 1990. Changing fire frequencies on Idaho’s river plains: Ecological and management implications. Pg 4-10 In Proceedings Cheatgrass invasion shrub die-off and other aspects of shrub biology and management. USDA Forest Service Technical Report. 276. Wisdom, M.J., M.M. Rowland, B.C. Wales, M.A. Hemstrom, W.J. Hann, M.G. Raphael, R.S. Holthausen, R.A. Gravenmier, and T.D. Rich. 2002. Modeled effects of sagebrush-steppe restoration on greater sage-grouse in the interior Columbia basin, U.S.A. Conservation Biology. 16:1223-1231. Willis, M. 2004. Personal Communication.

60 Young, J.A., R.A. Evans, and J. Major. 1972. Alien plants in the great basin. Journal of Range Management. 25:194-201. Young, J.A., R.A. Evans and P.T. Tueler. 1976. Great Basin plant communities-pristine and grazed. Pages 187-215 In R. Elston and P. Headrick (eds.) Holocene environmental change in the Great Basin. Nevada Archeology Survey. Research Paper No. 6, University of Nevada, Reno. 5:194-201. Young, J.A. and B.A. Sparks. 1985. Cattle in the cold desert. Utah State University Press, Logan.

61
APPENDICIES
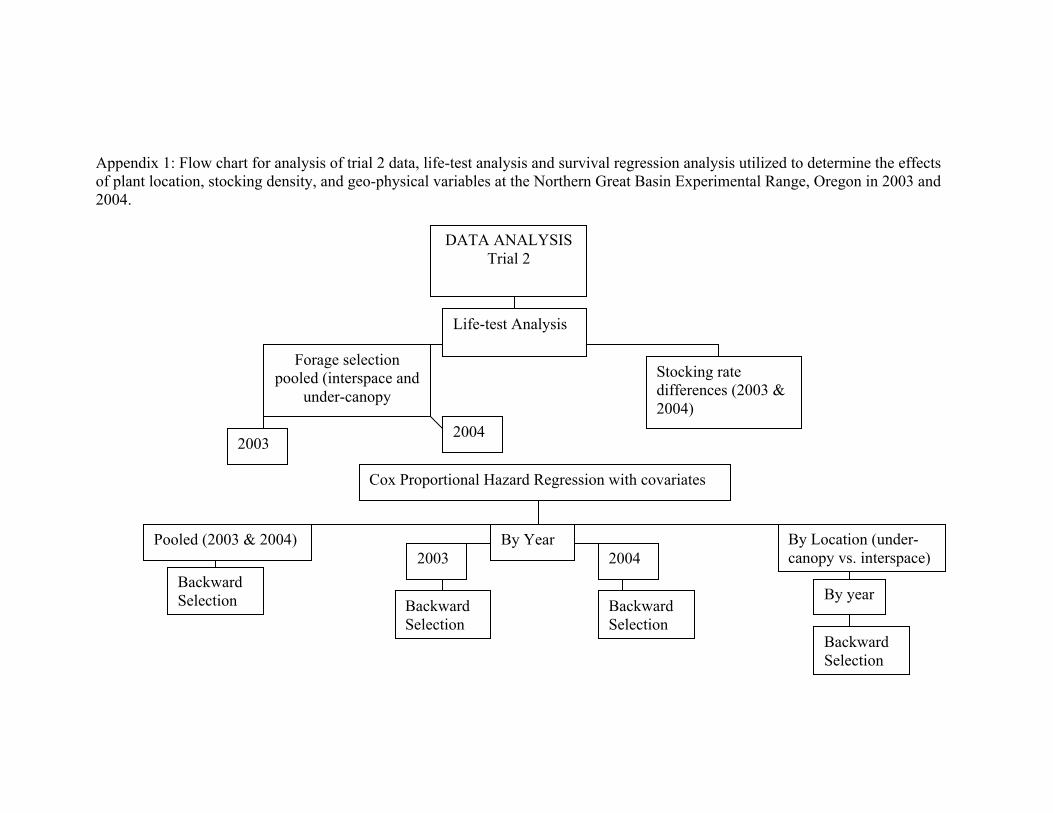
Appendix 1: Flow chart for analysis of trial 2 data, life-test analysis and survival regression analysis utilized to determine the effects of plant location, stocking density, and geo-physical variables at the Northern Great Basin Experimental Range, Oregon in 2003 and 2004.
By Year 2004
Backward Selection
2003
Backward Selection
Backward Selection
By Location (under-canopy vs. interspace)
Stocking rate differences (2003 & 2004)
Life-test Analysis
2004 2003
Forage selection pooled (interspace and
under-canopy
DATA ANALYSIS Trial 2
Cox Proportional Hazard Regression with covariates
Pooled (2003 & 2004)
Backward Selection
By year
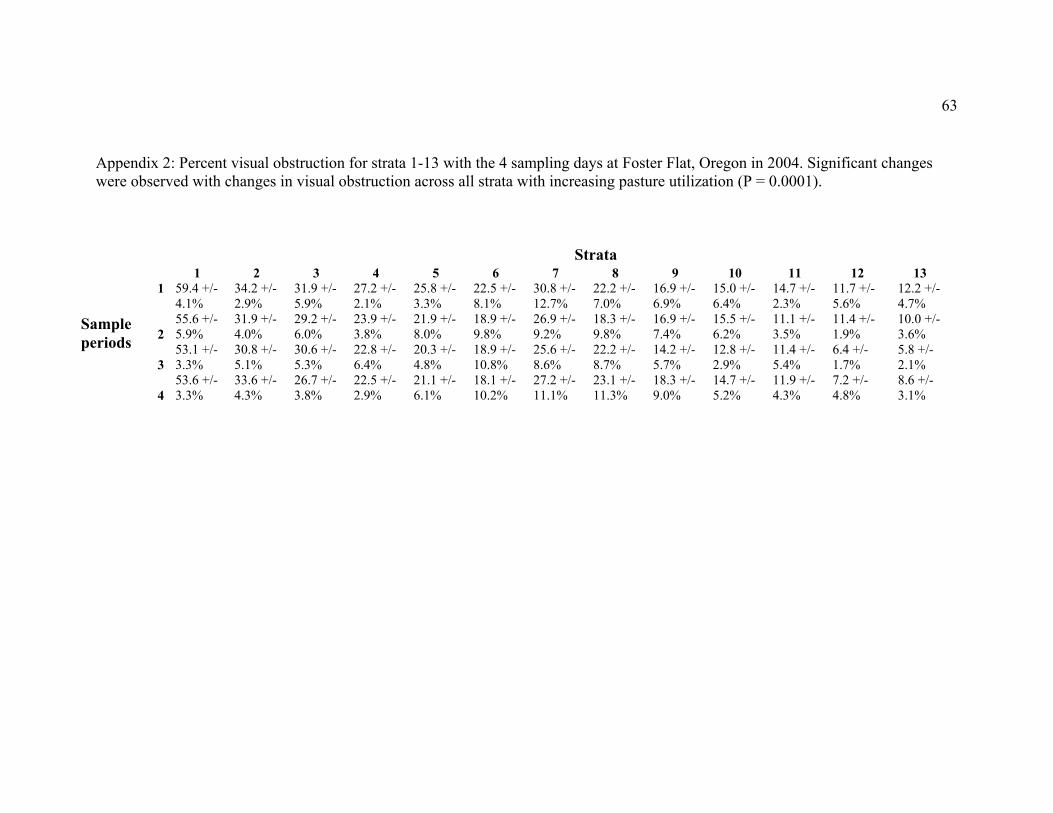
63
Appendix 2: Percent visual obstruction for strata 1-13 with the 4 sampling days at Foster Flat, Oregon in 2004. Significant changes were observed with changes in visual obstruction across all strata with increasing pasture utilization (P = 0.0001). Strata
1 2 3 4 5 6 7 8 9 10 11 12 131 59.4 +/-
4.1% 34.2 +/- 2.9%
31.9 +/- 5.9%
27.2 +/- 2.1%
25.8 +/- 3.3%
22.5 +/- 8.1%
30.8 +/- 12.7%
22.2 +/- 7.0%
16.9 +/- 6.9%
15.0 +/- 6.4%
14.7 +/- 2.3%
11.7 +/- 5.6%
12.2 +/- 4.7%
2 55.6 +/- 5.9%
31.9 +/- 4.0%
29.2 +/- 6.0%
23.9 +/- 3.8%
21.9 +/- 8.0%
18.9 +/- 9.8%
26.9 +/- 9.2%
18.3 +/-9.8%
16.9 +/- 7.4%
15.5 +/- 6.2%
11.1 +/- 3.5%
11.4 +/- 1.9%
10.0 +/- 3.6%
3 53.1 +/- 3.3%
30.8 +/- 5.1%
30.6 +/- 5.3%
22.8 +/- 6.4%
20.3 +/- 4.8%
18.9 +/- 10.8%
25.6 +/- 8.6%
22.2 +/- 8.7%
14.2 +/- 5.7%
12.8 +/- 2.9%
11.4 +/- 5.4%
6.4 +/- 1.7%
5.8 +/- 2.1%
4 53.6 +/- 3.3%
33.6 +/- 4.3%
26.7 +/- 3.8%
22.5 +/- 2.9%
21.1 +/- 6.1%
18.1 +/- 10.2%
27.2 +/- 11.1%
23.1 +/-11.3%
18.3 +/- 9.0%
14.7 +/- 5.2%
11.9 +/- 4.3%
7.2 +/- 4.8%
8.6 +/- 3.1%
Sample periods

64
Appendix 3: Vegetation characteristics for Foster Flat, Oregon in 2004. Sagebrush canopy cover and density was 17.1% ± 0.3 and 3209 ± 36.6 plants/hectare, respectively. Herbaceous cover for the site was 9.0% ± 0.01.
% Cover Bare ground 62.7
Rock 6.2 Litter 16.3 Moss 5.2 Crust 0.03
Pasture
1 Pasture
2 Pasture
3 Pasture
4 Canopy cover 19.3% 17.1% 16.7% 15.3%Shrub density
(stems/ha) 4180 2520 3160 2980
Annual Forbs %
Cover Perennial Forbs %
Cover Annual Grasses %
Cover Perennial Grasses %
CoverCollinsia parviflora 0.04 Agosteris glauca 0.1 Bromus tectorum
0.06 Agropyron spicatum 1.4
Microsteris gracilis 0.19 Crepis occidentalis 0.001 Elymus trachycaulus
0.2 Epilobium palustre 0.001 Eriogonum ovalifolium 0.4 Sitantion hystrix 2.03 Descuriania pinnata 0.001 Lupinus leucophyllus 0.8 Stipa thurbiana 1.87 Cryptantha circumscissa 0.01 Phlox longifolia 1.1Trifolium spp
0.06 Senecio integerrimus 0.4 Trifolium andersonii 0.03 Astragalus spp 0.05 Lomatium nevadense 0.2 Arabis sparsiflora 0.01 Antennaria dimorpha 0.05