Physics in Schools IV Supply and Retention of Teachers
108
PHYSICS IN SCHOOLS IV Supply and Retention of Teachers Alan Smithers and Pamela Robinson Centre for Education and Employment Research University of Buckingham Produced with the Support of The Gatsby Charitable Foundation
Transcript of Physics in Schools IV Supply and Retention of Teachers
PHYSICS IN SCHOOLS IVSupply and Retention of Teachers
Alan Smithers and Pamela RobinsonCentre for Education and Employment Research
University of Buckingham
Produced with the Support of
The Gatsby Charitable Foundation
(INSIDE FRONT COVER)
© The Gatsby Charitable Foundation, and Alan Smithers and Pamela Robinson 2008
Published June 2008
Carmichael Press University of Buckingham Buckingham MK18 1EG
Printed in England for the Carmichael Press by ********* ISBN 978 1 901351 92 7

Contents
Executive Summary i
1. Introduction 1
2. The National Picture 9
3. Admissions Tutors 20
4. Teacher Trainees 45
5 Entry to Teaching 54
6. Distribution Across State Schools 59
7. Turnover, Wastage and Moves 66
8 Looking to the Future 79
References 87
Appendix A: Methods 89
Appendix B: Sample 94

(BLANK PAGE)

Executive Summary It is widely recognised that physics specialists are under-represented among school science teachers. The government has set a target that by 2014 at least 25% should have physics as a specialism. In this report, the fourth in a series on physics in schools, we look at the current availability of physics teachers, examining in detail recruitment to, and progress in, teacher training through to completion, taking up teaching posts and deployment in schools, and on to departures from the profession.
Key Findings • It is difficult to determine whether the government’s target for teachers with a physics
specialism is on course since it is not clear what counts as a physics specialism and the data vary with source.
• Our best estimate of inflows and outflows of physics teachers in 2005-06 suggests that about 115 (26%) more left than entered.
• The most recent censuses of the Training and Development Agency for Schools (TDA) found steep rises in the numbers of physics teacher trainees in 2006-07 and 2007-08, but while there would have been a boost from enhancement courses, the re-classification of combined/general science trainees as physics trainees in response to specialism and recruitment premiums seems to have been the major factor.
• The annual reports of the Graduate Teacher Training Registry (GTTR) indicate that physics applications in England rose from a low of 343 for entry in 2001 to 520 in 2005 (52%), but they fell back to 453 in 2007. Of those applicants, 59% were accepted in 2004-05 and 69% in 2006-07. The latest figures for 2008-09 show applications down by nearly 27%.
• Females are more likely to apply to be teachers than males and more likely to be accepted - in physics by 12 percentage points in 2007-08 - but only about a fifth of physics graduates are female. In contrast, two-thirds of biology graduates are female.
• About four times as many biology graduates as physics graduates train to be specialist science teachers and they also comprise over a third of the combined/general science trainees as against 6% from a physics background. Less than a tenth of PGCE science output in 2005-06 was in physics compared with 12% in chemistry, 36% in biology and 43% in combined/general science.
• The TDA Teacher Training Profiles for 2005-06 show that nearly a quarter of the physics graduates training to be teachers were training to be maths teachers. Given the acute shortage of physics teachers the reasons should be investigated.
• Admissions tutors reported that biologists tended to apply early and physicists late. Although departments tried to set the same standards for both, some admitted that they took more risks with physicists, and they reported a success rate of only 81% taking into account withdrawals, deferrals, transfers and failures.
• Over two-fifths (43%) of the admissions tutors thought subsuming physics within science made it more difficult to recruit, but 25% thought it was important to do so; 29% thought that there should be a physics and maths PGCE, but 18% were against.
i

• Three of the admissions tutors had experienced a significant boost to recruitment from physics enhancement courses, three others were optimistic, but 22 (79%) thought filling places would be a continuing struggle.
• Physics teacher trainees held occupational values, particularly with regard to people, that were similar to those of teachers, but sharply different from those of most physics graduates.
• Of the 2006-07 trainees who had applied for posts in the state sector, 58% had been successful on their first or second application, and a further 24% had obtained posts by July, but 18% were still looking, one having made 15 applications.
• Over a quarter (29%) of the physics trainees would have preferred to teach physics and maths rather than having to teach all three sciences.
• Independent schools tended to recruit proportionally more of the physics teacher trainees (9%) than for any other subject except classics where it was 43%. They also tend to take the better qualified. In 2005-06, 22% had firsts against 13% going to the state sector (compared with 29% for all physics graduates). A third had received their teacher training at the top dozen universities compared with 24% of those taking posts in state schools.
• It was possible to predict with 84% accuracy whether a school would have any physics specialists, essentially from whether it had a sixth form, its region, whether it had specialist status in science, engineering or technology, and the ability of its pupils as indicated by GCSE results.
• Turnover and moves to other schools were somewhat higher for physics specialists than for teachers in the other core subjects. The main driver of wastage in physics is retirement, which contributes a quarter of the total turnover and half the wastage. Nearly three times as many physics leavers as biology leavers were aged over 50. Early promotion and poaching by other schools also played a part.
• There was a widespread view that physics posts were the most difficult to fill. Those schools attracting well-qualified applicants thought it was because they enjoyed an advantage such as specialist teaching, selection or specialist status.
• The schools adopted a wide variety of strategies to fill their physics posts: active recruitment, training up biologists, incentives such as allowances and promotion, sharing with other schools, flexibility and temporary ‘fixes’.
Methods A quantitative picture was painted by re-analysing national statistics and conducting four surveys. Four main sources of national statistics were drawn upon. Data were obtained from, respectively, the Graduate Teacher Training Registry (GTTR), the Training and Development Agency for Schools (TDA) and the Higher Education Statistics Agency (HESA). The fourth national source was a database compiled from the Department for Children, Schools and Families’ (DCSF’s) ‘Edubase’ and School and College Achievement Tables, to which data on eligibility for free school meals obtained under the Freedom of Information Act were added.
ii

In addition four surveys were conducted in summer 2007, one by interview and three by questionnaire.
Survey I. Admissions tutors of all PGCE courses offering physics as a specialism were interviewed in June and early July 2007.
Survey II. Teacher trainees in a sample of ten PGCE courses offering physics as a specialism were sent a questionnaire via the admissions tutors, with 80 responses being received from a possible 101 (79 per cent).
Survey III. A 10% quota sample of schools matching the population on region, size, selection, funding type, age range, gender, specialism and faith.
Survey IV. Teachers resigning from their schools to move or leave were sent a questionnaire through their schools and 423 responses were received including 30 from physics leavers (50% of the physics resignees reported by schools in the sample).
The National Picture TDA training profiles show that 275 physics specialists completed teacher training in 2005-06, including 21 via employment-based routes. This was less than a tenth of the total science output (9%) compared with 12% in chemistry, 36% in biology and 43% in combined/general science. DCSF statistics show that the overall PGCE science allocation has only been met or exceeded twice - in 1991-92 and 1992-93 - in years when the target was set low and the country was in economic recession.
A major reason for science shortfalls is the particular difficulty of attracting physics specialists. Recruitment figures from GTTR show that the physics PGCE intake declined as a proportion of the science intake from 30% in 1983 to 12% in 2007. Various incentives raised applications in England from a low of 343 in 2000-1 to 520 in 2004-5 (an increase of 52%), but they fell back in 2006-07 to 453. More applications, however, were accepted. The latest figures show applications for 2007-08 to be down by 27% as of June, though physicists tend to apply late.
Overall the equivalent of about 12% of the total graduate output (minus undergraduate teacher training) in England is needed to fill university PGCE places, but in some subjects, including maths, languages and religious education, it is over half. In physics it would take about 17% to fill 350 places. Although recruitment is difficult the extent of the matching between degree subject and teacher training is high - direct 54% and related 40%. Nearly a quarter of the physics graduates (23.5% in 2005-06) train to be maths teachers.
Physics is mainly taught in the leading and long-established universities, which also train the majority of the physics teachers. Teachers in the sciences tend to have below average degrees, though this is somewhat masked in physics by the high proportion of firsts awarded. Females are more likely to apply to be teachers than males and more likely to be accepted - in physics by 12 percentage points in 2006-07. One of the difficulties in recruiting physics teachers is that only about a fifth of the graduates are female in contrast to biology where it is about two-thirds of a much larger pool. About half the PGCE trainees in the sciences are aged 25 and over, but again biology is an exception with younger entrants in the majority.
iii

Admissions Tutors The admissions tutors of all 28 universities listed on the Graduate Teacher Training Registry’s website as having physics teacher trainees in 2007-08 were interviewed in June/July 2007 (Survey I). The courses, whether labelled science or physics, were all science PGCEs designed to enable the trainees to teach national curriculum science. Biologists tended to apply early and physicists late. Although departments tried to set the same standards for both, some admitted that they took more risks with physicists. Tutors agreed that many more physicists than biologists were temperamentally unsuited to teaching, so that the small pool of graduate physicists was even smaller when interest in, and suitability for, teaching were taken into account. Insufficient suitable teaching practice placements caused some departments to experiment with doubling up trainees. Independent schools were used by most, but not all the departments.
Of the 28 tutors, 43% thought subsuming physics within science was a problem, against 25% who thought it was a positive development. Having to teach all three sciences was thought to deter some applicants. Some tutors (29%) thought that there should be a physics and maths PGCE, but 18% were against. Most could foresee difficulties involving, among other things: current requirements; course organisation; robbing Peter to pay Paul; and the separation of science and maths in schools. Of the 28 tutors, three had experienced a boost to recruitment from their science enhancement courses, three were optimistic about the future believing that incentives and attempts to widen the pool of potential recruits were beginning to pay off, but 22 (79%) thought that recruitment to physics teacher training within science would continue to be problematic.
Teacher Trainees The Teacher Trainees Survey (Survey II) found that they were mainly drawn to physics teaching by the desire to work with and help people and in this they were similar to teachers, but different from the general run of physics graduates. Those most likely to be people-oriented were the female, older trainees who had a degree other than physics, and who came to teaching as a second career. Those motivated by the intrinsic values of subject interest and desire to teach were more likely to be male, young, direct from university, and to have a good degree. Those attracted by extrinsic rewards tended to be young with poorer degrees.
Of those who had applied for posts in the state sector, 58% had been successful in their first or second application, and a further 24% had obtained posts. But 18% were still looking, one having made 15 applications. Those who were snapped up tended to be female, young, and to have good degrees in physics. Nearly 30% of the trainees would have preferred to teach physics and maths, rather than having to teach all three sciences.
Entry to Teaching The 2007 TDA Performance Profiles show that of every 100 mainstream trainees for secondary school teaching in 2005-06, 14 drop out and 72 were in teaching posts (all sectors) in the January following completion. On national figures, physics is close to the average in taking a teaching post, but relatively high proportions were left still seeking a post (6%) or deciding not to take a post (5%). Nearly four times as many of the science trainees were biologists (41%) as physicists (11%).
iv

An analysis based on HESA employment statistics for the years 2002-03 to 2005-06 (Dataset 2) found that independent schools tend to take proportionally more of the physics teacher trainees (9%) than for any other subject except classics where it is 43%. They also tend to take the better qualified. In 2005-06, 22% had firsts against 13% going into the state sector (compared with 29% overall). A third had been educated at the top dozen universities compared with 24% of those taking posts in state schools.
Distribution Across State Schools From the data of the Schools Survey (Survey III) it was possible to predict with 84% accuracy whether a school would have any physics specialists, essentially from whether it had a sixth form, its region, whether it had specialist status in science, engineering or technology, and the ability of its pupils as indicated by GCSE results. Over two-fifths of the up-to-16 schools (41%)) had no physics specialists compared with 11% of the up-to-18 schools. Half the schools in Inner London had none against about 10% in Yorkshire and Humberside, and the West Midlands.
None of the engineering schools in the sample and only one of the science schools was without a physics specialist, while 48.0% of the non-specialist schools, 43% of the humanities and music schools, and somewhat surprisingly 44% of the maths and computing schools fell into this category. Few schools with high ability children, low eligibility for free school meals and low special needs were without a physics specialist, but this was true of over half those with poor GCSE results and a high intake with special needs. Of the school types, grammars, voluntary controlled and faith schools tended to come off best, and small schools worst.
Turnover, Wastage and Moves Survey III also found turnover and moves to other schools were somewhat higher for physics specialists than for teachers in the other core subjects. The main driver of wastage in physics is retirement, which contributes a quarter of the total turnover and half the wastage. Nearly three times as many physics leavers as biology leavers were aged over 50. Some of the retirements were normal age, but most were premature, often stemming from a sense of dissatisfaction. About half the physics teachers were resigning to go to other state schools. The main reasons were promotion, re-location and wanting to get away from their present school.
There was widespread agreement among schools that physics posts were the most difficult to fill. Schools without sixth forms and those in London, in line with national statistics, seemed to be the most vulnerable. Those able to fill their posts thought it was because they enjoyed advantages in terms of such things as specialist teaching, selection and specialist status.
The schools’ views of physics teacher turnover dovetailed into the accounts of the leavers themselves (ascertained in Survey IV), with the main loss factors emerging as promotion, retirement and moves to other schools (including some poaching). The schools adopted a wide variety of strategies for coping including: active recruitment; training up biologists and the unqualified; incentives such as allowances and promotion; sharing with other schools; flexible employment; and temporary ‘fixes’.
v

Looking to the Future It is difficult to determine whether the government’s target to increase the proportion of physics specialists in schools is on course since it is not clear what counts as a physics specialism and the data vary with source. Putting together TDA and HESA data we estimated that the number of new PGCE-trained physics teachers in 2005-06 entering state schools was 215. To this can be added 21 trained on employment based routes and 95 re-entering or transferring from other sectors (moves between state schools are discounted since this is a sector wide calculation) giving a total inflow of 330. Survey III enabled us to estimate an outflow during the same year of 445 resulting in a net decline of 115 physics specialists (26 %).
More recent TDA figures from its annual censuses have indicated that intake of physics trainees improved to 365 in 2006 and 477 in 2007, with the employment-based route expanding to 40 in 2007. Applying the same assumptions to these intake figures as those for 2005 suggests that the net deficit for 2006-07 could be halved to 55 and there could be an increase of 55 in 2007-08 towards the 2014 target. But there is a divergence between TDA and GTTR intake figures, and using the GTTR’s would point to continuing shortfalls of over 100. This leads us to make three technical recommendations.
• Monitor the provision of physics teachers by measuring as accurately as possible the inflows and outflows each year rather than in relation to a distant target which is hard to pin down.
• Adopt agreed definitions for ‘specialist physics teacher’ and ‘specialist physics teacher training’.
• The DCSF, TDA, GTTR, HESA and the training providers should work together to arrive at accurate and comparable statistics.
Various initiatives and incentives have been introduced, but at best the supply of physics teachers is breaking even, and may be falling, with at all events little scope for making up past deficits. We offer six further measures to improve physics teacher provision.
• Encourage more teaching of physics as a subject in its own right.
• Make PGCE teacher training more flexible by encouraging, for example, physics PGCEs and physics and maths PGCEs.
• Improve support for physics teachers in the early crucial years of teaching.
• Reduce the loss to independent schools by making state schools more competitive in terms of opportunities to specialise in physics teaching, facilities and technician back-up. This would also be likely reduce early retirement.
• Improve the deployment of existing teachers by incentivizing sixth form and further education colleges to work in partnership with 11-16 schools to ensure that the pupils are taught by well-qualified physics teachers as they move up through the schools.
• Since there are relatively few pupils interested in taking physics to a high level and relatively few well-qualified teachers, explore ways of bringing them together in particular schools, either in specialist science schools or in schools chosen on other criteria.
vi
1. Introduction 1.1 Physics is at the sharp end of teacher recruitment. It is the subject that schools find
most difficult to staff. Some schools do not teach it, and others that do, use non-physicists as teachers. In a series of papers Smithers and Robinson (2005, 2006 and 2007a) have quantified the impact of the shortage. They found that 8.7 per cent of comprehensive schools with sixth forms did not offer A-level physics. Of the schools without sixth forms, nearly a quarter had no teacher who had studied physics to any level at university. They showed that teacher qualifications were second only to pupil ability as a predictor of performance in physics. Shortages led to well-qualified teachers being distributed across schools very unevenly so the opportunity young people had of discovering whether physics was for them depended very much on the school they attended. The proportion of the age cohort taking A-level physics had dropped from 5.9 per cent in 1990 to 3.9 per cent in 1995, which indicates that there are young people capable of taking physics to a high level who are not doing so.
1.2 As the subject most likely to be affected physics is also a bell-weather for the general state of teacher supply. It has, as we trace in Chapter 2, had its ups-and-downs associated with, among other things, the state of the economy, government policy and various incentives and initiatives. But physics is also a special case for two main reasons: (a) in the recent past it has not been regarded as a school subject in its own right; and (b) a high proportion of physics graduates are not attracted to working with children.
Physics as a Subject 1.3 Physics has literally been disappearing from schools as it has become progressively
subsumed within science as the national curriculum subject. It became logical, therefore, to train teachers to teach ‘science’ and that has meant requiring physicists to teach biology and biologists, physics, even though they themselves may not have studied these subjects. This is not only likely to deter potential teachers (which is much more serious in physics than biology because so few are attracted anyway), but it is also likely to mean that in the early crucial years physics particularly (since a high proportion of science teachers come from a biology background) is not going to be taught by teachers whose interest and enthusiasm led them to study the subject. If young people cannot identify with physics and be sure they are good at it and like it, and know they are going to have good teachers, they are hardly going to risk their futures on the A-level. This reduces the numbers wanting to study the subject at university (with the consequent closure of 17 departments between 1994 and 2004), leading to a shrinking pool of graduates, and making it even harder to recruit teachers with a physics background.
1.4 Subsuming physics within science was prompted by the best of motives. It had long been a concern that many young people were writing themselves off from the sciences at the age of 14, particularly girls from physics and chemistry. One of the innovations of the national curriculum of 1988 was to make science compulsory to age 16. However, science could only be afforded a two-subject timetable slot within which physics, chemistry and biology were to be provided. This led to an ideological battle between those who favoured an integrated version of science and those who saw the three individual subjects as being taught by subject specialists
1

under the general heading of science. Although those favouring combined science eventually won out, for a time it became ‘incorrect’ to speak of physics, chemistry and biology, which were replaced by the labels Sc 2,3 and 4.
1.5 In a parallel development, the then Department for Education and Science (DES) produced a policy statement in 1985 proposing a move towards combined or integrated courses leading to a GCSE double award in science. Sixteen organisations led by the Royal Society and representing the science establishment of the day weighed in with support (Secondary Science Curriculum Review, 1987). It was originally intended that the physics, chemistry and biology GCSEs should be withdrawn. But independent schools - which it must be remembered were not subject to the national curriculum - protested mightily (although they had been signatories to the Double Award memorandum) and the individual science GCSEs were retained.
1.6 Leading state schools then began to lobby to be allowed to enter some of their pupils for the separate sciences and John McGregor, the Conservative Secretary of State at the time, conceded the point, but insisted that state schools should reflect the national curriculum by entering those pupils for all three science subjects. While, therefore, independent schools remained free to teach any combination of the sciences to 14-16 year-olds, state schools offering physics, chemistry and biology as separate subjects had to teach all three to the same pupils in the curriculum time of two. This meant that, in effect, the individual sciences were only available in those schools that could, and wished to, fit them in. Not surprisingly, relatively few state schools took up the option. In a study of comprehensive schools that had bucked the trend of declining physics (Smithers and Robinson, 2007a), it was found that they taught physics as physics. But in many schools physics has morphed into general science. Physics has, therefore, largely survived as a school subject in the independent sector and grammar schools.
1.7 The Blair government in its later years and the present Brown government have shown signs of wanting to re-establish physics as a school subject. In an important document published in 2006, HM Treasury outlined a Science and Innovation Investment Framework 2004-2014: Next Steps, which proposed that all pupils achieving at least a Level 6 in Key Stage 3 science should have an entitlement from September 2008 to take physics at GCSE along with chemistry and biology. At the same time GCSEs in science have been made more flexible with the opportunity of specialising in the three sciences on the back of a core of science.
Personal Characteristics 1.8 In order for these ambitious plans to be implemented the supply of teachers with the
necessary expertise has to be greatly improved. Therein lies the problem. For personality reasons, only a sub-set of what is now a very small pool of physics graduates will ever be attracted to teaching. Smithers and Hill (1989) showed that what draws people to the study of physics is often the love of impersonal and abstract patterns and this is different from the desire to be with and help people that is often the main motivation to teach. Essentially what Smithers and Hill did was to devise a psychological ‘people meter’ that enabled them to place students in different subjects along a spectrum. Physics came at the impersonal end along with maths; at
2
the opposite pole were subjects like drama and English, with of the sciences biology the most people-oriented. That placing corresponds quite closely with the ease or difficulty of recruiting teachers. Men and women also differ, on average, in their person orientation, with males more towards the impersonal end. Again, as is well known, females tend to be more attracted to teaching. When you have a subject such as physics, which is intrinsically impersonal and has few female students, attracting sufficient high calibre teachers is not easy. The strategy of recent governments has rested on the two-pronged approach of recruitment incentives and widening the pool of applicants.
Recruitment Incentives 1.9 In 2006, as part of its Science, Technology, Engineering and Maths (STEM)
commitment, the government (HM Treasury 2006) established a target that by 2014 25 per cent of science teachers should have a physics specialism compared to the 19 per cent reported for 2004-5 by the NFER (2006). (In chemistry the ambition is for 31 per cent compared with 25 per cent.) It is, of course, a moot point what counts as a physics specialism. This seems to include those with a degree in physics or one incorporating a significant element of the subject, qualified teachers who specialised in physics in initial teacher training (even if their degree was not), plus qualified teachers who have completed government-funded programmes designed to increase the pool of physics specialists such as the enhancement courses we will be discussing later.
1.10 The means by which it is hoped to achieve this target was described to us by the Training and Development Agency for Schools (TDA), which is responsible for allocating training places.
• The Department for Children Schools and Families (DCSF) sets the TDA a single initial teacher training (ITT) new entrant recruitment target for secondary science covering recruitment across all ITT routes including the national curriculum and post-16 in combined/general science, chemistry, physics, biology and other science (geology and environmental science).
• The DCSF also identifies the amount within this general target which should be set aside for physics and chemistry.
• The TDA will continue to allocate to providers science places in general rather than ring fence the places to specific science subjects.
• There are financial incentives and support in place to ensure that providers develop and expand their physics and chemistry provision.
• Providers have to declare their science trainees as physicists, chemists, biologists and general scientists rather than using the catch-all category of general/combined science.
• Providers have complete freedom to vire between the specialisms.
• In order for the TDA to record the specialism the allocation of places to the provider is split (in agreement with the provider) into these four sub-
3
categories so the provider can record registrations against each of these specialisms.
1.11 The strategy rests, therefore, on a clearer identification of who is being trained plus recruitment incentives directed towards both providers and trainees.
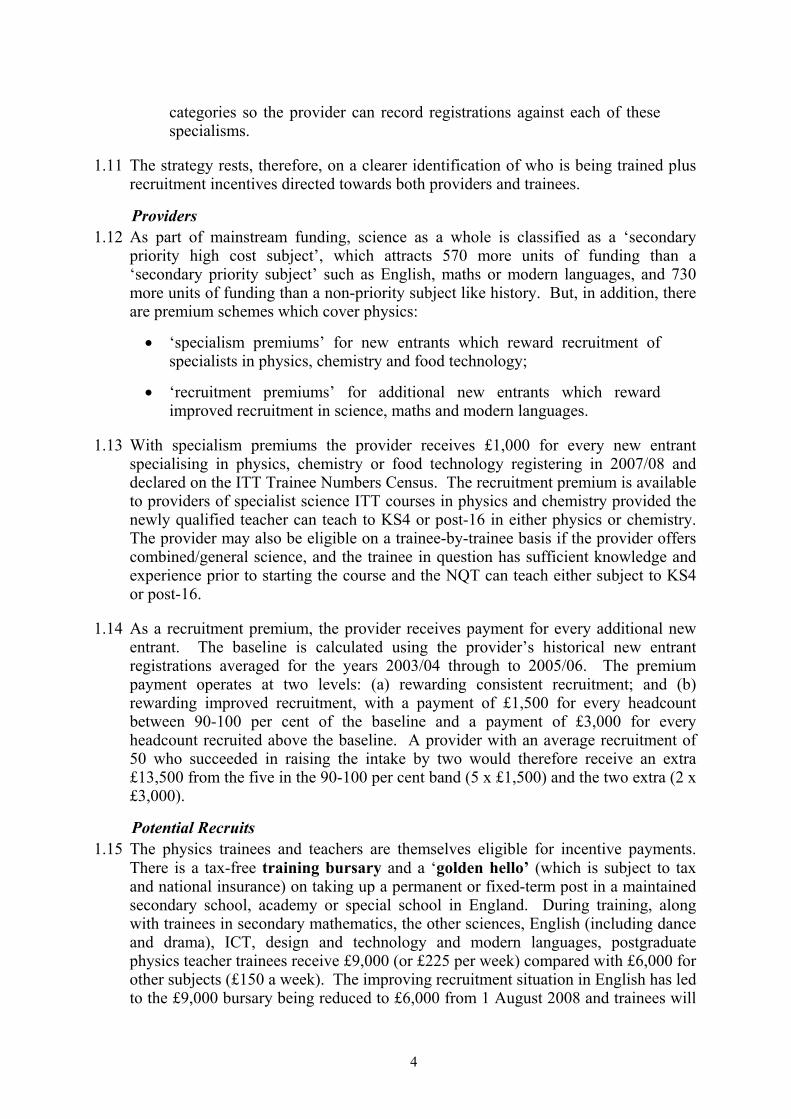
Providers 1.12 As part of mainstream funding, science as a whole is classified as a ‘secondary
priority high cost subject’, which attracts 570 more units of funding than a ‘secondary priority subject’ such as English, maths or modern languages, and 730 more units of funding than a non-priority subject like history. But, in addition, there are premium schemes which cover physics:
• ‘specialism premiums’ for new entrants which reward recruitment of specialists in physics, chemistry and food technology;
• ‘recruitment premiums’ for additional new entrants which reward improved recruitment in science, maths and modern languages.
1.13 With specialism premiums the provider receives £1,000 for every new entrant specialising in physics, chemistry or food technology registering in 2007/08 and declared on the ITT Trainee Numbers Census. The recruitment premium is available to providers of specialist science ITT courses in physics and chemistry provided the newly qualified teacher can teach to KS4 or post-16 in either physics or chemistry. The provider may also be eligible on a trainee-by-trainee basis if the provider offers combined/general science, and the trainee in question has sufficient knowledge and experience prior to starting the course and the NQT can teach either subject to KS4 or post-16.
1.14 As a recruitment premium, the provider receives payment for every additional new entrant. The baseline is calculated using the provider’s historical new entrant registrations averaged for the years 2003/04 through to 2005/06. The premium payment operates at two levels: (a) rewarding consistent recruitment; and (b) rewarding improved recruitment, with a payment of £1,500 for every headcount between 90-100 per cent of the baseline and a payment of £3,000 for every headcount recruited above the baseline. A provider with an average recruitment of 50 who succeeded in raising the intake by two would therefore receive an extra £13,500 from the five in the 90-100 per cent band (5 x £1,500) and the two extra (2 x £3,000).
Potential Recruits 1.15 The physics trainees and teachers are themselves eligible for incentive payments.
There is a tax-free training bursary and a ‘golden hello’ (which is subject to tax and national insurance) on taking up a permanent or fixed-term post in a maintained secondary school, academy or special school in England. During training, along with trainees in secondary mathematics, the other sciences, English (including dance and drama), ICT, design and technology and modern languages, postgraduate physics teacher trainees receive £9,000 (or £225 per week) compared with £6,000 for other subjects (£150 a week). The improving recruitment situation in English has led to the £9,000 bursary being reduced to £6,000 from 1 August 2008 and trainees will
4

no longer be eligible for a golden hello. At the same time the bursary for trainees on primary postgraduate ITT courses is to be reduced to £4,000.
1.16 The current value of the golden hello for physics teachers is £5,000. The present scheme replaced a previous one on 1 September 2000 whereby £2,500 was paid during training and a further £2,500 once an eligible post had been taken up. The value of the golden hello has varied with subject and when training was undertaken, and the £5,000 applies to science and mathematics teachers whose PGCE courses have begun between 1 August 2005 and 31 July 2008. The payment of the golden hello (which is subject to tax and NI) is made via a claim to the local authority.
Widening the Pool 1.17 As well as incentives the government has sought to widen the pool of trainees by
developing training routes alongside PGCE courses and promoting various enhancement arrangements.
Training Routes 1.18 In 2006-07, 2,990 of the 3,225 places (92.7 per cent) allocated by the TDA to
training science teachers on conventional ITT courses were accepted (not all arrive), but the shortfall was more than bridged by the 400 or so recruited to employment-based teacher training (EBITT). This is a collective name which the TDA uses for four related routes.
• Graduate Teacher Programme (GTP) – on-the-job teacher training normally for a year whereby a trainee who is a graduate is paid an unqualified teacher’s salary by a school which is reimbursed to a maximum by the TDA and also paid a training grant, leading to Qualified Teacher Status (QTS) but not a PGCE.
• Registered Teacher Programme (RTP) is similar to the GTP but for non-graduates with some experience of higher education who are able through employment-based teacher training and academic study to complete a degree and qualify as a teacher at the same time.
• Overseas Trained Teacher Programme (OTTP) is for teachers qualified outside the European Union and employed by a school in England and provides training and assessment to enable them to teach in England permanently.
• Teach First is run by an independent organisation which recruits top graduates straight from university to spend two years teaching in a challenging school in London, Manchester or the Midlands. Four-fifths of the places are devoted to the shortage subjects. The incentive is that the recruits are promised an interview for a job with a leading employer, as well as qualifying as a teacher.
1.19 Providers of GTP, RTP and OTTP training from 2007-08 receive a recruitment premium of £2,000 per physics or chemistry trainee, and £1,000 per biology, combined science, maths or food technology trainee. Employment-based routes are expected to make an important contribution to meeting the 2014 target for physics specialists, but until the TDA recently began compiling its Employment Based
5

Routes Database it was not clear how many had been recruited or to which specialisms.
Other Measures 1.20 Recognising that the pool of physics and physics-related graduates is probably not
going to be big enough to provide the specialist teachers needed, at least in the foreseeable future, the government has encouraged and supported a wide range of initiatives aimed at boosting the numbers.
• Physics Enhancement Programme offers a 26-week full-time course to enable graduates with some experience of the subject post-16 to reach a standard which would allow take-up of a conditional place in initial teacher training. It is available in seven university consortia and attracts a bursary of £225 per week. It is managed by a partnership of the TDA and Gatsby Technical Education Projects and it is delivered with the support of the Institute of Physics. It also includes mentoring subject support in the early years of teaching. It has been a model for enhancement courses in chemistry and mathematics, and 14-week extension courses in French and German.
• Science Additional Specialism Programme: following the Sainsbury Review (2007) the government also announced enhancement courses to enable serving teachers to become accredited specialists in physics, chemistry and maths teaching, with supply cover paid to schools and a bonus of £5,000 paid to every teacher who completes the course.
• Extended PGCE Courses lasting 18 months and two years for those who want to teach science or mathematics, but need some additional subject knowledge training, with supplementary bursaries taking the total to £16,000, for a course beginning in 2008.
• Booster Courses of two-weeks or equivalent in a range of subjects including science taken before or during initial teacher training to top-up subject knowledge in areas, for example physics for biologists and vice versa.
• Student Associates Scheme which enables university students to spend up to 15-days gaining first-hand experience of what a career in teaching involves. They are eligible for a tax-free bursary of £40 for every day spent in school. Priority is given to science and maths graduates, who comprise about a third of the total.
• Undergraduate Ambassadors Scheme is run by an independent organisation funded by the TDA to give undergraduate students the opportunity to volunteer for classroom experience.
• Some universities are incorporating education modules into their undergraduate programmes which contribute to the degree awarded.
• The TDA supports 400 distance-learning places in secondary shortage subjects run through the Open University.
6

1.21 We explore the views on the various schemes of the admission tutors of all the PGCE course training physics teachers in Chapter 3. It is obvious, however, that the push to increase the number of physics teachers involves some re-definition of what constitutes a specialist physics teacher.
Methods 1.22 The aim of this study has been to provide as complete a numerical picture as possible
of the availability of physics teachers to schools in England drawing on the latest information. The data have been obtained by two main methods: re-analysis of national statistics and a series of surveys by interview or questionnaire. These are briefly indicated here and described in full in Appendix A.
National Statistics 1.23 Four main sources of national data have been used:
• Graduate Teacher Training Registry (GTTR) - as the admissions service for PGCE courses it publishes an annual statistical report on applications and admissions by subject, and on its website regular updates on applications.
• Training and Development Agency for Schools (TDA) - has responsibility for, among other things, ensuring the supply of teachers in England’s schools, on which it compiles extensive databases, some of which are publicly available or can be accessed with permission.
• Higher Education Statistics Agency (HESA) - special analyses were commissioned of student entry to PGCE courses and the employment destinations of PGCE qualifiers.
• CEER’s Database - compiled from the Department for Children, Schools and Families’ (DCSF’s) ‘Edubase’, the DCSF’s School and College Achievement Tables, and data on eligibility for Free School Meals obtained under the Freedom of Information Act.
Surveys 1.24 Four surveys were undertaken, one by interview and three by questionnaire:
• PGCE Admissions Tutors (Survey I) - all admissions tutors for courses listed on the GTTR website as admitting physics specialist trainee teachers were interviewed in June and early July 2007.
• Teacher Trainees (Survey II) - a sample of 10 of the PGCE courses offering physics were sent a questionnaire through the admissions tutors, with 80 responses received out of a possible 101 (79 per cent).
• Schools (Survey III) - a 10 per cent quota sample of schools matching the population on region, size, selection, funding type, age range, gender, specialism and faith has been used to calculate the turnover and wastage of specialist teachers in selected subjects including physics. Comparisons between the composition of the sample and the population of schools are given in detail in Appendix B.
7
• Leavers (Survey IV) - personal accounts and additional background data obtained from 423 responses to a questionnaire sent via schools with leavers in selected subjects at the end of the summer term 2007.
The Report 1.25 The shape of our report follows the course of physics teacher supply from
applications, acceptances, entering and completing training through to taking posts as physics teachers in schools, and subsequently moving to other schools or leaving the state sector. We begin, in Chapter 2, with a review of the national statistics to examine the trends in the recruitment and output of physics teacher trainees, the match between degree and teacher training, and the characteristics of the trainees in terms of gender, age, degree class and type of university attended.
1.26 Chapter 3 is the most substantial and it is based on interviews with the admissions tutors of all PGCE courses offering a specialism in physics (Survey I). The interviews not only provided detailed information on recruitment, but also ranged widely over the tutors’ views on combined science and whether physics would sit more easily with mathematics for training purposes. From their experience they provided direct information on recruitment and training in 2006-07 (where their figures did not always correspond with those from national sources) and the prospects for 2007-08.
1.27 In Chapter 4, we report on our Teacher Trainees Survey (Survey II). It emerges that the values that had drawn them to teaching were similar to those of other teachers, but different from those of most physics graduates, so that the small pool of physics graduates is even smaller as far as teaching is concerned. We also look at where they were applying for posts and how successful they had been. In Chapter 5, we focus on the transition to teaching, using HESA data, in particular comparing those taking posts in state and independent schools.
1.28 In Chapter 6, we turn to our Schools Survey (Survey III) to describe the distribution of physics teachers across state schools and uncover how many lacked physics specialists and how the balance of science teachers varied. The distribution is explored in relation to school characteristics such as having a sixth-form, being specialist, the characteristics of the intake and where it is located. In Chapter 7, we look at who is resigning and where they are going, either to move to other schools or leave the state sector. As well as these statistics, we draw on the personal accounts of the physics leavers collected through the Leavers Survey (Survey IV).
1.29 We round off the empirical part of the report by returning to the Survey III which included an open-ended question allowing the schools to comment in their own words on physics teacher supply as they were experiencing it. In the final chapter, we draw the threads together and ask whether the ambition of the present government to have a quarter of the science teachers in schools as specialists in physics by 2014 is realisable, or is sadly an impossible dream.
8
2. The National Picture 2.1 Teacher training is becoming increasingly diversified. As well as the conventional
PGCE courses provided by higher education institutions (HEIs), there are PGCE schemes run by schools’ consortia (SCITTs), and also employment-based routes (EBITTs) leading to Qualified Teacher Status (but not a PGCE), including the Graduate Teacher Programme (GTP), the Registered Teacher Programme (RTP) (for non-graduates), the Overseas Trained Teacher Programme (OTTP) and Teach First. Keeping track of recruits and output, and assessing progress in relation to allocations, is more of a task, therefore, than when teacher training was almost exclusively the province of universities and colleges.
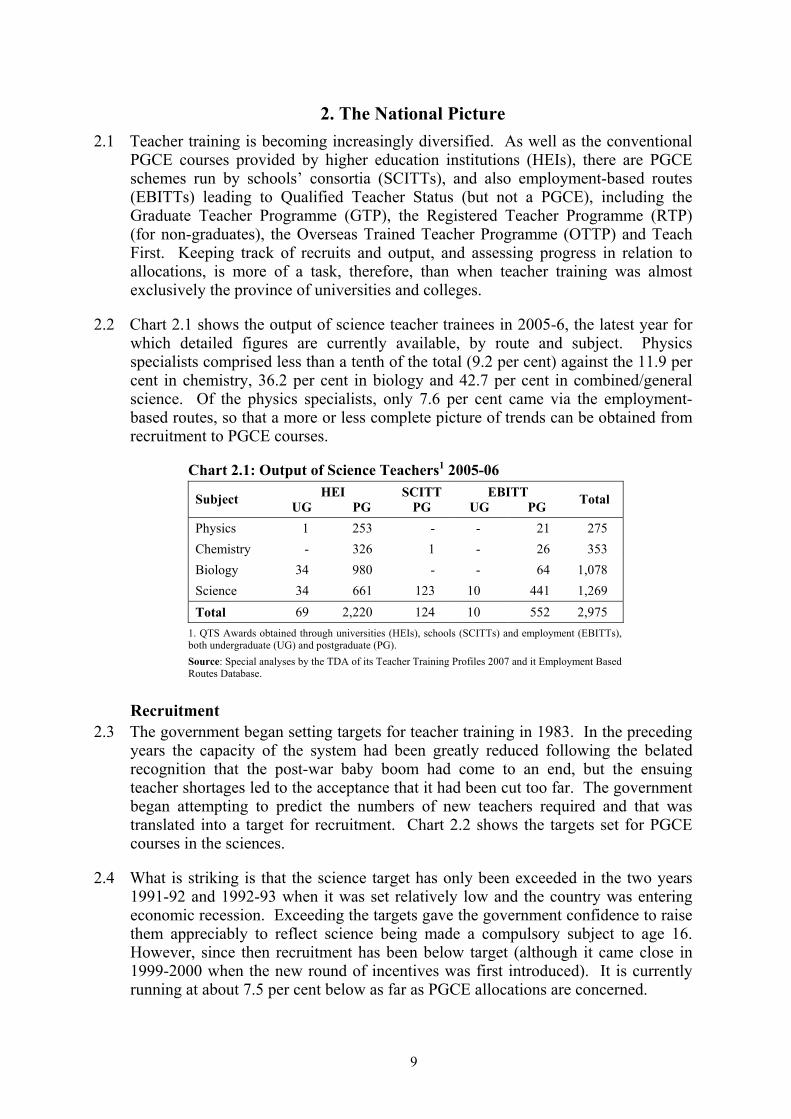
2.2 Chart 2.1 shows the output of science teacher trainees in 2005-6, the latest year for which detailed figures are currently available, by route and subject. Physics specialists comprised less than a tenth of the total (9.2 per cent) against the 11.9 per cent in chemistry, 36.2 per cent in biology and 42.7 per cent in combined/general science. Of the physics specialists, only 7.6 per cent came via the employment-based routes, so that a more or less complete picture of trends can be obtained from recruitment to PGCE courses.
Chart 2.1: Output of Science Teachers1 2005-06 HEI SCITT EBITT Subject UG PG PG UG PG Total
Physics 1 253 - - 21 275 Chemistry - 326 1 - 26 353 Biology 34 980 - - 64 1,078 Science 34 661 123 10 441 1,269 Total 69 2,220 124 10 552 2,975
1. QTS Awards obtained through universities (HEIs), schools (SCITTs) and employment (EBITTs), both undergraduate (UG) and postgraduate (PG). Source: Special analyses by the TDA of its Teacher Training Profiles 2007 and it Employment Based Routes Database.
Recruitment 2.3 The government began setting targets for teacher training in 1983. In the preceding
years the capacity of the system had been greatly reduced following the belated recognition that the post-war baby boom had come to an end, but the ensuing teacher shortages led to the acceptance that it had been cut too far. The government began attempting to predict the numbers of new teachers required and that was translated into a target for recruitment. Chart 2.2 shows the targets set for PGCE courses in the sciences.
2.4 What is striking is that the science target has only been exceeded in the two years 1991-92 and 1992-93 when it was set relatively low and the country was entering economic recession. Exceeding the targets gave the government confidence to raise them appreciably to reflect science being made a compulsory subject to age 16. However, since then recruitment has been below target (although it came close in 1999-2000 when the new round of incentives was first introduced). It is currently running at about 7.5 per cent below as far as PGCE allocations are concerned.
9

Chart 2.2: Trends1 in PGCE Science Targets2 and Intakes3
0
1
2
3
4
1983 1985 1987 1989 1991 1993 1995 1997 1999 2001 2003 2005 2007Year
Thou
sand
sTarget
Intake
1. England and Wales with the years labelled at the beginning of the recruitment cycle, so that 2007 stands for 2007-08. 2. PGCE Target for HEIs and SCITTs, but not QTS through EBITTs. 3. Intake to Universities including the OU plus other HEIs and SCITTS, but not EBITTS. Source: Annual DFEE/DfES/DCSF Statistical Evidence to the STRB.
Chart 2.3: Subject Balance in PGCE Intakes1 in the Sciences
Physics
Chemistry
Biology
Other
Combined
0
20
40
60
80
100
1983 1986 1989 1992 1995 1998 2001 2004 2007
Year
Per C
ent
1. England and Wales with the years labelled at the beginning of the recruitment cycle, so that 2007 stands for 2007-08. Source: Annual Reports of the GTTR to 1998 and from 2001 from GTTR.ac.uk/stats, since the reports themselves now include Scotland.
10
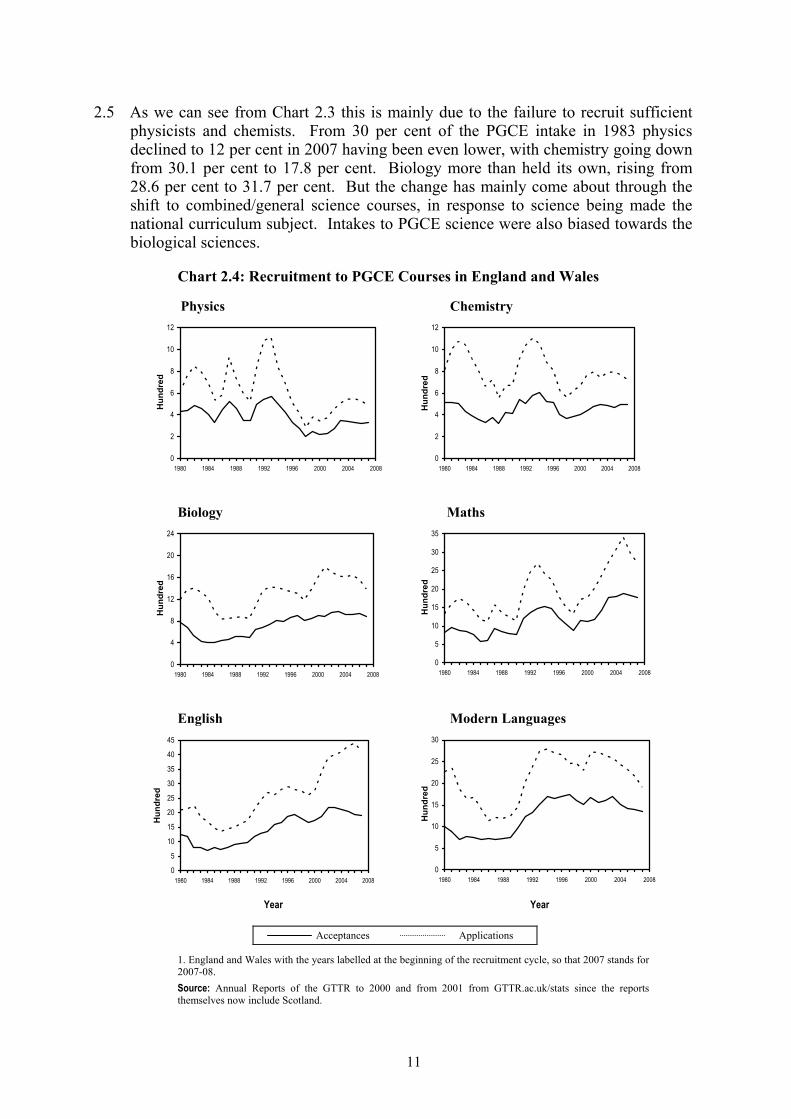
2.5 As we can see from Chart 2.3 this is mainly due to the failure to recruit sufficient physicists and chemists. From 30 per cent of the PGCE intake in 1983 physics declined to 12 per cent in 2007 having been even lower, with chemistry going down from 30.1 per cent to 17.8 per cent. Biology more than held its own, rising from 28.6 per cent to 31.7 per cent. But the change has mainly come about through the shift to combined/general science courses, in response to science being made the national curriculum subject. Intakes to PGCE science were also biased towards the biological sciences.
Chart 2.4: Recruitment to PGCE Courses in England and Wales Physics Chemistry
0
2
4
6
8
10
12
1980 1984 1988 1992 1996 2000 2004 2008
Hun
dred
0
2
4
6
8
10
12
1980 1984 1988 1992 1996 2000 2004 2008
Hun
dred
Biology Maths
0
4
8
12
16
20
24
1980 1984 1988 1992 1996 2000 2004 2008
Hun
dred
0
5
10
15
20
25
30
35
1980 1984 1988 1992 1996 2000 2004 2008
Hun
dred
English Modern Languages
0
5
10
15
20
25
30
35
40
45
1980 1984 1988 1992 1996 2000 2004 2008
Hun
dred
0
5
10
15
20
25
30
1980 1984 1988 1992 1996 2000 2004 2008
Hun
dred
Year Year
Acceptances Applications
1. England and Wales with the years labelled at the beginning of the recruitment cycle, so that 2007 stands for 2007-08. Source: Annual Reports of the GTTR to 2000 and from 2001 from GTTR.ac.uk/stats since the reports themselves now include Scotland.
11
Applications and Acceptances 2.6 The struggle to recruit physicists, and also chemists, emerges clearly in the time
courses of the applications and acceptances in the individual sciences shown in Chart 2.4. There are various bumps in the application figures, but closer inspection reveals that they can be attributed to three main influences: (a) the peaks around 1982 and 1992 correspond to high levels of graduate unemployment; (b) bursaries were introduced as recruitment incentives for physics and maths in 1986; and (c) since 1999 a range of new training bursaries and ‘golden hellos’ have come on stream.
2.7 Intakes have varied less than applications, but it is clear that while fewer physicists and chemists are being recruited than in the boom years, the biology intake has almost doubled since the nadir of 1983. Maths, English and modern languages, like the sciences, have been subject to fluctuations, but whereas the English intake has grown as places have been made available, maths and modern languages are still below their targets, and in the case of modern languages there have been recent falls. None, however, has been in such difficulty as the physics specialism in science and that is the main reason for the persistent failure to meet the overall science target.
2.8 The graphs in Chart 2.4 are for both England and Wales, since until the powers of the Welsh Office were handed over to the Welsh Assembly on 1 July 1999, the two countries had a common education system and statistics were compiled jointly. To consider trends, therefore, it is necessary to consider them together. Since devolution separate statistics have become available. Those from the GTTR show that in 2007 and 2006, there were respectively just 32 and 33 applications, and 24 and 25 accepted applications in Wales, so they have little effect on the overall picture.
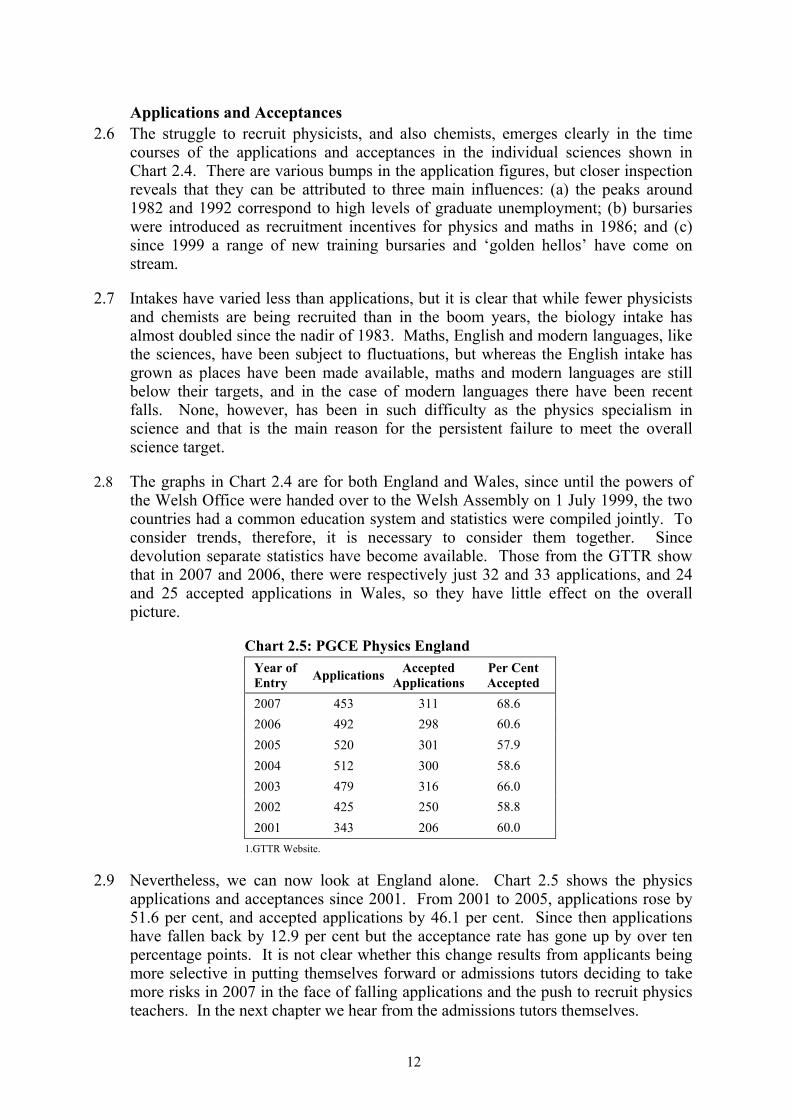
Chart 2.5: PGCE Physics England
Year of Entry Applications Accepted
ApplicationsPer Cent Accepted
2007 453 311 68.6 2006 492 298 60.6 2005 520 301 57.9 2004 512 300 58.6 2003 479 316 66.0 2002 425 250 58.8 2001 343 206 60.0
1.GTTR Website.
2.9 Nevertheless, we can now look at England alone. Chart 2.5 shows the physics applications and acceptances since 2001. From 2001 to 2005, applications rose by 51.6 per cent, and accepted applications by 46.1 per cent. Since then applications have fallen back by 12.9 per cent but the acceptance rate has gone up by over ten percentage points. It is not clear whether this change results from applicants being more selective in putting themselves forward or admissions tutors deciding to take more risks in 2007 in the face of falling applications and the push to recruit physics teachers. In the next chapter we hear from the admissions tutors themselves.
12
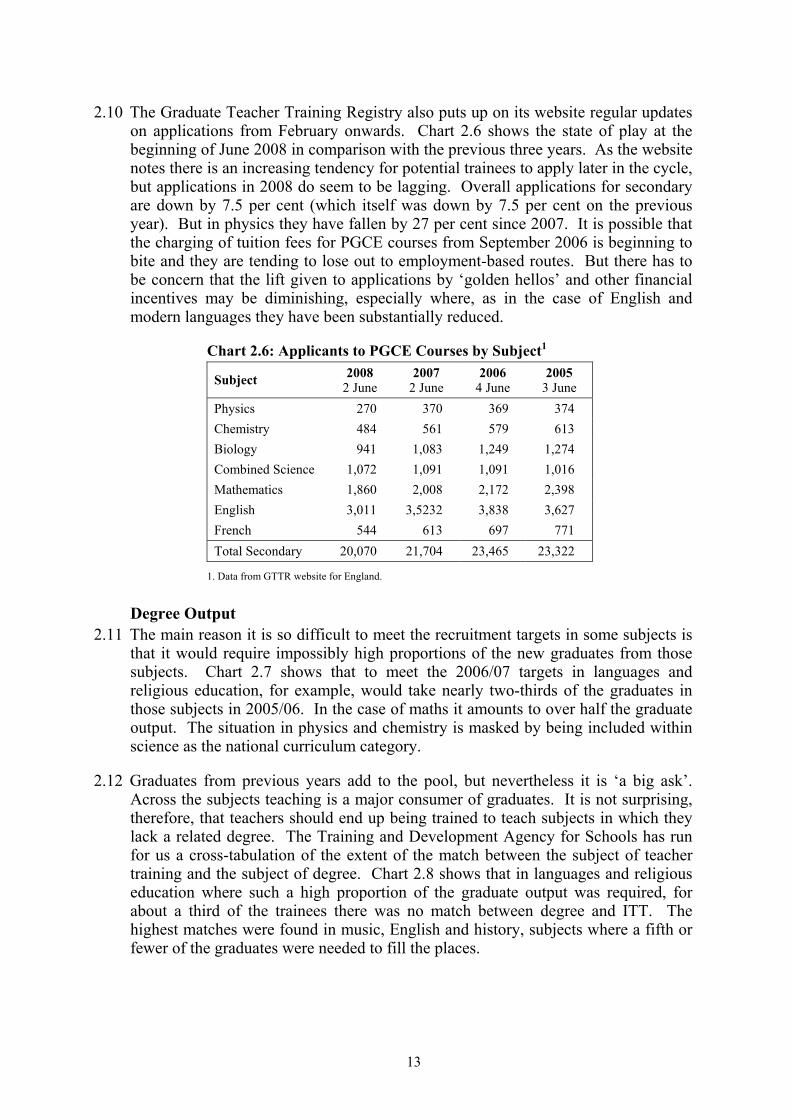
2.10 The Graduate Teacher Training Registry also puts up on its website regular updates on applications from February onwards. Chart 2.6 shows the state of play at the beginning of June 2008 in comparison with the previous three years. As the website notes there is an increasing tendency for potential trainees to apply later in the cycle, but applications in 2008 do seem to be lagging. Overall applications for secondary are down by 7.5 per cent (which itself was down by 7.5 per cent on the previous year). But in physics they have fallen by 27 per cent since 2007. It is possible that the charging of tuition fees for PGCE courses from September 2006 is beginning to bite and they are tending to lose out to employment-based routes. But there has to be concern that the lift given to applications by ‘golden hellos’ and other financial incentives may be diminishing, especially where, as in the case of English and modern languages they have been substantially reduced.
Chart 2.6: Applicants to PGCE Courses by Subject1 2008 2007 2006 2005 Subject 2 June 2 June 4 June 3 June
Physics 270 370 369 374 Chemistry 484 561 579 613 Biology 941 1,083 1,249 1,274 Combined Science 1,072 1,091 1,091 1,016 Mathematics 1,860 2,008 2,172 2,398 English 3,011 3,5232 3,838 3,627 French 544 613 697 771 Total Secondary 20,070 21,704 23,465 23,322
1. Data from GTTR website for England.
Degree Output 2.11 The main reason it is so difficult to meet the recruitment targets in some subjects is
that it would require impossibly high proportions of the new graduates from those subjects. Chart 2.7 shows that to meet the 2006/07 targets in languages and religious education, for example, would take nearly two-thirds of the graduates in those subjects in 2005/06. In the case of maths it amounts to over half the graduate output. The situation in physics and chemistry is masked by being included within science as the national curriculum category.
2.12 Graduates from previous years add to the pool, but nevertheless it is ‘a big ask’. Across the subjects teaching is a major consumer of graduates. It is not surprising, therefore, that teachers should end up being trained to teach subjects in which they lack a related degree. The Training and Development Agency for Schools has run for us a cross-tabulation of the extent of the match between the subject of teacher training and the subject of degree. Chart 2.8 shows that in languages and religious education where such a high proportion of the graduate output was required, for about a third of the trainees there was no match between degree and ITT. The highest matches were found in music, English and history, subjects where a fifth or fewer of the graduates were needed to fill the places.
13
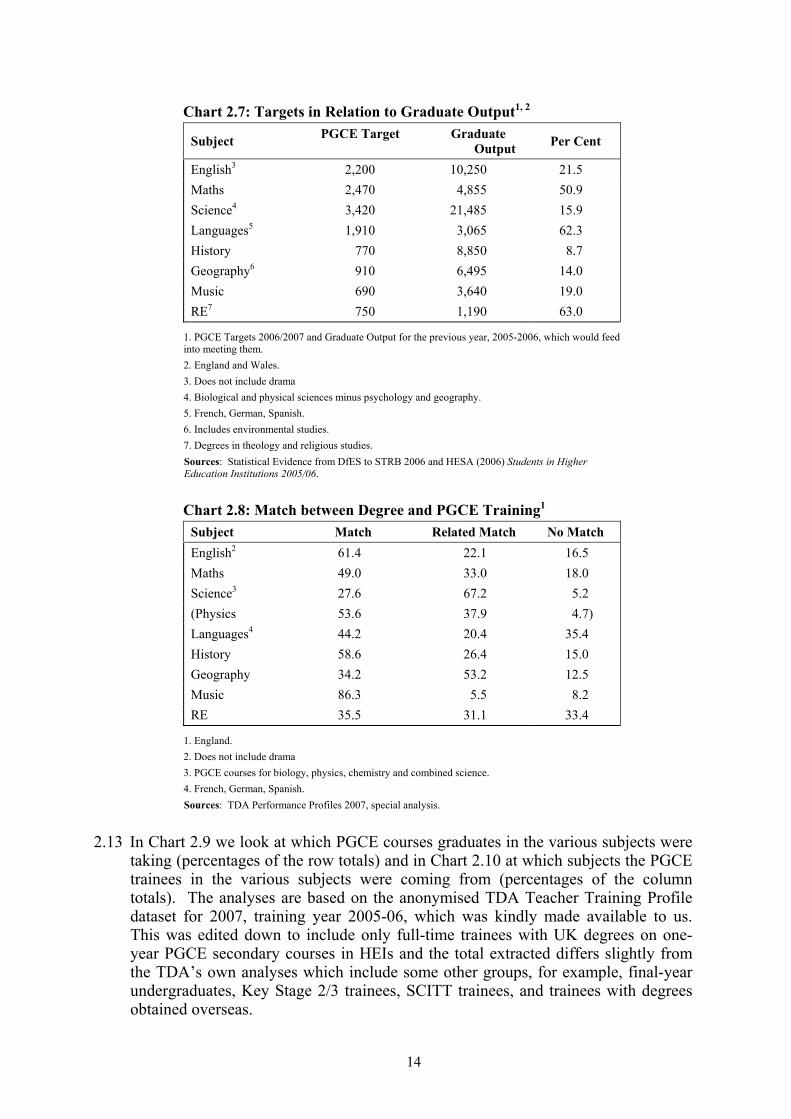
Chart 2.7: Targets in Relation to Graduate Output1, 2
Subject PGCE Target Graduate Output Per Cent
English3 2,200 10,250 21.5 Maths 2,470 4,855 50.9 Science4 3,420 21,485 15.9 Languages5 1,910 3,065 62.3 History 770 8,850 8.7 Geography6 910 6,495 14.0 Music 690 3,640 19.0 RE7 750 1,190 63.0
1. PGCE Targets 2006/2007 and Graduate Output for the previous year, 2005-2006, which would feed into meeting them. 2. England and Wales. 3. Does not include drama 4. Biological and physical sciences minus psychology and geography. 5. French, German, Spanish. 6. Includes environmental studies. 7. Degrees in theology and religious studies. Sources: Statistical Evidence from DfES to STRB 2006 and HESA (2006) Students in Higher Education Institutions 2005/06.
Chart 2.8: Match between Degree and PGCE Training1
Subject Match Related Match No Match English2 61.4 22.1 16.5 Maths 49.0 33.0 18.0 Science3 27.6 67.2 5.2 (Physics 53.6 37.9 4.7) Languages4 44.2 20.4 35.4 History 58.6 26.4 15.0 Geography 34.2 53.2 12.5 Music 86.3 5.5 8.2 RE 35.5 31.1 33.4
1. England. 2. Does not include drama 3. PGCE courses for biology, physics, chemistry and combined science. 4. French, German, Spanish. Sources: TDA Performance Profiles 2007, special analysis.
2.13 In Chart 2.9 we look at which PGCE courses graduates in the various subjects were taking (percentages of the row totals) and in Chart 2.10 at which subjects the PGCE trainees in the various subjects were coming from (percentages of the column totals). The analyses are based on the anonymised TDA Teacher Training Profile dataset for 2007, training year 2005-06, which was kindly made available to us. This was edited down to include only full-time trainees with UK degrees on one-year PGCE secondary courses in HEIs and the total extracted differs slightly from the TDA’s own analyses which include some other groups, for example, final-year undergraduates, Key Stage 2/3 trainees, SCITT trainees, and trainees with degrees obtained overseas.
14

2.14 The CEER analyses show that 327 physics graduates (on the narrow definition used by HESA) embarked on PGCE courses, but only 278 were recruited to physics teacher training. Some of the physics graduates signed up for the combined/general science PGCE, but nearly a quarter (23.5 per cent) opted to train as maths teachers. Given there is a dire shortage of physics teachers and the difficulty of filling training places this leakage should occur should be investigated.
Chart 2.9: PGCE Training Undertaken by Graduates of Selected Subjects1 PGCE Training
Degree Subject Physics Chem Biol Comb/ General Maths Other2
Total
Physics 48.9 0.0 7.6 18.0 23.5 1.8 327 Other Phys Sci3 5.4 3.6 6.4 13.7 2.8 68.1 686 Chemistry 1.5 50.0 12.4 28.6 5.0 2.6 458 Biology 0.8 4.6 59.6 30.4 1.3 3.2 1,130 Science Related4 0.8 1.2 11.2 6.6 3.7 76.5 1,515 Maths 0.3 0.1 0.2 0.4 60.4 38.6 1,431 Eng & Tech 6.9 1.3 2.1 6.3 42.4 40.9 521 Economics 0.0 0.6 0.0 0.6 41.1 57.7 163 Other5 0.1 0.0 0.3 0.4 1.8 97.4 8,439 Unknown 0.4 0.9 2.3 14.5 12.3 69.7 1,273
1. Percentages of row totals. 2. Includes 55 trainees for whom PGCE subject not recorded. 3. Except chemistry which is listed separately. 4. Medicine, dentistry, medical related, veterinary science, agriculture, sports science and psychology. 5.Architecture, law, social studies, business and administration, mass communication and documentation, languages, history and philosophy, creative arts, education. Source: CEER analysis of TDA Performance Profiles 2007 dataset extracting PGCE secondary teacher trainees with UK degrees on full-time one-year courses.
Chart 2.10: Teacher Trainees by Degree Subject1 PGCE Training
Degree Subject Physics Chem Biol Comb/ General Maths Other2
Physics 57.6 0.0 2.4 6.0 4.7 0.1 Other Phys Sci3 13.3 7.2 4.3 9.5 1.1 4.0 Chemistry 2.2 66.0 5.5 13.3 1.4 0.1 Biology 3.2 15.0 65.1 34.9 0.9 0.3 Science Related4 4.3 5.2 16.4 10.1 3.4 10.0 Maths 1.4 0.3 0.3 0.6 52.3 4.7 Eng & Tech 12.9 2.0 1.1 3.3 13.4 1.8 Economics 0.0 0.3 0.0 0.1 4.1 0.8 Other5 3.2 0.9 2.1 3.4 9.4 70.6 Unknown 1.8 3.2 2.8 18.7 9.4 7.6 Total 278 347 1,035 987 1,654 11,642
1. Percentages of columns. 2-5. As Chart 2.9. Source: CEER analysis of TDA Performance Profiles 2007 dataset extracting PGCE secondary teacher trainees with UK degrees on full-time one-year courses.
15

2.15 A clue to a possible explanation came in a letter received from a mature trainee following an earlier report (Smithers and Robinson, 2005) sharing with us why seven of the ten physicists on his science course had dropped out: “I did not wish to teach biology and chemistry, and I find it ridiculous that there was a comment on my factual knowledge of these, when I have never studied biology and I last studied chemistry many years ago.” It may also be that some find maths easier to teach since there are no practical classes.
2.16 Chart 2.10 shows that of the physics teacher trainees 57.6 per cent had a physics degree, with major contributions also from physics-related degrees like materials science and astronomy (13.3 per cent) and engineering and technology (12.9 per cent). Only 3.2 per cent came from outside the ambit of the sciences, engineering, technology and maths. The combined/general science courses recruited mainly from biology (34.9 per cent), chemistry (13.3 per cent) and science-related (10.1 per cent) degrees. Physics teacher training not only had by far the smallest intake of the sciences, but also there were few physics graduates in the combined/general science intake (6.0 per cent).
University and Teacher Training 2.17 Teacher training for the different subjects is offered in different types of university
In Chart 2.11 we draw on a dataset specially commissioned from HESA (Dataset 1 in Appendix B). This consisted of all the students who had moved on directly from completing a university qualification to teacher training in the years 2002-03 to 2005-06. Altogether 18,265 had obtained a degree and undertaken teacher training in England. Among the variables in the dataset were both the university in which the trainee had graduated and the university providing the teacher training.
Chart 2.11: University of Degree and Teacher Training %Physics %All
University Group1 Degree Obtained
Teacher Training
Degree Obtained
Teacher Training
Top1 41.3 32.3 13.7 14.1 Civics2 37.9 28.9 24.4 19.9 Greenfields3 15.1 10.3 9.4 6.3 Ex-Techs4 4.3 15.5 29.2 28.7 Other New Universities5 1.3 13.0 23.3 31.1 Total 232 232 18,625 18,625
1.Those of the top dozen universities in the UK (a baker’s dozen of 13) identified by Sutton Trust on the basis of league table positions, which were in England and offered degrees in physics, including Oxford, leading civics (eg Bristol, Birmingham) and greenfield universities (eg Warwick and York). 2.Civic universities not in top dozen (eg Leeds and Manchester). 3.Universities established on green field sites in the wake of the 1963 Robbins report and not included in the top dozen (eg East Anglia). 4.Former technical colleges that became universities mainly via college of advance technology or polytechnic status (eg Manchester Met and Huddersfield). 5.Mainly former colleges of education that have become universities (eg St Martin’s and Worcester). Sources: Dataset commissioned from HESA.
2.18 It shows that physics is mainly taught in the leading universities. Over 80 per cent of the physics degrees were obtained in the top dozen plus the other large civics. These universities also provided nearly 60 per cent of the teacher training. In
16

contrast, when it comes to all graduates considered as a group, the ex-techs and ex-colleges of education predominate both with regard to degrees awarded and teacher training.
Degree Classes 2.19 Traditionally teaching has tended not to be the first port of call for top graduates.
Chart 2.12 shows that, as a whole, science and maths graduates training to be teachers had proportionally fewer firsts than were awarded in those subjects, with the difference greatest in physics and smallest in biology. Proportionally more of the teacher trainees in physics than those in biology had a third or unclassified degree, again probably reflecting the respective difficulties in recruitment.
Chart 2.12: Degree Classes of Teacher Trainees and Graduates %Physics %Chemistry %Biology %Maths
Degree Class Teacher Trainees Grads Teacher
Trainees Grads Teacher Trainees Grads Teacher
Trainees Grads
First 13.6 26.8 15.6 22.7 10.0 13.4 17.1 26.3 Upper Second 36.6 34.0 34.5 35.4 50.2 47.4 33.7 33.4 Lower Second 34.1 25.3 37.2 25.6 34.3 29.7 32.2 25.6 Third 13.2 11.9 9.0 12.2 3.8 6.0 11.4 11.4 Unclassified 2.6 2.0 3.6 4.1 1.8 3.6 5.7 3.3 Total Known 273 2,235 333 2,710 1,010 4,585 1,600 4.575
Sources: CEER analysis of TDA Performance Profiles 2007 dataset, training year 2005-06, extracting PGCE secondary teacher trainees with UK degrees on full-time one-year courses; and data on graduates from 2004-05 who if they embarked on teacher training directly would be training in 2005-06 obtained from HESA Students in Higher Education 2004-05.
Gender 2.20 One of the reasons it may be so difficult to attract physics graduates into teaching is
gender. Nearly four-fifths of physics graduates are male. In terms of our ‘people meter’, teaching and females score high and physics low. It is not surprising, therefore, as Chart 2.13 shows, that proportionally more female graduates than their male counterparts should train as teachers. In all cases, except biology, there is a substantial difference, and even in biology the difference is in that direction. But, as Chart 2.13 shows, in physics, and to some extent maths, with so few female graduates in these subjects males remain in the majority among the teacher trainees.
Chart 2.13: Gender and Teacher Training Teacher Trainees Degree Subject %Male %Female %Male %Female
Physics 69.1 30.9 78.1 21.9 Chemistry 42.4 57.6 51.3 48.7 Biology 35.7 64.3 36.3 63.7 Maths 53.6 46.4 58.4 41.6
Sources: as Chart 2.12.
2.21 Female graduates are not only more likely to apply for teacher training but they are also more likely to be accepted, probably because the admissions tutors see in them the personal qualities to succeed in teaching. Chart 2.14 shows that this was true
17

across all subjects in both 2000-01 and 2007-08; in physics the difference on both occasions was 12 or more percentage points. The chart also brings out that in most subjects a higher proportion of applicants were accepted in 2007 than 2000, with the notable exception of English, but also females in maths.
Chart 2.14: Per Cent Acceptances by Year and Gender1, 2 2000-01 2007-08 Subject Men Women Men Women
Physics 60 73 66 78 Chemistry 56 65 65 72 Biology 50 60 60 66 Science 56 65 71 75 Maths 54 74 62 71 English 55 67 38 48 French 56 65 66 72 All Secondary 55 67 53 60
1. England and Wales. 2. Per cent of applications accepted. Source: GTTR website of final applicant and accepted applicant statistics for 2000-01 and 2007-08.
Age 2.22 Overall, approaching half (48.4 per cent) of teacher trainees on university PGCE
courses are aged 25 or over. Biology is an exception among the sciences with 56.7 per cent being under 25. In physics the proportions were equally balanced, but combined/general science (which casts its net widely), chemistry and maths tended to draw in older recruits.
Chart 2.15: Age and Teacher Training by Degree Subject Age PGCE Subject %Under 25 %25 and Over
N
Physics 50.0 50.0 278 Chemistry 42.5 54.8 347 Biology 56.7 43.3 1,035 Comb/Gen Science 41.9 58.1 987 Maths 46.9 53.1 1,654 All Trainees 51.6 48.4 15,943
Source: CEER analysis of TDA Performance Profiles 2007 dataset, training year 2005-06, extracting PGCE secondary teacher trainees with UK degrees on full-time one-year courses.
Résumé 2.23 TDA statistics show that 275 physics specialists completed training in 2005-06,
including 21 via employment-based routes. This was less than a tenth of the total science teacher trainee output (9.2 per cent) compared with 11.9 per cent in chemistry, 36.2 per cent in biology and 42.7 per cent in combined/general science. The overall PGCE science allocation has only been met in the two years, 1991-92 and 1992-93, when the country was in economic recession. A major reason for the shortfalls has been the difficulty of attracting physics specialists. The physics
18

PGCE intake declined as a proportion of the science intake from 30 per cent in 1983 to 12 per cent in 2007. Incentives raised applications in England from the low of 343 in 2000-01 to 520 in 2004-05 (up by 51.6 per cent), but they fell back in 2006-07 to 453. However, of those applicants more are being accepted, 300 (58.6 per cent) in 2004-05 and 311 (68.6 per cent) in 2006-07. The latest figures show applications in physics down in 2007-08 by about 27 per cent.
2.24 The major reason it is difficult to recruit well-qualified teachers for a number of subjects is that such a high proportion of the current graduate output would be needed. Overall, the equivalent of about 12 per cent of the total full-time first-degree UK domicile graduate output in England in 2006 was required to fill the PGCE places in universities in 2006-07 (22,910/192,195, figures from HESA 2007 and DCSF, 2008, deducting undergraduate teacher training) but in some subjects, including maths, languages and religious education it was over 50 per cent. The science target is 15.9 per cent of the overall science graduate output, but that encompasses a wide range of subjects including sports science and psychology. In science there is the lowest match (27.6 per cent) between degree and PGCE training. In physics, it would take about 17 per cent of the graduate output to fill 350 places. In spite of recruitment difficulties, there is a direct match of 53.6 per cent and a related match of 37.9 per cent. Nearly a quarter of the physics graduates (23.5 per cent) were found to be training to be maths teachers.
2.25 Physics is mainly taught in the leading and long-established universities which also train many of the physics teachers. Teachers in the sciences and maths, except perhaps biology, tend to have lower degree classes than average. Females are more likely to apply to be teachers than males and more likely to be accepted - in 2007-08, by 12 percentage points in physics - but only about a fifth of the graduates in physics are female. Recruits to teacher training are increasingly likely to have done something else between graduating and training, with nearly half the PGCE trainees aged 25 and over. Biology is an exception recruiting mainly younger graduates and together with the good degree classes indicates the relative attractiveness of teaching to biology graduates as compared with those in physics.
19

3. Admissions Tutors 3.1 Interviews were conducted in June and July 2007 with the physics teacher
training admissions tutors of all 28 universities in England listed on the Graduate Teaching Training Registry website as having physics trainees in 2007-08. As Chart 3.1 shows, and in confirmation of Chart 2.11 (page 16), four-fifths of the provision is in the long-established universities and the new universities opened in the wake of the 1963 Robbins Report. The former technical and teacher training colleges admitted only 55 out of the total of 281 (19.6 per cent). The size of the groups ranged from just two to 24, and one department with allocated places did not recruit any. Of the 281 trainees reported by the admissions tutors as entering (this differs from accepted applicants since some do not arrive), 228 (81.1 per cent) apparently successfully completed. The other 53 (18.9 per cent) were a mixture of withdrawals, transfers, deferrals and failures. This non-completion rate is considerably higher than the 12.2 per cent reported by the TDA for 2005-06 (see Chart 5.2, Page 55) but this could be because the admissions tutors were adopting a broader definition. Alternatively, drop-out may have risen.
Chart 3.1: Physics Teacher Training Admissions 2006-07
University Group Number Entered1 Completed %Deferred/Dropped Out
% Non Completion
Top Universities2 8 80 64 16 20.0 Civics3 10 118 101 17 14.4 Greenfields4 3 28 20 8 28.6 Ex-Techs5 4 37 29 8 21.6 Other New Universities6 2 18 14 4 22.2 All 27 281 228 53 18.9
1.Differs from GTTR annual report 2006-07 in several ways. Four institutions shown by GTTR as having admitted physics teacher trainees in the report did not appear on the website and had not recruited any and two institutions omitted from the GTTR publication had intakes. The 281 entries detailed by admissions tutors in the interviews compares with the 298 accepted applicants for England shown on the GTTR website - see Chart 8.1, page 81. 2.The nine of the top dozen UK universities (a baker’s dozen of 13) identified by Sutton Trust on the basis of league table positions which are in England and offer physics degrees, including Oxford, the leading civic (eg Bristol, Birmingham) and greenfield universities (eg Warwick and York). 3. Civic universities not in top dozen (eg Leeds and Manchester). 4. Universities established on greenfield sites in the wake of the 1963 Robbins report not in top dozen (eg East Anglia). 5. Former technical colleges that became universities mainly via college of advance technology or polytechnic status (eg Manchester Met and Huddersfield). 6. Mainly former colleges of education that have become universities (eg St Martin’s and Worcester).
3.2 The interviews were conducted by telephone and lasted about 30 minutes. They explored a number of themes including the structure of the PGCE course; recruitment; teaching practice; retention; destinations; views on combined science; views on a possible physics and maths PGCE; and trends and prospects. These form the sub-headings of this chapter. Within them a number of sub-themes emerged which are listed in the sections.
Nature of Course 3.3 A key feature of the PGCE courses in 2006-07 is that they were science PGCE
courses because the national curriculum subject is science. As one admissions tutor said to us: “until recently we have barely admitted physics existed as a school
20
subject. Since about 1991 physics, chemistry and biology have not been allowed to be mentioned in official documentation. It is all about Sc2, Sc3, Sc4 or whatever. It is only since Brown and Blair decided that having physics and chemistry was a good idea that we are allowed to use the words pre-16.”
3.4 Some of the courses are advertised as science PGCEs and some as physics PGCEs, but although this may reflect a difference in philosophy, they seem to be organised in much the same way. From one perspective a tutor explained: “We don’t offer as such a PGCE in physics. We offer science with physics, chemistry, and biology as specialisms. All trainees are expected to teach all three to key stage 3 (KS3), two of the three at KS4, and their specialism post-16.” From the other a tutor told us: “The students apply to do a PGCE in physics, chemistry or biology. But in reality they all have the same kind of programme because they have to be able to teach all three sciences at least to KS3. We only separate out into the three sciences when they do assessment at A-level.”
3.5 There is some differentiation in the courses, but it was constantly reiterated that the trainees have to be able to teach science. The extent and emphasis of the differentiation varied. The most generous provision for physics specialists appeared to be once a week:
The physics group meets once per week throughout the year when they focus on physics teaching. They also meet once per week to look at the biology components of the curriculum in the first term and chemistry in the second. They also meet as a whole science group when they look at general issues such as lesson planning, science policy, safety in science laboratories, etc.
3.6 At the other end of the scale there was complete integration:
We run an integrated course with the physicists, chemists and biologists all together. A science cohort of sixty, which we have had for the last few years, is broken down into four tutor groups. Within each of the tutor groups the specialisms are mixed.
3.7 Most departments were somewhere in between with a scattering of specific provision:
In terms of specific training there are various days spread out through the PGCE course where the physics specialists come together to look at particular pedagogy associated with teaching physics. But for the most part they are differentiated from the other trainees by the nature of their placements and what they are asked to teach in schools.
3.8 There could also be differentiation aimed at providing top-up: “The science PGCE is broken down into various areas, physics-based, biology-based or chemistry-based so they can gen up on some of the topics they haven’t done for a while and then there are other areas generic to science teaching.” Another tutor said: “They also do subject knowledge work in their non-specialist areas for everyone, so for example the chemists and biologists get ten two-hour slots of physics input.”
21
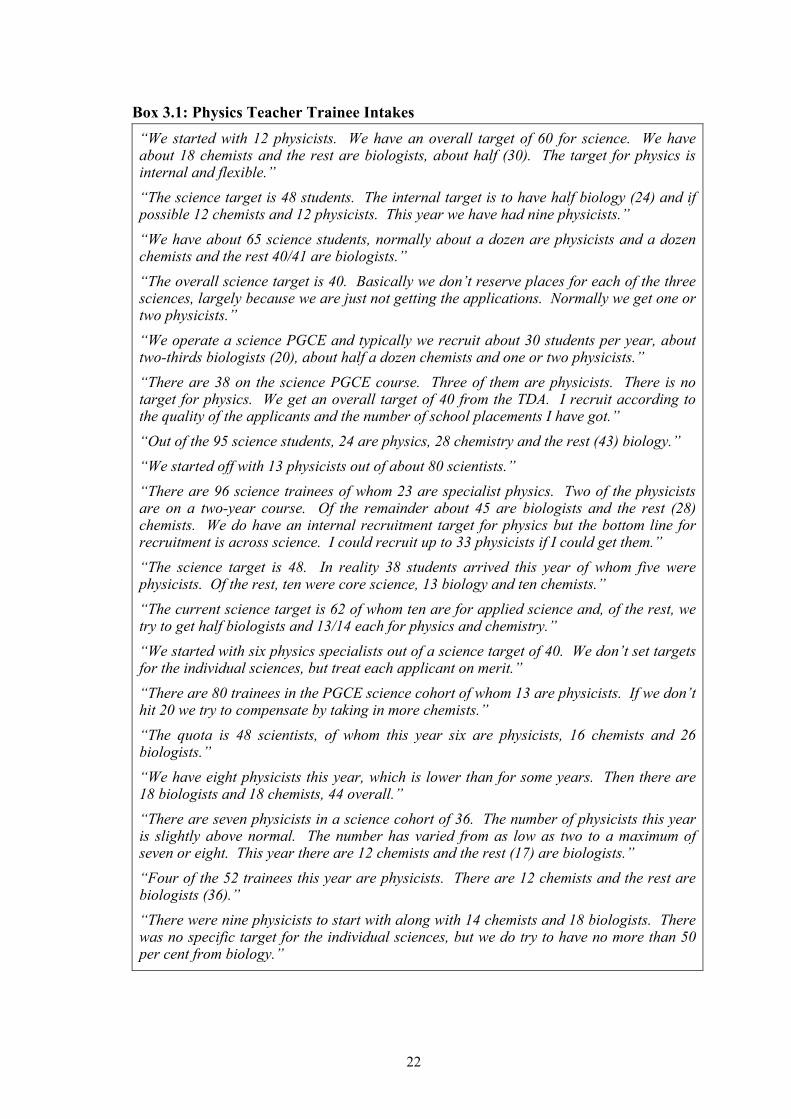
Box 3.1: Physics Teacher Trainee Intakes “We started with 12 physicists. We have an overall target of 60 for science. We have about 18 chemists and the rest are biologists, about half (30). The target for physics is internal and flexible.” “The science target is 48 students. The internal target is to have half biology (24) and if possible 12 chemists and 12 physicists. This year we have had nine physicists.” “We have about 65 science students, normally about a dozen are physicists and a dozen chemists and the rest 40/41 are biologists.” “The overall science target is 40. Basically we don’t reserve places for each of the three sciences, largely because we are just not getting the applications. Normally we get one or two physicists.” “We operate a science PGCE and typically we recruit about 30 students per year, about two-thirds biologists (20), about half a dozen chemists and one or two physicists.” “There are 38 on the science PGCE course. Three of them are physicists. There is no target for physics. We get an overall target of 40 from the TDA. I recruit according to the quality of the applicants and the number of school placements I have got.” “Out of the 95 science students, 24 are physics, 28 chemistry and the rest (43) biology.” “We started off with 13 physicists out of about 80 scientists.” “There are 96 science trainees of whom 23 are specialist physics. Two of the physicists are on a two-year course. Of the remainder about 45 are biologists and the rest (28) chemists. We do have an internal recruitment target for physics but the bottom line for recruitment is across science. I could recruit up to 33 physicists if I could get them.” “The science target is 48. In reality 38 students arrived this year of whom five were physicists. Of the rest, ten were core science, 13 biology and ten chemists.” “The current science target is 62 of whom ten are for applied science and, of the rest, we try to get half biologists and 13/14 each for physics and chemistry.” “We started with six physics specialists out of a science target of 40. We don’t set targets for the individual sciences, but treat each applicant on merit.” “There are 80 trainees in the PGCE science cohort of whom 13 are physicists. If we don’t hit 20 we try to compensate by taking in more chemists.” “The quota is 48 scientists, of whom this year six are physicists, 16 chemists and 26 biologists.” “We have eight physicists this year, which is lower than for some years. Then there are 18 biologists and 18 chemists, 44 overall.” “There are seven physicists in a science cohort of 36. The number of physicists this year is slightly above normal. The number has varied from as low as two to a maximum of seven or eight. This year there are 12 chemists and the rest (17) are biologists.” “Four of the 52 trainees this year are physicists. There are 12 chemists and the rest are biologists (36).” “There were nine physicists to start with along with 14 chemists and 18 biologists. There was no specific target for the individual sciences, but we do try to have no more than 50 per cent from biology.”
22

3.9 But even here some departments integrate: “Then there are the special subject knowledge enhancement sessions. So if the physicists are in the session on physics then they do more advanced work than the others.” Other departments ask applicants to attend two-week booster courses in their non-specialist areas before starting: “Sometimes the short booster course is made a condition of entry. That wouldn’t be for their physics subject knowledge but for their other knowledge.”
3.10 Physics, chemistry and biology teacher trainees are most likely to be separated for A-level teaching, but not all courses are validated for up-to-18 training by the Training and Development Agency for Schools (TDA). This seems to depend more on the availability of school placements than be any reflection on the quality of the provision, since one of the largest and most successful courses is validated only to 16, “though we try to give all the physicists 11-18 experience, and run four A-level sessions for them as part of the course.” As another of the 11-16 course tutors explained, “we used to be 11-18 but found that it was impossible to fulfil the condition that every single student got their required A-level teaching practice, because there is not that much A-level teaching out there.” A third tutor told us: “The course used to be up-to-18, but when we started being Ofsteded we couldn’t guarantee sufficient up-to-18 experience, largely because of the structure of schools in the area which is dominated by up-to-16 schools and sixth-form and tertiary colleges. So now the course is 11-16 with enhancement up to A-level.”
Recruitment 3.11 Science is the subject in the national curriculum and the science PGCE is the major
route for training teachers. Although many providers strive to keep a balance between those from physics, chemistry and biology backgrounds, the places for which they are funded are science places, and it is clear from Box 3.1 that biologists predominate. Departments do try to limit their biology intakes; a frequent comment was, “we try to have no more than half biologists”. But ultimately if the physics trainees do not come forward, the places are made available to chemists and biologists so that the department can draw down its full funding.
3.12 The admissions tutors’ comments on recruitment centred on a number of issues including: (a) the time at which applications came in; (b) the qualifications that were acceptable; (c) subject background; (d) the suitability of the applicants for teaching; (e) the age and gender of the applicants; (f) the impact of the university itself having a physics department; and (g) attempts to boost recruitment.
Applications 3.13 The process is complicated by the different times at which those from the different
science backgrounds apply.
Biologists tend to get in first. We are absolutely swamped with biologists when we open our books. We could probably fill the places three times over with biologists. Then a bit later the chemists start to trickle in. Last year we had filled all the places, because we do have to balance our books and then late in the summer we had physicists phoning up trying to get in which was very frustrating.
23

Box 3.2: Subject Background
“Trainees usually have a straight physics degree or a closely related one. It is a requirement that there should be a significant amount of physics in their degree. Other than physicists this year we have geologists, mechanical engineers, and an electrical engineer.” “On recruitment if they opt for the physics specialism we look for at least fifty per cent of their degree being clearly identifiable as physics.” “Most have physics or physics with astrophysics as their degree subject. Astrophysics is popular with younger graduates. There were also one or two engineers.” “We don’t get many straight physicists. This year is the exception; there are three. We get engineers, people who have worked in industry. We have one student with medical physics as a degree - their physics is fine.” “We don’t take electronic engineers but will consider mechanical and chemical engineers. But we are very wary of other physics-related degrees.” “Because we are recruiting heavily from the enhancement course the subject of first degree is quite wide-ranging rather than being straight physics or closely related. On the enhancement course they have to have some form of science degree with either some physics in their degree or to have done A-level physics.” “Nearly all are physicists with some engineers where we have to look at whether their degree course meets the requirement of at least 50 per cent physics. Some don’t, for example, engineering and management, or we find that the engineering is specialised like mechanical engineering which just isn’t sufficient preparation for physics teaching.” “We have a good reputation and attract the applicants so our recruits come in mainly with physics degrees or astrophysics.” “The physics cohort (excluding those from the enhancement course) tends to be first degree physicists or astro-physicists. If they are engineers or other allied things we would direct them to the enhancement course.” “Their degrees are either in physics or physics-related. The test is that the student has done a sufficient amount of physics at degree level so we do not consider medical-related. A student with a degree in ship science is one of the best physicists we have had in years. In other words, they have to prove their physics knowledge. There are not that many new graduates with straight physics degrees these days. We try to be open-minded but someone with a degree in motor engineering had a job convincing us of their physics knowledge, which really went back to A-level.” “It is not mainly physicists. There is a wide spread. We have those with engineering degrees and a decent maths background and others like geology. It is much more on a case by case basis.” “This year there is optometry, chemical engineering, five physics, and two astrophysics.” “Other than straight physicists we are happy to take mechanical, electronic and aero engineers. We steer clear of applicants with medical-related degrees. Two applicants were accepted on condition they did the enhancement course first. They need to be very keen to teach to go down this route. One has a degree in geological management.” “Predominantly physics, astrophysics and physics-related degrees, and various types of engineering such as mechanical, electrical. Occasionally we get earth science, geology.”
24
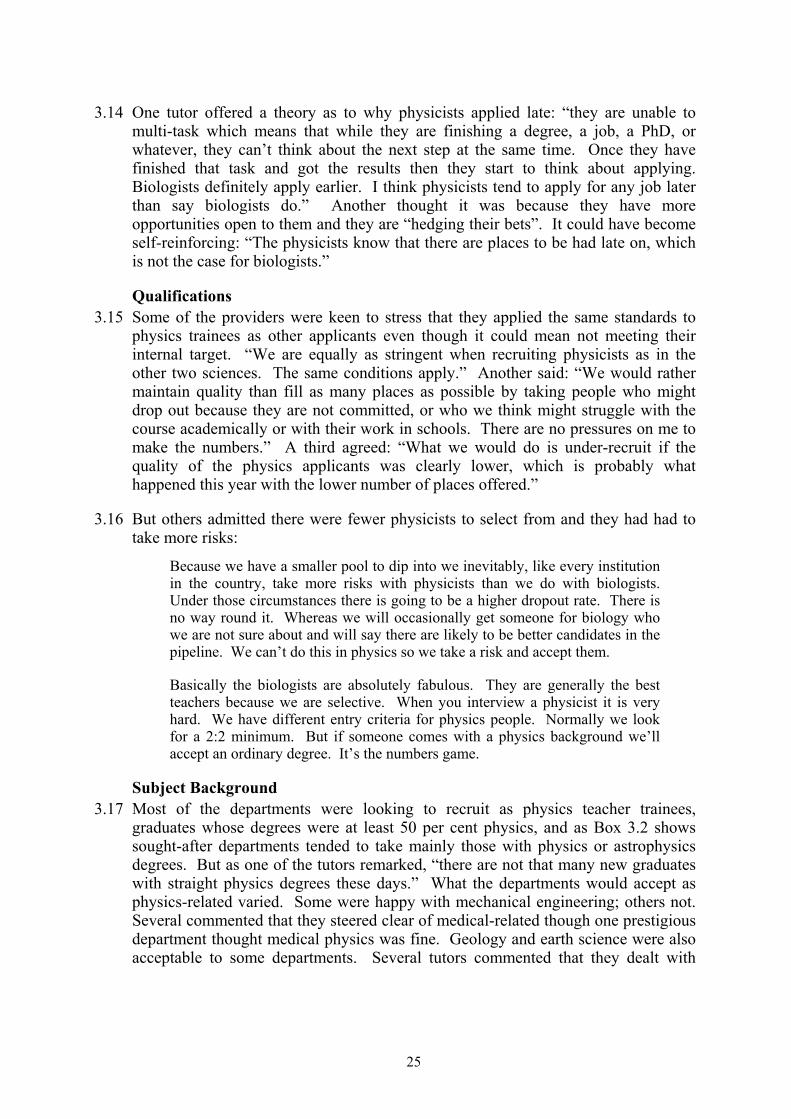
3.14 One tutor offered a theory as to why physicists applied late: “they are unable to multi-task which means that while they are finishing a degree, a job, a PhD, or whatever, they can’t think about the next step at the same time. Once they have finished that task and got the results then they start to think about applying. Biologists definitely apply earlier. I think physicists tend to apply for any job later than say biologists do.” Another thought it was because they have more opportunities open to them and they are “hedging their bets”. It could have become self-reinforcing: “The physicists know that there are places to be had late on, which is not the case for biologists.”
Qualifications 3.15 Some of the providers were keen to stress that they applied the same standards to
physics trainees as other applicants even though it could mean not meeting their internal target. “We are equally as stringent when recruiting physicists as in the other two sciences. The same conditions apply.” Another said: “We would rather maintain quality than fill as many places as possible by taking people who might drop out because they are not committed, or who we think might struggle with the course academically or with their work in schools. There are no pressures on me to make the numbers.” A third agreed: “What we would do is under-recruit if the quality of the physics applicants was clearly lower, which is probably what happened this year with the lower number of places offered.”
3.16 But others admitted there were fewer physicists to select from and they had had to take more risks:
Because we have a smaller pool to dip into we inevitably, like every institution in the country, take more risks with physicists than we do with biologists. Under those circumstances there is going to be a higher dropout rate. There is no way round it. Whereas we will occasionally get someone for biology who we are not sure about and will say there are likely to be better candidates in the pipeline. We can’t do this in physics so we take a risk and accept them.
Basically the biologists are absolutely fabulous. They are generally the best teachers because we are selective. When you interview a physicist it is very hard. We have different entry criteria for physics people. Normally we look for a 2:2 minimum. But if someone comes with a physics background we’ll accept an ordinary degree. It’s the numbers game.
Subject Background 3.17 Most of the departments were looking to recruit as physics teacher trainees,
graduates whose degrees were at least 50 per cent physics, and as Box 3.2 shows sought-after departments tended to take mainly those with physics or astrophysics degrees. But as one of the tutors remarked, “there are not that many new graduates with straight physics degrees these days.” What the departments would accept as physics-related varied. Some were happy with mechanical engineering; others not. Several commented that they steered clear of medical-related though one prestigious department thought medical physics was fine. Geology and earth science were also acceptable to some departments. Several tutors commented that they dealt with
25

applications, case by case, and degrees in ship science and motor engineering could in some circumstances be acceptable.
3.18 Seven universities are now offering six-month physics enhancement courses for graduates who need to develop their subject knowledge. Three - Keele, Loughborough and the Cumbria consortium - also run PGCE courses with a physics specialism, but four - Bath Spa, Bradford, Brighton, and East London - do not. A tutor in a university with physics teacher training commented, “if they are engineers or other allied things we would direct them to the enhancement course.” Another said, “two applicants were accepted on condition they did the enhancement course first. They need to be very keen to teach to go down this route. One has a degree in geological management.” A consequence is that physics teacher trainees will increasingly come from more diverse degree backgrounds: “Because we are recruiting heavily from the enhancement course the subject of first degree is quite wide-ranging rather than being straight physics or closely related. On the enhancement course they have to have some form of science degree with either some physics in their degree or to have done A-level physics.”
Suitability for Teaching 3.19 Some of the admissions tutors thought that the difficulty in attracting physics
graduates to teaching was not just that they were generally in short supply and much in demand elsewhere. “I think the problems lie a lot deeper. Physicists tend not to have the personal skills that you get with other people.” Another said:
To be honest with you some of the physics graduates are terrible. On interview it is quite clear they wouldn’t be very good at working with children, they can’t communicate. We also find that some of them have very poor subject knowledge. Not about passing finals, they can easily do that, but if I gave them a relatively straightforward question like ‘could you tell me what forces are acting on this cup’ they are hopeless at it. So we sift them by class of degree. If somebody has a third class we probably wouldn’t interview them except if they had some relevant additional experience, such as five years working with children.
3.20 A third tutor made the same point:
So the main difficulty is that they may well be weaker. They may not be academically weaker but it’s just the ability to relate to their fellow human beings, especially if they happen to be, say, fourteen. Some of them have worked in IT where they have sat a computer screen all day. Some of them don’t seem to have the ability to be able to respond to other people. Thinking on your feet in responding to fellow human beings is crucial.
3.21 These personal observations convincingly bear out the research of Smithers and Hill (1989) which showed that physics and teaching provide very different satisfactions. While some attracted to the abstract and impersonal patterns of physics also enjoy the continual human interaction of the classroom the overlap is not great. Thus of the small pool of physics graduates only some are ever going to contemplate teaching. This small pool is likely to include proportionally more females than males since there is a gender link in person orientation.
26

Box 3.3: Age and Gender
“Of the ten physics trainees three are women. The age of the trainees bunches in the mid to late twenties with some new graduates and some mature students as well.” “Four of the eight physics trainees are females. This year they are mainly in their twenties. But there has been a massive spread in other years between new graduates and those in their early fifties.” “Of the physicists 60-70 per cent are male. The age range is quite variable. Some are career changers; others are straight from their first degree. But the majority are younger students.” “One of the six physics trainees is female. They are always in the minority, but usually there are two or three. The physics numbers fluctuate; do not know why. The age range is spread. One trainee is in his fifties. There are two post-doc level trainees, one a woman. Then the rest have just graduated.” “In the current cohort there are 20 physicists. In terms of age there is a spread but it is not even, some new graduates and then say from 25 to 30 years old a group who may have dabbled in other things. Then there are people in their forties who may have had quite substantial careers and then there is also the one off types who may be in their fifties. The gender balance is the usual thing.” “In terms of gender, six of the 13 physicists are female. Most are new graduates or ex-PhD students. There is a mature man in his forties. The rest are less than thirty.” “We started with six physics specialists. Of the six, two were female. Ages ranged from 22 to 54 years old.” “This year we have had 13 physicists. Two were female. The age range was widely spread 21 to 55, bunched in the upper twenties and late thirties. Three were new graduates and there was one ex-company manager who was in his early fifties.” “Of the five physicists one was female. In terms of age they were in their early to mid-twenties. The oldest was 26.” “Of the 23, nine are female. The age range is 21 to forty. The average is 26 and the median is 27. It is not an even distribution it is towards the younger end. The majority have had some other activity after graduating and before applying.” “Seven of the 24 physicists are female (about 30%). In terms of age range, only one or two are recent graduates the rest have done something else, mainly post-graduate degrees or another job. The cohort is bunched mainly in the 27 to 30 age range, but one of the students is about 45 and had had another career before turning to teaching.” “The three this year are young. One had done two years of a PhD, gave it up because he didn’t like it. This year all three are male.” “The physics cohort is roughly 50/50 male, female. Their ages range from 45 to new graduates. The modal age would be about 25 to 28.” “We started with nine trainees in physics. Only one was female. Probably the average age is in the upper twenties.” “We have nine physicists, two of them female. Six of the nine were new graduates and the other three were mature students. This range is fairly typical for physics.” “Of the 15, three were female. Reflects the undergraduate composition by gender. Age 21-55, but usually bunch in mid-20s.”
27
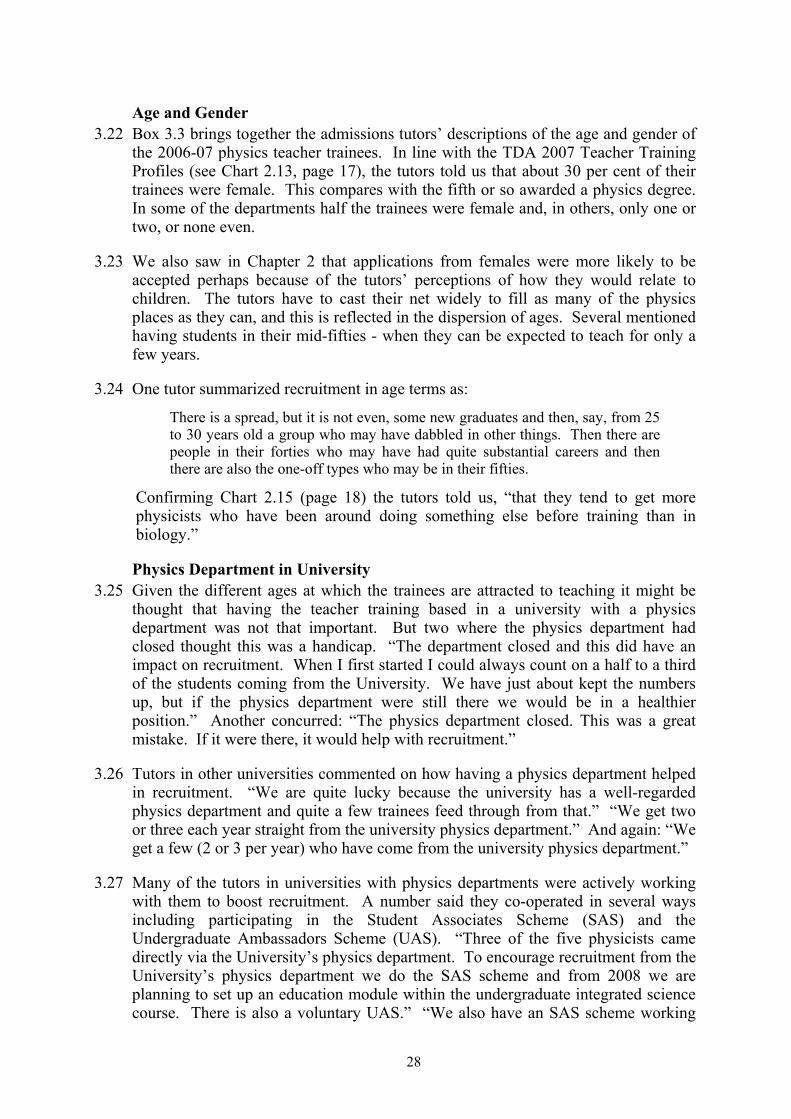
Age and Gender 3.22 Box 3.3 brings together the admissions tutors’ descriptions of the age and gender of
the 2006-07 physics teacher trainees. In line with the TDA 2007 Teacher Training Profiles (see Chart 2.13, page 17), the tutors told us that about 30 per cent of their trainees were female. This compares with the fifth or so awarded a physics degree. In some of the departments half the trainees were female and, in others, only one or two, or none even.
3.23 We also saw in Chapter 2 that applications from females were more likely to be accepted perhaps because of the tutors’ perceptions of how they would relate to children. The tutors have to cast their net widely to fill as many of the physics places as they can, and this is reflected in the dispersion of ages. Several mentioned having students in their mid-fifties - when they can be expected to teach for only a few years.
3.24 One tutor summarized recruitment in age terms as:
There is a spread, but it is not even, some new graduates and then, say, from 25 to 30 years old a group who may have dabbled in other things. Then there are people in their forties who may have had quite substantial careers and then there are also the one-off types who may be in their fifties.
Confirming Chart 2.15 (page 18) the tutors told us, “that they tend to get more physicists who have been around doing something else before training than in biology.”
Physics Department in University 3.25 Given the different ages at which the trainees are attracted to teaching it might be
thought that having the teacher training based in a university with a physics department was not that important. But two where the physics department had closed thought this was a handicap. “The department closed and this did have an impact on recruitment. When I first started I could always count on a half to a third of the students coming from the University. We have just about kept the numbers up, but if the physics department were still there we would be in a healthier position.” Another concurred: “The physics department closed. This was a great mistake. If it were there, it would help with recruitment.”
3.26 Tutors in other universities commented on how having a physics department helped in recruitment. “We are quite lucky because the university has a well-regarded physics department and quite a few trainees feed through from that.” “We get two or three each year straight from the university physics department.” And again: “We get a few (2 or 3 per year) who have come from the university physics department.”
3.27 Many of the tutors in universities with physics departments were actively working with them to boost recruitment. A number said they co-operated in several ways including participating in the Student Associates Scheme (SAS) and the Undergraduate Ambassadors Scheme (UAS). “Three of the five physicists came directly via the University’s physics department. To encourage recruitment from the University’s physics department we do the SAS scheme and from 2008 we are planning to set up an education module within the undergraduate integrated science course. There is also a voluntary UAS.” “We also have an SAS scheme working
28
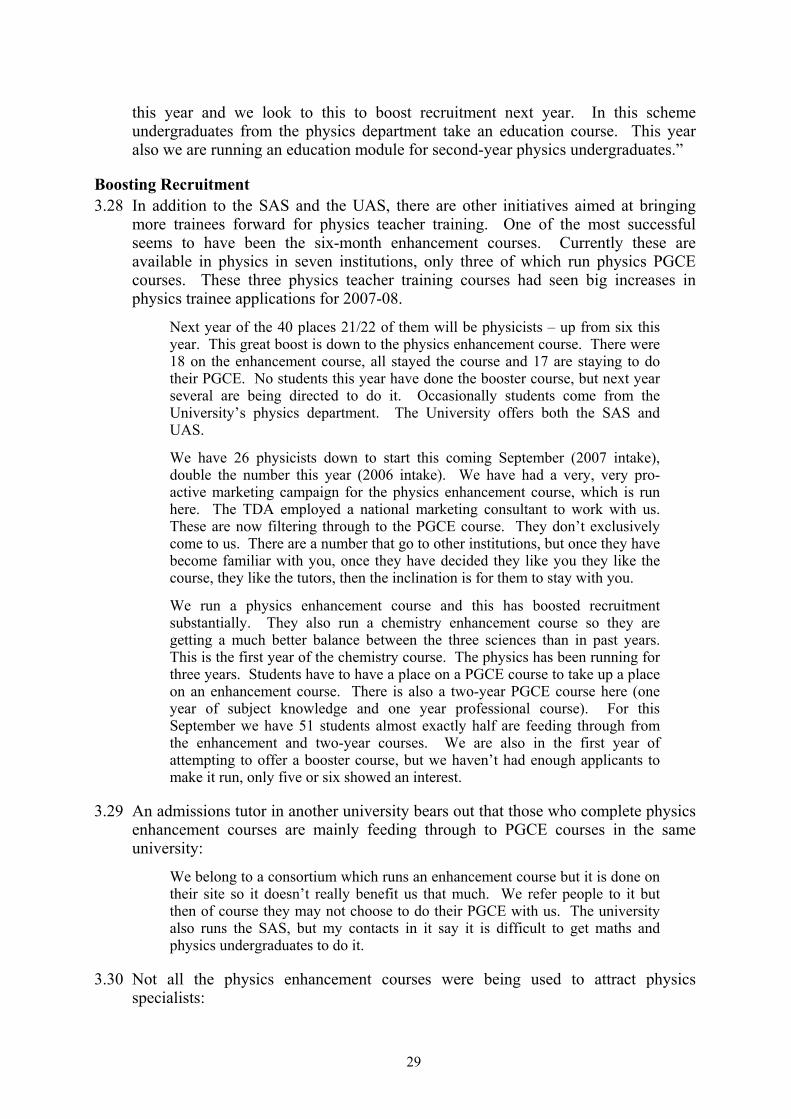
this year and we look to this to boost recruitment next year. In this scheme undergraduates from the physics department take an education course. This year also we are running an education module for second-year physics undergraduates.”
Boosting Recruitment 3.28 In addition to the SAS and the UAS, there are other initiatives aimed at bringing
more trainees forward for physics teacher training. One of the most successful seems to have been the six-month enhancement courses. Currently these are available in physics in seven institutions, only three of which run physics PGCE courses. These three physics teacher training courses had seen big increases in physics trainee applications for 2007-08.
Next year of the 40 places 21/22 of them will be physicists – up from six this year. This great boost is down to the physics enhancement course. There were 18 on the enhancement course, all stayed the course and 17 are staying to do their PGCE. No students this year have done the booster course, but next year several are being directed to do it. Occasionally students come from the University’s physics department. The University offers both the SAS and UAS.
We have 26 physicists down to start this coming September (2007 intake), double the number this year (2006 intake). We have had a very, very pro-active marketing campaign for the physics enhancement course, which is run here. The TDA employed a national marketing consultant to work with us. These are now filtering through to the PGCE course. They don’t exclusively come to us. There are a number that go to other institutions, but once they have become familiar with you, once they have decided they like you they like the course, they like the tutors, then the inclination is for them to stay with you.
We run a physics enhancement course and this has boosted recruitment substantially. They also run a chemistry enhancement course so they are getting a much better balance between the three sciences than in past years. This is the first year of the chemistry course. The physics has been running for three years. Students have to have a place on a PGCE course to take up a place on an enhancement course. There is also a two-year PGCE course here (one year of subject knowledge and one year professional course). For this September we have 51 students almost exactly half are feeding through from the enhancement and two-year courses. We are also in the first year of attempting to offer a booster course, but we haven’t had enough applicants to make it run, only five or six showed an interest.
3.29 An admissions tutor in another university bears out that those who complete physics enhancement courses are mainly feeding through to PGCE courses in the same university:
We belong to a consortium which runs an enhancement course but it is done on their site so it doesn’t really benefit us that much. We refer people to it but then of course they may not choose to do their PGCE with us. The university also runs the SAS, but my contacts in it say it is difficult to get maths and physics undergraduates to do it.
3.30 Not all the physics enhancement courses were being used to attract physics specialists:
29

Another issue is if we get applicants in, say, their late thirties, when they were at school it was possible to avoid physics as a subject, so they may have the people skills, and the biology and chemistry, but not the physics. We get them to do a small concept test (eg two people falling off a bridge, will they fall at the same speed, or one faster than the other?) and we ask how they would deliver this to young people and they are usually way off. I had two people in this boat apply this year who I think will make good teachers, but they haven’t got the physics. We failed them for the PGCE science because of their lack of breadth and we asked them to re-apply for the 2008 start to do physics and then that gives them the opportunity to get on to an enhancement course. We said ‘there is a bit of self-help needed here, get the KS3 syllabus, go to Smith’s and get the KS3 revision guide and then go on the enhancement course starting in January and we will offer you a provisional place for 2008 providing you successfully complete that course.’ That sort of time (26 weeks) is sufficient to plug the gap at KS3. They go out as science teachers not physics teachers and what we are doing is giving them access to an enhancement course to fill that gap.
3.31 Outside the universities running the enhancement courses, the PGCE physics teacher training courses had very few or no recruits coming from this source. “Next year we have three students doing the enhancement course at a neighbouring university. There are no local booster courses.” “We have had a few who have been on the enhancement course. This year one of the 23 has done the course. We also use the booster course. We usually encourage students to do this at interview, but I am not sure of the exact numbers.” “We haven’t had anyone do the enhancement course yet, but someone is doing it next year for the first time. Normally their subject knowledge is okay.” “No students this year have done a physics enhancement course. But we had a couple last year. We have also given a deferred place to someone who is going to do an enhancement course this year.” “ We have had students who have done the enhancement course. This year one of the men had formerly been an optometrist.”
3.32 Those departments most easily able to recruit to physics teacher training seemed largely unaware of enhancement and booster courses. “We haven’t had anybody yet who has gone through the physics enhancement course. We would recommend the booster course if we thought it was necessary. But we do recruit from those that have fairly strong physics backgrounds.” “I’m not too sure because we don’t run an enhancement course here. Next year there are none. As far as I am aware no one has done the booster course either.” “We have not had any students who have done the enhancement or the booster courses.”
Teaching Practice 3.33 Teacher training even in the universities is mainly school based. There is a
requirement for 120 days or 24 weeks of the PGCE course (usually 36 weeks) to be spent in being trained in schools. As well as university PGCE courses there are training routes - school centred and employment based - in which schools are in the lead. Unlike medicine, where practical training can be accommodated relatively easily in hospitals since it is a one-to-one activity, teaching involves whole classes and there is a limit on how many trainees a school can take on without becoming swamped.
30
3.34 With 40,000 teachers being trained at any one time, it can be difficult for university PGCE courses to find and maintain good training placements. We raised this with the physics admissions tutors in our interviews and four sub-themes emerged in their responses: (a) particular difficulties with physics placements; (b) difficulties with science placement in general; (c) ways of coping; and (d) the kinds of schools used.
Physics Trainees 3.35 The shortage of specialist physics teachers in schools itself imposes a limitation on
the training of new teachers. As one admissions tutor put it: “The crucial problem is finding someone in the teaching practice school to apprentice a young physicist. We are only just compliant in Ofsted’s eyes to offer training in the physics specialism to 18.” Another said: “The fact that schools may not have a specialist physics teacher has become an issue. One of our partnership schools is in that position this year and have biologists teaching A-level physics.” Sometimes it is the school which is reluctant to take on physics trainees: “Some schools will say they can’t have a physicist because they don’t have a member of staff who can mentor them properly. A lot of the schools have got physics vacancies and are light on physics teachers so they are loathe to take on physics students.”
3.36 Conversely, some schools are eager to have physics trainees because they are short of physics specialists: “We get asked disproportionately by schools ‘have you got a good physicist?’ But we are reluctant to put a physics trainee in a school where there isn’t a physics specialist teacher.” “Two of the schools - one of which is a grammar - have said they only want physics trainees. This will cause lots of problems re the knock-on effect. They are making this condition because they are absolutely desperate for physicists. In the spring the only request I got from schools was ‘have I got any physics NQTs?’”
3.37 Not all training providers are concerned whether there is a physics specialist to mentor the trainees. “Not all our schools have a physicist on the staff, but that wouldn’t necessarily mean we wouldn’t put a physicist in that school.” “It is not a problem placing physicists especially; there are lots of schools that can provide the necessary mentoring support. The physicists have to teach science at KS3, this is a TDA requirement.” “The school mentor doesn’t have to be a physicist, just a scientist, so the shortage of physics teachers in schools is not a real handicap when it comes to teaching practice.”
Science Placements 3.38 Some PGCE courses are having to work very hard to find enough school placements
for the sciences generally:
We have trouble finding enough science places per se (not because schools may not have a physicist). Getting the placements is absolutely dire. The TDA keep telling us it is not as bad as in some areas. But there is a lot of competition from other higher education institutions, the school-based schemes and the employment-based routes. We are mainly rural with few secondary schools except in the large urban areas. School science departments are also under pressure because of the new KS4 curriculum.
In this rural area there are a lot of small secondary schools which don’t have sixth forms. We are validated to 18, but it is a huge problem. If an institution
31
like ours can’t provide sixth form experience who can? I have spoken up about this at Ofsted meetings. It is just burying your head in the sand to say ‘we’re non-compliant’ or whatever’. It is a huge struggle. I am constantly juggling placements and constantly moving students from one placement to another to give them the level of experience they need.
3.39 It is, however, not just rural areas:
We can’t confine to the city – not enough schools. We have to go further afield but the problem is the population density in these areas is not high. There are a number of confounding variables. Some schools concentrate on the employment-based graduate teacher programme (GTP). I think the current inspection system is aggressive. Owing to Ofsted’s self-evaluation form and the various political polemics, some schools come under pressure, especially if they go into special measures or whatever. They have to concentrate on that and, therefore, if a student is placed there it can cause problems. Or they just say they can’t take anybody.
The main problem is that the high turnover of staff in London science departments means they are often not able to accommodate any teacher trainees. The average time in a job for a head of science in a London school is only three years. A school may have a head of department and say three newly qualified teachers. We have built up quite a large number of schools but we have had to go quite a long way out.
We are fishing in the same pool as a lot of other providers. There are also some schools that don’t take any science students at all. We have a good core of schools, but to expand the PGCE course would be very difficult.
3.40 It would be wrong to give the impression that all PGCE courses are struggling to find placements. “Generally there are no problems including also finding schools which provide A-level experience. The university has built up good relationships with schools through school partnerships.” “We haven’t had difficulty in finding placements. Our school partnerships are relatively stable.” “Largely placement is not an issue for us. The majority of our schools are in the 11-18 age range. We work with a partnership of schools locally and that partnership cuts across all subject areas.” But they were a minority. Only five of the 28 (17.9 per cent) said that teaching practice placements were not a problem.
Ways of Coping 3.41 It was evident from the interviews that finding sufficient school placements was
becoming increasingly difficult for many providers and their availability could be a limiting factor. This is leading some universities to look at new ways of organising school experience:
Currently we haven’t got enough places to meet all our needs. It would be a lot easier for us if the government intervened and said all schools must take trainees unless there was a very good reason not to. We are collaborating with the TDA on a pilot scheme for paired placements. The idea is the school science department would take two trainees and some of their teaching would be team teaching, so the impact on the department would be lower but there is still a lot of value in it because the trainees have to learn to work with others and they can give feedback to the other trainees, so there is constant feedback.
32

The downside is that they may not get on with the other one in the pair. But it is more cost effective for the schools because the weekly mentoring meeting, which is a condition of the partnership agreement, is less time consuming.
We have difficulty in finding placements for all our scientists. This coming year we are starting a paired placements scheme whereby we will be putting four science students in a school together, sharing two timetables so at various points one is leading and one is acting as a teaching assistant.
3.42 Placements for post-16 teaching were proving especially difficult. One admissions tutor said, “only three of our 25 partner schools have a sixth form so we have multiple double placements to ensure everybody gets a chance.” Some courses used sixth-form and FE colleges: “All the scientists all need some A-level contact and we do manage to do that. Sometimes we have to take them out of their 11-16 school and put them into a sixth-form college or an FE college for a two week placement.” But others were deterred, “because it is difficult to arrange the timing” and “you can only get post-16 experience in them”.
Schools 3.43 Most of the courses placed trainees in independent schools. One admissions tutor
said, “in this area we couldn’t manage without them.” Another said: “We use independent schools for teaching practice. The majority of the schools are 11-16 in this area so we struggle to provide every trainee with post-16 experience.” Another thought it was positively desirable, “we use independent schools for teaching practice since it enables the student to see both sides of the coin.” But three of the leading providers declined to use them on ideological grounds. “We haven’t used the independent sector for physics in the last four or five years because we are expecting our trainees to apply to the public sector.”
3.44 With secondary schools having been encouraged to become specialist, the science schools might have been expected to play a major role in the training of science teachers, but none of the providers operated a particular relationship with them. As one said, “we haven’t got that luxury.” In fact, another said, “it is more difficult to get a specialist science school for placement because a lot are going down the GTP route.” The consensus was, “placements are not guided by whether the schools are specialist science schools or not.”
Retention 3.45 Chart 3.1, page 20, shows that 53 of the 281 (18.9 per cent) entrants to physics
teacher training in 2006 had not successfully completed their courses during the year. Across the 28 providers, the non-completion rate ranged from 0 to 55.5 per cent. Not all of the non-completers had given up on teaching; some had transferred to other courses and others had deferred hoping to come back next year.
3.46 The apparently high drop out rate is not unconnected with the low numbers putting themselves forward. One tutor said: “My gut feeling is that a higher proportion withdraw in physics followed by chemistry and then biology, basically because we have less choice when recruiting physical scientists.” This impression is not entirely borne out by the TDA Teacher Training Profiles for 2005-06 (Chart 5.2, page 55), But other tutors developed the point: “Because we have a smaller pool to dip into we
33

inevitably, like every institution in the country, take more risks with physicists than we do with biologists. Under those circumstances there is going to be a higher dropout rate.” Another admitted: “We have different entry criteria for physics people.” On the other side of the coin a tutor said: “We have a very low level of fall out due to the rigorous selection process. We have about six times as many applicants for science as we have places, so there is a very high sifting rate.”
3.47 In the interviews a wide variety of reasons were cited for dropping-out, but they can be grouped under four main headings: (a) unhappy with physics as it is in schools; (b) inability to cope in the classroom; (c) transfers to other courses; and (d) for domestic or health reasons.
Nature of School Physics 3.48 One of the main reasons for dropping out was a tension between the way trainees
saw physics and the way physics is regarded in schools as part of science. The tutors offered a number of examples:
The physics they see out there is not the physics they love. As far as I can see, we only have one classic physicist who is going into a job. He has a real love of physics. He has done astrophysics at Masters’ level, bright-eyed and bushy tailed, wanting to change the world, really youthful enthusiasm. Got snapped up straight away in a job. To me he is one of the very few I have seen who can demonstrate a passion for the subject and then pass on that passion. They are very, very thin on the ground.
Though a youngish person he is fairly traditional and he didn’t like the new GCSEs. He’s very much the old sort of practical, making experiments, building radios that sort of physicist and this new syllabus about debating issues, discussing whether we should have nuclear power and so on, he felt totally bewildered by it.
He wasn’t enjoying teaching. He found the level of the physics he was working with wasn’t giving him an intellectual challenge. I always tell them it is not the science that is the challenge; it is the teaching of the science.
3.49 The subject of the third quote was also in the process of trying to write up his PhD so it may be that his level of commitment was not all that it might have been. Not only is it the physics per se that can cause the trainees to give up or be asked to leave, but also its position in science. We will be exploring this in more detail later in the ‘combined science’ section, and give just one example here: “I feel that physicists tend to be narrower in their field and there is an element there of biology not being quite respectable and that makes life difficult for them in school.”
Unsuited to Teaching 3.50 The other major reason for leaving is that the trainees are unsuited to teaching. As
one tutor succinctly put it, “it is usually the case that they love their physics but don’t like working with children.” Another said, “they mainly leave because of poor classroom management skills or poor subject knowledge which is not as strong as their degree indicated.”
3.51 This is borne out by the particular examples the tutors gave. “One left at the start of teaching practice - couldn’t face a class. One left after a debriefing that teaching
34
was not for him.” “He just couldn’t do it. It took him a while to come to terms with that but the mentors in the schools and the tutors in college were convinced he couldn’t do it and he was advised to withdraw.” “Two thought their notion of physics was not how it is in schools, so they decided teaching was not for them. They are purists to a degree and they don’t see the same sort of purity in schools. Inevitably there were class management problems because of this mismatch.” “Mostly it is about what they want to be able to do in relation to what they actually can do in teaching physics. They have ideas that just won’t work in the classroom. In an urban school lecturing for an hour will just not work and they find it difficult to accept that there is any other way.”
3.52 But one of the other examples is an interesting comment on the perceived correct way to teach physics:
He didn’t actually want to leave. He had worked very hard at being a didactic teacher and couldn’t really get his head round the whole idea of thinking from the child’s perspective and thinking from a learning perspective and not from the teacher delivery perspective. He was very, very good at chalk and talk and in spite of all the efforts of the school and the university combined he didn’t really meet the criteria required and didn’t meet the standards at all so he left the day before the external examination. I feel pretty sure it would have been recommended that he didn’t pass.
Transfer 3.53 Several of those withdrawing from the physics PGCE were doing so to transfer to
other teaching courses, quite often to primary. “The female pulled out at Easter because she decided she wanted to be a primary school teacher. She has been accepted on to the primary course.” “One transferred to the primary PGCE.”
Personal 3.54 Trainees were also withdrawing for a range of personal reasons. “Another student’s
wife died. He deferred intending to come back next year.” “One deferred because his wife had had another baby.” “There was only one other drop out and that was for health problems.”
Destinations 3.55 Of the 28 admissions tutors, 21were able to give us, in June and July 2007, detailed
information on the completing trainees’ employment plans for September 2007. Chart 3.2 presents the figures. Of the 190 starting training in these departments, 34 withdrew, deferred, transferred or failed, which at 18 per cent is about the same as the proportion of the cohort of 2006-07 physics trainees shown in Chart 3.1. The reasons for dropping out have been discussed in the previous section, and here we concentrate on those who successfully completed the course.
3.56 The main reported destinations were teaching in state schools, teaching in independent schools, not taking a teaching post and still seeking one. It seems that of those commencing training, just 60 per cent made it into state schools, which is a proportion which needs to be borne in mind when creating supply and demand models. The TDA Teacher Training Profiles for 2005-06 show that 71.6 per cent of
35

the PGCE physics trainees entered teaching (Chart 5.2, page 55), but this also included the independent schools
Chart 3.2: Destinations Destination Number Percentage
Started 190 100.0 Withdrawn/Deferred/Failed 34 17.9 Teaching in State School 114 60.0 Teaching in Independent School 21 11.1 Not Entering Teaching 12 6.3 Still Seeking Post 9 4.7
3.57 Eleven per cent were reported as taking up posts in independent schools. The attraction was explained by the tutors: “Two of the seven have got jobs in independent schools. A big draw for them was because they knew they would only be teaching physics.” “One has gone into the independent sector. He really did well on teaching practice in a very challenging school and then he was put in an independent school. Did really well there too and they offered him a job and he accepted.” Trainees in those departments which refused to use independent schools for teaching practice still took up appointments in them: “One is going to an independent school. He told another member of staff, he wouldn’t dare tell me, ‘I want to work in a decent school and in the area I am going to I just wouldn’t be able to work in the state system’”.
3.58 Twelve (6.3 per cent) had decided not to seek a post for September 2007. The reasons were various. “One has postponed teaching to do a year’s voluntary work in the church. Another is going to do a PhD in physics.” “She is seven months pregnant and is not applying but may do so next year.” “One is going abroad for personal reasons - to join his girl friend.” “For a variety of reasons four are not looking. One is off to Tanzania on a gap year, another is taking a career break for a year or so.” “One decided he wasn’t really sure he wanted to go into teaching and withdrew from the post. He may well go into some kind of teaching in time. One is deferring applying for a job because he wanted to do other things.” “One is still considering what he wants to do.” “Only one has not got a job. He is a student from another part of the UK and is still deciding whether to return or not.”
3.59 The remaining nine (4.7 per cent) were thought to be still seeking a post. This was not necessarily because the jobs were not there: “At the moment our physicists know they are gold dust. I have had so many people e-mailing me to ask if we have any physicists available and, of course, they have already got jobs ages ago.” “By and large the physicists and also the chemists get jobs much earlier than the biologists.” “They get snapped up.” But there could be particular reasons: “Two of the trainees have not got jobs. Both are mature students and one is in his mid-fifties.” Some of the trainees had just not got round to it. “Three have not got jobs yet (late July), mainly because they are dilatory in applying.” “He is being very laid back and is going to look for a job at some point.” “The fifth still has to start looking.” It could also be that the trainees were being very selective: “He has been offered a job but is
36
being very picky because he knows he can be” and “One of those still looking is intending to go into an independent school.”
Physics as Combined Science 3.60 Teachers are trained to teach the national curriculum and science is the subject
specified. There is a requirement that all newly qualified science teachers should be able to teach national curriculum science even though they themselves may not have studied all three of the main sciences. Physics is, therefore, subsumed within science and it does not emerge as a subject in its own right in many schools until A-level. We asked the 28 admissions tutors whether they saw this as (a) a problem; (b) whether they thought it put off potential applicants; and (c) whether they thought there were any issues for school science?
A Problem? 3.61 Twelve (42.9 per cent) of the tutors explicitly stated that having to teach the three
sciences was a problem, seven (25.0 per cent) thought it was a positive development and nine hedged their bets (32.1 per cent). The argument against physics being subsumed in science was put most forcefully by a tutor who was leaving: “I am fed-up with a policy that says physicists can teach biology and chemistry to GCSE. It is a myth and they don’t want to do it.” He was backed up by other tutors: “The TDA requirement is to recruit people who are interested in science, but in reality the physicists are only really interested in physics, the biologists are only interested in biology, and likewise the chemists in chemistry.” “Generally physicists don’t like having to do biology at KS3 and 4 and vice-versa.”
3.62 The contrary view was expressed by one in four of the tutors:
It doesn’t seem to be a put-off for physicists. In fact some of them seem to positively enjoy having to teach some biology and chemistry. We are always right up front both at interview and on the course that they will have to teach across the sciences to younger pupils. We do support the physicists for teaching biology. This doesn’t mean of course we have formally asked the trainees about this issue. It is an expectation they have so there hasn’t been an argument about it.
3.63 About a third hedged their bets:
Some only want to teach their specialism. Some are happy to teach across the specialisms. We do make it clear at interview the nature of the system we are working in. You train as science teacher with a specialism because that is what is on offer.
Deters Applicants 3.64 The overall message is one of reluctance on the part of the physicists to teach
biology and the biologists to teach physics. However, because it is made clear at interview that the subject is science with a specialism, most of those who accept that condition go along with it, with varying degrees of enthusiasm. This leaves open the question of how many potential teachers of physics with physics backgrounds are put off by the requirement to be able to teach science to GCSE. One of the tutors spelled this out:
37

My take on this is that we attract a sub-set of the possible physicists. In other words, it is made very explicit to people that part of the deal is teaching outside your specialism therefore the ones who come forward and apply have accepted that as part of what is required and often are really quite happy about it. The unanswered question for me has always been: how many out there find out about that and say it is not for me?
3.65 Another tutor gave a particular example:
The only physicists that apply are those who are prepared to teach the other specialisms. Only this week I interviewed an engineer who wanted to train to teach physics but when it was explained that he would have to teach biology and chemistry he didn’t follow through with the application. It raises all sorts of questions. Is physics so important that they should not have to teach biology? I don’t think so and I am a physicist.
3.66 The tutors also gave some examples of who was likely to be deterred:
I’m sure it does put some off, particularly if they have been through an independent school and left biology alone when they were fourteen and they don’t want to revisit it. Personally I think this is flawed science teaching in that you don’t make the links particularly for the young pupils.
Having to be competent to teach across the sciences at KS3 possibly does put off the pure physicist from applying, especially if they have not been down the routeway of double award science as pupils. They still think of themselves as physicists.
3.67 But some of the tutors suggested that things may be changing as the trainees come from among those who themselves have experienced national curriculum science:
It is the more mature trainees that find the combined science requirement more unpalatable. The younger trainees have themselves come through the combined science route in school.
3.68 Or having come from another background and taken a physics enhancement course:
If they are people who have come from the enhancement course their first degree would have been in another subject. What we have found with people who have gone through that course and then the physics PGCE is that once in post the headteachers are very much looking at them as double value because they can teach two A-level subjects.
School Science 3.69 The tutors were split on what they saw as the consequences for school science.
Some thought it necessary to insist on the trainees being able to teach all three sciences to bring out the links, others were concerned at what it meant for physics and the teaching of science.
What is concerning is that some of the fundamental physics skills that I had as a young professional in the classroom have now gone. They are not being passed on to the kids because there is no requirement for them to do it and so on to potential trainees. You lose this richness of background so they can deliver competently the subject in today’s classroom. We are in a downward spiral unless you capture those skills, unless you document those skills. As an
38
example, take the coefficient of linear expansion, how much something expands when it is heated and the maths needed to calculate it. We used to have to do this at O level, now: (a) they don’t have the maths skills to do it; (b) they don’t have the syllabuses to drive it through; and (c) they don’t have the fundamental construction skills to be able to know as a physicist the sort of measurements to do. There is a whole raft of stuff like this. In a grammar school I go into on teaching practice visits there are shelves of equipment. It hasn’t been chucked away, but nobody knows what to do with it; they don’t know how to use the equipment. When physicists get into schools many of the things that might enthuse them as physicists are not part of the curriculum. Science is being ‘dumbed down’. Things are now so prescriptive, you can’t go off at tangents like the astro-physicist, who gets so enthused with his subject would like to do. The time is just too tight. I think the extension of individual sciences to the maintained schools was a good move, rather than wrapping physics up in science.
3.70 A number of other tutors made similar points:
We are just reaping the rewards of the national curriculum. We are not generating the physical scientists. Science has become such a boring subject. Once they introduced science as mandatory it made the courses and the teachers cater for the fact that they were trying to interest girls in physics and boys in biology. But there never was a problem with biology. Now when they get to sixteen they vote with their feet as far as physics is concerned. The amount of experiments I see in schools that are being done by whole classes is woefully small. Instead they are sitting down with scientific papers and trying to make sense of that and science in the news and all of that. In fact, one lad said to me ‘we don’t do this much reading in English!’”
We are not picking up physical scientists because in primary schools there aren’t many scientists and most of them are biologists. KS3 science is mainly taught by biologists. Watching them teach biology their lessons are really enjoyable even though as student teachers they are novices. When they come to teach chemistry and physics their lessons are wooden, competent, but uninspiring. Schools place their physicists and, to some extent, chemists at KS4 and the sixth form when all the damage has been done.
The issue with physics is the reduction of the mathematical content. I did some research in the nineties looking at the amount of maths being taught in science lessons and most was in the physics part of the syllabus but it is dropping all the time. The equations of motion are not there, etc. So what you find now are those aspects of mathematics that were taught at O-level are now taught at A-level and some of them have been ditched at A-level, like projectile calculations. I teach them at undergraduate level. So in that sense we are not dumbing down - we are just waiting for them to be about seven years older!
3.71 The admissions tutors were ambivalent about independent schools. A few refused to use them for teaching practice placements because they saw themselves as training teachers for the state sector. They commented that graduates from independent schools were amongst the most likely to baulk at having to train to teach biology. But almost all the leading teacher training departments had some of their trainees going to teach in independent schools. As one explained:
39
Yes, they are reluctant to teach across the sciences. They all come with maths and often further maths at A-level. So for them they think they should be teaching physics and maths. It does depend on individuals though. This year one of the female physics graduates from the university said she loved teaching all three sciences on TP, yet she has taken a job in an independent school and will be teaching straight physics.
3.72 What comes through in these interviews is that physics is now available in two different forms in schools. On the one hand, it is subsumed within science which is consciously accessible to all pupils and, on the other, it is available as a subject in its own right - in some but not all schools. Independent schools are prominent among those that still teach physics, so much so that one tutor confessed, “One thing I am grateful to the independent sector for is that it has kept physics alive”.
Physics and Maths 3.73 Given that some potential physics teachers were evidently put off by the prospect of
teaching biology, that physics and engineering degrees require a high level of mathematical understanding, and that there is a severe shortage of physics teachers, the obvious question is would it make sense to offer an alternative PGCE course in physics alone, or physics and maths?
3.74 Of the 28 tutors, eight were clearly in favour, five strongly against, but most had mixed views largely because they could see difficulties. Several tutors commented that they used to have a physics PGCE where you could choose a second subject to physics, which was often maths. One developed the point: “Most physicists, rather than teach chemistry or worse still biology, would sooner teach maths. It is silly to get this rare commodity of a physics specialist and then tell them they have to teach biology.” The arguments in favour centred on bringing in more physics trainees and trainees with greater expertise in physics.
I like the idea because with the STEM agenda we need to marry science and maths together as much as we can. My experience of schools in this region is that they would welcome teachers who could teach any maths or physics at all.
Joint maths and physics PGCE would provide another option. I have long thought that physicists would much sooner teach maths and physics because these subjects are more relevant to their A-levels. I have also met people in schools with good physics degrees who are maths teachers because they didn’t want to teach the other sciences.
We are obviously turning down people for teaching because they want to teach physics and maths. I am also sure that there are some people who end up doing maths or science and would rather be doing both and equally some people who don’t come into teaching in the end because they couldn’t do physics and maths together.
3.75 The case against is essentially that science is science and maths is maths:
I am quite anti that. It would undermine both the maths and the physics. My other problem is - and this comes from speaking to my maths colleagues and I agree with them on this - we spend a lot of time on pedagogy in science and I worry that if we had to fit in the pedagogy of how to teach maths something
40

else would have to be sacrificed so you could end up with someone teaching maths and physics really badly.
It would be extremely damaging to science to isolate physics and then have the rest of the time just teaching mathematics. It is important that schools have a mixture of the sciences.
I can see from the trainees’ point of view this might be attractive. But I would worry about science in schools, where the biologists and chemists might end up working separately from the physicists. My preference would be to leave things as they are. The pedagogy of teaching maths and physics is also very different. I think maths should be taught by mathematicians trained to teach maths.
3.76 But most of the tutors had mixed feelings, largely because of the difficulties they could foresee. Among those they mentioned were:
• current requirements: “Not possible under current requirements.” “Unless the Ofsted inspection for ITT is altered it will not happen.” “Under current arrangements this would be spreading physicists too thinly.”
• course organisation: “Exceptionally difficult to find partnership schools where students could be guaranteed a physics-only experience.” “The main constraint would be time to fit the joint course in.” “We approached our PGCE maths department to see if they would like to work in harness with us on a joint PGCE and they said ‘maths recruitment is doing very well thank you and we really don’t want to stretch ourselves any more’.”
• recruitment: “They may end up as maths teachers - we may end up robbing Peter to pay Paul.” “I doubt it would boost physics numbers. Those who came over from single maths would probably drop out.” “I can see it would be more attractive to applicants who want to do mathematical physics, but I am not absolutely certain that they would be the same applicants who I would actually want to teach science. I am looking for applicants who have a joy in science and who want to share that enthusiasm for physics in the real world.”
• school organisation: “It would be difficult to bridge two departments in school.” “In schools you would end up doing two jobs rather than half of each.” “It would generate tension between departments in schools if someone was straddling maths and science and it would be more trouble than it is worth.”
Trends and Prospects 3.77 Of the 28 admissions tutors, only three were looking forward to substantial
improvements in their recruitment and these were the departments mounting enhancement courses. Of the other 25, three were optimistic, but 22 thought filling the places was going to continue to be a struggle. There was thus a split between those who viewed prospects through the lens of an enhancement course and those who did not.
41
Enhancement Course 3.78 Two of the three universities with a PGCE course in physics that were running an
enhancement course reported major increases in the number of physics trainees, and the third was hoping for a significant boost:
Five years ago, if you had five physicists you were doing well. Since then we have quadrupled that. We have put a lot of strategies in place to improve recruitment. It’s meant that we have had to be very pro-active and work hard at it. We are also in the fortunate position in that we are one of the few universities left that have an undergraduate physics department. So our enhancement course is taught with the help of our physics department. We use cutting-edge physicists to teach on the enhancement course. The course is also validated with a ‘Certificate in Higher Education’ award. The concept has been expanded. From August we are offering a type of enhancement course for serving teachers, so we are one of the pilots for the SAPs (The Science Additional Specialism Programme). We are doing a sort of condensed version of the physics enhancement course for serving teachers, who are very often chemists or biologists.
There are about 20 physicists and chemists on the enhancement course and some 14/15 will be doing their PGCE with us. So, definitely these courses have boosted recruitment.
Physics and chemistry have gone in cycles, there has been no definite trend. It has always been between four and eight but we are hoping for a boost next year because of recruitment from the enhancement course.
No Enhancement Course 3.79 Three of the other departments were optimistic, believing they would be getting get
more applicants because the incentives, enhancement and booster courses, and education modules in degree courses were drawing more in:
The numbers are changing and the evidence is that they are improving. So this year at this point in the recruitment cycle we are ahead of where we were last year. If it continues we will have more than this year’s 23, which is the biggest group we have had for about ten years. Last year we had 18 physicists.
The physics numbers are slightly up and I sense there is a greater awareness of the enhancement and booster courses and the incentives for physics recruitment and we as a department are taking a more active stance.
I get the feeling that there are more physicists around amongst the interviewees than previously. I am more optimistic about physics recruitment for this coming autumn. I think it might be that the various recruitment initiatives are beginning to pay off, especially the new education module.
3.80 But the other 22 universities did not see the general situation improving much in the near future. One tutor encapsulated the general mood:
I can’t imagine why it would (get better) to be honest. There aren’t that many people going into physics degrees and for those that come out there are plenty of other career opportunities. There are a number of issues concerning the national curriculum and how science is treated in some schools, especially in 11-16 schools, where they don’t teach physics, chemistry and biology as individual subjects. So the pupils haven’t got a very strong basis of knowing
42
what these subjects are, so why would they choose them at A-level. I don’t think we have helped the situation in a number of ways. Now we have got a situation where in a lot of the schools lower-school physics is taught by non-physicists. It becomes self-perpetuating after a while.
3.81 The departments raised a number of specific concerns:
• “The looming cloud of universities shutting physics departments.”
• “It has always been a great struggle and we take greater risks with selection. We have little ups and downs according to how the economy does. The better the economy the worse we do.”
• “The physicist as a person. They tend to relate very well to apparatus and not as well to people. So there are a lot of physicists who are just not interested in people interactions in the classroom which is always going to limit the field of physics specialists in teaching.”
• “We are picking from a small pool in the first place. Then there is the whole explosion in the jobs market with financial services and so on, electronics and computing. The whole field is open to them and they can command very good salaries.”
• “The quality of the candidates. Every year we in physics have to wait the longest of the three sciences to fill up the places. You can speculate that the late applicants were waiting the outcome of some other job applications or doctoral research post. Certainly those rejected tended to be late applicants and they were often turned down due to their apparent lack of commitment to teaching.”
• “The apparent boost in science recruitment is going to be short-lived. The financial incentives are not enough. We are spending a lot of our time at careers fairs, adverts in the press and so on for really the equivalent of rolling a ball up hill.”
• “We need a curriculum that turns kids on to an excitement and wonderment for the physical sciences. I don’t think the king has got any clothes on. With this centralised system if you make a mistake in one area you pull the whole edifice down with it. Can’t go back because the expertise in the school system is not there.”
• “Other countries don’t do this combined approach. A friend in Belgium who teaches physics has maths as a second subject. In France they have a teacher who does the physical sciences and then another teacher does the biology.”
• “Using biologists to teach physics as part of science is never going to work. Downstairs, right now I have a room full of biologists who are desperately trying over the next two weeks to get a toehold in physics. They are conscientious people and hardworking people and some of them will be absolutely super teachers but physics will never be in the palm of their hand.”
43
Résumé 3.82 The admissions tutors of all 28 universities listed on the Graduate Teacher Training
Registry website as having physics teacher trainees in 2007-08 were interviewed in June and July 2007. The courses whether labelled science or physics were all science PGCEs designed to enable the trainees to teach national curriculum science. TDA allocations were for science places and departments found it difficult to meet internal targets for physics.
3.83 Biologists tended to apply early and physicists late. Although departments tried to apply the same standards to both, some admitted that they took more risks with physicists. Non-completions overall amounted to 18.9 per cent which is higher than that recorded by the TDA, but the admissions tutors were also including deferrals and transfers. Tutors agreed that many more physicists than biologists were temperamentally unsuited to teaching, so that the small pool of graduate physicists is, in fact, even smaller as far as teaching is concerned.
3.84 The difficulty of finding teaching practice placements with physics specialists as mentors and sixth form experience was leading some departments to experiment with doubling up trainees. Independent schools were used by most, but not all universities, with the top universities among them, because some tutors saw themselves as training exclusively for the state sector. Nevertheless, independent schools proved attractive for physics specialists even from those departments.
3.85 Of the 28 tutors, 42.9 per cent thought subsuming physics within science was a problem although 25.0 per cent thought it was a positive development. Having to teach all three sciences was thought to deter some applicants and to have an impact on school science which had become less practical and less mathematical. Some tutors (28.6 per cent) thought that there should be a physics and maths PGCE, but 17.9 per cent were against. Most could foresee difficulties involving, among other things: current requirements; course organisation; robbing Peter to pay Paul; and the separation of science and maths in schools. Of the 28 tutors, three had experienced a boost to recruitment from their science enhancement courses, three were optimistic about the future believing that incentives and attempts to widen the pool of potential recruits were beginning to pay off, but 22 (78.6 per cent) thought that recruitment to fill physics teacher training places within science would continue to be a struggle.
44
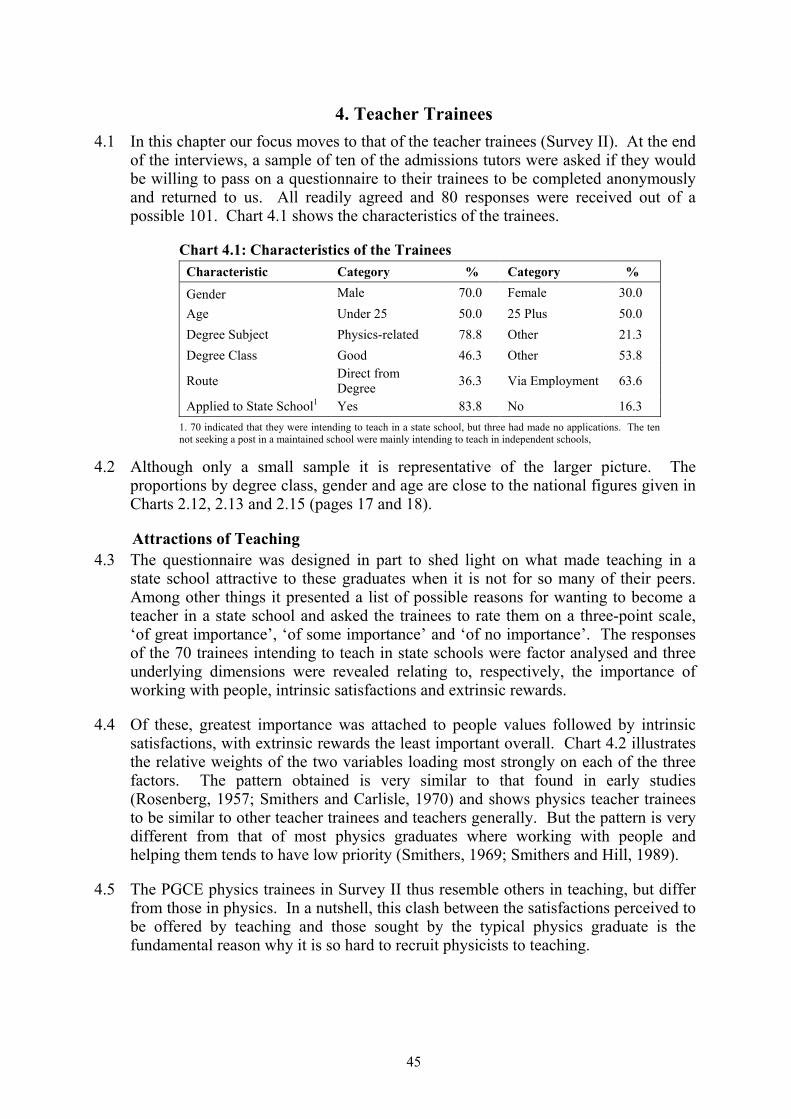
4. Teacher Trainees 4.1 In this chapter our focus moves to that of the teacher trainees (Survey II). At the end
of the interviews, a sample of ten of the admissions tutors were asked if they would be willing to pass on a questionnaire to their trainees to be completed anonymously and returned to us. All readily agreed and 80 responses were received out of a possible 101. Chart 4.1 shows the characteristics of the trainees.
Chart 4.1: Characteristics of the Trainees Characteristic Category % Category %
Gender Male 70.0 Female 30.0 Age Under 25 50.0 25 Plus 50.0 Degree Subject Physics-related 78.8 Other 21.3 Degree Class Good 46.3 Other 53.8
Route Direct from Degree 36.3 Via Employment 63.6
Applied to State School1 Yes 83.8 No 16.3 1. 70 indicated that they were intending to teach in a state school, but three had made no applications. The ten not seeking a post in a maintained school were mainly intending to teach in independent schools,
4.2 Although only a small sample it is representative of the larger picture. The proportions by degree class, gender and age are close to the national figures given in Charts 2.12, 2.13 and 2.15 (pages 17 and 18).
Attractions of Teaching 4.3 The questionnaire was designed in part to shed light on what made teaching in a
state school attractive to these graduates when it is not for so many of their peers. Among other things it presented a list of possible reasons for wanting to become a teacher in a state school and asked the trainees to rate them on a three-point scale, ‘of great importance’, ‘of some importance’ and ‘of no importance’. The responses of the 70 trainees intending to teach in state schools were factor analysed and three underlying dimensions were revealed relating to, respectively, the importance of working with people, intrinsic satisfactions and extrinsic rewards.
4.4 Of these, greatest importance was attached to people values followed by intrinsic satisfactions, with extrinsic rewards the least important overall. Chart 4.2 illustrates the relative weights of the two variables loading most strongly on each of the three factors. The pattern obtained is very similar to that found in early studies (Rosenberg, 1957; Smithers and Carlisle, 1970) and shows physics teacher trainees to be similar to other teacher trainees and teachers generally. But the pattern is very different from that of most physics graduates where working with people and helping them tends to have low priority (Smithers, 1969; Smithers and Hill, 1989).
4.5 The PGCE physics trainees in Survey II thus resemble others in teaching, but differ from those in physics. In a nutshell, this clash between the satisfactions perceived to be offered by teaching and those sought by the typical physics graduate is the fundamental reason why it is so hard to recruit physicists to teaching.
45
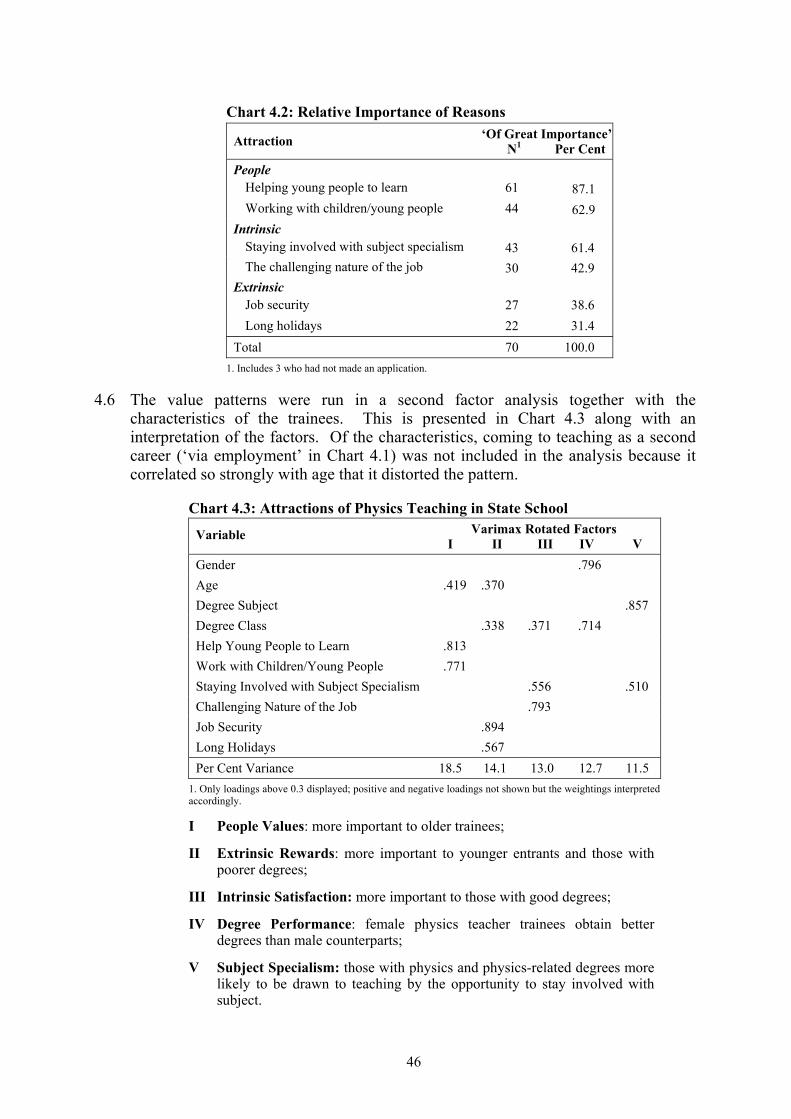
Chart 4.2: Relative Importance of Reasons ‘Of Great Importance’ Attraction N1 Per Cent
People Helping young people to learn 61 87.1 Working with children/young people 44 62.9
Intrinsic Staying involved with subject specialism 43 61.4 The challenging nature of the job 30 42.9
Extrinsic Job security 27 38.6 Long holidays 22 31.4
Total 70 100.0 1. Includes 3 who had not made an application.
4.6 The value patterns were run in a second factor analysis together with the characteristics of the trainees. This is presented in Chart 4.3 along with an interpretation of the factors. Of the characteristics, coming to teaching as a second career (‘via employment’ in Chart 4.1) was not included in the analysis because it correlated so strongly with age that it distorted the pattern.
Chart 4.3: Attractions of Physics Teaching in State School Varimax Rotated Factors Variable
I II III IV V Gender .796 Age .419 .370 Degree Subject .857 Degree Class .338 .371 .714 Help Young People to Learn .813 Work with Children/Young People .771 Staying Involved with Subject Specialism .556 .510 Challenging Nature of the Job .793 Job Security .894 Long Holidays .567 Per Cent Variance 18.5 14.1 13.0 12.7 11.5
1. Only loadings above 0.3 displayed; positive and negative loadings not shown but the weightings interpreted accordingly.
I People Values: more important to older trainees;
II Extrinsic Rewards: more important to younger entrants and those with poorer degrees;
III Intrinsic Satisfaction: more important to those with good degrees;
IV Degree Performance: female physics teacher trainees obtain better degrees than male counterparts;
V Subject Specialism: those with physics and physics-related degrees more likely to be drawn to teaching by the opportunity to stay involved with subject.
46
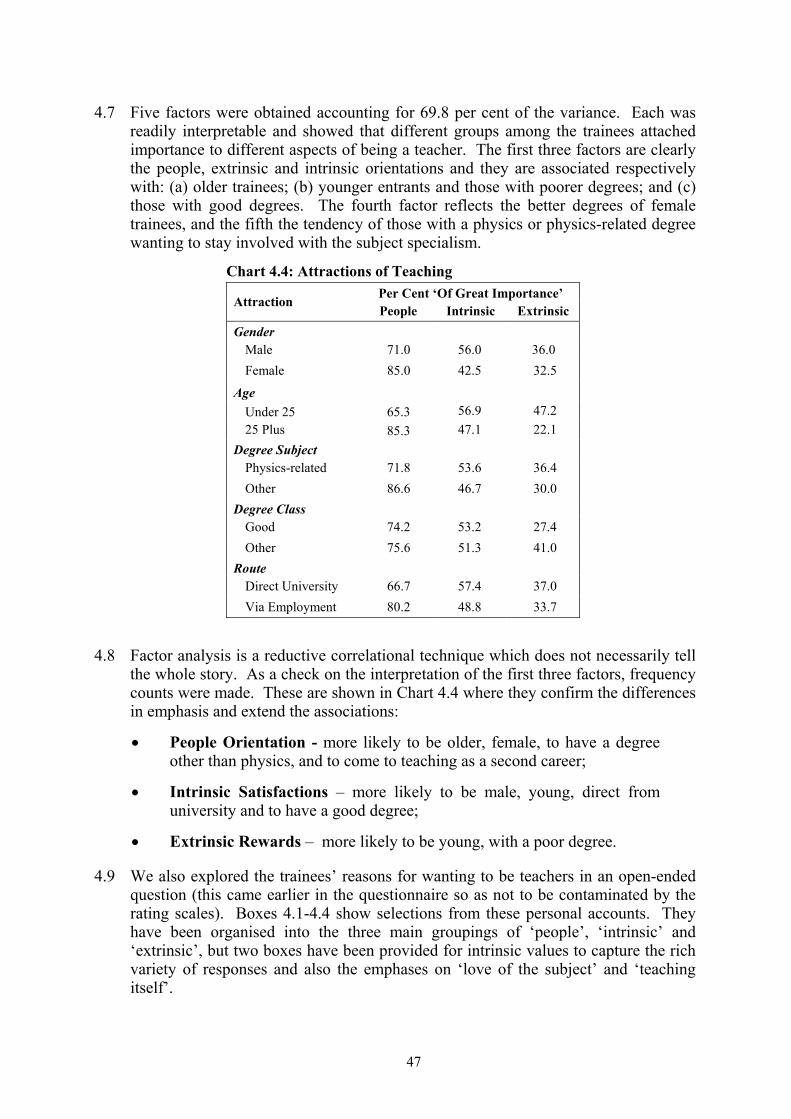
4.7 Five factors were obtained accounting for 69.8 per cent of the variance. Each was readily interpretable and showed that different groups among the trainees attached importance to different aspects of being a teacher. The first three factors are clearly the people, extrinsic and intrinsic orientations and they are associated respectively with: (a) older trainees; (b) younger entrants and those with poorer degrees; and (c) those with good degrees. The fourth factor reflects the better degrees of female trainees, and the fifth the tendency of those with a physics or physics-related degree wanting to stay involved with the subject specialism.
Chart 4.4: Attractions of Teaching Per Cent ‘Of Great Importance’ Attraction People Intrinsic Extrinsic
Gender Male 71.0 56.0 36.0 Female 85.0 42.5 32.5
Age
Under 25 65.3 56.9 47.2 25 Plus 85.3 47.1 22.1
Degree Subject Physics-related 71.8 53.6 36.4 Other 86.6 46.7 30.0
Degree Class Good 74.2 53.2 27.4 Other 75.6 51.3 41.0
Route Direct University 66.7 57.4 37.0 Via Employment 80.2 48.8 33.7
4.8 Factor analysis is a reductive correlational technique which does not necessarily tell the whole story. As a check on the interpretation of the first three factors, frequency counts were made. These are shown in Chart 4.4 where they confirm the differences in emphasis and extend the associations:
• People Orientation - more likely to be older, female, to have a degree other than physics, and to come to teaching as a second career;
• Intrinsic Satisfactions – more likely to be male, young, direct from university and to have a good degree;
• Extrinsic Rewards – more likely to be young, with a poor degree.
4.9 We also explored the trainees’ reasons for wanting to be teachers in an open-ended question (this came earlier in the questionnaire so as not to be contaminated by the rating scales). Boxes 4.1-4.4 show selections from these personal accounts. They have been organised into the three main groupings of ‘people’, ‘intrinsic’ and ‘extrinsic’, but two boxes have been provided for intrinsic values to capture the rich variety of responses and also the emphases on ‘love of the subject’ and ‘teaching itself’.
47
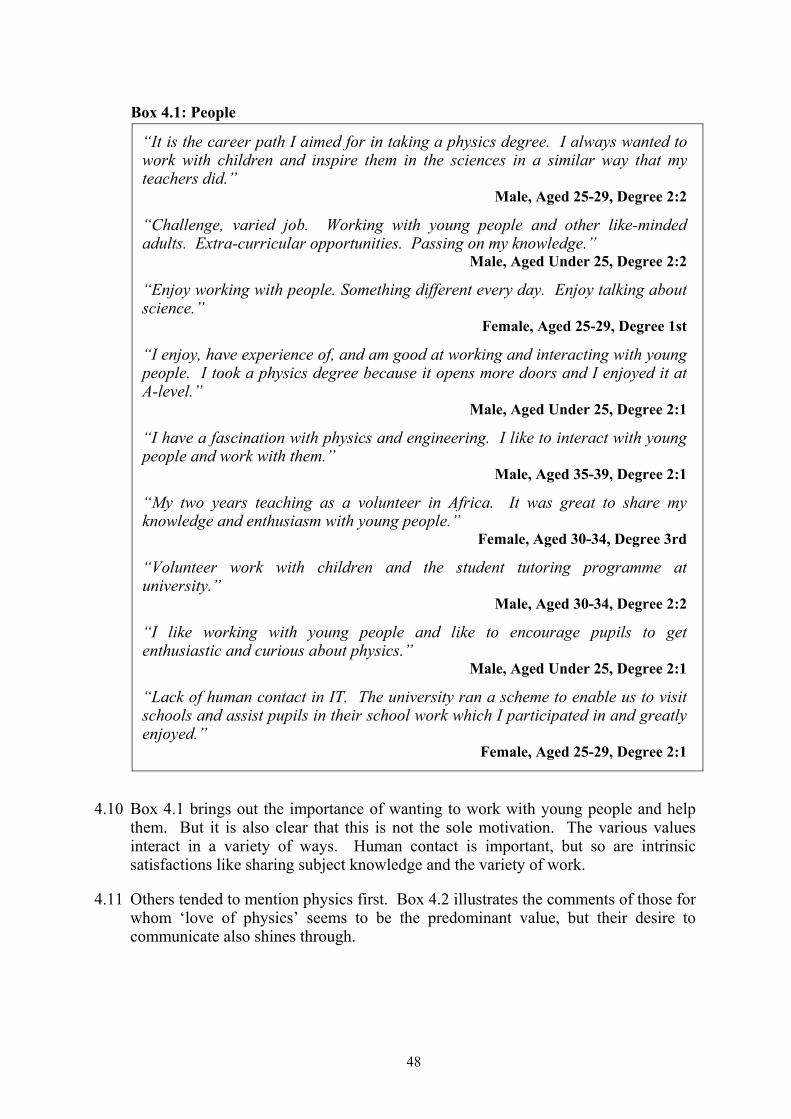
Box 4.1: People
“It is the career path I aimed for in taking a physics degree. I always wanted to work with children and inspire them in the sciences in a similar way that my teachers did.”
Male, Aged 25-29, Degree 2:2
“Challenge, varied job. Working with young people and other like-minded adults. Extra-curricular opportunities. Passing on my knowledge.”
Male, Aged Under 25, Degree 2:2
“Enjoy working with people. Something different every day. Enjoy talking about science.”
Female, Aged 25-29, Degree 1st
“I enjoy, have experience of, and am good at working and interacting with young people. I took a physics degree because it opens more doors and I enjoyed it at A-level.”
Male, Aged Under 25, Degree 2:1
“I have a fascination with physics and engineering. I like to interact with young people and work with them.”
Male, Aged 35-39, Degree 2:1
“My two years teaching as a volunteer in Africa. It was great to share my knowledge and enthusiasm with young people.”
Female, Aged 30-34, Degree 3rd
“Volunteer work with children and the student tutoring programme at university.”
Male, Aged 30-34, Degree 2:2
“I like working with young people and like to encourage pupils to get enthusiastic and curious about physics.”
Male, Aged Under 25, Degree 2:1
“Lack of human contact in IT. The university ran a scheme to enable us to visit schools and assist pupils in their school work which I participated in and greatly enjoyed.”
Female, Aged 25-29, Degree 2:1
4.10 Box 4.1 brings out the importance of wanting to work with young people and help them. But it is also clear that this is not the sole motivation. The various values interact in a variety of ways. Human contact is important, but so are intrinsic satisfactions like sharing subject knowledge and the variety of work.
4.11 Others tended to mention physics first. Box 4.2 illustrates the comments of those for whom ‘love of physics’ seems to be the predominant value, but their desire to communicate also shines through.
48

Box 4.2: Intrinsic - Love of Physics
“I really enjoyed the subject at school, more so than degree level. Also my physics teacher at school was amazing and a massive inspiration to everyone. (Seven out of 12 in the A-level class studied physics at degree level.)”
Male, Aged Under 25,Degree 2:2
“I love physics and love communicating my passion for science. I love how it can explain so many things in our world. I value education and the teaching profession and the shortage of physicists inspired me to sign up.”
Male, Aged Under 25, Degree 2:1
“I wanted a job that would allow me to use my knowledge from my degree and allow me to share my enthusiasm for the subject. Also I was concerned about the decline in interest in physics nationally.”
Female, Aged 25-29, Degree 2.1
“Physics is fun and I want to show kids what fun it can be.” Male, Aged 45 Plus, Degree 2:1
“Enthusiasm for the subject and passing on of knowledge and enthusiasm.” Male, Aged Under 25, Degree 1st
“I enjoy science, especially physics and I wanted to do something worthwhile and valuable with that. Also I knew there was a deficit of physics teachers.”
Male, Aged 25-29, Degree 3rd
“Love of my subject coupled with a joy of teaching and communicating ideas.” Male, Aged Under 25, Degree 2:1
“My love for physics at school, good teachers and wanting to encourage more girls to get into science.”
Female, Aged Under 25, Degree 2:2
“Love of science. Love of explaining things. To make a difference. To have colleagues.”
Female, Aged 30-34, Degree 1st
“I wanted a career that was related to my degree and I liked the idea of being a teacher and being able to pass my knowledge on to other people.”
Female, Aged Under 25, Degree 2:2
“Love my subject, wanted to work with dynamic, enthusiastic people.” Male, Aged Under 25, Degree 2:1
4.12 The other intrinsic emphasis is ‘love of teaching’ which comes through in comments of Box 4.3. Sometimes teaching has been what the trainee has always wanted to do and sometimes the decision to train is reached after experiencing other occupations. But for a significant sub-set of both groups it is the attractions of teaching itself that are uppermost.
49
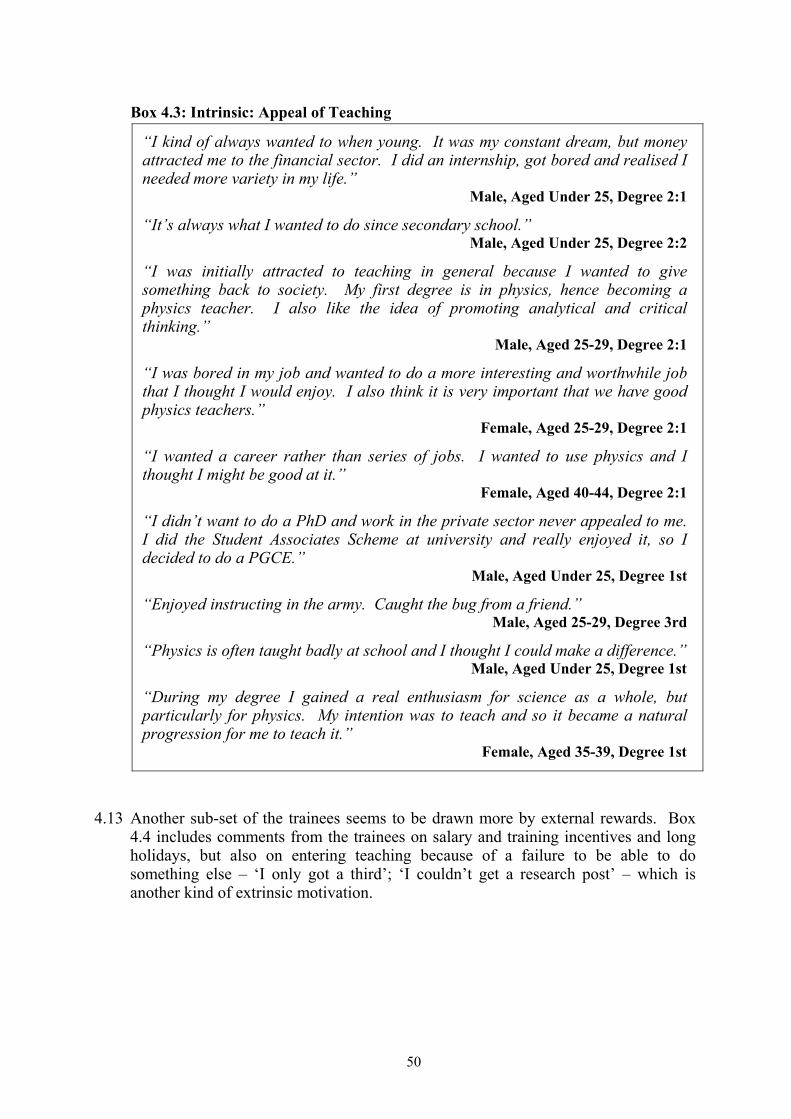
Box 4.3: Intrinsic: Appeal of Teaching
“I kind of always wanted to when young. It was my constant dream, but money attracted me to the financial sector. I did an internship, got bored and realised I needed more variety in my life.”
Male, Aged Under 25, Degree 2:1
“It’s always what I wanted to do since secondary school.” Male, Aged Under 25, Degree 2:2
“I was initially attracted to teaching in general because I wanted to give something back to society. My first degree is in physics, hence becoming a physics teacher. I also like the idea of promoting analytical and critical thinking.”
Male, Aged 25-29, Degree 2:1
“I was bored in my job and wanted to do a more interesting and worthwhile job that I thought I would enjoy. I also think it is very important that we have good physics teachers.”
Female, Aged 25-29, Degree 2:1
“I wanted a career rather than series of jobs. I wanted to use physics and I thought I might be good at it.”
Female, Aged 40-44, Degree 2:1
“I didn’t want to do a PhD and work in the private sector never appealed to me. I did the Student Associates Scheme at university and really enjoyed it, so I decided to do a PGCE.”
Male, Aged Under 25, Degree 1st
“Enjoyed instructing in the army. Caught the bug from a friend.” Male, Aged 25-29, Degree 3rd
“Physics is often taught badly at school and I thought I could make a difference.” Male, Aged Under 25, Degree 1st
“During my degree I gained a real enthusiasm for science as a whole, but particularly for physics. My intention was to teach and so it became a natural progression for me to teach it.”
Female, Aged 35-39, Degree 1st
4.13 Another sub-set of the trainees seems to be drawn more by external rewards. Box 4.4 includes comments from the trainees on salary and training incentives and long holidays, but also on entering teaching because of a failure to be able to do something else – ‘I only got a third’; ‘I couldn’t get a research post’ – which is another kind of extrinsic motivation.
50

Box 4.4: Extrinsic Rewards
“The salary paid while training. The ease of employment as a physics teacher after training and still being able to do a job that involves physics.”
Female, Aged Under 25, Degree 2:1
“An opportunity for a job to do with physics with a clear pay structure, job security and a choice where to work. Also, I enjoy teaching.”
Male, Aged 25-29, Degree 1st
“Working as a team. Using my degree. Getting paid to train and the golden hello. The holidays.”
Male, Aged 30-34, Degree 3rd
“Had often thought about it and had a place I withdrew from about 15 years ago (for financial reasons), but current bursary is much better.”
Female, Aged 40-44. Degree 2.2
“Everyone in my family is a teacher. I love physics and doing something different every day. Also the long holidays.”
Female, Aged Under 25, Degree 2:2
“I was bored. I wanted a job where I could use my knowledge of science. Teaching was one I could do.”
Male, Aged Under 25, Degree 2:2
“Wanted a rewarding job. I couldn’t get a research post.” Female, Aged 25-29, Degree 2:1
“Science is fun and I only got a third.” Male, Aged Under 25, Degree 3rd
“A rewarding job with the chance to influence a kid’s future. Wanted a fresh challenge. Job satisfaction. Thirteen weeks holiday. Physics can be exciting. Was inspired by my physics teacher.”
Male, Aged 25-29, Degree 2:1
Applications for Posts 4.14 Many of the trainees had been snapped up for posts. Chart 4.5 shows that 70.9 per
cent of those with jobs in state schools had been appointed on their first or second application, including some who had been offered posts by their teaching practice schools. But Chart 4.5 also shows that, even with the acute shortage of physics teachers, 7 (10.4 per cent) of those who had made applications did not have a post after six or more attempts. In one case the trainee had been unsuccessful on 15 occasions.
4.15 In some cases, it was possible to see why the person might be at a disadvantage. The one who had made 15 applications was over 45, had a degree in computer science and was keen to teach maths and physics. The trainee commented: “I do not get listed for comprehensive school jobs, but get interviews in the independent sector. I do not understand why, but it may mean I end up not teaching.” Of the others, four had third-class degrees, one in mechanical engineering and another in photonics, and
51
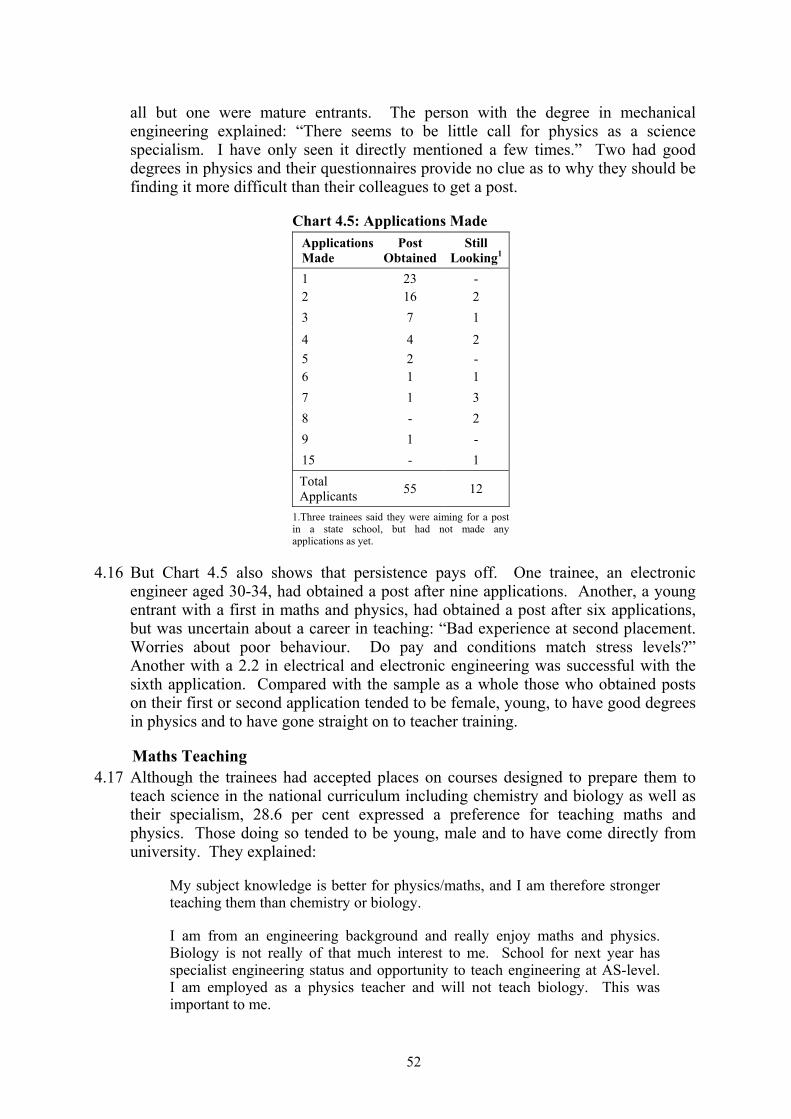
all but one were mature entrants. The person with the degree in mechanical engineering explained: “There seems to be little call for physics as a science specialism. I have only seen it directly mentioned a few times.” Two had good degrees in physics and their questionnaires provide no clue as to why they should be finding it more difficult than their colleagues to get a post.
Chart 4.5: Applications Made Applications Made
Post Obtained
Still Looking1
1 23 - 2 16 2 3 7 1
4 4 2 5 2 - 6 1 1 7 1 3 8 - 2 9 1 - 15 - 1 Total Applicants 55 12
1.Three trainees said they were aiming for a post in a state school, but had not made any applications as yet.
4.16 But Chart 4.5 also shows that persistence pays off. One trainee, an electronic engineer aged 30-34, had obtained a post after nine applications. Another, a young entrant with a first in maths and physics, had obtained a post after six applications, but was uncertain about a career in teaching: “Bad experience at second placement. Worries about poor behaviour. Do pay and conditions match stress levels?” Another with a 2.2 in electrical and electronic engineering was successful with the sixth application. Compared with the sample as a whole those who obtained posts on their first or second application tended to be female, young, to have good degrees in physics and to have gone straight on to teacher training.
Maths Teaching 4.17 Although the trainees had accepted places on courses designed to prepare them to
teach science in the national curriculum including chemistry and biology as well as their specialism, 28.6 per cent expressed a preference for teaching maths and physics. Those doing so tended to be young, male and to have come directly from university. They explained:
My subject knowledge is better for physics/maths, and I am therefore stronger teaching them than chemistry or biology.
I am from an engineering background and really enjoy maths and physics. Biology is not really of that much interest to me. School for next year has specialist engineering status and opportunity to teach engineering at AS-level. I am employed as a physics teacher and will not teach biology. This was important to me.
52

I would ideally like to teach maths and science, because I see poor numeracy skills when teaching physics. I would understand cross-curricular issues and applications possibly better than a maths teacher.
Maths is a better fit with physics than is biology.
My degree had a lot of mathematical content and I enjoy maths. Ideally I’d prefer to teach some of both science and maths. I am much more knowledgeable about maths than biology.
4.18 The case made by some of the admissions tutors for joint maths and physics teaching supported by a suitable PGCE is thus echoed by over a quarter of the trainees on the science PGCE and there may well be others who would be attracted by a different PGCE.
Résumé 4.19 The trainees were mainly drawn to physics teaching by the desire to work with and
help people and in this they were similar to other teachers, but different from the general run of physics graduates. Those most likely to be motivated by people values were the female, older trainees who had a degree other than in physics and who came to teaching as a second career. Those seeking the intrinsic satisfactions of subject interest and desire to teach were more likely to be male, young, direct from university and to have a good degree. Those attracted by extrinsic rewards tended to be young, with poor degrees.
4.20 Of those who had applied for posts in the state sector, 58.2 per cent had been successful in their first or second application, and a further 23.9 per cent had obtained posts. But 17.9 per cent were still looking, one having made 15 applications. Those who were snapped up tended to be female, young, and to have good degrees in physics. Over a quarter (28.6 per cent) would have preferred to teach physics and maths rather than physics with the other sciences.
53
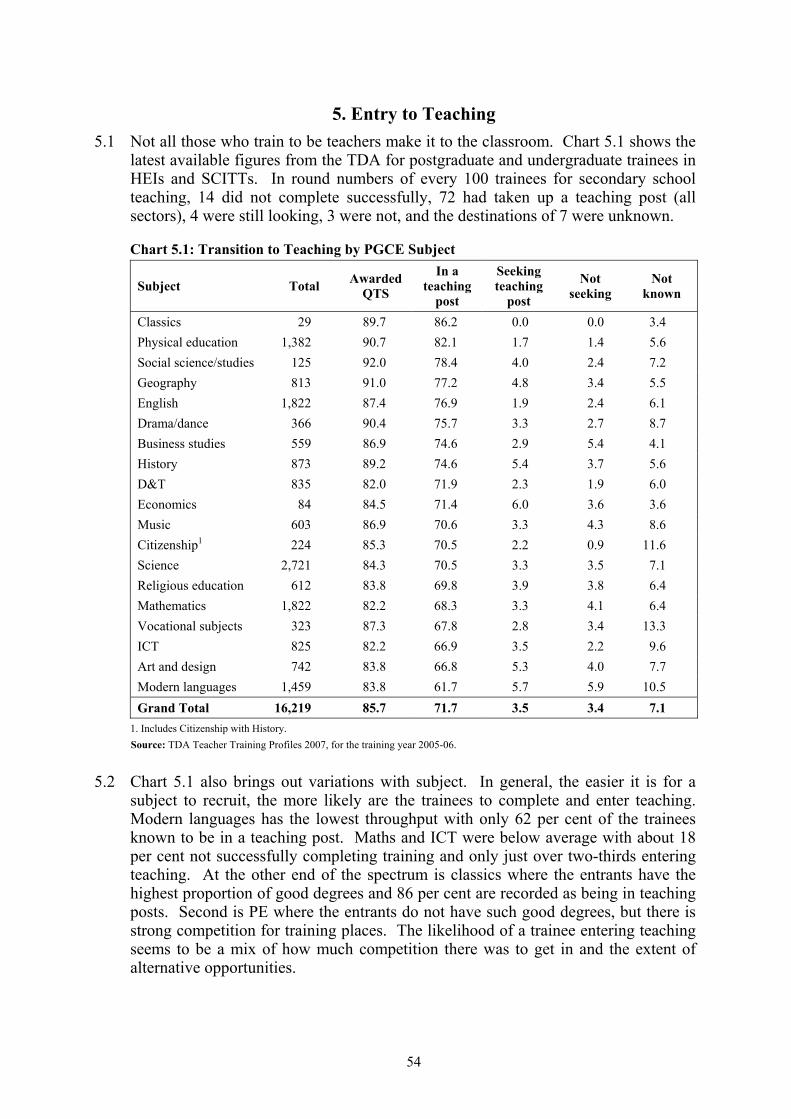
5. Entry to Teaching 5.1 Not all those who train to be teachers make it to the classroom. Chart 5.1 shows the
latest available figures from the TDA for postgraduate and undergraduate trainees in HEIs and SCITTs. In round numbers of every 100 trainees for secondary school teaching, 14 did not complete successfully, 72 had taken up a teaching post (all sectors), 4 were still looking, 3 were not, and the destinations of 7 were unknown.
Chart 5.1: Transition to Teaching by PGCE Subject
Subject Total Awarded QTS
In a teaching
post
Seeking teaching
post
Not seeking
Not known
Classics 29 89.7 86.2 0.0 0.0 3.4 Physical education 1,382 90.7 82.1 1.7 1.4 5.6 Social science/studies 125 92.0 78.4 4.0 2.4 7.2 Geography 813 91.0 77.2 4.8 3.4 5.5 English 1,822 87.4 76.9 1.9 2.4 6.1 Drama/dance 366 90.4 75.7 3.3 2.7 8.7 Business studies 559 86.9 74.6 2.9 5.4 4.1 History 873 89.2 74.6 5.4 3.7 5.6 D&T 835 82.0 71.9 2.3 1.9 6.0 Economics 84 84.5 71.4 6.0 3.6 3.6 Music 603 86.9 70.6 3.3 4.3 8.6 Citizenship1 224 85.3 70.5 2.2 0.9 11.6 Science 2,721 84.3 70.5 3.3 3.5 7.1 Religious education 612 83.8 69.8 3.9 3.8 6.4 Mathematics 1,822 82.2 68.3 3.3 4.1 6.4 Vocational subjects 323 87.3 67.8 2.8 3.4 13.3 ICT 825 82.2 66.9 3.5 2.2 9.6 Art and design 742 83.8 66.8 5.3 4.0 7.7 Modern languages 1,459 83.8 61.7 5.7 5.9 10.5 Grand Total 16,219 85.7 71.7 3.5 3.4 7.1
1. Includes Citizenship with History. Source: TDA Teacher Training Profiles 2007, for the training year 2005-06.
5.2 Chart 5.1 also brings out variations with subject. In general, the easier it is for a subject to recruit, the more likely are the trainees to complete and enter teaching. Modern languages has the lowest throughput with only 62 per cent of the trainees known to be in a teaching post. Maths and ICT were below average with about 18 per cent not successfully completing training and only just over two-thirds entering teaching. At the other end of the spectrum is classics where the entrants have the highest proportion of good degrees and 86 per cent are recorded as being in teaching posts. Second is PE where the entrants do not have such good degrees, but there is strong competition for training places. The likelihood of a trainee entering teaching seems to be a mix of how much competition there was to get in and the extent of alternative opportunities.
54
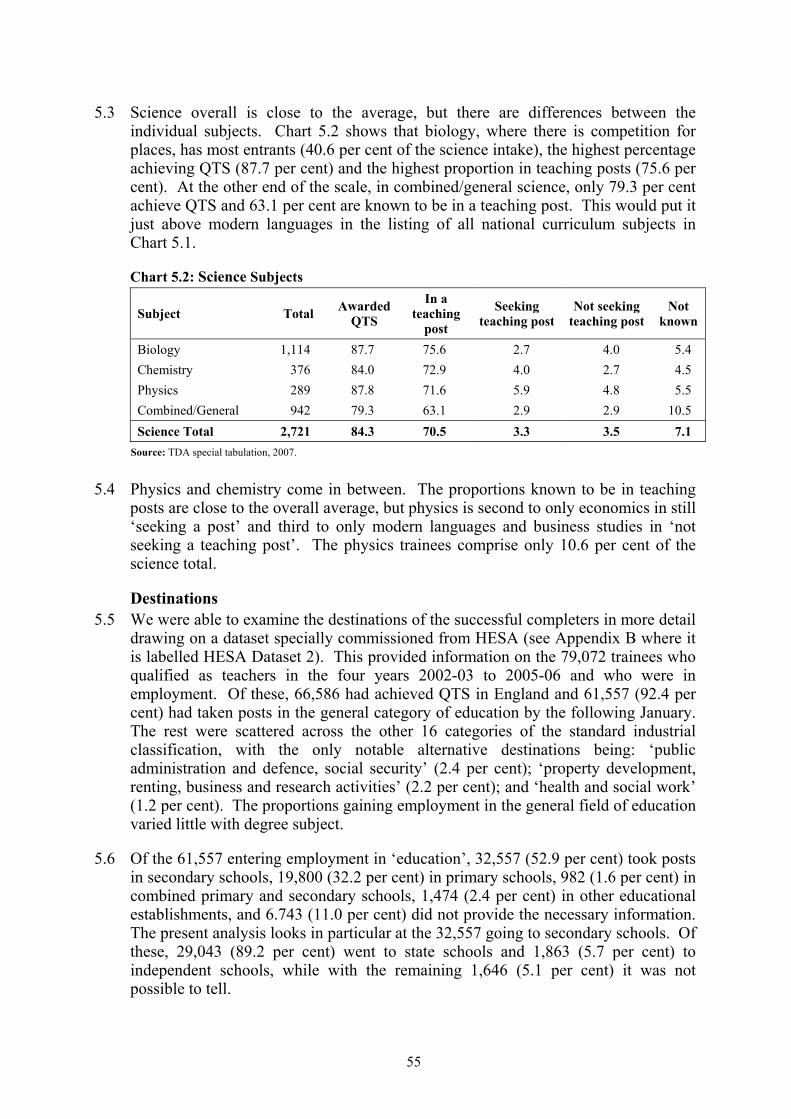
5.3 Science overall is close to the average, but there are differences between the individual subjects. Chart 5.2 shows that biology, where there is competition for places, has most entrants (40.6 per cent of the science intake), the highest percentage achieving QTS (87.7 per cent) and the highest proportion in teaching posts (75.6 per cent). At the other end of the scale, in combined/general science, only 79.3 per cent achieve QTS and 63.1 per cent are known to be in a teaching post. This would put it just above modern languages in the listing of all national curriculum subjects in Chart 5.1.
Chart 5.2: Science Subjects
Subject Total Awarded QTS
In a teaching
post
Seeking teaching post
Not seeking teaching post
Not known
Biology 1,114 87.7 75.6 2.7 4.0 5.4 Chemistry 376 84.0 72.9 4.0 2.7 4.5 Physics 289 87.8 71.6 5.9 4.8 5.5 Combined/General 942 79.3 63.1 2.9 2.9 10.5 Science Total 2,721 84.3 70.5 3.3 3.5 7.1
Source: TDA special tabulation, 2007.
5.4 Physics and chemistry come in between. The proportions known to be in teaching posts are close to the overall average, but physics is second to only economics in still ‘seeking a post’ and third to only modern languages and business studies in ‘not seeking a teaching post’. The physics trainees comprise only 10.6 per cent of the science total.
Destinations 5.5 We were able to examine the destinations of the successful completers in more detail
drawing on a dataset specially commissioned from HESA (see Appendix B where it is labelled HESA Dataset 2). This provided information on the 79,072 trainees who qualified as teachers in the four years 2002-03 to 2005-06 and who were in employment. Of these, 66,586 had achieved QTS in England and 61,557 (92.4 per cent) had taken posts in the general category of education by the following January. The rest were scattered across the other 16 categories of the standard industrial classification, with the only notable alternative destinations being: ‘public administration and defence, social security’ (2.4 per cent); ‘property development, renting, business and research activities’ (2.2 per cent); and ‘health and social work’ (1.2 per cent). The proportions gaining employment in the general field of education varied little with degree subject.
5.6 Of the 61,557 entering employment in ‘education’, 32,557 (52.9 per cent) took posts in secondary schools, 19,800 (32.2 per cent) in primary schools, 982 (1.6 per cent) in combined primary and secondary schools, 1,474 (2.4 per cent) in other educational establishments, and 6.743 (11.0 per cent) did not provide the necessary information. The present analysis looks in particular at the 32,557 going to secondary schools. Of these, 29,043 (89.2 per cent) went to state schools and 1,863 (5.7 per cent) to independent schools, while with the remaining 1,646 (5.1 per cent) it was not possible to tell.
55

5.7 The proportion taking posts in independent schools varied with subject. In general, the scarcer the teachers, the higher proportion going to the independent sector. Chart 5.3 shows that of the core subjects the proportions were highest in physics, chemistry and modern foreign languages and lowest in English and biology. Physics, in fact, is the second highest across all subject groups, but even it pales in comparison with classics where independent schools took 42.7 per cent of the output.
Chart 5.3: Degrees of New Teachers by Sector Selected Subjects1 %State %Independent Total Physics 91.1 8.9 505 Chemistry 92.1 7.9 772 Biology 94.9 5.1 2,168 Mathematics 94.9 5.1 2,230 English 95.4 4.6 2,866 Modern Foreign Languages 92.3 7.7 934 All Secondary 94.0 6.0 30,906
1.Subject of degree not necessarily PGCE course. 2.All PGCE completers in the four years 2002-03 to 2005-06 taking posts in secondary schools. Sources: Dataset commissioned from HESA.
University Background 5.8 Not only do independent schools take a relatively high proportion of the teachers
from the shortage subjects, but their recruits also tend to come from the leading universities and to have obtained the better degrees. Among all new teachers, as Chart 5.4 shows, about a fifth of those obtaining posts in independent schools had received their training at a leading university compared with about one in eight of those in state schools. For Oxbridge alone the proportions were, respectively, 7.6 per cent and 3.1 per cent.
Chart 5.4: PGCE University of New Teachers by Sector %Physics %All2 University Group1 State Independent State Independent
Top Universities 23.9 33.3 12.6 19.2 Civics 31.1 36.6 24.7 25.1 Greenfields 8.7 8.9 5.7 6.9 Ex-Techs 18.7 13.3 29.0 23.4 Other New Universities 17.6 8.9 28.0 25.3 Total 460 45 29,043 1,863
1. University providing the teacher training. See Chart 2.11, page 16, for definitions of the university groupings. 2. All PGCE completers in the four years 2002-03 to 2005-06 taking posts in secondary schools. Sources: Dataset commissioned from HESA.
5.9 Chart 5.4 also highlights the physics graduates. More were trained in the leading universities, but the difference between the independent and state sectors was even more marked than for the general run of degrees. A third going to independent schools had received their teacher training in the leading universities (13.3 per cent
56
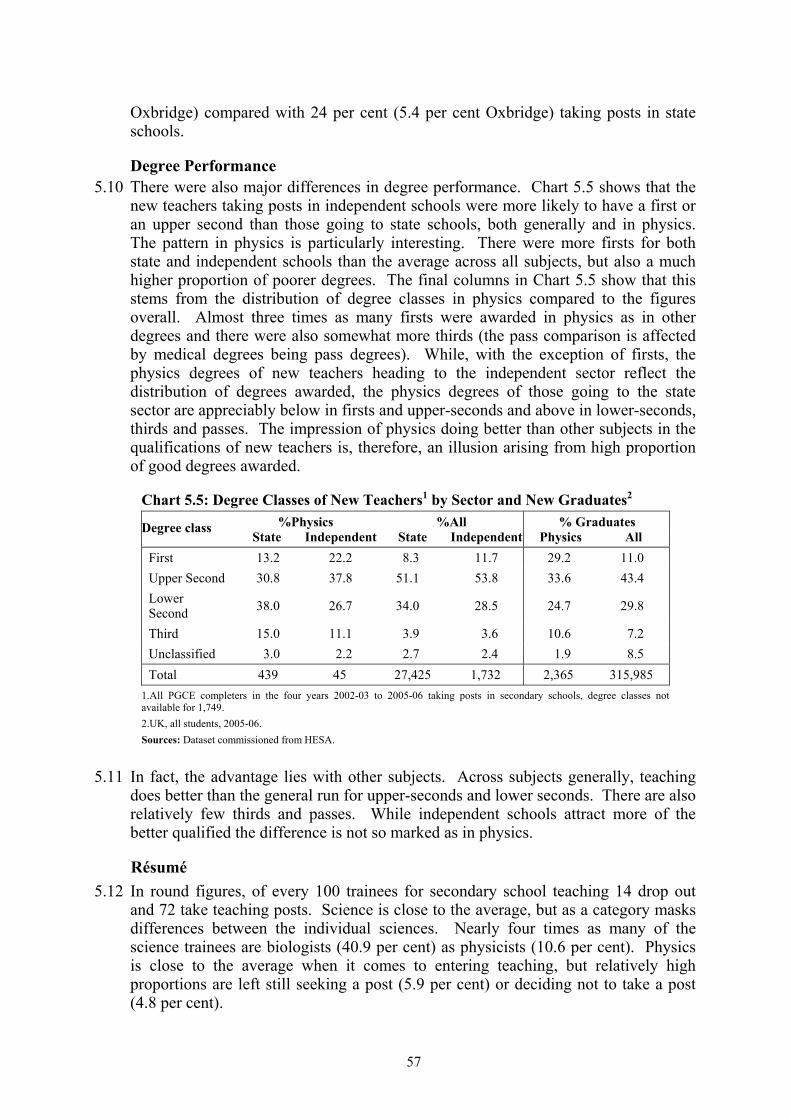
Oxbridge) compared with 24 per cent (5.4 per cent Oxbridge) taking posts in state schools.
Degree Performance 5.10 There were also major differences in degree performance. Chart 5.5 shows that the
new teachers taking posts in independent schools were more likely to have a first or an upper second than those going to state schools, both generally and in physics. The pattern in physics is particularly interesting. There were more firsts for both state and independent schools than the average across all subjects, but also a much higher proportion of poorer degrees. The final columns in Chart 5.5 show that this stems from the distribution of degree classes in physics compared to the figures overall. Almost three times as many firsts were awarded in physics as in other degrees and there were also somewhat more thirds (the pass comparison is affected by medical degrees being pass degrees). While, with the exception of firsts, the physics degrees of new teachers heading to the independent sector reflect the distribution of degrees awarded, the physics degrees of those going to the state sector are appreciably below in firsts and upper-seconds and above in lower-seconds, thirds and passes. The impression of physics doing better than other subjects in the qualifications of new teachers is, therefore, an illusion arising from high proportion of good degrees awarded.
Chart 5.5: Degree Classes of New Teachers1 by Sector and New Graduates2 %Physics %All % Graduates Degree class
State Independent State Independent Physics All First 13.2 22.2 8.3 11.7 29.2 11.0 Upper Second 30.8 37.8 51.1 53.8 33.6 43.4 Lower Second 38.0 26.7 34.0 28.5 24.7 29.8
Third 15.0 11.1 3.9 3.6 10.6 7.2 Unclassified 3.0 2.2 2.7 2.4 1.9 8.5 Total 439 45 27,425 1,732 2,365 315,985
1.All PGCE completers in the four years 2002-03 to 2005-06 taking posts in secondary schools, degree classes not available for 1,749. 2.UK, all students, 2005-06. Sources: Dataset commissioned from HESA.
5.11 In fact, the advantage lies with other subjects. Across subjects generally, teaching does better than the general run for upper-seconds and lower seconds. There are also relatively few thirds and passes. While independent schools attract more of the better qualified the difference is not so marked as in physics.
Résumé 5.12 In round figures, of every 100 trainees for secondary school teaching 14 drop out
and 72 take teaching posts. Science is close to the average, but as a category masks differences between the individual sciences. Nearly four times as many of the science trainees are biologists (40.9 per cent) as physicists (10.6 per cent). Physics is close to the average when it comes to entering teaching, but relatively high proportions are left still seeking a post (5.9 per cent) or deciding not to take a post (4.8 per cent).
57

5.13 The independent sector takes a higher proportion than state schools of the graduates with good degrees trained in the leading universities. In the case of physics, averaging across the four years 2002-03 to 2005-06, over a fifth (22.2 per cent) of the new teachers appointed to independent schools had ‘firsts’ compared with the 13.2 per cent appointed to state schools. A third of the appointees to independent schools were trained in the leading universities compared with 23.9 per cent of those going to state schools.
58
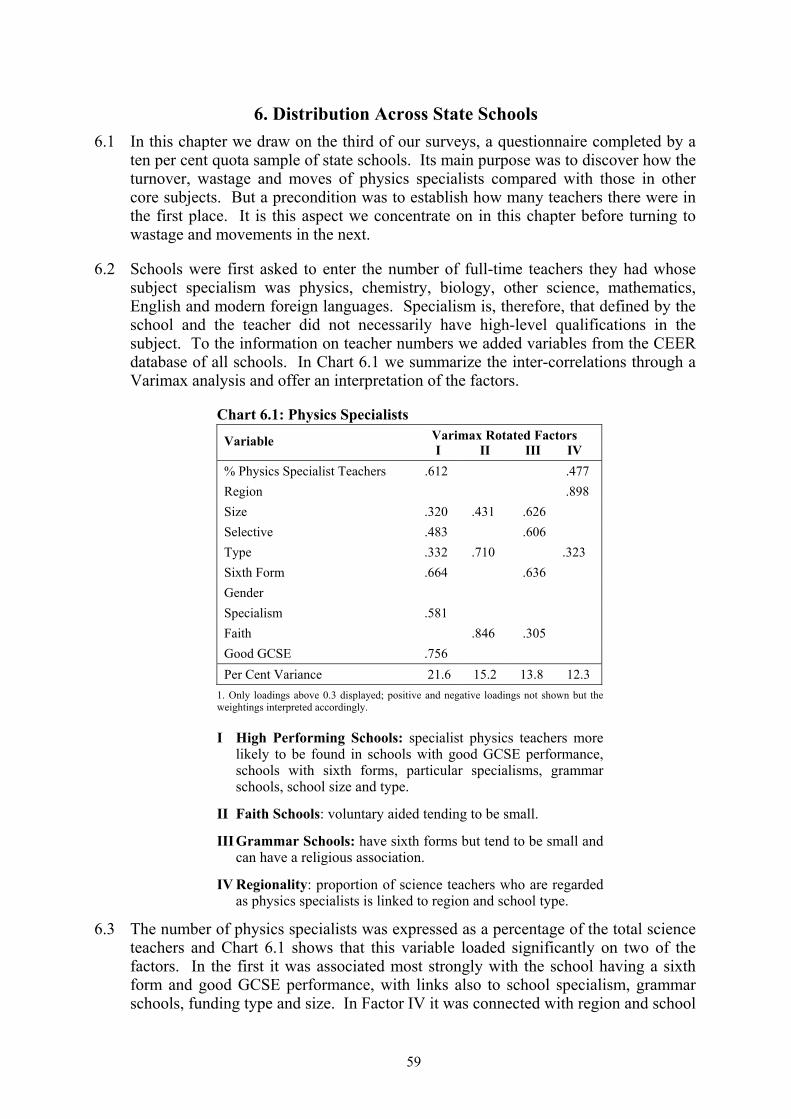
6. Distribution Across State Schools 6.1 In this chapter we draw on the third of our surveys, a questionnaire completed by a
ten per cent quota sample of state schools. Its main purpose was to discover how the turnover, wastage and moves of physics specialists compared with those in other core subjects. But a precondition was to establish how many teachers there were in the first place. It is this aspect we concentrate on in this chapter before turning to wastage and movements in the next.
6.2 Schools were first asked to enter the number of full-time teachers they had whose subject specialism was physics, chemistry, biology, other science, mathematics, English and modern foreign languages. Specialism is, therefore, that defined by the school and the teacher did not necessarily have high-level qualifications in the subject. To the information on teacher numbers we added variables from the CEER database of all schools. In Chart 6.1 we summarize the inter-correlations through a Varimax analysis and offer an interpretation of the factors.
Chart 6.1: Physics Specialists Varimax Rotated Factors Variable I II III IV
% Physics Specialist Teachers .612 .477 Region .898 Size .320 .431 .626 Selective .483 .606 Type .332 .710 .323 Sixth Form .664 .636 Gender Specialism .581 Faith .846 .305 Good GCSE .756 Per Cent Variance 21.6 15.2 13.8 12.3
1. Only loadings above 0.3 displayed; positive and negative loadings not shown but the weightings interpreted accordingly.
I High Performing Schools: specialist physics teachers more likely to be found in schools with good GCSE performance, schools with sixth forms, particular specialisms, grammar schools, school size and type.
II Faith Schools: voluntary aided tending to be small.
III Grammar Schools: have sixth forms but tend to be small and can have a religious association.
IV Regionality: proportion of science teachers who are regarded as physics specialists is linked to region and school type.
6.3 The number of physics specialists was expressed as a percentage of the total science teachers and Chart 6.1 shows that this variable loaded significantly on two of the factors. In the first it was associated most strongly with the school having a sixth form and good GCSE performance, with links also to school specialism, grammar schools, funding type and size. In Factor IV it was connected with region and school
59

type. A wide variety of school characteristics, therefore, seem to be associated with having physics specialist teachers.
6.4 In order to find out which are the most strongly related another variable was created: a categorical variable in which schools having no specialist physics teachers were divided from those with at least one. An attempt was then made to predict which category a school would belong to from its characteristics, using logistic regression analysis.
Chart 6.2: Schools with Physics Teachers Variable Odds Ratio1 Significance2
With Sixth Form 5.08 0.000 Without Sixth Form 0.000 North and Midlands 0.001 South and East 0.24 0.001 London 0.17 0.005 Not Specialist 0.024 Science, Engineering and Technology 3.91 0.036
Other Specialism 0.97 0.993 GCSE Band 5 (High) 0.265 GCSE Band 1 (Low) 0.20 0.051 GCSE Band 2 0.54 0.422 GCSE Band 3 (Modal) 0.51 0.363 GCSE Band 4 0.72 0.666 Special Needs3 Band 5 (High) 0.071 Special Needs Band 1 (Low) 2.56 0.200 Special Needs Band 2 3.47 0.055 Special Needs Band 3 (Modal) 4.43 0.010 Special Needs Band 4 3.24 0.025
1.Ratio of named category to base category. 2.Probability of occurring by chance so lowest numbers the most significant 3.Special needs supported.
6.5 In tune with the factor analysis, Chart 6.2 shows that there are four variables which emerge as the most predictive of whether or not a school will have specialist physics teachers: whether the school has a sixth form, its region, whether it is specialist and what sort of specialism it has, and the nature of the pupils (indicated by both GCSE results and special needs). A school with a sixth form was five times more likely to have specialist physics teachers than a school without; schools in London were about a fifth (0.17) as likely as those in the North and Midlands; science, engineering and technology schools were almost four times (3.91) as likely as non specialist schools; and the lowest achieving schools in terms of GCSE results were a fifth (0.20) as likely as the highest achieving. Together the variables predict with 84 per cent accuracy whether or not a school would have any specialist teachers of physics.
60

6.6 The factor and regression analyses describe the general pattern, but in order to explore in depth how physics teachers are distributed across the types of schools we need to look at each of the variables with the strongest associations: sixth form, region, specialism and ability. In each case, we present the balance of science teachers and the proportion of schools with no physics specialists. Numbers for the different school types are given in Appendix B.
6.7 Overall physics specialists comprised 19 per cent of the science teachers, a figure that was also found by the NFER (2006). Schools may be without physics teachers for two main reasons. For most it was because they classed all their teachers of the sciences as science teachers - 63 out of the 72 (87.5 per cent). But nine had biology and eight of them also chemistry specialists, but no physics specialists so they either could not recruit the teachers they needed or had chosen not to teach physics.
Sixth Form 6.8 Since the national curriculum subject is science, but A-levels are in individual
sciences it is not surprising that having a sixth form should be the school feature most predictive of whether it had physics specialists. Over two-fifths (41.2 per cent) of the up-to-16 schools reported having no physics specialists compared to ten per cent of those with sixth forms and the balance of science teachers reflected this. However 14 of the 172 schools with sixth-forms (8.1 per cent) listed all their teachers of the sciences as science teachers, perhaps because they did not offer some or all of the sciences at A-level, or for ideological reasons.
Chart 6.3: Age Range
% Balance of Science Teachers Age Range
Physics Chemistry Biology Science
% Schools Without
Physicists Up to 18 22.9 25.8 35.3 16.0 10.5 Up to 16 14.2 17.3 27.8 40.7 41.2 Total 19.1 22.1 32.0 26.7 23.8
Region 6.9 The distribution of physics specialist teachers was also strongly associated with
region. In the regression analysis we entered three broad areas, but in Chart 6.4 we show all ten standard regions in order of the percentage of physics specialists. Inner London, particularly, seems to have science teachers rather than specialists, with half the schools reporting no physicists and only 8.6 per cent of the science teachers classed as physics teachers. Outer London and the South West were somewhat similar, but schools in the West Midlands and Yorkshire and Humberside seemed better supplied. This was, in fact, generally the case for schools in the North and Midlands. The difference from London could reflect the ease of recruitment of specialists or be linked to the different patterns of schools in those regions.
61
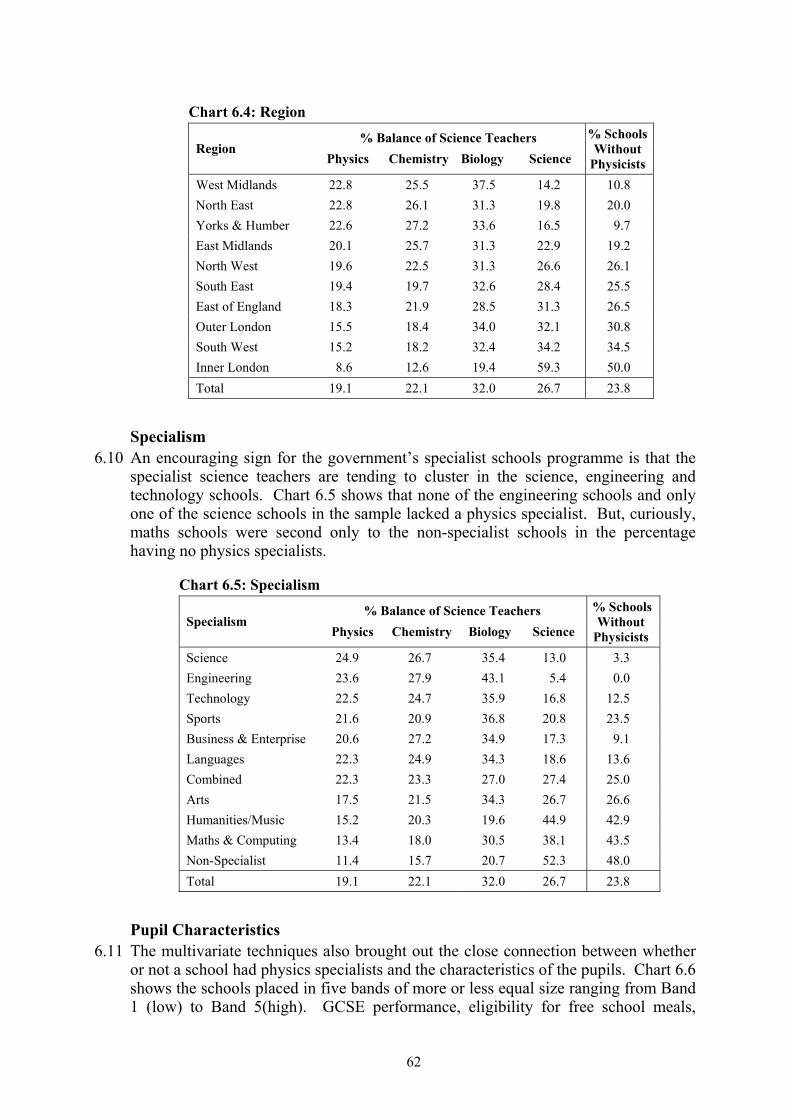
Chart 6.4: Region
% Balance of Science Teachers Region
Physics Chemistry Biology Science
% Schools Without
Physicists West Midlands 22.8 25.5 37.5 14.2 10.8 North East 22.8 26.1 31.3 19.8 20.0 Yorks & Humber 22.6 27.2 33.6 16.5 9.7 East Midlands 20.1 25.7 31.3 22.9 19.2 North West 19.6 22.5 31.3 26.6 26.1 South East 19.4 19.7 32.6 28.4 25.5 East of England 18.3 21.9 28.5 31.3 26.5 Outer London 15.5 18.4 34.0 32.1 30.8 South West 15.2 18.2 32.4 34.2 34.5 Inner London 8.6 12.6 19.4 59.3 50.0 Total 19.1 22.1 32.0 26.7 23.8
Specialism 6.10 An encouraging sign for the government’s specialist schools programme is that the
specialist science teachers are tending to cluster in the science, engineering and technology schools. Chart 6.5 shows that none of the engineering schools and only one of the science schools in the sample lacked a physics specialist. But, curiously, maths schools were second only to the non-specialist schools in the percentage having no physics specialists.
Chart 6.5: Specialism
% Balance of Science Teachers Specialism
Physics Chemistry Biology Science
% Schools Without
Physicists Science 24.9 26.7 35.4 13.0 3.3 Engineering 23.6 27.9 43.1 5.4 0.0 Technology 22.5 24.7 35.9 16.8 12.5 Sports 21.6 20.9 36.8 20.8 23.5 Business & Enterprise 20.6 27.2 34.9 17.3 9.1 Languages 22.3 24.9 34.3 18.6 13.6 Combined 22.3 23.3 27.0 27.4 25.0 Arts 17.5 21.5 34.3 26.7 26.6 Humanities/Music 15.2 20.3 19.6 44.9 42.9 Maths & Computing 13.4 18.0 30.5 38.1 43.5 Non-Specialist 11.4 15.7 20.7 52.3 48.0 Total 19.1 22.1 32.0 26.7 23.8
Pupil Characteristics 6.11 The multivariate techniques also brought out the close connection between whether
or not a school had physics specialists and the characteristics of the pupils. Chart 6.6 shows the schools placed in five bands of more or less equal size ranging from Band 1 (low) to Band 5(high). GCSE performance, eligibility for free school meals,
62

statemented special needs and supported special needs all show a marked graduation, with about half the most challenged schools having no physics specialists. The four variables are, in fact, closely intercorrelated so that only GCSE achievement was entered into the factor analysis to stand for them all.
Chart 6.6: Percentage Schools with No Physics Specialists Group1 GCSE2 FSM3 SN4 SNS5 Band 1 (Low) 53.5 9.5 5.0 10.0 Band 2 25.4 9.8 22.6 11.7 Band 3 (Modal) 20.9 18.0 13.6 15.0 Band 4 12.7 40.6 23.3 26.2 Band 5 (High) 6.5 42.4 53.2 54.8
1. Variables into five more or less equal levels ranging from One (low) to Five (high). 2. Percentage five good GCSEs including English and maths. 3. Percentage eligibility for free school meals. 4. Percentage statemented special needs. 5. Percentage supported special needs.
Other Variables 6.12 Several other school characteristics not emerging as predictive in the regression
analysis or strongly associated in the factor analysis nevertheless were found to be linked to physics teacher provision. Chart 6.7, for example, shows that none of the grammar schools was without physics specialists, whereas the secondary moderns were under-provided. This did not show up in the multivariate analyses, however, probably because there are few grammars and moderns in the sample (11.2 per cent together) and the variance they could have contributed was fed in by other variables.
Chart 6.7: Selection
% Balance of Science Teachers
Physics Chemistry Biology Science
% Schools Without
Physicists Grammar 29.4 31.5 34.7 4.3 0.0 Comprehensive 18.7 21.9 31.7 27.7 24.5 Secondary Modern 15.8 16.9 35.0 32.3 33.3 Total 19.1 22.1 32.0 26.7 23.8
Chart 6.8: Type
% Balance of Science Teachers Funding Category
Physics Chemistry Biology Science
% Schools Without
Physicists Voluntary Controlled 24.2 23.4 42.6 9.8 0.0 Voluntary Aided 21.6 24.9 34.7 18.7 15.1 Foundation 19.7 24.3 35.9 20.1 19.2 Community 18.0 20.7 29.7 31.7 28.7 Total 19.1 22.1 32.0 26.7 23.8
63
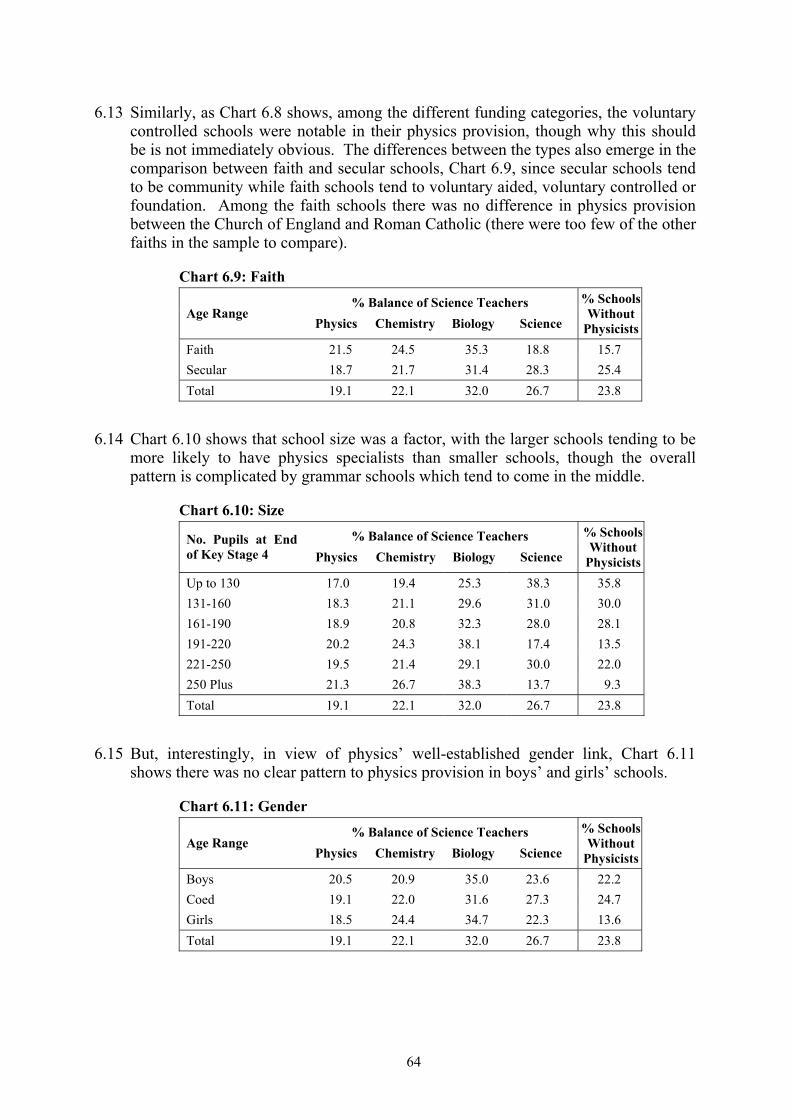
6.13 Similarly, as Chart 6.8 shows, among the different funding categories, the voluntary controlled schools were notable in their physics provision, though why this should be is not immediately obvious. The differences between the types also emerge in the comparison between faith and secular schools, Chart 6.9, since secular schools tend to be community while faith schools tend to voluntary aided, voluntary controlled or foundation. Among the faith schools there was no difference in physics provision between the Church of England and Roman Catholic (there were too few of the other faiths in the sample to compare).
Chart 6.9: Faith
% Balance of Science Teachers Age Range
Physics Chemistry Biology Science
% Schools Without
Physicists Faith 21.5 24.5 35.3 18.8 15.7 Secular 18.7 21.7 31.4 28.3 25.4 Total 19.1 22.1 32.0 26.7 23.8
6.14 Chart 6.10 shows that school size was a factor, with the larger schools tending to be more likely to have physics specialists than smaller schools, though the overall pattern is complicated by grammar schools which tend to come in the middle.
Chart 6.10: Size
% Balance of Science Teachers No. Pupils at End of Key Stage 4 Physics Chemistry Biology Science
% Schools Without
Physicists Up to 130 17.0 19.4 25.3 38.3 35.8 131-160 18.3 21.1 29.6 31.0 30.0 161-190 18.9 20.8 32.3 28.0 28.1 191-220 20.2 24.3 38.1 17.4 13.5 221-250 19.5 21.4 29.1 30.0 22.0 250 Plus 21.3 26.7 38.3 13.7 9.3 Total 19.1 22.1 32.0 26.7 23.8
6.15 But, interestingly, in view of physics’ well-established gender link, Chart 6.11 shows there was no clear pattern to physics provision in boys’ and girls’ schools.
Chart 6.11: Gender
% Balance of Science Teachers Age Range
Physics Chemistry Biology Science
% Schools Without
Physicists Boys 20.5 20.9 35.0 23.6 22.2 Coed 19.1 22.0 31.6 27.3 24.7 Girls 18.5 24.4 34.7 22.3 13.6 Total 19.1 22.1 32.0 26.7 23.8
64
6.16 Boys’ schools tended to have a somewhat higher percentage of their science teachers as physicists, but there was no difference in the proportions of biologists. Few of the girls’ schools had no physicists at all. The proportions in coeducational schools are very close to the means since they contribute 86.8 per cent of the sample.
Résumé 6.17 Some schools reported having no physics specialists. This could be either because
they classed all their science teachers as science teachers, or because they could not recruit any. It was possible to predict with 84 per cent accuracy whether a school would have any physics specialists, essentially from whether it had a sixth form, its region, whether it had specialist status in science, engineering or technology, and the ability of its pupils as indicated by GCSE results.
6.18 Over 40 per cent of the up-to-16 schools (41.2 per cent) reported having no physics specialists, against 10.5 per cent of the up-to-18 schools. Half the schools in Inner London had none compared with about 10 per cent in Yorkshire and Humberside, and the West Midlands. None of the engineering schools in the sample and only one of the science schools were in this position. But 48.0 per cent of the non-specialist schools, 42.9 per cent of the humanities and music schools, and, somewhat surprisingly, 43.5 per cent of the maths and computing schools listed no physics specialists. The nature of the pupils was also important. Few schools with high ability children, low free school meals, or low special needs were without physics specialists, but the converse was also true. Of the other defining features, grammar schools, voluntary controlled schools, faith schools came off best, and small schools worst.
65

7.Turnover, Wastage and Moves 7.1 The data on the deployment of teachers and other subjects discussed in Chapter 6
were gathered mainly as a basis for calculating what proportion of the teachers were leaving (turnover), either to move to another school or leave the state sector (wastage). Surprisingly, at the time the survey was conducted - the first week in June 2007 - there was no good information on the distribution of teachers across secondary schools. The most recently published Secondary School Curriculum and Staffing Survey (DfES, 2003) at the time our research was conducted was marred by a poor response rate. Subsequently the results of the 2007 survey have been published (DCSF 2008b), but again the response rate is low and the results are difficult to interpret.
7.2 This chapter draws on two surveys. The survey of a ten per cent quota sample of schools as described in Chapter 6 (Survey III) and also a survey of the leavers from those schools (Survey IV). In Survey III, as well as giving the numbers of full-time staff in the core subjects of physics, chemistry, biology, other science, mathematics, English and modern foreign languages, schools were asked in the same table to record the numbers leaving in the summer term 2007. For each leaver the school was asked to provide information about subject specialism and destination, and background details such as age and gender, by ticking boxes in a proforma.
7.3 The overall rates of teacher loss were of the same order as those found in extensive surveys carried out for the Department for Education and Skills for the years 2002-2004 (Smithers and Robinson, 2005). If anything, Chart 7.1 shows they appeared somewhat higher but it must be borne in mind that the present survey was only concerned with the core subjects and only looked at leavers in the summer term. The figures entered in the chart for 2007 have been scaled up to the whole year by assuming that about 70 per cent of the resignations fall in the summer (cf Smithers and Robinson 2003, Table 2.2, page 12). There is some evidence that the turnover is higher in the core subjects than for the whole range (Smithers and Robinson, 2005, Table 4.8, page 27) so it would be wrong to infer from Chart 7.1 that turnover is increasing, but it is reassuring that, allowing for the differences, the results are consistent with previous findings.
Chart 7.1: Overall Teacher Loss Year Turnover Wastage Moves 20071 15.7 8.7 7.0 20042 12.5 7.2 5.3 20032 12.8 7.2 5.6 20022 13.1 7.3 5.8
1. Current survey of core subjects in summer term 2007 estimated at 70 per cent of whole year and scaled up. 2.Data from Smithers and Robinson (2005), Table 2.1, page 10.
7.4 The dataset set derived from the Schools Survey (Survey III) was supplemented by background information on the schools held by CEER in its databank. Factor and regression analyses were run to see if turnover was associated with particular school features. The one variable that stood out was region. Chart 7.2 confirms that turnover and wastage rates are much higher in London and the South East than in the
66

rest of the country. Schools in London were also more likely to be without physics specialists (Chart 6.4, page 62).
Chart 7.2: Turnover by Region Region Turnover Wastage Moves Inner London 16.8 8.9 7.9 South East 13.2 7.3 5.9 Outer London 13.0 7.9 5.1 West Midlands 10.9 5.4 5.5 East Midlands 10.8 5.9 4.9 North East 10.4 6.4 4.0 East 10.3 5.6 4.7 North West 9.5 5.6 3.9 South West 9.4 5.2 4.2 Yorks & Humb 9.0 4.8 4.3 Total 11.0 6.1 4.9
7.5 It becomes interesting to see, therefore, if turnover for physics is higher than for the other core subjects. Chart 7.3 shows that turnover and moves are higher than for most of the other subjects except ‘general/combined science’, but wastage is about average.
Chart 7.3: Turnover by Subject Region Turnover Wastage Moves Physics 11.7 6.0 5.8 Chemistry 11.3 6.5 4.8 Biology 9.6 5.9 3.7 Comb/Gen Science1 11.8 6.0 5.8 Maths 11.1 6.1 5.0 English 10.5 6.1 4.4 Foreign Languages 9.6 5.6 4.0 Total 11.0 6.1 4.9
1. ‘Other science’ has been split off from ‘combined/general science’ and is not included in the tabulation. The respective rates were 14.4 per cent, 9.2 per cent and 5.2 per cent, perhaps indication that ‘other sciences are gradually being phased out with the high turnover and wastage stemming from retirements, while there are few moves to other schools.
7.6 Turnover and wastage give a broad indication of teacher movements in the subjects, but in order to understand them more fully we need to look at the detailed destinations. Chart 7.4 shows the percentages from the various subjects moving within the sector (moves) and to other destinations (wastage). The top line, therefore, represents in a somewhat different way the ‘moves’ column of Chart 7.3. Wastage is disaggregated into six categories. What stands out is that the main driver of wastage in physics is retirement. Over half the wastage or more than a quarter of the turnover is due to physicists retiring either at the normal age or early. Retirements in physics are higher than for all the other core subjects. On the other hand, less than ten per cent of the resignations in biology are for retirement. As
67
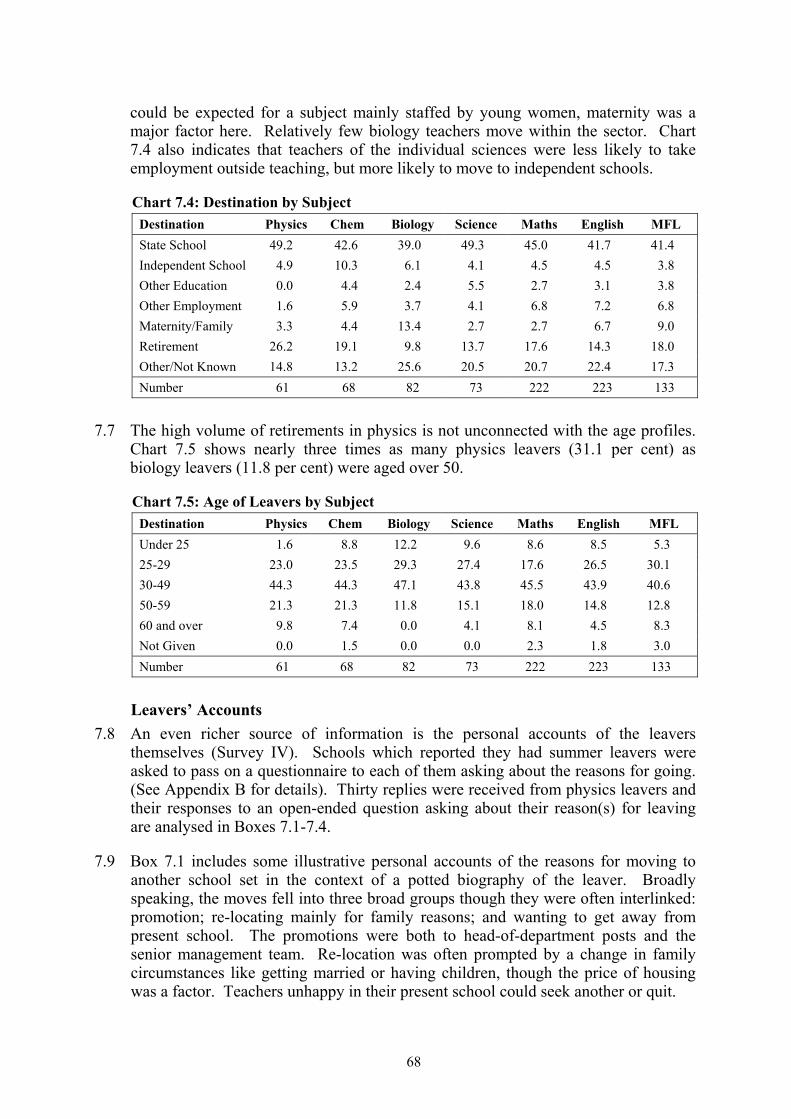
could be expected for a subject mainly staffed by young women, maternity was a major factor here. Relatively few biology teachers move within the sector. Chart 7.4 also indicates that teachers of the individual sciences were less likely to take employment outside teaching, but more likely to move to independent schools.
Chart 7.4: Destination by Subject Destination Physics Chem Biology Science Maths English MFL State School 49.2 42.6 39.0 49.3 45.0 41.7 41.4 Independent School 4.9 10.3 6.1 4.1 4.5 4.5 3.8 Other Education 0.0 4.4 2.4 5.5 2.7 3.1 3.8 Other Employment 1.6 5.9 3.7 4.1 6.8 7.2 6.8 Maternity/Family 3.3 4.4 13.4 2.7 2.7 6.7 9.0 Retirement 26.2 19.1 9.8 13.7 17.6 14.3 18.0 Other/Not Known 14.8 13.2 25.6 20.5 20.7 22.4 17.3 Number 61 68 82 73 222 223 133
7.7 The high volume of retirements in physics is not unconnected with the age profiles. Chart 7.5 shows nearly three times as many physics leavers (31.1 per cent) as biology leavers (11.8 per cent) were aged over 50.
Chart 7.5: Age of Leavers by Subject Destination Physics Chem Biology Science Maths English MFL Under 25 1.6 8.8 12.2 9.6 8.6 8.5 5.3 25-29 23.0 23.5 29.3 27.4 17.6 26.5 30.1 30-49 44.3 44.3 47.1 43.8 45.5 43.9 40.6 50-59 21.3 21.3 11.8 15.1 18.0 14.8 12.8 60 and over 9.8 7.4 0.0 4.1 8.1 4.5 8.3 Not Given 0.0 1.5 0.0 0.0 2.3 1.8 3.0 Number 61 68 82 73 222 223 133
Leavers’ Accounts 7.8 An even richer source of information is the personal accounts of the leavers
themselves (Survey IV). Schools which reported they had summer leavers were asked to pass on a questionnaire to each of them asking about the reasons for going. (See Appendix B for details). Thirty replies were received from physics leavers and their responses to an open-ended question asking about their reason(s) for leaving are analysed in Boxes 7.1-7.4.
7.9 Box 7.1 includes some illustrative personal accounts of the reasons for moving to another school set in the context of a potted biography of the leaver. Broadly speaking, the moves fell into three broad groups though they were often interlinked: promotion; re-locating mainly for family reasons; and wanting to get away from present school. The promotions were both to head-of-department posts and the senior management team. Re-location was often prompted by a change in family circumstances like getting married or having children, though the price of housing was a factor. Teachers unhappy in their present school could seek another or quit.
68
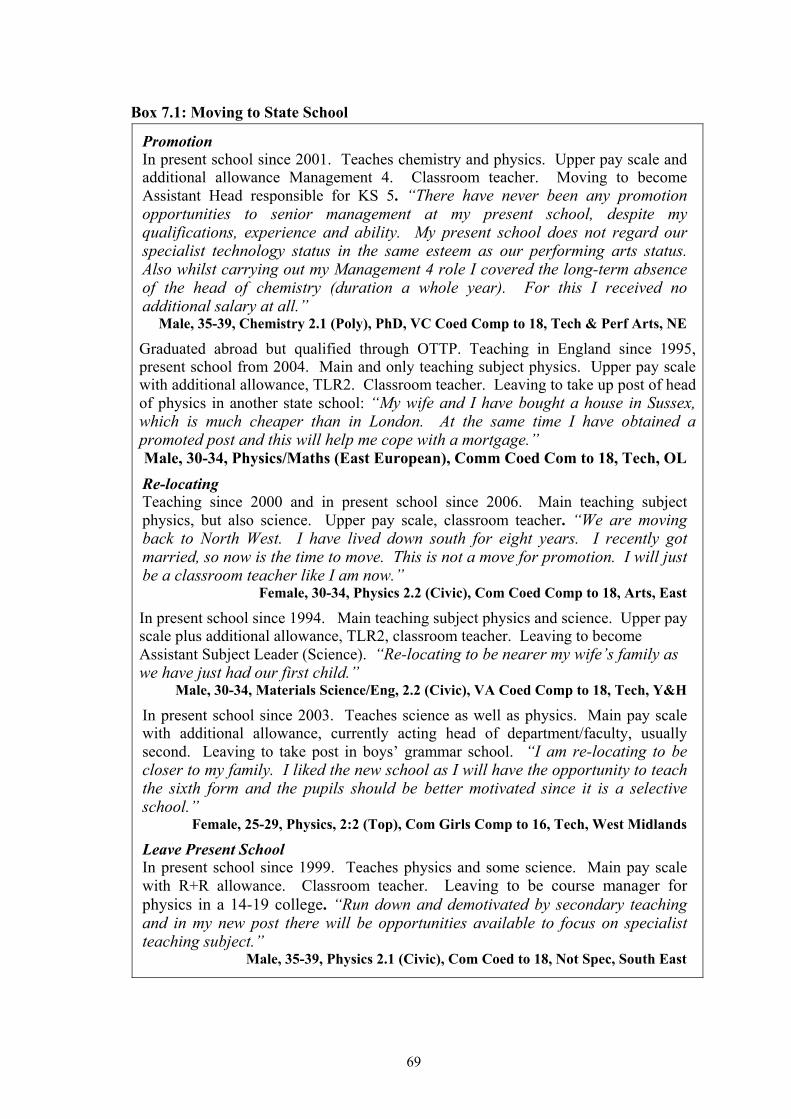
Box 7.1: Moving to State School
Promotion In present school since 2001. Teaches chemistry and physics. Upper pay scale and additional allowance Management 4. Classroom teacher. Moving to become Assistant Head responsible for KS 5. “There have never been any promotion opportunities to senior management at my present school, despite my qualifications, experience and ability. My present school does not regard our specialist technology status in the same esteem as our performing arts status. Also whilst carrying out my Management 4 role I covered the long-term absence of the head of chemistry (duration a whole year). For this I received no additional salary at all.”
Male, 35-39, Chemistry 2.1 (Poly), PhD, VC Coed Comp to 18, Tech & Perf Arts, NE
Graduated abroad but qualified through OTTP. Teaching in England since 1995, present school from 2004. Main and only teaching subject physics. Upper pay scale with additional allowance, TLR2. Classroom teacher. Leaving to take up post of head of physics in another state school: “My wife and I have bought a house in Sussex, which is much cheaper than in London. At the same time I have obtained a promoted post and this will help me cope with a mortgage.” Male, 30-34, Physics/Maths (East European), Comm Coed Com to 18, Tech, OL Re-locating Teaching since 2000 and in present school since 2006. Main teaching subject physics, but also science. Upper pay scale, classroom teacher. “We are moving back to North West. I have lived down south for eight years. I recently got married, so now is the time to move. This is not a move for promotion. I will just be a classroom teacher like I am now.”
Female, 30-34, Physics 2.2 (Civic), Com Coed Comp to 18, Arts, East
In present school since 1994. Main teaching subject physics and science. Upper pay scale plus additional allowance, TLR2, classroom teacher. Leaving to become Assistant Subject Leader (Science). “Re-locating to be nearer my wife’s family as we have just had our first child.”
Male, 30-34, Materials Science/Eng, 2.2 (Civic), VA Coed Comp to 18, Tech, Y&H
In present school since 2003. Teaches science as well as physics. Main pay scale with additional allowance, currently acting head of department/faculty, usually second. Leaving to take post in boys’ grammar school. “I am re-locating to be closer to my family. I liked the new school as I will have the opportunity to teach the sixth form and the pupils should be better motivated since it is a selective school.”
Female, 25-29, Physics, 2:2 (Top), Com Girls Comp to 16, Tech, West Midlands
Leave Present School In present school since 1999. Teaches physics and some science. Main pay scale with R+R allowance. Classroom teacher. Leaving to be course manager for physics in a 14-19 college. “Run down and demotivated by secondary teaching and in my new post there will be opportunities available to focus on specialist teaching subject.”
Male, 35-39, Physics 2.1 (Civic), Com Coed to 18, Not Spec, South East
69

Box 7.2: Retirement
Normal Age Teaching since 1970 and in present school since 1975. Teaches electronics as well as physics. Upper pay scale with additional allowance as head of department. “I have reached the age of sixty and have always planned to leave at this age. I am looking forward to having evenings and holiday time without job demands and shedding the ‘guilty conscience’ that, as a teacher, I live with because the job is never completed. I shall actually miss working with vibrant young minds. I am taking a sabbatical year, then I may resume some part-time work with bodies who organise support for engineering projects in schools.”
Female, 60, Physics, 2:1 (Civic), Com Coed Comp to 18, Maths, North West
Teaching more than 30 years. Been in present school since 1984. Teaches physics only. Leadership Group pay scale, deputy head. “Time to use flexibly for entertainment and travel as I please.”
Male, 60, Physics of Materials, 2:2 (Ex-Tech), Found Coed Comp to 18, Maths, Y & H
Early Teaching over 30 years. Had a one-year break in 1975 to complete M.Sc. in Education. Been in present school since 1973. Main teaching subject physics and also chemistry. Upper pay scale plus additional allowance. Head of department/faculty. “Stress, constant pressure from Ofsted and for ‘change’; new GCSE syllabus lowering the content so there is nothing left to teach in physics; proposed new A-level courses – again a dilution of content and just wanted to jump off the ‘teaching roundabout’.”
Male, 55-59, Physics 3rd (Civic), Found Coed Gram, Not Spec, North West
Teaching since 1975, been in present school since 1996. Main teaching subject physics, also teaches some chemistry and maths. Upper pay scale. No additional allowances. Classroom teacher. “The workload, the constant change in science by people who clearly never had to teach it in a ‘bog standard school’ and pupils who know their right, but who have no concept of their responsibilities.”
Male, 55-59, BEd in Physics/Maths (Coll Ed), VC Coed Comp to 16, Eng, North West
Teaching since 1971. Break 1975-1981 bringing up young family. In present school since 1989. Main teaching subject physics and also some maths. Leadership Group pay scale. “Health not as good as it was (blood pressure) plus added attractions of new grandchildren.”
Female, 55-59, Maths/Physics Ord, (Civic), Found Coed Comp to 18, Arts, East Mid
Teaching since 1971 with one year abroad. In present school since 1990. Teaches science as well as physics. AST pay scale: “husband retiring so may as well join him in a life of comparative leisure”.
Female, 55-59, Physics, 2:1 (Civic), Com Coed Comp to 16, MFL, North East
Been in present school since 1970. Main teaching subject physics. Upper pay scale with additional allowance, TLR2 as head of department/ faculty. “Wanted to leave present school and just wanted to leave teaching. Bureaucratic nonsense.”
Male, 55-59, Physics 2.2 (Civic), Found Boys Gram, Bus & Ent, East Midlands
70
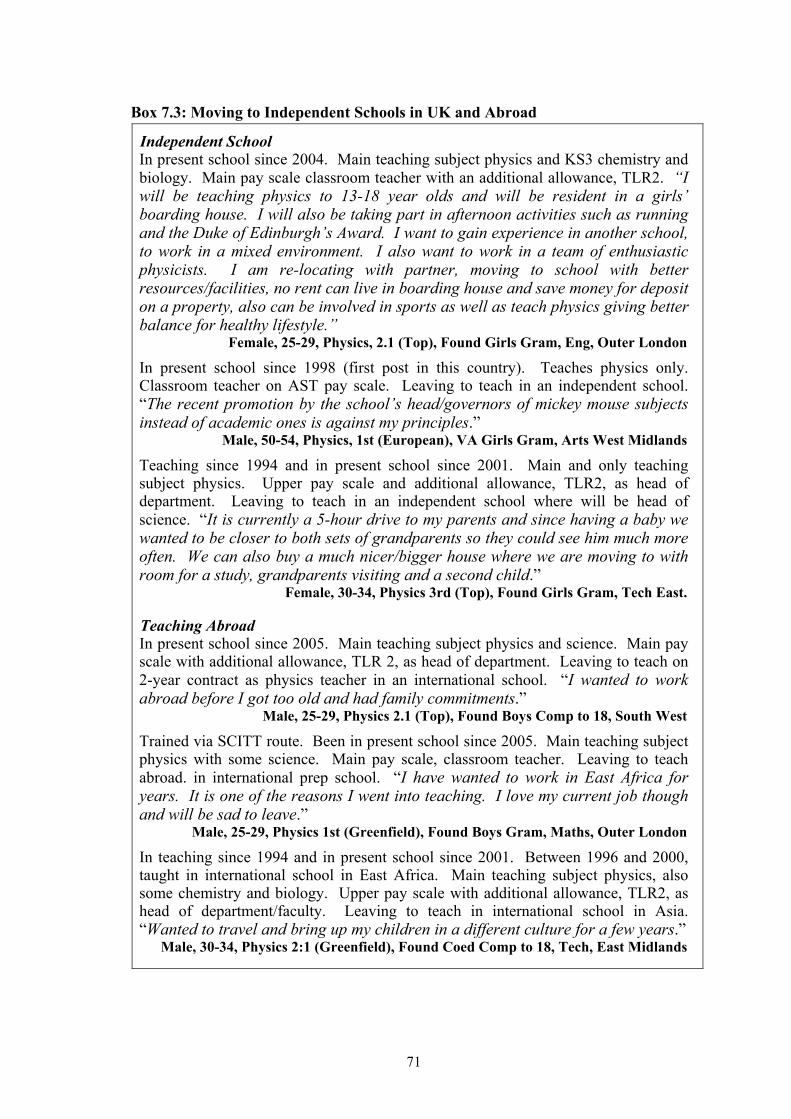
Box 7.3: Moving to Independent Schools in UK and Abroad
Independent School In present school since 2004. Main teaching subject physics and KS3 chemistry and biology. Main pay scale classroom teacher with an additional allowance, TLR2. “I will be teaching physics to 13-18 year olds and will be resident in a girls’ boarding house. I will also be taking part in afternoon activities such as running and the Duke of Edinburgh’s Award. I want to gain experience in another school, to work in a mixed environment. I also want to work in a team of enthusiastic physicists. I am re-locating with partner, moving to school with better resources/facilities, no rent can live in boarding house and save money for deposit on a property, also can be involved in sports as well as teach physics giving better balance for healthy lifestyle.”
Female, 25-29, Physics, 2.1 (Top), Found Girls Gram, Eng, Outer London
In present school since 1998 (first post in this country). Teaches physics only. Classroom teacher on AST pay scale. Leaving to teach in an independent school. “The recent promotion by the school’s head/governors of mickey mouse subjects instead of academic ones is against my principles.”
Male, 50-54, Physics, 1st (European), VA Girls Gram, Arts West Midlands
Teaching since 1994 and in present school since 2001. Main and only teaching subject physics. Upper pay scale and additional allowance, TLR2, as head of department. Leaving to teach in an independent school where will be head of science. “It is currently a 5-hour drive to my parents and since having a baby we wanted to be closer to both sets of grandparents so they could see him much more often. We can also buy a much nicer/bigger house where we are moving to with room for a study, grandparents visiting and a second child.”
Female, 30-34, Physics 3rd (Top), Found Girls Gram, Tech East.
Teaching Abroad In present school since 2005. Main teaching subject physics and science. Main pay scale with additional allowance, TLR 2, as head of department. Leaving to teach on 2-year contract as physics teacher in an international school. “I wanted to work abroad before I got too old and had family commitments.”
Male, 25-29, Physics 2.1 (Top), Found Boys Comp to 18, South West
Trained via SCITT route. Been in present school since 2005. Main teaching subject physics with some science. Main pay scale, classroom teacher. Leaving to teach abroad. in international prep school. “I have wanted to work in East Africa for years. It is one of the reasons I went into teaching. I love my current job though and will be sad to leave.”
Male, 25-29, Physics 1st (Greenfield), Found Boys Gram, Maths, Outer London
In teaching since 1994 and in present school since 2001. Between 1996 and 2000, taught in international school in East Africa. Main teaching subject physics, also some chemistry and biology. Upper pay scale with additional allowance, TLR2, as head of department/faculty. Leaving to teach in international school in Asia. “Wanted to travel and bring up my children in a different culture for a few years.”
Male, 30-34, Physics 2:1 (Greenfield), Found Coed Comp to 18, Tech, East Midlands
71

Box 7.4: Other Destinations
Other Employment Teaching since 1979 and in present school since 1985. Main teaching subject science/physics and also some ICT. Upper pay scale with an additional allowance, TLR2. Classroom teacher. Leaving for other employment to train as a home-information-pack inspector. “The behaviour of the students has deteriorated in the last five years to the point where little learning takes place. As a consequence there is little job satisfaction. I am attracted to becoming self-employed.”
Male, 50-54, Geology 2.1 (Ex-Tech), Comm Coed Comp to 18, MFL, South East
Teaching since 1997, in present school since 2001. Main teaching subject physics and some chemistry. Main pay scale, classroom teacher. Leaving to run own retail business. “Always saw teaching as my last career move and was initially very ambitious. In the end I was worn down by the workload and behaviour of pupils/politics and sought a business opportunity as an alternative.”
Male, 45-49, Phys/Chem 3rd (Greenfield), Comm Coed Comp to 18, Arts, Y&H
Further Education Teaching since 1991 in present school on fixed-term contract since 2007. Had 2-year break in service 1995-1997 in Asia. Main teaching subject physics with some science. Main pay scale, classroom teacher. Going to lecture in physics at FE college in South West. “Wanted to move to a different part of the country. College has better resources and facilities and travel will be a lot easier.”
Male, 35-39, Physics 2:1 (Top), VA Coed Comp to 18, Y&H
Maternity Teaching since 2003 in present school. Main teaching subject physics and science. Main pay scale with additional allowance, TLR2. Classroom teacher and team leader for KS3 Science. Leaving having had baby. Will be curriculum tutor on PGCE course at nearby university for approx one day per week and the rest of the time will be at home. “I have just had a baby. Returning to teaching would involve a lot of juggling of work and home commitments and the quality of life for my husband and myself would suffer. Even part-time involves a lot of compromise for you, your colleagues and students. I didn’t fancy coping with stroppy teenagers after a sleepless night! One of the reasons I went into teaching (leaving physics research) was that it is a career where you can easily stop and restart later when your children are older.”
Female, 25-29, Physics 1st and PhD (Top), Comm Coed Comp to 18, Maths, SE
Unsure Teaching since 1977 in just the one school. Teaches physics only. Upper pay scale with additional allowance as head of department. Not sure what she will be doing next: “Maybe part-time teaching, tutoring, marking – who knows? Just wanted to get out. Wanted lighter workload. There was lack of support from senior management, especially the headmistress. I was not valued.”
Female, 50-54, Physics 2.2 (Civic), Comm Girls Comp to 18, MFL, East
7.10 Boxes 7.2 to 7.4 treat the other main reasons for moving similarly. Box 7.2 focuses on retirements. Some were normal age, and the leavers were looking forward to more time for themselves, perhaps with some part-time involvement with schools or education generally. But most were teachers in the 50-59 age range, leaving early
72

and with some disaffection. Stress, pressure, new syllabuses, inspections, bureaucracy were all mentioned. Only occasionally was it because the spouse was retiring and they wanted to share in “a life of comparative leisure”.
7.11 Two of the main magnets drawing physics teachers away from the state sector were independent schools and international schools. Box 7.3 contains some of the teachers’ own stories and shows also that these leavers tended to come from grammar schools. It is mainly young well-qualified male teachers who look for an opportunity to work abroad, “before I got too old and had family commitments.” Moves to independent schools can be a reaction to what is happening in the state sector (“mickey mouse subjects”) or the opportunity to concentrate on teaching physics. But it could also just be a move to a school which happened to be in a part of the country where the teacher wanted to live or the living costs were lower.
7.12 Beyond moving within the state sector, retiring or going to an independent or international school, a variety of other explanations were given, collated in Box 7.4. Relatively few of the physics teachers took employment outside education, and those that did mainly went for self-employment. In the sample one was training to be a home-information-pack inspector (HIPs) and the other was setting up a retail business. Another leaver was mainly interested in moving to a particularly attractive part of the country and an opening came up in Further Education. Another, a leaver from a research background, had resigned to raise a family, having deliberately chosen teaching as “a career where you can easily stop and restart later when your children are older.” One leaver was unsure what she was going to do, having just wanted to get out of her present school where she had taught for 30 years because, “I was not valued”.
Experience of Schools 7.13 In this report we have described in detail the various stages of physics teacher supply
from teacher training, through deployment in schools, to leaving for other schools or elsewhere. To round it off we try to capture how it seems on the ground from the schools perspective. The concluding question in the Schools Survey (Survey III) asked: ‘Are there any other comments you would like to add about the recruitment and retention of teachers of physics in your school and/or generally?’ Boxes 7.5 to 7.7 present a selection of the comments organised around the three themes of: the schools’ perceptions of physics teacher recruitment; any special features of turnover; and what they were doing to try to ensure they were attracting the physics teachers they needed.
7.14 Box 7.5 bears out the analysis of Chapter 6 (Chart 6.2, page 60) which indicates that it is schools without sixth forms and those in London which find it most difficult to attract and retain physics teachers. But recruitment difficulties were not confined to schools in those categories. A school in the generally well-supplied South West said, “physics is worse than any other subject as far as recruitment is concerned”, which perhaps sheds some light on the somewhat surprising data of Chart 6.4, page 62, showing that the South West is only just above Inner London in its physics specialists.
73
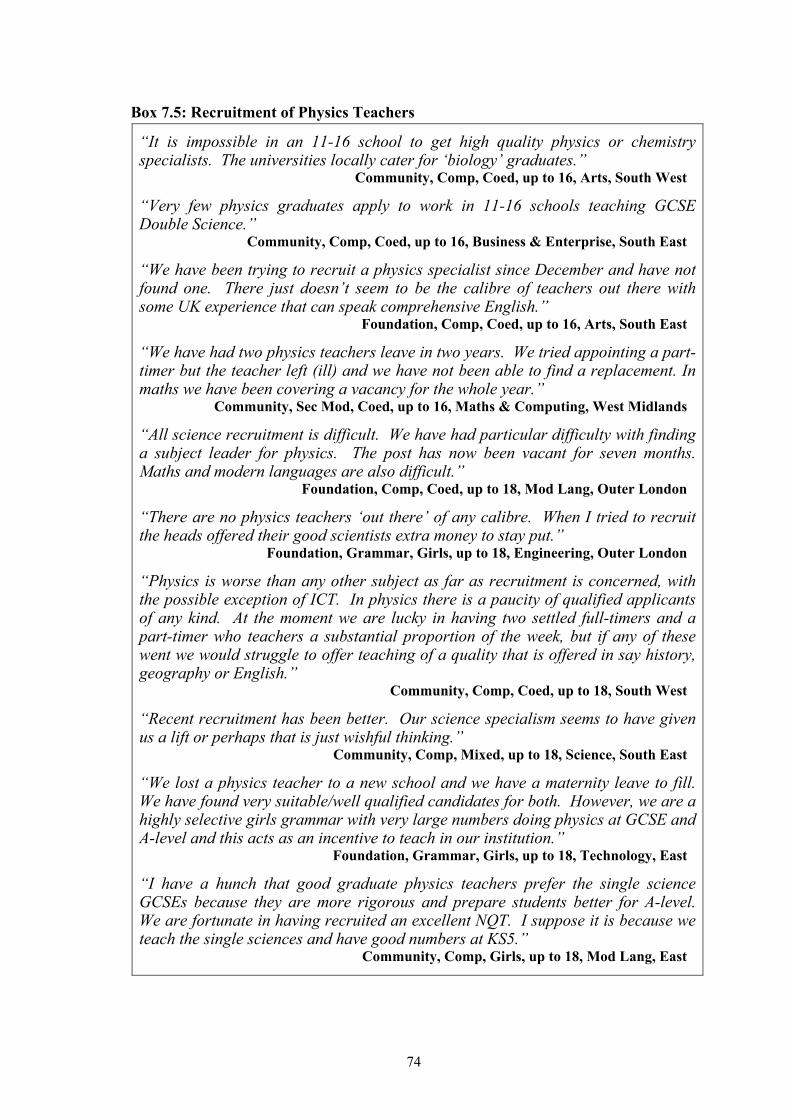
Box 7.5: Recruitment of Physics Teachers
“It is impossible in an 11-16 school to get high quality physics or chemistry specialists. The universities locally cater for ‘biology’ graduates.”
Community, Comp, Coed, up to 16, Arts, South West
“Very few physics graduates apply to work in 11-16 schools teaching GCSE Double Science.”
Community, Comp, Coed, up to 16, Business & Enterprise, South East
“We have been trying to recruit a physics specialist since December and have not found one. There just doesn’t seem to be the calibre of teachers out there with some UK experience that can speak comprehensive English.”
Foundation, Comp, Coed, up to 16, Arts, South East
“We have had two physics teachers leave in two years. We tried appointing a part-timer but the teacher left (ill) and we have not been able to find a replacement. In maths we have been covering a vacancy for the whole year.”
Community, Sec Mod, Coed, up to 16, Maths & Computing, West Midlands
“All science recruitment is difficult. We have had particular difficulty with finding a subject leader for physics. The post has now been vacant for seven months. Maths and modern languages are also difficult.”
Foundation, Comp, Coed, up to 18, Mod Lang, Outer London
“There are no physics teachers ‘out there’ of any calibre. When I tried to recruit the heads offered their good scientists extra money to stay put.”
Foundation, Grammar, Girls, up to 18, Engineering, Outer London
“Physics is worse than any other subject as far as recruitment is concerned, with the possible exception of ICT. In physics there is a paucity of qualified applicants of any kind. At the moment we are lucky in having two settled full-timers and a part-timer who teachers a substantial proportion of the week, but if any of these went we would struggle to offer teaching of a quality that is offered in say history, geography or English.”
Community, Comp, Coed, up to 18, South West
“Recent recruitment has been better. Our science specialism seems to have given us a lift or perhaps that is just wishful thinking.”
Community, Comp, Mixed, up to 18, Science, South East
“We lost a physics teacher to a new school and we have a maternity leave to fill. We have found very suitable/well qualified candidates for both. However, we are a highly selective girls grammar with very large numbers doing physics at GCSE and A-level and this acts as an incentive to teach in our institution.”
Foundation, Grammar, Girls, up to 18, Technology, East
“I have a hunch that good graduate physics teachers prefer the single science GCSEs because they are more rigorous and prepare students better for A-level. We are fortunate in having recruited an excellent NQT. I suppose it is because we teach the single sciences and have good numbers at KS5.”
Community, Comp, Girls, up to 18, Mod Lang, East
74
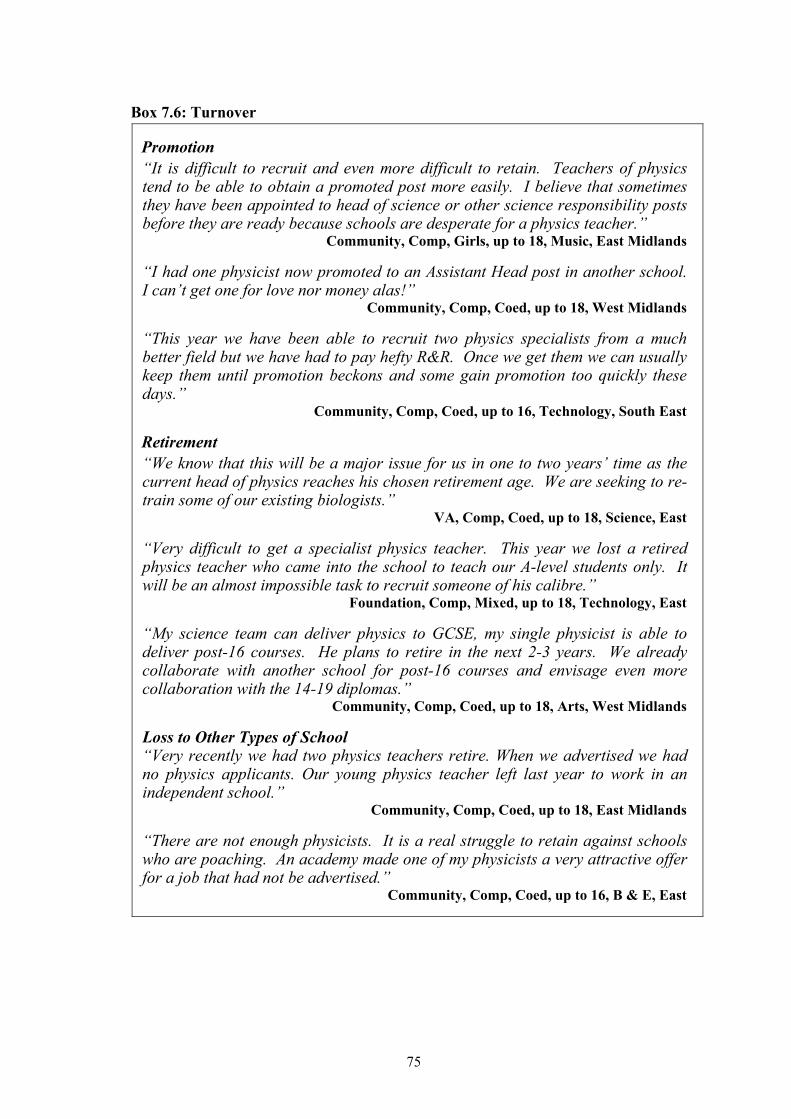
Box 7.6: Turnover
Promotion “It is difficult to recruit and even more difficult to retain. Teachers of physics tend to be able to obtain a promoted post more easily. I believe that sometimes they have been appointed to head of science or other science responsibility posts before they are ready because schools are desperate for a physics teacher.”
Community, Comp, Girls, up to 18, Music, East Midlands
“I had one physicist now promoted to an Assistant Head post in another school. I can’t get one for love nor money alas!”
Community, Comp, Coed, up to 18, West Midlands
“This year we have been able to recruit two physics specialists from a much better field but we have had to pay hefty R&R. Once we get them we can usually keep them until promotion beckons and some gain promotion too quickly these days.”
Community, Comp, Coed, up to 16, Technology, South East
Retirement “We know that this will be a major issue for us in one to two years’ time as the current head of physics reaches his chosen retirement age. We are seeking to re-train some of our existing biologists.”
VA, Comp, Coed, up to 18, Science, East
“Very difficult to get a specialist physics teacher. This year we lost a retired physics teacher who came into the school to teach our A-level students only. It will be an almost impossible task to recruit someone of his calibre.”
Foundation, Comp, Mixed, up to 18, Technology, East
“My science team can deliver physics to GCSE, my single physicist is able to deliver post-16 courses. He plans to retire in the next 2-3 years. We already collaborate with another school for post-16 courses and envisage even more collaboration with the 14-19 diplomas.”
Community, Comp, Coed, up to 18, Arts, West Midlands
Loss to Other Types of School “Very recently we had two physics teachers retire. When we advertised we had no physics applicants. Our young physics teacher left last year to work in an independent school.”
Community, Comp, Coed, up to 18, East Midlands
“There are not enough physicists. It is a real struggle to retain against schools who are poaching. An academy made one of my physicists a very attractive offer for a job that had not be advertised.”
Community, Comp, Coed, up to 16, B & E, East
75

Box 7.7: Strategies
“We don’t have any physics specialists and required the support this year of a science/physics AST through London Challenge to train the science department.”
Community, Comp, Coed, up to 16, Outer London
“We are using GTPs and an NQT to meet our recruitment needs in physics. The GTPs are former pupils.”
VA, Comp, Coed, up to 18, Business & Enterprise, Outer London
“Over the past seven years it has been very difficult to attract and keep teachers of physics. For three of the seven years we ‘made do’ with temporary fixes. We have also used staff whom, had there been advice, we would not have employed. Our current physicist is from Australia and is returning this summer.”
Foundation, Comp, Girls, up to 18, Maths & Computing, South East
“Recruitment is a huge concern. We have a physics teacher who we trained and have promoted to retain him. We are a technology and training school.”
Foundation, Sec Mod, Coed, up to 18,Technology, South East
“We have spent a lot of money and effort recruiting a full-time physics teacher to start in September. We finally recruited an NQT from Sweden via an agency.”
Community, Grammar, Boys, up to 18, Technology, South East
“We are lucky to have well qualified physicists who we have been able to retain via promotional/other responsibilities and by offering part-time.”
Foundation, Comp, Coed, up to 18, Technology, South East
“Physics teachers are in short supply and in order to retain ours we have shown them that they are valued, are in a good working environment and with a friendly supportive staff.”
Foundation, Comp, Coed, up to 18, Technology, East
“Recruitment is a nightmare! We have lots of biologists who we have to ‘train’ to teach physics at KS4. It is not just physics though; there are also problems in maths, English and D&T.”
VC, Comp, Coed, up to 18, Arts, West Midlands
“Largely the staff who teach physics here are chemists who have become physicists. Out of eight science staff in total only one is a physics graduate. Last year’s advert for a physicist only produced another chemist!”
Community, Comp, Coed, up to 16, Technology, Y & H
“Retention is vital. We have not been able to recruit a ‘true’ physicist for five years. Adverts have on occasion produced a nil response and other attempts produced no viable candidates. There is a critical shortage at NQT and ‘first promotion’ level.”
Community, Comp, Coed, up to 16, Engineering, Y& H
“The only R&R payment made in this school is to a physics teacher.” VA, Comp, Coed, up to 18, Arts, North West
76

7.15 Box 7.5 presents the broad range of comments on the current physics teacher recruitment situation and favourable ones were far outnumbered by concerns. Those making positive comments often felt they were at advantage – they offered physics at GCSE as well as A-level, they were selective, or specialist status had given them a boost.
7.16 The schools’ comments on turnover are the mirror image of what the leavers said about their reasons for going. Box 7.6 shows that they fall into three main groups: promotion; retirement; and loss to other schools. Physics teachers can enjoy rapid promotion: “I believe that sometimes they have been appointed to head of science or other science responsibility posts before they are ready because schools are desperate for a physics teacher.” Retirement is also a looming issue. But while, as they told us, some teachers are moving to independent or international schools, the heads also identified a threat from poaching by schools in more favourable circumstances including the academies as they come on stream.
7.17 Box 7.7 reveals that the schools are adopting a wide range of strategies to cope including:
• sharing with other schools;
• making do with ‘temporary fixes’ – recently retired teachers, agency staff etc;
• promoting;
• working hard at recruitment;
• being flexible over part-time teaching;
• making sure that the teachers feel valued;
• training up biologists;
• training teachers through use of the employment-based routes;
• making ‘hefty’ recruitment and retention payments.
7.18 These words of the headteachers, as they struggle to attract and keep the physics teachers they need, take us to the heart of the problem.
Résumé 7.19 Turnover and moves to other schools were somewhat higher for physics specialists
than for teachers in the other core subjects. The main driver of wastage in physics is retirement which contributes a quarter of the total turnover and half the wastage. Nearly three times as many physics leavers as biology leavers were aged over 50. Some of the retirements were normal age, but most were early often stemming from a sense of dissatisfaction. About half the physics teachers were leaving to go to other state schools. The main reasons were promotion, re-location and wanting to get away from present school.
77
7.20 Schools were asked about the current state of physics teacher recruitment. Schools without sixth forms and those in London (consistent with the statistics of Chapter 6) seemed to be experiencing the greatest difficulty, but there was a widespread view that physics is the most difficult subject for which to recruit. Those able to fill their posts thought it was because they were at an advantage through specialist teaching, and/or selection and/or a boost from specialist status.
7.21 In accounting for turnover, the schools’ views dovetailed with the accounts of leavers themselves: promotion; retirement; and loss to other schools (including some poaching). The schools adopted a wide variety of strategies for coping including: active recruitment; training up physicists; incentives; sharing with other schools; flexibility; and temporary ‘fixes’.
78
8. Looking to the Future 8.1 It is widely recognised that physics specialists are under-represented among science
teachers in state schools and in the introduction to this report we described a range of measures the government has adopted in seeking to correct the imbalance. There are training bursaries and golden hellos, enhancement, booster and flexible courses, schemes to involve undergraduates in teaching, and re-training for serving teachers. A major STEM (Science, Technology, Engineering and Maths) Programme was launched in October 2006. The Sainsbury (2007) Review of Government’s Science and Innovation Policies put forward a number of important proposals for broadening the base of recruitment and improving retention.
8.2 In 2006 HM Treasury on behalf of the government published The Science and Innovation Framework 2004-2014: Next Steps in which it set the goal of increasing the proportion of science teachers who had a physics specialism to 25 per cent by 2014. It is difficult to be sure what this means exactly since it is not stated in the form that there are currently X teachers with a physics specialism and we propose raising it to Y by 2014. In part, this reflects the difficulty of counting the physics teachers and science teachers, which tend to merge into one another since science is the national curriculum subject not physics. In our Schools Survey (Survey III) 63 schools out of 303 (20.8 per cent) chose to report all their science teachers as science teachers rather than distinguishing some with individual specialisms.
8.3 The government has accepted as a baseline that 19 per cent of the science teachers were physics specialists in 2005, a figure obtained in a survey in which heads of science were asked to report the specialism of their teachers (NFER, 2006). Our 2007 survey, described in Chapter 6, and using a similar method arrived at a comparable figure. But the government’s main source of information has been Secondary School Curriculum and Staffing Surveys, the most recent of which has just been published (DCSF 2008b). This Survey attempts to count qualifications in relation to periods taught and is not easy to interpret. The government is intending to replace this approach by an annual School Workforce Census, but the difficulties of precisely what to count will remain. What defines a physics specialist teacher? Is it the main teaching subject, which may differ between Key Stage 3, Key Stage 4 and A-level, or the subject of qualification in which case what is to be regarded as appropriate? If it is subject of qualification, is this to be: the subject of the degree obtained which raises the question of what counts as physics and physics-related; subject of initial teacher training which may itself be science; or completing an enhancement course when consensus has to be reached on what level of enhancement turns a non-specialist into a specialist?
Definitions and Data 8.4 It may not, therefore, be possible to determine in any solid way whether the
proportion of physics specialists among science teachers has risen to 25 per cent by 2014. But we can accept it as a sign of the government’s commitment to increase the number of specialist physics teachers. A more direct approach would be to monitor the rate of progress towards this objective by comparing the inflows and outflows. Obviously, if more are entering than leaving then provision is improving provided that the increase is proportionally greater than any increase in pupil numbers.
79
We recommend that the provision of physics teachers be carefully monitored by measuring as accurately as possible the inflows and outflows each year.
8.5 Even this simple-seeming calculation is not as straightforward as might be thought. The elements that need to be taken into account are clear. On the one hand, inflows comprise newly-trained teachers, teachers who have been out of service who return, and transfers in from other sectors, for example, from further education. On the other, the outflow is physics teachers leaving the maintained sector. However, putting precise numbers on the elements is much less easy than it should be partly because of the difficulties of definition and partly due to differences in the data from different sources. Is, for example, moving from a part-time to a full-time contract a return to the maintained sector (as it is treated in DCSF statistics), or is moving from a comprehensive school to a city technology college (state funded but classed as independent) leaving the maintained sector?
8.6 But more than that even for agreed definitions the actual numbers are hard to pin down. The TDA, if anyone, should know how many physics teachers are being trained each year. It conducts a Trainee Numbers Census (TDA, 2007) which collects “information on the number and characteristics of trainees who register or who are forecast to register on TDA-funded mainstream initial teacher training courses for the forthcoming academic year.” In line with government policy it has recently begun to disaggregate the science teachers. Trainees on employment-based initial teacher training routes are collected via another system, the EBR database which “is open all year round and does not have timed collections such as the Census.”
8.7 On the strength of its latest Trainee Numbers Census, the TDA on 11 November 2007 issued a buoyant press release reporting that the number of trainees with a physics specialism had risen from 365 in 2006-07 to 477 in 2007-08, with 40 new and expected trainees on employment-based programmes. Chemistry numbers had also leapt. Chart 8.1 presents the data, in comparison with the GTTR accepted applicant figures for the same years. In sharp contrast to the TDA figures, the GTTR returns are little changed. Moreover the TDA and GTTR figures for the 2005 physics trainee intake were similar - TDA, 289 (see Chart 5.2, page 55) and GTTR, 301 (website).
8.8 There are a number of possible reasons for the divergence.
• Physics trainees notoriously apply late and applicants after 1 July deal directly with the provider so the details may not be passed on to the GTTR;
• The TDA figures refer to all mainstream courses, while the GTTR covers only postgraduate courses so it is possible, but not likely, that the growth has occurred outside the ambit of the PGCE;
• It is not clear how enhancement course trainees are counted and it could be that the boost they have given appears in the TDA figures but not the GTTR’s.
80

Chart 8.1: Comparison of TDA and GTTR Intake Data 2006 2007
ITT Course TDA1 GTTR2 TDA1 GTTR2
Physics 365 298 477 311 Chemistry 558 457 739 465 Biology 914 877 968 831 Comb/Gen Science 1,132 1,052 883 1,068 Applied/Other Science3 18 14 24 13 Total 2,987 2,698 3,091 2,688
1. TDA ITT Training Numbers Census covering all mainstream teacher training courses but not employment-based routes in England. 2. GTTR website. 3. Applied science, environmental science and geology.
8.9 But the GTTR figure of 298 accepted applicants for physics for 2006 admissions which includes both universities and school-based schemes is not very different from the figure of 281 reported to us by the university admissions tutors (Chart 3.1, page 20) - bearing in mind that the latter does not include the SCITTs and that not all accepted applicants actually take up places. It is possible that some of the increase reported by the TDA comes from trainees moving on from enhancement courses to PGCE training which have not been recorded by GTTR.
8.10 There is, however, another and more likely explanation. The steep rises in the physics and chemistry PGCE intakes from 2006 to 2007 are accompanied by a sharp fall in the combined/general science entry. From 2007 a specialism premium of £1,000 per new trainee has been introduced to encourage the recruitment of physics specialists and eligibility is defined quite broadly (see page 4). The training providers are also handsomely rewarded by a recruitment premium for additional new entrants in physics (page 4). Both premiums are payable on completion of the TDA Census. As we saw in Chapter 3 (pages 20-23) there may not be much difference in practice between a physics and a science PGCE. The premiums could have acted to prompt some training providers to re-classify trainees from the combined/general science category to physics after they had been admitted in GTTR terms as combined/general scientists. Chemistry too attracts the premium and this would help to explain the leap here also. The apparent increase in numbers could therefore, in effect, be the same trainees reported under a different label.
8.11 Both definitions and consequently the ensuing statistics, therefore, are muddy. If serious progress is to be made towards providing more specialist physics teachers for schools then it is important that what is to count as specialist training should be sorted out as a as a matter of urgency.
We recommend that agreed definitions be reached for ‘specialist physics teacher’ and ‘specialist physics teacher training’.
It is important that the DCSF, TDA, GTTR, HESA and the training providers should work together to arrive at as accurate statistics as possible.
81

A Balance Sheet 8.12 There has, therefore, to be considerable uncertainty at present in drawing up any
balance sheet. In Chart 8.2 we provide the best approximation we can for the year 2005-06, the latest year for which the TDA Teacher Training Profiles are available.
Chart 8.2: Gains and Losses of Physics Teachers Flows Number
Inflow Newly Trained: PGCE1 215 Newly Trained: EBITT1 20 Transfer in or Re-entrant2 95 Sub Total 330
Outflow Leaving State Sector3 445 Sub Total 445 Net (-115)
1. Provided by TDA. 2. Estimated from DCSF (2008a). 3. Calculated from survey data of Chapter7.
Inflow 8.13 The inflow in 2005-06 was arrived at from estimates of the newly qualified PGCE
trained taking posts in state schools; those achieving QTS via employment -based routes, and re-entrants and transfers into the sector (movements between state schools are discounted since it is a sector-wide calculation).
• The information on the newly qualified PGCE entrants is taken from Chart 5.2, page 55, based on TDA analyses of the 2007 Training Profiles dataset. Of the 289 physics teacher trainee intake in 2005, 254 successfully completed, and of these 207 were in a teaching post (including independent schools) the January following completion, 17 were still seeking a post, 14 were not seeking a teaching post (5.5 per cent) and the destinations of 16 were unknown. To the 207 in teaching can be added 31 of those ‘still seeking’ and the ‘unknowns’ (deducting 5.5 per cent as conservative estimate of those who do not become teachers). From Chart 5.3, page 56, we can assume 9 per cent of the newly-trained teachers took posts in independent schools leaving 217 as our best estimate of entrants to the state sector.
• The TDA in a private communication reported that 21 physics trainees had achieved QTS by employment-based training in 2005-06.
• About two-fifths (39.8 per cent in DCSF 2008a) of teachers recruited by state schools are transfers in or re-entrants, and we can apply this figure to physics but it is almost certainly an over-estimate since a high proportion of the physics leavers are retirements.
• Rounding to the nearest 5 teachers.
82

Outflow 8.14 The best available data on the turnover and wastage of physics teachers are
contained in this report (Chart 7.4, page 68) which are for 2006-07 and we have to assume the figures for 2005-06 were about the same. From our 10 per cent sample we found that 31 physics teachers were leaving the state sector in the summer term. In order to arrive at the annual figure of 445 entered in Chart 8.2 we have:
• multiplied by 10 to scale up from the sample to the population;
• assumed from previous studies (see paragraph 7.3, page 66) that 70 per cent of teachers resign in the summer term and so have multiplied by 100/70;
• rounded to nearest 5.
8.15 This calculation can only be indicative. There are a number of underlying assumptions. Any error in the sampling will be magnified in the scaling up. It also does not include city technology colleges, academies, sixth form and further education colleges which, as well as independent schools, are in the market for specialist physics teachers. But the size of the gap between outflow and inflow does suggest that the number of physics specialists could actually have fallen in 2005-06.
Improving? 8.16 But as we saw in Chart 8.1 alternative figures are available. If we had used the 2006
and 2007 TDA Census recruitment figures in Chart 8.2, keeping to the same assumption that 75 per cent of the intake would take posts in state schools (from 217/289), different estimates of the gap between outflows and inflows would have been obtained. The 2006 entry figure of 365 could have been expected to have yielded 275 teachers for state schools halving the gap from 115 to 55. In 2007-08 there could actually be a small surplus of teachers available over outflow. The entry figure of 477 could be expected to provide 360 teachers for state schools. If we also take into account the projected increase from 21 to 40 via employment-based routes potential inflow would exceed outflow by 55 taking the government towards its 2014 target. But of course these estimates depend crucially on the categories used for counting and the accuracy of the data. If we had used the GTTR data there would continue to have been shortfalls of over 100.
Further Measures to Increase Supply 8.17 It could be that more physics teachers are now being trained than are leaving and
that progress is being made towards the 2014 target, but in view of the uncertainties surrounding the balance sheet we cannot be sure. Alternative estimates point to a less favourable picture. It is important, therefore, to consider other ways of increasing physics teacher output. There are already signs that the Science Additional Specialism Programme (see page 6) will bear fruit. Data from the TDA show that in 2007-08 there are 48 serving teachers enhancing their understanding of physics in the three centres piloting the programme (Edge Hill, Keele and Brighton Universities).
8.18 But the data of this report pose several interesting questions which could point the way to other approaches to increasing the supply of physics teachers.
83

• If large numbers of physics teachers are retiring (see Chart 7.4, page 68), why was it once a more popular as career than it seems to be now?
• Why should working in independent schools be so much more attractive to some trainees (see Chapter 3) even when their tutors may actively discourage them from taking these posts?
• Why should a quarter of physics graduates entering teaching (Chart 2.9, page 15) chose to train as maths teachers?
8.19 The answers may lie in changes that have taken place in the teaching of physics in state schools which have not affected the independent sector to the same degree. Since the 1988 national curriculum physics has been subsumed within science. This has had several effects. Physics has, to some extent, lost its identity as a school subject in the state sector, but it has retained it in the independent sector which is not subject to the national curriculum. In order to prepare teachers to teach science, the training institutions have been asked to ensure that their trainees are able to offer all three sciences even though the trainees themselves may not have studied all three. This has led to the expectation that physicists, who may feel they have a closer affinity to maths, would be able to teach biology. Likely answers to the three questions, therefore, appear to be:
• that physics teaching was once more popular than it is now because it was physics teaching not science teaching;
• that posts in independent schools attract applicants because they are specialist posts;
• that some physicists are attracted to maths teacher training because they prefer to teach maths to biology.
8.20 This leads us to propose two further measures the government could consider to increase physics teacher supply.
Make physics teaching more attractive by encouraging the teaching of physics as a subject in its own right.
Make PGCE teacher training more flexible by, for example, encouraging physics PGCEs and physics and maths PGCEs.
8.21 This would not only enable state schools to compete more effectively with independent schools, but it would also open up a potential new source of supply. One of the admissions tutors whom we have already quoted (page 38) encapsulates the argument.
My take on this is that we attract a sub-set of the possible physicists. In other words, it is made very explicit to people that part of the deal is teaching outside your specialism therefore the ones who come forward and apply have accepted that as part of what is required and often are really quite happy about it. The unanswered question for me has always been: how many out there find out about that and say it is not for me?
84

8.22 The admissions tutors interviewed for Chapter 3 were generally supportive of the idea of alternative PGCE courses, but some could foresee difficulties like pressure on resources, the risk that the trainees would prefer to teach maths, and being out of step with the way the subjects are organised in schools (see pages 40-41).
Retention 8.23 There could also be action on other fronts. There is evidence that the loss of physics
teachers during the first five years of teaching tends to be higher than that of other science and maths teachers (DfES, 2007). A contributory factor here, as we showed in Bucking the Trend (Smithers and Robinson, 2007), is that because of the shortage of physics teachers the newly-trained can find themselves as the sole physics teacher in a school and not get a proper chance to develop their own professional expertise. The present study (Chart 7.3, page 67) also found a higher rate of turnover among physics teachers than for the other core subjects, though this mainly reflected a higher rate of retirement. The data on retention lead us to make two other proposals.
Improve support for physics teachers in the early crucial years of teaching by increased mentoring provision.
Reduce the losses to independent schools by making state schools more competitive through greater opportunity to specialise, better facilities and more technician back-up. This could also be expected to reduce early retirements.
Deployment 8.24 But it is likely to continue to be difficult to ensure a supply of high calibre physics
teachers across all schools. Our outflow figure of around 440 suggests that over a fifth of the graduate output would be required each year to maintain the status quo from new graduates. This is daunting enough but as physics graduates fall at the opposite end of the occupational values spectrum from teachers (see page 2 and comments of admissions tutors, page 26), particularly with regard to working with people, only a small proportion of the graduates are likely to be attracted to teaching.
8.25 It is necessary, therefore, to address the deployment of the available teachers as well as seeking to improve supply and retention. In the first report in this series (Smithers and Robinson, 2005) we uncovered a hiatus between the further education sector and 11-16 schools. Generally, sixth form and further education colleges had well-qualified physics teachers, but could not always attract sufficient students, while the feeder 11-16 schools on which they were dependent often could not find any physics teachers. In other words, it is a bit like trying to position a ladder several storeys off the ground.
Improve the deployment of existing teachers by incentivizing sixth form and further education colleges to work in partnership with 11-16 schools to ensure that the pupils are taught by well-qualified physics teachers as they move up through the schools.
8.26 At its height A-level physics was taken by 5.9 per cent of the age group, but by 2005 the percentage had fallen to 3.9 (Smithers and Robinson, 2006). So it does look as
85

though there are children who are falling through the net. But the proportion taking physics to a high level has never been large, nor is it in other countries (Smithers, 1997). If there are relatively few pupils capable of taking physics to a high level and relatively few highly qualified physics teachers, then ways should be explored of bringing them together. De facto this is already happening in the independent sector and grammar schools. One way of enhancing provision in the state sector would be to make specialist science schools particularly attractive to well-qualified physics graduates. They are already moving in this direction (Chart 6.5, page 62 and the eighth quote in Box 7.5). A necessary corollary would be, however, to allow the specialist schools to select some of their intake. Specialist science schools need not be the only way to do it. There could be open competition among the schools to become centres of physics excellence and some of the comprehensives studied in Smithers and Robinson (2007a) would have a very good case. Such a policy would require a considerable shift in thinking, but we suggest that the data and evidence on physics teacher availability means that it should be considered.
Since there are relatively few pupils interested in taking physics to a high level and relatively few well-qualified teachers, we suggest that ways be explored of bringing them together in particular schools, either the specialist science schools or schools chosen on other criteria.
Conclusion 8.27 The government has recognised that physics is in decline as a school subject and is
making strenuous attempts through various incentives and initiatives to provide more teachers in the subject. In this report we have looked in detail at the flows through teacher training, entry into the profession, the distribution of physics teachers across different types of school, and turnover and wastage. The government has adopted a target that a quarter of science teachers by 2014 should have a specialism in physics, but this is difficult to put into practice and monitor. We suggest that a more direct approach to ascertaining whether physics teacher provision is improving would be comparison of inflows and outflows. This will require better definitions and more reliable statistics than are available at present. But the early indications from adopting such an approach are that the number of physics specialist teachers was declining in 2005-06. While recognising that schemes like the Physics Enhancement courses and the Science Additional Specialism Programme are having an impact, further measures encompassing supply, retention and deployment are put forward for consideration.
86

References Department for Education and Science (1985). Science 5-16: A Statement of Policy.
London: HMSO.
Department for Education and Skills (2003). Secondary Schools Curriculum and Staffing Survey, November 2002 (Provisional). Statistical First Release 25/2003. London: DfES.
Department for Education and Skills (2007). ‘Proportion of teachers qualifying in 1999 recorded as in service in maintained secondary schools in England in subsequent years.’ Prepared by School Workforce Analysis Unit, DfES.
Department for Schools, Children and Families (2008a). School Workforce in England. Statistical First Release 29/2007 (additional tables published January 2008 on the DCSF website).
Department for Schools, Children and Families (2008b). Secondary School Curriculum and Staffing Survey 2007. Research Report DCSF-RR026.
Higher Education Statistics Agency (2007). Students in Higher Education Institutions 2005-06. Cheltenham: HESA.
HM Treasury (2006). Science and Innovation Investment Framework 2004-2014: Next Steps. London: HMSO.
National Foundation for Educational Research (2006). Mathematics and Science in Secondary Schools: the Deployment of Teachers and Support Staff to Deliver the Curriculum. Slough: NFER.
Sainsbury, D. (2007). The Race to the Top: A Review of Government’s Science and Innovation Policies. London: HM Treasury.
School Science Curriculum Review (1987). Double Award Balanced Science: Statement of Support. SSRC and Engineering Council.
Rosenberg (1957). Occupations and Values. Free Press: Glencoe, Illinois.
Smithers, A. (1969). ‘Occupational values of students’, Nature, 222, 725-26.
Smithers, A. (1997). ‘The supply of, and demand for, scientists and engineers,’ The Save British Science Lecture, Annual Meeting of Association for Science Education, Birmingham, 2 January, 1997. (http://www.buckingham.ac.uk/education/research/ceer/index.html)
Smithers, A. and Carlisle, S. (1970). ‘Reluctant teachers’, New Society, 15, 391-92.
Smithers, A. and Hill, S. (1989). ‘Recruitment to physics and maths teaching: a personality problem?’ Research Papers in Education, 4, 3-21.
Smithers, A. and Robinson, P. (2000). Attracting Teachers: Past Patterns, Present Policies and Future Prospects. Liverpool: The Carmichael Press.
Smithers, A. and Robinson, P. (2001). Teachers Leaving. London: National Union of Teachers.
Smithers, A. and Robinson, P. (2003). Factors Affecting Teachers’ Decisions to Leave the Profession. Research Report 430. Nottingham: DfES Publications.
87

Smithers, A. and Robinson, P. (2004). Teacher Turnover, Wastage and Destinations. Research Report 553. Nottingham: DfES Publications.
Smithers, A. and Robinson, P. (2005). Teacher Turnover, Wastage and Movements Between Schools. Research Report 640. Nottingham: DfES Publications.
Smithers, A. and Robinson, P. (2006). Physics in Schools and Universities II: Patterns and Policies. Buckingham: Carmichael Press.
Smithers, A. and Robinson, P. (2007a). Physics in Schools III: Bucking the Trend. Buckingham: Carmichael Press.
Smithers, A. and Robinson, P. (2007b). Teacher Training Profiles 2007. Buckingham: CEER.
Training and Development Agency for Schools (2007). ‘More new science teachers than ever before’, Press Release 11 November 2007.
88
Appendix A: Data A.1 The aim of the study has been to provide as complete and up-to-date a picture as
possible of physics teacher provision. The data have come from a number of sources, but are principally of two kinds: national statistics and survey data.
National Statistics A.2 By national we mean England. The countries of the UK run their own school
systems. This has always been the case in Scotland and Northern Ireland, and with devolution those in England and Wales are growing further apart. Sometimes the statistics, particularly older statistics, are for England and Wales combined, but wherever possible we have separated them.
Graduate Teacher Training Registry A.3 The GTTR is an admissions service operated by UCAS for entry to postgraduate
teacher training courses in higher education (undergraduate applications to ITT are dealt with directly through UCAS). Currently all higher education institutions in England and Wales recruit through the GTTR and all but the University of Paisley (it processes its own applications) do so in Scotland. It also covers PGCE programmes in school-centred initial teacher training (SCITT) so it is a valuable source of data for training routes other than the employment-based schemes (EBITT).
A.4 Data on applications and acceptances processed by the GTTR are published in two formats, an annual statistical report giving data on overall numbers for the year and a website which monitors applications and acceptances compared to the same time in the previous year. Applicant data are published on a monthly basis, starting in February of the application cycle and quarterly for acceptances. These data are aggregated by institution but broken down by country, enabling us to compile data for England only. A run of years is available on the website from 2001 through to 2008. The Annual Report, published in July on the previous year, tabulates applications and acceptances by subject in the secondary age range for each institution. Data are also available on applicants by gender, age and outcome, and for the primary and middle age range courses.
Training and Development Agency for Schools A.5 The TDA came into being in September 2005 from a merger of the Teacher Training
Agency (TTA) and the National Remodelling Team (NRT). Established ten years earlier in 1994, the TTA’s main responsibility had been the initial recruitment and training of teachers in England’s schools (Wales, Scotland and Northern Ireland have their own arrangements), including the allocation of places to providers. The TDA has a wider remit covering the whole school workforce. In addition to ensuring that schools have an adequate supply of good quality newly qualified teachers it has the added responsibilities of enabling schools to develop the effectiveness of their support staff, to develop the effectiveness of their teachers and keep their knowledge and skills up-to-date (CPD), and to support schools to be effective in the management of training, development and remodelling of their workforce.
89

A.6 In relation to its core business the TDA compiles extensive data through its Trainees Numbers Census, its Teacher Training Profiles and its Employment Based Routes Database. Much of this statistical information is available on its website, but it will also provide additional information and the datasets can be accessed with permission by researchers. CEER has drawn on the Teacher Training Profiles since their inception in 1998 to provide an annual report on teacher training including league tables of providers (for example, Smithers and Robinson, 2007b).
Higher Education Statistics Agency A.7 HESA collects data about students on courses in UK higher education institutions at
first degree, other undergraduate and postgraduate levels, the qualifications obtained and their first destination six months after qualifying. The data are published annually as Students in Higher Education Institutions and Destination of Leavers from Higher Education Institutions. In addition, we commissioned in July 2007 special analyses on student entry to PGCE courses and the employment destination of PGCE qualifiers.
Chart A1: Variables Dataset 1 Dataset 2 Academic year Age in Years Gender Mode of Study Institution of First Degree Country of Institution Institution of PGCE Country of PGCE Institution Qualification (on entry to PGCE) Classification of First Degree Programme Title (eg BSc. Physics) Subject 1 of qualification Subject 2 of qualification Subject 3 of qualification Subject balance indicator Destination of PGCE leavers Teaching sector Teaching phase
A.8 The data were provided for each student (anonymised) on a case-by-case basis for the years 2002/03 through to the latest available, 2005/06. Prior to 2002/03 the data are not strictly comparable because of changes in the classification of subjects studied. Unfortunately the data are held in two separate databases so we were not able to track the same students through from entry to teacher training to employment, but we were able to line up the two datasets on an aggregate basis. Chart A1 shows the variables included in the datasets.
90
• Dataset 1 (students moving directly from first degree to PGCE) contains 27,873 cases (6,373 in 2002/03; 6,979 in 3003/04; 7,361 in 2004/05; and 7,160 in 2005/06).
• Dataset 2 (all PGCE qualifiers in employment) comprises 79,072 cases (17,473 in 2002/03; 19,892 in 2003/04; 20,687 in 2004/05 and 21,020 in 2005/06). The data are UK wide, but England can be separated out.
CEER Database A.9 Our Centre has compiled from various sources a database which covers the location
and characteristics all maintained secondary schools in England. It is derived, in part, from the DCFS’s Edubase - a listing of schools which is regularly updated and available on the Department’s website, as a school finder facility. The full listing can be purchased. School characteristics recorded include age range, gender, admissions policy, religious character of the school and specialist status and subject. Eligibility for free school meals (FSM) was added as a surrogate for the socio-economic environment of the school and obtained from the DCFS’s website under Freedom of Information. Additional variables on school performance at GCSE and A-level, as well as pupil numbers at Key Stages 4 and 5 and the size of the sixth form were obtained from the DCFS’s School and College Achievement and Attainment tables.
Surveys A.10 Data for the study were also gathered by means of interviews with the admissions
tutors of all PGCE courses training specialist physics teachers and three surveys focusing, respectively, on physics teacher trainees, physics teachers in schools and physics teachers leaving.
I. Interviews with Physics PGCE Admissions Tutors A.11 The interviews with admissions tutors were carried out by telephone in June and
early July 2007. Contact was made by first listing the institutions shown on the GTTR website as offering a physics PGCE in 2007-08. The GTTR’s Annual Report, which is usually published in July each year, was not available at the time the interviews were being planned and the information differs slightly from that on the website.
A.12 Twenty-eight institutions were listed. Each individual institution’s website was searched to find the name and contact details of the admissions tutor. In some cases there was a named individual for physics and in others physics was subsumed under the general title of admissions tutor for science. Tutors were e-mailed describing the research and asked if they would be willing to participate. Over a period of two weeks all 28 tutors responded, a handful after several reminders, and all agreed to take part.
A.13 The interviews were semi-structured and covered the following:
• organisation of the course;
91
• recruitment - applications, subject background, suitability for teaching, age and gender, physics department in the university, boosting recruitment;
• teaching practice - physics trainees, science trainees generally, how availability ensured, whether schools used includes independent schools;
• retention - nature of school physics, unsuited to teaching, transfers, personal;
• destinations - state school, independent school, still seeking post, not entering teaching;
• physics as combined science - a problem? effect on applications, interaction with school science;
• physics and maths PGCE - arguments for, against and difficulties;
• trends and prospects - whether the signs are hopeful or concerning.
A.14 The tutors gave their permission for the interviews to be taped and transcribed on the assurance that no person or institution would be identified individually. The interviews were conducted by telephone and varied in length up to about 45 minutes. Some tutors were keen to talk at length about the recruitment of physics teachers and the training process in general.
II.Teacher Trainee Questionnaires A.15 At the end of the interviews the admissions tutors in a sample of ten universities
were asked if they would be willing to pass on a questionnaire (to be completed anonymously) to their group of physics trainees who were about to complete the course. All agreed and 80 responses were received from a possible 101 (79.2%) trainees. The questionnaire covered: gender; age; qualifications; route into teaching; attractions of teaching; intention to teach in maintained schools; applications to schools; expectation of teaching in five years time; and interest in teaching maths.
III.Schools Questionnaire A.16 There is no good information on turnover and wastage rates by subject because there
is no accurate data on teacher numbers by subject. A special survey was therefore devised to collect this information. Schools are being asked to provide so much information about themselves that they are becoming increasingly reluctant to complete questionnaires so we opted to construct a quota sample.
A.17 Headteachers in secondary, maintained schools in England were sent a letter and questionnaire in the last week of May 2007, just before the resignation deadline of 31 May, to ask them if they would provide information on how many full-time teachers they had specialising in the teaching of physics, chemistry, biology, other science, mathematics, English and languages, and how many were leaving that term. For each leaver the school was asked to provide a few details by ticking boxes on a chart provided. These details were: subject specialism; type of contract; post held; gender; age; length of service; and destination.
92
A.18 About a fifth of headteachers (19.8 per cent, or 599 out of 3,032) provided information. Not all returns were complete and 95 questionnaires were rejected, leaving a total of 504. From this a 10 per cent quota sample was arrived at by filling the cells of a cross-tabulation of size by region. Where more questionnaires were available than needed for the cell those included were drawn randomly with the others held in reserve. The cross tabulation was revisited to ensure that the sample also matched the population on selection, funding type, age range, gender, specialism and faith. This was achieved by swapping, where necessary, schools previously included with those from the reserve. As Appendix B shows, an excellent degree of correspondence was achieved but this does not compensate for limitations in the original sample and this must be borne in mind in the interpretation. However, the quota sample also provided a good prediction of the population values on special needs and eligibility for free school meals, which were not controlled in arriving at the sample.
IV.Leavers Questionnaire A.19 Headteachers who returned questionnaires and had summer leavers (about 90 per
cent) were asked if they would be willing to pass on a letter to each of the teachers intending to leave at the end of the summer term (the leavers’ names were unknown to us). This enclosed a letter asking them to provide some brief biographical details, their reasons for resigning and where they were going. Specifically it covered: main teaching subject(s) and other teaching subject(s); gender; age; ethnicity; teacher training route; first degree; years teaching; nature and length of service; pay scale, allowances and post; destination; and reason(s) for leaving.
A.20 A total of 1,450 letters were sent to schools but we do not know how many were passed on to leavers. Four hundred and twenty-three replies (29.2 per cent of the total sent to schools) were received.
93
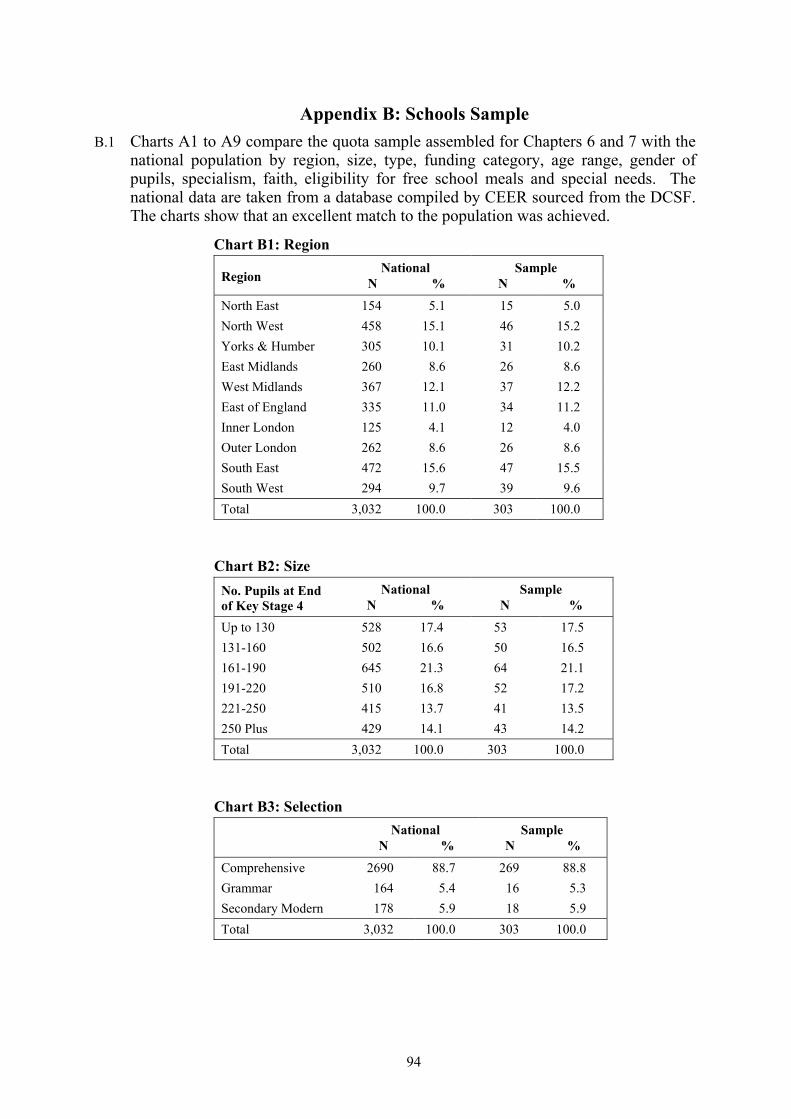
Appendix B: Schools Sample B.1 Charts A1 to A9 compare the quota sample assembled for Chapters 6 and 7 with the
national population by region, size, type, funding category, age range, gender of pupils, specialism, faith, eligibility for free school meals and special needs. The national data are taken from a database compiled by CEER sourced from the DCSF. The charts show that an excellent match to the population was achieved.
Chart B1: Region National Sample
Region N % N %
North East 154 5.1 15 5.0 North West 458 15.1 46 15.2 Yorks & Humber 305 10.1 31 10.2 East Midlands 260 8.6 26 8.6 West Midlands 367 12.1 37 12.2 East of England 335 11.0 34 11.2 Inner London 125 4.1 12 4.0 Outer London 262 8.6 26 8.6 South East 472 15.6 47 15.5 South West 294 9.7 39 9.6 Total 3,032 100.0 303 100.0
Chart B2: Size National Sample No. Pupils at End
of Key Stage 4 N % N %
Up to 130 528 17.4 53 17.5 131-160 502 16.6 50 16.5 161-190 645 21.3 64 21.1 191-220 510 16.8 52 17.2 221-250 415 13.7 41 13.5 250 Plus 429 14.1 43 14.2 Total 3,032 100.0 303 100.0
Chart B3: Selection National Sample N % N %
Comprehensive 2690 88.7 269 88.8 Grammar 164 5.4 16 5.3 Secondary Modern 178 5.9 18 5.9 Total 3,032 100.0 303 100.0
94

Chart B4: Funding Category National Sample N % N %
Community 1,903 62.8 188 62.0 Voluntary Aided 514 17.0 53 17.5 Voluntary Controlled 89 2.9 10 3.3 Foundation 526 17.3 52 17.2 Total 3,032 100.0 303 100.0
Chart B5: Age Range National Sample N % N %
Up to 16 1,308 43.1 131 43.2 Up to 18 1,724 56.9 172 56.8 Total 3,032 100.0 303 100.0
Chart B6: Gender of Pupils National Sample N % N %
Mixed 2,630 86.7 263 86.8 Girls’ 223 7.4 22 7.3 Boys’ 179 5.9 18 5.9 Total 3,032 100.0 303 100.0
Chart B7: Specialism National Sample N % N %
Technology 565 18.6 56 18.5 Arts 415 13.7 41 13.5 Sports 344 11.3 34 11.2 Science 289 9.5 30 9.9 Maths & Computing 240 7.9 23 7.6 Business & Enterprise 222 7.3 22 7.3 Languages 220 7.3 22 7.3 Combined 89 2.9 12 3.8 Humanities 78 2.6 6 2.0 Engineering 48 1.6 6 2.0 Music 18 0.6 1 0.3 Non-Specialist 504 16.6 50 16.5 Total 3,032 100.0 303 100.0
95

Chart B8: Faith National Sample N % N %
Church of England 153 5.0 15 5.0 Roman Catholic 329 10.9 32 10.6 Other Christian 28 0.9 3 1.0 Other Faith 12 0.4 1 0.3 Secular 2,510 82.8 252 83.2 Total 3,032 100.0 303 100.0
Chart B9: By School Characteristics Means National Sample
% Free School Meals 15.74 14.90 % Special Needs Supported 11.10 10.62 % Special Needs with Statement 7.35 7.33
96

(INSIDE BACK COVER BLANK)

(BACK COVER)
ISBN 978 1 901351 92 7
Carmichael Press, University of Buckingham, MK18 1EG