Physics-based Stimulation for Night Vision Goggle Simulation · 2011-05-14 ·...
64
AFRL-HE-AZ-TR-2006-0050 Physics-based Stimulation for Night Vision Goggle Simulation Jeff Clark Renaissance Sciences Corporation 1361 North Alma School Road Chandler AZ 85224 November 2006 Final Report for January 2004 to June 2006 Air Force Research Laboratory Human Effectiveness Directorate Warfighter Readiness Research Division Approved for public release; Distribution is unlimited.
Transcript of Physics-based Stimulation for Night Vision Goggle Simulation · 2011-05-14 ·...

AFRL-HE-AZ-TR-2006-0050 Physics-based Stimulation for Night Vision Goggle Simulation
Jeff Clark
Renaissance Sciences Corporation 1361 North Alma School Road
Chandler AZ 85224
November 2006 Final Report for January 2004 to June 2006
Air Force Research Laboratory Human Effectiveness Directorate Warfighter Readiness Research Division
Approved for public release; Distribution is unlimited.

NOTICES This report is published in the interest of scientific and technical information exchange and its publication does not constitute the Government’s approval or disapproval of its idea or findings. Using Government drawings, specifications, or other data included in this document for any purpose other than Government procurement does not in any way obligate the U.S. Government. The fact that the Government formulated or supplied the drawings, specifications, or other data does not license the holder or any other person or corporation; or convey any rights or permission to manufacture, use, or sell any patented invention that may relate to them. Qualified requestors may obtain copies of this report from the Defense Technical Information Center (DTIC) at http://www.dtic.mil. The Office of Public Affairs has reviewed this report, and it is releasable to the general public, including foreign nationals. AFRL-HE-AZ-TR-2006-0050 HAS BEEN REVIEWED AND IS APPROVED FOR PUBLICATION IN ACCORDANCE WITH ASSIGNED DISTRIBUTION STATEMENT. // Signed // // Signed // WILLIAM R. BICKLEY H. BARBARA SORENSEN Project Scientist Senior Scientist // Signed // MICHAEL E. MORRIS, Lt Colonel, USAF Director of Operations Warfighter Readiness Research Division Air Force Research Laboratory

REPORT DOCUMENTATION PAGE Form Approved
OMB No. 0704-0188 Public reporting burden for this collection of information is estimated to average 1 hour per response, including the time for reviewing instructions, searching existing data sources, gathering and maintaining the data needed, and completing and reviewing this collection of information. Send comments regarding this burden estimate or any other aspect of this collection of information, including suggestions for reducing this burden to Department of Defense, Washington Headquarters Services, Directorate for Information Operations and Reports (0704-0188), 1215 Jefferson Davis Highway, Suite 1204, Arlington, VA 22202-4302. Respondents should be aware that notwithstanding any other provision of law, no person shall be subject to any penalty for failing to comply with a collection of information if it does not display a currently valid OMB control number. PLEASE DO NOT RETURN YOUR FORM TO THE ABOVE ADDRESS. 1. REPORT DATE (DD-MM-YYYY) 29-11-2006
2. REPORT TYPE Final
3. DATES COVERED (From - To) January 2004 to June 2006 5a. CONTRACT NUMBER F41624-97-D-5000 T.O. #37 5b. GRANT NUMBER
4. TITLE AND SUBTITLE Physics-based Stimulation for Night Vision Goggle Simulation
5c. PROGRAM ELEMENT NUMBER 63231F 5d. PROJECT NUMBER 4924 5e. TASK NUMBER AT
6. AUTHOR(S) Jeff Clark
5f. WORK UNIT NUMBER 01
7. PERFORMING ORGANIZATION NAME(S) AND ADDRESS(ES) 8. PERFORMING ORGANIZATION REPORT NUMBER
Renaissance Sciences Corporation 1361 North Alma School Road Chandler AZ 85224
9. SPONSORING / MONITORING AGENCY NAME(S) AND ADDRESS(ES) 10. SPONSOR/MONITOR’S ACRONYM(S) AFRL; AFRL/HEA
11. SPONSOR/MONITOR’S REPORT NUMBER(S)
Air Force Research Laboratory Human Effectiveness Directorate Warfighter Training Research Division 6030 South Kent Street Mesa AZ 85212-6061
AFRL-HE-AZ-TR-2006-0050 12. DISTRIBUTION / AVAILABILITY STATEMENT Approved for public release; distribution is unlimited.
13. SUPPLEMENTARY NOTES
14. ABSTRACT
Attempts at devising training simulator out-the-window “night time” displays that can be effectively used by a night vision goggle (NVG)-wearing trainee have yielded NVG display systems of questionable fidelity, stability, and/or repeatability. The “physics-based” approach reported here first characterizes a display in terms of its absolute dynamic output range for night vision imaging system (NVIS) radiance and then, using that characterization, maps, as possible, to-be-displayed NVIS radiance values of simulated scene objects on to the display itself. Treatment of NVG-specific phenomena, such as “halos,” is discussed, as are considerations of NVIS cross-illumination in multi-screen displays. Modifications to an existing NVG simulation software module (SensorHost) to accommodate display of NVIS radiance are described. Example NVIS characterizations of various off-the-shelf simulator display systems are detailed.
15. SUBJECT TERMS Cross illumination; Display systems; Multiscreen displays; Night operations; Night operations training; Night vision goggles; Night vision imaging system; NVG; NVIS; Physics based stimulation; 16. SECURITY CLASSIFICATION OF: 17. LIMITATION
OF ABSTRACT 18. NUMBER OF PAGES
19a. NAME OF RESPONSIBLE PERSON Dr William R. Bickley
a. REPORT UNCLASSIFIED
b. ABSTRACT UNCLASSIFIED
c. THIS PAGE UNCLASSIFIED
UNLIMITED
64
19b. TELEPHONE NUMBER (include area code)
Standard Form 298 (Rev. 8-98) Prescribed by ANSI Std. Z39.18

This page intentionally left blank

iii
Table of Contents
1. INTRODUCTION ...............................................................................................................................................1 1.1. SENSOR-IN-THE-LOOP NIGHT VISION GOGGLE AIRCREW TRAINING ...........................................................1 1.2. APPROACH ..................................................................................................................................................2 1.3. RESEARCH TASKS AND MILESTONES...........................................................................................................2
2. BACKGROUND..................................................................................................................................................4 2.1. NVG SPECTRAL RESPONSE .........................................................................................................................4 2.2. REAL-WORLD DATA ...................................................................................................................................5
3. OPTIMIZATION OF THE DISPLAY ..............................................................................................................7 3.1. OVERVIEW ..................................................................................................................................................7
3.1.1. Brightness Adjustment...........................................................................................................................8 3.1.2. Contrast Adjustment ..............................................................................................................................9 3.1.3. Spectral Response..................................................................................................................................9
3.2. DISPLAY SETUP AND ADJUSTMENT PROCESS ............................................................................................10 3.2.1. Video Format .......................................................................................................................................10 3.2.2. Black Level Setting..............................................................................................................................11 3.2.3. Contrast Setting ...................................................................................................................................11
3.3. OTW PHOTOPIC FILTRATION ....................................................................................................................12 3.4. MULTI-DISPLAY CONSIDERATIONS ...........................................................................................................18
3.4.1. Overview .............................................................................................................................................18 3.4.2. Black Level..........................................................................................................................................19 3.4.3. Bright Image Cross Illumination .........................................................................................................19 3.4.4. Cross Illumination and Scene Contrast................................................................................................20
4. DETERMINISM OF NVG IMAGERY...........................................................................................................21 4.1. OVERVIEW ................................................................................................................................................21 4.2. DISPLAY CHARACTERIZATION PROCEDURE ..............................................................................................21 4.3. GENERALIZED RADIANCE RENDERING ALGORITHM .................................................................................22
4.3.1. Impact of Display Gamma...................................................................................................................22 4.3.2. Color Mapping Algorithm ...................................................................................................................23 4.3.3. Generalized Bucket Rendering Equations ...........................................................................................24
5. ARTIFICIAL AUGMENTATION OF BRIGHT SOURCES .......................................................................26 5.1. OVERVIEW ................................................................................................................................................26
5.1.1. Introduction..........................................................................................................................................26 5.1.2. Algorithm.............................................................................................................................................26
5.2. EXAMPLE ..................................................................................................................................................28 6. ADAPTATION OF SENSORHOST SOFTWARE LIBRARY.....................................................................30
6.1. OVERVIEW ................................................................................................................................................30 6.2. SENSORHOST MODIFICATION....................................................................................................................30
6.2.1. External Extensions .............................................................................................................................30 6.2.2. Internal Extensions ..............................................................................................................................32
7. CONCLUSIONS................................................................................................................................................33
iv
7.1. OPTIMIZATION OF THE DISPLAY ................................................................................................................33 7.1.1. Adjustment Process .............................................................................................................................33 7.1.2. Passive Display Modifications.............................................................................................................33
7.2. DETERMINISM OF NVG IMAGERY .............................................................................................................33 7.2.1. Display Characterization Procedure.....................................................................................................34 7.2.2. Recommended Rendering Technique ..................................................................................................34
7.3. AUGMENTATION OF BRIGHT SOURCE EFFECTS .........................................................................................36 7.4. ADAPTATION OF SENSORHOST SOFTWARE ...............................................................................................36
8. DETAILED RESULTS AND ADDITIONAL DATA.....................................................................................37 8.1. DISPLAY NVG SPECTRAL RESPONSE ........................................................................................................37
8.1.1. Barco RetroGraphics 801S Spectral Response ....................................................................................37 8.1.2. Barco 908 Spectral Response...............................................................................................................38
8.2. DISPLAY LUMINANCE AND RADIANCE TRANSFER FUNCTIONS..................................................................39 8.3. COLLECTED DISPLAY CHARACTERIZATION DATA ....................................................................................40
8.3.1. Barco RetroGraphics 801S ..................................................................................................................40 8.3.2. Mock M2DART Display with Barco 908 Projector ............................................................................42 8.3.3. M2DART Display with Barco 808 Projector.......................................................................................44 8.3.4. SEOS Panoramic Display with Barco 909 Projector ...........................................................................46
8.4. MULTI-DISPLAY CROSS-ILLUMINATION STUDY DATA (M2DART)..........................................................48 8.4.1. Black Level..........................................................................................................................................48 8.4.2. Bright Image Cross Illumination .........................................................................................................48 8.4.3. Cross Illumination Impact on Contrast ................................................................................................49
8.5. IMPLEMENTATION EXAMPLE OF RENDERING EQUATIONS .........................................................................51 8.5.1. Blue-Green-Red color mapping:..........................................................................................................51 8.5.2. Red-Green-Blue color mapping:..........................................................................................................51 8.5.3. Normalization Equations .....................................................................................................................52
8.6. DISPLAY CHARACTERIZATION DATA FORM ..............................................................................................54

v
List of Figures Figure 1 NVG and Night Sky Radiation......................................................................................................... 4 Figure 2 Display Transfer Function................................................................................................................ 7 Figure 3 Normalized Display Transfer Function with Variable Gamma........................................................ 8 Figure 4 Normalized Display Transfer Function with Variable Brightness ................................................... 9 Figure 5 Normalized Display Transfer Function with Variable Contrast....................................................... 9 Figure 6 Barco RetroGraphics 801s CRTs Normalized Spectral Response ................................................. 10 Figure 7 Example Normalized Display Transfer Function with Saturating Gamma Curve ........................ 12 Figure 8 B-G-R Color Mapping (Example from Barco 801) ....................................................................... 12 Figure 9 Unfiltered Photopic Out-the-Window ( from 7E-11 to 1E-6 W/cm2/sr) ........................................ 13 Figure 10 Photopic Filters Spectrum ............................................................................................................ 14 Figure 11 Filtered Photopic Out-the-Window with Red filter on BLUE CRT............................................. 14 Figure 12 Filtered Photopic Out-the-Window with Red filter on BLUE and GREEN CRTs ...................... 14 Figure 13 Unfiltered Stimulate Image (54% Moon)..................................................................................... 15 Figure 14 Filter on Blue Stimulate Image (54% Moon) ............................................................................... 15 Figure 15 Filter on Blue and Green Stimulate Image (54% Moon).............................................................. 16 Figure 16Unfiltered Stimulate Image (99% Moon)...................................................................................... 16 Figure 17 Filter on Blue Stimulate Image (99% Moon) ............................................................................... 17 Figure 18 Filter on Blue and Green Stimulate Image (99% Moon).............................................................. 17 Figure 19 M2DART Screens Identification ................................................................................................. 18 Figure 20 M2DART Exploded View (Courtesy of AFRL) .......................................................................... 19 Figure 21 Barco 801 Blue Gun With Non-Linear Saturation ....................................................................... 23 Figure 22-Blue-Green-Red Radiance Mapping Example............................................................................. 24 Figure 23 ExampleHalo Rendering on Retrographics .................................................................................. 29 Figure 24 Barco RetroGraphics 801s Red CRT Spectral Response ............................................................. 37 Figure 25 Barco RetroGraphics 801s Green CRT Spectral Response.......................................................... 37 Figure 26 Barco RetroGraphics 801s Blue CRT Spectral Response ............................................................ 38 Figure 27 Barco RetroGraphics 801s CRTs Normalized Spectral Response ............................................... 38 Figure 28 Barco 908 CRTs Normalized Spectral Response......................................................................... 39 Figure 29 Barco RetroGraphics 801s Luminance Transfer Function Curves............................................... 41 Figure 30 Barco RetroGraphics 801s Radiance Transfer Function Curves.................................................. 42 Figure 31 Barco 908 - Mockup M2DART Luminance Transfer Function Curves....................................... 43 Figure 32 Barco 908 - Mockup M2DART Radiance Transfer Function Curves.......................................... 43 Figure 33 Barco 808 - M2DART Luminance Transfer Function Curves..................................................... 45 Figure 34 Barco 808 - M2DART Radiance Transfer Function Curves........................................................ 45 Figure 35 Barco 909 - SEOS Panorama Luminance Transfer Function Curves........................................... 47 Figure 36 Barco 909 - SEOS Panorama Radiance Transfer Function Curves.............................................. 47 Figure 37 Albedo patches (gray scale) ......................................................................................................... 50

vi
List of Tables Table 1 Real-World Natural Illumination Data……………………………………………….. 5 Table 2 Natural Night Time Radiance and Luminance Ratio………………………………… 6 Table 3 Cross Illumination Screen Pairs ………………………………………………………. 19 Table 4 Barco RetroGraphics 801s Transfer Function Characteristics ………………………… 41 Table 5 Barco 801 Blue CRT Evaluation ……………………………………………………… 42 Table 6 Barco 908 – Mockup M2DART Transfer Function Characteristics ………………….. 43 Table 7 Baraco 908 Blue CRT Evaluation …………………………………………………….. 44 Table 8 Barco 808 M2DART Transfer Function Characteristics ………………………………. 44 Table 9 Barco 808 M2DART Blue CRT Evaluation ……………………………………………. 45 Table 10 Barco 909 SEOS Panorama Transfer Function Characteristics ………………………… 46 Table 11 Barco 909 SEOS Panorama Blue CRT Evaluation …………………………………….. 47 Table 12 Screen Black Level ……………………………………………………………………… 48 Table 13 Cross Illumination Impact on Black Level ……………………………………………… 49 Table 14 Cross Illumination Impact on Contrast …………………………………………………. 50
1
1. Introduction
1.1. Sensor-in-the-loop Night Vision Goggle Aircrew Training A variety of approaches have been taken to produce night vision goggle (NVG) training capabilities for aircrews including sensor-in-the-loop solutions utilizing real NVGs (stimulated), in addition to solutions employing completely synthetic NVG imagery and specialized displays (simulated).
Past work at the Air Force Research Laboratory, Human Effectiveness Directorate, Warfighter Readiness Research Division (AFRL/HEA) has focused on the physics-based approach of producing simulated representations of NVG imagery. As it is likely the case that both simulated and stimulated NVG applications will be widely used for the foreseeable future, this effort sought to reuse much of the physics-based approach and display integration utility of the SensorHost simulation library, and to apply those elements to the NVG stimulate application.
While there are examples of successful stimulated NVG systems, quality results tend to require significant resources given to subjective tuning and tweaking of display systems, often resulting in repetitive guesswork, distracting unaided artifacts, questionable NVG realism, and/or unrepeatable results. It was expected that by “repackaging” the deterministic elements of the physics-based simulate approach, a foundation for an optimized and repeatable process can be defined for the stimulate application. It was also expected that the accuracy of the NVG experience can be enhanced/optimized in most configurations. While the capabilities of any particular system will ultimately be limited by the display itself, it would often be valuable to know where the system falls short of reality in a way that can be quantitatively understood. Finally, NVG stimulation techniques should also benefit from the application of the team’s physics savvy to better understand and even modify the NVG performance of traditional display systems available from industry.
While there are numerous physical challenges to producing a quality sensor-in-the-loop NVG training system (including creating light-tight environments, NVG-compatible cockpits, focal distance impacts, and so forth), those challenges are generally well known and documented. This research focused solely on the ability to produce quantitatively accurate stimulated NVG imagery in a more repeatable way. The following are other challenges we faced:
1. The most significant challenge with the stimulate approach is to capture the full dynamic range of the scenes, both inter-scene and intra-scene range. The inter-scene natural illumination scenarios from Overcast Starlight to Full Moon illumination span three orders of magnitude, while the intra-scene range of natural illumination to emissive light sources can span 10 orders of magnitude. While traditional displays will not achieve this real-world performance, it is critical to maximize the performance of the display with regard to both NVG-sensitive dynamic range and NVG-sensitive intensity precision, all while minimizing negative unaided artifacts on the out-the-window (OTW) display.
2. When using traditional OTW displays, the realism of the night scene as seen by the unaided eye (under-the-goggle) is always sacrificed to accommodate viewing with the NVGs. It will be necessary to minimize this tradeoff to achieve meaningful improvement in the ultimate quality of many of these systems.

2
1.2. Approach The scope of challenges involved in the stimulation of NVGs within aircrew training systems is broad. The focus of this exercise was solely on the image generation process and, in particular, the effectiveness of generating quantitative, physics-based scenes rather than subjective estimations.
By far, the most significant variable in a stimulate system, at a system level, is the display system. In particular, it is the near-infrared (NIR) performance of a given display that will most significantly impact the quality and accuracy of the stimulated result. As such, the effort documented here focused on quantifying the performance that could be expected when using common/traditional displays, and also sought to predict the display performance required to achieve certain accuracy thresholds. These predictions will help to research and recommend future display technologies that will positively impact the quality of future NVG stimulation systems.
Different display systems were evaluated (characterized) as to their ability to stimulate the NVG. Data were collected and analyzed, utilizing computer models of the simulation system. As much as possible, the overall system performance and imagery quality were analyzed objectively using quantitative comparison. Relevant integration issues such as ambient light level, adjustment procedure, and different display system configurations and modifications were analyzed, and recommendations made to highlight potential concerns and modifications critical to integration efforts.
The NVG Stimulate testbed reused and expanded the existing physics-based SensorHost library of functions, to allow it to be used in a Stimulate approach. SensorHost algorithm modifications were simulated and tested in the virtual, as well as the real, training laboratory.
1.3. Research Tasks and Milestones The planned tasks for this research addressed four major thrusts:
Optimization of the Display: There are three fundamental parameters to a display’s performance that most impact the quality and accuracy of the stimulated NVG imagery: minimum output value (in night vision imaging system [NVIS] radiance units), maximum output value (in NVIS radiance units), and the number of usable intensities between the minimum and maximum. Specific research tasks in this area included:
• Investigate an adjustment procedure that systematically optimizes the minimum display level, maximum display level, and the number of usable intensities.
• Investigate passive display system modifications that address the suitability of a given display to the sensor-in-the-loop application.
Quantitative Determinism of NVG Imagery: At the core of the physics-based approach to simulation (or stimulation) is the requirement that simulated radiance values (i.e. the simulated light reflected off of a vehicle with white metallic paint in a particular illumination condition) are translated to known physical values of light when ultimately presented to the human eye. In the case of NVG stimulation, this critical conversion takes place at the OTW displays. Before any sensor-in-the-loop experiments can be successful, we must show that we can model the NVG-sensitive output of a display as a function of its input from the IG (rendered pixels). Specific research tasks in this area include:
• Investigate a display characterization procedure that provides SensorHost with the data necessary to model the behavior of the display as viewed by the NVG.
• Identify the recommended rendering technique to be utilized by the IG in a SensorHost stimulate application. As in the simulate mode, the IG will encode simulated radiance values into some combination of RGB pixel values as described by the rendering technique.

3
Artificial Augmentation of Bright Sources: It is known that traditional OTW displays cannot achieve a dynamic range that captures all elements of the battlefield and/or cultural environment. Prior work in the simulation of NVG representations of bright sources was investigated for applicability to the sensor-in-the-loop problem. More specifically, artificial injection of halo effects can provide cues to the viewer that may increase the realism of the NVG scene beyond the capability of the display system. Specific research tasks in this area include:
• Investigate artificial injection of halo effects.
• Subjectively assess the viability of this approach by presenting notional halos in a stimulated scene.
Adaptation of SensorHost Software Library: Based upon the results achieved in the investigations described above, certain elements of the SensorHost software library were generalized and/or adapted to facilitate repeatability of the results achieved in the investigation. Specific research tasks in this area included:
• Extend the application programming interface (API), if required, to allow image generator (IG) and SensorHost to communicate the parameters to the rendering technique for stimulate mode.
• Extend the API, if required, to facilitate artificial halo injection.
• Extend the SensorHost configuration mechanisms to address configuration complexities unique to the sensor-in-the-loop application.

4
2. Background
2.1. NVG Spectral Response Aviator NVGs are primarily designed to amplify the night sky radiance energy as reflected by the terrain and various surfaces. As a result, an NVG device is sensitive to the electromagnetic wavelength spectrum between 600 nm to 900 nm (from red to near infrared) that is available in the natural night sky irradiance (from moon, stars, etc) as shown in Figure 1. With the addition of minus blue filters, there is little-to-no overlap in the ranges of sensitivity of the human eye and NVGs.
The majority of flight simulator systems use cathode ray tube (CRT)-based projection systems in various configurations. A typical Red-Green-Blue (RGB) CRT display is spectrally designed to stimulate the human eye as shown in Figure 1. One fundamental question of the research was whether there is enough in-band (within the NVG spectral response) radiance from the CRT to be representative of the natural nighttime terrain and surface radiance (electromagnetic energy reflected from the night sky).
Figure 1 NVG and Night Sky Radiation
An important metric to understand in the NVG Stimulation approach is the NVIS Radiance. NVIS radiance is a measure of the electro-magnetic radiance that the NVG will respond to according to its response curve. Radiance is a measure of flux density per solid viewing angle (steradian). A sphere contains 4π steradians. Flux is a measure of energy flow rate in Watts. NVIS radiance is calculated by convolving and integrating the incoming spectral radiance with the NVG spectral response (see Equation 1).
The example given is for Class B NVG since this goggle is being used in the study. The Class B NVG device is a Generation III NVG with a minus blue filter added so that it is compatible with NVIS RED cockpit lighting.
(1)
( ) ( )930
450
nm
B BnmNR N G dλ λ λ= ⋅∫
Equation 1 Class B NVIS Radiance Calculation

5
Where:
NRB Class B NVIS radiance (W/cm2-sr)
N(λ) Incoming spectral radiance (W/cm2-sr-nm)
GB(λ) Class B NVG response curve (0-100%)
λ Wavelength (nm). For a typical measurement, dλ=4nm
Notice that the integration range starts from 450 nm. Although for all practical purposes the effective wavelength range of a Class B NVG begins at 600 nm, there are some minor outlaying responses, albeit minimum, that may be included in the total NVIS radiance. A spectro-radiometer such as Photo-Research PR-715 can be used to measure N(λ) with 4 nm bin size. This instrument is sensitive over the 380 nm to 1068 nm wavelength range.
The primary input variable to a SensorHost physics-based NVG simulation model is the incoming NVIS radiance. Tto model a response of an NVG viewing a CRT display, the NVIS radiance (e.g., NRB) characteristics of a CRT display must be determined. Using an NVIS radiometer, the NRB value of a display can be measured directly. An example of this instrument is the Photo-Research PR-1530 with a dynamic range of 10-11 to 10-3 (W/cm2-sr) and spectral sensitivity between 450 nm to 930 nm.
Luminance is a scalar measure of the electromagnetic energy in the photopic (visible) spectrum. Radiance applies to a general electromagnetic spectrum, and specifically in this report, radiance refers to the NVIS spectrum.
2.2. Real-World Data To assist in scoping the domain of sensor input, we reference these real-world natural illumination and NRb data (Table 1).
Table 1 Real-World Natural Illumination Data (http://www.engineeringtoolbox.com/31_708.html)
Conditions Illumination (ft-candles) (lux)
Sunlight 10,000 107,527Full Daylight 1,000 10,752.7Overcast Day 100 1,075.3 Very Dark Day 10 107.53
Twilight 1 10.75 Deep Twilight .1 1.08
Full Moon .01 .108 Quarter Moon .001 .0108
Starlight .0001 .0011 Overcast Night .00001 .0001
Table 2 lists the nighttime natural luminance from a lambertian surface 100% reflector and an NVG in-band radiance based on AFRL’s field measurements. The calculated ratio of fL/NRb provides benchmark numbers. We suggest that if a display can reproduce similar ratio numbers, then the simulator OTW and NVG experience would approach the “real-world” performance.

6
Table 2 - Natural Night Time Radiance and Luminance Ratio
Illuminance Luminance NRb Radiance Ratio 100% Reflector (Source: AFRL SH2.0)
Condition ft-candles ft-Lambert W/cm2/sr fL/NRb OCSL 1.00E-05 1.00E-05 7.50E-11 1.33E+05 CSL 1.00E-04 1.00E-04 4.00E-10 2.50E+05
QM (50%) 1.00E-03 1.00E-03 2.10E-09 4.76E+05 FM 1.00E-02 1.00E-02 1.50E-08 6.67E+05

7
3. Optimization of the Display
3.1. Overview To begin the analysis and optimization of the NVIS radiance performance of the display, we considered the theoretical luminance performance of a display in the general case. A display can be modeled simplistically as a black box with an input and output. The input to this black box is an 8-bit pixel value and the output is the luminance produced. The behavior of the output is a variable of the input and adjustable by the display settings (Figure 2). A display Transfer Function maps an input pixel value to the luminance output of a display for a given display setting.
Transfer Functionp=Pixel Value (0-255) L(p) = Luminance (Radiance)
Settings (Brightness,Contrast, etc)
Figure 2 Display Transfer Function
A typical CRT projection system consists of three CRTs/guns, representing the primary colors Red, Green and Blue. The resulting luminance (radiance) for all guns will be the total luminance (radiance) from each gun due to the additive nature of the Electromagnetic energy.
Because the human perceptual response to light intensity is nonlinear, the CRT is designed to be inherently nonlinear. The intensity of light reproduced at the screen of a CRT is a nonlinear (power) function of its voltage input. The nonlinearity of a CRT is meant to provide output that takes into account the nonlinearity of human vision response. In simulate, this nonlinearity in display response presented a challenge due to the fact that all real-time NVG simulate solutions relied on uniform full-field video gains in order to simulate the gain circuitry of the NVG. In this case, nonlinearity in the display made it impossible to gain the entire scene equally as happens in the NVG.
The combination of transfer functions of the video card, projector drive circuit, CRT, the projection geometry, projection screen material, and so forth, all influence the display Transfer Function (See Equation 2). It is hypothesized that the behavior of the NVIS radiance display Transfer Function will follow a similar gamma curve of the luminance display Transfer Function. The luminance and radiance gamma value may/will be different. If the gamma value is the same, then the relationship of luminance and NVIS radiance is linear/proportional. If the gamma value is different, then the relationship is nonlinear. This transfer function is unique for each CRT color. Hence, the determination of the display transfer function must be performed independently for each color gun.
The following display transfer function describes a general luminance behavior of a CRT display. This function is normalized for clarity. The minimum (darkest) luminance is 0 and the maximum (brightest) luminance is assumed to be 1.
(2)
L C p Bγ= × +
Equation 2 Normalized Display Transfer Function

8
Where:
L = Normalized luminance 0-1.0 (0-100 IRE) C = A function of contrast adjustment and display characteristic P = Normalized pixel value 0-1.0 γ = Gamma factor B = A function of brightness (Black Level) adjustment and display characteristic
In
Figure 3, a value of γ = 1.0 produces a linear transfer function. When γ is higher than 1.0, then the curve is “pushed” downward at the lower pixel values. As a result, there are more pixel values available to represent the darker scene (lower luminance level), resulting in more details and variations in the darker scene. On the other hand, if γ is too high, the brighter scene will be washed out, reducing the scene contrast. The overall display gamma function may be adjusted by changing the graphic card driver’s gamma value.
Figure 3 Normalized Display Transfer Function with Variable Gamma
3.1.1. Brightness Adjustment Brightness, or more accurately black-level, adjustment raises/lowers the gamma curve as shown in Figure 4. The black level should be adjusted so the darkest scene to be viewed will be properly dark with sufficient visible details. Adjusting the black level for NVG stimulate is discussed in Section 3.2.2. Notice that a high black level reduces the total usable pixel range, while too low of a black level will clip the lower pixel values also reducing the available pixel values. B is a function of the Brightness adjustment. The “normalized” brightness number B relates somewhat to the 0-100% brightness dial adjustment on the display. However, a B=0 does not necessarily equate to the 0% brightness dial.
9
Figure 4 Normalized Display Transfer Function with Variable Brightness
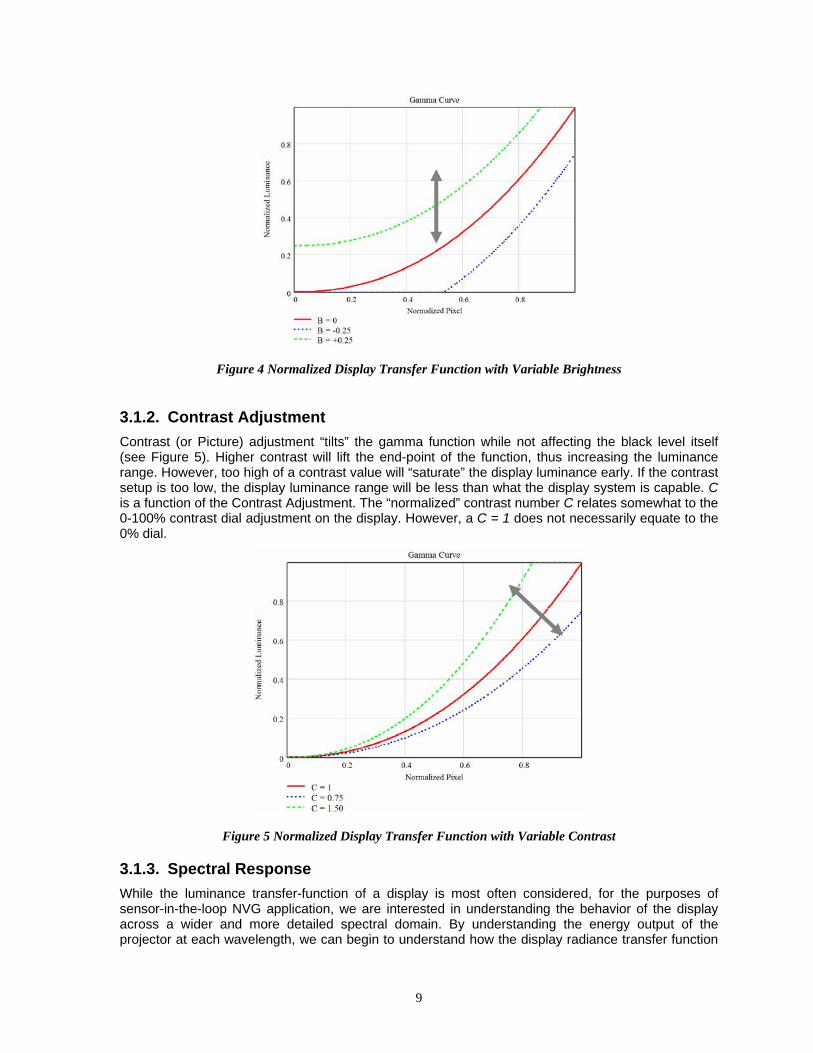
3.1.2. Contrast Adjustment Contrast (or Picture) adjustment “tilts” the gamma function while not affecting the black level itself (see Figure 5). Higher contrast will lift the end-point of the function, thus increasing the luminance range. However, too high of a contrast value will “saturate” the display luminance early. If the contrast setup is too low, the display luminance range will be less than what the display system is capable. C is a function of the Contrast Adjustment. The “normalized” contrast number C relates somewhat to the 0-100% contrast dial adjustment on the display. However, a C = 1 does not necessarily equate to the 0% dial.
Figure 5 Normalized Display Transfer Function with Variable Contrast
3.1.3. Spectral Response While the luminance transfer-function of a display is most often considered, for the purposes of sensor-in-the-loop NVG application, we are interested in understanding the behavior of the display across a wider and more detailed spectral domain. By understanding the energy output of the projector at each wavelength, we can begin to understand how the display radiance transfer function

10
relates to its luminance transfer function. Also, by analyzing the distribution of energy across NVG-sensitive wavelengths versus that in the visible wavelengths, we can get a preliminary and quantitative assessment of how suited the display will be to NVG-only viewing and/or combined NVG and unaided viewing. Understanding a display’s spectral output will also be critical if any filtering techniques are to be employed (see discussion in later sections).
Section 8 contains data and discussion for the spectral analyses performed during the research effort. As an example, the following graphs (Figure 6) summarize the spectral output of the RetroGraphics display we used. The curves are normalized (%) spectral plots of fully activated Red, Green, and Blue CRTs superimposed with the NVG response curve (black line). The logarithmic plot clearly shows the presence of NVIS radiance under the NVG curve. It is also apparent that Green has the highest luminance and Blue the lowest. It is recognized that the NVG response curve used in the report for illustration does not include the leaky green filter modification consistent with the actual NVGs used in the study. This difference to total NRb contribution of the leaky green notch is minor compared to the variation in NVIS radiance of real-world scenes and was ignored for the purposes of computational analysis.
Normalized Spectral Respose
0%
10%
20%
30%
40%
50%
60%
70%
80%
90%
100%
380
412
444
476
508
540
572
604
636
668
700
732
764
796
828
860
892
924
956
988
1020
1052 nm
Nor
mal
ized
Inte
nsity
(%)
Red GunGreen GunBlue GunNVG
Normalized Spectral Respose (log scale)
1.E-12
1.E-11
1.E-10
1.E-09
1.E-08
1.E-07
1.E-06
1.E-05
1.E-04
1.E-03
1.E-02
1.E-01
1.E+00
380
416
452
488
524
560
596
632
668
704
740
776
812
848
884
920
956
992
1028
1064
nm
Nor
mal
ized
Inte
nsity
(%)
Red GunGreen GunBlue GunNVG
Figure 6 Barco RetroGraphics 801s CRTs Normalized Spectral Response
3.2. Display Setup and Adjustment Process The following describes the approach taken and lessons-learned in the optimization of the display systems used in this effort. In every case, these critical metrics ultimately determine the fidelity of the NVG representation:
• Minimum display level (measured in NRb)
• Maximum display level (measured in NRb)
• Number of usable intensities
3.2.1. Video Format We found that the optimum settings for a given display system were dependent of the video format in operation. While this is true for photopic viewing, we found it to be particularly critical in this case given the desire to aggressively optimize for black level and dynamic range. Therefore, it is always required to set the graphics hardware refresh rate (e.g., 60 Hz) and the resolution (e.g., 1024 x 1280, 1200 x 1600, etc.) as it is intended to be used operationally. Display resolution impacts the maximum luminance value per pixel, which is related to the ability of a CRT circuit driver to ramp up to the peak voltage in a refresh cycle. It is also critical to perform any other adjustments inherent to the display.

11
For example, one must insure that the focus and convergence of each CRT gun is optimal as these settings effect measured energy values in addition to the quality of the imagery.
3.2.2. Black Level Setting The black level of a CRT display is set primarily by the brightness setting. A black level (R-G-B = 0-0-0) represents the darkest scene that the display will produce. The desired darkest setting will depend on the training requirement and the capability of the display. Generally, it would be expected that the system, as a whole, would be expected be able to support Clear Starlight (CSL) or Overcast Starlight (OCSL) black levels. In general, a CRT display system can produce darker black level than displays based on digital light processing (DLP) or liquid crystal technologies. It should be noted that some display models may not be dark enough to represent OCSL conditions.
For NVG Stimulation, we assumed the black level should be set to an NVIS radiance value from a 10% reflective surface under either a CSL or OCSL. Using an NVIS radiometer, the black level would be set to either 4.00E-11 for CSL or 7.00E-12 (W/cm2-sr) for OCSL. In order to assure that the black level is not set too low, the brightness should be decreased gradually until the radiometer reading reaches the desired level. If the radiance cannot reach the desired black level, then the adjustment should stop immediately before the radiance value has bottomed out. This indicates that the display is not capable of representing lower than a 10% albedo under the desired minimum lighting condition.
As a word of caution, the black level measured at R-G-B=0-0-0 is the additive radiance of all the guns. To characterize more accurately, each gun should be measured independently by covering the other guns with a light-tight material. It is likely that one gun/color may bottom out earlier than the other guns. In this case, it would be desirable to set the brightness of that color independently (available in some displays) in addition to the overall brightness control. If this were not practical, then one would optimize the first gun that will cover most of the natural illumination radiance level. If Blue-Green-Red color mapping order is chosen, the number of maximum pixel values available for the Blue gun must be preserved. Therefore, the Blue gun should not bottom out later than a pixel value of 0. The only way to determine this is by plotting the measured luminance/radiance against the rendered pixel values and to visually assess the plot graph.
3.2.3. Contrast Setting The maximum dynamic range of a CRT display is set by the contrast setting. A white level (R-G-B = 255-255-255) represents the brightest color that the display can produce. The maximum NVIS radiance for the display is adjusted by the overall contrast setting. To assure that the contrast is not set too high, the contrast should be increased gradually until the radiometer reading reaches a saturation level. This may be assessed by analyzing a plot of the luminance/radiance against the rendered pixel values.
Similar to the black level, the contrast setting is also best adjusted independently per color. A reason for this is that one of the guns may saturate earlier. A gun saturates when the second derivative of the transfer function is negative; i.e., the transfer function’s luminance/radiance rate of increase is diminishing (see gray arrow on Figure 7). The effective pixel range is also reduced (in this example, from 1.0 to 0.8). The dashed line indicates a theoretical non-saturating gamma curve. This is only a virtual line, because the real display luminance will not go beyond 1.0 (normalized).

12
Figure 7 Example Normalized Display Transfer Function with Saturating Gamma Curve
3.3. OTW Photopic Filtration As the display is manipulated to produce the correct NVIS radiance, the resulting photopic OTW view becomes “unnatural” in color and in luminance. The luminance to NRb ratios as listed in Section 2.2 suggests that the luminance level is 10 to 1000 times brighter than expected from an OTW nighttime scene. This is the situation illustrated in Figure 8 and Figure 9.
Figure 8 B-G-R Color Mapping (Example from Barco 801)

13
Figure 8 is a Blue-Green-Red color mapping method for a Barco RetroGraphics display with a Barco 801 projector. (The topic of “color mapping” is discussed in Section 4.3.2). The Blue CRT is able to represent reflective radiance up to QM illumination conditions. The Green CRT will be added under the FM condition up to 2E-7 W/cm2/sr. The remaining energy available in the Green and Red CRTs will cover higher radiance sources such as the moon, some stars, light points, and other bright illumination sources.
OCSL CSL QM FM
Figure 9 Unfiltered Photopic Out-the-Window ( from 7E-11 to 1E-6 W/cm2/sr)
Figure 9 is a theoretical prediction of the photopic OTW view based on the B-G-R color mapping method. Notice how “bright” the nighttime scene would look with the unaided eyes. A logical approach to solving this problem is by cutting down the amount of photopic luminance while preserving much of the NVIS radiance energy. Since the target NVG is mainly effective in electromagnetic wavelengths higher than 600 nm, blocking the wavelength below will preserve NVIS radiance while reducing the photopic impact of the projectors.
There are plenty of commercial off-the-shelf (COTS) choices for such filters. Additionally, custom filters from glass dichroic material can be tailored with specific color response curves. An economical source for projector filters can be found among theatrical lighting suppliers.
There are two types of filter materials: gel and glass dichroic. Gel is made from co-extruded polycarbonate plastic or deep dyed polyester and mounted on a custom frame in front of the projector. Gel is a flexible film with “softening” temperatures between 125 ˚C to 160 ˚C. Although the material is strong and will not be affected by typical operating temperatures, it is less permanent than a glass dichroic filter. Dichroic filters are durable glass color filters that transmit only certain wavelengths of light, reflecting the rest of the spectrum, rather than absorbing it. Since virtually no energy is absorbed by the filter, light transmission is significantly higher than gels and less likely to fade or be damaged from handling.
Figure 10 shows the response curves of two different filters, a Rosco Primary Red #6500 Dichroic Filter and Rosco Medium Red #27 Gel Filter. The filter response curve data are courtesy of Rosco International. Notice that the transmission data from the factory cuts off at 750nm.

14
Figure 10 Photopic Filters Spectrum
Figure 11 is a theoretical prediction of the filtered photopic OTW view. A Rosco #27 Red filter is applied in front of the Blue CRT projector only. Notice how much dimmer the QM scene is compared to the unfiltered view. There are, however, energies in the wavelengths of red coming through from the Blue CRT (see Figure 10). Also notice that with an FM scene that green has quite a large photopic impact. While filtering blue the highest color (255-255-255) will appear to the unaided eye as pale yellow.
OCSL CSL QM FM
Figure 11 Filtered Photopic Out-the-Window with Red filter on BLUE CRT
Figure 12 is a theoretical prediction of the filtered photopic OTW view. Rosco #27 Red filters are placed in front of the Blue and Green guns. Notice how much dimmer the FM scene is compared to the unfiltered view or the filtered Blue only view.
OCSL CSL QM FM
Figure 12 Filtered Photopic Out-the-Window with Red filter on BLUE and GREEN CRTs

15
Figures 13-18 shows filtered and unfiltered Stimulate images.
Figure 13 Unfiltered Stimulate Image (54% Moon)
Figure 14 Filter on Blue Stimulate Image (54% Moon)

16
Figure 15 Filter on Blue and Green Stimulate Image (54% Moon)
Figure 16 Unfiltered Stimulate Image (99% Moon)

17
Figure 17 Filter on Blue Stimulate Image (99% Moon)
Figure 18 Filter on Blue and Green Stimulate Image (99% Moon)

18
3.4. Multi-Display Considerations
3.4.1. Overview Most NVG Stimulation applications involve simultaneous multiple displays. Several concerns were raised regarding the impact of cross-illumination to the black level and scene contrast. An investigation was conducted to uncover the impact, if any, of using rear projection multi-faceted/multi-channel display system configuration such as found in the L-3 Mobile Modular Display for Advanced Research and Training (M2DART). Specifically, we addressed the following:
1. Total multi-display NRB black level
2. Bright image cross-illumination between screens
3. Amount of NRB reflection from adjacent screens
4. Scene contrast degradation
The data collection was conducted in the AFRL Mesa facility. An M2DART display system in B-Bay was prepared with an extra light-blocking drapery. The projector systems installed were Barco 808s. Figure 19 is a screen identification layout for the M2DART that we will refer to in this section of the report. Figure 20 shows an exploded view of the M2DART.
Front1
Left2
Top3
Right4
LeftRear
5
Upper Left
6
Upper Right
7
RightRear
8
Figure 19- M2DART Screens Identification

19
Figure 20 M2DART Exploded View
3.4.2. Black Level It was postulated that when all projectors/displays are on, the total black level (the baseline radiance from the screen) might increase and be noticeable by NVGs. To study this, a number of surrounding screens displaying a color of 0-0-0, RGB black, were gradually increased while the black level from one of the screens was measured. This measured any impact of adjacent screens to the black level of any specific screen.
The data show that screen black level in an M2DART configuration is not meaningfully degraded by the surrounding black screens. This is shown by the numerical data collected, which is included in Section 8.4.1.
3.4.3. Bright Image Cross Illumination A bright image on one of the screens may impact the black level of adjacent/opposite screens. The amount of this cross illumination depends on the spectral reflectivity of the screen material, diffusing property and illumination incident angle. To measure the cross illumination impact on the black level, a bright image was displayed on an adjacent or opposite screen while the reflected radiance was measured from a black screen. The exemplar bright image that was used was a white disk representing a full moon. Numerical data collected are included in Section 8.4.2.
Most cross illumination comes from opposite screen pairs (Table 3). If the cross illumination effect must be removed, e.g., during OCSL illumination training, then it could be possible to turn off or darken the opposite screen from the screen the pilot is looking at. In this case, a head tracker system with only moderate accuracy is needed to identify the screen being observed by the pilot.
Table 3- Cross Illumination Screen Pairs
Screen 1 and Screen 5 Screen 2 and Screen 4 Screen 2 and Screen 8 Screen 3 and Screen 5

20
Cross illumination and black level: We found that a bright image (e.g., a white disk that is the relative size of a full moon) will impact the black level of the opposite screen. The worst-case black level impact was measured at 5.3E-11 NRB. A black-level impact of this order of magnitude is significant for OCSL illumination (representing a 71% albedo increase) and possibly some CSL illumination training scenarios. Due to this cross illumination of the black level, it is not recommended to attempt NVG stimulation during an OCSL illumination mode without some type of screen switching compensation technique.
3.4.4. Cross Illumination and Scene Contrast This portion of the experiment would only be performed if the previous portions indicate a significant black level impact. A bright image on a screen may impact the image contrast of adjacent/opposite screens. The amount of this cross illumination depends on the spectral reflectivity of the screen material, diffusing property and illumination incident angle. To measure the cross illumination impact on the contrast level, a bright image is displayed on an adjacent or opposite screen while the reflected radiance is measured from calibrated patches on a screen. The bright image used was a white disk about the size of a full moon. Numerical data collected is included in Section 8.4.3
Cross illumination and contrast: In practical viewing conditions, there is no appreciable impact to image contrast due to a bright image appearing on the surrounding screen(s). During CSL condition, the worst-case impact of a bright event was a shift of 12% in albedo of a dark patch. A temporary impact of this magnitude is not likely to negatively impact training value. Bright events occurring in a moonlit scenario are not likely to impact NVG image contrast in a perceptible way since the energy from cross illumination will be below the simulated ambient levels.
Goggle glare: “Goggle glare” effect due to multiple Green CRTs from different angles impacts the image contrast and manifests as a “washout.” The simple solution to this is to use NVG with the Glare Hood Extension Kit P/N 9668LKA142657LX installed (See “Aircrew System Change No. 668”).

21
4. Determinism of NVG Imagery
4.1. Overview Many image generation systems do not employ sophisticated signature models that simulate the multispectral radiometric environment in a generalized way. That is, many do not yet have the ability to describe all scene elements in terms of the way they radiate/reflect energy. In the absence of the ability to predict these values, subjective tuning of the “brightness” of scene elements has been the only approach available to most sensor-in-the-loop implementations. To introduce determinism into the application, true physics-based scene rendering must be assumed to be a feature of the IG.
To demonstrate the ability to produce repeatable and quantitative stimulation of the NVG, two critical requirements were identified and addressed:
• The relationship between pixel value (rendered by the IG) and display’s radiation of NVG-sensitive light must be known.
• The relationship between simulated scene radiance values and rendered pixel values must be known.
In summary, the NVG stimulate approach first requires a deterministic method to produce an actual NVG-sensitive quantity of light exiting the display that is equal to the quantity of light intended in the multi-spectral scene simulation. This method is outlined fundamentally by the two bullets above and the following subsections address the research approach taken for each respectively.
4.2. Display Characterization Procedure The goal for a display characterization was to obtain wavelength-specific radiance measurements within the range of 350 nm to 950 nm as produced by the projector and screen through a variety of display configurations. At a minimum, the radiance measurements were expected to produce a scalar radiance measurement consistent with the NVIS B sensitivity filter (NRb). In characterizing a display, the output luminance and NVIS radiance of the display were measured against an increasing series of pixel values for each CRT gun.
To extract the transfer function characteristics of the display, we used a radiometer/photometer instrument (Photo-Research NviSpot PR-1530AR) to collect the data. This instrument is capable of measuring the photopic luminance as well NVIS Radiance using a special filter/detector combination whose transmission curve matches the NVIS relative response in MIL-L-85762, NVIS-B Compatibility (Night Vision Goggles). When operated in the NVIS Mode, the NviSpot display reads out in NVIS Radiance (NRa or NRb) units. As mentioned earlier, the NVG response curve used in the report for illustration does not include the leaky green filter mod consistent with the actual NVGs used in the research. This difference to total NRb contribution of the leaky green notch is minor compared to the variation in NVIS radiance of real-world scenes and was ignored for the purposes of computational analysis.
After setting the black level and contrast per Sections 3.1.1 and 3.1.2, measurements were taken for each CRT separately. A full screen/full field image with solid colors ranging from 0 to 255 were displayed and measured. The maximum interval between colors was 15, with fewer intervals for lower pixel values. The experiment was performed in a light-tight room with the NVIS ambient level kept to below 6E-12 w/sr/cm2. Light leak and intrusion were detected readily with a pair of NVGs and the offending light sources were then covered.
The following were data recorded during a characterization procedure:

22
System Information:
• Display/Projector make, model, type
• Screen material, thickness, type
• Image Source type, graphic card
Setup Information:
• Image resolution
• Measurement distance, location on the screen, angle
• Measuring instruments
• Ambient radiance on the screen (projector off)
• Black level on the screen (projector on)
• Display setup (Brightness, Contrast, Color temperature, etc)
Measurements:
• Pixel value versus radiance (NRb) and Luminance (fL)
A sample of the data collection form is included in Section 8.6.
Collected data were compiled and γ for each CRT for both luminance and NVIS radiance were computed from the data. A simple binary search algorithm combined with least-mean squares evaluation was used to find the closest γ that matches the data set. A “saturation” level detection algorithm was employed to test if a data set is saturated. Section 8.3 summarized the results of characterization for different display models and configurations.
In several cases, displays were found not to follow the simple pγ relationship in NRb and/or luminance space and included higher order nonlinear distortions (see the Figure 21 as an example). To be certain that these distortions are captured in the display characterization process, we increased the number of samples measured as compared to the number of samples previously taken in NVG simulate applications.
4.3. Generalized Radiance Rendering Algorithm
4.3.1. Impact of Display Gamma The geometric relationship between display system input and measured light output is inherent to all traditional displays. This relationship must be accommodated somewhere within the system. Ultimately, it is desired that physics-based modeling of the environment produce quantitative scene renderings that, when converted to light by the display system, produce the same quantities of light that were intended in the computational rendering. Therefore the nonlinear radiance transfer function inherent to the display, as adjusted, must be modeled and must influence the way scenes are generated by the IG. It was assumed, for IG real-time performance considerations, that simple linear mappings of simulated radiance values to pixel values must be supported. Therefore, correction for the display radiance response to pixel value must be applied in order to achieve a linear relationship of pixel value to output display radiance. This correction would generally be accomplished through traditional gamma correction mechanisms but in practice, simple gamma correction was not found to be accurate enough. That is, in several cases, displays were found not to follow the simple pγ relationship in NRb and/or luminance space and included higher order nonlinear distortions (see the figure below as an example).

23
A more exact conversion was implemented involving the use of a lookup table. Although still referred to loosely as gamma correction, it involves the use of an inverse normalized mapping of the display response profile. In the demos, this mapping was returned by SensorHost as a table and was used by the IG to re-map the pixel before it was sent to the display. Since this mapping contains all of the original data points from the display mapping (generated during the characterization), it will be as accurate as the number of sample points collected to build the display profile.
4.3.2. Color Mapping Algorithm Each CRT gun (color) has a distinct NVIS radiance transfer function, defined by the minimum radiance (at pixel value 0), maximum radiance (at pixel value 255 or less), and its aggregate γ value. In mapping pixel color values (RGB) to NVIS radiance, a straightforward bucket rendering method is devised. In this method, the NVIS radiance range is divided into three ranges: low, medium, and high. A CRT color is chosen to represent the low range radiance values. As the maximum radiance for that CRT is reached, another CRT color is activated to add to the low range maximum radiance. When both CRT colors are maximized, then a third CRT color is activated and added.
As an example, an intuitive mapping is to stack Blue, which has the lowest maximum radiance, with Green, and then Red, having the highest maximum radiance. See Figure 22 for a plot of “Desired NVIS radiance” versus “Predicted NVIS radiance.” Desired NVIS radiance is the value computed by the IG based on the material reflectivity, NVG response curve, and illumination. Predicted NVIS radiance is the radiance produced by the display based on its characteristics.
0 0.2 0.4 0.6 0.80
5 .10 9
1 .10 8
1.5 .10 8
2 .10 8
MeasuredTheoretical
Barco 801 Blue Gun
Pixel Value
Rad
ianc
e (W
/cm
^2/s
r)
Figure 21 Barco 801 Blue Gun With Nonlinear Saturation

24
1 .10 11 1 .10 10 1 .10 9 1 .10 8 1 .10 7 1 .10 61 .10 11
1 .10 10
1 .10 9
1 .10 8
1 .10 7
1 .10 6
Red GunGreen GunBlue GunDesired NRb
Desired NVIS Radiance (W/cm^2/sr)
Mea
sure
d N
VIS
Rad
ianc
e (W
/cm
^2/s
r)
Figure 22 Blue-Green-Red Radiance Mapping Example
4.3.3. Generalized Bucket Rendering Equations The rendering equations used for stimulate are identical to the equations used for a simulate with ViPRS configuration. The IG uses the same equation for each gun, applying the SensorHost produced per gun coefficients. However, stimulate requires that the resultant values from the rendering equation be gamma corrected in order to create a linear mapping of simulated radiance to rendered display radiance. In the case of a stimulate rendering the gamma correction information retrieved from SensorHost, either in coefficient or tabular forms, will be specific for the channel requested.
The general form of the bucket equation for any gun (color) is as follows:
(3)
nn
n n
r MnRp fMxR MnR
⎛ ⎞−= ⎜ ⎟−⎝ ⎠
Equation 3 General rendering equation

25
Where:
f(x) Non-linear function such as: 1
( ) nf x x γ=
or
( ) ( )nf x LUT x=
pn Final pixel value of this gun to be sent to the display.
r The scene fragment radiance.
MnRn The minimum radiance assigned to this gun.
MxRn The maximum radiance assigned to this gun.
γn The gamma correction coefficient for this gun.
n Projector gun number (1,2,3,…)
This equation may produce values less than 0 and greater than 1. It is assumed that either the rendering hardware or IG software will perform the clipping at the bottom and top.

26
5. Artificial Augmentation of Bright Sources
5.1. Overview
5.1.1. Introduction Early in this effort, it was assumed that current displays would rarely be able to produce pixel energies sufficient to create effects seen in the sensor associated to bright point-source that are described in the second training requirement (see 1.3). Knowing that point screen sources would not generally be bright enough to affect the gain state of the goggle, we recognized that at least a synthetic goggle halo could be rendered into the scene, thus providing a level of bright-source cueing that might be useful in training.
The rendering of a halo is a relatively simple matter if the IG is SensorHost capable and uses the SensorHost halo models that are mapped into radiance space. The IG would then Bucket Render the halo along with everything else in the scene.
Later findings showed that every display tested was able to cause the sensor to generate a halo, although for some the halo intensity is quite low. An algorithm had to be developed that compensated for the display-generated halo so that the summation of it and the artificial halo produced the correct luminance on the sensor.
5.1.2. Algorithm To produce a desired halo of a simulated bright point-source from the viewed display, three steps must be taken.
• The radiance of the simulated bright point-source must be calculated.
• The IG must calculate how many pixels on the display must be “lit” and at what intensity to produce the equivalent amount of energy as the bright point-source that is in the simulation.
• The halo of the lit pixels must be calculated and subtracted from the desired halo.
Simulated Bright Point-Source Radiance
To calculate the bright point-source radiance we use the pseudo-radiance equation as defined by SensorHost.
(4)
22
( )
sin2
ss
I w hRfov dπ
⋅ ⋅=
⎛ ⎞⋅ ⋅⎜ ⎟⎝ ⎠
Equation 4 Pseudo-radiance for bright point source
Where:
Is Simulated radiant intensity of the source (W/sr)
w The width of the viewable display in pixels
h The height of the viewable display in pixels
fov The field of view of the sensor
d The distance from the source to the simulated viewpoint in (cm)

27
Calculate the Number of Pixels and Pixel Energy
The in-band world radiance of a single pixel is the maximum radiance returned from all of the radiance to color mappings that SensorHost provides. Using the following equation, a radiant intensity can be calculated for the pixel.
(5) 2
2sin2pm
p
fovR dI
pix
π ⎛ ⎞⋅ ⋅ ⋅⎜ ⎟⎝ ⎠=
Equation 5 Per-pixel radiant intensity calculation
Where:
Rpm Measured pixel radiance value (W/cm^2/sr)
fov The field of view of the sensor
d The mean distance the real viewer is from the display (cm)
pix The number of pixels within the field of view of the sensor at the viewer distance
Using Ip we can calculate an equivalent simulation radiance using the SensorHost pseudo-radiance equation. This will allow us to calculate how many pixels will be needed to produce the equivalent amount of energy as the simulated source.
(6)
22sin
2
pp
I w hR
fov dπ
⋅ ⋅=
⎛ ⎞⋅ ⋅⎜ ⎟⎝ ⎠
Equation 6 Per-pixel pseudo-radiance calculation
Where:
Ip The pixel radiant intensity (W/sr).
w The width of the viewable display in pixels.
h The height of the viewable display in pixels.
fov The field of view of the sensor.
d The mean distance the real viewer is from the display (cm).
Now the number of pixels to render is simply a ratio of the simulated source radiance over the pixel radiance.

28
(7)
s
p
RnR
=
Equation 7 The number of pixels to render the light point
n may be capped if n is larger than the number of pixels that best approximate the visual size of the bright point, or some size that has been determined to be “good enough”.
Calculate the Final Halo
There are two possible solutions to calculating the halo. One uses the simplified radiance exemplar image/halo intensity function combination and the other uses the more complex multi-dimensional halo model.
The exemplar image/intensity function calculation simplifies to:
(8)
( ) ( )e m s m pH H h R h R n⎡ ⎤= ⋅ − ⋅⎣ ⎦
Equation 8 Halo intensity based on exemplar image/intensity function
Where:
He The exemplar radiance halo image
Hm An interpolation function created using the halo intensity table
To calculate the final complementary halo using the more detailed multi-dimensional model the following would be used:
(9)
( ) ( )s pH HaloModel R HaloModel R n= − ⋅
Equation 9 Halo intensity function based on multi-dimensional halo model
Where:
H Halo image. (W/cm^2/sr)
HaloModel An interpolation function for the halo model.
5.2. Example Figure 23 is an example rendering used during the halo study. It is a clear starlight lighting scenario rendered for display on the Barco Retrographics (Barco 801).

29
Figure 23 Example Halo Rendering on Retrographics

30
6. Adaptation of SensorHost Software Library
6.1. Overview External extensions to SensorHost were quite modest. There was a need to add two new API calls that returned per-color display correction coefficients and tables, a new configuration file XML node for switching the internal state of SensorHost, and a more detailed display profile file format in XML. The internal changes included a rewrite of the video managing system to generalize the handling of display colors and changes to the radiance to color allocation logic.
6.2. SensorHost Modification
6.2.1. External Extensions API
To provide a means to correct for a displays per-color non-linearities, two new function calls were added to the API. shVideoGetChannelGamma returns a single gamma coefficient for the specified color. shVideoGetChannelGammaTable returns a table that contains a normalized inverse mapping of the requested colors pixel to radiance response. The mapping is used by the IG to correct each pixel before finally being rendered. This correction creates a display radiance response that is linear with respect to simulated fragment radiance.
Configuration
There was an option added to the configuration that changes the way SensorHost allocates the radiance to color mappings and locks all color gains to 1.0. The XML command, or node, is called RADIANCE_MAPPING and it has two attributes.
The first is the MODE attribute which controls the logic that SensorHost should use to assign radiance to colors. It, currently, accepts one option and that is stimulate. When this option is enabled, SensorHost no longer allocates the blue range based on the current environmental lighting conditions.
The second is the ORDER attribute which controls the assignment order of the guns (colors). The accepted settings are as follows: BGR, BRG, GBR, GRB, RGB, RBG, RAW. Each letter corresponds to a specific gun. R is for the red gun, G is for the green gun, and B is for the blue gun. The RAW option tells SensorHost to set the color allocations to the actual radiance values that each gun can produce. The results of setting the ORDER attribute will be reflected in the minimum and maximum radiances returned by shChannelGetMinMax.
The following shows an example entry in the SensorHost configuration file:
<RADIANCE_MAPPING MODE="STIMULATE" ORDER="RGB"/>
Display Profile
The final external change is the addition of the ability to read in a new display profile file format in XML. This file format makes it possible to specify the pixel response for each gun of a display and set a gamma value for each gun externally which will override the computed gamma produced by SensorHost.

31
The opening token, or node in XML parlance, is the DISPLAY node. This is used to group the gun response nodes.
Each gun response node is named. Currently there are three names to choose from, RED, GREEN, and BLUE.
Each gun node must have a MODEL sub node defined. In the MODEL node is an XML CDATA container that holds the display pixel response profile in two columns. The first column is the normalized pixel value and the second column is the display response to that pixel value. A second, optional, child node is the GAMMA node which is used to define an overriding final gamma value for that gun which would be returned by a call to shVideoGetChannelGamma or shVideoGetChannelGammaTable.
A small example file is below:
<?xml version="1.0"?> <DISPLAY> <RED> <GAMMA>2.85</GAMMA> <MODEL> <![CDATA[ 0 3.2e-11 0.5 3.93e-8 1 1.71e-7 ]]> </MODEL> </RED> <GREEN> <MODEL> <GAMMA>2.8</GAMMA> <![CDATA[ 0 3.3e-11 0.5 6.26e-9 1 3.06e-8 ]]> </MODEL> </GREEN> <BLUE> <MODEL> <![CDATA[ 0 3.1e-11 0.25 1.18e-10 0.5 3.22e-10 0.75 4.6e-10 1 5.51e-10 ]]> </MODEL> </BLUE> </DISPLAY>

32
6.2.2. Internal Extensions When in sensor-in-the-loop configuration, the radiance range for each display color is defined by the physical radiance output of the display; changes had to be made to the color allocation logic in SensorHost when in stimulate mode. The extensions allowed the colors to be placed in any order, specified by the configuration file. The ranges for each color in the stimulate mode are then defined by the radiance ranges for each display color.
The shVideo object, that handles the loading of the display profile, had to be further generalized to be able to return per-color gamma table and coefficients. This resulted in two new API calls, shVideoGetChannelGamma and shVideoGetChannelGammaTable.
An interesting side note is that, in simulate, SensorHost would have a single display profile that is used to model the monochromatic display being used and shVideoGetChannelGamma and shVideoGetChannelGammaTable can still be used by the IG to retrieve the display correction data, per-color if it chooses. SensorHost will simply return the same display profile for each color. The result is that an IG can use a single rendering execution path for simulate and stimulate, further reducing execution complexity and integration errors.

33
7. Conclusions
7.1. Optimization of the Display During this research effort, we learned that CRT-based display systems currently fielded can generally be expected to produce the dynamic range of NVG-sensitive radiance intensities sufficient to bound the full regime of natural illumination found in the night environment. All of the displays tested as part of the effort were able to achieve an NRb black level of 4E-11 W/cm2/sr (approximately 10% albedo under CSL) while able to produce at least a maximum NRb output of 1.5E-8 W/cm2/sr (approximately 100% albedo under full moon conditions [FM]). The brightest display measured was able to a produce a maximum radiance on the order of 100 times that of 100% FM reflectivity. Even this brightest display falls well short of the radiance output required to represent many of the bright sources found in the night environment, so aggressive optimization of display performance in the NVG wavelengths is always recommended.
7.1.1. Adjustment Process The display optimization processes discussed in Section 3 were found to reliably minimize the display black level and maximize the top-end output within the physical limitations of the display and according to the constraints of the sensor-in-the-loop application. The optimization approach is described as a process rather than a procedure as some measure of knowledge of the target application and experience with NVGs is likely to be required in any given case. The display optimization worksheet tools found in Section 8 were shown to be useful as decision aids during the optimization process.
7.1.2. Passive Display Modifications Displays that are capable of producing an NVG-sensitive dynamic range greater than the natural illumination envelope require additional optimization for this dynamic range to be utilized in real application. Among the systems tested, it was found that the proportion of visible wavelengths to NVG-sensitive wavelengths makes all but the Red CRT unusable for meaningful NVG response, assuming unaided artifacts are to be avoided. The 256 intensities provided by a single 8-bit IG (Red) output can only be stretched so far. Subjectively, we determined this practical limit to be approximately equal to FM reflective radiance. The photopic filtering technique discussed in Section 3.3 was shown to be an attractive mechanism for making use of the additional 2 x 256 intensities available from the Blue and Green CRTs. By utilizing the range of intensities provided by all three projector guns, we preserved the option to aggressively optimize the dynamic range of the display while keeping unaided artifacts to an acceptable minimum. In this case “acceptable” was a subjective assessment made by comparing the unaided color distortion experienced during the study to the color distortion typical of traditional sensor-in-the-loop, red-dominated implementations.
The decision of whether to use the filtering approach should take into account the broader system level considerations not discussed here. However, it was generally found that the brighter the display, the more there is to be gained by using the photopic filtering approach developed in the research.
7.2. Determinism of NVG Imagery Many image generation systems do not employ sophisticated signature models that simulate the multispectral radiometric environment in a generalized way. That is, many do not yet have the ability to describe all scene elements in terms of the way they radiate energy. In the absence of the ability to predict these values, subjective tuning of the “brightness” of scene elements has been the only approach available to most sensor-in-the-loop implementations. To introduce determinism into the application, and due to the fact that there is less room for “error” in the sensor-in-the-loop application, true physics-based scene rendering must be assumed to be a feature of the IG.

34
7.2.1. Display Characterization Procedure Detailed modeling of the display transfer function (in NRb space) was found to be a critical prerequisite to producing quantitative, verifiable NVG imagery results. It was assumed, for IG real-time performance considerations, that simple linear mappings of simulated radiance values to pixel values must be supported. Therefore, correction for the display radiance response to pixel value must be applied in order to achieve a linear relationship of pixel value to output display radiance. This correction would generally be accomplished through traditional gamma correction mechanisms but in practice, simple gamma correction was not found to be accurate enough. That is, in several cases, displays were found not to follow the simple pγ relationship in NRb and/or luminance space and included higher-order non-linear distortions. To be certain that these distortions are captured in the display characterization process, we increased the number of samples measured as compared to the number of samples previously taken in NVG simulate applications.
The display characterization procedure discussed in Section 4.2 and captured in the worksheets in section 8.6 and Error! Reference source not found. was found to be a repeatable method for characterizing the nonlinear distortions introduced by the display.
7.2.2. Recommended Rendering Technique As it was desired that the approach developed in this study be quickly applied by current users of the SensorHost simulate rendering approach, we began by testing the bucket rendering approach already utilized by SensorHost:
(10)
nn
n n
r MnRp fMxR MnR
⎛ ⎞−= ⎜ ⎟−⎝ ⎠
Equation 10 SensorHost Simulate approach rendering equation
Where:
pn Final pixel value of color n
n Color channel (0 = Blue,1 = Green,2 = Red)
( )f x Inverse gamma correction function1
( )f x x γ= **
r The scene fragment radiance calculated by IG
MnRn The minimum radiance assigned to color n (Blue always lowest energy range, Green always mid energy range, Red always highest energy range) *
MxRn The maximum radiance assigned to color n (Blue always lowest energy range, Green always mid energy range, Red always highest energy range) *
Notes:
*This parameter is provided by SensorHost using API call shChannelGetMinMax.
** γ is the calculated display gamma coefficient provided by SensorHost using API call shVideoGetChannelGamma.
The following generalizations were found to be required to fully support physics-based sensor-in-the-loop rendering:
• The default SensorHost radiance to pixel mapping logic forces terrain rendering to be mapped to a single color. This constraint, requested by an IG developer for real-time performance concerns,

35
cannot be assumed in the sensor-in-the-loop case. This is due to the fact that the pixel to screen radiance relationship in the display now determines the required IG radiance to pixel mapping more so than logic decisions found within SensorHost. Therefore, SensorHost must be able to define the IG pixel mappings precisely and without constraint. Said another way, terrain (and all other scene elements) must be able to span color boundaries in the event that the display transfer function requires it.
• For similar reasons, and because display NRb output behavior cannot be predicted in the general case, it was desired to make the radiance mapping component order arbitrary. That is, Blue should not have to be the first color mapped, Green should not have to be the second color mapped, and Red should not have to be the last color mapped, etc.
• The gamma correction function applied should not be assumed to be the standard gamma relationship and should instead be able to be implemented as an arbitrary non-linear function.
These generalizations yield a new expression of the generalized bucket rendering technique:
(11)
nn n
n n
r MnRp fMxR MnR
⎛ ⎞−= ⎜ ⎟−⎝ ⎠
Equation 11 New general rendering equation for Stimulate and Simulate/ViPRS
Where:
pn Final pixel value of this gun
n Color channel (0, 1, 2, n, … order arbitrary) ****
fn (x) Non-linear function such as: 1
( ) nnf x x γ= **
or
( ) ( )n nf x LUT x= ***
r The scene fragment radiance calculated by IG
MnRn The minimum radiance assigned to this color channel *
MxRn The maximum radiance assigned to this color channel *
Notes:
* This parameter is provided by SensorHost using API call shChannelGetMinMax. There are no constraints on the color ordering, and the minimum and maximum radiance ranges for each color can have any value.
** γ is the calculated display gamma coefficient provided by SensorHost using API call shVideoGetChannelGamma.
*** This parameter is provided by SensorHost using API call shVideoGetChannelGammaTable
**** How n maps to Red, Green, and Blue color channels is determined by the SensorHost configuration (see RADIANCE_MAPPING).

36
This form preserves all of the dynamic range and precision benefits that are core to the simulate mathematical approach while minimizing the extensions/generalizations that IG developers must make to take advantage of the results of this study.
7.3. Augmentation of Bright Source Effects As it was known that all traditional display systems would fall well short of providing the range of NVG-sensitive output required to accurately represent many of the bright sources in the night environment, the artificial injection of NVG halo effects was demonstrated as a means to add additional cues as to the intended intensity of bright objects.
A technique for boosting the display-generated halos was developed that produces artificial halo intensities that, when viewed by the sensor, produce convincing halo effects using a display that is not otherwise capable of producing halos in the goggles. At the core of the technique was the use of the radiance form of the halo model query already present within SensorHost. This form of the halo model was originally required in support of “pixel rendering mode” (F-18 DMT) as that technique also requires that all pixel transformations take place in radiance space.
A noted challenge was the “difference halo” problem. That is, for maximum accuracy an additional IG-side transformation was required to predict the halo that would be created by the specific display by a specifically rendered light point so that the screen radiance lacking in the halo could be calculated. From this calculation, the radiance boost required to produce the desired halo could be calculated and mapped into pixel space using the same rendering equation used for the rest of the scene.
7.4. Adaptation of SensorHost Software The SensorHost software library was updated to include an implementation of all of the approaches demonstrated during the research. The existing radiance rendering approach, previously developed for simulate, was found to be reusable for stimulate to a greater degree than was originally expected. In the end, generalizations to the multicolor rendering equation were required, but changes to the rendering approach were avoided. As a result, the API extensions, configuration additions, and internal generalizations made SensorHost a more flexible system for future sensor applications while maintaining backward compatibility for current applications. The goal of making physics-based NVG STIMULATION more accessible to current SensorHost users was achieved. In fact, an IG developer that has already implemented a SensorHost multicolor simulate renderer in its most general form should be able to render a stimulate scene by making only configuration changes.

37
8. Detailed Results and Additional Data
8.1. Display NVG Spectral Response
8.1.1. Barco RetroGraphics 801S Spectral Response The first display system chosen for the research effort was a Barco RetroGraphics 801S. This is a single display with rear-projection Red-Green-Blue CRTs. The image is projected onto a mirror and then to a Fresnel/lenticular screen, which radiates directional (as oppose to diffuse) intensity. The maximum resolution for this display is 1600 x 1200 pixels.
Figures 24, 25, and 26 show the result of spectro-radiometry (Photo-Research PR-715) measurement for different CRTs. Two graphs per figure are included with the second graph being in a logarithmic scale. The data for each plot are taken for different pixel values per color. For example, 60-0-0 means Red at 60 (of 255 maximum), Green at 0, and Blue at 0. The log scale exaggerates minute radiance presence in the NIR region. Although small, in aggregate, they would add up enough NVIS Radiance to affect the NVG. The steep drops in the NIR region are due to instrument measurement noise at this level of dynamic range (6 orders of magnitude).
Red CRT Spectral Radiance
0.000E+00
1.000E-07
2.000E-07
3.000E-07
4.000E-07
5.000E-07
6.000E-07
7.000E-07
8.000E-07
9.000E-07
1.000E-06
380
420
460
500
540
580
620
660
700
740
780
820
860
900
940
980
1020
1060 nm
w/c
m2/
sr
60-0-0
120-0-0
180-0-0
240-0-0
255-0-0
Red CRT Spectral Radiance (log scale)
1.000E-12
1.000E-11
1.000E-10
1.000E-09
1.000E-08
1.000E-07
1.000E-0638
042
046
050
054
058
062
066
070
074
078
082
086
090
094
098
010
2010
60nm
w/c
m2/
sr
60-0-0
120-0-0
180-0-0
240-0-0
255-0-0
Figure 24 Barco RetroGraphics 801s Red CRT Spectral Response
Green CRT Spectral Radiance
0.000E+00
1.000E-07
2.000E-07
3.000E-07
4.000E-07
5.000E-07
6.000E-07
7.000E-07
8.000E-07
9.000E-07
1.000E-06
380
420
460
500
540
580
620
660
700
740
780
820
860
900
940
980
1020
1060 nm
w/c
m2/
sr
0-60-0
0-120-0
0-180-0
0-240-0
0-255-0
Green CRT Spectral Radiance (log scale)
1.000E-12
1.000E-11
1.000E-10
1.000E-09
1.000E-08
1.000E-07
1.000E-0638
042
046
050
054
058
062
066
070
074
078
082
086
090
094
098
010
2010
60 nm
w/c
m2/
sr 0-60-0
0-120-0
0-180-0
0-240-0
0-255-0
Figure 25 Barco RetroGraphics 801s Green CRT Spectral Response

38
Blue CRT Spectral Radiance
0.000E+00
1.000E-07
2.000E-07
3.000E-07
4.000E-07
5.000E-07
6.000E-07
7.000E-07
8.000E-07
9.000E-07
1.000E-06
380
420
460
500
540
580
620
660
700
740
780
820
860
900
940
980
1020
1060 nm
w/c
m2/
sr
0-0-60
0-0-120
0-0-180
0-0-240
0-0-255
Blue CRT Spectral Radiance (log scale)
1.000E-12
1.000E-11
1.000E-10
1.000E-09
1.000E-08
1.000E-07
1.000E-0638
042
046
050
054
058
062
066
070
074
078
082
086
090
094
098
010
2010
60 nm
w/c
m2/
sr
0-0-60
0-0-120
0-0-180
0-0-240
0-0-255
Figure 26 Barco RetroGraphics 801s Blue CRT Spectral Response
The following graphs in Figure 27 show normalized (%) plots of 255 Red, 255 Green, and 255 Blue CRTs super imposed with the NVG response curve (black line). The logarithmic plot clearly shows the presence of NVIS radiance under the NVG curve. It is also apparent that Green has the highest luminance and Blue the lowest.
Normalized Spectral Respose
0%
10%
20%
30%
40%
50%
60%
70%
80%
90%
100%
380
412
444
476
508
540
572
604
636
668
700
732
764
796
828
860
892
924
956
988
1020
1052 nm
Nor
mal
ized
Inte
nsity
(%)
Red GunGreen GunBlue GunNVG
Normalized Spectral Respose (log scale)
1.E-12
1.E-11
1.E-10
1.E-09
1.E-08
1.E-07
1.E-06
1.E-05
1.E-04
1.E-03
1.E-02
1.E-01
1.E+00
380
416
452
488
524
560
596
632
668
704
740
776
812
848
884
920
956
992
1028
1064
nm
Nor
mal
ized
Inte
nsity
(%)
Red GunGreen GunBlue GunNVG
Figure 27 Barco RetroGraphics 801s CRTs Normalized Spectral Response
8.1.2. Barco 908 Spectral Response The second display system measured was a Barco 908 projector. The projector was setup 8’ behind a 3/8” acrylic screen. This setup was to optically simulate a M2DART system in support of the Navy’s AV-8 Simulator program.
The spectral distributions of Barco 908 are essentially the same as Barco 801s. However, the relative peak intensities of the Red and Green CRTs between the two projectors are different (see Figure 28). This variation would indicate dissimilarity in the white-color balance between the two projectors (e.g., different color temperature adjustment). The color balance is adjustable and not an inherent property of the projector. The spectral distribution of a CRT depends on the type of phosphor used. Therefore, as long as the CRT’s phosphors are the same, different CRT projector systems or models will exhibit similar spectral distribution.

39
Normalized Spectral Response
0%
10%
20%
30%
40%
50%
60%
70%
80%
90%
100%
380
412
444
476
508
540
572
604
636
668
700
732
764
796
828
860
892
924
956
988
1020
1052 nm
Nor
mal
ized
Inte
nsity
(%)
Red Gun
Green Gun
Blue Gun
NVG
Normalized Spectral Response (log scale)
1.00E-12
1.00E-11
1.00E-10
1.00E-09
1.00E-08
1.00E-07
1.00E-06
1.00E-05
1.00E-04
1.00E-03
1.00E-02
1.00E-01
1.00E+00
380
416
452
488
524
560
596
632
668
704
740
776
812
848
884
920
956
992
1028
1064 nm
Nor
mal
ized
Inte
nsity
(%)
Red Gun
Green Gun
Blue Gun
NVG
Figure 28 Barco 908 CRTs Normalized Spectral Response
8.2. Display Luminance and Radiance Transfer Functions These equations were used in the early stages of the study to assist in the analysis of display behavior and to establish critical metrics later in the study. These equations are not part of the SensorHost extensions. The luminance transfer function for a CRT projector is:
(12)
( ) ( ) LL p mxL mnL p mnLγ= − × +
Equation 12 Luminance and Radiance Display Transfer Function
Where:
L(p) photopic luminance as a function of pixel value (fL)
p normalized pixel value (0 to 1.0 = 0 to 255)
mxL maximum display luminance at this setting (fL)
mnL minimum display luminance at this setting (fL)
γL total display gamma at this setting (unit less)
The NVIS Radiance transfer function for a CRT projector is:
(13)
( ) ( ) RR p mxR mnR p mnRγ= − × +
Equation 13 NVIS Radiance Display Transfer Function
Where:
R(p) NVIS radiance as a function of pixel value (w/sr/cm2)
p normalized pixel value (0 to 1.0 = 0 to 255)
mxR maximum display radiance at this setting (w/sr/cm2)
mnR minimum display radiance at this setting (w/sr/cm2)
γR total display gamma at this setting (unit less)

40
Luminance/radiance minima, maxima, and gammas characterize a specific display. These parameters are also specific for each setup. Any changes to the display system component (e.g., contrast, brightness, graphic card, resolution, refresh rate, etc) will affect these numbers and a re-characterization is necessary to maintain simulation accuracy.
When a display model saturates prior to a pixel value (p) 1.0, then the Display Transfer Function must be modified to account for the non-gamma behavior after the saturation point. The maximum value will be recalculated to project a theoretical maximum based on a purely gamma function behavior.
(14)
sat sattheoretical
sat
v mn p mnmxp
γ
γ
+ ⋅ −=
Equation 14 Theoretical maximum value in a saturated curve
Where:
mxtheoretical theoretical maximum value (w/sr/cm2 or fL)
vsat saturation value at inflection point (w/sr/cm2 or fL)
psat saturation pixel at inflection point (0 to 1.0)
mn minimum display value at this setting (w/sr/cm2 or fL)
γ total display gamma at this setting (unit less)
8.3. Collected Display Characterization Data
8.3.1. Barco RetroGraphics 801S The following data were collected at the AFRL Mesa facility. The setup parameters for the measurement were:
Screen resolution: 1600 x 1200
Screen refresh rate: 60 Hz
Color temperature: 6500 K
Overall Brightness (black level) setting: 41%
Overall Contrast setting: 78%
Eye point (distance from screen): 59”
Measurement location and angle: Center and Normal to the screen
Source: PC with Radeon 9800 graphic card. Gamma (RGB): 1.0
During NVIS radiance measurement, a Roscolux #27 Medium Red filter was installed on Blue CRT (See Section 3.3).
Table 4 summarizes the result of the data collection and analysis:

41
Table 4 Barco RetroGraphics 801s Transfer Function Characteristics
CRT mnL mxL γL mnR mxR γR (fL) (fL) (W/sr/cm2) (W/sr/cm2)
B41-C78 Red 0 20 2.735 6.00E-12 2.72E-06 2.717 Green 0 47.3 2.564 6.00E-12 9.75E-07 2.647 Blue 2.50E-04 8.77 3.438 7.00E-12 1.04E-08 2.211
NOTE: These characteristics are specific for this display at Brightness 41% and Contrast 78%. Any change to these settings or other setup adjustment will require a complete re-characterization of the display.
The following plots in Figures 29 and 30 graphically illustrate the display transfer functions with the obtained characteristics. The solid lines are the measured data and the dotted lines are the Transfer Function model. Notice that Green CRT is saturated, whereas the Blue CRT almost covers the full range of pixel values. Usually, a choice must be made to prioritize which CRT must have the maximum pixel value range (by adjusting the contrast setting), while letting others saturate at will. Another important observation is the fact that each CRT color has different luminance and radiance γ values. This indicates that the relationship between luminance and NVIS radiance is NOT linear. This means the NVIS radiance value cannot be predicted from the luminance value by a multiplication factor or ratio.
Figure 29 Barco RetroGraphics 801s Luminance Transfer Function Curves

42
Figure 30 Barco RetroGraphics 801s Radiance Transfer Function Curves
Table 5 shows the NVIS radiance of Blue CRT ranges from 7E-12 to 1.04E-08 W/sr/cm2. Comparing this range with Table 2, the Blue CRT alone is able to produce representative NVIS radiance under OCSL to FM illumination conditions. However, the photopic luminance is 100 to 1000 times brighter than what it needs to be.
Table 5 Barco 801 Blue CRT Evaluation
Luminance NRb Radiance Ratio OCSL 1.00E-05 7.50E-11 1.33E+05
FM 1.00E-02 1.50E-08 6.67E+05 Min Blue (0-0-0) 2.5E-4 7E-12 3.57E+07
Max Blue (0-0-255) 8.77 1.04E-08 8.43E+08
8.3.2. Mock M2DART Display with Barco 908 Projector The following data were collected at the AFRL Mesa facility. The setup parameters for the measurement were:
Screen type: 3/8” Acrylic
Screen resolution: 1280 x 1024
Screen refresh rate: 60 Hz
Color temperature: 6500 K
Overall Brightness (black level) setting: 56%
Overall Contrast setting: 96%
Eye point (distance from screen): 36”
Measurement location and angle: Center and Normal to the screen
Projector Throw Distance to screen: 96”
Source: Laptop PC with Radeon 9000 graphic card. Gamma (RGB): 1.0

43
Table 6 summarizes the result of the data collection and analysis:
Table 6 Barco 908 - Mockup M2DART Transfer Function Characteristics
CRT mnL mxL γL mnR mxR γR (fL) (fL) (W/sr/cm2) (W/sr/cm2)
B56 – C95 Red 0 5.95 2.245 8.5E-11 1.08E-6 2.254 Green 1.0E-03 12.9 2.375 6.9E-11 3.55E-7 2.348 Blue 1.0E-03 8.77 2.256 6.6E-11 3.51E-9 1.422
NOTE: These characteristics are specific for this display at Brightness 56% and Contrast 95%. Any change to these settings or other setup adjustment will require a complete re-characterization of the display.
Figures 31 and 32 show the results of the Barco 908 mockup M2DART luminance and radiance transfer function curves.
Figure 31 Barco 908 - Mockup M2DART Luminance Transfer Function Curves
Figure 32 Barco 908 - Mockup M2DART Radiance Transfer Function Curves
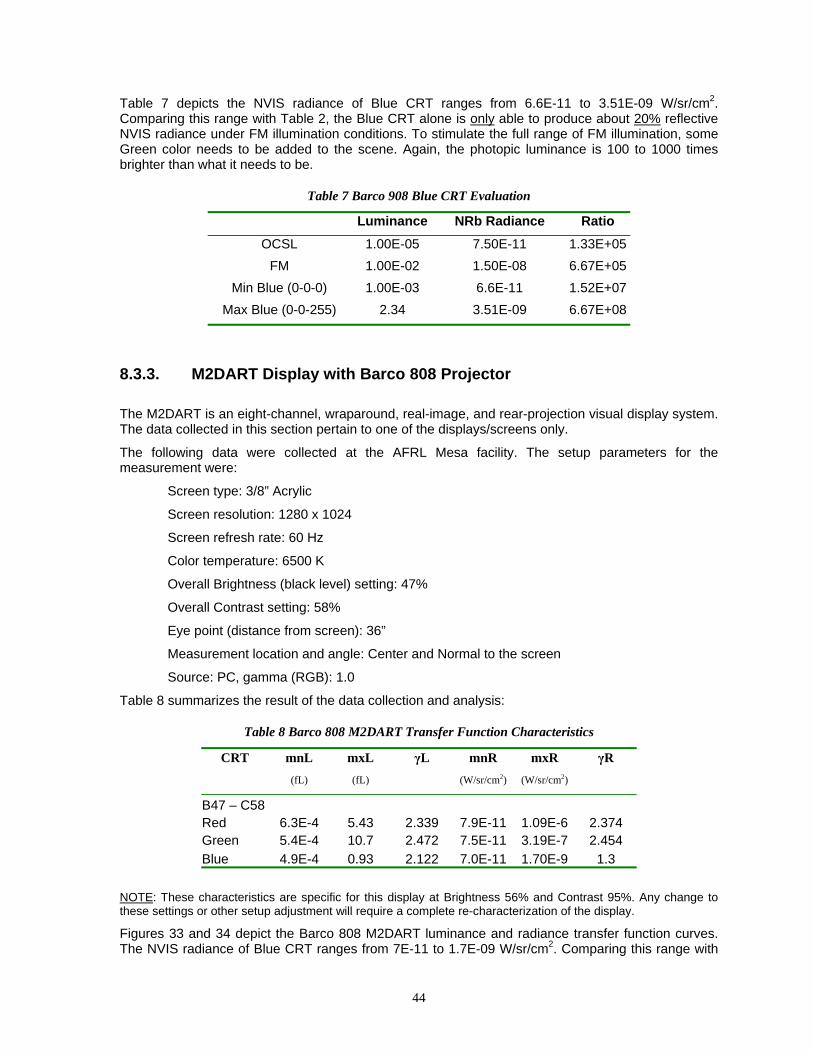
44
Table 7 depicts the NVIS radiance of Blue CRT ranges from 6.6E-11 to 3.51E-09 W/sr/cm2. Comparing this range with Table 2, the Blue CRT alone is only able to produce about 20% reflective NVIS radiance under FM illumination conditions. To stimulate the full range of FM illumination, some Green color needs to be added to the scene. Again, the photopic luminance is 100 to 1000 times brighter than what it needs to be.
Table 7 Barco 908 Blue CRT Evaluation
Luminance NRb Radiance Ratio OCSL 1.00E-05 7.50E-11 1.33E+05
FM 1.00E-02 1.50E-08 6.67E+05 Min Blue (0-0-0) 1.00E-03 6.6E-11 1.52E+07
Max Blue (0-0-255) 2.34 3.51E-09 6.67E+08
8.3.3. M2DART Display with Barco 808 Projector The M2DART is an eight-channel, wraparound, real-image, and rear-projection visual display system. The data collected in this section pertain to one of the displays/screens only.
The following data were collected at the AFRL Mesa facility. The setup parameters for the measurement were:
Screen type: 3/8” Acrylic
Screen resolution: 1280 x 1024
Screen refresh rate: 60 Hz
Color temperature: 6500 K
Overall Brightness (black level) setting: 47%
Overall Contrast setting: 58%
Eye point (distance from screen): 36”
Measurement location and angle: Center and Normal to the screen
Source: PC, gamma (RGB): 1.0
Table 8 summarizes the result of the data collection and analysis:
Table 8 Barco 808 M2DART Transfer Function Characteristics
CRT mnL mxL γL mnR mxR γR (fL) (fL) (W/sr/cm2) (W/sr/cm2)
B47 – C58 Red 6.3E-4 5.43 2.339 7.9E-11 1.09E-6 2.374 Green 5.4E-4 10.7 2.472 7.5E-11 3.19E-7 2.454 Blue 4.9E-4 0.93 2.122 7.0E-11 1.70E-9 1.3
NOTE: These characteristics are specific for this display at Brightness 56% and Contrast 95%. Any change to these settings or other setup adjustment will require a complete re-characterization of the display.
Figures 33 and 34 depict the Barco 808 M2DART luminance and radiance transfer function curves. The NVIS radiance of Blue CRT ranges from 7E-11 to 1.7E-09 W/sr/cm2. Comparing this range with

45
Table 2, the Blue CRT (Table 9) alone is only able to produce about 11% reflective NVIS radiance under FM illumination conditions. To stimulate the full range of FM illumination, some Green color needs to be added to the scene. Again, the photopic luminance is 10 to 1000 times brighter than what it needs to be. For further discussion on this topic, please refer to Section 3.3.
Figure 33 Barco 808 - M2DART Luminance Transfer Function Curves
Figure 34 Barco 808 - M2DART Radiance Transfer Function Curves
Table 9 Barco 808 M2DART Blue CRT Evaluation
Luminance NRb Radiance Ratio OCSL 1.00E-05 7.50E-11 1.33E+05
FM 1.00E-02 1.50E-08 6.67E+05 Min Blue (0-0-0) 4.9E-04 7.0E-11 7.00E+06
Max Blue (0-0-255) 0.928 1.7E-09 5.46E+08

46
8.3.4. SEOS Panoramic Display with Barco 909 Projector The SEOS panoramic display is a collimated display system that provides images at optical infinity.
The projectors form an intermediate image, sharply focused on the surface on the translucent back projection screen. Observers viewing the convex surface of the back projection screen reflected through the spherical collimating mirror see the resultant image close to optical infinity. A typical Panorama system uses 3 to 6 CRT projectors to provide up to a 225° panoramic view.
The following data were collected at the PAX Navair/AWTD MFS facility. The setup parameters for the measurement were:
Screen type: Panorama
Screen resolution: 1600 x 1400
Screen refresh rate: 60 Hz
Color temperature: 6500 K
Overall Brightness (black level) setting: 68%
Overall Contrast setting: 96%
Red Brightness: 48%, Contrast: 67%
Green Brightness: 50%, Contrast: 50%
Blue Brightness: 33%, Contrast: 64%
Eye point (distance from mirror): 135.24”
Measurement location and angle: Center and Normal to the screen
Source: Laptop PC, gamma (RGB): 1.0
Table 10 summarizes the result of the data collection and analysis:
Table 10 Barco 909 SEOS Panorama Transfer Function Characteristics
CRT mnL mxL γL mnR mxR γR (fL) (fL) (W/sr/cm2) (W/sr/cm2)
B68 – C96 Red 3.0E-4 1.01 2.355 3.2E-11 1.71E-7 2.317 Green 3.0E-4 1.31 2.569 3.3E-11 3.06E-8 2.5 Blue 3.0E-4 0.37 2.125 3.1E-11 5.51E-10 1.517
NOTE: These characteristics are specific for this display at Brightness 68% and Contrast 96%. Any change to these settings or other setup adjustment will require a complete re-characterization of the display.
Because this display system is dimmer than the previous displays, the vertical scales for luminance and radiance of the following plots have been exaggerated 10 X (zoom in) (Figures 35 and 36).

47
Figure 35 Barco 909 - SEOS Panorama Luminance Transfer Function Curves
Figure 36 Barco 909 - SEOS Panorama Radiance Transfer Function Curves
The NVIS radiance of Blue CRT ranges from 7E-11 to 1.7E-09 W/sr/cm2. Comparing this range with Table 2, the Blue CRT (Table 11) alone is only able to produce about 11% reflective NVIS radiance under FM illumination conditions. To stimulate the full range of FM illumination, some Green color needs to be added to the scene. Again, the photopic luminance is 10 to 1000 times brighter than what it needs to be. For further discussion on this topic, please refer to Section 3.3.
Table 11 Barco 909 SEOS Panorama Blue CRT Evaluation
Luminance NRb Radiance Ratio OCSL 1.00E-05 7.50E-11 1.33E+05
FM 1.00E-02 1.50E-08 6.67E+05 Min Blue (0-0-0) 3.0E-04 3.1E-11 9.68E+06
Max Blue (0-0-255) 0.37 5.51E-10 6.72E+08

48
8.4. Multi-Display Cross-Illumination Study Data (M2DART)
8.4.1. Black Level Steps
1. Set projectors to the following initial setup to B46 C95, that is: a. Brightness 46% b. Contrast 95%
2. Turn OFF all screens 3. Turn ON Screen 1 and set RGB to 0-0-0 4. Measure NRb from Screen 1 5. Turn ON Screen 2-8 and set RGB to 0-0-0 6. Measure and record NRb from Screen 1 7. Repeat for steps 2 through 6 with screens 2, 5 and 8
Data Collected (Table 12):
Table 12- Screen Black Level
Measure On Screen Black 0-0-0 On Screen
Black Level (NRB)
Screen 1 Screen 1 6.6E-11 Screens 1-8 6.6E-11 Screen 2 Screen 2 8.5E-11 Screens 1-8 8.5E-11 Screen 5 Screen 5 8.7E-11 Screens 1-8 9.3E-11 Screen 8 Screen 8 0.3E-11 Screens 1-8 0.5E-11
Comments
From the data measurement above, surrounding black screens (0-0-0) do not appear to significantly impact the black level of a given screen. Screen black level in an M2DART configuration is not meaningfully degraded by the surrounding black screens.
8.4.2. Bright Image Cross Illumination Steps
1. Turn OFF all screens 2. Turn ON and set Screen 1 to R-G-B = 0-0-0 3. Turn ON and display bright test image on Screen 2 4. Measure and record black level NRB on Screen 1 5. Goto step 3, but display the bright image on a different screen (3,5,6, and 8) consecutively. 6. Repeat step 3-5 but measure the black level for Screen 2 instead.
Data Collected (Table 13):
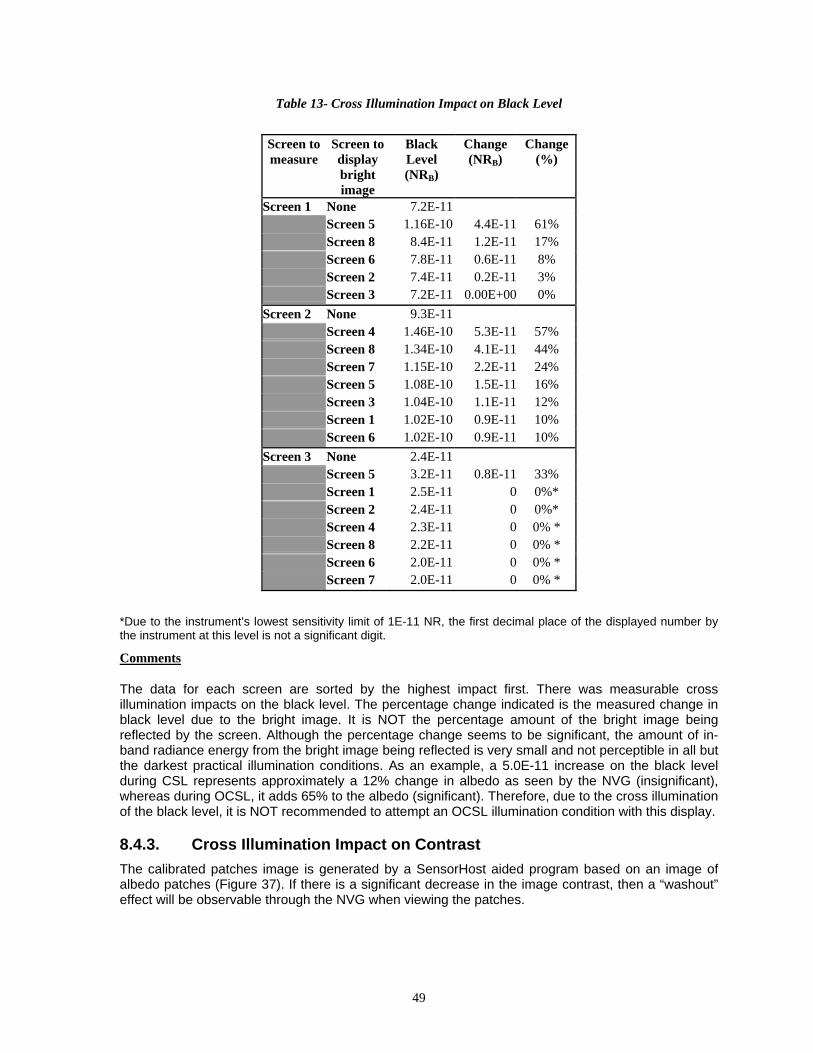
49
Table 13- Cross Illumination Impact on Black Level
Screen to measure
Screen to display bright image
Black Level (NRB)
Change (NRB)
Change (%)
Screen 1 None 7.2E-11 Screen 5 1.16E-10 4.4E-11 61% Screen 8 8.4E-11 1.2E-11 17% Screen 6 7.8E-11 0.6E-11 8% Screen 2 7.4E-11 0.2E-11 3% Screen 3 7.2E-11 0.00E+00 0% Screen 2 None 9.3E-11 Screen 4 1.46E-10 5.3E-11 57% Screen 8 1.34E-10 4.1E-11 44% Screen 7 1.15E-10 2.2E-11 24% Screen 5 1.08E-10 1.5E-11 16% Screen 3 1.04E-10 1.1E-11 12% Screen 1 1.02E-10 0.9E-11 10% Screen 6 1.02E-10 0.9E-11 10% Screen 3 None 2.4E-11 Screen 5 3.2E-11 0.8E-11 33% Screen 1 2.5E-11 0 0%* Screen 2 2.4E-11 0 0%* Screen 4 2.3E-11 0 0% * Screen 8 2.2E-11 0 0% * Screen 6 2.0E-11 0 0% * Screen 7 2.0E-11 0 0% *
*Due to the instrument’s lowest sensitivity limit of 1E-11 NR, the first decimal place of the displayed number by the instrument at this level is not a significant digit.
Comments
The data for each screen are sorted by the highest impact first. There was measurable cross illumination impacts on the black level. The percentage change indicated is the measured change in black level due to the bright image. It is NOT the percentage amount of the bright image being reflected by the screen. Although the percentage change seems to be significant, the amount of in-band radiance energy from the bright image being reflected is very small and not perceptible in all but the darkest practical illumination conditions. As an example, a 5.0E-11 increase on the black level during CSL represents approximately a 12% change in albedo as seen by the NVG (insignificant), whereas during OCSL, it adds 65% to the albedo (significant). Therefore, due to the cross illumination of the black level, it is NOT recommended to attempt an OCSL illumination condition with this display.
8.4.3. Cross Illumination Impact on Contrast The calibrated patches image is generated by a SensorHost aided program based on an image of albedo patches (Figure 37). If there is a significant decrease in the image contrast, then a “washout” effect will be observable through the NVG when viewing the patches.

50
STEPS
1. Display contrast chart image on Screen 1
2. Turn OFF Screens 2 to 8
3. Measure Screen 1 NRB for some or all 13 patches
4. Display bright test image on Screen 2
5. Measure Screen 1 NRB for some or all 13 patches
6. Repeat steps 4-6 with the bright scene repositioned to screen 5
Figure 37 Albedo patches (gray scale)
Data (Table 14):
Table 14- Cross Illumination Impact on Contrast
Chart Image On Screen
Illumination Condition
Bright Image on
Screen
Patch Pixel
(Gray)
Patch Albedo
(%)
Patch (NRB)
Change (NRB)
Screen 1 Full Moon None 016 6.3% 2.51E-10 0 Full Moon 5 016 6.3% 2.93E-10 4.2E-11 Full Moon 7 016 6.3% 2.57E-10 0.6E-11 Full Moon 8 016 6.3% 2.50E-10 0 Full Moon 2-8 016 6.3% 2.99E-10 4.8E-11

51
Comments
The data tabulated above are taken under FM illumination rendered image. Under this condition, there is no noticeable impact of cross illumination to the contrast when viewing through an NVG, nor is it indicated in the data above. Unfortunately, the CSL condition was viewed subjectively but not measured due to time constraints. When CSL image was rendered, and a bright image was displayed on the opposite screen (worst case), there was a slight increase in the NVG luminance, but not much in a way of contrast degradation or “washout.” Based on the previous black-level measurements, a 6.3% albedo during CSL would be seen by the NVG as an 18% albedo surface if the “full moon” image appears on the remaining screens at the same time. This variation is well within the range of variation common among real-world CSL illumination conditions.
8.5. Implementation Example of Rendering Equations The equations summarized below state the generalized bucket rendering equation in a form that takes into account system-specific performance constraints within the Aechelon PC-NOVA/RADIANT system. An IG-side implementation, such as this, would normally be derived by the IG developer as it requires an understanding of the limits inherent in their rendering architecture. But in this case, the color spanning allowed by the generalized form was required to support sensor in the loop testing. This derivation was provided in anticipation that the generalized form could not be supported in real time. The following are two sets of equations that mathematically describe the mapping function for Blue-Green-Red and Red-Green-Blue bucket rendering methods.
8.5.1. Blue-Green-Red color mapping: (15)
MeasuredbMnR bMnR=
MeasuredbMxR bMxR=
gMnR bMxR=
Measured MeasuredgMxR bMxR gMxR= +
rMnR gMxR=
Measured Measured MeasuredrMxR bMxR gMxR rMxR= + +
Equation 15 BGR Color Mapping Equations
8.5.2. Red-Green-Blue color mapping: (16)
MeasuredrMnR rMnR=
MeasuredrMxR rMxR=
gMnR rMxR=
Measured MeasuredgMxR rMxR gMxR= +
bMnR gMxR=
Measured Measured MeasuredbMxR rMxR gMxR bMxR= + +
Equation 16 RGB Color Mapping Equations

52
Where:
_MxR mapping maximum display radiance at this setting (w/sr/cm2)
_MnR mapping minimum display radiance at this setting (w/sr/cm2)
_MxRMeasured measured/actual maximum display radiance (w/sr/cm2)
_MnRMeasured measured/actual minimum display radiance (w/sr/cm2)
r,g,and b color prefixes for Red, Green, and Blue
8.5.3. Normalization Equations Having calculated the color mapping parameters _MxR and _MnR, the next step would be to normalize in such a way that the radiance to be rendered can be expressed in the pixel color space of 0 to 1.0 for each color. What follows is a version of the general bucket rendering equation that was derived for an IG partner during the study.
Calculate overall minimum and maximum radiance:
First, establish the overall minimum and maximum display radiance available in radiance space. These numbers will be used to normalize the radiance values to be rendered. These calculations can be performed once during a display configuration load.
(17)
min( , , )MnR rMnR gMnR bMnR= max( , , )MxR rMxR gMxR bMxR=
Equation 17 Overall minimum and maximum radiance
Calculate per color gain and bias factors:
Next, calculate the Bias and Gain factors for each color space. These calculations can be performed once during a display configuration load. These numbers will be used in implementing the color mapping algorithm, to, essentially, position each radiance to be rendered in its allotted color space (see Equation 22).
(18)
rMxR MnRrMxMxR MnR
−=
−
gMxR MnRgMxMxR MnR
−=
−
bMxR MnRbMxMxR MnR
−=
−
Equation 18 Intermediate variables

53
(19)
rMnR MnRrBiasMxR MnR
−=
−
gMnR MnRgBiasMxR MnR
−=
−
bMnR MnRbBiasMxR MnR
−=
−
Equation 19 Bias per color
(20)
1rGainrMx rBias
=−
1gGaingMx gBias
=−
1bGainbMx bBias
=−
Equation 20 Gain per color
Normalize scene radiance to be rendered:
(21) Radiance MnRr
MxR MnR−
=−
Equation 21 Per frame radiance normalization
Radiance is the IG computed NVG in-band electro-magnetic energy based on the material reflectivity signature, NVG response curve, and various illumination sources. This value is being normalized to a floating-point value of 0-1.0. This is computed for every frame.
Rendering equations per color:
The final equation in this algorithm is to be computed for every frame in real-time. The values R, G, and B are normalized in the pixel color space.
(22)
( ) ( )*R r r rBias rGain= − ( ) ( )*G r r gBias gGain= − ( ) ( )*B r r bBias bGain= −
Equation 22 Per frame color rendering equations

54
8.6. Display Characterization Data Form
DATE COMMENTS DISPLAY BRIGHTNESS ` CONTRAST EYEPOINT RESOLUTION
R G B NRb (PR-1530)
fL (PR-1530)
fL (LS-110)
NVG fL (LS-110) NOTES
0 0 0 0 0 5 0 0 10 0 0 15 0 0 20 0 0 25 0 0 30 0 0 35 0 0 40 0 0 45 0 0 50 0 0 55 0 0 60 0 0 65 0 0 70 0 0 75 0 0 80 0 0 85 0 0 90 0 0 95 0 0 100 0 0 105 0 0 110 0 0 115 0 0 120 0 0 135 0 0 150 0 0 165 0 0 180 0 0 195 0 0 210 0 0 225 0 0 240 0 0 255

55
R G B NRb (PR-1530)
fL (PR-1530)
fL (LS-110)
NVG fL (LS-110) NOTES
0 0 0 0 5 0 0 10 0 0 15 0 0 20 0 0 25 0 0 30 0 0 35 0 0 40 0 0 45 0 0 50 0 0 55 0 0 60 0 0 65 0 0 70 0 0 75 0 0 80 0 0 85 0 0 90 0 0 95 0 0 100 0 0 105 0 0 110 0 0 115 0 0 120 0 0 135 0 0 150 0 0 165 0 0 180 0 0 195 0 0 210 0 0 225 0 0 240 0 0 255 0

56
R G B NRb (PR-1530)
fL (PR-1530)
fL (LS-110)
NVG fL (LS-110) NOTES
0 0 0 5 0 0
10 0 0 15 0 0 20 0 0 25 0 0 30 0 0 35 0 0 40 0 0 45 0 0 50 0 0 55 0 0 60 0 0 65 0 0 70 0 0 75 0 0 80 0 0 85 0 0 90 0 0 95 0 0
100 0 0 105 0 0 110 0 0 115 0 0 120 0 0 135 0 0 150 0 0 165 0 0 180 0 0 195 0 0 210 0 0 225 0 0 240 0 0 255 0 0