Physics 1405 - Fun Physicist - Homefunphysicist.weebly.com/uploads/2/0/3/8/20383539/calc... · ·...
161
Modified January 4, 2015 (check reverse side of page) Page 1 of 161 Phys 2425 University Physics Workbook Part I Calculus based course, Tyler Junior College, Summer I 2013 by Gene Branum, Tom Hooten, Doug Parsons, & Jim Sizemore Tyler Junior College Acknowledgements: This workbook has been developed over a number of years by numerous collaborators whose names have been lost and forgotten. Our thanks go to those unsung heroes who have contributed to this work. Portions of this work are used by permission and/or fair use of Dr. Bob Abel (Olympic College), M. Brooks, G. Sherman, M. Broyles, A. Kumar (Collin College), The Science Source, Cenco Physics, Vernier, and AAPT. Tareleton State College in Stephenville, TX, Rocket Launch on 4/5/2013. Photo by Jim Sizemore. This work is licensed under a Creative Commons Attribution- NonCommercial-ShareAlike 3.0 Unported License . Hyperlinks work, primary web site at http://iteach.org/funphysicist/ . Offsite files at: PDF: http://funphysicist.weebly.com/uploads/2/0/3/8/20383539/calc_physics_workbook_v1.pdf Word: http://funphysicist.weebly.com/uploads/2/0/3/8/20383539/calc_physics_workbook_v1.docx
Transcript of Physics 1405 - Fun Physicist - Homefunphysicist.weebly.com/uploads/2/0/3/8/20383539/calc... · ·...

Modified January 4, 2015 (check reverse side of page) Page 1 of 161
Phys 2425 University Physics
Workbook Part I
Calculus based course, Tyler Junior College, Summer I 2013 by Gene Branum, Tom Hooten, Doug Parsons, & Jim Sizemore
Tyler Junior College
Acknowledgements: This
workbook has been developed
over a number of years by
numerous collaborators whose
names have been lost and
forgotten. Our thanks go to those
unsung heroes who have
contributed to this work. Portions
of this work are used by
permission and/or fair use of Dr.
Bob Abel (Olympic College), M.
Brooks, G. Sherman, M. Broyles,
A. Kumar (Collin College), The
Science Source, Cenco Physics,
Vernier, and AAPT.
Tareleton State College in
Stephenville, TX, Rocket Launch
on 4/5/2013. Photo by Jim
Sizemore.
This work is
licensed under a
Creative Commons Attribution-
NonCommercial-ShareAlike 3.0
Unported License.
Hyperlinks work, primary web site at http://iteach.org/funphysicist/. Offsite files at: PDF: http://funphysicist.weebly.com/uploads/2/0/3/8/20383539/calc_physics_workbook_v1.pdf Word: http://funphysicist.weebly.com/uploads/2/0/3/8/20383539/calc_physics_workbook_v1.docx

Modified January 4, 2015 (check reverse side of page) Page 2 of 161
Recommend Printing Instructions
Yes to “Front & Back (recommended)” – that is, 2 sided copies
Collate
Do not staple
Do not Hole Punch
Spiral Binding
No to Colored Paper – plain white
No to Color printing
Deliver to bookstore
Special Instructions 1. PLEASE MAKE EVERY EFFORT TO DELIVER THIS TO THE BOOKSTORE BY THE FIRST DAY OF CLASS
________
2. BINDING ON LEFT SIDE LIKE A REGULAR BOOK – NOT ON RIGHT
3. Print in black & white
4. If possible print all copies from file-don't make Xerox & copy (due to photos/graphics not copying well). 5. CANARY cardstock front and back.
6. Print so odd numbered pages are on the right.
7. Deliver one copy to <your name>, <your office> (<your mailroom>)
TJC Bookstore Information
TJC Course Name: University Physics I
TJC Course Number: PHYS 2425
Instructor's Name: <your name>
Bookstore Up-Charge (if known): $5.00
Table of Contents Lab Report Guidelines .......................................................................................... 4
Force Table (Vectors) ......................................................................................... 12
Free Fall (Constant Acceleration) ....................................................................... 13
Projectile Motion (Motion in 2 Dimensions) ......................................................... 17
Friction (Inclined Plane) ...................................................................................... 19
Atwood’s Machine (Explore F = ma) ................................................................... 22
Collisions (1D Energy & Momentum Conservation) ............................................ 25
Energy Conservation with a Spring ..................................................................... 28
2D Collisions (Momentum Conservation) ............................................................ 31
Circular Motion (Centripetal Force) ..................................................................... 33
Torque, Equilibrium, & Center of Gravity ............................................................ 35
Archimedes’ Principle (Fluids) ............................................................................ 41
Physical Pendulum (Oscillator) ........................................................................... 54
String Harmonics (Waves) .................................................................................. 56
Specific Heat of Substances ............................................................................... 66
Team Assessment Form ..................................................................................... 69
Appendix A: Table of Accepted Densities ........................................................... 71
Appendix B: Table of Specific Heats ................................................................... 72
Appendix C: Periodic Table of the Elements ...................................................... 73
Appendix D: Quick Questions ............................................................................ 74

Modified January 4, 2015 (check reverse side of page) Page 3 of 161
Appendix E: Lecture Worksheets ....................................................................... 75
Project ........................................................................................................................... 76
Moon’s Motion ............................................................................................................. 79
Planning for College .................................................................................................... 81
Penny Mass (Density) .................................................................................................. 83
Roadrunner .................................................................................................................. 85
Roadrunner Speed ....................................................................................................... 87
Supergirl’s Jump .......................................................................................................... 89
Treasure Hunt .............................................................................................................. 91
Supergirl’s Force .......................................................................................................... 93
Weighing Air ................................................................................................................ 95
Supergirl’s Energy ....................................................................................................... 97
Supergirl’s Power ........................................................................................................ 99
Supergirl’s Momentum ............................................................................................. 101
Rocket Report ............................................................................................................ 103
Yo-yo Centripetal Force ............................................................................................ 105
Moon Guns ................................................................................................................. 107
Rolling Race ................................................................................................................ 109
Yo-yo Torqure Force ................................................................................................. 111
Supergirl’s Breaks the Steeple .................................................................................. 113
Sound Resonance ....................................................................................................... 115
Fluids ........................................................................................................................... 117
Slinky Wave ................................................................................................................ 119
Doppler ....................................................................................................................... 121
Interference ................................................................................................................ 123
Interference Part II .................................................................................................... 126
Heat ............................................................................................................................. 128
Entropy ....................................................................................................................... 130
Appendix F: Study Habits & Work Ethic ........................................................... 132
Appendix G: Teamwork & Problems ................................................................ 134
Appendix H: Geometry, Trigonometry, & Vector Summary .............................. 137
Appendix I: Exponentials & Logarithms Summary ........................................... 148
Appendix J: Calculus Review ........................................................................... 152
Profits from the sale of this lab manual will go toward student activities and professional
development.
Modified January 4, 2015 (check reverse side of page) Page 4 of 161
University Physics Workbook Part I Lab Report Guidelines
Lab Supplies
1. Ruler with centimeter scale
2. Protractor
3. Pencil
4. CALCULATOR
5. Graph Paper
Student’s Lab Responsibility
1. Be on time!
2. Study lab before class – PRE-LAB ASSIGNMENTS WILL BE REQUIRED!
For example, your instructor may need to approve your data collection prior to
class.
3. Actively participate as an individual in a group.
4. Be careful with equipment.
5. Feel free to move around and talk in lab, but DO NOT DISTURB OTHERS!
6. When you leave the lab, return equipment precisely where you got it from, place
chairs under tables, and clean your work area.
Links to expanded discussion: The following is about 24 pages worth of how-to for scientific writing with links to
additional resources. I’ve attempted to condense this and more to 8 pages, however this
is a good discussion – a little light reading.
IMPORTANT NOTE: Links are active in the online version of this lab manual.
pdf version:
http://writingcenter.unc.edu/resources/handouts-demos/pdfs/Scientific%20Reports.pdf
html version:
http://writingcenter.unc.edu/resources/handouts-demos/specific-writing-
assignments/scientific-reports
Guidelines for Lab Reports
At a very basic level a lab report expresses clear thinking about a topic under
investigation. Your goal is to think, investigate, and express your investigation clearly!
We are practicing writing a research report to prepare you for your future work. No
matter what you do in the future you will be called upon to write reports, unless you’re
content to flip burgers for the rest of your life or something equally mundane. Our
practice contributes to the knowledge and skills your future will require. Classroom
thinking is, “I’m doing this because the teacher requires it.” Broader thinking is, “I’m
practicing writing skills that my future endeavors will require.”
Think of your audience. People who read research reports are interested in two
things, (1) what is the information contained in the report, and (2) are the findings valid
and legitimate. Write your report to answer these two basic questions.
A lab report generally follows the scientific method, that is, (1) research, (2) make
a hypothesis, (3) design an experiment, (4) perform the experiment, (5) analyze the
experiment to determine if it confirms or contradicts the original hypothesis, and (6)

Modified January 4, 2015 (check reverse side of page) Page 5 of 161
report your findings. Your goal is to clearly, completely, and yet concisely explain how
you followed the scientific method in performing your experiment.
A key prerequisite to a good report is to know and understand the scientific
principles underlying your experiment and why and how the experiment tests those
principles. IT IS, therefore, IMPERATIVE TO READ AND UNDERSTAND THE LAB
INSTRUCTIONS BEFORE COMING TO LAB. Understand the following:
1. What you are going to do, that is, what’s the procedure?
2. Why are we going to do it that way?
3. What are we hoping to learn from this experiment?
4. Why would we benefit from this knowledge?
Answering these questions lead you to a more complete understanding of the experiment
think about the “big picture” leading to a better lab report.
Ask questions of the lab instructor. If you don’t know an answer the instructor can
help explain it or, at least, help you figure it out.
Before the Lab
A. READ AND UNDERSTAND THE LAB INSTRUCTIONS!
B. Plan the steps of the experiment carefully with your lab partners.
C. Design a table to record your data.
D. Assign each member of the lab group a “job” and rotate that job each lab. Don’t
have somebody doing the same thing all semester.
E. EVERYBODY does the experiment. Have one person do one measurement, a
second person do the second measurement, a third person the third measurement, etc.
During the Lab
F. All members record the data in your personal lab book.
G. Record data carefully in a well organized manner.
H. Consult with your lab partners as you are performing work.
Lab Reports
I. DO YOUR OWN WORK! You may discuss this with your lab partners, however
copying will result in a zero grade, or worse, for all persons in the lab group.
Copying is a violation of academic ethics and punishment may be severe. Students
should adhere to high ethical standards.
J. The instructor may, optionally, require reports to be submitted as a lab group.
Consult your instructor or their syllabus regarding this.
K. Lab reports are due at the beginning of the next scheduled lab, however write a first
draft prior to leaving. If you have forgotten something then you can acquire what
you need. YOUR INSTRUCTOR MAY REQUIRE A REVIEW OF DATA AND
CALCULATIONS PRIOR TO LEAVING LAB OR MAY REQUIRE YOU TO
TURN IN YOU LAB NOTEBOOKS.
L. Neatness, readability, and a well-organized report is the primary requirement.
M. The prose, tables, and equations of your report must be typed.
N. Graphs and drawings may be done using pencil and straight edge, but grids must be
included and it must be to scale. Be sure to include them in the proper order. YOUR
INSTRUCTOR MAY REQUIRE HAND DRAWN GRAPHS – you need to learn to
walk before you can run, you need to be able to create hand drawn graphs before you
can create computer graphs, you may know programs insides and out, but don’t
know how to apply them to math, science, and technology problems.

Modified January 4, 2015 (check reverse side of page) Page 6 of 161
O. Use the following outline format and do not deviate from this order when writing
your lab report. You may mix typed and hand written information, however DO
NOT, for example, staple raw data to the end of the report.
Course Name and Section
Experiment Name
Date experiment was performed
Lab Partner’s Names and Duties
Title
I. Purpose A few sentences stating the quantitative
hypotheses you will be testing.
II. Theory/Introduction Discuss key equations
III. Procedure
Title Procedure Step
Use subtopic headings as
an aid to organizing
your information
Next Procedure Step
etc.
USE DIAGRAMS!
IV. Data ORGANIZE IN TABLES!
V. Graphs Hand drawn using a straight edge.
VI. Sample Calculations Provide a sample or all calculations used in the lab
VII. Results 1. These are calculations on the data.
2. ORGANIZE IN TABLES!
3. ALWAYS REPORT THEORETICAL
EXPECTATIONS!
4. ALWAYS REPORT A %ERR OR %DIFF!
5. Show the step-by-step reasoning leading to
your conclusion.
VIII. Conclusions State your step-by-step reasoning and
conclusion about each hypothesis tested and why
you believe your conclusion is reasonable.
IX. Questions Answer any questions posed in the lab instructions
DO NOT DISMANTLE THE APPARATUS UNTIL AFTER YOUR INSTRUCTOR
HAS REVIEWED (SIGNED OFF) ON YOUR DATA AND CALCULATIONS. It may
be necessary to repeat portions of your experiment.
P. Be consistent with your outline format throughout the entire report.
Q. Do not write on the back of your paper.
R. Organize your report so that there are no large gaps between topic headings.
S. General Guidelines: 1. Use correct spelling, grammar and complete sentences to express your ideas.
Word processors are very good at this.
2. Be complete and clear, yet concise. Hack writers typically bloat their bloat
their narratives with excessive and repetitious wordiness. Unfortunately in
school you are required to write an n-page report which encourages this. It’s

Modified January 4, 2015 (check reverse side of page) Page 7 of 161
time to break that habit and write with meaning and clarity – not merely write to
fill space.
3. Avoid repetition.
4. Be consistent with your terminology. If a word or phrase was used in one part
of your report, use the same word or phrase for the entire report.
5. Carefully prepare your report.
6. Make your report easy to follow.
7. Be specific.
8. Explain your terms – even if they were in the lab instructions.
9. Avoid jargon.
10. Pretend you’re writing for a student in another section of this course and write in
a way that student may understand your work.
T. Title: 1. Is the title brief yet clear enough to identify the experiment?
2. Does it express all the features of interest?
U. Purpose: 1. The purpose and conclusion are the most important parts of you reports.
2. State the hypotheses you will be quantitatively testing.
3. As you write the remainder of you report make sure you show the step-by-step
reasoning processing leading to your conclusions for each and every
hypothesis you are testing.
4. What is your testable hypothesis?
a. Not a hypothesis: There is significant relationship between the temperature
of a solvent and the rate at which a solute dissolves.
b. Hypothesis: As temperature increases the rate at which a solute dissolves
increases.
5. A purpose goes one step further; for example, determine the mathematical
relationship between the temperature of the solvent and rate of solute
dissolution.
6. What leads you to believe your hypothesis is supported by evidence? Even
outside-the-lab experience may be used. For example, you note that sugar
seems to dissolve faster in hot water than in cold.
7. Justify the experimental approach to test your hypothesis.
8. What is the rationale of the experiment as it relates to your hypothesis?
9. In a short paragraph list with short discussion (phrase or sentence) the theories
you intend to confirm – do not list equations.
10. Insure your list of theories or questions investigated are complete.
11. What is the experimental objective? Why is it important to do this experiment?
12. Think about what the experiment is testing and list the theories being tested even
if not mentioned in the lab manual.
13. Indicate the main topics to be tested.
14. Outline the purpose, scope, and approach of the experiment.
15. Brevity is important. Mention or list items – don’t thoroughly discuss them.
You’ll discuss them completely in the next section.
16. Are there details which could be reduced, put in an appendix, or omitted?
V. Theory/Introduction:

Modified January 4, 2015 (check reverse side of page) Page 8 of 161
1. Demonstrate that you understand the context for this experiment. Using the
dissolution rate of a solute as has been our example, you may recall lecture
discussions about polar molecules that motivate your hypothesis.
2. List equations pertaining to theories being tested, the theories mentioned in the
purpose, and thoroughly (yet concisely and clearly) discuss those theories and
equations.
3. Discuss how your experiments will confirm or deny those theories and what
error analysis you will perform.
4. Define symbols and abbreviations the first time they are used.
5. Discuss the applicability of prior work with adequate references.
6. Your experimental approach needs to be adequate. In general, attempt
experiments at the extremes of the capabilities of the instrument and at least one
attempt in the middle. In general this will require at least three measurements
and spread measurements out evenly.
W. Procedure: 1. You must describe your procedure in sufficient detail that your experiment may
be reproduced.
2. Be precise, but stay relevant. Ask yourself, “Would it make a difference if a
part were a different size or different material?”
3. Provide enough details to prevent the experiment from going awry if someone
else tries to perform it.
4. Explain your rationale. If you capped a test tube after adding solute, why did
you do that?
5. What is your control experiment? Did other researchers obtain specific results
performing the experiment under specific conditions? You may repeat this as a
control. Or, are you comparing your results to an existing theory?
6. Describe the steps like a story in chronological order. Especially if order is
important to the procedure, present the steps in order.
7. Don’t use the recipe approach. Don’t, for example, specify amounts such as
50 ml. Instead state, “Measure the water used in the experiment, record this in
the data table, and add it to the beaker.”
8. Usually we want to use past tense and third person reporting. Since first person
is usually more readable, at this stage, we won’t be particular about this.
Remember, however, in the future this distinction may be important.
X. Diagrams: 1. Draw diagrams neatly using a straightedge.
2. Identify the equipment used and label the parts. Include them in your report in
the correct order.
Y. Data Tables: 1. ALWAYS USE TABLES! The strength of a table is the ability to supply large
amounts of exact data.
2. NEVER REPORT DATA IN PARAGRAPH FORM!
3. Use data tables to identify and organize your data and information.
4. Choose a good clear descriptive title for your table.
5. Number your table.
6. Arrange the table so readers read vertically, not horizontally. Have a header row
and then data in columns.

Modified January 4, 2015 (check reverse side of page) Page 9 of 161
7. Center numbers in a column or line up on the decimal point.
8. Be sure to identify the data collected with the appropriate units of measurement
in these tables.
9. Use clear descriptive captions that are easily identifiable.
10. Round to 3 sig. figs. or more such that the final result is accurate to 3 sig. figs.
11. If you have few measurements and few calculations, sometimes it makes more
sense to report data and results together. This is acceptable, however if
neatness, organization, and clarity are improved, report data and results
separately.
Z. Graphs: 1. Most of the time data is in the form of a response variable as a function of the
independent variable. Data in this form is plotted in a graph. Always graph data
if it is in this form.
2. The strength of a graph is the ability to dramatically illustrate trends. Note the
strength of tables is presentation of exact information. A graph trades exactness
for illustrative ability. A graph helps readers better understand your results.
3. A beginner problem is not making graphs big enough. Use an entire page for
your graphs AND make sure your data consumes most of the page.
4. What is the message the graph is attempting to convey?
5. Identify the graph with a clear descriptive title.
6. Number your graph.
7. Use Graph Paper.
8. Use a French curve or ruler to connect the dots or mark the best fit line.
9. Identify the quantity being graphed along each axis (force, distance, etc.)
10. Identify the unit of measurement of each quantity graphed.
11. The independent variable (what you set) goes on the horizontal axis and the
dependent variable (what your measure) goes on the vertical axis.
12. Clearly mark the scale of measurement along the x- and y- axes.
13. Insure the scale is uniform.
14. Start the scale from (0,0). Choose scales of 1, 2, 5, 10, 20, 50, 100, 500, or
1000 units per division. Do not, for example, use units of 3, 7, 11, etc. units per
division.
15. Write the title, quantity, measurement information, and units in the margin -
NOT INSIDE THE GRAPH GRID.
16. Denote the experimentally obtained data on the graph by small, precise dots.
17. Keep it simple. Draw three separate graphs, for example, rather than three
overlying and confusing lines on a solitary graph.
18. Ask yourself if the best-fit line must go through the origin or not?
19. If more than one graph is placed on a grid, be sure to CLEARLY identify each
curve along with the scale of measurement that applies to that curve, e.g. color
code and key.
AA. Sample Calculations: 1. Write all the general formulae you are applying, and then give an example
calculation for each formula using experimental data. Show only a single
example for each formula.
2. Indicate the units on your calculations
3. Calculate percent difference or error.
4. Use lined paper and show only one calculation per line.

Modified January 4, 2015 (check reverse side of page) Page 10 of 161
5. ALLOW ADEQUATE SPACE BETWEEN CALCULATIONS SO THAT
THEY CAN BE EASILY READ!
BB. Results: 1. Summarize data with calculated averages, slope of line, % Err, % Dev, etc.
2. ALWAYS TABULATE if possible. Don’t write, for example, “R1 was 50 ,
R2 was 50 , measured Rs was 101 , the calculated Rs was 100 , and the
% Err was 1.00%. For the second experiment, R1 was 40 , R2 was 60 ,
measured Rs was 98 , the calculated Rs was 100 , and the % Err was 2.00%,
…” Use tables instead as shown in the following example:
R1 () R2 ()
Theory
Rs = R1 + R2
()
Measured
Rs () % Err
50 50 100 101 1%
40 60 100 98 2%
.
.
.
.
.
.
.
.
.
.
.
.
.
.
.
3. Create your own well organized tables. This is the art form of learning to better
report scientific information and you only learn by doing.
4. If possible, graph your tabulated information. Some reviewers demand that
you do not replicate tabulated information in a graph and vice-versa. That is not
the case for our college’s labs and especially at the student’s level of math skills.
Tabulate the information you are graphing.
5. Write a clear descriptive summary for each table and graph.
6. Always report % Err or % Diff (whichever is applicable)
7. Always compare experiment to any and all applicable theories even if not
specified in the objective or purpose statement.
8. Be clear and complete, yet concise.
9. Most important: How do your results confirm or contradict your original
hypotheses?
10. Do you observe trends?
11. Do not make conclusions.
CC. Conclusion/Discussion: 1. This is the most important part of the report. In this section you will summarize
your purpose, the hypotheses tested, argue the validity of the methods used
to confirm or contradict the hypotheses, did you confirm or contradict your
hypotheses, and the implications of your findings.
2. Use your best communication skills to convey your message. If reasoning is
difficult to follow it detracts from the report.
3. Write in paragraph form using complete sentences.
4. Review the purpose of the experiment to help you formulate your conclusions.
Paraphrase a restatement of the purpose.
5. Explain whether the data supports or contradicts the hypotheses and support this
with your evidence.
6. Be clear and complete, yet concise. The extremes of too much brevity and
excessive verbosity are to be avoided.

Modified January 4, 2015 (check reverse side of page) Page 11 of 161
7. Facts, arguments, and conclusions need to be technically valid and accurate.
8. Avoid bias and guesswork.
9. Acknowledge anomalous data, or deviation, from expectations.
10. If you should have done a better experiment, be honest, however since your
results are reviewed before completion of the lab we should not encounter this.
You will be penalized for incomplete labs and doubly penalized for dishonesty.
11. If your experiment had a weakness, be precise about that weakness, why and
how that weakness affected your data, and what you would do to eliminate that
weakness. Avoid lame excuses like human error, it was the second Tuesday of
the month, etc.
12. What was this experiment about, what are the findings and implications, and
why do they matter?
13. From your results, connect the dots clearly, completely, and concisely leading
to your conclusion about all hypotheses tested.
14. Relate your findings to previous work including lecture discussions. Present
your work in context.
15. Do your results support or not support your expectations (theory)?
16. Include possible reasons for any percent difference or error obtained in the
experiment.
17. Lastly, what are the implications of this work.
DD. Questions: 1. Answer ALL the questions raised in the purpose, introduction, and
theory/introduction sections.
2. Restate the question.
3. THIS IS NOT A SUBSTITUTE FOR A CONCLUSION!
4. Explain your reasoning thoroughly including using the SOLVE Method
(Appendix B).
5. Use your best communication skills to convey your message. If reasoning is
difficult to follow it detracts from the report.
6. Write in paragraph form using complete sentences.
7. Be clear and complete, yet concise. The extremes of too much brevity and
excessive verbosity are to be avoided.
8. Facts, arguments, and conclusions need to be technically valid and accurate.
Lab Grades
1. Lab reports are evaluated on content, technical validity, organization, and
presentation of information and neatness. This reflects the quality of your work!
2. I will end with the statement I started with: At a very basic level a lab report
expresses clear thinking about a topic under investigation. Your goal is to
think, investigate, and express your investigation clearly!

Modified January 4, 2015 (check reverse side of page) Page 12 of 161
University Physics Workbook Part I Force Table (Vectors)
Forces are an important part of physics and the world around us. Forces keep our
feet on the ground, help us to move around the planet, and allow us to do other wonderful
things – like ride a bike. Forces are a defined in physics as a vector quantity. That is to
say they have a magnitude and a direction. In this lab you will study forces and,
hopefully, better understand force and equilibrium (when forces sum to zero) concepts.
Note: When the purpose says something like “investigate,” “study,” etc., it’s actually
saying to test the theory – confirm whether or not it agrees with experiments.
Purpose:
To experiment with the treatment of forces as vectors.
Procedure:
According to Newton’s first law of motion, a body in motion
will maintain its condition of motion unless acted upon by unequal
forces. Therefore, if an object is in equilibrium, the vector sum of
the forces acting on the object must be zero.
The body in our experiment will be the ring at the center of a
force table. We will produce forces on the ring by hanging masses
from it in various directions. The force which will produce
equilibrium (called the equilibrant force) shall be determined
experimentally and compared with that determined analytically by
treating force as a vector. Equilibrium, is achieved when the ring is
centered on the force table.
Due to the presence of friction in the pulleys, small amounts
of mass could be added or subtracted from the equilibrant measurement and small
changes in pulley’s position are possible without any noticeable effect; the ring does not
move. This will be a source of error and should be addressed in your conclusion.
Find experimentally the mass which must be added to produce equilibrium for
each of the following cases and determine its direction as outlined above:
1. 500g at 0°, 300g at 90°
2. 400g at 0°, 600g at 140°
3. 300g at 0°, 400g at 120°, 600g at 310°
Then, work each problem mathematically to determine the equilibrant force.
Work one problem per page. For each problem, neatly construct a force diagram
showing the given force vectors, the measured equilibrant, and the calculated
resultant. Show all work in an orderly and logical progression. Find the percent
error in each case by using the following formula:

Modified January 4, 2015 (check reverse side of page) Page 13 of 161
University Physics Workbook Part I Free Fall (Constant Acceleration)
Free Fall in a Gravitational Field
All things must fall to the Earth. We know this is due to gravity and we know that it
happens in about the same manner all over the world. But, how fast do we fall? If we
assume that the resistance of the air around us is negligible, how fast would some object
fall under the influence of gravity?
Purpose:
Show that the acceleration due to gravity near the surface of the Earth is constant and
to determine its value.
Procedure:
Your instructor has set up the Behr Free-Fall apparatus and demonstrated its use.
Using the high-voltage spark timer and the spark-recording tape, make a record of the
position of the falling plummet at 1/60 second intervals for at least twenty intervals.
Measure the position of each spark dot using a meter stick. Record this data under the
position column in the data table.
Some groups will “beta” test two alternative procedures. The first is using the
Vernier sonic position sensor to record distance and time. The second is to drop balls
from known heights and record distance and time. We are in the process of determining
the best labs for future semesters.
Subtract each of the position readings from the position reading immediately
preceding it to find ∆x. Record ∆x1, ∆x2, ∆x3, etc. (∆x1 = x3 - x2).
Divide the ∆x intervals by the 1/60 second time interval to calculate the velocity
of each of the ∆x intervals. . Record these values in the data table.
Graphical Analysis:
Plot a velocity vs. time graph. The slope of the velocity-time graph, , is
equal to the acceleration of the falling plummet. Assuming the acceleration due to
gravity near the surface of the Earth to be 9.80 m/s2, find the percent error.
Plot a position vs. time graph. The slope of the position-time graph,
,
represents the velocity of the plummet at a given instant in time. The instantaneous
velocity is determined by finding the slope of the tangent to the curve at a given instant.
Determine graphically from your position-time graph the velocity of the plummet at the
11.5 time interval.
Compare the calculated value of the velocity at the 11.5 sec. instant with the velocity
recorded in the data table during the 12th
time interval. The recorded velocity, being
found by
, is the velocity for the interval and should approximate the instantaneous
velocity at the 11.5 instant.
From your data, determine the velocity at the 11.5 sec. time interval by finding
the midpoint of that velocity time interval. Compare the graphically determined velocity
to the velocity from you data for the 11.5 sec. time interval and find the percent
difference.

Modified January 4, 2015 (check reverse side of page) Page 14 of 161
Data Table:
Reading Time (s) Position (m) x (m) V (m/s)
1
2
3
4
5
6
7
8
9
10
11
12
13
14
15
16
17
18
19
20

Modified January 4, 2015 (check reverse side of page) Page 15 of 161

Modified January 4, 2015 (check reverse side of page) Page 16 of 161

Modified January 4, 2015 (check reverse side of page) Page 17 of 161
University Physics Workbook Part I Projectile Motion (Motion in 2 Dimensions)
To predict where a ball will land on the floor when it is shot off a table at some angle
above the horizontal, it is necessary to first determine the initial speed (muzzle velocity)
of the ball. This can be determined by shooting the ball horizontally off the table and
measuring the vertical and horizontal distances through which the ball travels. Then, the
initial velocity can be used to calculate where the ball will land when the ball is shot at an
angle.
Purpose:
To predict and verify the range of a ball launched at an angle. The initial velocity of
the ball is determined by shooting it horizontally and measuring the range and the height
of the launcher.
Materials:
C-Clamp Target Paper with Carbon Paper
Projectile Launcher Projectile
Plumb - Bob Meter Stick
Some Preliminary Background Information:
Horizontal Initial Velocity
For a ball shot horizontally off a table with an initial speed, v0, the horizontal
distance traveled by the ball is given by x = v0t, where t is the time the ball is in the air.
Air friction is assumed to be negligible.
The vertical distance the ball drops in time t is given by
.
The initial velocity of the ball can be determined by measuring x and y.
Initial Velocity At An Angle
To predict the range, x, of a ball shot off with an initial velocity at an angle, θ, above the
horizontal, first predict the time of flight using the equation for the vertical motion:
Where y0 is the initial height of the ball and y is the position of the ball when it hits the
floor. Then use to find the range.
Procedure:
Initial Velocity of the Ball
Put the plastic ball into the projectile launcher and cock it to the long-range
position. Fire one shot to locate where the ball hits the floor. At this position, tape a
piece of white paper to the floor. Place a piece of carbon paper (carbon side down) on
top of this paper. Do not tape it down. When the ball hits the floor, it will leave a mark
on the white paper. Remove the tape when the experiment is complete.
Fire at least five shots (for more uniform results, pull the string perpendicular to
the launcher.)
Measure the vertical distance from the bottom of the ball as it leaves the barrel
(this position is marked on the side of the barrel) to the floor. Record this distance as y in
your data table.

Modified January 4, 2015 (check reverse side of page) Page 18 of 161
Use a plumb – bob to find the point on the floor that is directly beneath the release
point on the barrel. Measure the horizontal distance along the floor from the release
point to the point that you determine to be the average of the points at which the ball hits
the floor. Record this as the horizontal distance, x, in your data table.
Using the vertical distance and the horizontal distance, calculate the time of flight
and the initial velocity of the ball. Repeat this procedure for the short range and the
medium range positions.
Range of the Ball Shot at an Angle
Adjust the angle of the projectile launcher to 60⁰.
Shoot the ball at least ten times with each of the velocities, vs, vm, and vl.
Choose a single point to represent the average position of the projectile when shot
at vs, vm, and vl.
Using the initial velocities, vs, vm, and vl, found in the first part of this experiment
and the vertical heights from which the ball is shot, calculate the new times of flight and
horizontal distances.
Abbreviated Data Tables – does not include individual points. What does your data table
need to look like to collect individual data point, calculate mean, and calculate errors?:
Table A: Determining Initial Velocity
Launch Position y (m) x (m) v (m/s)
Short
Medium
Long
Table B: Confirming the Predicted Range
Trials Height
(m)
Launch
Angle
(θ)
Initial
Velocity
(m/s)
Time of
Flight
Cal. (s)
Range,
xc cal.
(m)
Range,
xe exp.
(m)
% Diff.
Short
Medium
Long
Modified January 4, 2015 (check reverse side of page) Page 19 of 161
University Physics Workbook Part I Friction (Inclined Plane)
Frictional resistance to the relative motion of two solid objects is usually
proportional to the force which presses the surfaces together as well as the roughness of
the surfaces. Since it is the force perpendicular or "normal" to the surfaces which affects
the frictional resistance, this force is typically called the "normal force" and designated
by N.
Purpose:
To determine the static and kinetic coefficients of friction between a wooden block and
an inclined plane.
Materials:
Mass set Pulley
Wooden block Triple beam balance
Inclined plane string
Some Preliminary Questions:
Draw a free-body diagram of the system. From the diagram, can you see a
relationship between the block and the hanging mass?
Procedure:
Part I: Static and Kinetic Friction
When the block is placed on an inclined plane, a force Fd, acts down the plane
trying to pull the block down the plane, but a frictional force, f, opposes Fd. However, if
the angle θ that the incline makes with the horizontal is increased, the block will
eventually slide down the plane. When this occurs, we can write the following equation:
We are concerned with two frictional forces – the static frictional force, fs, which
tends to keep the block from moving from rest and the kinetic frictional force, fk, which
tends to retard the motion of the block after it has started moving.
Static Friction:
If the block is placed on the inclined plane and the angle θ is increased slowly, the
block will eventually move. Thus
Equation 1
But what are these two forces? Can we break them down into simpler terms that are
familiar to us – like mass and gravity? The answer of course is yes. Recalling from
Newton’s second law; force is equal to the mass times the acceleration of that mass – in
this case gravity. So we can write the following:
Equation 2
Where we have taken into account the angle of the incline. If you draw a free-body
diagram, you can see that this is part of the normal force acting on the block - the y-
Modified January 4, 2015 (check reverse side of page) Page 20 of 161
component to be exact. This leads us to the conclusion that the x-component must relate
to the frictional force in some way, so;
Equation 3
Where we have included the coefficient of static friction – the very thing we are
looking to find! If we now take equations 2 and 3 and substitute them in to equation 1 we
can create an expression involving things we can measure to find the coefficient of static
friction!
Equation 4
Solving this equation for μs is simple and yields a simple relation involving the
tangent of the angle. Notice that the mass is not important! What does this mean for the
coefficient of static friction?
Kinetic Friction:
In a similar set-up to that of the static friction experiment, the coefficient for kinetic
friction can also be found. If the block is tapped lightly as the angle θ is increased, the
block will eventually slide down the plane with a constant velocity. Thus we can write
the following:
Equation 5
Notice how this equation looks strikingly similar to equation 1 from earlier? This is
a property we like to call symmetry. When you have symmetry, you can cut out a lot of
extra steps – making things much simpler. Since equation 5 looks like equation 1, we
can correctly assume that the solution for the coefficient of kinetic friction will look
similar to that for the coefficient of static friction. So, using the same reasoning as above,
we can conclude that
Equation 6
Which allows us to calculate the coefficient of kinetic friction between the block and
the inclined plane.
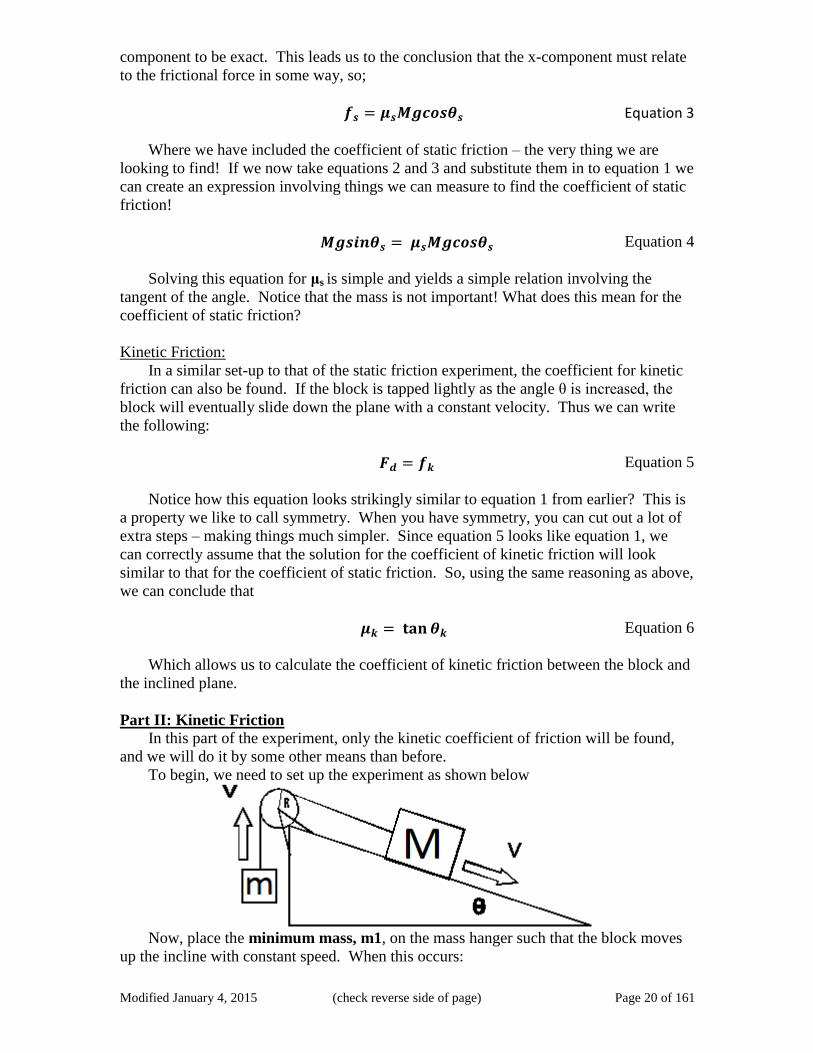
Part II: Kinetic Friction
In this part of the experiment, only the kinetic coefficient of friction will be found,
and we will do it by some other means than before.
To begin, we need to set up the experiment as shown below
Now, place the minimum mass, m1, on the mass hanger such that the block moves
up the incline with constant speed. When this occurs:

Modified January 4, 2015 (check reverse side of page) Page 21 of 161
Equation 7
Now, place the maximum mass, m2, on the mass hanger that will allow the block to
move down the incline with constant speed. When this occurs:
Equation 8
With these two equations, we can come up with a single expression for the
coefficient of kinetic friction by simply substituting equation 8 into equation 7. Show
your work for this on your calculations page. Now that we have two values for the
coefficient of kinetic friction, we can compare them. Use the percent difference
calculation to compare the values of the coefficient of kinetic friction that you got from
Part I and Part II.
Conclusion:
Make sure to draw free-body diagrams for all parts of the lab, as well as show all
calculations used to find the coefficients of friction. Pay close attention to the differences
in Part I and Part II – how are the expressions used to find the coefficient of kinetic
friction similar? How are they different? Is one way better than the other? Why or why
not? Calculate a percent difference between the two.

Modified January 4, 2015 (check reverse side of page) Page 22 of 161
University Physics Workbook Part I Atwood’s Machine (Explore F = ma)
Atwood’s Machine
A classic experiment in physics is the Atwood’s Machine: Two masses on either side
of a pulley connected by a light string. When released, the heavier mass will accelerate
downward while the lighter one accelerates upward at the same rate. The acceleration
depends on the difference in the two masses as well as the total mass.
In this lab, you will determine the relationship between the two factors which
influence the acceleration of an Atwood’s machine using a Photogate for measuring the
acceleration.
Purpose:
Use a Photogate to study the acceleration of an Atwood’s machine.
Determine the relationships between the masses on an Atwood’s machine and the
acceleration.
Materials:
Computer Vernier Photogate with pulley
Vernier computer interface Mass set
Logger Pro string
Some Preliminary Questions:
1) If two equal masses are suspended from either end of a string passing over a
pulley, what kind of motion do you expect to occur? Why?
2) For an Atwood’s machine, how would you expect the acceleration to change if
you:
3) Move mass from one side to the other, keeping the total mass constant?
4) Gradually increase the mass of both sides?
5) Why do the two masses have the same acceleration?
6) Draw a free-body diagram of the left side mass. Draw another FBD of the right
side mass. Include all forces acting on each mass.
Procedure:
Part I Constant Total Mass
1) For this part of the experiment, you will keep the total mass used constant, but
move masses from one side to the other. The difference in masses changes.

Modified January 4, 2015 (check reverse side of page) Page 23 of 161
2) Set up the Atwood’s machine. Be sure the heavier mass can move at least 40 cm
before hitting the floor (or table top).
3) Connect the Photogate with the pulley to DIG/SONIC 1 of the interface.
4) Open the file indicated on the whiteboard at the front of the class. A graph of
velocity vs. time will be displayed.
5) Arrange a collection of masses totaling 200g on m2 and a 200g mass on m1. What
is the acceleration of this combination? Record your values for mass and
acceleration in a data table.
6) Move 5g from m2 to m1. Record the new masses in the data table.
7) Position m1 as high up as it can go. Click the collect button to begin data
collection. Steady the masses so they are not swinging. Wait one second and
release the masses. Catch the masses before they hit the floor or the other mass
strikes the pulley.
8) Click the examine button and select the region of the graph where the velocity
was increasing at a steady rate. Click the linear fit button to fit the line y=mx+b
to the data. Record the slope, which is the acceleration, in the data table.
9) Continue to move the masses from m2 to m1 in 5g increments, changing the
difference between the masses, but keeping the total constant. Repeat steps 6-7
for each mass combination. Repeat this step until you get at least five different
combinations.
Part II Constant Mass Difference
10) For this part of the experiment, you will keep the difference in mass between the
two sides of the Atwood’s machine constant and increase the total mass.
11) Put 120g on m1 and 100g on m2.
12) Repeat steps 6-7 to collect data and determine the acceleration.
13) Add mass in 20g increments to both sides, keeping a constant difference of 20
grams. Record the resulting mass for each combination in a data table. Repeat the
procedure for each combination of mass until you have at least five different
combinations.
Data Table
An example of what your data table should look like is given below.
Part I: Total Mass Constant
Trial m1(g) m2(g) Accelerat
ion (m/s2)
Δm (g) mT (g)
1
…
Analysis
For each trial, calculate the difference between m1 and m2. Enter the result in a
column labeled Δm.
For each trial, calculate the total mass in grams. Enter the result in a column labeled
mT.
Disconnect all sensors and choose New from the File menu. Plot a graph of
acceleration vs. Δm, using the Part I data. Based on your analysis of the graph, what is
the relationship between the mass difference and the acceleration of an Atwood’s
machine?
Modified January 4, 2015 (check reverse side of page) Page 24 of 161
Plot a graph of acceleration vs. total mass, using the Part II data. Based on your
analysis of the graph, what is the relationship between total mass and the acceleration of
an Atwood’s machine?
Develop a single expression for the acceleration of an Atwood’s machine, combining
the results of the previous two steps in the analysis.
Extensions for Developing Your Conclusion
Draw another free-body diagram for some mass m1 and m2. Using these diagrams,
apply Newton’s second law to each mass. Assume that the tension is the same on each
mass and that they have the same acceleration. From these two equations, find an
expression for the acceleration of m1 in terms of m1, m2, and g. Compare the expression
to your result in step 5 of the analysis.
For each of the experimental runs you made, calculate the expected acceleration
using the expression you found with Newton’s second law of motion and the specific
masses used. Compare these figures with your experimental results using either a percent
difference or percent error calculation. Are the experimental acceleration values low or
high? Why?
Some other questions to consider when writing your conclusion: Could an unknown
mass be determined using an Atwood’s machine? How does the force exerted upward by
the pulley change as the system begins accelerating? Why? How does the tension in the
string change as the masses start to move? Or does it?

Modified January 4, 2015 (check reverse side of page) Page 25 of 161
University Physics Workbook Part I Collisions (1D Energy & Momentum Conservation)
The collision of two carts on a track can be described in terms of momentum
conservation and, in some cases, energy conservation. If there is no net external force
experienced by the system of two carts, then we expect the total momentum of the system
to be conserved. This is true regardless of the force acting between the carts. In contrast,
energy is only conserved when certain types of forces are exerted between the carts.
Collisions are classified as elastic (kinetic energy is conserved), inelastic (kinetic
energy is lost) or completely inelastic (the objects stick together after collision).
Sometimes collisions are described as super-elastic, if kinetic energy is gained. In this
experiment you can observe most of these types of collisions and test for the conservation
of momentum and energy in each case.
Purpose:
• Observe collisions between two carts, testing for the conservation of momentum.
• Measure energy changes during different types of collisions.
• Classify collisions as elastic, inelastic, or completely inelastic.
Materials:
Computers Dynamics cart track
Vernier computer interface Dynamics carts (2)
Logger Pro
Two Vernier Motion Detectors
Procedure
1) Measure the masses of your carts and record them in your data table. Label the
carts as cart 1 and cart 2.
2) Set up the track so that it is horizontal. Test this by releasing a cart on the track
from rest. The cart should not move.
3) Practice creating gentle collisions by placing cart 2 at rest in the middle of the
track, and release cart 1 so it rolls toward the first cart, magnetic bumper toward
magnetic bumper. The carts should smoothly repel one another without physically
touching.
4) Place a Motion Detector at each end of the track, allowing for the 0.15 m
minimum distance between detector and cart. Connect the Motion Detectors to
the DIG/SONIC 1 and DIG/SONIC 2 channels of the interface. If the Motion
Detectors have switches, set them to Track.
5) (Optional) Open the file “18 Momentum Energy Coll” from the Physics with
Vernier folder.
6) Click “collect” to begin taking data. Repeat the collision you practiced above and
use the position graphs to verify that the Motion Detectors can track each cart
properly throughout the entire range of motion. You may need to adjust the
position of one or both of the Motion Detectors.
7) Place the two carts at rest in the middle of the track, with their Velcro bumpers
toward one another and in contact. Keep your hands clear of the carts and click
“Zero”. Select both sensors and click “ok”. This procedure will establish the same
coordinate system for both Motion Detectors. Verify that the zeroing was
successful by clicking “collect” and allowing the still-linked carts to roll slowly

Modified January 4, 2015 (check reverse side of page) Page 26 of 161
across the track. The graphs for each Motion Detector should be nearly the same.
If not, repeat the zeroing process.
Part I: Magnetic Bumpers
8) Reposition the carts so the magnetic bumpers are facing one another. Click
“collect” to begin taking data and repeat the collision you practiced in Step 3.
Make sure you keep your hands out of the way of the Motion Detectors after you
push the cart.
9) From the velocity graphs you can determine an average velocity before and after
the collision for each cart. V10 = original velocity of cart 1, V20 = original velocity
of cart 2, V1f = final velocity of cart 1, and V2f = final velocity of cart 2. To
measure the average velocity during a time interval, drag the cursor across the
interval. Click the Statistics button to read the average value. Measure the average
velocity for each cart, before and after collision, and enter the four values in the
data table. Delete the statistics box.
10) Repeat Step 9 as often as required to obtain reliable data. How much is that?
Record the velocities in your data table.
Part II: Velcro Bumpers
11) Change the collision by turning the carts so the Velcro bumpers face one another.
The carts should stick together after collision. Practice making the new collision,
again starting with cart 2 at rest.
12) Click “collect” to begin taking data and repeat the new collision. Using the
procedure in Step 9, measure and record the cart velocities in your data table.
13) Repeat the previous step as a second run with the Velcro bumpers.
Part III: Velcro to Magnetic Bumpers
14) Face the Velcro bumper on one cart to the magnetic bumper on the other. The
carts will not stick, but they will not smoothly bounce apart either. Practice this
collision, again starting with cart 2 at rest.
15) Click “collect” to begin data collection and repeat the new collision. Using the
procedure in Step 9, measure and record the cart velocities in your data table.
16) Repeat the previous step as a second run with the Velcro to magnetic bumpers.
Data Tables Mass of cart 1 (kg) Mass of cart 2 (kg)
Run V1o (m/s) V2o (m/s) V1f (m/s) V2f (m/s)
.
.
.
.
.
.
.
.
.
.
.
.
.
.
.
Run P1o (kg m/s) P2o (kg m/s) P1f (kg m/s) P2f (kg m/s) PTo (kg m/s) PTf (kg m/s) Err
.
.
.
.
.
.
.
.
.
.
.
.
.
.
.
.
.
.
.
.
.
.
.
.

Modified January 4, 2015 (check reverse side of page) Page 27 of 161
Run E1o (J) E2o (J) E1f (J) E2f (J) ETo (J) ETf (J) Err
.
.
.
.
.
.
.
.
.
.
.
.
.
.
.
.
.
.
.
.
.
.
.
.
ANALYSIS
1) Determine the momentum (P = mv) of each cart before the collision, after the
collision, and the total momentum before and after the collision (see Step 9 above
for meaning of subscripts). Calculate the error of the total momentum comparing
before and after the collision. What is the sensible error statistic to use? Enter the
values in your data table.
2) Determine the kinetic energy (E = ½ mv2) for each cart before and after the
collision. Calculate the error of the total energy comparing before and after the
collision. Enter the values in your data table.
3) If the total momentum for a system is the same before and after the collision, we
say that momentum is conserved. If momentum were conserved, what would be
the error in total momentum?
4) If the total kinetic energy for a system is the same before and after the collision,
we say that kinetic energy is conserved. If kinetic energy were conserved, what
would be the error in total kinetic energy?
5) Inspect the momentum error. Even if momentum is conserved for a given
collision, the measured values may not be exactly the same before and after due to
measurement uncertainty. The error should be small. Is momentum conserved in
your collisions?
6) Repeat the preceding question for the case of kinetic energy. Is kinetic energy
conserved in the magnetic bumper collisions? How about the Velcro collisions? Is
kinetic energy consumed in the third type of collision studies? Classify the three
collision types as elastic, inelastic, or completely inelastic.

Modified January 4, 2015 (check reverse side of page) Page 28 of 161
University Physics Workbook Part I Energy Conservation with a Spring
When a spring is stretched a distance d from its equilibrium position, work has been
done on the spring. That work is stored in the spring as elastic potential energy, given by
the following equation:
The constant k is a property of the spring. It is a measure of how much force is
required to stretch the spring. For these springs, the average value of k is about 9.5 N/m.
When the spring is hanging vertically, as in the setup for our lab today, the spring
also has gravitational potential energy given by the following equation:
The height h will be measured as a distance above the tabletop.
When the spring in our experiment is stretched and released, it undergoes simple
harmonic motion. At any point in the oscillation, if we sum all of the energy of the
spring, it is a constant value.
But, at the top of its oscillation, it stops momentarily before it falls back down. At
the bottom of its oscillation, it stops momentarily before it is pulled back up. Thus the
kinetic energy at each of these positions is zero. The potential energies still exist at these
points.
Purpose:
To experimentally test the principle of conservation of energy where gravitational
and spring forcers are involved.
Materials:
Ring Stand
Spring
Mass Hanger
Pendulum Clamp
Meter Stick
Masses
Procedure:
1) Our goal today is to calculate the potential energies at the top of the oscillation
and the bottom of the oscillation. We will compare them in an effort to show that
the total energy is conserved.
2) Set up the apparatus as demonstrated by the instructor. Make sure the 0cm mark
of your meter stick is on the table. In your data table, record the position of the
upstretched spring as ho.

Modified January 4, 2015 (check reverse side of page) Page 29 of 161
3) Place a 200g mass on the hook on
the spring. Choose a position 2-3
cm below position h0. This will be
your “drop height” – record it in
your data table as h1. The distance
(h0 - h1 ) is the distance d1 that the
spring has stretched. Record d1 in
your data table also.
4) Calculate the elastic potential
energy and the gravitational
potential energy at the top of the
oscillation and record the values in
your data table.
5) Set up the Vernier ultrasonic
detector under the 200 g mass.
6) Start Vernier data collection and
then release the mass to begin the simple harmonic motion. By careful
observation and repeated trials, you can estimate the lowest point to which the
mass descends before returning upward. This position will be recorded in your
data table as h2. The distance (h0 – h2) is the distance d2 that the spring has
stretched at its lowest point. How close does your observation come to the
Vernier reading?
7) Note: To measure the lowest position, you need to make your measurement on
the first 2-3 oscillations. After that, the motion begins to damp out and your
measurements will not be as accurate.
8) Calculate the elastic potential energy and the gravitational potential energy at the
bottom of the oscillation and record the values in your data table.
9) Find the total energy at the top of the oscillation and at the bottom of the
oscillation and record the totals in your data table.
10) Find the percent difference in the two total values.
Data Table:
Unstretched spring height h0
Drop height h1
Distance spring stretched at the top d1 = h0 - h1
Energy at Top: PEspring PEgravity
Lowest height h2 Distance spring stretched at the bottom d2 = h0 – h2
Energy at Bottom: PEspring PEgravity
Diagram of apparatus

Modified January 4, 2015 (check reverse side of page) Page 30 of 161
Percent difference: ________________________
Questions for Conclusion:
1) Assume that the total energy at the top of the oscillation is the total energy in the
system, find the gravitational potential energy, the elastic potential energy, and
the kinetic energy at the midpoint of the oscillation.
2) What are some possible reasons for any error you experienced? Remember,
human error is not a valid source of error!
3) Was the purpose of this lab accomplished (if it was, how did you demonstrate that
energy is conserved in this system? If not, explain why not).
Total energy at top = Total energy at bottom =

Modified January 4, 2015 (check reverse side of page) Page 31 of 161
University Physics Workbook Part I 2D Collisions (Momentum Conservation)
When objects collide, energy and momentum are both transferred between the
colliding objects. If certain properties of one of the colliding objects are known, then
properties of the other object can also be known.
Purpose:
To experimentally test the principle of conservation of momentum in a 2
dimensional collision.
Materials:
Marble Launcher
Marbles
Target Paper with Carbon Paper
Triple Beam Balance
Meter Stick
Plumb-Bob
Procedure:
1) Specific procedures for this experiment are to be established by each working
group of students. What follows is a general statement of procedures and
practices.
2) The apparatus consists of collision balls and a curved, grooved track. The
grooved track is to be mounted on the edge of the table such that upon rolling
down the track the steel ball will leave horizontally and fall freely under the
influence of gravity until hitting the floor. By taping a large sheet of paper on the
floor, the impact points can be marked by allowing the steel ball to strike carbon
paper placed at the point of impact. Place a piece of paper over the carbon paper
to prevent tearing. The point at which the ball leaves the track can be projected
on the paper by means of a plumb-bob.
3) By allowing the steel ball to roll from the same position each time, it should have
the same horizontal velocity each time. To determine this velocity, run 6-8 trials
and determine the average point of impact and percent difference. This gives the
measurable quantities of height fallen and distance traveled horizontally during
the fall. Use the equations motion with constant acceleration to determine the
time of flight and the horizontal velocity of the ball at the start of the fall.
4) By positioning a second ball on the support provided, a collision can be made to
occur when the first call rolls down the track under the initial conditions. Care
should be exercised to position the second ball so that the collision occurs just as
the first ball leaves the track. Again, 6-8 trials should be run so that the average
impact points of the two balls can be found.
5) Since the mass of each ball is measurable, the momentum of each ball before and
after the collision can be calculated. Find the horizontal momentum of the steel
ball-marble system before and after the collision and compare them by finding the
percent difference between the two values. Interpret your results. You can also
investigate conservation of kinetic energy. Is this collision elastic or inelastic?
What are the errors?

Modified January 4, 2015 (check reverse side of page) Page 32 of 161
ΘB
ΘM
XB
M
X’M
X’B
M
M
B
0°
Diagram:
Data Table:
Y= vB= PB=
mB= vB’= PB’=
mM= vM’= PM’=
xB= xB’=
θB= θM=

Modified January 4, 2015 (check reverse side of page) Page 33 of 161
University Physics Workbook Part I Circular Motion (Centripetal Force)
Purpose
To investigate centripetal force relationships for an object in uniform circular motion.
Procedure
If a mass is forced to travel in a circular path, it must be continually accelerated even
if the speed is constant. This is because the direction of its velocity is continually
changing. This acceleration is along the radius connecting the body with the center of its
circular path. For a path of radius R at linear speed v, the "center-seeking" or centripetal
acceleration a is given by
Newton's second law gives us the magnitude of the centripetal force F necessary for
this centripetal acceleration on a body of mass m.
Figure 1 is a diagram of a system in which a mass (a stopper, labeled mass s) is being
whirled at radius R about a glass tube which serves as a bearing for the string. As the
mass whirls, a second mass (labeled mass w) attached to the opposite end of the same
string provides the necessary centripetal force. If the speed of the rotation is too small,
mass w begins to move downward. If the speed of rotation is too great, mass w begins to
move upward.
Assemble an apparatus similar to the one in Figure 1. Start by making mass w on the
order of 20 g and total string length about 1.5 m. Thread the string through the glass tube
and attach mass w to the string. Tie mass s securely to the other end of the string. Move
to an area where there is plenty of room and careful1y whirl mass s above your head.
You will find that mass w moves up and down as the speed of rotation is changed. With a
little practice, you can find a combination of speed of rotation, mass w, and radius of
rotation which will keep mass w in stationary equilibrium.
Once you have found such a combination, have your lab partner time 20 revolutions
of mass s. Before you stop rotating mass s, grasp the string at the bottom of the tube and
hold it there as you stop. Continue holding the string and mark it at the top of the glass
tube with a pen. The distance from the pen mark to the center of mass s is the radius of
rotation R.
Divide the total time to make 20 revolutions by the number of revolutions (20). This
is the Period (T)
Each revolution is 2R in length; therefore, the linear speed of mass s is given by

Modified January 4, 2015 (check reverse side of page) Page 34 of 161
Determine the required force to make the stopper stay in its orbit and compare that force
with the tension provided by the weight. Perform 6 trials using at least 2 stoppers, 2
weights, and various radii. Create and label a data table with the following quantities and
their units: #Trials, Ms, Mw, Time for 20 Rev. with subdivisions of a, b, & avg, radii, T,
v, Fc, mg, %difference.
III. Diagram
mass s R
mass w
Glass tube Pen mark

Modified January 4, 2015 (check reverse side of page) Page 35 of 161
University Physics Workbook Part I Torque, Equilibrium, & Center of Gravity
Purpose In this experiment, you will investigate torques on rigid bodies and static equilibrium. Equipment
1 Lab Balance
1 Meter stick
1 Balance Stand for meter stick
1 Set of Mass Hangers for meter stick
1 Hooked Mass Set
1 Small, Unknown Metal Mass
Introduction Consider, for example, an ordinary chair. It appears to be a rigid body. Is it in
equilibrium as it sits on the floor? If, as often happens, one of its legs is a bit short, it will
not be in equilibrium; instead, it will wobble about the two diagonally-opposite longer
legs. But if an elephant sits on the chair, it will most definitely be in equilibrium with all
four legs resting solidly on the floor.
What has changed? Only the chair’s shape. The elephant has distorted it. It is not a
rigid body under these conditions.
In this experiment, you will investigate truly rigid bodies and static equilibrium. The
static equilibrium condition is very important in civil engineering, applying to bridges,
dams, buildings, statues, and balconies, and in our daily lives, applying to our ability to
stand up, to drive around corners without overturning, and to slide a stein of beer the
length of the bar without spilling it.
Analyzing static equilibrium conditions is an essential part of architectural
engineering. The designer needs to identify all the forces and torques that act on a
structural element, and to ensure through design and materials selection that the element
will safely tolerate the loads to be exerted on it.
Two conditions must be met for a rigid object subject to a combination of external
forces to be in mechanical equilibrium:

Modified January 4, 2015 (check reverse side of page) Page 36 of 161
The vector sum of all the external forces acting on it must be zero. Translational
equilibrium:
The vector sum of all the individual torques about an arbitrary axis must be zero.
Rotational equilibrium:
To be in static equilibrium, a rigid object must also be in rotational equilibrium.
The concept of center of mass is what allows us to study the motion and equilibrium
of extended (real world) objects as if they were point objects. By considering the
translational motion of an object’s center of mass (the motion of a point mass), and the
rotational motion of the object about its center of mass, we can determine the complex
motion of any extended object.
In this experiment, you will examine torques, rotational equilibrium, and center of
mass as they apply to a rigid object. The rigid object will be an ordinary wooden meter
stick. By measuring the forces and calculating the torques acting on this meter stick in
different situations, you will experimentally verify the two equilibrium equations. In
doing this, you will learn to
Describe mechanical equilibrium of a rigid object
Explain the center of mass concept
Explain how a laboratory balance measures mass
Theory Equilibrium
A rigid body in static equilibrium must necessarily be in rotational equilibrium.
Torque about some axis of rotation (also called moment of force) results from a force
being exerted at a point not on the axis. Torque is defined as the vector product of the
force and the displacement to the axis:
Therefore, the magnitude of the torque is
The measurement unit for torque is the newton-meter (N m), which you should not
confuse with the unit of work (1 newton-meter = 1 joule).
Torque is a vector quantity. Its direction is normal to the plane containing r and F.
When you cross r into F using the right-hand rule, your thumb points in the direction of
the radius (outward sense – radius vector tail is at center and tip is on circle), fingers in
the direction of the force, and palm points in direction of torque. For convenience,

Modified January 4, 2015 (check reverse side of page) Page 37 of 161
torques are often designated by the circular directions of motion that they tend to cause
(clockwise or CW, and counter-clockwise or CCW).
A rigid body can rotate about a specific axis in only two directions, CW or CCW.
CW torques produce CW rotational motion and CCW torques cause CCW rotational
motion. Rotation will not begin or change if the applied torques are balanced (if the
system is in rotational equilibrium). The condition for rotational equilibrium is
where is CW torque and is CCW torque. Conventionally, the CCW direction
is positive, and the CW direction is negative. When you put your right hand on a clock
with your thumb pointing perpendicular to the face, the fingers point in the positive,
CCW, direction. Digressing, CW is the direction a shadow of the sundial moves during
the day in the Northern Hemisphere and as clocks were developed that convention was
maintained.
For the system in Figure 8.1, the condition for rotational equilibrium becomes:
In this case the counterclockwise torque is F1r1 and the clockwise torques are F2r2
and F3r3. Note that the forces Fi may also be expressed as weights according to Newton’s
Second Law (Wi = Fi = mig). In this equation, the weight W has units of N, the mass m is
in kg, and the gravitational acceleration g is in m/s2.
You can use the equation of balanced torques to find an unknown quantity such as a
moment arm. Assume the bar above is in static equilibrium and the forces exerted on the
bar are due to three masses hanging at the indicated positions. Then, dividing the
previous equation by g, equilibrium is given by:
or
If m2 = m3 = 100 gm, m1 = 200 gm, r2 = 40 cm, and r3 = 60 cm, r1 must be

Modified January 4, 2015 (check reverse side of page) Page 38 of 161
Center of Gravity The center of gravity of an object is the point where all of the weight of that object
(mg) may be concentrated for the purpose of determining the torque gravity exerts on it.
The weights of the infinitesimal mass particles making up a rigid object create torques
about the object’s center of gravity. A wooden meter stick of uniform cross section, for
example, may be considered as made up of many point masses that are in rotational
equilibrium about its center of gravity at the 50 cm point. The ruler can be balanced
(supported in rotational equilibrium) on a fulcrum located at its center of gravity.
The center of mass of this same ruler would be at the same location as its center of
gravity as long as the acceleration due to gravity g is uniform. For a symmetrical stick
with a uniform mass distribution, its center of mass and its center of gravity will both be
located at its center of symmetry.
The concept of linear mass density u is closely related to the concept of uniform
mass distribution. The linear mass density of a rigid object is defined as its mass per unit
length:
If a meter stick has a mass of 150 gm, its linear mass density becomes
(150 gm)/(100 cm) = 1.50 gm/cm = 0.15 kg/m. Assuming a uniform mass distribution for
the ruler, every centimeter of it has a mass of 1.50 g, and 60 cm would have 90 g of mass.
Keep in mind, however, that laboratory 1-m rulers do not necessarily have uniform mass
distribution, especially older ones that are worn on their edges, and such an assumption
gives only approximate values.
Procedure
You will use minimal equipment and no computer sensors in this experiment. In
hanging masses from the meter stick, you may suspend them from sliding clamps with
hangers or from loops of string. Suspending the hooked masses from loops of string (or
rubber bands) is easier since you can consider the strings to be massless. If you use the
clamps with hangers, be sure that you add their masses to the hanging mass.
A. Rigid Rod Supported at its Center of Gravity
Measure the mass of the meter stick and record its value above Data Table 8.1.
Case 1. Two masses of known value
1) Supporting the meter stick at its center of mass (point where the meter stick is
balanced by itself), hang a 100 gm mass at the 20 cm point. Record this mass m1
and its moment arm r1 in your data tables.
2) Balance the ruler by placing a 200 gm mass at an appropriate location on the
other side of the fulcrum. Record this mass m2 and its moment arm r2 in your data
tables
3) Calculate and record the CW and CCW torques and the percent difference
between them.
Case 2. Three masses of known value

Modified January 4, 2015 (check reverse side of page) Page 39 of 161
4) With the ruler still supported at its center of mass, hang a 100 gm mass m1 at the
15 cm mark and a 200 gm mass m2 at the 75 cm mark. Hang a 50 gm mass m3 at
the appropriate position so the ruler is in static equilibrium. Record all masses and
moment arms in your data tables
5) Compute and record the torques and percent differences as you did in step 4.
B. Rigid Rod Supported at Different Points
6) In Part A, you did not take the mass of the ruler itself into account because the
support was located at its center of gravity, and the torque due to its weight was
zero.
7) In this part, the ruler will not be supported at its center of gravity but at other
pivot points indicated in general in Figure 8.2. For these cases, you will have to
consider the weight of the ruler and compute appropriate torques for each case
due to m2 and m3.
8) Hang a 100 gm mass m1 near the zero end of the ruler and slide the support to the
appropriate position to achieve static equilibrium. Record the mass and moment
arm in your data table.
9) Assuming uniform mass distribution of the ruler, calculate and record the mass m2
of L2.
10) Calculate and record the moment arm r2.
11) For the same setup, calculate and record the moment arm r3 due to the mass m3 of
that portion of the ruler on the other side of the support.
12) Calculate and record the torques and percent differences as you did in Part A.
C. Center of Gravity
13) Tape an unknown mass near one end of the ruler as shown in Figure 8.3. Keep the
mass at the same position for the rest of this part.
14) Measure the mass mr of the loaded ruler and record it under Data Table 8.3.
15) The center of gravity of the loaded ruler is now at point C. Balance the loaded
ruler and record the exact position of point C in Table 8.3.
16) Hang a mass m1 of arbitrary value from point A near the other end of the ruler.
Adjust the support point of the loaded ruler from C to B until the ruler is again in
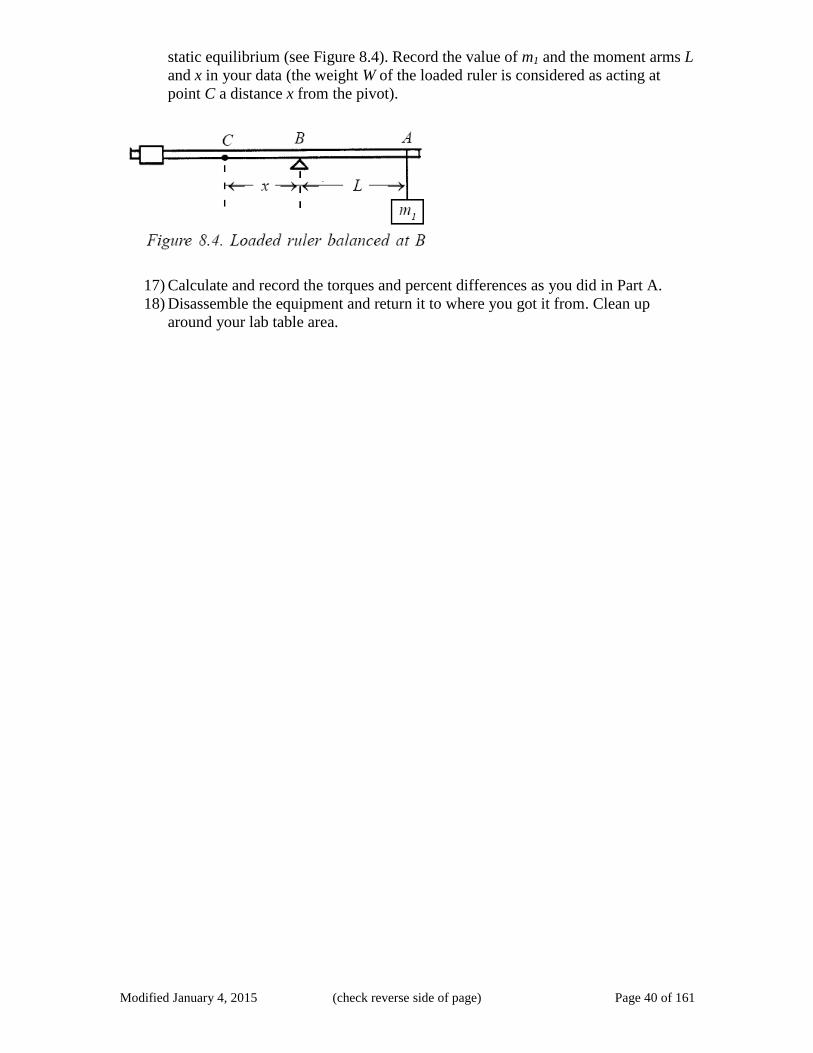
Modified January 4, 2015 (check reverse side of page) Page 40 of 161
static equilibrium (see Figure 8.4). Record the value of m1 and the moment arms L
and x in your data (the weight W of the loaded ruler is considered as acting at
point C a distance x from the pivot).
17) Calculate and record the torques and percent differences as you did in Part A.
18) Disassemble the equipment and return it to where you got it from. Clean up
around your lab table area.

Modified January 4, 2015 (check reverse side of page) Page 41 of 161
University Physics Workbook Part I Archimedes’ Principle (Fluids)
Purpose
You will use Archimedes’ principle in this experiment to determine the densities of
several solids and liquids.
Equipment
Spring scales calibrated in N (preferred), force sensor, or mass balance rigged so
object can be tied to it and lowered into water. There is a procedure to place the mass
balance on the table, place a beaker of fluid on it, raise or lower objects into the fluid,
and measure forces, however it requires a major revision of this theory and procedure
and is therefore outside the scope of this laboratory.
Lab jack, scissor jack, blocks, pieces of 2x4, or other blocks to raise and lower
beakers, etc.
Overflow can
If mass balance is used, be sure to convert mass reading to force readings.
500-mL beaker
1000-mL beaker
Large ringstand, stand with 90° clamps and crossbar, or other arrangement to hang
objects being measured.
Metal cube with hook. If it doesn’t have a hook, tie it with string like a Christmas
package.
Lab balance
String
Wooden object with hook. If it doesn’t have a hook, tie it with string like a Christmas
package.
Hydrometer or hydrometers capable of measuring liquids heavier and lighter than
water

Modified January 4, 2015 (check reverse side of page) Page 42 of 161
Metal cylinder with hook. If it doesn’t have a hook, tie it with string like a Christmas
package.
Bottle of unknown liquid such as saltwater, ethanol/water mixture, antifreeze/water
mixture, etc.
Introduction
A solid object may float or sink when placed in a given fluid (i.e., in a gas or a
liquid). If the object floats, it is buoyed up by a force equal to its weight. According to the
ancient Greek philosopher Archimedes, the buoyant (upward) force exerted on an object
that is either wholly or partially submerged in a fluid is equal to the weight of the amount
of fluid displaced by the object. The object will sink when its weight exceeds the weight
of the displaced fluid.
Because of Earth’s gravity, every fluid substance from the atmosphere to the oceans
to a tank full of gasoline has an internal pressure that increases with depth. And because
gases are compressible, the greater pressure at a given depth squeezes the fluid into
greater density at that depth. The density of an ideal gas is proportional to absolute
pressure and inversely proportional to absolute temperature. Liquids are much less
compressible, however the density of water increases about 0.3% as you descend to the
bottom of the ocean.
We live our lives at the bottom of the atmospheric ocean which exerts about
101,300 N of force on every square meter of our bodies (10.13 N/cm2). We don’t notice
this pressure, of course, because the fluids inside our bodies exert a balancing outward
pressure. This balance is not automatic. Sometimes driving down a mountain the tube
leading to our inner ear is temporarily blocked and we feel this pressure until we yawn to
open the tube to “pop” our ears. The pressure change may be great enough that we
cannot breathe normally and we must surround our bodies with air at normal atmospheric
pressure if we ascend into the atmosphere or descend into the ocean.
Because of the vertical pressure gradient in fluids, the pressure on the lower surface
of a submerged object is always greater than that on the upper surface. This is the root
cause of the buoyant force.
Specific gravity is really nothing but relative density; that is, it is a unit-less ratio
between the density of an object or a substance relative to the density of pure water, with
both values of density expressed in the same units. Specific gravity is much more useful
when dealing with different systems of units. The specific gravity of pure water is
always 1.0, however the density is 1.0 gm/cm3, 1000 kg/m
3, or 62.4 lb/ft
3. Thus the
density of steel is 7.8 gm/cm3, 7800 kg/m
3, or 487 lb/ft
3, but the specific gravity is always
7.8 independent of the system of units.
You will use Archimedes’ principle in this experiment to determine the densities of
several solids and liquids. When you finish the experiment, you will be able to:
1) Determine whether or not an object will float or sink in a fluid if you know the
density of each.
2) Explain the difference between density and specific gravity.
3) Determine the density or specific gravity of a solid or fluid whether it floats or
sinks.
Theory
A. Objects Denser Than Water
The buoyant force is described by Archimedes’ principle as: an object, when placed
in a fluid, is buoyed up by a force equal to the weight of the fluid displaced by the object.
The principle applies to an object either entirely or partially submerged in the fluid. The

Modified January 4, 2015 (check reverse side of page) Page 43 of 161
magnitude of the buoyant force depends only on the weight of the displaced fluid, and not
on the object’s weight. Using Archimedes’ principle, you can deduce that an object:
1) Will float in a fluid if the object’s density is less than the fluid’s density (ρo < ρf).
2) Will sink if the object’s density is greater than the fluid’s density (ρo > ρf).
3) Will remain in equilibrium at a given submerged depth if the object’s density is
exactly equal to the fluid’s density at that depth (ρo = ρf).
The buoyant force on a floating object Fb is related to the properties of the displaced
fluid by:
gVgmF offb Equation 1
where ρf is the density of the fluid, Vo is the volume of the submerged part of the object,
and g is the acceleration due to gravity.
When working with forces it is important for the student to be able to draw a free
body diagram and working with buoyant force is no exception. Figure 1 following shows
the free body diagrams (a) in air and (b) in water.
Figure 1 – Free body diagrams of forces on object of mass mo. Neither the mass nor the weight of the
object changes, however on the right hand side depicting the case of measurement underwater (or under
some other fluid) there is a buoyant force, Fb. The spring scale (or force sensor, etc.) simply measure the
tension in the string attached to the object. On the left hand side, measurement in air, this tension is equal
and opposite to the weight (since the object is at rest). Note the density of air is quite small and we
therefore presume the buoyant force of air on the object is negligible. On the right hand side, measurement
of the object while it is under the surface of a fluid, the spring scale reads Fu – equal and opposite to the
difference between the weight and buoyant force.
The volume of the submerged object oriented vertically is equal to its cross-sectional
area A multiplied by the height h of the submerged part. Note that the force of the fluid
on the top and bottom equals:
Equation 2
Remember that the pressure on the bottom is slightly greater than the pressure on the top
and the difference equals:
mo
Fa
weight = mog
(a)
Spring scale – this
measures the
tension in the string.
In this case, Fa.
mo
Fu
weight = mog
(b)
Spring scale – this
measures the
tension in the string.
In this case, Fu.
Fb Surface of water (or
fluid). Object is
underwater when this
measurement is done.
Measurement
in air
Measurement
under water
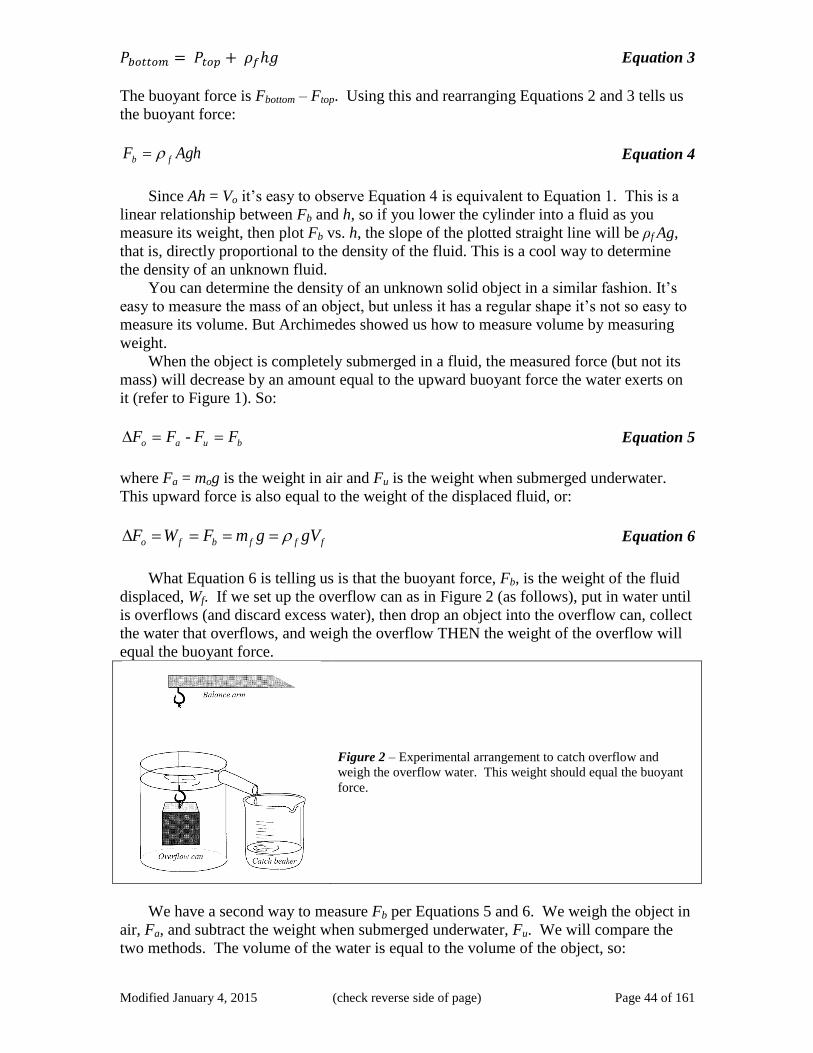
Modified January 4, 2015 (check reverse side of page) Page 44 of 161
Equation 3
The buoyant force is Fbottom – Ftop. Using this and rearranging Equations 2 and 3 tells us
the buoyant force:
AghF fb Equation 4
Since Ah = Vo it’s easy to observe Equation 4 is equivalent to Equation 1. This is a
linear relationship between Fb and h, so if you lower the cylinder into a fluid as you
measure its weight, then plot Fb vs. h, the slope of the plotted straight line will be ρf Ag,
that is, directly proportional to the density of the fluid. This is a cool way to determine
the density of an unknown fluid.
You can determine the density of an unknown solid object in a similar fashion. It’s
easy to measure the mass of an object, but unless it has a regular shape it’s not so easy to
measure its volume. But Archimedes showed us how to measure volume by measuring
weight.
When the object is completely submerged in a fluid, the measured force (but not its
mass) will decrease by an amount equal to the upward buoyant force the water exerts on
it (refer to Figure 1). So:
buao FFFF - Equation 5
where Fa = mog is the weight in air and Fu is the weight when submerged underwater.
This upward force is also equal to the weight of the displaced fluid, or:
fffbfo gVgmFWF Equation 6
What Equation 6 is telling us is that the buoyant force, Fb, is the weight of the fluid
displaced, Wf. If we set up the overflow can as in Figure 2 (as follows), put in water until
is overflows (and discard excess water), then drop an object into the overflow can, collect
the water that overflows, and weigh the overflow THEN the weight of the overflow will
equal the buoyant force.
Figure 2 – Experimental arrangement to catch overflow and
weigh the overflow water. This weight should equal the buoyant
force.
We have a second way to measure Fb per Equations 5 and 6. We weigh the object in
air, Fa, and subtract the weight when submerged underwater, Fu. We will compare the
two methods. The volume of the water is equal to the volume of the object, so:

Modified January 4, 2015 (check reverse side of page) Page 45 of 161
g
FVV
f
o
of
Equation 7
The density of the object is therefore (recall Fa is the force reading in air and equals
the weight of the object):
ua
a
f
o
fo
o
o
oFF
F
F
gm
V
m
Equation 8
B. Density of an Unknown Liquid
You can also determine the density of an unknown liquid without measuring the
submerged height of the solid object. Recall Equations 4 and 5 and Figure 1. When we
measure a sinking object in water we obtain Fbw = wVog = Fa – Fuw where w refers to
the density of water and when we measure the same object in the unknown fluid we
obtain Fbf = fVog = Fa – Fuf. Where the subscript “b” refers to buoyant force, subscript
“w” refers to water, subscript “f” refers to unknown fluid, subscript “a” refers to
measurements in air, and subscript “u” refers to submersion under the water or unknown
fluid. The ratio of Fbf to Fbw is given by the following equation:
Equation 9
Multiplying the specific gravity of the unknown fluid given by Equation 9 by the
density of water gives the density of the unknown fluid.
Equation 10
Devices to measure S.G. are known as hydrometers. They are simply closed tubes
weighted at the bottom of known mass. The deeper in the fluid the hydrometer goes,
more volume of fluid is displaced raising the buoyant force. When the buoyant force
equals the weight, the hydrometer stops. For a fluid denser than water the hydrometer
rides higher (less deep) than for water. For a fluid less dense than water the hydrometer
goes deeper. A scale on the side of the hydrometer is calibrated to indicate specific
gravity. This is illustrated in Figure 3.
C. Objects Less Dense Than Water
Most hydrometers are less dense than water and that gives us a hint of how to
measure the density of a liquid less dense than water. We will explore two methods – the
first being the principle the hydrometer uses. For the most part it’s impractical – objects
have to be shaped like hydrometers and most are not. Therefore we need a second
method – attach a sinker to a floating object to make it sink and measure the forces. In
the following section we will develop the theory behind both.

Modified January 4, 2015 (check reverse side of page) Page 46 of 161
Case (a), f > w
Hydrometer is shallow
displacing less volume.
fVhg = Fb = Wh where Wh
is the weight of the
hydrometer (and doesn’t
change) and Vh is the
volume the hydrometer
displaces. Therefore if f ↑,
Vh ↓ (large fluid density
implies small volume
displaced)
Case (b), f = w
Hydrometer in water is at a
very specific depth such
that wVhg = Fb = Wh
Case (c), f < w
Hydrometer is deep
displacing more volume.
Since fVhg = Fb = Wh if
f ↓, Vh ↑. Therefore this
fluid is less dense than
water.
Figure 3 – Hydrometer in three different density liquids. Hydrometer is shallow if fluid is more dense than
water, hydrometer is medium if fluid density equals water, and hydrometer is deep if fluid is less dense
than water.
The first question is, for an object less dense than water, what fraction of it is above
the surface? When an object floats the buoyant force is equal and opposite to the weight.
Therefore:
Equation 11
Where Vu is the volume of the object underwater and Vo is the total volume of the
object. As previously used, f is the density of the fluid, o is the density of the object,
and g is the acceleration of gravity. Since Vo – Vu is the volume above water, by
rearranging Equation 11 we find the fraction above water is:
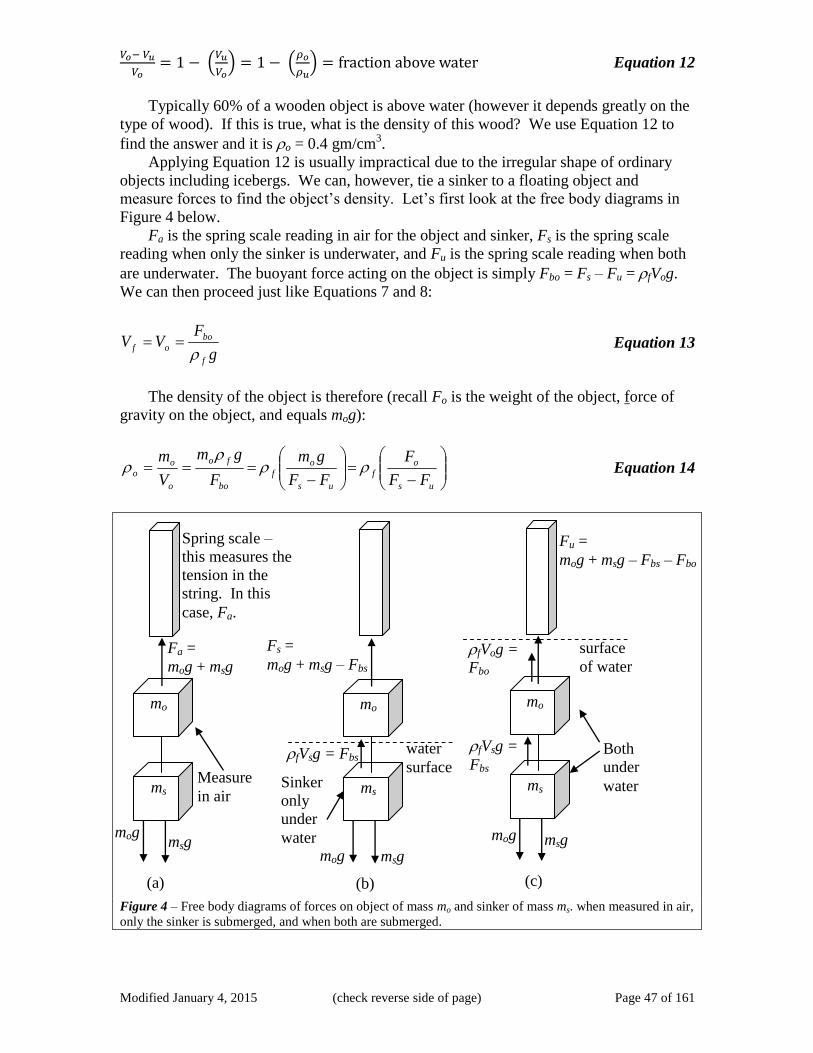
Modified January 4, 2015 (check reverse side of page) Page 47 of 161
Measure
in air
Fa =
mog + msg
(a)
Spring scale –
this measures the
tension in the
string. In this
case, Fa.
ms
mo
msg mog
Equation 12
Typically 60% of a wooden object is above water (however it depends greatly on the
type of wood). If this is true, what is the density of this wood? We use Equation 12 to
find the answer and it is o = 0.4 gm/cm3.
Applying Equation 12 is usually impractical due to the irregular shape of ordinary
objects including icebergs. We can, however, tie a sinker to a floating object and
measure forces to find the object’s density. Let’s first look at the free body diagrams in
Figure 4 below.
Fa is the spring scale reading in air for the object and sinker, Fs is the spring scale
reading when only the sinker is underwater, and Fu is the spring scale reading when both
are underwater. The buoyant force acting on the object is simply Fbo = Fs – Fu = fVog.
We can then proceed just like Equations 7 and 8:
g
FVV
f
bo
of
Equation 13
The density of the object is therefore (recall Fo is the weight of the object, force of
gravity on the object, and equals mog):
us
o
f
us
o
f
bo
fo
o
o
oFF
F
FF
gm
F
gm
V
m
Equation 14
Figure 4 – Free body diagrams of forces on object of mass mo and sinker of mass ms. when measured in air,
only the sinker is submerged, and when both are submerged.
fVsg = Fbs water
surface Sinker
only
under
water
Fs =
mog + msg – Fbs
(b)
ms
mo
msg mog
Both
under
water
Fu =
mog + msg – Fbs – Fbo
(c)
ms
mo
msg mog
fVsg =
Fbs
surface
of water fVog =
Fbo

Modified January 4, 2015 (check reverse side of page) Page 48 of 161
See! This isn’t very hard. Just keep the free body diagrams in mind, figure out
forces, and calculate density. Also choose variable that remind you of what they
physically mean. You’ll notice that the subscript “s” refers to a sunken sinker, “u” refers
to both underwater, Fbo is the buoyant force on the object, etc. Naming things well is a
mnemonic device to help us remember their meaning.
Procedure
You will:
1. Weigh a sinking object in air and under water
2. Weigh the water displaced
3. Weigh a floating object in air and under water (using a sinker)
4. Measure the volume of the floating object, calculate density directly, and
compare results with results from using Archimedes’ Principle
5. Weigh the sinking object under water and under an unknown liquid
6. Find the specific gravity of an unknown liquid using a hydrometer
From these measurements, you will calculate the densities of the objects and liquids.
It is preferable to use spring scales to measure forces directly, however if mass balances
are used be sure to convert mass readings to force readings.
A. Density of a Sinking Object
1. Place the spring scale on the ringstand. Alternatively, if using a lab balance,
mount the lab balance on a ringstand about two feet high.
2. Using thread tie the object with a loop on the end of the thread.
3. Place the overflow can on a lab jack under the object.
4. Weigh the metal object mo , calculate its weight, Fa (force reading in air), and
record this in Table 1.
5. Weigh the dry catch beaker mb and record its mass in Table 1.
6. Place the catch beaker beneath the spout of the overflow can as shown in Figure
11.2, and fill the overflow can with water until it runs out the spout. Then empty
and replace the beaker.
7. Hang the metal object by the short thread from the hook beneath the balance pan,
then raise the lab jack until the object is completely submerged in the water.
Weigh the submerged object and record its force, Fu, in Table 1.
8. Remove the sample from the hook under the scale or balance.
9. Measure and record the combined mass of the catch beaker and the overflow
water mcomb.
10. Record the measured mass mw of the displaced water.
11. Calculate the weight of the displaced water, Ww, and record this in Table 2.
12. Use Equation 5 to calculate the buoyant force, Fb, and record this in Table 2.
13. Calculate and record the percent difference between Ww and Fb. in Table 2
14. Using Equation 8, calculate and record the density, o, of the object and record
this in Table 2.
15. Record the accepted value of density (consult your textbook for this value), acc,
and record this in Table 2.
16. Calculate the percent error between measured density, o, and the accepted value,
acc, and record this in Table 2.

Modified January 4, 2015 (check reverse side of page) Page 49 of 161
B. Density of a Liquid
17. Use the same object from Part A and, since this was performed in water, the force
in air, Fa, in Table 1 and the buoyant force, Fb, in Table 2 will be needed.
Transfer this information to Table 3 noting that Fbw = Fb from Table 2.
18. Replace the overflow can with the unknown liquid in a beaker. Repeat the
procedure in step 7 and record the force, Fuf.
19. Use Equations 9 and 10 to calculate the density, f, and specific gravity, S.G., of
the unknown liquid and record these values in Table 3.
20. Use the hydrometer to measure the specific gravity of the unknown liquid and
record this as S.G.h.
21. Using S.G.h compute the density and record it as h.
22. Find the percent difference between f and h.
C. Density of a Floating Object
23. The procedure for this is similar to Part A, but we won’t do overflow. Instead use
a regularly shaped floating object (rectangular solid, cylinder, etc.). Using your
knowledge of the volume of solids, measure and calculate the volume and record
this in Table 4. Below Table 4 describe how you calculate this volume and record
data taken to perform this calculation.
24. Place the spring scale on the ringstand. Alternatively, if using a lab balance,
mount the lab balance on a ringstand about two feet high.
25. Weigh the sinker, ms, and the floating object, mo. From Equation 14 we observe
that it is not necessary to know the mass of the sinker, but just-in-case and for
good measure, we’ll record it anyway. Record mo, calculate the object’s weight,
Fo, and record it in Table 4.
26. From mo and Vo calculate the density. Record it in the column od (density object
direct measurement).
27. Using thread tie the sinker below the floating object and tie a loop above the
floating object.
28. Place a beaker about half full of water on a lab jack under the sinker/object
combination.
29. Also for good measure record the density of the fluid, f. Since you’re using
water, f = 1.00 gm/cm3.
30. Record the weight (force in air), Fa, of the sinker/object combination.
31. Hang the sinker/object combination by the short thread from the hook beneath the
balance pan (or spring scale), then raise the lab jack until the sinker ONLY is
completely submerged in the water. Record this force, Fs.
32. Now raise the lab jack until both the sinker and object are completely submerged,
BUT THE SINKER SHOULD NOT BE RESTING ON THE BOTTOM. If
necessary, add more water. Record this force, Fu.
33. Use Equation 14 to calculate the density, o, of the object and record this.
34. Clean up and put away equipment.
Post-Lab Questions – Answer on a separate page and attach
1. In Table 2 you found the buoyant force using two methods. Do your results
confirm or contradict Archimedes’ Principle? Explain thoroughly.
2. Also in Table 2 you compared your measured density with the accepted density?
Do you believe the Archimede’s Principle is a good method or poor method to
measure density? Explain thoroughly.

Modified January 4, 2015 (check reverse side of page) Page 50 of 161
3. Due to the string used, will the measured force be greater than or less than the true
force? Also due to the string, will the measured volume be greater than or less
than the true volume? Combining these two influences will the measured density
be greater than or less than the true density or about the same? Explain
thoroughly.
4. As a hypothetical example, if you submerge an object with the same density as
the fluid, will the object sink, rise, or remain unchanged? Explain.
5. How would you cause an un-tethered, at rest, un-powered submarine to rise? To
sink? Are you changing the density, volume, and/or mass of the submarine?
How is this different from a hot air balloon? Explain.
6. What is the net force on a floating ice cube? A floating block of wood? A steel
bolt floating in mercury? Explain.
7. Which is heavier, 1 cm3 of ice or 1 cm
3 of water? Explain.
8. If you have a beaker of water and a block of wood balanced on a mass balance
and you put the wood in the water, will the mass balance change? Why or why
not? Wouldn’t the buoyant force on the wood cause the mass balance to show
less mass when the wood is in water? Similarly, if pigeons in a truck were flying,
would it weigh less? Explain.
9. A lift is rated to lift 10,000 N (about a ton). If it were lifting an aluminum object
( = 2.7 gm/cm3) out of a lake, what is the maximum mass of aluminum it can
lift? What is the weight of this maximum mass?
10. Explain how a hydrometer works. Consider one with a cross-sectional area of
1 cm3 and mass of 100 gm. What length is underwater? If it measures alcohol
with = 0.8 gm/cm3 how much is below the surface? If it measures antifreeze
with = 1.1 gm/cm3 how much is below the surface? Assume it’s sufficiently
long that it won’t sink.

Modified January 4, 2015 (check reverse side of page) Page 51 of 161
Page left intentionally blank

Modified January 4, 2015 (check reverse side of page) Page 52 of 161
Lab Report: Names _______________________________________________________
Table 1 – Raw Data for Density of Sinking Object and Direct Confirmation of
Archimedes’ Principle
Object
Material
mo
( )
Fa
( )
mb
( )
Fu
( )
mcomb
( )
mw
( )
Table 2 – Results for Density of Sinking Object and Direct Confirmation of Archimedes’
Principle. Note, accepted values of density is tabulated in Appendix A.
Object
Material
Ww
( )
Fb
( )
F Err%
( )
o
( )
acc
( )
Err%
( )
Table 3 – Density of an Unknown Liquid
Fa
( )
Fbw
( )
Fuf
( )
f
( )
S.G.
( )
S.G.h
( )
h
( )
%
( )
Table 4 – Density of a Floating Object
ms = ( ), Fa = ( ), f = ( )
Object
Material
Vo
( )
mo
( )
od
( )
Fo
( )
Fs
( )
Fu
( )
o
( )
o Err
%
( )

Modified January 4, 2015 (check reverse side of page) Page 53 of 161
Page left intentionally blank

Modified January 4, 2015 (check reverse side of page) Page 54 of 161
University Physics Workbook Part I Physical Pendulum (Oscillator)
Purpose
To determine the relationship between the period of a square physical pendulum and
the length of its sides and compare to the theory of this type of pendulum.
Theory
A physical pendulum is defined as a rigid body mounted so that it can swing in a
vertical plane about an axis passing perpendicularly through it. It differs from a simple
pendulum in that it cannot be approximated by a point mass.
The theory of harmonic oscillation predicts that when there is a restoring “force-like”
quantity causes an “acceleration-like” quantity proportional to and in the opposite
direction as a “displacement-like” quantity then the system will oscillate. Furthermore,
the angular frequency of oscillation is equal to the square root of the constant of
proportionality. For a spring the “force-like” quantity IS the force and the
“displacement-like” quantity IS the displacement. However, even for a simple
pendulum, the “force-like” quantity is torque and the “displacement-like” quantity the
angle. In electricity the “force-like” quantity is voltage, the “acceleration-like” quantity
is change of current divided by change of time, and the “displacement-like” quantity is
charge.
Using your knowledge of rotational mechanics from lecture include a discussion of
the theory of the physical pendulum and predict the period versus side length in your lab
report. For reference, the formula for the moment of inertia around the center of a
rectangular plate of dimensions x and y is:
When applying this formula do not forget the parallel-axis theorem.
Procedure
You will be provided with several square sheets of metal which will have pins
through one corner so that the sheets can oscillate about the pin as shown.
The period of a pendulum is defined as the time it takes the pendulum to make one
complete oscillation. The accuracy of measurement of the period can be increased by
finding the average time per oscillation. While keeping the angle of oscillation small (less
than 15°), determine the period of each pendulum after allowing it to complete 20
oscillations.
Graphically determine what relationship exists between the period of the pendulum
and the length of its side (Period vs. Length). Plot by hand using a ruler – DO NOT USE
A COMPUTER! To confirm the relationship between period and length you may need to
make a second graph and/or transform the data.

Modified January 4, 2015 (check reverse side of page) Page 55 of 161
Diagram Physical Pendulum Holder

Modified January 4, 2015 (check reverse side of page) Page 56 of 161
University Physics Workbook Part I String Harmonics (Waves)
Purpose
In this experiment, you will explore the relationship between string length, wavelength,
frequency, linear density, and string tension in a standing wave, thus gaining an empirical
understanding of the normal modes of vibration in a stretched string.
Equipment
Frequency generator
Meter stick
Pulley
Banana plug patch cords (multiple)
Mechanical wave driver
Clamps (C clamps, table clamps)
Amplifier (may not be necessary)
String
Mass set with hanger (up to 2 kg
total)
Support rod
Introduction
A wave moving within any material is evidence that energy is being transported as the
result of a disturbance. There are two distinct categories of waves: mechanical and
electromagnetic. Mechanical waves require some kind of material to travel in, but
electromagnetic waves, including light, do not.
The speed of both categories of waves depends on two properties of the material they are
moving through. For mechanical waves they are an inertial property and an elastic
property. For electromagnetic waves they are the permittivity and permeability of the
material. For a mechanical wave in a stretched string, the inertial property is its linear
density (its mass per unit length), and the elastic property is the tension force in it.
A wave will propagate along the string if you disturb its equilibrium state at any position.
When the wave reaches either end, it will reflect and propagate back toward the
disturbance.
If you make the disturbance repetitive by using, say, an electric vibrator at one end, the
waves propagating away from the vibrator interfere with those that are reflected back
from the other end. If the length of the string is an integral multiple of the half-
wavelength of the interfering waves, the interference pattern (blur, wave envelope) will

Modified January 4, 2015 (check reverse side of page) Page 57 of 161
be stationary in the string. Such a stationary wave pattern is called a standing wave.
Using a high speed camera we show actual motion vs. what the eye sees on this YouTube
video: http://www.youtube.com/user/SizemoresScience#p/a/u/0/VmGWvuqFqxQ.
In this experiment, you will create standing waves in a stretched string and then measure
their wavelength. You will explore the relationship between string length, wavelength,
frequency, linear density, and string tension in a standing wave, thus gaining an empirical
understanding of the normal modes of vibration in a stretched string.
You will compare your measurements of standing waves to the theory that relates these
properties. When you are finished, you will be able to
Explain how standing waves are created.
Identify the nodes and antinodes and the number of segments in a standing wave.
Discuss the factors that determine the natural frequencies of a vibrating string.
Theory
The properties that characterize a wave are its wavelength λ, its frequency of oscillation f
(measured in hertz, or 1/s = s–1
), and its speed v. These properties are related by the
equation:
λ f = v Equation 1
Mechanical waves propagate through a medium in either a longitudinal or a transverse
mode. In a longitudinal wave, each particle in the medium oscillates in the same direction
as the wave propagation. Sound waves in any material travel in this manner. In
transverse waves, each particle oscillates perpendicular to the direction of wave
propagation. The waves in a stretched string vibrate in a traverse mode.
Figure 1 – Plot of wave height (displacement) vs. distance, x, or time, t. Interpreting this
as a plot vs. x, this would be a snapshot of the wave at an instant of time. Interpreting
this as a plot vs. t, then one would stay at a particular location and record the wave height
as it progresses over time.
As each particle oscillates, its maximum displacement up and down is called the wave’s
amplitude, designated as +A or –A. Figure 1 is a plot of displacement vs. either position
or time. The energy being carried by the wave is related to its amplitude. The period of
oscillation is inversely related to the frequency:
Dis
pla
ce
me
nt -
ma
xim
um
is
A, A
mp
litu
de
x or t
-A
A
l
T = 1/f
v
lf = v

Modified January 4, 2015 (check reverse side of page) Page 58 of 161
T = 1/f Equation 2
Let’s think about why Equation 1 and 2 are true. A period is the time required for a wave
to go from its peak, down to the valley, and back up to the peak again when the observer
is standing in one position. To understand this, go to the phet simulation
(http://phet.colorado.edu/sims/wave-on-a-string/wave-on-a-string_en.html ). Select “no
end”, “oscillate”, zero damping, low frequency, and low tension. Position the computer
mouse pointer where one of the green dots is at a maximized and observe the time
required for the green dot to go down and back to your mouse pointer. This time is the
period, T.
Frequency is related to the number of cycles, n, (up, down, and back up) observed in a
given time, t, and is defined as:
f = n/t Equatioon
The faster the wave goes up and down the higher the frequency. The time required for
one cycle has the special name of period – the same period as above. When we observe
only a single cycle, frequency equals one cycle per the period, or:
f = 1/T Equation 4
It is easy to observe that rearrangement of Equation 4 leads to Equations 2.
The wavelength is the distance a wave travels in one period and has a special Greek letter
for it, l. l is Greek for l and stands for length as in wavelength. Look at the phet
simulation again. You will observe (if it is slowed down sufficiently for your eye to see)
that the distance a wave travels in one period is the distance from one peak to the next
peak. Wave speed is, therefore:
v = l/T Equation 5
Substituting Equation 2 for T, one obtains Equation 1 presented previously.
Two waves meeting each other will interfere. The combined wave they produce is a
simple superposition of the two waves. If two waves moving in opposite directions have
the same amplitude and frequency, their interference produces a standing wave as shown
in Fig. 2. The positions of minimum displacement (destructive interference) are called
nodes, and the positions of maximum displacement (constructive interference) are called
antinodes. The length of one segment of the standing wave is equal to one-half its
wavelength.
When a string is vibrated at one end, waves traveling from the vibrator interfere with
waves reflected from the opposite fixed end. This interference produces a standing wave
in the string at specific frequencies that depend on the string’s density, tension, and
length. If the string is vibrated at multiples of this frequency, standing waves with
multiple segments will appear. The lowest frequency (far left in Figure 3) is known as the
first harmonic and higher frequencies are higher (second, third, etc.) harmonics (see
Figure 3).
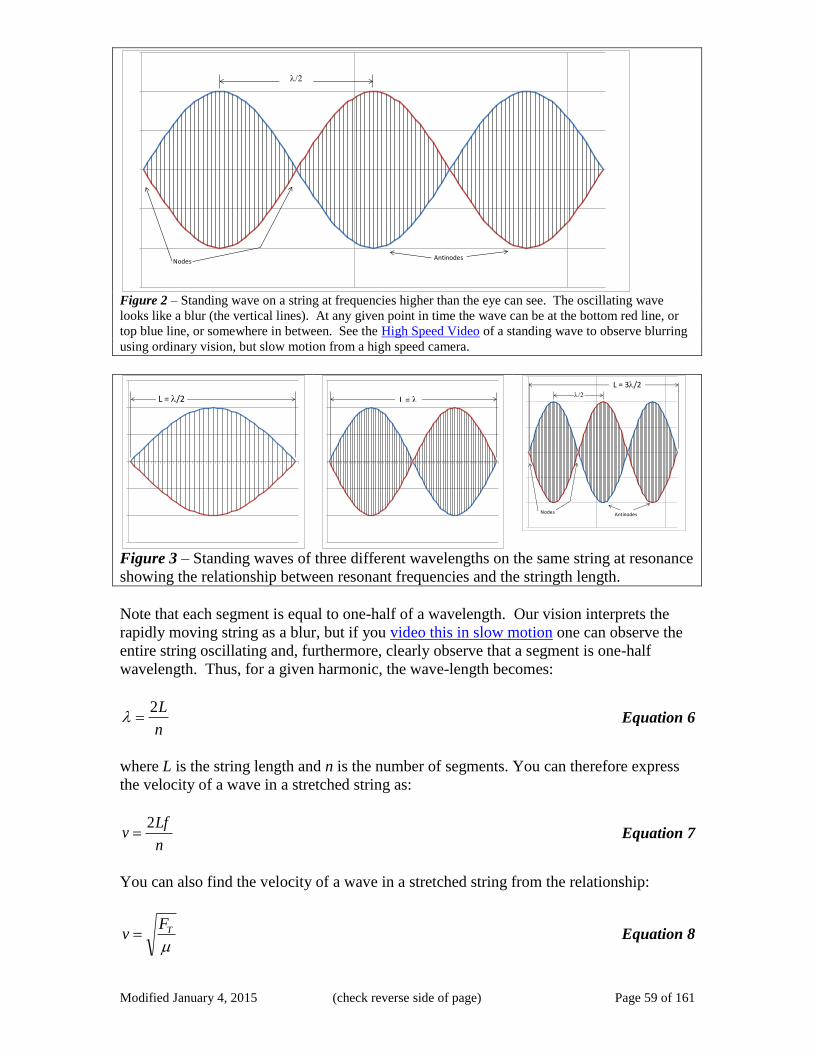
Modified January 4, 2015 (check reverse side of page) Page 59 of 161
Figure 2 – Standing wave on a string at frequencies higher than the eye can see. The oscillating wave
looks like a blur (the vertical lines). At any given point in time the wave can be at the bottom red line, or
top blue line, or somewhere in between. See the High Speed Video of a standing wave to observe blurring
using ordinary vision, but slow motion from a high speed camera.
Figure 3 – Standing waves of three different wavelengths on the same string at resonance
showing the relationship between resonant frequencies and the stringth length.
Note that each segment is equal to one-half of a wavelength. Our vision interprets the
rapidly moving string as a blur, but if you video this in slow motion one can observe the
entire string oscillating and, furthermore, clearly observe that a segment is one-half
wavelength. Thus, for a given harmonic, the wave-length becomes:
n
L2l Equation 6
where L is the string length and n is the number of segments. You can therefore express
the velocity of a wave in a stretched string as:
n
Lfv
2 Equation 7
You can also find the velocity of a wave in a stretched string from the relationship:
TF
v Equation 8
l/2
NodesAntinodes
L = l/2 L = ll/2
Nodes Antinodes
L = 3l/2

Modified January 4, 2015 (check reverse side of page) Page 60 of 161
where the tension force, FT, is the force applied to stretch the string and the linear mass
density, μ, is an inertial property equal to mass per unit length. You can find the value of
μ by weighing a known length of string.
length
mass Equation 9
Procedure
You will apply tension to a length of string by hanging mass from it over a pulley, as
shown in Figure 4. You will then create waves in the string with a computer-driven
vibrator and adjust the frequency (Part A) and the tension (in Part B) to create standing
waves having from 1 to 7 segments.
Figure 4 – Schematic of Experimental Apparatus
1) Cut a piece of string about 5 m long. Stretch it out on the table (doubling it if
necessary) and measure its length ls. Wad the string up and carefully measure its
mass ms. Record both values in Data Table 1.
2) Calculate the string’s linear density and record its value in Table 1.
3) Cut about a 2-m piece of your string and tie a loop in each end. Slip one loop over a
vertical support rod that is clamped to the table. Pass the string over a pulley that is
clamped to the end of the lab table about 1.5 m away and hook a mass hanger in the
other loop.
4) Place the wave driver under the string near the vertical support rod. Slide the loop
down the support rod until the string rests in the slot on the top of the wave driver.
Use banana-plug patch cords to connect the wave driver to the output of the power
amplifier. With the power switched off, plug the Power Amplifier into Analog
Channel A. Note that in some experimental arrangements the Power Amplifier is not
necessary.
5) Place 1 kg mass on the hanger, however more or less may be required depending on
the experimental arrangement.
6) Measure the length of string L between the vibrator and the top of the pulley. Record
this length in Table 1.
7) Turn everything on and set amplitude to 1 V (or as near as possible). Vary the
frequency until the string vibrates (resonates) at its fundamental frequency (one
segment). Adjust the frequency only to obtain the greatest amplitude possible.

Modified January 4, 2015 (check reverse side of page) Page 61 of 161
8) Vary frequency to get higher and higher harmonics (2, 3, etc. segments) and record
resonance frequencies up to 7 segments in Table 1.
9) Add approximately 0.5 kg to the mass hanger and repeat Steps 7 and 8.
10) Add (approximately) an additional 0.5 kg to the mass hanger and repeat Steps 7 and
8.
11) You should have three sets of data – one for each mass.
12) From the frequencies, calculate the periods, T.
13) For each of the three different masses, plot wavelength vs. period for the different
harmonics. Find the best fit line and make sure it intercepts zero if it is supposed to.
Be sure to write the equation the graph is plotting on the graph and identify what the
slope represents. Attach the graphs.
14) Tabulate the slopes, wave speed, of each line from the graphs in Table 2.
15) Compare the measured wave speeds to theoretical wave speed and calculate and
enter in Table 2.
Post-Lab Questions – Answer on a separate page and attach
1) In the graphs of wavelength vs. period, what should the slope represent?
2) Should the plot of wavelength vs. period intercept zero? Explain.
3) For each of the three different cases, what were the fundamental frequencies and
wavelengths?
4) How many natural frequencies (normal modes) does a simple pendulum have? A
mass on a spring? Explain.
5) A violin’s E string vibrates at 660 Hz, the distance between clamps is 330 mm, and
. What is the tension at resonance?
6) What length would the string in Question 5 need to be to resonate at 880 Hz (A about
concert A)? How is that length achieved during play by a violinist?
7) What would the string in Question 5 require to resonate at concert A (440 Hz)? Is
this a thicker or thinner string than the string of Question 5?
8) An tube open at both ends behaves similarly to a standing wave on a string. For the
lowest resonance frequency, half a wavelength is the length of the tube, however the
open ends are antinodes instead of nodes (like a string). A closed end makes a node.
So a tube closed at one end consists of a node and antinode. Express, as a function
of the tube’s length L, the sequence of resonance wavelengths of a closed tube.
9) A closed tube is 30 cm long and the speed of sound is 343 m/sec. What are the first
three harmonics of that tube?

Modified January 4, 2015 (check reverse side of page) Page 62 of 161
Page left intentionally blank

Modified January 4, 2015 (check reverse side of page) Page 63 of 161
Lab 13 Report: Names _____________________________________________
Table 1 – Data Table Recording Mass, Wavelength, Mass Density, Etc.
String Mass, ms = ________ ( ), String Length, ls = ________ ( )
Mass Density, = ________ ( ), Distance between string clamps, L = ________
( )
Mass on
Hanger
Tension
Force
Theoretical
Wave
Speed
Harmonic
n
Wavelength
l
( )
Frequency
f
( )
Period
T
( )
Mh =
________
( )
FT =
________
( )
vt =
________
( )
1
2
3
4
5
6
7
Mh =
________
( )
FT =
________
( )
vt =
________
( )
1
2
3
4
5
6
7
Mh =
________
( )
FT =
________
( )
vt =
________
( )
1
2
3
4
5
6
7

Modified January 4, 2015 (check reverse side of page) Page 64 of 161
Table 2 – Theoretical vs. Measured Wave Speed
Mass ( )
Theoretical Wave
Speed, vt
( )
Measured Wave
Speed, vm
( )
Percent Error

Modified January 4, 2015 (check reverse side of page) Page 65 of 161
Page left intentionally blank

Modified January 4, 2015 (check reverse side of page) Page 66 of 161
University Physics Workbook Part I Specific Heat of Substances
Purpose:
To determine the specific heat of various substances, understand the first law of
thermodynamics, energy conversation, and compare this to accepted values.
Factors to be Related
Cs Specific heat of substance
Cc Specific heat of calorimeter cup
Cw Specific heat of water
Ms Mass of substance
Mc Mass of calorimeter cup
Mw Mass of water
Ts Original temperature of substance
Tw Original temperature of water
Tf Final temperature of water and substance
Theory
The specific heat of a substance is the amount of heat necessary to raise the
temperature of one gram of the substance one degree Celsius. The heat capacity of a
substance is the amount of heat necessary to raise the temperature of a given mass of the
substance one degree Celsius. The heat capacity of a substance is MsCs. The amount of
heat lost by a mass of substance in dropping from one temperature to another is the mass
of the substance multiplied by its specific heat and that result multiplied by the difference
in temperatures.
To determine the specific heat of a substance, suspend a mass of the substance at a
high temperature into a mass of water at a lower temperature. Then determine the final
temperature of the water. Applying the law of conservation of energy, the heat lost by the
substance is equal to the heat gained by its environment.
The amount of heat lost by the substance is ........................ MsCs(Ts - Tf)
The heat gained by the water is ........................................... MwCw(Tf - Tw)
The amount of heat gained by the calorimeter cup is .......... McCc(Tf - Tw)
The total measurable heat gained by the environment is ..... MwCw(Tf - Tw) + McCc(Tf - Tw)
From the law of conservation of energy the following equation is found:
MsCs(Ts - Tf) = MwCw(Tf - Tw) + McCc(Tf - Tw)
Apparatus
Calorimeter
Pot of boiling water
Substances of unknown specific heat
Thermometer
Bunsen burner & stand

Modified January 4, 2015 (check reverse side of page) Page 67 of 161
Procedure:
1. Start water boiling in pot and bring to vigorous boil. Each lab group may have its
own pot and burner OR your lab instructor may set up only one boiling pot for all
groups.
2. Find the mass of the substance to be tested (Ms).
3. Suspend substance in boiling water for 5 minutes. Measure the temperature, Ts.
4. Find the mass of the calorimeter cup (Mc).
5. Fill the calorimeter cup half full with water and find the mass again (Mc + Mw). Mix
cold and warm water to make it a few degrees lower than room temperature.
6. Determine the temperature of the water in the calorimeter (Tw).
7. Quickly remove substance from boiling water and put it into the calorimeter.
8. Find highest temperature to which calorimeter water rises (Tf).
9. Repeat procedure with two or more other substances.

Modified January 4, 2015 (check reverse side of page) Page 68 of 161
Page left intentionally blank

Modified January 4, 2015 (check reverse side of page) Page 69 of 161
Team Assessment Form
Date ______ Course ___________ Your Name _________________________________
Your name is required for credit for one lab – you will be credited with a 100% grade for
participation in this survey. Please be as accurate as possible.
Please rate your teammates on the following:
Teammate
__________ __________ __________ __________ __________
Contributions to Team Interaction (choose one for each teammate): Interacts poorly,
inconsistently, or
not at all
Interacts with
team members to
accomplish the
objective
Provides
leadership in
helping the team
accomplish the
objective
efficiently
Individual Contributions (choose one box for each teammate):
Is unprepared
Is adequately
prepared
Prepared more than
was assigned
Contribution to Team Purpose/Goal (choose one box for each teammate): Did not contribute,
or poor contribution,
to lab group
Adequate
contribution to lab
group
Superior contribution
to lab group

Modified January 4, 2015 (check reverse side of page) Page 70 of 161
Page left intentionally blank

Modified January 4, 2015 (check reverse side of page) Page 71 of 161
Appendix A: Table of Accepted Densities
Complete Table of Densities (at
http://www.periodictable.com/Properties/A/Density.html)
Solids
S.G. (Specific Gravity)
– no units
Liquids &
Gases
S.G.
(Specific
Gravity) –
no units
Gold (Au) 19.3 19.3 Mercury
(Hg) 13.6 13.6
Lead (Pb) 11.3 11.3 Water 1.0 1.0
Silver (Ag) 10.5 10.5 Oil 0.9 0.9
Copper
(Cu) 8.9 8.9 Alcohol 0.8 0.8
Steel (Fe) 7.8 7.8 Antifreeze
1.125
(32°F)
1.098
(77°F)
1.125
(32°F)
1.098
(77°F)
Tin (Sn) 7.29 7.29 Air 1.29*10
-
3
1.29*10-3
Zinc (Zn) 7.14 7.14 Hydrogen 9.0*10-5
9.0*10-5
Aluminum
(Al) 2.7 2.7 Oxygen
1.43*10-
3
1.43*10-3
Brass 8.4 – 8.7 8.4 – 8.7
Balsa
Wood 0.3 0.3
Oak 0.8 0.8
Earth
Average 5.52 5.52
Crown
Glass
(ordinary,
no-lead
glass)
2.4 – 2.8 2.4 – 2.8

Modified January 4, 2015 (check reverse side of page) Page 72 of 161
Appendix B: Table of Specific Heats
Specific heats for various substances at 20 °C
Substance c
c
,
, or
Aluminum 0.900 0.215
Iron (Steel) 0.45 0.108
Copper 0.386 0.0923
Brass 0.380 0.092
Gold 0.126 0.0301
Lead 0.128 0.0305
Silver 0.233 0.0558
Glass .84 0.20
Water 4.186 1.00
Ice (-10 C) 2.05 0.49
Steam 2.08 0.50
Mercury 0.140 0.033
Alcohol(ethyl) 2.4 0.58

Modified January 4, 2015 (check reverse side of page) Page 73 of 161
Appendix C: Periodic Table of the Elements LIGHT METALS
IA VIIIA
Hydrogen Helium
1 4.003
H He
1 IIA IIIA IVA VA VIA VIIA 2Lithium Beryllium Boron Carbon Nitrogen Oxygen Fluorine Neon
6.939 9.012 10.811 12.01115 14.007 15.999 18.998 20.183
Li Be B C N O F Ne
3 4 5 6 7 8 9 10Sodium M agnesium Aluminum Silicon Phosphorus Sulfur Chlorine Argon
22.99 24.312 26.981 28.086 30.974 32.064 35.453 39.948
Na Mg Al Si P S Cl Ar
11 12 13 14 15 16 17 18Potassium Calcium Scandium Titanium Vanadium Chromium M anganese Iron Cobalt Nickel Copper Zinc Gallium Germanium Arsenic Selenium Bromine Krypton
39.102 40.08 44.956 47.9 50.942 51.996 54.938 55.847 58.933 58.71 63.54 65.37 69.72 72.59 74.922 78.96 79.909 83.8
K Ca Sc Ti V Cr Mn Fe Co Ni Cu Zn Ga Ge As Se Br Kr
19 20 21 22 23 24 25 26 27 28 29 30 31 32 33 34 35 36Rubidium Stront ium Yttrium Zirconium Niobium M olybdenum Technet ium Ruthenium Rhodium Palladium Silver Cadmium Indium Tin Ant imony Tellurium Iodine Xenon
115.17 87.62 88.905 91.22 92.906 95.94 99 101.07 102.91 106.4 107.87 112.4 114.82 118.69 121.75 127.6 126.9 131.3
Rb Sr Y Zr Nb Mo Tc Ru Rh Pd Ag Cd In Sn Sb Te I Xe
37 38 39 40 41 42 43 44 45 46 47 48 49 50 51 52 53 54Cesium Barium Hafnium Tantalum Tungsten Rhenium Osmium Iridium Plat inum Gold M ercury Thallium Lead Bismuth Polonium Astat ine Radon
132.9 137.34 178.49 180.95 183.85 186.21 190.2 192.2 195.09 196.97 200.59 204.37 207.19 200.98 (210) (210) (222)
Cs Ba Hf Ta W Re Os Ir Pt Au Hg Tl Pb Bi Po At Rn
55 56 72 73 74 75 76 77 78 79 80 81 82 83 84 85 86Francium Radium
22.3 (226)
Fr Ra
87 88
Lanthanum Cerium Praseodymium Neodymium Promethium Samarium Europium Gadolinium Terbium Dysprosium Holmium Erbium Thulium Ytterbium Lutet ium
138.91 140.12 140.91 144.24 (147) 150.35 151.96 157.25 158.92 162.5 164.93 167.26 168.93 173.04 174.97
La Ce Pr Nd Pm Sm Eu Gd Tb Dy Ho Er Tm Yb Lu
57 58 59 60 61 62 63 64 65 66 67 68 69 70 71Actinium Thorium Protact inium Uranium Neptunium Plutonium Americium Curium Berkelium Californium Einsteinium Fermium M endelevium Nobelium Lawrencium
227 232.04 (231) 238.03 (237) (242) (243) (247) (249) (251) (254) (253) (256) (254) (257)
Ac Th Pa U Np Pu Am Cm Bk Cf Es Fm Md No Lr
89 90 91 92 93 94 95 96 97 98 99 100 101 102 103
57-71
118110 111 112 113 117114 115 116
NON METALS
108 10989-
103 104 105 106 107
Group VIIA includes the halogens .
Group IA includes hydrogen and the alkali metals .
In the periodic table the elements are arranged in order of increasing atomic number. Vertical
columns headed by Roman. Numerals are called Groups . A horizontal sequence is called a Period .
The most active elements are at the top right and bottom left of the table. The staggered line
(Groups IIIA and VIIA) roughly separates metallic from non-metallic elements.
The elements intervening between groups IIAand
IIIA are called transition elements .
Groups - Elements within a group have
similar properties and contain the same
number of electrons in their outside energy
shell.
Periods - In a given period the properties of
the elements gradually pass from a strong
metallic to a strong non-metallic nature, with
the last number of a period being an inert gas.
Short vertical columns without Roman numeral
headings are called sub-groups.

Modified January 4, 2015 (check reverse side of page) Page 74 of 161
University Physics Workbook Part I Appendix D: Quick Questions
1) Is it faster for a bicycle rider (or motorcyclist) to stop, turn the bicycle instantly
180°, and accelerate up to speed or to ride in a circle? Explain.
2) If you pull backward on a bicycle pedal, which way will the bicycle move?
Explain.
3) Racers race 800 km and the leaders are neck and neck racing at 320 km/hr (kph).
One develops car trouble after 75 min. and is in the pit 75 min. How fast does the
driver have to travel to catch up to the leader? Explain.
4) An airplane takes off and travels 1 hr at 400 kph in one direction. It changes
direction and travels 1.5 hr at 300 kph in a second direction. What is the
maximum distance from the starting point? What is the minimum distance?
5) Two balls are released. On drops straight down and the other has an initial
horizontal velocity. Which one hit the ground first? Explain.
6) A monkey is hanging from a tree and a boy takes a BB gun and aims it straight at
the monkey (if you looked down the barrel the monkey would be at the center).
At the instant the boy fires, the monkey releases its hold on the tree. Ignoring air
resistance, will the BB hit the monkey? Will it make a difference is the the BB
gun is aimed up or down at an angle? Explain.
7) On a cliff over the water you are throwing rocks into the water. You give two
rocks the same horizontal velocity. The vertical velocity is the same magnitude,
but in one case it’s up and in the other case it’s down. Will the vertically thrown
rock have less velocity, the same velocity, or greater velocity when it hits the
water? Explain.
8) An ice cube is floating in water. What is the total force acting on it? If you take
this to the Moon (gmoon = g/6) what will be the new mass? New weight? New
total force on the ice cube? Explain.
9) What is the total force acting on an airplane in straight and level flight? Explain.
10) How much work is done when you do isometric exercises? How much work do
you do swinging an object in a circle? Explain.
11) If a 150 kg lineman tackles a 70 kg kicker, who exerts the larger force? Explain.
12) Two ice skaters (no friction) initially at rest push away from each other. What is
the total momentum? Explain.
13) A mile long stretch of iron railroad track is laid with both ends fixed at 20° C. A
heat wave comes along with temperatures of 50° C. Young’s
Modulus = 200*109 N/m
2 and thermal expansion coefficient = 11*10
-6 /° C.

Modified January 4, 2015 (check reverse side of page) Page 75 of 161
University Physics Workbook Part I Appendix E: Lecture Worksheets
The following worksheets have questions that may require extra pages. They are
designed so that extra pages may be stapled to the worksheet and handed in to the
instructor.

Modified January 4, 2015 (check reverse side of page) Page 76 of 161
Project
Date: _____________ Class:_______________ Section (day/time) _______________ Minimum 2, Maximum 5 people per group – when it gets to 6, split the group in half.
Names (write legibly,
include last names) ______________________, ______________________,
______________________, ______________________, ______________________
In-class groups will participate in a project and present a tri-fold display at the end of
the semester. This is very much like a K-12 high school science fair project. Research
science fair guidelines, and compare to this, to get ideas, but you will be held accountable
to meet the following guidelines.
Due to the short length of Summer semesters, Summer classes are exempt from a
project requirement. Homework will assume greater importance.
Tri-fold Required (see photo above) at or prior to end of semester. See below for
guidelines. Also refer to the science poster, writing in science, and writing in
engineering.
Project ideas: Archimede's screw (water pump), Foucault's pendulum (no model -
difficult to build), magnetic levitation, or CHOOSE YOUR OWN.
You may have an idea. If you have an idea, discuss it me, your other professors,
and/or contact me. I am looking for a step up from the baking soda and vinegar volcano.
But can you design a project to use baking soda and vinegar to weigh air?
Potential opportunity some semester:
Some semesters we have disabled students who need notetakers. Being a
notetaker satisfies project requirement, however a tri-fold poster is still required
and must have science content.
Project requirements:
1. Progress Reports:
(a) Plan: Due about 1/3 way through semester (see syllabus). Your plan must
include a timeline and who is doing what tasks. This spreadsheet is
provided as an example: spreadsheet.
Your plan must also include your hypothesis and experiment design.
What are you testing?
(b) Progress Report: Due about 2/3 way through semester (see syllabus). Be
honest – are you on track to finish?
2. Working model if project is amenable to a working model. Check with me if in
doubt.
3. Tri-fold Poster Guidelines: A Tri-fold poster is required at last day of class.
The library or writing lab can help AND you get ICHA credit for utilizing the
writing center. Organization:
(a) Title (include names of group members)
(b) Brief description (~1 paragraphs)
(c) Introduction - more thorough discussion of background, history, &
theory. For trifold make these bullet points.

Modified January 4, 2015 (check reverse side of page) Page 77 of 161
(d) Experiment - Describe equipment and procedure. Vary factors and test
the outcomes. View labs as examples. Ask similar questions relating to
your project. What did it do? For example, if you build a battery, what
was the voltage and how long did it run a light bulb.
(e) Results - Take the data, analyze it, and try to draw conclusions. In
general we report results and not raw data.
(f) Discuss Results - What to the results mean or imply? Discuss cause and
effect. Did your project meet expectations or not? What would you do
differently in the future?
(g) Brief, Key Conclusions (h) Cite all non-original sources using MLA or APA style. Pick one or the
other (MLA or APA), but be consistent. The library or writing lab can
help. Remember, if you cite the source it's research, if you don't it's
plagiarism.
(i) Think for yourself. Gather research sources, however contribute your own
thoughts and conclusions. If too much of your tri-fold is citations you
won't be accused of plagiarism, but the grade may suffer from lack of
originality.
(j) Edit ruthlessly. The emphasis of a tri-fold poster is on visual information
& completeness yet very concise
(k) Email me an electronic version of your poster text and photos.
(l) NO FLIPPING PAGES. Everything must be visible from the front
including group member names & citations.
Grading: Your grade will depend on how well you comply with these requirements.
Sometimes things don't work out as we plan. Your grade, therefore, will not depend
on whether the project works. If it doesn't work I'll be looking for a good explanation of
what went wrong; a good attempt; a clear explanation of your project, construction, and
procedures; valid testing; results and conclusions; and good tri-fold presentation.

Modified January 4, 2015 (check reverse side of page) Page 78 of 161
Page left intentionally blank

Modified January 4, 2015 (check reverse side of page) Page 79 of 161
Moon’s Motion
Date: _____________ Class:_______________ Section (day/time) _______________ Minimum 2, Maximum 5 people per group – when it gets to 6, split the group in half.
Names (write legibly,
include last names) ______________________, ______________________,
______________________, ______________________, ______________________
The Sun and the Moon are the two astronomical objects that are most evident to us.
In this ICA we seek to understand on a basic level how the Moon moves around the Earth
and to explain why we reached our conclusion.
Equipment: Your eyes and brains and your teammates
Procedure: Over the period of this class, observe the moon nightly (or daily). Work as
a team - if one person forgets to observe, another teammate can pick up the slack. Also
for analysis you'll need to discuss this with each other. Sketch the image of the moon
similar to below - be sure to label North, South, East, and West. The four most common
phases follow:
Note that directions are laying on your back with your head to the North looking UP
into the sky. In this case East is to the left. If you look DOWN at a map, East is to the
right.
Also report Moon rise or Moon set. You may estimate this, for example, if the Moon
is halfway up in the sky at sunset, Moonrise was about 6 hr before and Moonset about 6
hr after. Take data for at least one full cycle. Note that about a week before the New
Moon the Moon rises just before dawn and is hard to observe at other times. Fill in the
best you can.
A calendar is helpful to record your observations – draw the sketch and estimated
Moonrise and Moonset in the space for each day of the calendar.
Very Important Analysis: This assignment is incomplete until you can successfully
reason, and explain your reasoning based on your observations, how and which direction
the Moon moves around the Earth. Sketches, like below, and models are very helpful.

Modified January 4, 2015 (check reverse side of page) Page 80 of 161
Page left intentionally blank

Modified January 4, 2015 (check reverse side of page) Page 81 of 161
Planning for College
This is an individual take-home assignment. Name: ______________________________
Date: _____________ Class:_______________ Section (day/time) _______________
What are you going to do with the rest of
your life and how will college help? Figure out
what you enjoy doing, what you're good at, and
what you can be paid for. See the figure to the
right. The sweet spot, the center, is where you
want to go.
Steps To Get There -- GRADUATE! To graduate, or any other goal, Plan your
work and work your plan!
Assignment: Create a specific degree plan. For each
semester make three columns. The first is the
course you will be take, the second column is the number of credits, and the third column
is to what degree requirement does the class apply. Does the class apply to your 2 year
degree, your 4 year degree, and/or does it apply toward your major?
If you haven’t decided on you major, choose the major you are currently leaning
towards. If you’ve partially completed your degree write down what you’ve done and
what you still need to do indicating which is which.
Why make a best guess now if you're undecided. If you plan, now, to travel from
Tyler, TX to Los Angeles, CA, and you change your mind deciding to go to San Diego,
CA, it's easier to change your destination half-way there than it is to start from Tyler.
Just be sure you're not taking the Hasting's Cutoff (the "shortcut" the Donner Party) – try
to avoid a drastic change in majors. A few more things:
If you feel there is something unusual in your plans, write a note about it.
But be as specific as possible
You have one week to complete this assignment - it is due the first meeting of
the second week of class. Bug advisors and instructors, search sites (including TJC’s, UTT’s, or the 4 year
college you plan to attend).
Do your homework now - it will save you time, energy, and money!

Modified January 4, 2015 (check reverse side of page) Page 82 of 161
Page left intentionally blank
Modified January 4, 2015 (check reverse side of page) Page 83 of 161
Penny Mass (Density)
Date: _____________ Class:_______________ Section (day/time) _______________ Minimum 2, Maximum 5 people per group – when it gets to 6, split the group in half.
Names (write legibly,
include last names) ______________________, ______________________,
______________________, ______________________, ______________________
Taking accurate measurement is one of the most important aspects of studying
physics or, indeed, any other quantitative discipline. You may find these results
surprising.
Mass is the amount of matter in an object. Technically, mass is a measure of the
inertia of an object and inertia is how much an object resists change in velocity. On the
other hand, weight is a special type of force - the force gravity exerts on an object. The
mass is the same on the Earth and the Moon, but weight is different because the Moon's
gravity attracts less.
Equipment required - pennies, balance, and graph paper
Procedure
1) Important! Without anything on the mass balance, adjust it so it reads zero.
2) Carefully find the mass of 10 different pennies chosen randomly to the nearest
tenth of a gram and record data below
3) Pennies most likely do not have identical masses. To find patterns in data people
create a type of graph called a histogram which plots the frequency of each
measurement. The vertical (y) axis on a histogram is the frequency and
horizontal (x) axis is the mass (increments of a tenth of a gm). Using the graph
paper provided (or your own), create a histogram of the mass.
4) Can the pennies be divided into groups based on mass? Explain (attach extra
pages if needed).
5) Calculate mean and standard deviation. You are probably familiar with the
formula for mean, but standard deviation, a measure of the spread, is probably
unfamiliar. The formulas are:
Data and Results – create two columns on your paper. Label the first Penny # and the
second mass (gm). Record data. On the last row enter your m and s calculations.
Analysis
What do you observe about the mass of the pennies (examine histograms)? Do the
pennies look the same? If all the pennies look the same, explain why mass is different?
How might you analyze the information differently to provide meaningful information?
Perform your revised analysis. Show your results (on a separate sheet of paper if
necessary). What do you conclude?

Modified January 4, 2015 (check reverse side of page) Page 84 of 161
Page left intentionally blank

Modified January 4, 2015 (check reverse side of page) Page 85 of 161
Roadrunner
Date: _____________ Class:_______________ Section (day/time) _______________ Minimum 2, Maximum 5 people per group – when it gets to 6, split the group in half.
Names (write legibly,
include last names) ______________________, ______________________,
______________________, ______________________, ______________________
Frequently we will watch a Roadrunner cartoon to find physical law violations in those
cartoons. When we do, get with your ICA group, watch the cartoon with the rest of the
class, then discuss and list the physical law violations observed. You may use this form
and/or a separate piece of paper.
Description of Scene Name the Law Violated How was the Law Violated?

Modified January 4, 2015 (check reverse side of page) Page 86 of 161
Page left intentionally blank

Modified January 4, 2015 (check reverse side of page) Page 87 of 161
Roadrunner Speed
Date: _____________ Class:_______________ Section (day/time) _______________ Minimum 2, Maximum 5 people per group – when it gets to 6, split the group in half.
Names (write legibly,
include last names) ______________________, ______________________,
______________________, ______________________, ______________________
1) In today's Roadrunner cartoon, in addition to identifying scenes where a physical
law is violated (and which law is violated and how it was violated), estimate the
Roadrunner's speed. What is your estimate? Show calculations.
2) Based on your estimate, what do you think the problems might be going that
fast? Presuming the estimate is less than the speed of light it's possible for an
object to go that fast, but other things happen at speeds slower than light speed,
but still fast compared to, for example, a jet airplane. What are those "other
things" and what might they do to the Roadrunner?
3) Also get with your ICHA group, watch the rest of the cartoon, then discuss and
list the physical laws and/or violations. Use a separate piece of paper as needed.
Description of Scene Name the Law Violated How was the Law Violated?

Modified January 4, 2015 (check reverse side of page) Page 88 of 161
Page left intentionally blank

Modified January 4, 2015 (check reverse side of page) Page 89 of 161
Supergirl’s Jump
Date: ______________________
Class: ______________________
Section (day/time) ____________ Minimum 2, Maximum 5 people per group – when it gets to 6, split the
group in half.
Names (write legibly,
include last names) ______________________, ______________________,
______________________, ______________________, ______________________
Originally Kryptonites (people from Krypton, that is, Superman, Supergirl, etc.)
could only leap - they couldn't fly. Let's figure out how fast Supergirl must take-off to
jump to the top of the steeple (21.0 m) or other local towers. The pre-calculus and
calculus based classes also have to figure out the acceleration required.
Why did I use the character of Supergirl and not Superman? Women have made
great contributions in Science, Technology, Engineering, and Math, but have not always
been recognized. Among other things women did the astronomy calculations in
nineteenth and early twentieth century, broke the German and Japanese codes in WW II,
and discovered splitting of the atom. Also in WW II the armed forces were segregated,
but blacks served behind the lines as engineers building road and bridges and other
meritorious duties. Science, Technology, Engineering, and Math does not differentiate
by race, religion, gender, ethnic origin, or any other differences. EVERYBODY is
capable of doing math and science.
1) The first thing to do is figure out how high she must jump. There are several
methods to do this, length of shadows, a photo and application of trigonometry,
an inclinometer (at exploratorium site - lot's of good stuff there). Since the point
of this ICHA is not height measurement your instructor will help with this.
2) After the jump, Supergirl's vertical velocity will decrease at a constant rate
(acceleration) given by g (9.8 m/sec2). First, what is the AVERAGE vertical
velocity in terms of time and distance?
3) Second, what is the average vertical velocity in terms of the PEAK velocity (the
speed of take-off)
4) Third step: Equate the answers from the first and second question and solve for
time in terms of distance and take-off velocity.
5) Fourth step: Using another equation, what is the time in terms of acceleration due
to gravity, g, and take-off velocity?
6) Equate the results of Steps three and four and solve for velocity - this should give
you velocity in terms of distance and g.
7) Finally, plug in numbers for height and g and solve for the take-off velocity. If
you used numbers before this step, you did something wrong.
8) Advanced classes, how would you figure the take-off acceleration? Presume
Supergirl can accelerate over a distance of 1 m. Show all your work below (or
attach sheets).
9) For calculus based classes, show how to use calculus to figure takeoff velocity
and acceleration.

Modified January 4, 2015 (check reverse side of page) Page 90 of 161
Page left intentionally blank

Modified January 4, 2015 (check reverse side of page) Page 91 of 161
Treasure Hunt
Date: _____________ Class:_______________ Section (day/time) _______________ Minimum 2, Maximum 5 people per group – when it gets to 6, split the group in half.
Names (write legibly,
include last names) ______________________, ______________________,
______________________, ______________________, ______________________
1) Begin at the bottom (south side) of the sundial. In case of rain your instructor will
provide alternative instructions.
2) Take 5 paces (a pace is two steps) south-west.
3) Then take 10 paces south. If you run into flower beds don't tramp through them.
Have one group member point south and the other pace the distance, then figure
out position at the end.
4) There should be a message at the location. Pick it up and read it.
5) Draw the vectors to scale showing tail-to-tip addition and measure the resulting
vector magnitude, angle, x coordinate, and y coordinate.
6) Now run the numbers. Using trigonometry calculate the resulting vector
magnitude, angle, x coordinate, and y coordinate.
7) What is the length of the resultant vector? The angle? The x coordinate? The y
coordinate? Does this come close to your sketched estimate?
8) Show your calculations. If it matches the paper you picked up, your instructor
will give you a "treasure."

Modified January 4, 2015 (check reverse side of page) Page 92 of 161
Page left intentionally blank
Modified January 4, 2015 (check reverse side of page) Page 93 of 161
Supergirl’s Force
Date: ______________________
Class: ______________________
Section (day/time) ____________ Minimum 2, Maximum 5 people per group – when it gets to 6, split the
group in half.
Names (write legibly,
include last names) ______________________, ______________________,
______________________, ______________________, ______________________
1) Originally Kryptonites (people from Krypton, that is, Superman, Supergirl, etc.)
could only leap - they couldn't fly. Let's figure out how hard Supergirl must push
to jump over TJC chapel steeple (21.0 m high). Last time you calculated how fast
she must take-off. What was that value (or recalculate it now)?
2) When she crouches to leap and then pushes, she pushes (uniformly accelerates)
over a distance of about 1 m. Derive or find the appropriate equation that applies.
3) What is her acceleration? Show work.
4) What is the equation to find force given mass and acceleration?
5) Supergirl has a mass of 54 kg. How hard does she have to push? That is, what
force does she exert to take-off? Show work.
6) Superman has a mass of 101 kg. How hard does he have to push to reach the
same speed? Show work.
7) According to DC Comics Supergirl is only 80% as strong as Superman, but let's
make our life easier and assume they're equally strong. If they are equally strong,
who can leap higher? Why? Explain.
8) Calculus based classes need to go further. Superman’s strength is more than
1017
N – let’s just assume he can exert 1017
N force which would make
Supergirl’s strength 1016
N. Compare Superman and Supergirl’s final velocity if
the push with their maximum force.

Modified January 4, 2015 (check reverse side of page) Page 94 of 161
Page left intentionally blank

Modified January 4, 2015 (check reverse side of page) Page 95 of 161
Weighing Air
Date: _____________ Class:_______________ Section (day/time) _______________ Minimum 2, Maximum 5 people per group – when it gets to 6, split the group in half.
Names (write legibly,
include last names) ______________________, ______________________,
______________________, ______________________, ______________________
Did you know Archimedes invented the raygun? See the picture above - He did! He
also figured out how a goldsmith cheated a king. We're going to use the same principle
to weigh air.
1) We have evacuated Magdeburg hemisphere's with us today which means it
doesn't have any air inside. What's the mass to the nearest tenth gm? Call this
quantity mt (empty - get it) and be sure to list quantities as equations with units,
for example, mt = xxx.x gm (each x represent a digit). mt is NOT the true mass of
the hemispheres. Remember, the mass balance actually measure FORCE exerted
on the scale. So what force is exerted in N? Call this ft.
2) Pressure is force per unit area. One atmosphere pressure is 101,325 N/m2 at sea
level and 15°C. The force holding the hemispheres together is the cross-sectional
area times pressure. To get a rough idea how much this is, try pulling the
Magdeburg hemisphere's apart. Was it easy or hard? Did it take more than one
person?
3) Now that you've pulled it apart (or let the air back in), what is the mass now to the
nearest tenth gm? Call this quantity ma (mass apart). Pick symbols for your
quantities that mnemonically remind you of what that quantity represents.
4) What is the weight in N? Call this Fa remembering that weight is just a special
type of force. The force of gravity.
5) What is the inside diameter to the nearest mm?
6) Calculate the volume of the hemisphere in m3. Do you know the formula for the
volume of a sphere on the top of your head? This is such a common formula that
science students should know it by heart. It is: V = 4πr3/3.
7) Archimedes' Principle tells us that the buoyant force equals the weight of the fluid
(in this case air) displaced. When the hemispheres are separated there is no
buoyant force. Draw force diagrams for our two cases - the hemispheres
evacuated and the hemispheres pulled apart. Although Archimedes’ deals with
fluids, which is in a later chapter, it is introduced when we discuss force because
it REALLY helps you understand force balance.
8) From the force balance sketches you just made, derive a formula for the buoyant
force in terms of your known quantities. It's a good idea to work things out using
scratch paper and putting your final derivation here afterward.
9) Now calculate the buoyant force.
10) Buoyant force is the weight of the air displaced. Calculate the mass of air in kg
and density in kg/m3?
11) The accepted value is 1.28 kg/m3. Calculate your percent difference. If you're
within 30% you're doing well. Why is this measurement so inaccurate?

Modified January 4, 2015 (check reverse side of page) Page 96 of 161
Page left intentionally blank

Modified January 4, 2015 (check reverse side of page) Page 97 of 161
Supergirl’s Energy
Date: ______________________
Class: ______________________
Section (day/time) ____________ Minimum 2, Maximum 5 people per group – when it gets to 6, split the
group in half.
Names (write legibly,
include last names) ______________________, ______________________,
______________________, ______________________, ______________________
1) Originally Kryptonites (people from Krypton, that is, Superman, Supergirl, etc.)
could only leap - they couldn't fly. Let's figure out how much energy she needs to
jump to the top of the TJC chapel steeple (21.0 m high).
2) If Supergirl is leaping over something else, how tall is it?
3) Last time you calculated how fast she must take-off. What was that value (or
recalculate it now on the back of the paper)?
4) What is the equation for kinetic energy?
5) What is her kinetic energy? Her mass is 54 kg. Show work.
6) Energy is not lost or gained. What form of energy does her kinetic energy
transform into?
7) What is her gravitational potential energy at the top?
8) From gravitational potential energy, derive a working equation for the height?
9) Calculate the height. Show work.
10) How does this height compare with the height you started with. Is this
reasonable? Why? Explain.

Modified January 4, 2015 (check reverse side of page) Page 98 of 161
Page left intentionally blank

Modified January 4, 2015 (check reverse side of page) Page 99 of 161
Supergirl’s Power
Date: ______________________
Class: ______________________
Section (day/time) ____________ Minimum 2, Maximum 5 people per group – when it gets to 6, split the
group in half.
Names (write legibly,
include last names) ______________________, ______________________,
______________________, ______________________, ______________________
1) Last time you calculated the energy it takes Supergirl to jump over the TJC chapel
steeple. When she leaps she expends this power is a very short period of time - the
time it takes to extend her legs (1 m).
2) If the object Supergirl is leaping over is not 21.0 me (the steeple’s height), how
tall is it?
3) Last time you calculated how fast she must take-off. What was that value (or
recalculate it now on the back of the paper)?
4) Either find or derive the formula for time if you know speed and distance. What is
that formula?
5) Now do the calculation to find time. ALWAYS write answer in form of and
equation and include units, for example, t = 10.2 sec.
6) Last time you calculated the kinetic energy. What was that value (or recalculate it
now on the back of the paper)?
7) From the information in Steps 4 & 5, calculate power.
8) Recalculate power required if she jumped over a 30 m building. 60 m. 90 m,
120 m, etc. Keep going until you see a pattern. Use the SOLVE method one
VALID equation per line, keep 3 sig figs & units, express answer as equation
with units, & attach extra pages with complete work.
Power at 30 m =
Power at 60 m =
Power at 90 m =
Etc.
Pattern observed?

Modified January 4, 2015 (check reverse side of page) Page 100 of 161
Page left intentionally blank

Modified January 4, 2015 (check reverse side of page) Page 101 of 161
Supergirl’s Momentum
Date: ______________________
Class: ______________________
Section (day/time) ____________ Minimum 2, Maximum 5 people per group – when it gets to 6, split the
group in half.
Names (write legibly,
include last names) ______________________, ______________________,
______________________, ______________________, ______________________
The original Superman couldn't fly – he could only "leap over tall buildings in a
single bound." By the time Supergirl came along he and she ould fly. But let's go back
to the original, pretend she could only jump, and, this time, figure out how much
momentum she needs to jumps to the top of the TJC chapel steeple.
1) If Supergirl is not jumping over the steeple (21.0 m), how high is the object.
2) Last time you calculated how fast she must take-off. What was that value (or
recalculate it now on the back of the paper)?
3) What is the equation for momentum?
4) What is her momentum? Her mass is 54 kg. Show work.
5) What is her momentum when she reaches the top?
6) Why did her momentum change? Explain.

Modified January 4, 2015 (check reverse side of page) Page 102 of 161
Page left intentionally blank

Modified January 4, 2015 (check reverse side of page) Page 103 of 161
Rocket Report
Date: _____________ Class:_______________ Section (day/time) _______________ Minimum 2, Maximum 5 people per group – when it gets to 6, split the group in half.
Names (write legibly,
include last names) ______________________, ______________________,
______________________, ______________________, ______________________
Observe the water rockets, record the information below, and attempt to surmise how to
improve the rockets performance.
Rocket Characteristics
How did it perform? How high
did it go?
How might it perform
better?

Modified January 4, 2015 (check reverse side of page) Page 104 of 161
Page left intentionally blank

Modified January 4, 2015 (check reverse side of page) Page 105 of 161
Yo-yo Centripetal Force
Date: _____________ Class:_______________ Section (day/time) _______________ Minimum 2, Maximum 5 people per group – when it gets to 6, split the group in half.
Names (write legibly,
include last names) ______________________, ______________________,
______________________, ______________________, ______________________
1) When twirling a yo-yo (or any mass on the end of a string) in a circle, there is a
centripetal force - the tension in the string. Our goal it to calculate it and compare
it to the weight creating the centripetal force.
2) What is the formula for centripetal force?
3) What is the mass of the yo-yo (Instructor supplied)? We'll call this my.
4) How long (R) is the string from the yo-yo (or other mass) to the center of rotation.
5) Use a timer to determine the angular velocity, ω, of the yo-yo. A good way to do
this is count 10 revolutions and find the time. Enter that here:
6) What is the time for one revolution, T?
7) Remember, angular velocity is the number of radians per second and there are 2π
radians per revolution. So the formula for angular velocity is 2π / T in units of
radians per second. Calculate and enter the angular velocity in radians per
second.
8) What is the formula for the speed the yo-yo is moving?
9) Calculate the speed.
10) Using the formula for centripetal force, calculate the centripetal force.
11) The mass pulling the string, mp, is what value?
12) What weight does mp exert?
13) Compare this weight to the centripetal force. Are they close? Why or why not?
Explain.

Modified January 4, 2015 (check reverse side of page) Page 106 of 161
Page left intentionally blank

Modified January 4, 2015 (check reverse side of page) Page 107 of 161
Moon Guns
Date: _____________ Class:_______________ Section (day/time) _______________ Minimum 2, Maximum 5 people per group – when it gets to 6, split the group in half.
Names (write legibly,
include last names) ______________________, ______________________,
______________________, ______________________, ______________________
If homo sapiens (us) every get to the point of waging war on the Moon, it would only
be necessary to pierce the armor of the habitats of vehicles of the enemy. Then the
occupants would die of asphyxiation.
Armor piercing rounds have typical velocities of 1400 m/sec to 1900 m/sec.
1) Why would it be a bad idea to fire some of those rounds (the faster ones) on the
Moon? Hint: Calculate the circular orbit velocity and escape velocity from the
Moon. G = 6.67428*10-11
N m2/kg
2, Rmoon = 1.737*10
6 m, and
Mmoon = 7.3477*1022
kg.
2) What is the maximum velocity round you could safely fire on the Moon? Show
all your work.

Modified January 4, 2015 (check reverse side of page) Page 108 of 161
Page left intentionally blank

Modified January 4, 2015 (check reverse side of page) Page 109 of 161
Rolling Race
Date: _____________ Class:_______________ Section (day/time) _______________ Minimum 2, Maximum 5 people per group – when it gets to 6, split the group in half.
Names (write legibly,
include last names) ______________________, ______________________,
______________________, ______________________, ______________________
How many of participated in a pinewood derby in Girl Scouts, Cub Scouts,
Brownies, or some other organization? In this competition you built a small model car
and rolled it down a ramp. The fastest car wins. We're going to do something similar.
We're going to roll several objects down a ramp and see which one goes fastest. Record
the objects being raced and their characteristics. Are they spherical, cylindrical, etc?
Solid or Hollow? Etc.
Object 1 &
Characteristics
Object 2 &
Characteristics
Who
won?
Why?

Modified January 4, 2015 (check reverse side of page) Page 110 of 161
Page left intentionally blank

Modified January 4, 2015 (check reverse side of page) Page 111 of 161
Yo-yo Torqure Force
Date: _____________ Class:_______________ Section (day/time) _______________ Minimum 2, Maximum 5 people per group – when it gets to 6, split the group in half.
Names (write legibly,
include last names) ______________________, ______________________,
______________________, ______________________, ______________________
My yo-yo has a spool diameter of ____________ and outer diameter of _____________.
1) What direction will it move when I pull it to the right as shown
in the figure at right?
2) What direction will it move when I pull it to the right again,
but as shown in the next figure?
3) What direction will it move when I pull it up as shown in the
figure below?
4) What the critical angle, θ, where it won't move? What
direction will it move if the angle is decreased slightly?
What direction will it move if the angle is increased
slightly?

Modified January 4, 2015 (check reverse side of page) Page 112 of 161
Page left intentionally blank
Modified January 4, 2015 (check reverse side of page) Page 113 of 161
Supergirl’s Breaks the Steeple
Date: ______________________
Class: ______________________
Section (day/time) ____________ Minimum 2, Maximum 5 people per group – when it gets to 6, split the
group in half.
Names (write legibly,
include last names) ______________________, ______________________,
______________________, ______________________, ______________________
Today we're going to figure out how hard Supergirl must push to break the steeple.
You will recall it is 21.0 m high.
1) First, proceed to steeple to measure the area of the legs supporting it.
2) What is the length and width of a column supporting the steeple? Be sure to
express values as equation with units with one equation per line. Attach extra
pages if needed.
3) Calculate the total area of columns supporting the steeple? Show all work.
4) Bricks and mortar (the clock tower) and concrete have about the same properties -
Young’s modulus of 20*109 Pa and strength (maximum stress in compression) of
20*106 Pa. You know the area and the maximum stress. Solve for and calculate
the force required to break the clock tower. Use the SOLVE method, keep 3 sig
figs and units, one equation per line (use extra paper if needed), & write answer as
equation.
5) What will be the change in height of the clock tower immediately prior to
breaking? Keep using our standard method of problem solving per Item 3.
6) The maximum stress in tension is smaller: 2*106 Pa. Repeat the calculations of
force and change in height if Supergirl tries to pull the clock tower apart.
7) How many ordinary, non-Kryptonian, people would it require to perform this feat
without pulleys or other machines? A rough estimate of the force a normal person
can exert is about 1000 N.
8) Is the answer to Item 6 sensible? Is that about what you expected before doing
calculations?

Modified January 4, 2015 (check reverse side of page) Page 114 of 161
Page left intentionally blank

Modified January 4, 2015 (check reverse side of page) Page 115 of 161
Sound Resonance
Date: _____________ Class:_______________ Section (day/time) _______________ Minimum 2, Maximum 5 people per group – when it gets to 6, split the group in half.
Names (write legibly,
include last names) ______________________, ______________________,
______________________, ______________________, ______________________
Today we're going to swirl a sound resonance tube and calculate the sound
resonances.
1) How long is the tube in m?
2) What are the first 4 longest wavelengths that fit in this tube for a resonating sound
wave? By this point in the semester I should not have to remind you about the
SOLVE method and keeping 3 sig figs and units.
3) The speed of sound is near 340 m/sec. What are the first 4 lowest frequencies?
4) Does this make sense? Below is a list of musical notes and frequencies.
5)
Note f (Hz) Next
octave
Note f (Hz) Next
octave
Note f (Hz)
A 110 A 220 Concert A 440
A sharp/B
flat 117
A sharp/B
flat 233
A sharp/B
flat 466
B 123 B 247 B 494
C 131 Middle C 262 C 523
C sharp/D
flat 139
C sharp/D
flat 277
C sharp/D
flat 554
D 147 D 294 D 587
D sharp/E flat 156 D sharp/E flat 311 D sharp/E flat 622
E 165 E 330 E 659
F 175 F 349 F 698
F#/G flat 185 F#/G flat 370 F#/G flat 740
G 196 G 392 G 784
G#/A flat 208 G#/A flat 415 G#/A flat 831
A 220 Concert A 440 A 880

Modified January 4, 2015 (check reverse side of page) Page 116 of 161
Page left intentionally blank

Modified January 4, 2015 (check reverse side of page) Page 117 of 161
Fluids
Date: _____________ Class:_______________ Section (day/time) _______________ Minimum 2, Maximum 5 people per group – when it gets to 6, split the group in half.
Names (write legibly,
include last names) ______________________, ______________________,
______________________, ______________________, ______________________
1) Take two pieces of ordinary paper and hold them hanging down
and loose per the figure at the right. Then blow between them as
shown. Do they attract, repel, or do nothing? Explain what is
happening. What you are
observing is called the Bernoulli
effect. Observe a water faucet (or
pouring water out of a bottle).
First, turn it on slowly so it comes
out smooth (this is called laminar
flow). What happens to the flow as
it speeds up from gravity? Does it
narrow or expand? As fluids move
faster they become turbulent
(turbulent flow). What changes
happen as you look down the
stream? Describe and sketch this
stream of water.The Bernoulli
effect ignores drag, however drag is
important in many fluids. Due to
high drag, baseballs behave just
the opposite of what the Bernoulli
effect predicts as shown below
right. Baseballs curve due to a drag
effect - the Magnus effect. Drag
can be observed with eggs since
raw eggs are a hard shell filled with a viscous fluid while a hard boiled egg is
completely solid. The viscous fluid interior should slow the spin of the raw egg.
Spin the two eggs, observe, and record your observations below. At the end we
will reveal which egg is hard boiled and which is raw. Did you predict this
correctly? How did the raw egg behave? The hard boiled egg?
To test this your instructor will choose the hard boiled egg and break it on the
instructor’s head.
PS - a large number of physics textbooks erroneously state the curve of a baseball is due
to the Bernoulli effect.

Modified January 4, 2015 (check reverse side of page) Page 118 of 161
Page left intentionally blank
Modified January 4, 2015 (check reverse side of page) Page 119 of 161
Slinky Wave
Date: _____________ Class:_______________ Section (day/time) _______________ Minimum 2, Maximum 5 people per group – when it gets to 6, split the group in half.
Names (write legibly,
include last names) ______________________, ______________________,
______________________, ______________________, ______________________
Also refer to slinky waves for conceptual classes.
1) Use a slinky to make a transverse standing wave. Measure the wavelength of the
slinky wave. What is it?
2) Use a timer to find the period of a slinky wave. This often works well by timing
10 oscillations and then dividing by 10. What is the period?
3) What formula do you use to find the wave speed?
4) Evaluate the wave speed.
5) Your instructor will provide the total mass of the slinky. What is it?
6) What is the length of the slinky?
7) Combining Parts 5 and 6, what is μ, the mass per unit length?
8) You instructor is going to put a mass on the slinky or use a spring scale to stretch
the slinky to find the spring constant. What is the mass or force reading on the
spring scale?
9) How much did the slinky elongate?
10) Combining Parts 8 and 9, what is the spring constant k?
11) How are you going to get the tension, FT, of the slinky? Find FT.
12) What is the formula for wave speed?
13) Evaluate wave speed using the formula in Question 12.
14) How does the answer to Part 13 compare to the answer to Part 4?

Modified January 4, 2015 (check reverse side of page) Page 120 of 161
Page left intentionally blank
Modified January 4, 2015 (check reverse side of page) Page 121 of 161
Doppler
Date: _____________ Class:_______________ Section (day/time) _______________ Minimum 2, Maximum 5 people per group – when it gets to 6, split the group in half.
Names (write legibly,
include last names) ______________________, ______________________,
______________________, ______________________, ______________________
The Doppler effect is so intimately connected to physics that the Society of Physics
Students uses it in their logo.
We're all familiar with the fact that when a fire truck or police car goes by it starts with a
high pitch sound as it approaches, then it becomes lower pitched after it passes. This is
the Doppler Effect.
The Doppler Effect ONLY regards pitch, not loudness. Loudness is mostly determined
by its power and how near or how far way a sound source is. We're going to throw
Doppler Footballs or some similar device to observe this effect.
1) Now, let’s do a problem. Have a friend (pretend) swing sound source that emits a
pure 440 Hz A note when at rest. Swing it in a circle. Part of the circle it is
coming toward you at 10 m/s, and part of the circle it is moving away at 10 m/s.
Draw two sketches – one for the source receding and one for the source
approaching.
2) What formulas would you use?
3) What is the wavelength and frequency for the source as it’s approaching you? Is
the frequency higher or lower?
4) What is the wavelength and frequency for the source as it’s receding from you?
Is the frequency higher or lower?
5) Now redo this problem if you are moving away from the center of the circle at
2 m/s. Presume the size of the circle is small, in other words, at one point the
source is moving toward you at 10 m/s and you’re moving away at 2 m/s. At
another point the source is moving away from you at 10 m/s and you’re also
moving away at 2 m/s.
6) What is the wavelength and what frequency do you hear for the source as it’s
approaching you? Is the frequency higher or lower?
7) What is the wavelength and what frequency do you hear for the source as it’s
receding you? Is the frequency higher or lower?
8) Now, think of this problem if the observer is standing still again, but there’s a
2 m/s wind from the observer to the sound source.
9) What is the wavelength and what frequency do you hear for the source as it’s
approaching you? Is the frequency higher or lower?
10) What is the wavelength and what frequency do you hear for the source as it’s
receding you? Is the frequency higher or lower?
11) What do you observe about your answers to 7, 8, 10, and 11. Remember all
velocities are relative to the medium the wave is traveling in. The only exception
is electro-magnetic waves and that peculiarity is the basis of Einstein’s Theory of
Relativity.

Modified January 4, 2015 (check reverse side of page) Page 122 of 161
Page left intentionally blank

Modified January 4, 2015 (check reverse side of page) Page 123 of 161
Interference
Date: _____________ Class:_______________ Section (day/time) _______________ Minimum 2, Maximum 5 people per group – when it gets to 6, split the group in half.
Names (write legibly,
include last names) ______________________, ______________________,
______________________, ______________________, ______________________
In this activity we will bounce a laser beam (670 nm) at a blank CD and determine
the spacing of tracks on a CD. Alternatively use a diffraction grating.
The two images above are like a snapshot of a ripple tank where two wave emitters
are two wavelengths apart (the emitters are horizontal). This is like a CD with a spacing
of twice the wavelength of the light. Each stripe acts like the wave generator in a ripple
tank. Unlike the above image a CD has thousands in a row. But the angle where waves
reinforce (constructive interference) are the same. The light areas are where crests and
troughs of the two emitters waves go together and dark regions are where the crest of one
meets the trough of the other emitter. Let's look at the wave pattern first and try to decide
what we expect before we measure the CD.
The first thing to notice is that the right and left pattern above appear identical, but
they are not. The waves are 180° out of phase. In the image at left
the center is a crest. In the image at right the center is a trough. But
reinforcement occurs at the same angles either way.
Why reinforcement occurs in the center should be obvious (see
figure at right). At any point on a vertical line halfway between the
two emitters the wave emanating from each emitter is going to
reach that middle line at the same time. So the perpendicular from
the line connecting the emitters is going to be where constructive
interference occurs.
It's the other angles that are a little bit more
difficult to figure out, but not really that hard. The
first angle (other than straight ahead) where
constructive interference occurs is where there is
exactly one wavelength difference between the path
lengths as shown in the next figure. The other, larger,
angles occur where the path length difference is 2, 3,
4, etc. wavelength difference. The figure at right
shows the angle for the first order (1 wavelength
difference). The angle, θ, from the center is found from simple trigonometry.
On the next page the left hand top figure is expanded. Using a protractor (or ruler
and trigonometry), find the angles of all orders of reinforcement. What are they?
1) Use the symbol d to represent the distance between emitters and use trigonometry
to solve for this angles of the orders. What is the formula?
2) If d is two wavelengths, evaluate this formula for all orders. What is θ1, θ2, θ3,
etc.?
3) Compare the results of Part 1 and 2. Are they close to each other? Why or why
not? Explain.

Modified January 4, 2015 (check reverse side of page) Page 124 of 161

Modified January 4, 2015 (check reverse side of page) Page 125 of 161
Page left intentionally blank

Modified January 4, 2015 (check reverse side of page) Page 126 of 161
Interference Part II
Date: _____________ Class:_______________ Section (day/time) _______________ Minimum 2, Maximum 5 people per group – when it gets to 6, split the group in half.
Names (write legibly,
include last names) ______________________, ______________________,
______________________, ______________________, ______________________
Review the previous assignment. You compared the predicted and measured values
of the angles where constructive interference occurred. Now consider the CD or
diffraction grating. Let’s figure out the spacing. The accepted value for a CD is 1.6 m
and the accepted value for a DVD is 0.74 m. Your instructor will provide the accepted
value if you use something else.
1) Use trigonometry to measure the angles where constructive interference occurs as
follows: How far from the screen was the CD?
2) How far from the central spot was the first order spot? The second order spot?
The third order spot? Etc.
3) Using trigonometry, what is the formula for θn given the results of Parts 5 and 6?
4) Evaluate the angles θ1, θ2, θ3, etc. What are they? Write them down – these are
your measured values.
5) If you know the angle of a given order, n, how do you find the spacing, d?
6) Calculate and tabulate the spacing for all orders. Is d always the same? Why or
why not? Explain.
7) Compare d to the accepted value. How close did you get?

Modified January 4, 2015 (check reverse side of page) Page 127 of 161
Page left intentionally blank

Modified January 4, 2015 (check reverse side of page) Page 128 of 161
Heat
Date: _____________ Class:_______________ Section (day/time) _______________ Minimum 2, Maximum 5 people per group – when it gets to 6, split the group in half.
Names (write legibly,
include last names) ______________________, ______________________,
______________________, ______________________, ______________________
Mechanical energy is easily converted to heat, but the reverse is harder. Today we're
going to use thermal probes to understand how mechanical energy is turned into heat.
1. Without touching the probe to anything, what is the temperature in °F? In °C?
2. Hold it in your hand. What is your temperature in °F? In °C?
3. Don't put this under your tongue, however, why do doctors put the thermometer
under your tongue (or elsewhere) to measure body temperature?
4. Rub your hands together then hold the thermal probe in your hand. What is the
new temperature in °F? In °C?
5. Is your hand hotter now? Why? Or why not? Explain.
6. Measure and record the temperature of several things around the room. The
window, the computer, etc. Record your observations. Explain why one thing is
warmer than another.
7. What is heat? Why can energy be converted to heat, but not all heat can be
converted back to useful energy? Does this mean energy isn't conserved? Why
or why not? Explain.

Modified January 4, 2015 (check reverse side of page) Page 129 of 161
Page left intentionally blank

Modified January 4, 2015 (check reverse side of page) Page 130 of 161
Entropy
Date: _____________ Class:_______________ Section (day/time) _______________ Minimum 2, Maximum 5 people per group – when it gets to 6, split the group in half.
Names (write legibly,
include last names) ______________________, ______________________,
______________________, ______________________, ______________________
When something gains heat it becomes more disordered and it's hard to get that order
back. The ice cube above, for example, gains heat and becomes a disordered puddle of
water. Going back to become an ice cube is more difficult.
Watch this video (it helps to turn the poor soundtrack off):
http://www.youtube.com/watch?v=D-y73F0A02Y. Can you tell
when the film switches from running forward to running
backward? What finally informs you that the film was
running backward?Let's solve an entropy problem. If 1 cal
of heat enters the hot side of a copper heat conductor at
400°K and leaves cold side at 300°K, calculate the change in
entropy. First, how much entropy does the hot side lose?
3) How much entropy does the cold side gain?
4) Add the answers from Parts 2 and 3 - What is the total
entropy change?
5) The second law of thermodynamics says entropy increases. Did this happen?

Modified January 4, 2015 (check reverse side of page) Page 131 of 161
Page left intentionally blank

Modified January 4, 2015 (check reverse side of page) Page 132 of 161
University Physics Workbook Part I Appendix F: Study Habits & Work Ethic
Seven Habits of Successful Students 1. ATTEND ON TIME – ALWAYS! Don't miss except for illness, hardship, or other
emergency. Learn what work you missed and make it up. Arrive on-time, take
notes, and make the best use of your time in class.
2. 2-3 hours of study outside class for every contact hour in class is normal and
expected. This is the norm and ill prepared students will need to do more.
3. Finding and fixing mistakes is more important than never making a mistake.
We’re only human – error elimination is impossible. The 3 main ways to find and
fix mistakes are step-by-step organized written problem solving (SOLVE),
estimation, and dimensional analysis.
o Use the SOLVE method (or roughly equivalent method). SOLVE stands for
Sketch to understand problem, Organize (list known and unknown quantities), List
appropriate equations, Vary equations step-by-step in an organized fashion and write
down each step on paper line-by-line to symbolically find the unknown quantity,
Estimate/Evaluate – estimate a ballpark for your answer and then plug in numbers
at the very end of the process. Compare your estimate to the result to decide if your
result is reasonable.
If the estimate and result are not comparable then there was probably a mistake
somewhere. Review your step-by-step written work to attempt to find the mistake.
There are other methods you may have learned. As long as you are consistent in
the use or an organized method, I will award full credit. Note that all these methods
employ two find-and-fix techniques to find-and-fix mistakes.
o ALWAYS use dimensions, dimensional analysis, and convert units using
fraction multiplication (or solve a proportion). NEVER CONVERT UNITS IN
YOUR HEAD – this commonly leads people to multiply when they should divide
and divide when they should multiply. ALWAYS write your conversion using
fraction multiplication or, less efficiently, proportions. REVIEW YOUR WORK if
dimensions don’t agree – there is probably a mistake somewhere.
4. Keep 3 sig figs ALWAYS and sometimes more. Never drop below calculating
results to 3 sig figs. Sometimes more are needed for answers accurate to 3 sig figs.
In future courses this rule will be refined, but for now you will be graded down if
you fail to keep at least 3 sig figs.
5. Always take lecture notes. We learn by taking notes even if we throw them away at
the end of lecture. But don’t toss the lecture notes – do the next step.
6. Continually summarize material. There are several summary methods – Cornell,
SQ3R, etc. Summarizing commits information to long-term memory. Habitual, e.g.
daily, summary reinforces memory each time you do it. Pick a method and use it
consistently. In Prof. Sizemore’s classes he allows a single summary card on exams.
7. Continually do and UNDERSTAND homework. Getting the correct answer at the
end is less important than learning and understanding the concepts and the process
used to arrive at the correct answer. You may get lucky getting the correct answer,
but understanding best prepares you.
For your amusement, here’s an article on How to Succeed at Failing.

Modified January 4, 2015 (check reverse side of page) Page 133 of 161
Modified January 4, 2015 (check reverse side of page) Page 134 of 161
University Physics Workbook Part I Appendix G: Teamwork & Problems
For individual (and study group) quantitative problem solving we strongly, strongly
encourage the use of the SOLVE 5-Step Problem Solving method.
1. S – Sketch Sketch, draw a picture, understand the
problem
2. O – Organize Organize, write down known and unknown
quantities
3. L – List List relevant equations, determine which are
applicable
4. V – Vary Vary, rewrite, and transform equations to
express unknown quantity in terms of known
quantities
5. E – Evaluate Evaluate expressions, Plug in Numbers,
evaluate to determine if answer makes
We will be using this throughout the course.
Group Problem Solving: This also works for group problems solving. The same reason
the SOLVE 5-Steps help individuals wrap their heads around a problem, it helps
communicate your reasoning to others especially your teacher!
Tolerating Frustration: Quantitative reasoning can be frustrating. A large number of
steps and if you make a mistake on any one step you will get a wrong result. That's why
we need to tolerate frustration to succeed in quantitative disciplines.
TEAMWORK: This is very important to employers and is a skill lacking in graduates.
Making unemotional decisions: The largest issue is we are human and emotions get in
our way. Here are a few things to assist us in preventing emotions from disrupting teams.
1. Allow everybody enough time to state their opinions without interruption. However
we should be clear, complete, and concise in expressing ourselves (see Item 5).
2. Eliminate religion, politics, cursing and racial, ethnic, sexist, or other slurs,
offensiveness, and insensitivity. All of these things inflame emotions in people and
distract from focusing on the scientific or technical problem you’re trying to solve.
3. Avoid personal attacks. Don’t say, “your idea stinks.” Say something like, “I’m not
fond of this idea because …”
4. Explain your reasoning leading your conclusion. DON’T BELIEVE YOU
ALREADY KNOW HOW TO EXPLAIN YOURSELF! It takes many years of
practice a first or second year college student is poor at explaining their reasoning. I
do not consider myself a master. We tend to make “leaps of logic” that even we are
not aware of. Get a friend or mentor to listen to you, asking questions when we have
take “leaps of logic,” and in a non-threatening way help us understand where we
need to “fill in the holes” (break our reasoning down into smaller steps). Don’t be
offended if somebody asks you to explain in greater detail. For your information
“leaps of logic” is called a non sequitur.
5. Be clear and complete, yet concise and stick to the point. DON’T BELIEVE YOU
ALREADY KNOW THIS! Again, a friend or mentor can assist with this. It takes
many years of practice to whittle your speech and writing to be concise, yet clear and
Modified January 4, 2015 (check reverse side of page) Page 135 of 161
sufficient and I don’t consider myself a master. Don’t be offended if somebody
stops you from rambling. Chalk it up to practicing speaking and writing clearly,
completely, and concisely.
6. Avoid “My Way or the Highway” thinking, the “Pet Theory,” and hyper-criticism.
We become upset if one person dominates a discussion, if our ideas are unfairly
“shot down,” or if somebody is being hypercritical. We’re going to discuss
brainstorming later as it’s an important technique to prevent emotional attachment or
rejection of ideas.
7. Participate, but don’t dominate. One method is for the facilitator to announce to the
group to be clear, complete, and concise in their answers and then poll each
member’s opinion on an issue.
8. Take a vote and, if necessary, a secret ballot. Resort to this if there is a point of
contention that cannot be resolved by consensus and secret ballot if the discussion
becomes heated.
9. Take a break. Sometimes giving people some alone cooling off time, adjourning for
lunch or the evening, getting a meal together as a team, relaxing, loosening up
(imbibe alcoholic beverages or get a massage for those that don’t imbibe), go over
the ground rules (no personal attacks, stick to the issue, nobody dominates,
everybody participates, etc), then resume discussion.
10. We need to respect others opinions and interact civilly in order to WORK together.
Brainstorming: Gather all potential ideas WITHOUT PREJUDGEMENT! Write down
even bad ideas. Don’t write whose idea it is. Bad ideas are OK – you want everybody
comfortable sharing ideas. Let people just shout out an idea. Or have people write it on
a post it note and have stick in on a board. Don’t say anything about the merit of an idea.
Group Decision Making: The next phase is considering the merit of an idea. Have
people discuss the pros and cons. Make a T-chart or use a figure-of-merit (FOM –
mathematical formula where the idea that best solves the problem gains the highest or
lowest score).
A simple example of an FOM is cost to run a car. Let’s say the price of one car is
P=$10,000 and another P=$20,000, vehicles are in your fleet t=5 years, resale value is
20% of purchase price (r=0.2), they’re used k=48,000 km/yr (30,000 mi), the $10,000 car
gets e=8.5 km/l (20 mpg) while the $20,000 care gets e=12.75 km/l (30 mpg) at a future
projected average of f=1.3 $/l, and maintenance is m=3 times fuel cost. An FOM would
be cost to run the car per year which we are trying to minimize (lowest score).
Crunching the numbers we see that the $10,000 car has an FOM of 31,000 the $20,000
car has an FOM of 23,000. Since FOM is cost per year we see the clear choice is the
vehicle with the more expensive price tag. My father was fleet sales manager for a tire
company (selling to truckers) and he used this argument to show why his more expensive
tires were actually the better bargain. Following is an Excel spreadsheet to calculate this
problem:
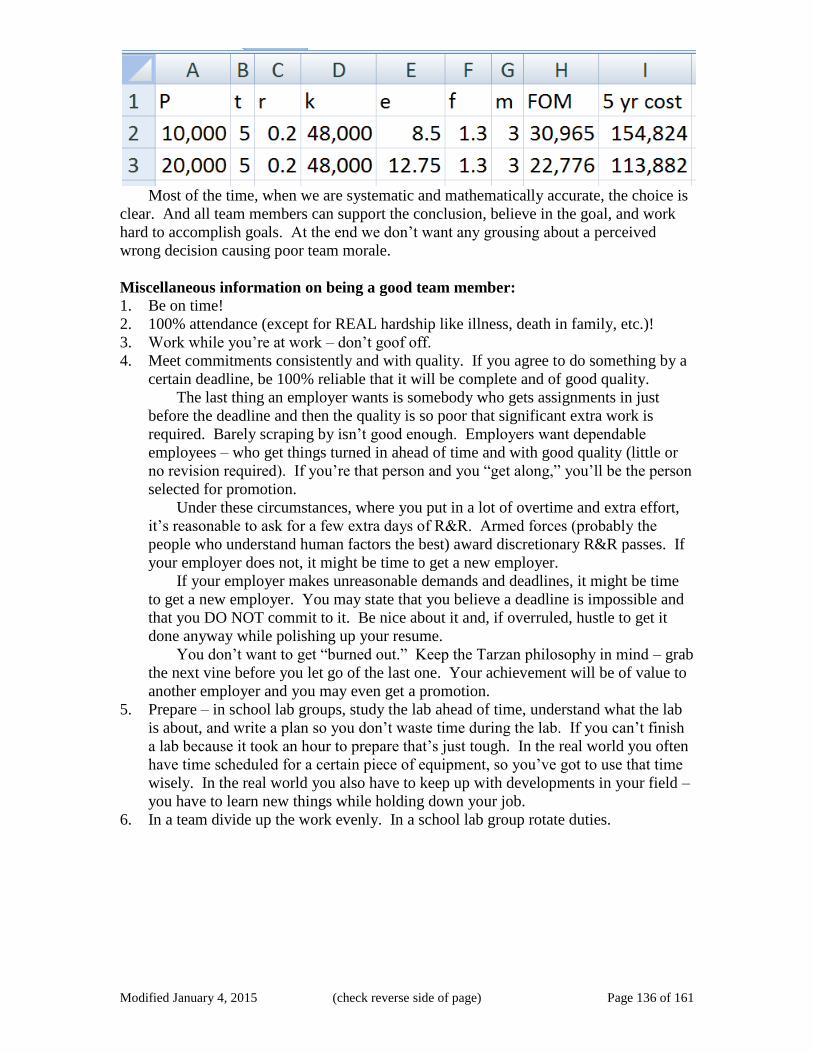
Modified January 4, 2015 (check reverse side of page) Page 136 of 161
Most of the time, when we are systematic and mathematically accurate, the choice is
clear. And all team members can support the conclusion, believe in the goal, and work
hard to accomplish goals. At the end we don’t want any grousing about a perceived
wrong decision causing poor team morale.
Miscellaneous information on being a good team member:
1. Be on time!
2. 100% attendance (except for REAL hardship like illness, death in family, etc.)!
3. Work while you’re at work – don’t goof off.
4. Meet commitments consistently and with quality. If you agree to do something by a
certain deadline, be 100% reliable that it will be complete and of good quality.
The last thing an employer wants is somebody who gets assignments in just
before the deadline and then the quality is so poor that significant extra work is
required. Barely scraping by isn’t good enough. Employers want dependable
employees – who get things turned in ahead of time and with good quality (little or
no revision required). If you’re that person and you “get along,” you’ll be the person
selected for promotion.
Under these circumstances, where you put in a lot of overtime and extra effort,
it’s reasonable to ask for a few extra days of R&R. Armed forces (probably the
people who understand human factors the best) award discretionary R&R passes. If
your employer does not, it might be time to get a new employer.
If your employer makes unreasonable demands and deadlines, it might be time
to get a new employer. You may state that you believe a deadline is impossible and
that you DO NOT commit to it. Be nice about it and, if overruled, hustle to get it
done anyway while polishing up your resume.
You don’t want to get “burned out.” Keep the Tarzan philosophy in mind – grab
the next vine before you let go of the last one. Your achievement will be of value to
another employer and you may even get a promotion.
5. Prepare – in school lab groups, study the lab ahead of time, understand what the lab
is about, and write a plan so you don’t waste time during the lab. If you can’t finish
a lab because it took an hour to prepare that’s just tough. In the real world you often
have time scheduled for a certain piece of equipment, so you’ve got to use that time
wisely. In the real world you also have to keep up with developments in your field –
you have to learn new things while holding down your job.
6. In a team divide up the work evenly. In a school lab group rotate duties.

Modified January 4, 2015 (check reverse side of page) Page 137 of 161
University Physics Workbook Part I Appendix H: Geometry, Trigonometry, & Vector Summary
Dr. Tovar at Eastern Oregon University has developed a number of good reviews
and links to other reviews. If you don’t like mine, try his or Dr. Dawkings’ at
http://physics.eou.edu/opensource/math/, basic algebra at
http://physics.eou.edu/opensource/math/alg/alg.pdf, trigonometry at
http://physics.eou.edu/opensource/math/trig/trig.pdf, and vectors at
http://physics.eou.edu/opensource/math/vecalg/vecalg.pdf. Dr. Dawking’s material is at
http://tutorial.math.lamar.edu/. Dr. Tovar’s and Dr. Dawkings’ material are mirrored at
my weebly site (http://funphysicist.weebly.com/#helps-mirrored-from-offsite).
The three topics, Geometry, Trigonometry, and Vectors, are closely connected. The
summary presented is not exhaustive, however it is my opinion that these are the most
relevant to a non-calculus physics classes.
There is some really basic stuff that should not be necessary to review. I presume
you already know this material and, therefore, I’ll only discuss it briefly.
Point: An object located in space with no width, height, or depth.
Line: A line extends infinitely in both directions and is the set of points such that, if any
two points in a line are chosen, all points on the line between those two point are on the
shortest path between those two points. A line is pictured as follows:
Note the two arrows at each end. This is an attempt to communicate the idea that a line
goes infinitely in both directions. Closely related to the concept of a line are:
Ray: It is part of a line that starts at one point and continues infinitely. To
show this ideas the symbol for a ray is:
Line segment: This is the part of the line that starts at one point and stops at a
second point. To show this idea a line without arrows is drawn:
Parallel Lines: Lines that never intersect and by “intersecting” we mean that at
least one point is common to both lines. If lines are not parallel, they will
intersect. Examples:
Parallel Lines
Non-Parallel Lines – note that they are not shown
explicitly intersection, however if one or both are
extended (the dashed line) it’s clear they will
eventually intersect.

Modified January 4, 2015 (check reverse side of page) Page 138 of 161
Transversal: A third line that intersects two other lines.
Perpendicular: A line that intersects at 90°, a.k.a., right angle or normal, to a
second line. Note the use of the word “normal.” In physics, “normal” has the
same meaning as perpendicular. A more rigorous mathematical definition is
required, however we’ll leave this for later when we define angles. Following
are symbols used to show right angles – note the square used to imply this
meaning.
Finally note the use of arcs to denote general angles.
Parallel Lines Transversal – small angles equal each other and large angles equal each
other.
The key idea to remember in a transversal of parallel lines is small angles equal each
other AND big angles equal each other. Angles are labeled using arcs, arcs with hash
marks, a symbol, or some combination of methods. Commonly used symbols are Greek
letters like or . Whatever method you use, CLARITY IS MOST IMPORTANT!
When working on a geometry problem or physics problem using geometry, USE A
RULER & FILL THE ENTIRE SHEET OF PAPER. Here are three different examples
of the different notations.
transversal
Parallel Lines Non-Parallel Lines
Transversal
Perpendicular, 90° angle, right angle,
or normal – note the use of a box to
show this. Note that all other
angles are also
right angles
Transversal of two parallel lines with
angles shown as single or double arcs
Transversal of two parallel lines with
angles shown as arcs or hashed arcs
Transversal of two parallel lines with
angles shown using symbols
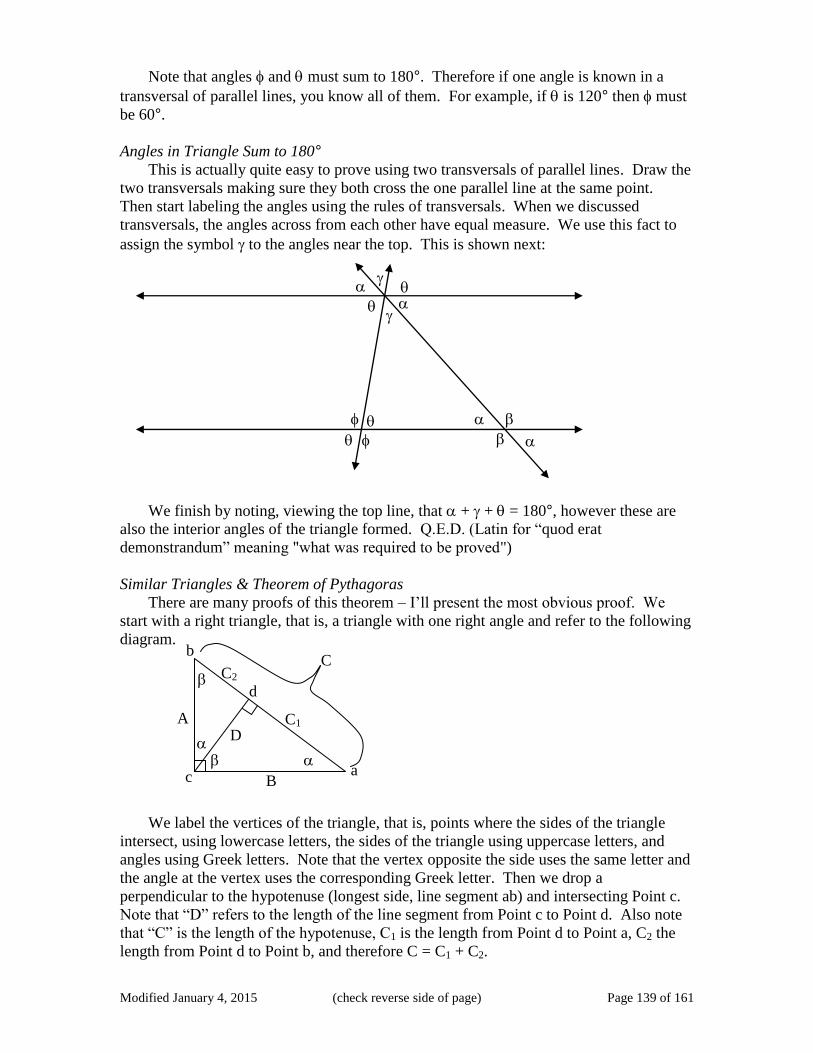
Modified January 4, 2015 (check reverse side of page) Page 139 of 161
Note that angles and must sum to 180°. Therefore if one angle is known in a
transversal of parallel lines, you know all of them. For example, if is 120° then must
be 60°.
Angles in Triangle Sum to 180°
This is actually quite easy to prove using two transversals of parallel lines. Draw the
two transversals making sure they both cross the one parallel line at the same point.
Then start labeling the angles using the rules of transversals. When we discussed
transversals, the angles across from each other have equal measure. We use this fact to
assign the symbol to the angles near the top. This is shown next:
We finish by noting, viewing the top line, that + + = 180°, however these are
also the interior angles of the triangle formed. Q.E.D. (Latin for “quod erat
demonstrandum” meaning "what was required to be proved")
Similar Triangles & Theorem of Pythagoras
There are many proofs of this theorem – I’ll present the most obvious proof. We
start with a right triangle, that is, a triangle with one right angle and refer to the following
diagram.
We label the vertices of the triangle, that is, points where the sides of the triangle
intersect, using lowercase letters, the sides of the triangle using uppercase letters, and
angles using Greek letters. Note that the vertex opposite the side uses the same letter and
the angle at the vertex uses the corresponding Greek letter. Then we drop a
perpendicular to the hypotenuse (longest side, line segment ab) and intersecting Point c.
Note that “D” refers to the length of the line segment from Point c to Point d. Also note
that “C” is the length of the hypotenuse, C1 is the length from Point d to Point a, C2 the
length from Point d to Point b, and therefore C = C1 + C2.
a
b
c
C
A
B
d
D
C1
C2

Modified January 4, 2015 (check reverse side of page) Page 140 of 161
Now, to proceed, we must discuss Similar Triangles. Any similar figure, including
triangles, has the same shape as another, but a different size. For triangles this means
angles are preserved, that is, the angles are the same in similar triangles.
Using what we’ve reviewed previously, that is, the sum of all angles in a triangle
equals 180°, we assign symbols to all the angles in the previous figure. After doing this,
therefore: is similar to and is similar to .
Also in similar figures, all lengths scale the same. This is the meaning of “same
shape, different size.” This also means that lengths are in proportion in similar figures
and, now, we can write a mathematical equation, a proportion, to describe this:
and
We will use these equations in just a little bit to derive a second proof of the
Pythagorean Theorem. Before we do that, note:
“area of ” + “area of ” = “area of .”
And areas are proportional to the length of one side squared, therefore the
Pythagorean Theorem is immediately proven:
Let’s now revisit the equations above applying cross-multiplication:
and
Noting that C1 + C2 = C we add the prior equations again deriving the Pythagorean
Theorem:
The Pythagorean Theorem is one of the most important in math and science and we
will have opportunity to apply it shortly.
Geometric Optics Application
As the name implies, analysis of optical systems in entirely based on Geometry
including similar triangles. There are two basic rules: (1) Rays of light through the
center of a lens is undeflected, and (2) parallel rays meet as the focus. Let’s draw the
figure:
ho is the size of the object, do is the distance of the object from the lens, hi is the size
of the image, di is the distance of the image from the lens, f is the focal length of the lens,
•
ho
do hi
di f

Modified January 4, 2015 (check reverse side of page) Page 141 of 161
and angles are labeled to help visualize the similar triangles. Now we can write
equations:
magnification
And:
Rearranging and noting
:
Now by dividing by di we obtain the thin lens equation:
Q.E.D.
Trigonometry – Some Old Hippy Caught Another Hippy Tripping On Acid
A humorous saying, but it helps us to remember our trigonometric functions, sine,
cosine, and tangent. They are just ratios – refer to the following figure:
O stands for the length of the side opposite from the angle, , A stands for the side
adjacent to the angle, and H is the hypotenuse of this right triangle. Following is how the
trigonometric functions are defined and note, the abbreviation for sine is sin, for cosine is
cos, and for tangent is tan:
Sin equals opposite over hypotenuse, cos equals adjacent over hypotenuse, and tan
equals opposite over adjacent. Now we have a mnemonic device – the underlined letters
are there first letters of each word in the phrase: Some Old Hippy Caught Another Hippy
Tripping On Acid.
O H
A

Modified January 4, 2015 (check reverse side of page) Page 142 of 161
Watch out though – take a look at the second non-right angle in the triangle:
The side adjacent to is NOT the same side that is adjacent to . Note that
= 90°-- and we observe the following relationships:
Note the last equation defines the cotangent function.
If we know the angle, we can calculate the ratios, that is, the sin, cos, or tan of the
angle. If we know the angle we can calculate the angle, however insure your calculator
is in the proper mode. If you wish to know degrees, insure the calculator is in “degree
mode” and if you wish to know radians insure your calculator is in “radian mode.”
We’ve been using angles, but we have not been rigorous about defining angle
including units of radians, degrees, and revolutions. We’ll digress to do this and then
discuss inverse trigonometric functions. Refer to the following figure:
A circle is a set of points a specific distance, R, from a center point, c. Shown are
two lines from the center to the circle. S is the distance along the circle from the points
where the two lines intersect. The angle, in units of radians, is defined as:
If we go all the way around the circle, the distance traveled is 2R and thus the angle
going in a complete circle is 2 rads (rad is an abbreviation for radian). Going in a
complete circle is also called a revolution (rev) and also equals 360°. Now we have
conversions between these three angular units.
O H
A
R
R c
S is the distance along the arc of the circle

Modified January 4, 2015 (check reverse side of page) Page 143 of 161
Now back to inverse trigonometric functions. Make sure your calculator is in the
mode your desire – degrees or radians. I prefer the notation asin, acos, and atan to refer
to the inverse functions, however modern calculators use , , and
. Many students become confused erroneously thinking the inverse functions
refers to a reciprocal and that’s why I prefer asin, acos, and atan. However both usages
are shown next in defining inverse trigonometric functions.
This is all the trigonometry this course requires, however we’ll do a trigonometry
example in conjunction with vectors, thus we’ll discuss vectors first.
Vectors
Nature is not one dimensional – it’s at least three or four, including time, or more if the
String Hypothesis is confirmed. That’s why we need vectors. Before getting much
further, let me refer you to an online resource: Online Vector Resource:
http://comp.uark.edu/~jgeabana/java/VectorCalc.html.
Vectors will be covered in detail by your instructor and, therefore, this is not a
review as previous material was. Hopefully this section can serve as a reference to help
you.
We represent vectors by arrows and describe the length, units, and direction of the
arrow. If the unit is a Newton (if we’re discussing a force), then there is a scale to our
arrow, for example, 1 cm length represents 1 N. The direction of the arrow is given by
the angle from the x-axis with counter-clockwise being positive angles. Consider the
following example:
A vector is symbolized by an arrow over the letter, such as shown above, a line over
the letter, e.g., , or bold, A. Part of the reason we do things is convenience of the tools
available, therefore we use bold letters to symbolize vectors because it was easier for
typewriters and that practice continued into our computer age. A line over a letter works
well for blackboards. We have better word processing tools these days and thus I’ll
x
y
A Ay
Ax

Modified January 4, 2015 (check reverse side of page) Page 144 of 161
avoid bold face for vectors, but not all the way to an arrow over to denote vectors. My
practice will be the middle – I’ll use a line over.
Ax is the x component of the vector and Ay is the y component. There may also be a
z component, . It’s easy to see, using the Pythagorean Theorem, that the length or
magnitude of equals:
Some people use the ordinary capital letter without bold to mean the vector length. I
prefer using the absolute value symbol with the overline, that is, the magnitude of is
symbolized by . Also the term “magnitude” is preferred over “length.” If we restrict
our consideration to two dimensions, the angle, , is given by:
Conversely, in two dimensions, if you know magnitude and angle, you can find the
components:
These formulae for 3 dimensions are more complicated and are usually discussed in
more advanced classes.
A very popular method to describe vectors is to use the unit vector notation. A unit
vector along the x axis, y axis, or z axis is defined. There are just vectors with magnitude
of one. The x axis unit vector has a carrot or hat over the letter, that is, , y axis unit
vector is , and z axis is . Some authors use i, j, and k instead of x, y, and z to refer to
unit vectors. Therefore, , , and . The connection to components is as
follows:
Adding Vectors
Graphically we use the arrow description and add vectors tip-to-tail, that is, the tip of
the first vector touches the tail of the second. The following figure shows this:
You may use a ruler and protractor to carefully measure and draw to find . The
component method is extremely popular for this purpose since:
A B
A
B
A + B = C
C

Modified January 4, 2015 (check reverse side of page) Page 145 of 161
And
And, in three dimensions
Or using unit vectors as we will use in the rest of this book
Subtracting Vectors
This easiest way to think about this is adding the negative vector, that is, a vector the
same magnitude and in the opposite direction. So:
The way to negate a vector is simply to negate each of the components. This should
be clear from the previous figure. So subtraction using components is also quite simple.
Multiplying Vectors by a Scalar
A scalar, unlike a vector, is a quantity without direction. Scalars are the stuff we’ve
been used to working with in most of our math. To multiply a vector by a scalar we just
multiply the magnitude by the scalar and direction does not change. If the scalar is
negative, the arrows end flips just like we saw previously when subtracting vectors.
Letting the scalar be symbolized by k, then:
Vector Scalar Product aka Dot Product
We first encounter this when discussing work, that is, the force in the direction of
motion times distance. If the force is perpendicular to the direction of motion, there is no
work. It’s like the weight of a rider on a riding lawn mower. Motion is parallel to the
ground, but the person’s force is perpendicular to the ground, therefore the person isn’t
working. They may be sipping an ice cold lemonade lazily guiding the lawn mover. The
lawn mover’s motor is doing the work – not the rider.
A B A
A – B = C
C
–B

Modified January 4, 2015 (check reverse side of page) Page 146 of 161
We say that work is force in the direction of motion – a quantity we can easily derive
as follows:
Fx is the force in the direction of the motion, , and since :
This is the definition of the dot product (note the “dot” between vectors) or scalar
product. The result is a scalar.
The proof of the component version of the dot product is beyond this course and is
simply stated below:
Vector Cross Product
We first encounter this discussing torque and rotational motion. Torque is defined
as force perpendicular to the lever arm, R, times the lever arm. See the next figure:
In this case it’s clear that only the y component of force will cause rotation. Fx will
not. Therefore the magnitude of torque is easy to calculate and is:
Torque is a vector quantity and one finds the direction of the vector using the “Right
Hand Rule.” Point the thumb of your right hand in the direction of , and fingers in the
direction of the force component perpendicular to , then your palm will point in the
direction of torque. This takes practice and will be covered in class.
The component version of the cross product is beyond the scope of this course and is
simply stated below:
F
D
Fx
R
F Fy
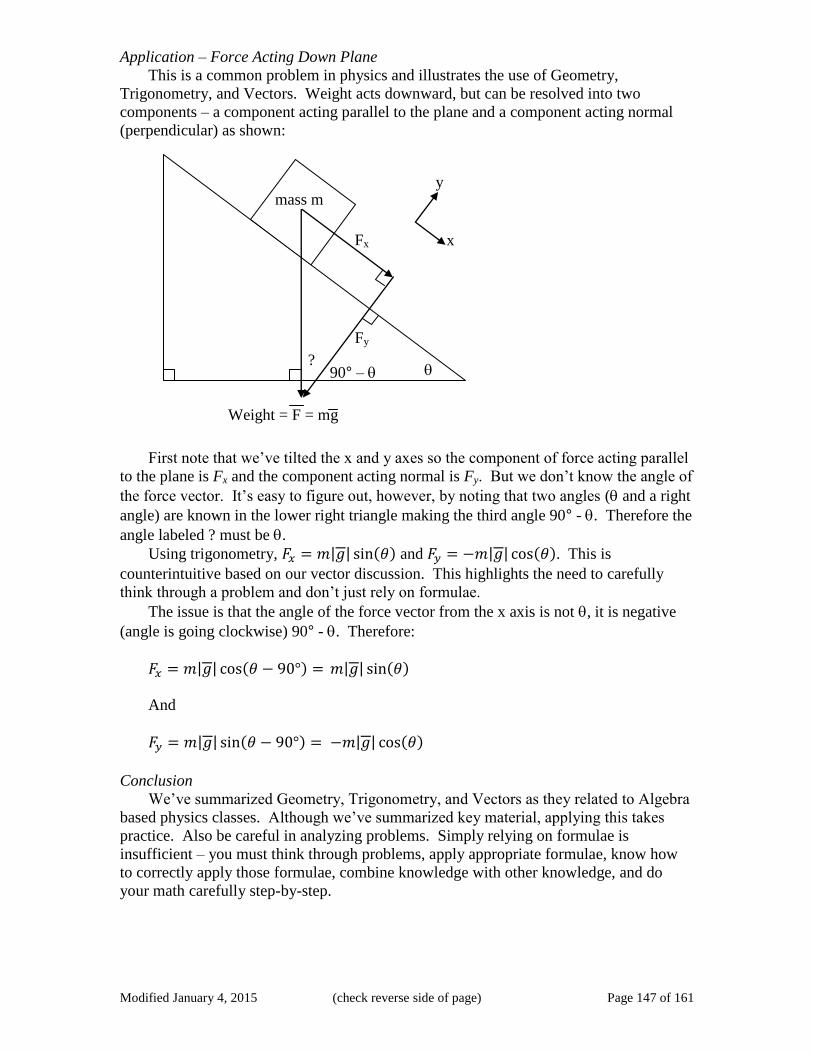
Modified January 4, 2015 (check reverse side of page) Page 147 of 161
Application – Force Acting Down Plane
This is a common problem in physics and illustrates the use of Geometry,
Trigonometry, and Vectors. Weight acts downward, but can be resolved into two
components – a component acting parallel to the plane and a component acting normal
(perpendicular) as shown:
First note that we’ve tilted the x and y axes so the component of force acting parallel
to the plane is Fx and the component acting normal is Fy. But we don’t know the angle of
the force vector. It’s easy to figure out, however, by noting that two angles ( and a right
angle) are known in the lower right triangle making the third angle 90° - . Therefore the
angle labeled ? must be .
Using trigonometry, and . This is
counterintuitive based on our vector discussion. This highlights the need to carefully
think through a problem and don’t just rely on formulae.
The issue is that the angle of the force vector from the x axis is not , it is negative
(angle is going clockwise) 90° - . Therefore:
And
Conclusion
We’ve summarized Geometry, Trigonometry, and Vectors as they related to Algebra
based physics classes. Although we’ve summarized key material, applying this takes
practice. Also be careful in analyzing problems. Simply relying on formulae is
insufficient – you must think through problems, apply appropriate formulae, know how
to correctly apply those formulae, combine knowledge with other knowledge, and do
your math carefully step-by-step.
mass m
Weight = F = mg
y
x Fx
Fy
? 90° –

Modified January 4, 2015 (check reverse side of page) Page 148 of 161
University Physics Workbook Part I Appendix I: Exponentials & Logarithms Summary
In the prior appendix I mentioned Dr. Dawkings has developed a number of good
reviews at http://tutorial.math.lamar.edu/ and Dr. Tovar has other reviews and links to
Dr. Dawkings’ reviews at http://physics.eou.edu/opensource/math/. In particular, Dr.
Dawkings’ algebra and trigonometry review contains exponentials and logarithms at
http://tutorial.math.lamar.edu/pdf/AlgebraTrig.pdf. Dr. Tovar’s and Dr. Dawkings’
material are mirrored at my weebly site (http://funphysicist.weebly.com/#helps-mirrored-
from-offsite).
Laws of Exponents To remember laws of exponents, you may expand recalling that exponents mean
repeated multiplication. For example, x3 = x*x*x. All of the rules are derived from this
basic understanding.
Let i, j, m and n be any Real or Rational (fraction) numbers. Let a and b be any Real
or Rational numbers greater than zero. When first learning laws of exponents think of i,
j, m, n, a and b as integers, however they are quite general and are extended to complex
numbers.
For the radical form recall:
and
Rule
Name Summary Radical Form Examples
Zero
Exponent not applicable 123
0 = 1
Exponent
of One not applicable 123
1 = 123
Exponents
and Roots
Negative
Exponent
Powers of
One
1
456 = 1

Modified January 4, 2015 (check reverse side of page) Page 149 of 161
Rule
Name Summary Radical Form Examples
Powers of
-1
n even:
n odd:
n even:
n & m odd:
n odd & m even results in
imaginary & complex
numbers (don’t worry about
this yet)
(defines
pure imaginary
number of
magnitude 1)
Product of
Powers Note:
&
Thus:
Quotient
of Powers
See Product of Powers:
Power of
Power
Power of
Product
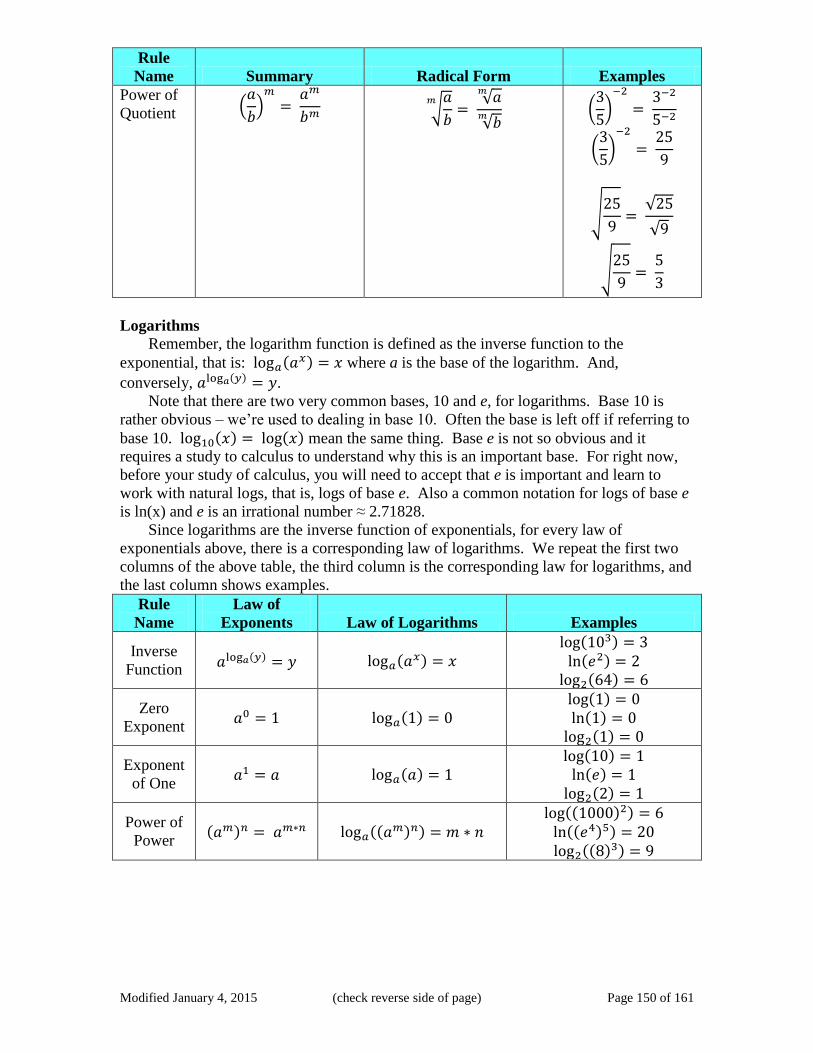
Modified January 4, 2015 (check reverse side of page) Page 150 of 161
Rule
Name Summary Radical Form Examples
Power of
Quotient
Logarithms
Remember, the logarithm function is defined as the inverse function to the
exponential, that is: where a is the base of the logarithm. And,
conversely, .
Note that there are two very common bases, 10 and e, for logarithms. Base 10 is
rather obvious – we’re used to dealing in base 10. Often the base is left off if referring to
base 10. mean the same thing. Base e is not so obvious and it
requires a study to calculus to understand why this is an important base. For right now,
before your study of calculus, you will need to accept that e is important and learn to
work with natural logs, that is, logs of base e. Also a common notation for logs of base e
is ln(x) and e is an irrational number ≈ 2.71828.
Since logarithms are the inverse function of exponentials, for every law of
exponentials above, there is a corresponding law of logarithms. We repeat the first two
columns of the above table, the third column is the corresponding law for logarithms, and
the last column shows examples.
Rule
Name
Law of
Exponents Law of Logarithms Examples
Inverse
Function
Zero
Exponent
Exponent
of One
Power of
Power

Modified January 4, 2015 (check reverse side of page) Page 151 of 161
Rule
Name
Law of
Exponents Law of Logarithms Examples
Change
Base
Use Power of
Power Rule and
fact that
therefore (aka )
If
then
Logs of
Different
Bases
Use Change Base Rule and let
And
Let y = a
Negative
Exponent
Powers of
-1
n even:
n odd:
The logarithm of a negative number is undefined
Product of
Powers This Rule, , implies
Quotient
of Powers
This Rule,
, implies
Power of
Product
While the law of exponents is simple and important
rules, there is no simple corresponding logarithm
rule. Apply previous rules in multi-step analysis.
Examples:
Power of
Quotient

Modified January 4, 2015 (check reverse side of page) Page 152 of 161
University Physics Workbook Part I Appendix J: Calculus Review
Fortunately sparkcharts makes this available for free at http://www.sparknotes.com/free-
pdfs/nook-study/9781411487628_calculusi.pdf. It also has a pretty good Logarithm,
Exponent, and Trigonometry review. It does not include a review of Geometry and
Vectors that I include in Appendic D. By copyright law I can’t reproduce that sparkchart
here. However Appendices D & E include Trignometry, Exponentials, and Logarithms
and following is a “Quick Calculus” review by Dr. Tovar of Eastern Oregon University.
Dr. Tovar created several good reviews including calculus
(http://physics.eou.edu/opensource/math/calc/calc.pdf). He does permit reproduction
which I will do imbedding his review into this workbook. Note that the very last line on
each page is not Dr. Tovar’s – it is this workbook’s footer. Following in Dr. Tovar’s
calculus review starting with the title page below:
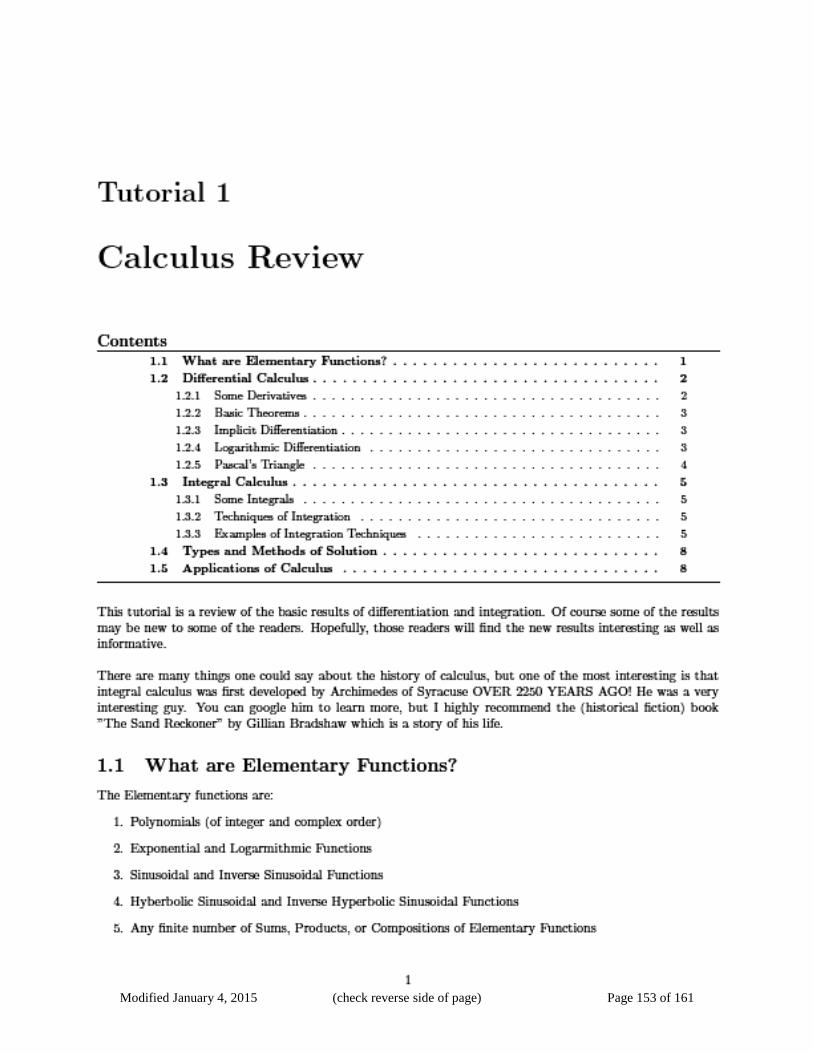
Modified January 4, 2015 (check reverse side of page) Page 153 of 161

Modified January 4, 2015 (check reverse side of page) Page 154 of 161
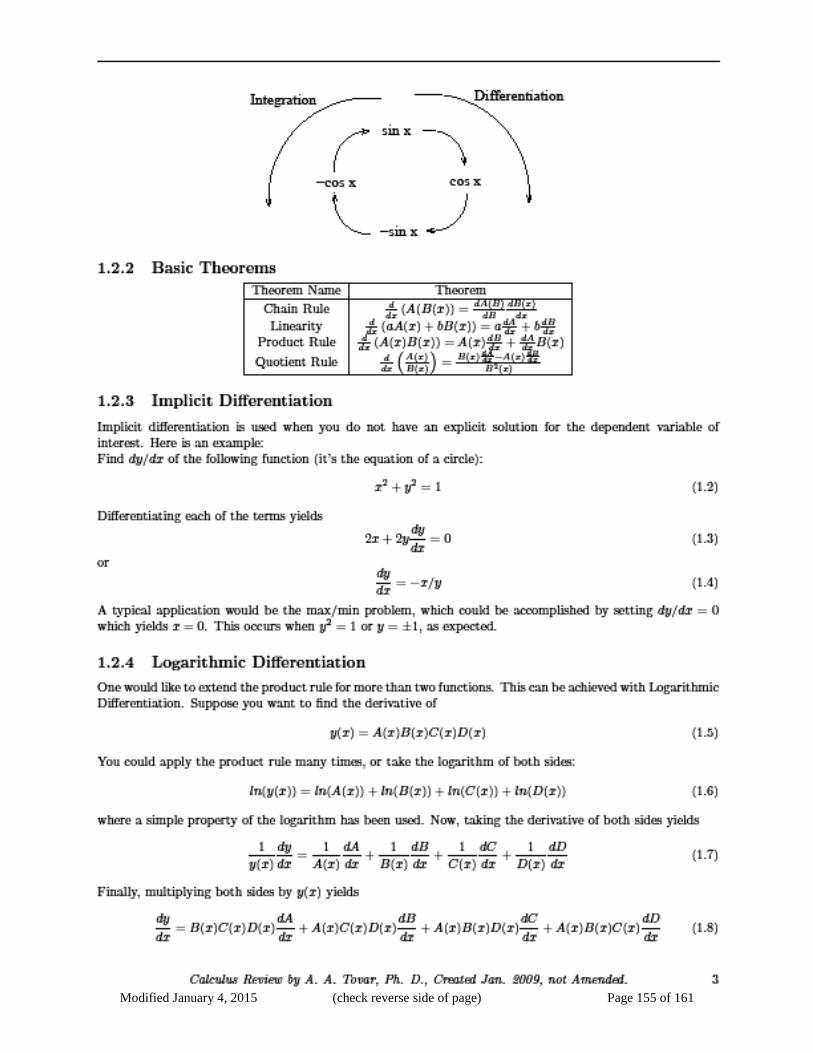
Modified January 4, 2015 (check reverse side of page) Page 155 of 161

Modified January 4, 2015 (check reverse side of page) Page 156 of 161

Modified January 4, 2015 (check reverse side of page) Page 157 of 161

Modified January 4, 2015 (check reverse side of page) Page 158 of 161

Modified January 4, 2015 (check reverse side of page) Page 159 of 161

Modified January 4, 2015 (check reverse side of page) Page 160 of 161
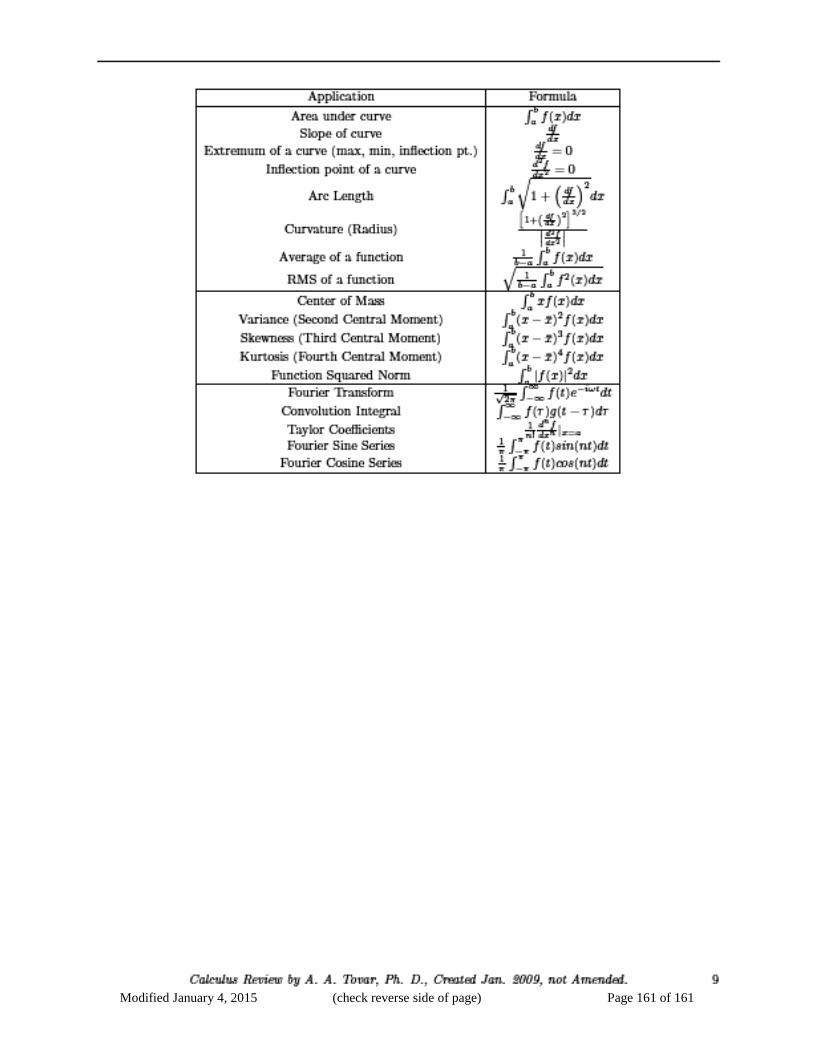
Modified January 4, 2015 (check reverse side of page) Page 161 of 161