Physics-02 (Keph 201407) - CIET
21
Physics-02 (Keph_201407) Physics 2019 Physics-02 (Keph_201407)Oscillations and Waves 1. Details of Module and its structure Subject Name Physics Course Name Physics 02 (Physics Part 2 ,Class XI) Module Name/Title Unit 10, Module 7, Simple Pendulum and Its Applications Chapter 14, Oscillations Module Id keph_201407_eContent Pre-requisites Periodic motion, periodic sine and cosine function, simple harmonic motion,phase, energy of a simple harmonic motion, periodic time, frequency Objectives After going through this module, the learners will be able to: Use a simple pendulum plot its L-T 2 graph and use it to find the effective length of a second’s pendulum Study variation of time period of a simple pendulum of a given length by taking bobs of same size but different masses and interpret the result Use a simple pendulum plot its L-T 2 graph and use it to calculate the acceleration due to gravity at a particular place Keywords Simple Pendulum, time period, effective length, Amplitude, acceleration due to gravity, dissipation of energy, experiments with simple pendulum 2. Development team Role Name Affiliation National MOOC Coordinator (NMC) Prof. Amarendra P. Behera Central Institute of Educational Technology, NCERT, New Delhi Programme Coordinator Dr. Mohd Mamur Ali Central Institute of Educational Technology, NCERT, New Delhi Course Coordinator / PI Anuradha Mathur Central Institute of Educational Technology, NCERT, New Delhi Subject Matter Expert (SME) Ramesh Prasad Badoni GIC Misras Patti Dehradun Uttarakhand Review Team Associate Prof. N.K. Sehgal (Retd.) Prof. V. B. Bhatia (Retd.) Prof. B. K. Sharma (Retd.) Delhi University Delhi University DESM, NCERT, New Delhi
Transcript of Physics-02 (Keph 201407) - CIET
Physics-02 (Keph_201407)
Physics 2019 Physics-02 (Keph_201407)Oscillations and Waves
1. Details of Module and its structure
Subject Name Physics
Course Name Physics 02 (Physics Part 2 ,Class XI)
Module Name/Title Unit 10, Module 7, Simple Pendulum and Its Applications
Chapter 14, Oscillations
Module Id keph_201407_eContent
Pre-requisites Periodic motion, periodic sine and cosine function, simple harmonic
motion,phase, energy of a simple harmonic motion, periodic time,
frequency
Objectives After going through this module, the learners will be able to:
Use a simple pendulum plot its L-T2graph and use it to find the
effective length of a second’s pendulum
Study variation of time period of a simple pendulum of a given
length by taking bobs of same size but different masses and
interpret the result
Use a simple pendulum plot its L-T2graph and use it to
calculate the acceleration due to gravity at a particular place
Keywords Simple Pendulum, time period, effective length, Amplitude,
acceleration due to gravity, dissipation of energy, experiments with
simple pendulum
2. Development team
Role Name Affiliation
National MOOC
Coordinator (NMC)
Prof. Amarendra P. Behera Central Institute of Educational
Technology, NCERT, New Delhi
Programme
Coordinator
Dr. Mohd Mamur Ali Central Institute of Educational
Technology, NCERT, New Delhi
Course Coordinator /
PI
Anuradha Mathur Central Institute of Educational
Technology, NCERT, New Delhi
Subject Matter Expert
(SME)
Ramesh Prasad Badoni GIC Misras Patti Dehradun
Uttarakhand
Review Team Associate Prof. N.K. Sehgal
(Retd.)
Prof. V. B. Bhatia (Retd.)
Prof. B. K. Sharma (Retd.)
Delhi University
Delhi University
DESM, NCERT, New Delhi
Physics-02 (Keph_201407)
Physics 2019 Physics-02 (Keph_201407)Oscillations and Waves
TABLE OF CONTENTS
1. Unit Syllabus
2. Module-Wise Distribution Of Unit Syllabus
3. Words You Must Know
4. Introduction
5. Using a simple pendulum plot L – T and L – T2 graphs, hence find the effective length of
second's pendulum using appropriate graph
6. To determine 'g', the acceleration due to gravity, at a given place, from the L – T2 graph, for
a simple pendulum
7. Some more experiments using the same apparatus
8. Summary
1. UNIT SYLLABUS
Unit 10:Oscillations and Waves
Chapter 14 oscillations
Periodic motion, time period, frequency, displacement as a function of time , periodic
functions Simple harmonic motion (S.H.M) and its equation; phase; oscillations of a loaded
spring-restoring force and force constant; energy in S.H.M. Kinetic and potential energies;
simple pendulum derivation of expression for its time period.
Free forced and damped oscillations (qualitative ideas only) resonance
Chapter 15 Waves
Wave motion transverse and longitudinal waves, speed of wave motion , displacement,
relation for a progressive wave, principle of superposition of waves , reflection of waves ,
standing waves in strings and organ pipes, fundamental mode and harmonics, beats,Doppler
effect
2. MODULE-WISE DISTRIBUTION OF UNIT SYLLABUS 15 MODULES
Module 1
Periodic motion
Special vocabulary
Time period, frequency,
Periodically repeating its path
Periodically moving back and forth about a point
Mechanical and non-mechanical periodic physical
quantities
Module 2 Simple harmonic motion
Ideal simple harmonic oscillator
Amplitude
Comparing periodic motions phase,
Physics-02 (Keph_201407)
Physics 2019 Physics-02 (Keph_201407)Oscillations and Waves
Phase difference
Out of phase
In phase
not in phase
Module 3
Kinematics of an oscillator
Equation of motion
Using a periodic function (sine and cosine functions)
Relating periodic motion of a body revolving in a circular
path of fixed radius and an Oscillator in SHM
Module 4
Using graphs to understand kinematics of SHM
Kinetic energy and potential energy graphs of an oscillator
Understanding the relevance of mean position
Equation of the graph
Reasons why it is parabolic
Module 5
Oscillations of a loaded spring
Reasons for oscillation
Dynamics of an oscillator
Restoring force
Spring constant
Periodic time spring factor and inertia factor
Module 6
Simple pendulum
Oscillating pendulum
Expression for time period of a pendulum
Time period and effective length of the pendulum
Calculation of acceleration due to gravity
Factors effecting the periodic time of a pendulum
Pendulums as ‘time keepers’ and challenges
To study dissipation of energy of a simple pendulum by
plotting a graph between square of amplitude and time
Module 7
Using a simple pendulum plot its L-T2graph and use it to
find the effective length of a second’s pendulum
To study variation of time period of a simple pendulum of a
given length by taking bobs of same size but different
masses and interpret the result
Using a simple pendulum plot its L-T2graph and use it to
calculate the acceleration due to gravity at a particular
place

Physics-02 (Keph_201407)
Physics 2019 Physics-02 (Keph_201407)Oscillations and Waves
Module 8
Free vibration natural frequency
Forced vibration
Resonance
To show resonance using a sonometer
To show resonance of sound in air at room temperature
using a resonance tube apparatus
Examples of resonance around us
Module 9
Energy of oscillating source, vibrating source
Propagation of energy
Waves and wave motion
Mechanical and electromagnetic waves
Transverse and longitudinal waves
Speed of waves
Module 10 Displacement relation for a progressive wave
Wave equation
Superposition of waves
Module 11
Properties of waves
Reflection
Reflection of mechanical wave at i)rigid and ii)non-rigid
boundary
Refraction of waves
Diffraction
Module 12
Special cases of superposition of waves
Standing waves
Nodes and antinodes
Standing waves in strings
Fundamental and overtones
Relation between fundamental mode and overtone
frequencies, harmonics
To study the relation between frequency and length of a
given wire under constant tension using sonometer
To study the relation between the length of a given wire and
tension for constant frequency using a sonometer
Module13 Standing waves in pipes closed at one end,
Standing waves in pipes open at both ends
Fundamental and overtones
Relation between fundamental mode and overtone
frequencies
Harmonics
Physics-02 (Keph_201407)
Physics 2019 Physics-02 (Keph_201407)Oscillations and Waves
Module 14 Beats
Beat frequency
Frequency of beat
Application of beats
Module 15
Doppler effect
Application of Doppler effect
MODULE 7
3. WORDS YOU MUST KNOW
Let us remember the words we have been using in our study of this physics course
Displacement the distance an object has moved from its starting position moves in a particular
direction.SI unit: m, this can be zero, positive or negative
For a vibration or oscillation, thedisplacement could ne mechanical, electrical magnetic.
mechanical displacement can be angular or linear.
Acceleration- time graph: graph showing change in velocity with time , this graph can be obtained
from position time graphs
Instantaneous velocity
Velocity at any instant of time
𝑣 = lim∆𝑡⟶0
∆𝑥
∆𝑡=
𝑑𝑥
𝑑𝑡
Instantaneous acceleration
Acceleration at any instant of time
𝑎 = lim∆𝑡⟶0
∆𝑣
∆𝑡=
𝑑𝑣
𝑑𝑡=
𝑑2𝑥
𝑑𝑡2
kinematics study of motion without considering the cause of motion
Oscillation: one complete to and fro motion about the mean position Oscillation refers to
any periodic motion of a body moving about the equilibrium position and repeats itself over and
over for a period of time.
Vibration: It is a to and fro motion about a mean position. the periodic time is small. so we can
say oscillations with small periodic time are called vibrations. the displacement from the mean
position is also small.
Frequency: The number of vibrations / oscillations in unit time.

Physics-02 (Keph_201407)
Physics 2019 Physics-02 (Keph_201407)Oscillations and Waves
Angular frequency: a measure of the frequency of an object varying sinusoidally equal to 2π
times the frequency in cycles per second and expressed in radians per second.
Inertia: Inertia is the tendency of an object in motion to remain in motion, or an object at rest
to remain at rest unless acted upon by a force.
Sinusoidal: like a sin 𝜽 𝒗𝒔𝜽 A sine wave or sinusoid is a curve that describes a smooth
periodic oscillation.
Simple harmonic motion (SHM):repetitive movement back and forth about am
equilibrium(mean) position, so that the maximum displacement on one side of this position is
equal to the maximum displacement on the other side. The time interval of each complete
vibration is the same.
Harmonic oscillator: A harmonic oscillator is a physical system that, when displaced from
equilibrium, experiences a restoring force proportional to the displacement.
Mechanical energy:is the sum of potential energy and kinetic energy. It is the energy
associated with the motion and position of an object.
Restoring force: is a force exerted on a body or a system that tends to move it towards an
equilibrium state.
Conservative force: is a force with the property that the total work done in moving a particle
between two points is independent of the taken path. When an object moves from one location
to another, the force changes the potential energy of the object by an amount that does not
depend on the path taken.
Bob:A bob is the weight on the end of a pendulum
Periodic motion: motion repeated in equal intervals of time.
Simple pendulum: If a heavy point-mass is suspended by a weightless, inextensible and
perfectly flexible string from a rigid support, then this arrangement is called a ‘simple
pendulum’
Time period of a pendulum𝑇 = 2𝜋 √𝑙
𝑔
Restoring Force: No net force acts upon a vibrating particle in its equilibrium position. Hence,
the particle can remain at rest in the equilibrium position. When it is displaced from its
equilibrium position, then a periodic force acts upon it which is always directed towards the
equilibrium position. This is called the ‘restoring force’. The spring gets stretched and, due to
elasticity, exerts a restoring force F on the body directed towards its original position. By
Hooke’s law, the force F is given by
𝐹 = −𝑘𝑥,
Displacement Equation of SHM:
𝑦 = 𝑎 sin 𝜔𝑡
Time period: The time taken by an oscillating system to complete one oscillation,
𝑇 = 2 𝜋/𝜔.
Physics-02 (Keph_201407)
Physics 2019 Physics-02 (Keph_201407)Oscillations and Waves
Frequency: The number of oscillations in one second is called the ‘frequency’ (n) of
oscillation system.
𝑛 =1
𝑇 =
𝜔
2𝜋
Phase:When a particle vibrates, its position and direction of motion vary with time. The
general equation of displacement is
y = a sin(ω t + 𝜙),
𝜙 is called the ‘initial phase’ we usually we have 𝜙 = 0 when we are talking about the SHM of a
single particle.
Velocity in SHM: 𝑣 in terms of a and 𝒚 as
𝑣 = 𝜔 √𝑎2 − 𝑦2
Acceleration in SHM: Acceleration of a moving particle is
∴ 𝛼 = − (𝑣2
𝑎2) 𝑦. or 𝛼 = −𝜔2𝑦.
4. INTRODUCTION:
We have learnt about a simple pendulum, nature of simple harmonic motion. we have understood
that a restoring force must set up in any system so that it can oscillate.
We will now learn more about the experiments we perform in the laboratory using a simple
pendulum.
5. USING A SIMPLE PENDULUM PLOT L – T AND L – T2 GRAPHS, HENCE FIND THE
EFFECTIVE LENGTH OF SECOND'S PENDULUM USING APPROPRIATE GRAPH.
The apparatus required to perform the experiment is
Clamp stand;
a split cork;
a heavy metallic (brass/iron) spherical bob with a hook;
a long, fine, strong cotton thread/string (about 2.0 m);
stop-watch; metre scale, graph paper, pencil, eraser.
DESCRIPTION OF TIME MEASURING DEVICES IN A SCHOOL LABORATORY
The most common device used for measuring time in a school laboratory is a stop-watch or a stop-
clock. As the names suggest, these have the provision to start or stop their working as desired by the
experimenter.
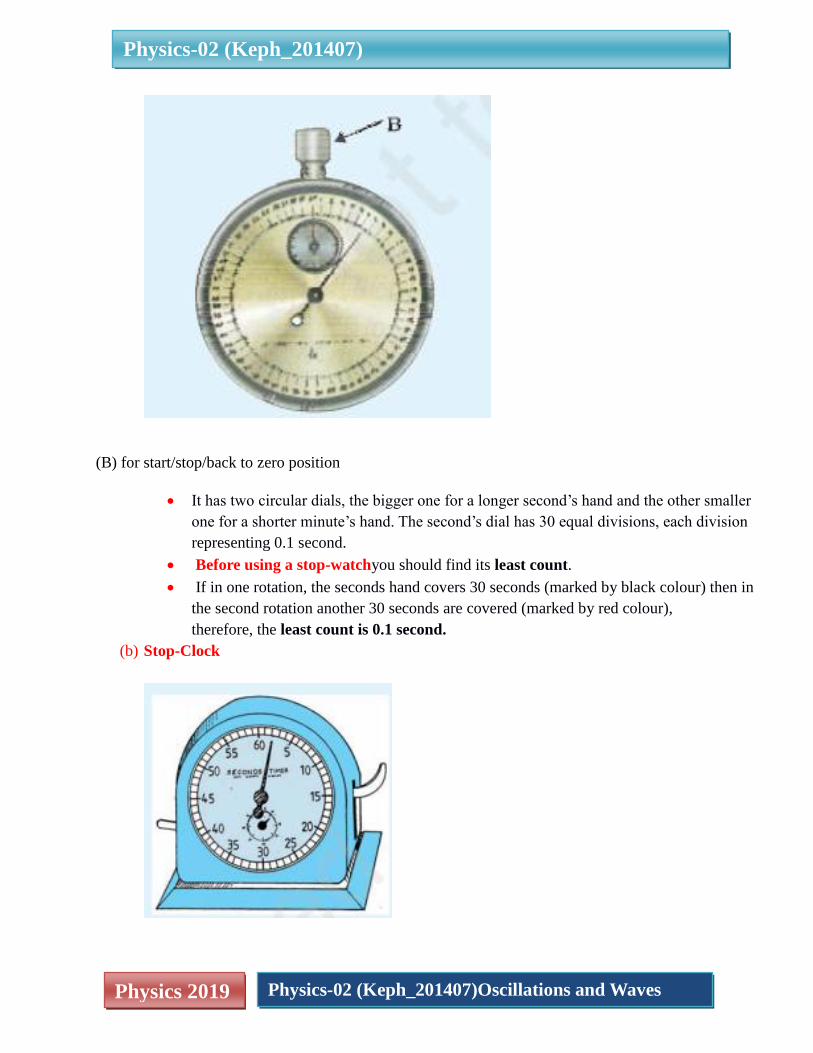
(a) Stop-Watch
A stop-watch is a special kind of watch. It has a multipurpose knob or button
Physics-02 (Keph_201407)
Physics 2019 Physics-02 (Keph_201407)Oscillations and Waves
(B) for start/stop/back to zero position
It has two circular dials, the bigger one for a longer second’s hand and the other smaller
one for a shorter minute’s hand. The second’s dial has 30 equal divisions, each division
representing 0.1 second.
Before using a stop-watchyou should find its least count.
If in one rotation, the seconds hand covers 30 seconds (marked by black colour) then in
the second rotation another 30 seconds are covered (marked by red colour),
therefore, the least count is 0.1 second.
(b) Stop-Clock

Physics-02 (Keph_201407)
Physics 2019 Physics-02 (Keph_201407)Oscillations and Waves
The least count of a stop-watch is generally about 0.1s
While the least count of a stop-clock is 1s, so for more accurate measurement of time
intervals in a school laboratory, a stop-watch is preferred.
Digital stop-watches are also available now. These watches may be started by pressing
the button and can be stopped by pressing the same button once again. The lapsed time
interval is directly displayed by the watch.
TERMS AND DEFINITIONS
Second's pendulum: It is a pendulum which takes precisely one second to move from one extreme
position to other. Thus, its times period is precisely 2 seconds.
Simple pendulum: A point mass suspended by an inextensible, mass less string from a rigid point
support.
In practice a small heavy spherical bob of high density material of radius r, much smaller than the
length of the suspension, is suspended by a light, flexible and strong string/thread supported at the
other end firmly with a clamp stand. This a good approximation to an ideal simple pendulum.
Effective length of the pendulum:
The distance L between the point of suspensionand the centre of spherical bob (centre of gravity),
Physics-02 (Keph_201407)
Physics 2019 Physics-02 (Keph_201407)Oscillations and Waves
L = l + r + e, is also called the effective length, refer to figure (b)
Where
L is the length of the string from the top of the bob to the hook,
e the length of the hook and
r the radius of the bob
PRINCIPLE
The simple pendulum executes Simple Harmonic Motion (SHM) as the acceleration of the
pendulum bob is directly proportional to its displacement from the mean position and is always
directed towards it.
The time period (T) of a simple pendulum for oscillations of small amplitude, is given by the
relation
𝐓 = 𝟐𝛑 √𝐋
𝐠
Where
L is the length of the pendulum
g is the acceleration due to gravity at the place of experiment.
PROCEDURE
(i) Place the clamp stand on the table. Tie the hook, attached to the pendulum bob, to one end of
the string of about 150 cm in length. Pass the other end of the string through two half-pieces of
a split cork.
The string should be tied first, the length of the string along with the hook may be marked with a
pen.
(ii) Clamp the split cork firmly in the clamp stand such that the line of separation of the two pieces
of the split cork is at right angles to the line OA along which the pendulum oscillates
The string should be placed between the split corks. Place the cork between the clamp holders,pull
the string up to the pen mark and tighten the clamp holder. The point of suspension should be neat.
(iii)Mark, with a piece of chalk or ink, on the edge of the table a vertical line parallel to and just
behind the vertical thread OA, the position of the bob at rest. Take care that the bob hangs
vertically (about 2 cm above the floor) beyond the edge of the table so that it is free to
oscillate
Physics-02 (Keph_201407)
Physics 2019 Physics-02 (Keph_201407)Oscillations and Waves
(iv) Displace the bob to one side, not more than 150 angulardisplacements, from the vertical
position OA and then release it gently.
In case you find that the stand is shaky, put some heavy object on its base.
Make sure that the bob starts oscillating in a vertical plane about its rest (or mean) position OA
and does not
a) spin about its own axis, or
b) move up and down while oscillating, or
c) revolve in an elliptic path around its mean position.
(v) Keep the pendulum oscillating for some time. After completion of a few oscillations, start the
stop-watch/clock as the thread attached to the pendulum bob just crosses its mean position
(say, from left to right). Count it as zero oscillation.
You can also choose an extreme position to start counting, start with zero and the pendulum
completes one oscillation when it returns to the same extreme position.
(vi) Keep on counting oscillations 1,2,3,…, n, everytime the bob crosses the mean position OA in
the same direction (from left to right).
Stop the stop-watch/clock, at the count n (say, 20 or 25) of oscillations, i.e., just when n oscillations
are complete.
For better results, n should be chosen such that the time taken for n oscillations is 50 s or more. Read,
the total time (t) taken by the bob for n oscillations. Repeat this observation a few times by noting the
time for same number (n) of oscillations. Take the mean of these readings. Compute the time for one
oscillation, i.e., the time period T (= t/n) of the pendulum.
(vii) Change the length of the pendulum, by about 10 cm. Repeat the step 6 again for
finding the time (t) for about 20 oscillations or more for the new length and find the mean time
period.
Take 5 or 6 more observations for different lengths of pendulum and find mean time period in
each case.
(viii) Record observations in the tabular form with proper units and significant figures.
(ix) Take effective length L along x-axis and T 2 (or T) along y-axis, using the observed values
from the table.
Physics-02 (Keph_201407)
Physics 2019 Physics-02 (Keph_201407)Oscillations and Waves
Choose suitable scales on these axes to represent L and T2 (or T).
Plot a graph between L and T2
Plot a graph between L and T
What are the shapes of L –T 2 graph and L –T or T- L (showing the dependence of T on effective
length L of the pendulum)graph?
Explain their shapes with reasons
OBSERVATIONS
(i) Radius (r) of the pendulum bob (given) = ... cm
Length of the hook (given) (e) = ... cm
Least count of the metre scale = ... mm = ... cm
Least count of the stop-watch/clock = ... s
OBSERVATION TABLE
Measuring the time period T and effective length L of the simple pendulum
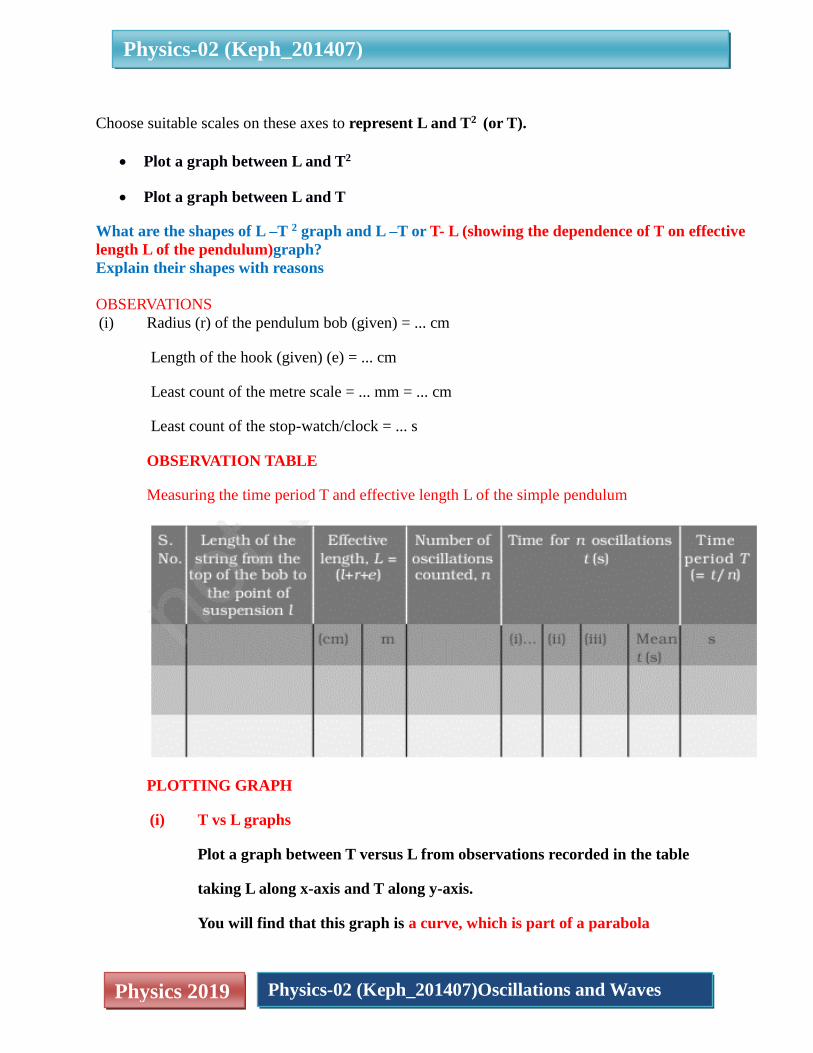
PLOTTING GRAPH
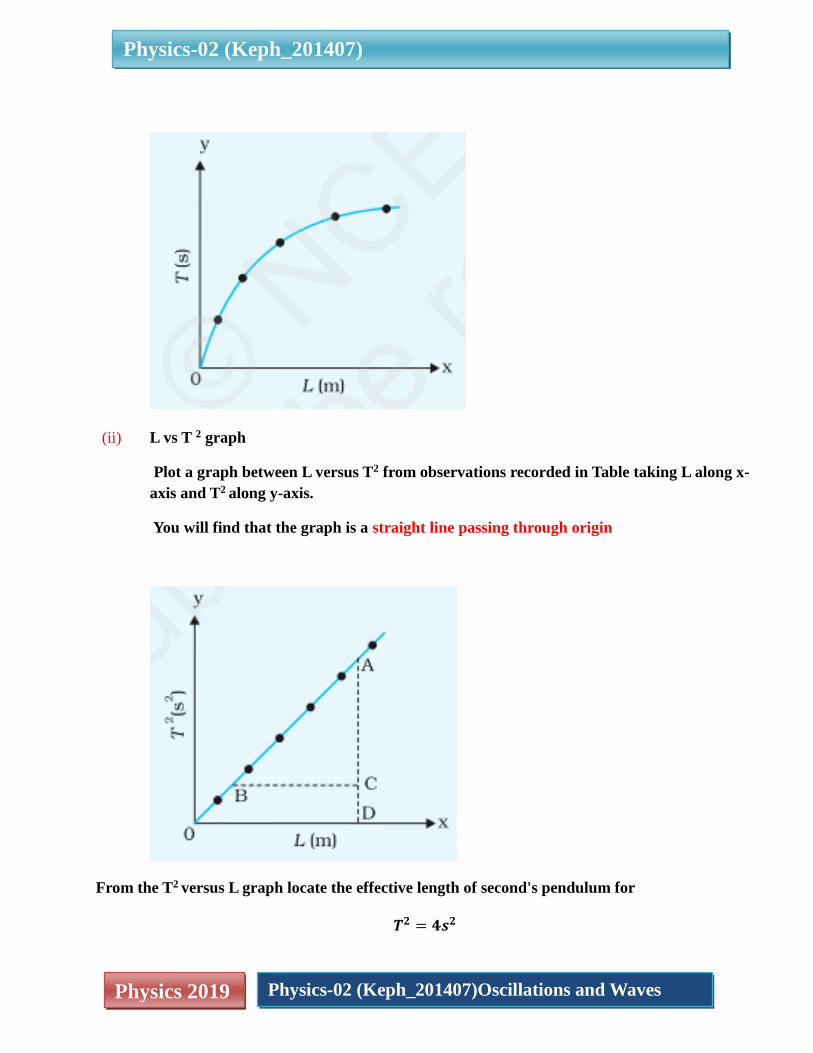
(i) T vs L graphs
Plot a graph between T versus L from observations recorded in the table
taking L along x-axis and T along y-axis.
You will find that this graph is a curve, which is part of a parabola
Physics-02 (Keph_201407)
Physics 2019 Physics-02 (Keph_201407)Oscillations and Waves
(ii) L vs T 2 graph
Plot a graph between L versus T2 from observations recorded in Table taking L along x-
axis and T2 along y-axis.
You will find that the graph is a straight line passing through origin
From the T2 versus L graph locate the effective length of second's pendulum for
𝑻𝟐 = 𝟒𝒔𝟐
Physics-02 (Keph_201407)
Physics 2019 Physics-02 (Keph_201407)Oscillations and Waves
RESULT
The graph L versus T is curved, convex upwards.
The graph L versus T2 is a straight line.
The effective length of second's pendulum from L versus T2 graph is ... cm.
Note:
The radius of bob may be found from its measured diameter with the help of callipers by placing
the pendulum bob between the two jaws of
(a) Ordinary callipers, or
(b) Vernier Callipers,
It can also be found by
placing the spherical bob between two parallel card boards and measuring the spacing
(diameter) or distance between them with a metre scale.
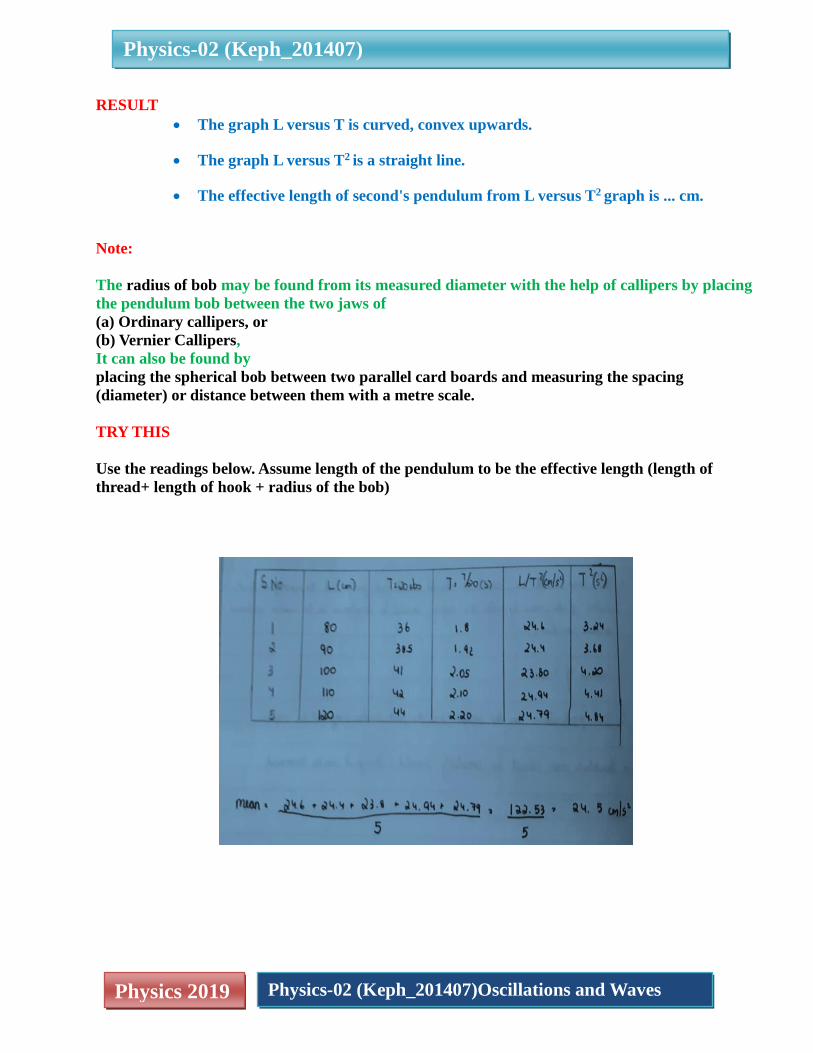
TRY THIS
Use the readings below. Assume length of the pendulum to be the effective length (length of
thread+ length of hook + radius of the bob)

Physics-02 (Keph_201407)
Physics 2019 Physics-02 (Keph_201407)Oscillations and Waves
a) Plot a graph between L and T
b) Plot a graph between L and T2
c) from the graph find the length of a second/s pendulum
d) calculate the value of acceleration due to gravity at the place where the readings are taken
e) Find the length of a pendulum whose period time is 1.5 s.
THINK ABOUT THESE
The accuracy of the result for the length of second's pendulum depends mainly on the
accuracy in measurement of effective length (using metre scale) and the time period T of the
pendulum (using stop-watch).
As the time period appears as T2, a small uncertainty in the measurement of T would result in
appreciable error in T 2, hence significantly affecting the result. A stop-watch with accuracy
of 0.1s may be preferred over a less accurate stop-watch/clock.
Some personal error is always likely to be involved due to stop-watch not being started or
stopped exactly at the instant the bob crosses the mean position. Take special care that you start
and stop the stop-watch at the instant when pendulum bob just crosses the mean position in the
same direction.
Sometimes air currents may not be completely eliminated. This may result in conical
motion of the bob, instead of its motion in vertical plane. The spin or conical motion of the
bob may cause a twist in the thread, thereby affecting the time period. Take special care that the
bob, when it is taken to one side of the rest position, is released very gently.
To suspend the bob from the rigid support, use a light, strong, unspun cotton thread instead of
nylon string. Elasticity of the string is likely to cause some error in the effective length of
the pendulum.
The simple pendulum swings to and fro in SHM about the mean, equilibrium position. the
relation between T and L
𝐓 = 𝟐𝛑 √𝐋
𝐠
g, holds strictly true for small amplitude or swing θ of the pendulum. Remember that this
relation is based on the assumption that sin θ ≈ θ, (expressed in radian) holds only for
small angular displacement θ.

Physics-02 (Keph_201407)
Physics 2019 Physics-02 (Keph_201407)Oscillations and Waves
Buoyancy of air and viscous drag due to air slightly increase the time period of the
pendulum. The effect can be greatly reduced to a large extent by taking a small, heavy bob
of high density material (such as iron/ steel/brass).
EXAMPLE
Interpret the graphs between L and T 2, that you have drawn for a simple pendulum.
SOLUTION
𝐓 = 𝟐𝛑 √𝐥
𝐠
𝐓𝟐 =𝟒𝛑𝟐𝐥
𝐠
Taking
l,along x-axis and
T 2 along y-axis.
We will find that the graph is a straight line passing through origin
The equation of this line graph will be y = mx
𝐓𝟐 =𝟒𝛑𝟐𝐥
𝐠
The slope of the l -T2 graph is
𝟒𝛑𝟐
𝐠
EXAMPLE
How can you determine the value of 'g', acceleration due to gravity, from the T 2 vs L graph?
SOLUTION
We can calculate ‘g’ from the slope
𝐬𝐥𝐨𝐩𝐞 =𝟒𝛑𝟐
𝐠 𝐨𝐫 𝐠 =
𝟒𝛑𝟐
𝐬𝐥𝐨𝐩𝐞

Physics-02 (Keph_201407)
Physics 2019 Physics-02 (Keph_201407)Oscillations and Waves
6. TO DETERMINE 'g', THE ACCELERATION DUE TO GRAVITY, AT A GIVEN PLACE,
FROM THE L – T 2 GRAPH, FOR A SIMPLE PENDULUM.
Same as above
EXAMPLE
How will the values change if the experiment was performed at a location on mount Everest?
Height of Mount Everest = 8,848 m
https://upload.wikimedia.org/wikipedia/commons/d/d1/Mount_Everest_as_seen_from_Drukair2
_PLW_edit.jpg
a) Length of the pendulum
b) Time for 20 oscillations
c) Amplitude
d) Periodic time
e) Slope of L-T2 graph
SOLUTION
a) no change
b) increase
Physics-02 (Keph_201407)
Physics 2019 Physics-02 (Keph_201407)Oscillations and Waves
c) no change
d) increase
e) As𝐠 =𝟒𝛑𝟐
𝐬𝐥𝐨𝐩𝐞 g decreases with altitude , hence slope must increase
7. STUDY VARIATION OF TIME PERIOD OF A SIMPLE PENDULUM OF A GIVEN
LENGTH BY TAKING BOBS OF SAME SIZE BUT DIFFERENT MASSES AND
INTERPRET THE RESULT
Studying the effect of mass of the bob on the time period of the simple pendulum.
Hint:
With the same experimental set-up, take a few bobs of different materials (different masses)
but of same size.
Keep the length of the pendulum same for each case.
Starting from a small angular displacement of about 10° find out, in each case, the time period of
the pendulum, using bobs of different masses.
Does the time period depend on the mass of the pendulum bob?
If yes, then see the order in which the change occurs.
If not, then do you see an additional reason to use the pendulum as a time measuring device.
8. SOME MORE EXPERIMENTS USING THE SAME APPARATUS
You can also try the following
STUDYING THE EFFECT OF SIZE OF THE BOB ON THE TIME PERIOD OF THE
SIMPLE PENDULUM.
Hint:
With the same experimental set-up, take a few spherical bobs of same material (density) but of
different sizes (diameters).
Keep the length of the pendulum the same for each case.
Clamp the bobs one by one, and starting from a small angular displacement of about 10°, each
time measure the time for 50 oscillations.
Find out the time period of the pendulum using bobs of different sizes.

Physics-02 (Keph_201407)
Physics 2019 Physics-02 (Keph_201407)Oscillations and Waves
Compensate for difference in diameter of the bob by adjusting the length of the thread.
Does the time period depend on the size of the pendulum bob?
If yes, see the order in which the change occurs.
STUDYING THE EFFECT OF MATERIAL (DENSITY) OF THE BOB ON THE TIME
PERIOD OF THE SIMPLE PENDULUM. Hint:
With the same experimental set-up, take a few spherical bobs (balls) of different materials, but of
same size.
Keep the length of the pendulum the same for each case.
Find out, in each case starting from a small angular displacement of about 10°, the time
period of the pendulum using bobs of different materials,
Does the time period depend on the material (density) of the pendulum bob?
If yes, see the order in which the change occurs.
If not, then do you see an additional reason to use the pendulum for time
measurement.
STUDYING THE EFFECT OF AMPLITUDE OF OSCILLATION ON THE TIME
PERIOD OF THE SIMPLE PENDULUM.
Hint:
With the same experimental set-up, keep the mass of the bob and length of the pendulum fixed.
For measuring the angular amplitude, make a large protractor on the cardboard and have a
scale marked on an arc from 0° to 90° in units of 5°.
Fix it on the edge of a table by two drawing pins such that its 0°- line coincides with the
suspension thread of the pendulum at rest. Start the pendulum oscillating with a very large
angular amplitude (say 70°) and find the time period T of the pendulum.
Change the amplitude of oscillation of the bob in small steps of 5° or 10° and determine the
time period in each case till the amplitude becomes small (say 5°).
Draw a graph between angular amplitude and T.
How does the time period of the pendulum change with the amplitude of oscillation?
Physics-02 (Keph_201407)
Physics 2019 Physics-02 (Keph_201407)Oscillations and Waves
How much does the value of T for A = 10° differ from that for A= 50° from the graph you
have drawn?
Find at what amplitude of oscillation, the time period begins to vary?
Determine the limit for the pendulum when it ceases to be a simple pendulum.
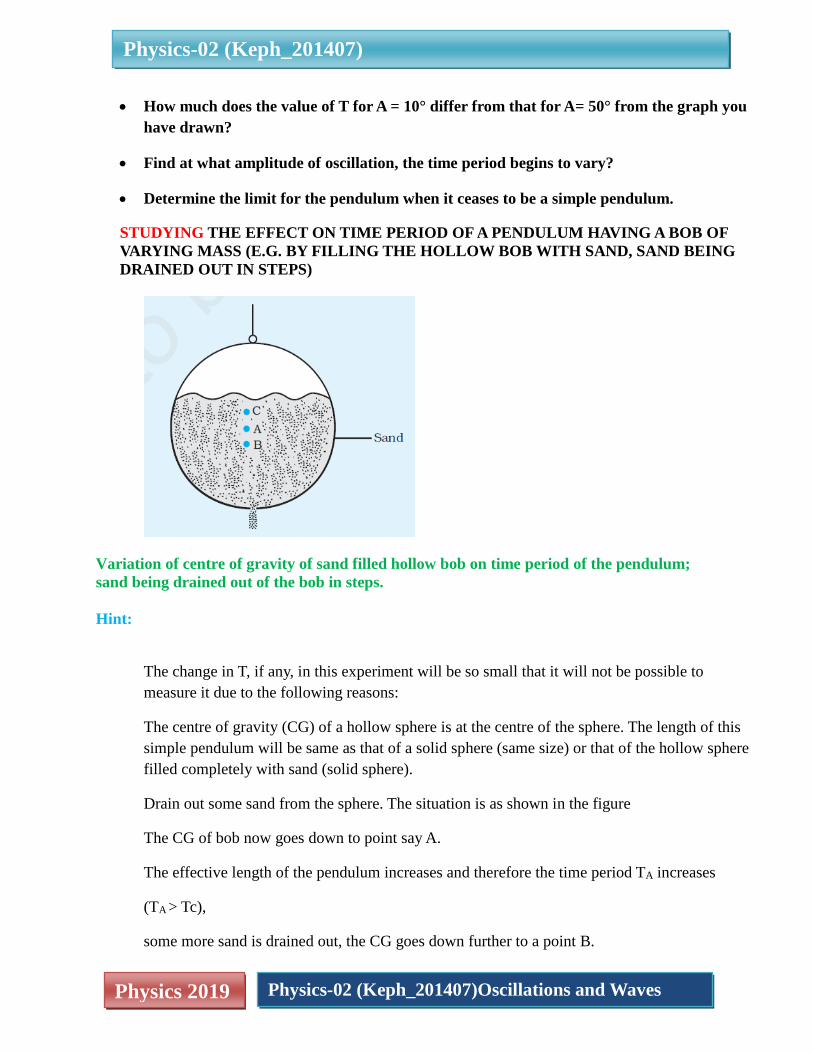
STUDYING THE EFFECT ON TIME PERIOD OF A PENDULUM HAVING A BOB OF
VARYING MASS (E.G. BY FILLING THE HOLLOW BOB WITH SAND, SAND BEING
DRAINED OUT IN STEPS)
Variation of centre of gravity of sand filled hollow bob on time period of the pendulum;
sand being drained out of the bob in steps.
Hint:
The change in T, if any, in this experiment will be so small that it will not be possible to
measure it due to the following reasons:
The centre of gravity (CG) of a hollow sphere is at the centre of the sphere. The length of this
simple pendulum will be same as that of a solid sphere (same size) or that of the hollow sphere
filled completely with sand (solid sphere).
Drain out some sand from the sphere. The situation is as shown in the figure
The CG of bob now goes down to point say A.
The effective length of the pendulum increases and therefore the time period TA increases
(TA > Tc),
some more sand is drained out, the CG goes down further to a point B.
Physics-02 (Keph_201407)
Physics 2019 Physics-02 (Keph_201407)Oscillations and Waves
The effective length further increases, increasing T.
The process continues and L and T change in the same direction (increasing), until finally the
entire sand is drained out.
The bob is now a hollow sphere with CG shifting back to centre C.
The time period will now become Tc again.
9. SUMMARY
A simple pendulum is a heavy spherical small bob ,with an inextensible thread suspended
from a rigid point support
Simple pendulum executes simple harmonic motion
The time period is given by
𝐓 = 𝟐𝛑 √𝐥
𝐠
Time period is independent of mass of the bob
Pendulums keep constant time period and are used as timing devices
Acceleration due to gravity can be experimentally determined using a simple
pendulum