Phylogenetic and biogeographic studies in Guareeae ...
62
Phylogenetic and biogeographic studies in Guareeae (Meliaceae: Melioideae) Erik Koenen under supervision of: Lars Chatrou Biosystematics Group Wageningen University 16-8-2011
Transcript of Phylogenetic and biogeographic studies in Guareeae ...

Phylogenetic and biogeographic studies
in Guareeae (Meliaceae: Melioideae)
Erik Koenenunder supervision of: Lars Chatrou
Biosystematics GroupWageningen University
16-8-2011


Table of contents
Abstract 3
List of tables and figures 4
Preface 5
1 Introduction 6 1.1 Previous studies in Meliaceae 6 1.2 Hypotheses 8
2 Material and methods 11 2.1 Taxon sampling 11 2.2 DNA extraction 11 2.3 Amplification 11 2.4 Sequencing 13 2.5 Alignment 13 2.6 Bayesian inference 13 2.7 Calibration points 15 2.8 Ancestral state reconstruction 16
3 Results 17 3.1 MrBayes analyses 17 3.2 Consensus network reconstruction 17 3.3 Analysis of ITS using doublet models in PHASE 19 3.4 Implementation of molecular clocks 19 3.5 Estimated divergence dates 24 3.6 Ancestral state reconstruction 26
4 Discussion 29 4.1 Performance of methods used 29
4.1.1 Alignment of ITS 30 4.1.2 Phylogenetic utility of ycf1 in Meliaceae 31 4.1.3 Gene trees versus concatenation 32 4.1.4 Molecular clock models 33
4.2 Evolution of Melioideae-Guareeae 35 4.2.1 Generic relationships in Guareeae 35 4.2.2 Species delimitation in Neoguarea and Leplaea 36 4.2.3 Evolution of indeterminate leaf growth 38 4.2.4 Origin and diversification of Melioideae 38
4.3 Conclusions 42
Literature cited 44
AppendicesI. List of vouchers 50II. Supplementary figures 56
2
Abstract
Guarea (Meliaceae) has previously been considered as a genus with a trans-Atlantic distribution, but a recent revision of the African species leads to different hypotheses on generic delimitation. In this study, phylogenetic studies in Guareeae are undertaken to test the new classification of African genera. Bayesian model-based likelihood methods and network reconstruction are used with a nuclear marker (ITS) and a plastid gene (ycf1). From the results, it follows that monophyly of Leplaea and Heckeldora cannot be rejected. Furthermore, Neoguarea seems to take an isolated position on the branch leading to Guarea, in between Turraeanthus and Ruagea with whom it also shares leaf morphological characters. Granting it generic rank seems appropriate, both on morphological and phylogenetic grounds. To better understand how these lineages spread over the continents, biogeographical studies are carried out. Molecular dating analyses and an ancestral area reconstruction are performed on an ITS-dataset including representatives of the whole subfamily Melioideae. Both an uncorrelated lognormal relaxed clock and a random local clock model are used for the estimation of divergence dates. The results suggest migration of the lineage leading to Guarea and Ruagea over a North-Atlantic land bridge during the late Eocene or early Oligocene. A sister relationship of Guarea and Chisocheton is rejected, suggesting two separate origins of intermittent leaf growth within the tribe. And, following the results, an Indian-Malagasy origin of Melioideae and Meliaceae is hypothesized.
Keywords: biogeography, Guareeae, internal transcribed spacer, Meliaceae, Melioideae, phylogeny, random local clock model, relaxed clock model, systematics, ycf1.
List of abbreviations
ITS = internal transcribed spacerKT-boundary = Cretaceous-Tertiary boundaryMCC-tree = maximum clade credibility treeMCMC = Markov chain Monte CarloMya = million years agoPICs = parsimony informative characterspp = posterior probabilityRLC = random local clockycf1 = hypothetical chloroplast open-reading frame 1
3

List of tables and figures
– Tables page
Chapter 3 Table 1. Statistics of the different alignments. 17Table 2. Mean rate of evolution of each partition per site per million years. 24Table 3. Age estimates (mean age) for selected clades and divergences 25
– Figures
Chapter 1Figure 1. African representatives of Melioideae. 7Figure 2. Apical leaf bud in Guarea and Chisocheton 9
Chapter 2Figure 3. Position of ycf1 in the Citrus sinensis chloroplast genome 12Figure 4. Predicted consensus secondary structures of ITS 14
Chapter 3Figure 5. MrBayes tree of ITS 18Figure 6. MrBayes tree of ycf1 19Figure 7. SplitsTree super network 20Figure 8. PHASE tree of ITS 21Figure 9. BEAST tree of ITS under lognormal relaxed clock model 22Figure 10. BEAST tree of ITS under random local clock model 23Figure 11. Posterior distribution of ucld.stdev and rateChangeCount parameters 24Figure 12. Chronogram with ancestral area reconstruction 27Figure 13. MCC-tree with optimization of different leaf types 28
Appendix IIFigure 1. MrBayes tree of ITS and ycf1 combined 56Figure 2. SplitsTree consensus network 57Figure 3. Chronogram of relaxed clock analysis showing rates 58Figure 4. Chronogram of relaxed clock analysis showing ages 59Figure 5. Chronogram of random local clock analysis showing rates 60Figure 6. Chronogram of random local clock analysis showing ages 61
Cover illustration: Molecular clock design by Erik Koenen.Cover photos from left to right: Bark and slash of Leplaea thompsonii (by Carel Jongkind), fruits and leaves of Heckeldora leonensis (idem) and flowers of Turraeanthus longipes (by Lars Chatrou).
4

Preface
I have enjoyed carrying out this thesis at the Biosystematics group, and both the group as well as the thesis itself have played a part in this. Talking to the group members and other students during work and breaks have provided some essential diversion and amusement, as well as useful help and guidance. I think it was a stimulating place to study systematics, even though the group is kind of small. I remember often discussing very different topics within phylogenetics, for example during the journal club. Furthermore, I was very motivated to do this thesis and I think it was worth working all these long days. After studying the taxonomy for a group of species within the Mahogany family (Meliaceae), I have remained interested in doing research on this plant family. This second thesis was a good opportunity to study this family more broadly and to test certain hypotheses that I formulated after my first thesis. In this thesis, I also learned a lot about phylogenetic methods and the latest models for statistic analyses within phylogenetics, which I liked a lot. During this thesis, I also made a trip to the Royal Botanical Gardens at Kew, London. There, I had the chance to meet with dr. Terry Pennington, one of the few Meliaceae experts worldwide. He, together with dr. Brian Styles, wrote an authorative monograph of the genera of the Meliaceae as well as a monograph of the Neotropical Meliaceae. As a part of a new revision of the genus Guarea for the Neotropics, he has also been involved in some phylogenetic work on that genus. Therefore, I went there to meet him with the purpose to discuss our projects and to see if working together would be an option. He gave me some dried leaf samples and, via dr. Jim Clarkson (Jodrell Laboratory at Kew), I received ITS sequence data for a large part of the Neotropical Guarea species. Next to that, they also sent me DNA extracts from their study as well as from previous studies where ITS was used as the phylogenetic marker, so that for these accessions I could additionally sequence a second marker, ycf1. This material has been of great importance for this thesis, given the limitations on my time and budget I would never have been able to gather so much data to use in my analyses without this visit to Kew. I would therefore like to take this opportunity to sincerely thank Terry and Jim for helping me out a great deal!In relation to this, I want to thank the Alberta Mennega Foundation, who has supported this thesis by providing funding for travelling to London and to sequence additional material.I was made familiar with working in the Biosystematics lab by Ria Vrielink. She has also helped me a lot with answering diverse questions and solving problems during the whole period that I was working in the lab. I would like to sincerely thank her for this.Clearly, Lars Chatrou, my supervisor, deserves my gratitude. He gave me very important constructive feedback and I always enjoyed discussing my work with him. Furhtermore, we often talked about various other topics, either related to systematics or not. Lars always really motivated me to carry on and try different solutions for problems I encountered. For all this, I would like to thank him very much, and I hope we can work together more in the future.And finally, a big thank you to the whole Biosystematics Group! I had a great and instructive time, thanks to all staff and students.
5

1. Introduction
The mahogany family (Meliaceae), is a pantropical family of trees and shrubs, or very rarely herbs (Pennington & Styles, 1975). They mostly occur in tropical rainforests and swamp forests, but are also represented in dryer woodlands and semi-arid regions. The family is placed in the Sapindales, but its sister-relationship is unresolved, being most closely related to Simaroubaceae and/or Rutaceae (Muellner et al., 2007). The total number of species in the family has recently been estimated at ca 700 in 50 genera (Muellner et al., 2009). The family is mostly characterized by compound leaves (more rarely with simple leaves), flowers with the filaments fused into a tube, and capsular fruits (Pennington & Styles, 1975). Two subfamilies are currently recognized: Swietenioideae, usually with woody septicidal capsules and with multiple winged seeds per locule; and Melioideae, usually with loculicidal capsules or indehiscent berries with 1 or 2 seeds per locule (Pennington & Styles, 1975; Muellner et al. 2003 and 2008a; Fig. 1). The tribe Guareeae, on which this study focuses, is included in Melioideae. Special emphasis is placed on the African representatives of Guareeae, following recent taxonomic work (De Wilde, 2007; Koenen & De Wilde, in prep.).
The family includes some genera that are highly rated for their timber, mainly in subfamily Swietenioideae (e.g. Swietenia, Cedrela, Khaya and Entandrophragma). The subfamily Melioideae also includes a number of economically important species, e.g. Azadirachta indica A.Juss. ('neem' tree, medicinal use and in cosmetics), Lansium domesticum Correa ('langsat', edible fruits), Sandoricum koetjape Merr. ('santol', edible fruits) and Melia azedarach L. ('chinaberry', ornamental, shade tree in plantations, medicinal use) (Oyen & Dung, 1999). Timber species in Melioideae are more scarce or are only locally used. Species of the genus Leplaea form an exception in this, there are four species in the genus of which the wood is of good to excellent quality (Louppe et al., 2008; Koenen & De Wilde, in. prep.) and they are therefore some of the most sought-after timber trees of Tropical Africa. As for all Meliaceae that are used as timber, their abundance has drastically declined. Many Meliaceae are therefore also listed as threatened on the IUCN Red List (14 spp. CR, 19 spp. EN, 114 VU, out of 214 species in total, IUCN, 2010).
Notable genera within Guareeae include the large Australasian genera Chisocheton (±50 spp.) and Dysoxylum (±80 spp.) (Mabberley et al., 1995) and the Neotropical Guarea (±75 spp., Pennington pers.comm.). An intriguing and conspicuous character that the representatives of the genera Chisocheton and Guarea share is the apical bud on their leaves, which allows for intermittent growth (Pennington & Styles, 1975; Pennington, 1981; Mabberley, 1995; Fukuda et al. 2003; Fig. 2). These leaves can be seen as analogous to twigs (Steingraeber & Fisher, 1986), they can be induced to grow their own root system and can then survive for more than 5 years (Fisher, 1992). Even more peculiar, in C. pohlianus Harms and C. tenuis P.F. Stevens the inflorescences are epiphyllous (Mabberley, 1979; Fisher & Rutishauer, 1990) and C. tenuis even develops epiphyllous shoots and can show an alteration of leaf and shoot axes (Fisher & Rutishauer, 1990). The aforementioned 'ever-growing' leaves are unique within the Angiosperms and are essentially the same in both genera. Also given the fact that no absolute diagnostic characters exist to discriminate between the two genera (Pennington & Styles, 1975), it seems obvious that the two genera are sister groups. In other words, the apical bud in their leaves seems to be a character that only evolved once, with the most recent common ancestor of both genera already possessing this feature.
1.1 Previous taxonomic and phylogenetic studies in MeliaceaeRecently, many genera of Meliaceae have been or are under taxonomic revision. In
Swietenioideae, Carapa was recently revised by Kenfack (2011) and Cedrela by Pennington (Pennington & Muellner, 2010). An update of the Flora Neotropica for Meliaceae (Pennington, 1981), is also expected. In Melioideae, recent revisions of
6

Figure 1. African representatives of Melioideae. a). Flowers of Trichilia monadelpha (Thonn.) J.J. de Wilde, with the laccinate staminal tube typical of the genus. b). Flowers of Heckeldora jongkindii J.J. de Wilde, with an entire staminal tube. c). Flowers of Turraeanthus longipes Baill., with the petals and staminal tube fused for the greater part. d). Infructescences of H. zenkeri (Harms) Staner, with unilocular indehiscent berries. e). Infructescences of Leplaea thompsonii (Sprague & Hutch.) E.J.M. Koenen & J.J. de Wilde, fruits 2-locular capsules though usually not dehiscing. f). A dehisced fruit of Neoguarea glomerulata (Harms) E.J.M. Koenen & J.J. de Wilde, with one developed seed.
(Photographs by: a. Erik Koenen (Koenen 24) b. C.C.H. Jongkind (Jongkind ?) c. L.W.C. Chatrou (Chatrou 564) d. L.J.G. van der Maesen (Maesen 5563) e. F.J. Breteler (Breteler 15389) f. unknown.)
7

African species that were formerly placed in Guarea has led to new hypotheses on generic relationships and the classification of African genera (De Wilde, 2007; Koenen & De Wilde, in prep.). Heckeldora, previously considered monotypic, now includes 7 species. Furthermore, Leplaea has been reinstated, with a broader circumscription to also accommodate 7 species, most of which were previously included in Guarea. Lastly, the section Neoguarea has been raised to generic rank in order to accommodate Guarea glomerulata Harms, a species morphologically distinct from all other African species placed in Guareeae. The Flore du Gabon treatment of Meliaceae is expected to be published in the near future, dealing with a substantial part of African Meliaceae (De Wilde, in prep.).
Meliaceae phylogenetics have also been much investigated recently, most notably by Alexandra Muellner and co-workers (Muellner et al., 2003, 2005, 2006, 2008a, 2008b, 2008c, 2009, 2010). The family as a whole is undoubtedly monophyletic, but molecular characters have shed new light on infrafamilial relationships. The previous classification in four subfamilies (Pennington & Styles, 1975) has been refuted, with the aforementioned two subfamilies remaining (Muellner et al., 2003). The tribal classification also seems to be in need of revision. Tribes Trichilieae and Turreeae do not seem to be distinct from each other and Aglaieae seem to be nested within Guareeae (Muellner et al., 2008). In biogeographic studies, Meliaceae seem to have an African/Gondwanan origin, with the crown age of the family being estimated in between 76.3-84.2 Mya (NPRS) or at 103.70 Mya (penalized likelihood) (Muellner et al., 2006). A study on the phylogenetics of Chisocheton shows some Guarea species nested within the former (Fukuda et al., 2003), but with low support values.
This study sets out to resolve generic relationships within Guareeae and thereby test the hypothesised classification of African genera. Furthermore, it should provide an answer on whether the apical leaf bud in the intermittently growing leaves in species of Chisocheton and Guarea evolved once or has separate origins. Another goal was to elucidate the spreading of Melioideae over the continents and the origins of African and Neotropical Guareeae by means of molecular dating analyses with fossil calibration of molecular clock models and an ancestral area reconstruction. Both a chloroplast and a nuclear marker are used for the phylogenetic analyses. The internal transcribed spacers (ITS) of the nuclear ribosomal DNA is used because it is highly informative and most previous phylogenetic studies in Meliaceae have also used this marker, so ITS-sequences were already available from GenBank for a large number of species. Chloroplast genomes in Meliaceae seem to be evolving at a very slow rate, compared to other plant families. As a result, most plastid markers that have been used in previous studies in Meliaceae have yielded poorly resolved phylogenetic trees (Muellner et al., 2003, 2006 and 2009). The plastid marker that is used in this study is a portion of the large so-called hypothetical chloroplast open reading frame 1 (or ycf1), which has been used in only a few other studies in Angiosperms so far. It is usually located at the boundary of the inverted repeat (IR) and small single copy (SSC) regions of the chloroplast genome (Neubig et al., 2009). It has been shown to be remarkably informative in phylogenetic studies in Orchids (Neubig et al., 2009) and Pinus (Gernandt et al., 2009; Parks et al., 2009). In Annonaceae, it also seems to be quite informative, and is more variable than other chloroplast markers matK and trnL-F (Neubig & Abbott, 2010). Because of the results of these previous studies that use ycf1, it was decided to use this marker and assess its utility in Meliaceae.
1.2 HypothesesFollowing from the results of recent revisions of Heckeldora (De Wilde, 2007) and
Guarea in Africa (Koenen and De Wilde, in prep.), the relationships between these two genera as well as the third related genus in Africa, Turraeanthus, have proven to be quite intricate to resolve with morphological characters. Heckeldora has in the past been classified within Guarea by several taxonomists (Pellegrin (1939) and Harms (1940), among others) until Pennington and Styles (1975) concluded in their generic monograph of the Meliaceae that it should be considered a separate genus, because its
8

Figure 2. Apical leaf bud in Guarea kunthiana A. Juss (a) and Chisocheton sp. (b). (a. from Venezuela, Breteler 4935, b. from New Guinea, Boswezen Nw. Guinea 2432).
unilocular ovary is a unique character state within the family. From the aforementioned revisions, it became clear that the delimitation of Guarea as a genus with a trans-Atlantic distribution could not be upheld. Several African species should be considered to belong in Heckeldora rather than Guarea, on account of their unilocular ovaries. Most of the remaining African species are transferred to the reinstated Leplaea on account of a number of differential characters, of which the presence of a terminal leaflet in their compound leaves allows to easily distinguish it from Guarea, the species of which possess a terminal bud. Leplaea was considered to be congeneric with Guarea previously (Pennington & Styles, 1975), although recognized as a distinct monotypic genus by Harms (1940) and Staner (1941). The Central African species originally described as Guarea glomerulata, seems difficult to accommodate in any of the genera previously described for Africa, as it lacks the definitive characters of all of these. Therefore, the genus Neoguarea is newly recognized to accommodate that species. The newly hypothesised classification of African Guareeae, thus involves four genera: Heckeldora, Leplaea, Neoguarea and Turraeanthus. Guarea is thereby excluded from Africa. My first hypothesis (1) is therefore that these genera are monophyletic. The phylogenetic analyses of Guareeae in this study, with full taxon sampling for the African species, allow for assessing this.
A special case within the genus Leplaea are L. thompsonii (Sprague & Hutch.) E.J.M. Koenen & J.J. De Wilde and the newly described species L. adenopunctata E.J.M. Koenen & J.J. De Wilde. The latter is distinguished from L. thompsonii by its thin, papery leaflets that are densely covered with gland-dots, and smaller flowers. The fruits within L. thompsonii, however, are variable in the number of seeds that develop per locule and a large part of the populations of the species seem to have indehiscent fruits (E.J.M. Koenen & J.J. De Wilde, in prep.). Because a geographic pattern is observed for these characters, and there is a partial overlap with the newly described L. adenopunctata, multiple accessions of both species are sequenced to test the hypothesis (2) that both species are distinct and to see if a geographic pattern can also be found in molecular characters. Next to the new classification of African Guareeae, a hypothesis (3) to test with phylogenetic methods is the suspected sister-relationship between Guarea and Chisocheton, in which case the 'ever-growing' leaves have evolved only once.
Further hypotheses that are formulated for this study reside in the realm of biogeography, and relate to questions of how the lineages of Guareeae have migrated or dispersed in the past to arrive at the current pantropical distribution. One hypothesis (4a) is that the tribe Guareeae originated in Africa and that the non-African genera that are classified within the tribe dispersed from Africa to the other continents, first to
9

(South-East) Asia and later to the Neotropics via North-America (Bering Sea or a North Atlantic land bridge). A similar route is thought to be the most important route within the whole family of Meliaceae for dispersal to other continents (Muellner et.al., 2006). This would explain why the African species in the genus Leplaea have a terminal leaflet on their compound leaves where species of Chisocheton and Guarea lack this leaflet and instead have a terminal bud that allows intermittent growth of the leaf. This is because leaves with a terminal leaflet are thought to be the ancestral state from which the intermittent leaf growth character is derived. The first compound leaves that develop in Chisocheton seedlings are also terminated by a terminal leaflet (Mabberley, 1979), so it makes sense that the terminal leaflet would represent the ancestral state. Therefore, Leplaea seems to be a more basal lineage than Chisocheton and Guarea. Another aspect taken into consideration in the formulation of this hypothesis is that the African group would be expected to be older because its variation in morphological characters is considerably higher than that in the Australasian and Neotropical genera, even though these groups are many times more species rich (±130 spp. in 2 distinctive genera and ±85 spp. in 3 genera, respectively, opposed to only 19 spp. in 4 genera in Africa). This suggests a relatively recent rapid radiation in South-East Asia and the Neotropics, whereas the African species seem to have had a longer separate evolutionary history.
A somewhat different hypothesis (4b) can be formulated based on recent work by Muellner et al. (2010) on the biogeography of the tribe Cedreleae, containing the Neotropical Meliaceous genus Cedrela and the closely related Asian genus Toona. Both together form the sister to the African genus Entandrophragma. Divergence of Cedrela and Toona is estimated at approximately 50 Mya, in the now temperate regions of North America and Europe. Entandrophragma apparently is an even older lineage, but it was not included in the dating analysis. If in Guareeae there have been similar evolutionary histories and dispersal routes, the African lineages might also be older and Guarea and Chisocheton might have diverged around the same time as Cedrela and Toona. Both lineages would then have migrated from Europe and North-America to South-America and across the Bering Sea to Asia, respectively.
A third, less likely, hypothesis (4c) is that long distance dispersal between South-America and Africa has taken place. This has been suggested for many trans-atlantic genera (Renner, 2004), and Carapa, with its floating seeds (own observation), is probably an example within Meliaceae where long distance dispersal has taken place. This hypothesis is less likely here because the seeds of Guareeae seem not to be adapted to dispersal by water (they are thought to be animal-dispersed) and they are unlikely to germinate in coastal ecosystems, as they all occur in wet evergreen or semi-deciduous rainforests. Furthermore, definitive morphological characters that support a close relationship between Neotropical and African lineages are lacking, while the difference between Guarea and Chisocheton is quite unclear based on morphology (Pennington & Styles, 1975). The leaves with intermittent growth do point to a closer relationship between Guarea and Chisocheton than either of the two would have with the African lineages. As the African Guareeae lack this character, long distance dispersal within Guareeae between Africa and South-America is not suspected.
10

2. Material and methods
Lab work and computer analyses were carried out at the Biosystematics group of Wageningen University. Supervision in the lab was provided by Ria Vrielink, thesis supervisor Lars Chatrou provided assistance with the computer analyses. A visit to the Herbarium of the Royal Botanic Gardens at Kew was made, where the project was discussed with Terence D. Pennington. Together with him and Jim Clarkson (Jodrell laboratory at Kew), plans for a collaboration were made, and part of the data was provided by Kew.
2.1 Taxon samplingA total of 133 accessions of Melioideae were used as well as eight accessions of
Swietenioideae for the outgroup in the dating analyses. The analyses were carried out with different sets of fewer accessions, however, and often different outgroups were used. Taxon sampling was most dense in Guareeae, our group of interest. The focus here has been mainly on the genera Guarea, Leplaea, Heckeldora and related genera in the Neotropics and Africa, and to a lesser extent on Australasian genera Dysoxylum, Chisocheton and tribe Aglaieae. For Africa, all species of Guareeae have been sampled. Decisions on which taxa should be included were based on the tribal classification from Pennington & Styles (1975) and a phylogenetic study by Muellner et al. (2008) on the subfamily Melioideae.
Plant material was either collected on a collecting trip in Gabon, or sampled from the herbarium collections of both the Wageningen (WAG) and Leiden (L) branches of the Nationaal Herbarium Nederland, and from the Herbarium of the Royal Botanic Gardens, Kew (K) in London. Additionally, samples from the DNA bank at Kew were obtained and for ITS many previously published sequences were used (Muellner et al., 2005, Muellner et al., 2008a, Wright et al., 2006) and a number of unpublished ITS sequences of Guarea were kindly provided by Jim Clarkson (Jodrell Laboratory at Kew). Vouchers of new sequences have been deposited in WAG, L, K, FHO, MO, NY, B or BRUN, often with duplicates in other herbaria. A complete list of vouchers is included in Appendix I.
2.2 DNA extractionMaterial collected in the field was dried and stored in silica gel prior to DNA
extraction (Chase & Hills, 1991). Total genomic DNA was extracted using either a modified cetyl trimethyl ammonium bromide (CTAB) method (Doyle and Doyle, 1987) or a modified protocol for the DNeasy Plant Mini Kit (QIAGEN, Leusden, Netherlands), the latter was used to obtain better purified DNA from heavily degraded herbarium material. For the CTAB method, isopropanol precipitation for herbarium samples was usually carried out overnight, instead of the standard 30 minutes precipitation, to compensate for a higher degree of degradation of DNA in the material.
2.3 AmplificationPolymerase chain reaction (PCR) amplification was carried out in a PTC-200 Thermo
Cycler ( MJ Research). For the fragment including internal transcribed spacers 1 and 2, the 5.8S rRNA gene and parts of the flanking 18S and 26S rRNA genes, primers F1-ITS and R1-ITS (Muellner et al., 2005) and ITS-4 (White et al., 1990) were used. In a few cases, amplification was carried out in two pieces, with internal primers ITS-C and ITS-E (Blattner, 1999). A 50 μl reaction mix included 5 μl of 10x PCR buffer, 2 μl dNTP’s, 5 μl bovine serum albumine (BSA), 1.75 μl of both the forward and reverse primers, 0.4 μl of Taq-polymerase, 1 to 5 μl of template DNA (approximately 30-120 ng) and a certain volume of MQ water to arrive at a total of 50 μl. The addition of BSA increased the amount of amplification product in most cases, while some reactions (probably due to low quality of template DNA) did not yield any product without adding BSA. After an initial denaturing step of 3 minutes at 95°C, 36 cycles were performed with a 1 min.
11

denaturing step at 94°C, 1 min. annealing at 58-69°C (dependent on primer combination) and 1 min. extension at 72°C, followed by a final extension step of 7 minutes at 72°C. The sequences that were provided by the Royal Botanic Gardens, Kew, were amplified in two pieces, with two Meliaceae specific primers that were developed by Alexandra Muellner (unpublished), ITS-2 (Mel) (5’-GCT ACG TTC TTC ATC GAT GC-3’) and ITS-5 (Mel) (5’-GGA AGG AGA AGT CGT AAC AAG G-3’) for the amplification of ITS1 and primers ITS-3, ITS-4 (White et al., 1990) for amplification of ITS2, annealing temperature was set to 52°C.
For ycf1, primers were designed based on previously published sequences of Citrus sinensis (L.) Osbeck (Bausher et al., 2006) and a number of taxa from the related angiosperm orders Malvales, Brassicales and Myrtales. For amplification I used primers ycf1-F33 (5’- CCC TTA CCA TAC TGA AAC GAC – 3’) and ycf1-R1999 (5’- TCA CAA GCA TAT GTA TTT TAC -3’), with additional internal primers ycf1-intF964 (5’-GCA TTC CAA AGT AGC ACA AAT TC-3’) and ycf1-intR996 (5’- ATA TCA AAC GAG GAG CTT TGG -3’) for a number of accessions (see Fig. 3). Reaction mixtures were the same as for ITS. The following PCR program was used: an initial denaturing step of 2 minutes at 94°C, 36 cycles a 1 min. denaturing step at 94°C, 1 min. annealing at 55-59°C (dependent on primer combination) and 2 min. extension at 72°C, followed by a final extension step of 7 minutes at 72°C.
Figure 3. Position of ycf1 in the Citrus sinensis chloroplast genome. Arrows indicate the primers that were developed for this study.
Amplification proved to be difficult for a number of DNA samples that were extracted from (older) herbarium material and those from the DNA bank at Kew, due to fragmentation. As amplification of short fragments (~400 bp for ITS1 and 2) is not preferred, because of cost-inefficiency, I explored two alternative strategies. Blattner (1999) describes a method for direct amplification of the whole ITS region including the 5.8S rRNA gene, using trace amounts of internal primers. In the first number of PCR cycles, the region is amplified in two overlapping parts. In later cycles, these are extended to the full product when the internal primers are exhausted, the overlapping parts then serve as priming regions for the Taq-polymerase. That method did not work very well, as multiple bands were visible when PCR products were loaded on a gel. The other method used was the Overlap-Extension-PCR, for which the protocol published by Heckman & Pease (2007) was used, but omitting the cloning steps. Also for this method, multiple bands were visible on a gel. It can be expected that both methods will work well when using a cloning step, but this was not attempted due to time limitations. And, with such complex amplification methods, one wonders whether sequencing ITS1 and 2 separately is not a better option after all. In the end, I have managed to obtain some sequences from degraded herbarium material by using the DNeasy Plant Mini Kit (QIAGEN) for DNA extraction and in a few cases by using internal primers to sequence the markers in two parts. Further optimization of DNA extraction protocols for herbarium material will probably provide more opportunities to sample from herbarium sheets in the future (Martijn Staats, pers.comm.).
12

2.4 SequencingAmplification products were cleaned up using the MinElute PCR purification kit (QIAGEN), following the manufacturers' protocols. Cycle sequencing reactions were performed in the PTC-200 Thermo Cycler (MJ Research), with the use of the BigDye Terminator Cycle sequencing kit, following the manufacturers' protocols. The same primers were used as for the amplification, with the exception that for the large ycf1 fragments (when internal primers were not used in amplification) the internal primer ycf1-intR1320 (5’- GCC AAT ATG GAA GCC TGG GTT G -3’) was used as well (see Fig. 3). The products of the cycle sequencing reaction were processed in an ABI3100 capillary sequencer at the Greenomics sequencing facility. Assembly of the tracers and sequence editing were done using the Staden package (Staden et al., 1996).
2.5 AlignmentAlignment of ITS was done with MAFFT version 6.818 (Katoh & Toh, 2008a), using
the G-INS-i or the X-INS-i option, believed to be some of the most accurate methods currently available for the alignment of structural ncRNAs (Katoh & Toh, 2008b). A consensus secondary structure was predicted with RNAalifold (Bernhart et al., 2008; see Fig. 4) and was compared with secondary structures of ITS as published by Muellner et al. (2008b) for Aglaia elaeagnoidea (A.Juss.) Benth. and Lansium domesticum. The consensus structure was later also used for analyses with PHASE (Gowri-Shankar & Rattray, 2007), which takes secondary structure into account (see also under ‘§ 3.6 Phylogenetic analyses’). I have searched for the conserved Angiosperm sequence motif GGCRY-(4 to 7n)-GYGYCAAGGAA in ITS1 and the GAATTGCAGAATTC motif in the 5.8S gene to check for possible paralogous sequences or pseudogenes (Feliner & Rosselló, 2007). The alignment was (substantially) edited by eye using Mesquite version 2.74 (Maddison & Maddison, 2010), because, especially for less closely related taxa, it seemed that on many positions in the alignment homology of nucleotide characters was wrongfully assumed. PRANK (Loytynoja & Goldman, 2005) was also used in an attempt to align ITS, but the alignment that was produced was thought to be inferior to the MAFFT alignment as was assessed by eye. A consensus secondary structure was estimated from that alignment as well, and it was not consistent with secondary structures as have been published for ITS. Phylogenetic analyses of the PRANK alignment did not yield different well-supported clades and support values were generally lower, therefore the MAFFT alignment was preferred. (see also § 4.1.1, 'Alignment of ITS').
2.6 Bayesian inferenceFor the phylogenetic analyses, a couple of different software packages were used,
all based on Bayesian inference (i.e. MrBayes, PHASE and BEAST). Datasets of both ITS and ycf1 were run separately as well as in a combined matrix (concatenation) in the parallel (MPI) version of MrBayes v3.2 (Ronquist & Huelsenbeck, 2003; Altekar et al., 2004). I have used Modeltest v3.7 (Posada & Crandall. 1998) to select the appropriate model of nucleotide substitution. For both markers, HKY85 and GTR models received similarly high likelihoods. The GTR+I+G model was selected because it is the most complete model. A number of indel characters were coded for both markers and analysed under the binary model. ITS was analysed with separate partitions for ITS1 and ITS2, for both markers a separate partition was made for the indel characters. In concatenated analyses, both markers and the indel characters were partitioned separately (5 partitions in total: ITS1, ITS2, indels for ITS, ycf1, indels for ycf1). Always, two independent runs were undertaken and the number of generations was usually set to 30 million, with 25% burn-in. Tracer v1.5 was used to analyse the parameter output files and to check for convergence. To further investigate conflict between the two markers, the output files of separate runs were also used to construct consensus networks using SplitsTree 4 (Huson & Bryant, 2006).
13

Figure 4. Predicted consensus secondary structures of the ITS-alignment. a). ITS1 aligned with MAFFT-X-INS-i b). idem for ITS2. c). ITS1 aligned with PRANK. d). idem for ITS2.
Alignment of ycf1 was done by eye using Mesquite. An inversion of 5 bp that seemed to be randomly distributed among unrelated taxa in the matrix was excluded from the analyses.
PHASE (Gowri-Shankar & Rattray, 2007) was used for analyses of ITS with doublet substitution models. In this way, secondary structure information can be taken into account into the model of evolution, by estimating doublet base changes for the stem regions instead of individual nucleotide base changes. Doublet models are also available in MrBayes, but the data then has to be partitioned into separate stem and loop regions. In PHASE, a consensus secondary structure in dot-bracket notation can be provided to the program, which is far more convenient. The data was partitioned in four partitions, the stem and loop regions of both ITS1 and ITS2. The stem regions were analysed under the RNA7D doublet model, while loop regions were analysed under the HKY85 model. The MCMC method of PHASE is slower than that of MrBayes and parallelisation is not available for PHASE. Therefore, the number of generations was set to only 5 million, with 1.5 million as burn-in. Two independent runs were undertaken to check for convergence and the two resulting majority-rule consensus trees were exactly identical in topology and clade posterior probabilities. PHASE produces a consensus tree file with two trees. The first tree is with estimated branch lengths, but PHASE does not write posterior probabilities to that tree. It only writes the posterior probabilities to a cladogram that is included in the same tree file. The two trees were combined by manually editing the tree file, so that probabilities were available in the tree with branch lengths.
14

The most extensively used software package was BEAST v1.5.4 and v1.6 (Drummond & Rambaut, 2007). The program has quite some advantages over others. Preparing the input files for MrBayes and PHASE involves a lot of drudgery manual editing with text editors, but preparing input files for BEAST is very convenient due to the program BEAUti that is included in the package. Another great advantage is the faster likelihood search method, greatly decreasing the time needed for a run to reach convergence. With the included program LogCombiner, log files and tree files from multiple independent runs can easily be combined and in this way effective sampling sizes (ESSs) can be increased. And an important feature of BEAST is that it can implement different molecular clock models, which allows for estimation of divergence dates and absolute evolutionary rates when fossil and/or secondary calibration points are used. The use of a relaxed molecular clock model was also suggested to improve phylogeny estimation (Drummond et al., 2006), but this has recently been refuted (Wertheim et al., 2010). I have implemented both the uncorrelated lognormal relaxed clock model (Drummond et al., 2006) and the random local clock model (Drummond & Suchard, 2010) in analyses of the ITS dataset. For a discussion on the calibration points used, see the next section (§ 2.7 ‘Calibration points’). The substitution model used was the GTR+I+G model, for the same reasons as for the MrBayes analyses. The ITS-dataset was analysed without partitions and with separate partitions for ITS1 and 2. The rDNA characters were excluded. The ycf1 dataset was run under the exponential relaxed clock model, with the HKY+G substitution model.
Prior setting is known to influence Bayesian phylogenetic inference (Zwickl & Holder, 2004; Yang & Rannala, 2005), so it is important to set appropriate priors. In BEAUti, priors can be set quite conveniently. For the tree prior, the Yule model was selected, which estimates only a birth- and not a death-rate. The prior for the ulcd.mean or clock.rate (mean rate of evolution), was set to a lognormal distribution with a mean of 2.15E-3 and standard deviation 1.25. This prior setting is an approximation of the distribution of rates in ITS that was found for woody angiosperm clades (Kay et al., 2006). Runs without data to sample from the prior were undertaken to inspect the behavior of the priors and to set prior distributions for a number of parameters (i.e. yule.birthRate, covariance and coefficientOfVariation). For the relaxed clock model, two independent runs of 30 million generations each were undertaken. Tracer v1.5 was used to confirm that the runs had reached convergence, the runs yielded very similar results and the ESSs were all above 100. For the random local clock model, 4 independent runs of 30 million generations each were used to be able to reach convergence. For both analyses, the independent runs were combined with LogCombiner with resampling at lower frequencies so that the tree files were not too large to be analysed in TreeAnnotator. The first 25% of the trees were discarded as burn-in under both clock models. Annotated maximum clade credibility (MCC) trees were produced with TreeAnnotator from the tree samples of chronograms (the “.(time).trees”-files) produced by BEAST. Majority-rule consensus trees were produced with the program Sumtrees from the DendroPy package (Sukumaran & Holder, 2010), from the tree samples with branch lengths in substitutions (the “.(subst).trees”-files). For the posterior mapping (see § 2.8 Posterior mapping'), tree files from the analyses under both clock models were combined and the MCC produced, to get the best possible average over the two different analyses. All majority-rule consensus trees and MCC trees were visualised with FigTree v1.3.1 (http://tree.bio.ed.ac.uk/software/figtree/).
2.7 Calibration pointsFor the dating analyses, a combination of fossil and secondary calibration points
was used: 1) The root of the tree was constrained with a normal prior with the 95% confidence interval between 76 Mya (maximum crown age of Sapindales as estimated by Wang et al., 2008) and 48.6 Mya (the oldest fossil findings of Meliaceae, Muellner et al., 2006). In this way a so-called “soft” maximum bound was set on the root height. 2)
15

The stem age of Cedreleae was constrained with a lognormal prior (mean 2.29 (in real space), standard deviation 1.0) at 48.6 Mya, based on a fossil fruit from the London Clay (Early Eocene) that is intermediate between Cedrela and Toona (Muellner et al., 2010). 3) The crown age of Guarea was constrained with a lognormal prior (mean 3.46 (in real space), standard deviation 1.0) at 23.03 Mya based on fossil pollen from the Oligocene San Sebastian Formation in northern Puerto Rico (Muellner et al., 2006). 4) The crown age of Melieae was constrained with a lognormal prior (mean 4.29 (in real space), standard deviation 1.0) at 20.43 Mya based on fossil pollen from the Lower Miocene from western Poland (Muellner et al., 2006 ).
2.8 Ancestral area reconstruction and character mappingMesquite (Maddison & Maddison, 2010) was used to perform posterior mapping
analyses. Ancestral areas were mapped on an MCC tree from combined relaxed and random local clock analyses of ITS in BEAST, with unordered parsimony reconstruction. Each taxon was assigned to one of the following areas: South America, Central America, Upper Guinea, Lower Guinea + Congolia, Tropical Africa (Guineo-Congolian forest regions), East Africa, Southern Africa, Madagascar, Indian Subcontinent, Malesia, Australia, Pacific Islands.
To investigate the origins of intermittent leaf growth in Guarea and Chisocheton, leaf morphology was scored for all taxa as one of the following: simple, paripinnate, paripinnate with terminal bud, imparipinnate with a terminal leaflet, imparipinnate with alternate leaflets, bipinnate with a terminal leaflet. This was mapped on the same tree as for the ancestral area analysis using maximum likelihood mapping.
16

3. Results
In total, 36 sequences of ITS and 36 of ycf1 were produced in the lab at Wageningen University and 40 ITS sequences from Kew have been used (see also Appx I). One of the reverse primers that was used for ITS (R1-ITS) did not lead to full ITS2 sequences, so the ITS sequences that I produced were generally shorter than those from GenBank or Kew (by c. 50-100 bp). Sequence length for ITS typically ranges from 640 to 690 bp, but the longest is 803 bp and the shortest (due to bad sequence reads) is 354 bp. Sequences from Kew range from 355 to 785 bp. Although primers were designed on a 1966 bp portion of Citrus ycf1, the sequences of Meliaceae ycf1 vary from 1551 to only 1691 bp maximum length in the studied taxa. The sequences from amplification in two parts do not completely overlap and thus contain some missing data. All new sequences are unpublished as of yet.
3.1 MrBayes analysesThe alignment of ITS that was prepared for runs in MrBayes (including 5.8S rDNA
and parts of the flanking 18S and 26S rDNA genes), had a total length of 1043 bp and a total number of 105 Melioideae accessions. Melia azedarach was set as the outgroup, based on Muellner et al. (2008), where Melia and Azadirachta were shown as the most basal lineages of Melioideae (MrBayes allows only a single outgroup, so Melia was chosen). Gaps and ambiguous characters were excluded from the analysis as well as most of the rDNA characters (because of missing data and/or lack of informative characters in those regions), so the number of nucleotide characters used by MrBayes for the analysis was 414 bp. Indels were coded as binary characters (16 in total). For ycf1, total alignment length was 1807 bp for 36 taxa, of which 1547 bp were used for the analysis after exclusion of gaps and ambiguous characters. An additional number of 5 indel characters were coded as well. See also Table 1 for a summary of the different alignments.
Table 1. Statistics of the different alignments.
ITS (MrBayes)
ITS (SplitsTree)
ITS(BEAST)
ycf1(MrBayes)
ycf1(SplitsTree)
Number of taxa 105 34 119 36 34
Total aligned length (bp) 1043 1043 - 1807 1807
Length without ambiguous characters
414 414 506 1547 1547
Variable sites/invariable sites
348/66 283/131 416/90 284 168
Autapomorphies - 76 - - 118
PICs - 207 - - 50
Indels 16 16 - 5 5
A majority-rule consensus tree of an ITS analysis is shown in Figure 5. Concatenation of the sequences of ITS for 105 taxa with the 36 sequences of ycf1 (c. 52% missing data) yielded an almost identical tree (Fig. 1 in Appx II, see also § 4.1.2 'Gene trees vs. concatenation'). Analysis of ycf1 shows a number of clades that are different from the ITS runs and with high support, although the majority-rule consensus tree is poorly resolved (Fig. 6).
3.2 Consensus network reconstructionSome conflict between the two markers was observed. To investigate this, a so-
17

Figure 5. Majority rule consensus tree of a MrBayes analysis (30 million generations) of an ITS dataset of 105 accessions of Melioideae. Burn-in was set to 25%. Posterior probabilities are shown for each node.
18

Figure 6. Majority rule consensus tree of a MrBayes analysis (30 million generations) of an ycf1 dataset of 36 accessions of Melioideae. Burn-in was set to 25%. Posterior probabilities are shown for each node.
called “super network” was produced with SplitsTree from 5000 trees of an ITS-analysis and 5000 trees from an ycf1-analysis (Fig. 7). The super network function in SplitsTree allows for different taxa in the tree samples that are used as input files. The ITS-dataset contained 80 accessions of Guareeae, the ycf1-dataset contained a subset of 34 accessions. A consensus network with equal “edge” (=branch) weights, so without branch length information, was also produced (Fig. 2 in Appx II), where the ITS-analysis was performed with the same 34 accessions as the ycf1-analysis. To compare both markers, the number of autapomorphies and potentially parsimony- informative characters (PICs) were determined for these alignments (see Table 1). While ycf1 contains 168 variable sites, 118 (70%) of these are autapomorphies, so the number of PICs is far lower than the number of variable sites. ITS contains 76 autapomorphies, which amounts to 26% of the number of variable sites.
3.3 Analysis of ITS using doublet models in PHASEThe alignment of ITS1 and ITS2 that was prepared for PHASE was 532 bp long in
total, after removing gaps, with the same set of 105 taxa as for the MrBayes analyses (see also Table 1). The outgroup was set to both Melia azedarach and Azadirachta indica. The topology of the tree that was produced with PHASE (Fig. 8) is somewhat different than that of the MrBayes analysis of ITS. The figure also shows nodes with posterior probability lower than 50%, but some nodes that are not present in the majority-rule consensus tree of MrBayes are rather well-supported. Especially the more basal nodes differ considerably. Overall the tree seems to be slightly more resolved. These differences are further discussed in § 4.1 “Performance of the methods used”.
3.4 Implementation of molecular clocksFor the analyses with molecular clocks implemented, an ITS-dataset of 119
accessions (110 Melioideae accessions and an outgroup of 9 Swietenioideae
19

accessions) was compiled. After the exclusion of gaps and ambiguous characters, the alignment that was used in the BEAST analyses had a total length of 506 bp (see also Table 1). A majority-rule consensus tree of the lognormal relaxed clock analysis is shown in Figure 9. A chronogram (MCC-tree) with the branches coloured according to the estimated substitution rate per site per million years is shown in Figure 3 of Appendix II. A chronogram that shows the 95% confidence intervals for the age estimates is shown in Figure 4 of Appendix II. Figure 10 shows a majority-rule consensus tree of the random local clock analysis. Notably, due to the clock model, the branch lengths are scaled to the rates and are therefore not very heterogeneous.
Figure 7. Supernetwork of separate MrBayes-analyses of ITS and ycf1 (5000 trees each), with 80 and 34 taxa respectively.
20

Figure 8. Extended majority rule consensus tree of the PHASE analysis of ITS (5 million generations of which 1.5 are burn-in). The 105 taxa used are the same as in the MrBayes analysis (Fig. 4). Posterior probabilities are shown for each node.
21

Figure 9. Majority rule consensus tree of the uncorrelated lognormal relaxed clock analysis in BEAST (2 independent runs of 30 million generations each) of an ITS dataset of 119 accessions of Meliaceae. The first 5 million generations of each run were discarded as burn-in. Posterior probabilities are shown for each node.
22

Figure 10. Majority rule consensus tree of the random local clock (RLC) analysis in BEAST (4 independent runs of 30 million generations each) on the same ITS dataset of 119 accessions in as the relaxed clock analysis (Fig. 9). The first 5 million generations of each run were discarded as burn-in. Posterior probabilities are shown for each node.
23

Similar chronograms to the ones of the relaxed clock analysis can be found in Figures 5 and 6 of Appendix II. The exponential relaxed clock analysis that was performed on the ycf1-dataset yielded a poorly resolved tree (not shown). A possible drawback of BEAST is that indel characters cannot be used, because they cannot be modelled under a molecular clock. The lack of the informative indels might have been a problem in the ycf1 analysis. Another problem in this analyses was perhaps the clock model, this might have led to over-parameterisation. The estimated mean rates of evolution from the different analyses are summarized in Table 2. For a summary of the age estimates found, see § 3.5 'Estimated divergence dates'.
Table 2. Mean rate of evolution of each partition per site per million years.
ITS1 ITS2 ITS-total ycf1
Relaxed clock 3,60E-03 2,70E-03 3,18E-03 2,49E-04
Random local clock 3,57E-03 2,77E-03 3,17E-03 -
The ITS-dataset was analysed both with two partitions and unpartitioned. Partitioning strategies are often compared by calculating Bayes factors (Nylander et al., 2004; Brown & Lemmon, 2007). Usually, the marginal likelihoods that are used to calculate Bayes factors are estimated following the harmonic mean method (Newton & Raftery, 1994), which is also featured in Tracer. For the ITS dataset, runs with two partitions were favoured over unpartitioned runs, with Bayes factors 18.184 and 7.341 for the relaxed clock and random local clock models, respectively. However, calculating Bayes factors through harmonic mean estimation has been shown to be inaccurate and Bayes factors that are calculated in this way will often erroneously favour more complex models and partitioning strategies (Lartillot & Philippe, 2006; Fan et al., 2010). A more complex partitioning strategy can lead to more diffuse posterior distributions, and this is also observed when comparing the posterior of partitioned and unpartitioned runs of ITS. In fact, ITS1 and ITS2 are very similar in their biological and evolutionary properties. The likelihoods of the different runs are nearly the same, as are the estimates for most (but not all) of the parameters for the separate partitions in partitioned runs. In the end, the unpartitioned strategy was preferred and used for most of the runs.
The strict clock model is rejected for the ITS dataset. The ulcd.stdev estimate in the relaxed clock analysis was 0.4, with the posterior distribution not close to 0 (Fig. 11a), indicating some rate heterogeneity. In the random local clock analysis, the posterior distribution of rate changes had the highest density around 5 or 6 (Fig. 11b). So an approximate number of 6 or 7 different rates across the tree is favoured over one rate for the whole tree, thereby rejecting a strict clock.
Figure 11. Posterior probability distribution of the ucld.stdev (a) and rateChangeCount (b) parameters of the uncorrelated lognormal relaxed clock and random local clock analyses of ITS.
3.5 Estimated divergence datesThe age estimates from both clock analyses can be read from Figures 4 and 6 in
Appendix II, for all nodes with posterior probability >0.5. An overview of the estimated node ages for the most important clades is given in Table 3. The first column shows
24

the node ages as estimated under a relaxed clock model and the second under a random local clock model. 95% confidence intervals are given in between brackets. The ages for some of the nodes are not available for one of the two analyses (indicated as “n/a”), due to that clade not being monophyletic or with support less than 0,5 posterior probability in that analysis. The third column shows the age estimates as published by Muellner et al. (2006, 2008b and 2010), when available. The age estimates of the two analyses under the different clock models are overall very similar, though the random local clock estimates have smaller 95% confidence intervals smaller. The estimates as published by Muellner et al. are mostly strikingly different. The estimates of Muellner et al. (2006) as given in the table represent an average of 4 different non-parametric rate smoothing (NPRS) runs (hence the ±-sign) and a penalized likelihood analysis, respectively. The estimates of Muellner et al. (2008b) are from a Bayesian analysis using the program multidivtime (Thorne & Kishino, 2002). The estimates of Muellner et al. (2010) are from a BEAST analysis and from a multidivtime analysis, respectively.
Table 3. Age estimates (mean age) of crown groups of some important clades and divergence events from the relaxed clock and random local clock analyses of ITS, with the 95% confidence interval in between brackets, and from the publications of Muellner et al., with the year of publication in between brackets.
Relaxed clock Random local clock
Muellner et al.
1. Meliaceae 67,38 (58,59–76,28)
67,97 (60,41–75,67)
±81,75 / 103,70
(2006)
2. Swietenioideae 58,96 (50,62–68,05)
60,22 (52,14–68,45)
±72,23 / 81,16
(2006)
3. Cedreleae 17,87 (7,54–29,64)
17,81 (11,68–24,48)
48,4 / 54,8 (2010)
4. Melioideae 63,16 (52,73–73,12)
64,08 (55,18–72,38)
±75,43 / 90,84 or 76
(2006)(2008b)
5. “core” Melioideae
54,17 (45,15–63,62)
54,13 (46,38–61,74)
n/a
6. African-American divergence Trichilia
33,68 (26,21–41,53)
n/a n/a
7. “core” Guareeae and Aglaieae
n/a 41,69 (35,32–48,08)
n/a
8. Aglaieae 29,97 (23,56–36,4)
29,18 (24,04–34,94)
36 (2008b)
9. Heckeldora 16,72 (10,82–23,29)
15,96 (11,83–20,65)
n/a
10. Leplaea n/a 30,94 (21,68–39,62)
n/a
11. Turraeanthus 8,46 (2,95–15,15)
8,3 (3,8–13,37) n/a
12. African-American divergence Guareeae
30,44 (25,33–36,21)
31,19 (26,22–36,6)
n/a
13. Ruagea 8,94 (4,08–14,31)
8,72 (5,43–12,34)
n/a
25
14. Guarea 25,07 (23,14–28,29)
26,02 (23,18–29,96)
n/a
15. “core” Guarea 9,17 (6,08–12,38)
7,85 (5,83–10,04)
n/a
(n/a = not available)
3.6 Ancestral area reconstruction and character optimisationFigure 12 shows the MCC of the combined analyses with colour-coded branches for
the ancestral area reconstruction as was generated with Mesquite using maximum parsimony. Furthermore, the geological time-scale is indicated, as well as some geological events that are relevant for divergences within the Melioideae. Figure 13 shows the same MCC, but with the branches colour-coded according to leaf morphology.
The MCC tree was used for posterior mapping because it is best to use a fully resolved tree. When using a majority-rule consensus tree, the parsimony algorithm handles it in such a way that weird and clearly wrong patterns can be seen in the case of polytomies. The problem of using a tree where part of the nodes have weak or no support could be overcome by using statistical methods. This is possible for ancestral area reconstruction, by using a sample of trees from an MCMC run to do the mapping (Nylander et al., 2008; Yu et al., 2010). To explore this option was, however, not possible within this project due to time limitations. Careful interpretation of these results is therefore needed.
26

Figure 12. Chronogram with colour-coded branches from the ancestral area reconstruction in Mesquite. The geological time scale is indicated on the x-axis, with ages in millions of years ago (Mya). Blue bars indicate 95% confidence intervals of age estimates. Numbers on nodes correspond to the age estimates as summarized in Table 3.
27

Figure 13. MCC-tree with colour-coded branches of the Maximum Likelihood character optimization of different leaf types.
28

4. Discussion
This study was in part carried out to test the hypothesised classification and the suspected inter- and infrageneric relationships of African Guareeae. Indeterminate leaf growth in Guarea and Chisocheton was hypothesised to have a single origin. Different hypotheses for the migration routes within Guareeae where formulated, where migration via the now temperate regions in the Northern Hemisphere during past warmer periods is thought to be more likely than long-distance dispersal. Different methods were used in order to test these hypotheses. The performance of these methods will be discussed first. The use of more markers would be highly desirable for obtaining more robust results and better resolved phylogenies. The results nonetheless lead to quite some interesting insights in the origin and evolution of Melioideae, and Guareeae in particular, as will be discussed in the second part of this chapter.
4.1 Performance of methods usedI tried to make the most out of the (limited) data, by making careful use of different
methods, from sequence assembly and alignment to prior setting and model-based phylogeny estimation. There are now so many different phylogenetic methods and model-based method are getting ever more sophisticated. At some point it seems, however, that one can get lost in comparing different software packages, models and/or prior settings. That seems to be the case in this study as well, as is evident from the many different trees that are shown in Chapter 3. The different software packages used for Bayesian MCMC analyses are particularly different in user-friendliness and/or functionality. MrBayes and PHASE can both implement doublet models, which is lacking in BEAST. It seems that partitioning ITS in stem and loop regions and using a doublet model for the stem regions is the most biologically sensible partitioning strategy for ITS. On the other hand, unlike that of the rRNA subunits, the secondary structure of ITS is variable among taxa. So the different lengths of the stem and loop regions within the alignment are summarized as a “consensus structure”, which is then to be used in phylogenetic analyses. That should decrease the adequacy of the partitioning strategy, because the stem regions of some species will fall into the loop partition of other species and vice versa. Furthermore, this strategy largely depends on the accuracy of the secondary structure prediction (Álvarez & Wendel, 2003), which also depends on the quality of the alignment (See also § 4.1.1). In any case, the analyses with doublet models for the stem regions led to different results. Most interestingly is perhaps the high support for a monophyletic Guarea (Fig. 8; doublet models in PHASE), where the G. kunthiana-G. bullata-clade is placed in a polytomy with the rest of Guarea, Ruagea and Neoguarea in the MrBayes analysis of ITS (Fig. 5; GTR+I+G model). The latter changes when G. silvatica C.DC. is excluded, then a monophyletic Guarea receives similarly high support (0.96 pp) in a MrBayes analysis (not shown). G. silvatica is sitting on a long branch, which seems to cause the uncertainty around the crown node of Guarea. But, PHASE apparently seems to deal better with that, which could be attributed to the use of the doublet model to model compensatory base changes. In the PHASE analysis, Guareeae also mainly cluster in two large clades (Fig. 8) like in the network (Fig. 7) and BEAST analyses (Figs 9 and 10), but not in MrBayes (Fig.5). The PHASE tree further differs near the base, where it is less well-resolved than the MrBayes tree. Unfortunately, the PHASE output cannot be read with Tracer, which would make Bayes factor comparison between the PHASE and MrBayes runs easy to do. The results of those runs have now not been compared against each other in terms of model fit, but for some cases, the use of doublet models as was done here in PHASE seems advantageous when the results are compared with different analyses.
What BEAST lacks in substitution model choice, it makes up for with other functionality. The MCMC method is very efficient, as is prior setting with the possibility
29

to run empty datasets to sample from the prior. Other programs in the package as LogCombiner and TreeAnnotator are very useful and BEAUti is very user-friendly. And BEAST has the added functionality of using molecular clock models and the possibility to calibrate them with fossils and/or secondary calibration points. BEAST is also being actively developed and is arguably the leading phylogenetic software package at the moment of writing, though it is not made for all purposes. It also leads to some different results in tree topology under the different molecular clock models, as is discussed in § 4.1.4.
The differences that are found with different methods pose a new problem: which results should we choose as the most likely results? It is impossible to say which of the trees is closest to the 'true tree', we could only perhaps try to find out which models fit best to the data. Model comparison methods should be further developed and Bayes factors are potentially useful for this. The most-used method for calculating Bayes factors is through estimation of marginal likelihoods via the harmonic mean method. However, that suffers from irreproducibility and overestimation (Lartillot & Philippe, 2006; Fan et al., 2010). Better methods for Bayes factor calculation like thermodynamic integration (Lartillot & Philippe, 2006) or the stepping stone method (Fan et al., 2010) are not yet implemented in phylogenetic software packages. More 'data-power' would be a good solution to get around the problem. With larger data-sets like whole chloroplast genomes (Parks et al., 2009) and/or more informative, low-copy number nuclear markers (Mort & Crawford, 2004), one would expect more robust phylogenies and similar answers under most models. Unfortunately, sampling such markers was not possible within the scope of this project. Due to the limited sequence data, the differences in approaches did matter considerably, as is further elucidated in the subsections of this paragraph.
4.1.1 Alignment of ITSAlignment of matrices with high sequence divergence is often not straightforward.
This is also the case for ITS sequences, which usually have a high number of indels (Álvarez & Wendel, 2003). ITS RNA molecules have a secondary structure, which is usually more conserved than the sequences. In many studies, including those in Meliaceae, secondary structures of ITS are first predicted and then used as a guide for alignment (Muellner et al., 2005, 2008a, 2008b). This is thought to increase alignment accuracy. Usually, first a rough alignment is made using a program like ClustalX (Thompson et al., 1997) which is then further edited by eye while comparing the secondary structure prediction to the aligned sequences. Recently, more advanced alignment programs have been developed. One of these is PRANK (Loytynoja & Goldman, 2005), a “phylogenetically informed” alignment program, that has clear advantages over ClustalX and the likes. PRANK, however, does not allow to take secondary structure information into account. But, for the alignment of structural RNAs also several programs have been developed recently. MAFFT is one of them and it is thought to be among the most accurate methods that are available at the moment (Katoh & Toh, 2008). This method takes secondary structure into account by calculating base pairing probabilities over the alignment in iterative steps.
For the initial alignment of ITS in this study, both PRANK and MAFFT were used and the alignments compared, as described in § 2.5. As is evident from Figure 4, the consensus secondary structure prediction of the MAFFT alignment is far more realistic than that of PRANK, also when comparing it to published secondary structure predictions of Aglaieae ITS (Muellner et al., 2008b). While that does not prove that the MAFFT alignment is superior in terms of sequence homology, it does seem that PRANK severely sacrifices phylogenetic information by creating long gaps and underestimating homology. When using the MAFFT and PRANK outputs for phylogenetic analyses without further editing, the PRANK alignment yields a much less resolved tree (not shown). Because no conflicting clades where observed in the analyses of the PRANK alignment, the MAFFT alignment was preferred. The MAFFT
30
alignment did also not seem to be very accurate though, but the method seemed to be mainly problematic for less related taxa. It was therefore still heavily edited by eye to arrive at the alignment that was used for all the analyses. The use of ITS as a phylogenetic marker has been criticised recently for many different reasons (Álvarez & Wendel, 2003), and alignment issues are an obvious important problem for ITS phylogenies. Feliner & Rosselló (2007) have argued that ITS, because of its many advantages and through thoughtful use, can and will remain a much used and important nuclear marker for phylogenetic studies at low taxonomic levels. In studies in Meliaceae, it has proven to be the most valuable marker used so far. Also in this study, it proved to be a valuable marker, and following some of the guidelines that were proposed by Feliner & Rosselló (2007), no problems with paralogous sequences or pseudogenes were encountered. The most difficult issue was the alignment, but using the “structure aware”-program MAFFT, most regions were reasonably alignable.
4.1.2 Phylogenetic utility of ycf1 in MeliaceaeThe plastid marker that was used in this study, ycf1, has been shown to be highly
informative in Orchidaceae, Pinus and Annonaceae as compared to most traditionally used plastid markers (Neubig et al., 2009; Gernandt et al., 2009; Parks et al., 2009; Neubig & Abbott, 2010). In Meliaceae, it also seems to be relatively more informative than other plastid markers. No direct comparison between ycf1 and other plastid markers has been made in this study, but previous studies at higher taxonomic levels within the family that have used rbcL (Muellner et al., 2003, 2006, 2008a) or matK (Muellner et al., 2003) have resulted in poorly resolved estimates of phylogeny. At lower taxonomic levels, trnL-F, psbA-trnH (Fukuda et al., 2003), trnS-G and psbB-psbT-psbN (Muellner et al., 2009) also seem to be relatively invariable and not very useful for genus- or species-level phylogenetics. The use of such markers next to ITS, is advantageous though, because otherwise the estimate of phylogeny is only based on a single gene tree. Although it would be better to include another nuclear marker (single-copy or with low copy numbers), these markers have not yet been developed for Meliaceae and are more difficult to sequence from herbarium material (Cowan, 2006; Muellner et al., 2008b). Therefore, a chloroplast marker was also included in this study and ycf1 was chosen because of the aforementioned results in other plant groups.
As is apparent from Table 1, the alignment of ycf1 contains a remarkably high number of autapomorphies (70% of variable sites). Therefore, the number of potentially parsimony-informative characters (PICs) is relatively low. The combined plastid dataset of Muellner et al. (2009) is similar to the ycf1 alignment in this study: it is only slightly longer (1620 included characters against 1547) and contains a comparable number of similarly related taxa. It seems, however, that in determining the number of variable sites and PICs, the outgroups were included in that study. In that case, that alignment contains fewer variable sites than the ycf1 alignment (with outgroups included) in this study (190 against 284). Their alignment does include a large number of PICs (107 against 50 in this study). The number of PICs in this study was determined without outgroups, so those values do not seem to be directly comparable. The outgroups in the study of Muellner et al. (2009) would probably contribute a lot to the number of PICs, because they are two pairs of closely related taxa (Khaya and Swietenia; Melia and Azadirachta) that would probably share many synapomorphies. In that case, the proportion of PICs without outgroups might be lower in that study compared to the ycf1 alignment of this study. Nevertheless, when comparing the phylogenetic trees from both plastid datasets, they seem to be similarly poorly resolved. But, assessing the variability of ycf1 as compared to their dataset is also difficult because the group that was studied (Cedreleae) might differ considerably from Guareeae in the variability of the whole plastid genome. Fukuda et al. (2003) mention the mean pairwise sequence divergence for the regions that they used, which varies between 0,34 and 1,21%. Their phylogenetic trees are also poorly
31

resolved and ycf1 might be more informative than their markers. However, due to the large number of autapomorphies, ycf1 does not seem to be a much more useful plastid marker in Meliaceae, when compared to the aforementioned markers.
The alignments of both markers that were used for the runs to produce the trees for the consensus network allow for a direct comparison of ITS and ycf1, because exactly the same taxa were included in those datasets. The number of (in)variable sites, autapomorphies and PICs for both alignments are summarized in Table 1. As was to be expected, the ITS alignment has a far smaller proportion of invariable sites (15.9 against 90.3% in ycf1). Furthermore, the percentage of autapomorphies in the ITS alignment is far smaller than in the ycf1 alignment (26 against 70%), leaving about 4 times as many PICs while the alignment (without ambiguous characters) is almost 4 times as short. To be precise, exactly 50% of the ITS alignment consists of PICs, against 3,23% in ycf1. That said, further sampling of chloroplast markers in Meliaceae does not seem to be very sensible. Only whole chloroplast sequences would probably include enough informative characters to build a well-resolved phylogenetic tree to study infra- and intergeneric relationships. However, because recombination is absent in chloroplast genomes, an analysis with whole chloroplast sequences would in effect yield only a single gene tree. The development of nuclear markers other than ITS is highly desired for phylogenetic studies in Meliaceae, not only for species-level phylogenetics, but also to study generic relationships within the family.
4.1.3 Gene trees versus concatenationBecause ycf1 is so much less variable than ITS, a combined analysis of both
markers leads to largely the same results as analyses of ITS alone. Single gene trees are often different in topology than the species tree (Maddison, 1997), as can be inferred from unlinked loci (Edwards et al., 2007). The combined analysis in this study is a bad attempt at reconstructing the species tree, because it is still mostly an ITS gene tree. In any case, the concatenation approach is not a proper way of reconstructing a species tree, due to problems caused by horizontal gene transfer or interspecific gene flow, gene duplication and incomplete lineage sorting (Maddison, 1997; Edwards et al., 2007). The latter problem is addressed by some recent advances in Bayesian estimation of species trees from gene trees using the multi-species coalescent (Liu, 2008; Heled & Drummond, 2010). For these methods, multiple unlinked loci need to be sampled across multiple accessions per species, thus requiring a considerable sampling effort. Up until now, most studies of plant phylogeny have used only chloroplast markers and/or rDNA markers and ITS, while species tree methods should preferably be used on multiple nuclear markers. Multiple plastid markers cannot be used in the same way, because they are linked due to the almost complete absence of recombination in the maternally inherited chloroplast genomes. In principle, one plastid and one nuclear marker would be suited for species tree methods, although only two markers is not a lot (in fact, the minimum).
In this study, it was not possible to use these methods, as sampling multiple accessions per species was not possible due to limitations in time and budget. Moreover, it can be very difficult to obtain enough material to sample from when using tropical taxa, as that would require extensive field work or sampling from (often degraded) herbarium material. As mentioned before, concatenating both markers in a combined analysis is thought to be a bad approach. Multiple plastid markers can be concatenated because they are linked, but also because they are haploid genes, without multiple alleles. Different haplotypes can exist, which can also lead to discordance with the species tree due to lineage sorting (Jakob & Blattner, 2006), but among plastid markers these problems are mostly absent (so there should not be any conflict between plastid markers from the same accession). Heteroplasmy or haplotype polymorphism within populations or even individuals have been reported, and even homologous recombination seems to occur in plastid genomes (Wolfe &
32

Randle, 2004). However, these phenomena are probably very rare, but one should be aware of them. A nuclear marker, such as ITS, is considerably different from plastid markers. As was mentioned, the variability of ITS is many times higher than that of ycf1. This is caused by higher rates of evolution in the nuclear genome, caused both by a higher substitution rate (Wolfe et al., 1987), because nuclear markers are diploid and because ITS is thought to have relatively little selective pressure as it is a non-coding region in which only the secondary structure is more or less conserved (Álvarez & Wendel, 2003). That is why concatenation of these two markers or of any relatively invariable plastid marker and a highly variable nuclear marker is problematic. The problem of lineage sorting is one thing, but here the high variability of ITS almost completely obscures the little information in the ycf1 alignment. Each informative character is treated the same and thus contributes as much to the tree topology as all others. Therefore, in the case of conflict between the two markers, the topology that ycf1 would favour will not be found in the combined analysis, because ITS has a much stronger influence on the tree topology. That is because every character in ycf1 that would favour one clade can in that case be overruled by multiple characters in ITS that favour another clade.
That is thought to explain why in the combined analysis, Leplaea cauliflora E.J.M. Koenen & J.J. de Wilde and L. cedrata (A.Chev.) E.J.M. Koenen & J.J. de Wilde still form a clade with high support (Fig. 1 in Appx II), as in analyses of ITS alone (Figs 5, 9, 10, 11), while in the ycf1 tree, L. cedrata is shown with high support as the sister to L. mayombensis (Pellegr.) Staner (Fig. 6). If the two markers would be equal, the sister-relationship in the combined analysis, whichever it would be, should only be moderately supported or it would be unresolved. However, the results of this combined analysis are misleading in that a sister-relationship of L. cauliflora and L. cedrata seems to be favoured by a combination of both markers, while in fact it cannot be decided. Both hypotheses are still equally probable, because both markers should in fact be weighed equally, and not every nucleotide character over the whole alignment, as is the case with a concatenation approach. When employing species tree methods, the markers would be weighed equally. Also in network reconstruction methods as in SplitsTree, this is the case, and this is a better way of combining both markers. In both the super network (Fig. 7) and the consensus network (Fig. 8) of tree samples from both markers, a reticulate pattern is shown around the three species. This should be interpreted as conflict between both markers because of which the relationships between the three species are unclear. However, in the network analyses, the information of both markers is combined in a way that Leplaea is estimated as monophyletic. This is why it is relevant, also in this study, to question the use of concatenation approaches. The tree topology of the concatenated analysis namely does not resolve Leplaea as a monophyletic clade and thus renders the information of ycf1 on this part of the tree to be useless. Phylogenetic trees that are produced through a concatenated analysis should therefore not be seen as the best representation of the phylogeny based on all available data. It is better to compare different gene trees and construct networks, in case species tree methods fall outside the scope of the study.
4.1.4 Molecular clock modelsPreviously popular methods for producing dated phylogenies, such as non-
parametric rate smoothing (NPRS) and penalized likelihood (Sanderson et al., 2004; Rutschmann, 2006), have in recent years been more and more replaced by Bayesian methods. The first Bayesian methods, such as multidivtime (Thorne & Kishino, 2002), still required a fixed tree topology as input next to sequence data. A co-estimation of phylogeny and divergence times is possible in BEAST (Drummond & Rambaut, 2007), so that topological uncertainties can be taken into account. Three different clock models are available in BEAST: a strict clock, the uncorrelated lognormal or exponential relaxed clock (Drummond et al., 2006) and since recently also a random
33
local clock model (Drummond & Suchard, 2010). The strict clock does not take substitution rate heterogeneity across the tree into account. The relaxed and random local clock models deal with heterogeneity in a different way. The relaxed clock model estimates a rate for each branch of the tree, where rates change smoothly from one branch to the next. The random local clock model (from now: RLC model) assumes that related taxa will share a more or less similar substitution rate and it assigns local clocks to parts of the tree with similar rates, with multipliers on the nodes where rate changes occur (so no smooth changes). The idea of local clocks has previously been used by some studies (Yoder & Yang, 2000; Douzery et al., 2003), but the clocks were then assigned to parts of the tree manually. In the RLC model, assigning local clocks is statistically modelled, also taking uncertainty of changes from one local clock to another into account. In an MCMC run with the RLC model, trees with different configurations of local clocks will be sampled. In the MCC tree, the rates and divergence dates from the sampled trees will be averaged with the local clock configurations and rates that were sampled most often contributing most. A suggested advantage of the RLC model is that it can deal better with stochasticity of the data. In the relaxed clock approach, modelling a rate for each branch is sensitive to stochastic differences between taxa when relatively little sequence data is used. Because molecular evolution is a stochastic process, different numbers of substitutions on different branches can in part be produced by chance and not solely by different rates of evolution. The relaxed clock model assumes that changes occur smoothly and are widespread among the tree, but the different rates that will be estimated in a relaxed clock analysis will in part be caused by the model and are not necessarily data-driven (Drummond & Suchard, 2010). The notion that evolutionary rates are heritable and will persist for some time in related lineages might be biologically more adequate, although I believe that changes would occur more or less smoothly. So perhaps both models are not perfectly adequate, but both might be able to approximate the true rates and divergence dates pretty well.
When comparing the rates and age estimates that were produced by both methods, they are actually found to be highly similar (Tables 2 and 3). Generally, the RLC estimates have a smaller 95% confidence interval. The differences between the mean age estimates seem to be very small and hardly significant at this time-scale, especially for the deeper nodes. Surprisingly, however, there are some clear differences in phylogenetic inference under both clock models. The majority-rule consensus tree of the RLC analysis (Fig. 10) is more resolved than that of the relaxed clock analysis (Fig. 9). Many unresolved positions in the latter are actually resolved with moderate to even very high support in the RLC analysis, of which the inferred monophyly of Leplaea, with 0.85 posterior probability (pp), especially caught the eye because Leplaea is one of the focal genera of this study. A well-supported monophyletic Leplaea was not found in any of the other ITS analyses. In the ycf1 tree, Leplaea is monophyletic with 0.65 pp and also the super network, using both markers (and thus more data), shows Leplaea as monophyletic. That the RLC analysis finds the same clade with high support with ITS alone does suggest an advantage for phylogenetic inference of the clock model. This is also tempting to believe due to the overall more resolved tree with also higher posterior probabilities on many clades. Some examples are: 1) a sister-relationship between Melieae (Melia and Azadirachta) and Sandoriceae (Sandoricum) with 0.99 pp in the RLC analysis but unresolved under the relaxed clock; 2) 0.99 pp for Nymania as the sister to a clade of Turraea, Humbertioturraea, Naregamia and Caledocaryia, also unresolved under the relaxed clock; 3) placement of Synoum in the South-East Asian clade of Guareeae with relatively high support (0.83 pp for the whole clade), while under the relaxed clock it is placed deeper in the tree and those clades have much lower support. The first and third example are refuted by the MrBayes analysis of ITS with high support, although that could be a taxon sampling effect. The RLC seems to cluster lineages together when the same rate is assigned to these. It could be that long branch attraction
34
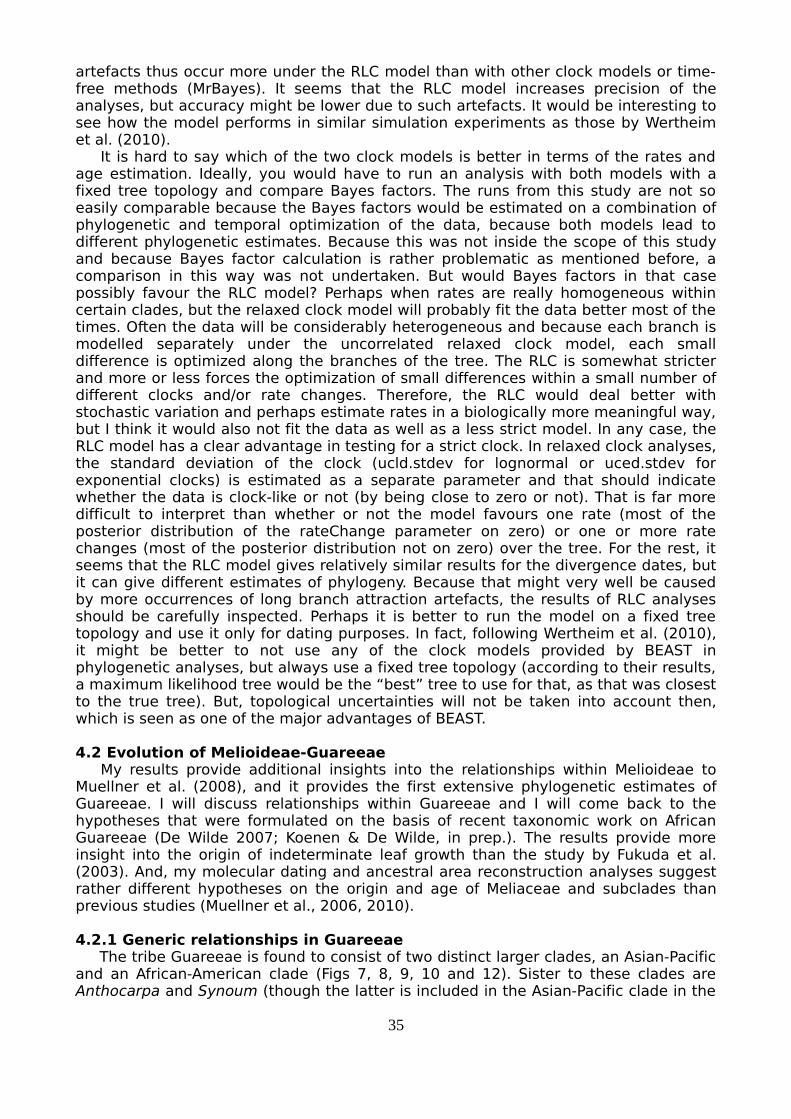
artefacts thus occur more under the RLC model than with other clock models or time-free methods (MrBayes). It seems that the RLC model increases precision of the analyses, but accuracy might be lower due to such artefacts. It would be interesting to see how the model performs in similar simulation experiments as those by Wertheim et al. (2010).
It is hard to say which of the two clock models is better in terms of the rates and age estimation. Ideally, you would have to run an analysis with both models with a fixed tree topology and compare Bayes factors. The runs from this study are not so easily comparable because the Bayes factors would be estimated on a combination of phylogenetic and temporal optimization of the data, because both models lead to different phylogenetic estimates. Because this was not inside the scope of this study and because Bayes factor calculation is rather problematic as mentioned before, a comparison in this way was not undertaken. But would Bayes factors in that case possibly favour the RLC model? Perhaps when rates are really homogeneous within certain clades, but the relaxed clock model will probably fit the data better most of the times. Often the data will be considerably heterogeneous and because each branch is modelled separately under the uncorrelated relaxed clock model, each small difference is optimized along the branches of the tree. The RLC is somewhat stricter and more or less forces the optimization of small differences within a small number of different clocks and/or rate changes. Therefore, the RLC would deal better with stochastic variation and perhaps estimate rates in a biologically more meaningful way, but I think it would also not fit the data as well as a less strict model. In any case, the RLC model has a clear advantage in testing for a strict clock. In relaxed clock analyses, the standard deviation of the clock (ucld.stdev for lognormal or uced.stdev for exponential clocks) is estimated as a separate parameter and that should indicate whether the data is clock-like or not (by being close to zero or not). That is far more difficult to interpret than whether or not the model favours one rate (most of the posterior distribution of the rateChange parameter on zero) or one or more rate changes (most of the posterior distribution not on zero) over the tree. For the rest, it seems that the RLC model gives relatively similar results for the divergence dates, but it can give different estimates of phylogeny. Because that might very well be caused by more occurrences of long branch attraction artefacts, the results of RLC analyses should be carefully inspected. Perhaps it is better to run the model on a fixed tree topology and use it only for dating purposes. In fact, following Wertheim et al. (2010), it might be better to not use any of the clock models provided by BEAST in phylogenetic analyses, but always use a fixed tree topology (according to their results, a maximum likelihood tree would be the “best” tree to use for that, as that was closest to the true tree). But, topological uncertainties will not be taken into account then, which is seen as one of the major advantages of BEAST.
4.2 Evolution of Melioideae-GuareeaeMy results provide additional insights into the relationships within Melioideae to
Muellner et al. (2008), and it provides the first extensive phylogenetic estimates of Guareeae. I will discuss relationships within Guareeae and I will come back to the hypotheses that were formulated on the basis of recent taxonomic work on African Guareeae (De Wilde 2007; Koenen & De Wilde, in prep.). The results provide more insight into the origin of indeterminate leaf growth than the study by Fukuda et al. (2003). And, my molecular dating and ancestral area reconstruction analyses suggest rather different hypotheses on the origin and age of Meliaceae and subclades than previous studies (Muellner et al., 2006, 2010).
4.2.1 Generic relationships in Guareeae The tribe Guareeae is found to consist of two distinct larger clades, an Asian-Pacific
and an African-American clade (Figs 7, 8, 9, 10 and 12). Sister to these clades are Anthocarpa and Synoum (though the latter is included in the Asian-Pacific clade in the
35
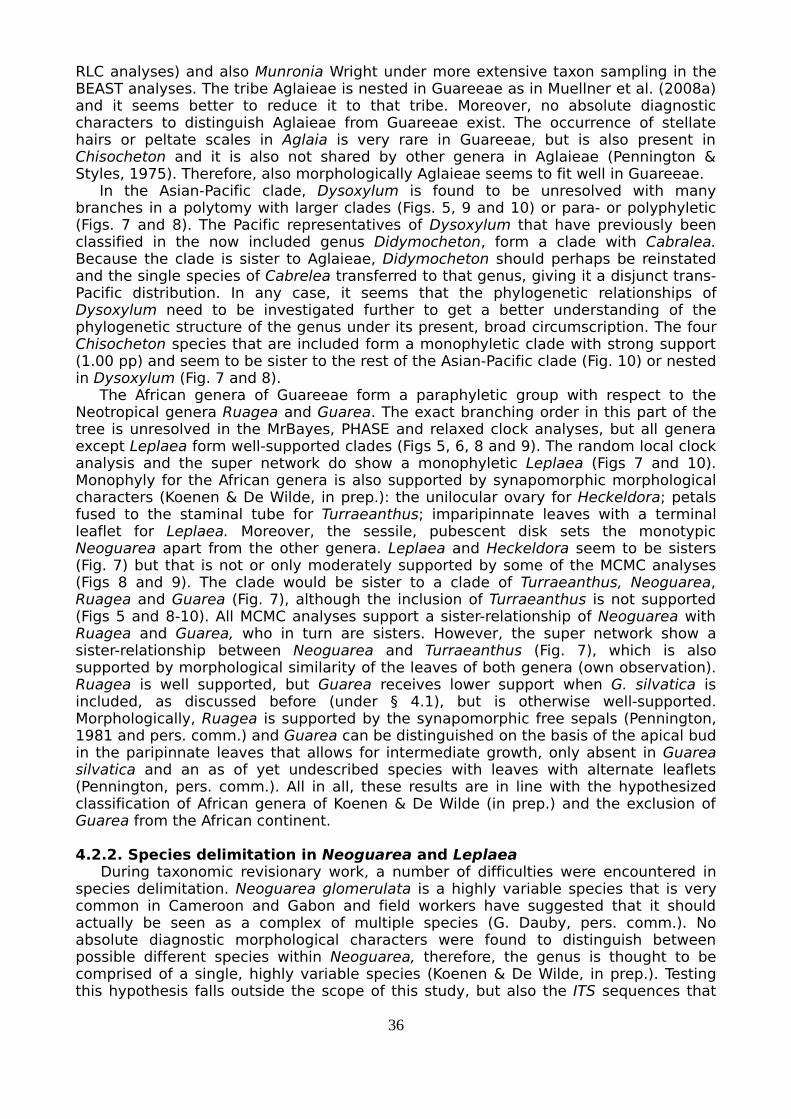
RLC analyses) and also Munronia Wright under more extensive taxon sampling in the BEAST analyses. The tribe Aglaieae is nested in Guareeae as in Muellner et al. (2008a) and it seems better to reduce it to that tribe. Moreover, no absolute diagnostic characters to distinguish Aglaieae from Guareeae exist. The occurrence of stellate hairs or peltate scales in Aglaia is very rare in Guareeae, but is also present in Chisocheton and it is also not shared by other genera in Aglaieae (Pennington & Styles, 1975). Therefore, also morphologically Aglaieae seems to fit well in Guareeae.
In the Asian-Pacific clade, Dysoxylum is found to be unresolved with many branches in a polytomy with larger clades (Figs. 5, 9 and 10) or para- or polyphyletic (Figs. 7 and 8). The Pacific representatives of Dysoxylum that have previously been classified in the now included genus Didymocheton, form a clade with Cabralea. Because the clade is sister to Aglaieae, Didymocheton should perhaps be reinstated and the single species of Cabrelea transferred to that genus, giving it a disjunct trans-Pacific distribution. In any case, it seems that the phylogenetic relationships of Dysoxylum need to be investigated further to get a better understanding of the phylogenetic structure of the genus under its present, broad circumscription. The four Chisocheton species that are included form a monophyletic clade with strong support (1.00 pp) and seem to be sister to the rest of the Asian-Pacific clade (Fig. 10) or nested in Dysoxylum (Fig. 7 and 8).
The African genera of Guareeae form a paraphyletic group with respect to the Neotropical genera Ruagea and Guarea. The exact branching order in this part of the tree is unresolved in the MrBayes, PHASE and relaxed clock analyses, but all genera except Leplaea form well-supported clades (Figs 5, 6, 8 and 9). The random local clock analysis and the super network do show a monophyletic Leplaea (Figs 7 and 10). Monophyly for the African genera is also supported by synapomorphic morphological characters (Koenen & De Wilde, in prep.): the unilocular ovary for Heckeldora; petals fused to the staminal tube for Turraeanthus; imparipinnate leaves with a terminal leaflet for Leplaea. Moreover, the sessile, pubescent disk sets the monotypic Neoguarea apart from the other genera. Leplaea and Heckeldora seem to be sisters (Fig. 7) but that is not or only moderately supported by some of the MCMC analyses (Figs 8 and 9). The clade would be sister to a clade of Turraeanthus, Neoguarea, Ruagea and Guarea (Fig. 7), although the inclusion of Turraeanthus is not supported (Figs 5 and 8-10). All MCMC analyses support a sister-relationship of Neoguarea with Ruagea and Guarea, who in turn are sisters. However, the super network show a sister-relationship between Neoguarea and Turraeanthus (Fig. 7), which is also supported by morphological similarity of the leaves of both genera (own observation). Ruagea is well supported, but Guarea receives lower support when G. silvatica is included, as discussed before (under § 4.1), but is otherwise well-supported. Morphologically, Ruagea is supported by the synapomorphic free sepals (Pennington, 1981 and pers. comm.) and Guarea can be distinguished on the basis of the apical bud in the paripinnate leaves that allows for intermediate growth, only absent in Guarea silvatica and an as of yet undescribed species with leaves with alternate leaflets (Pennington, pers. comm.). All in all, these results are in line with the hypothesized classification of African genera of Koenen & De Wilde (in prep.) and the exclusion of Guarea from the African continent.
4.2.2. Species delimitation in Neoguarea and Leplaea During taxonomic revisionary work, a number of difficulties were encountered in
species delimitation. Neoguarea glomerulata is a highly variable species that is very common in Cameroon and Gabon and field workers have suggested that it should actually be seen as a complex of multiple species (G. Dauby, pers. comm.). No absolute diagnostic morphological characters were found to distinguish between possible different species within Neoguarea, therefore, the genus is thought to be comprised of a single, highly variable species (Koenen & De Wilde, in prep.). Testing this hypothesis falls outside the scope of this study, but also the ITS sequences that
36

are included in this study contain quite a high number of differential characters (16 out of 582 characters, while sequences of recently diverged separate species can be identical). That implies that the species is highly variable in its genetic make-up as well, and whether or not separate entities would be involved, it seems to be a species that is well suited for population genetic studies and assessment of spatial genetic diversity of rainforest habitats (e.g. Dauby et al., 2010).
The most difficult taxonomic problem was the delimitation of L. thompsonii and seemingly closely related taxa. L. thompsonii is also seen as a highly variable tree species by field workers (C. Ewango, pers. comm.) and has two synonyms described from Gabonese material, with the type of L. thompsonii having been collected in Nigeria. The type specimens of the Gabonese material look strikingly different in flower morphology, which is presumably partly caused by the difference in sex of these individuals but also among other Central African collections of L. thompsonii the variability of flower morphology is high. But because intermediate forms can be found among herbarium material, no separate species have been recognized in Central Africa (Koenen & De Wilde, in prep.). Herbarium collections from the Upper Guinean forest region (sensu White, 1979) which have previously been identified as L. thompsonii, are thought to represent three species: L. mangenotiana (Aké Assi & Lorougnon) E.J.M. Koenen & J.J. De Wilde, L. adenopunctata, and L. thompsonii. The first of these is a narrow endemic shrub species, occurring in the very humid region around Cape Palmas. L. adenopunctata is a species that occurs in similar habitats as L. laurentii in Central Africa, so in the somewhat dryer evergreen and semi-deciduous forests. The remaining material belongs to a species that seems intermediate between these in ecology (relatively wet evergreen forests) and therefore similar to L. thompsonii in Central Africa, but differing from the typical L. thompsonii in its fruit morphology. The fruits of L. thompsonii are seemingly indehiscent and contain always only one mature seed per locule, while fruits of the Upper Guinean individuals are dehiscent and contain either one or two mature seeds. The boundary between the occurrence of both fruit types is actually poorly understood. As it also seems that there are no differences in flower and vegetative morphology (but the number of flowering collections from the region is low), it is still, quite unsatisfactorily, included in L. thompsonii.
To investigate this with molecular characters, multiple accessions of L. thompsonii were included: two from Gabon, two from Western Cameroon and two from the Upper Guinea region. Two accessions of L. adenopunctata were included as well, and a single accession of L. mangenotiana. From the results it is clear that L. adenopunctata clusters with one of the two Upper Guinean L. thompsonii accessions and usually with L. mangenotiana as well, with high support (see Figs 5-10). The other accession from Lower Guinea (voucher Jongkind 9059) only clusters with low support with the rest of the Lower Guinean accessions (Fig. 8 and BEAST analyses, not shown) and is otherwise shown as a part of the polytomy of Central African accessions and L. laurentii and L. mayombensis (Fig. 5).
Upon inspection of the ITS alignment, it becomes clear that these spacer regions are not variable enough to distinguish among different species of Leplaea. This is also evident from the large polytomy that contains, L. laurentii, L. mayombensis and Central African L. thompsonii (Figs 5 and 8), although these species are clearly differentiated in morphological and ecological features. However, the Upper Guinean clade seems supported by six synapomorphies in ITS, but five of these are ambiguous in the aforementioned L. thompsonii accession that is included with low support in only part of the analyses. That suggests that some gene flow between Lower Guinea and Upper Guinea populations might still be occurring or that both ITS-types/alleles persist in contemporary Upper Guinean populations. The data from this study is too limited to address this problem adequately and it should be investigated with multi-gene network reconstruction (Huson & Bryant, 2006) and coalescent methods (Edwards et al., 2007) to truly understand the levels of gene flow between these populations and
37

morphological entities. Meanwhile, there is a synapomorphic morphological character that supports the Upper Guinea clade, namely the development of two seeds per locule in the dehiscent fruits (one seed per locule and indehiscent fruits in Central Africa). One collection (fruits only, Kennedy s.n.) from Nigeria, the Western extreme of the Lower Guinea forest region also shows this character, however, leaving the boundary between these clades unclear. Could this be a hybrid zone? Should Upper Guinea individuals with glabrous, thick leathery leaves be attributed to L. adenopunctata, L. thompsonii or be recognized as a new species? Koenen & De Wilde (in prep.) conclude that more fertile collections from Upper Guinea as well as from Nigeria/Western Cameroon are necessary to satisfactorily answer the latter question. More molecular data and the use of multi-gene network reconstruction or multi-species coalescent methods would probably also give a valuable insight in this taxonomic problem. Given the fact that not many collections of these large tree species from these regions exist at all, that also requires more plant collections to sample from. These methods in fact also seem hardly applicable to tropical taxa, as of yet, due to the difficulties surrounding the sampling of enough individuals from throughout the species' ranges. In any case, this problem clearly shows the immense lack of knowledge on the biodiversity of the wet tropics, and that while tropical ecosystems are under ever increasing pressure.
4.2.3. Evolution of indeterminate leaf growthAs is evident from the results, Guarea and Chisocheton are not sister genera. The
apical leaf bud in representatives of these genera that allow for indeterminate, intermittent growth does therefore not have a single origin, but in fact evolved twice independently. This is remarkable because the feature is essentially the same in both genera. Two separate origins of the character are also shown by ML character optimization on the MCC tree of the BEAST analyses (Fig. 13). Unfortunately, the tree topology around the base of the core Guareeae/Aglaieae clade is weakly supported, so the ancestral character states of the nodes before the crown nodes of Guarea and Chisocheton cannot be confidently reconstructed. However, it is perhaps most likely that the ancestral state for both genera was an imparipinnate leaf with a terminal leaflet, as is reconstructed as the ancestral state of all of Guareeae and Aglaieae and that of Chisocheton (Fig. 13). The ancestral state of Guarea/Ruagea was not unambiguously reconstructed, but Ruagea is characterized by imparipinnate leaves, with a terminal leaflet or more rarely with alternate leaflets (Pennington, 1981). The first leaves of seedlings of Chisocheton are simple with subsequent leaves going through trifoliolate to imparipinnate with a terminal leaflet to paripinnate with an apical bud and the determinate leaves of juveniles seem to be homologous to leaves of Dysoxylum (Mabberley, 1979). Furthermore, intermittent though not intermediate growth is also reported in Dysoxylum (Mabberley et al., 1995). Perhaps this was also present in the mrca of both. In the case that the character indeed evolved separately from the same ancestral state, this can be seen as an example of parallel evolution. The character can be found as well in some ferns (e.g. Lygodium and Gleicheniaceae) but is not known in any other angiosperm (Mabberley, 1979), making the separate origin in Chisocheton and Guarea even more remarkable.
4.2.4. Origin and diversification of MelioideaeThe estimation of divergence dates and the ancestral area reconstruction together
allow for reconstruction of the whole geographical history of the Melioideae. Linking the geographical patterns that are observed in Figure 12 with the age estimates for each node (Table 3 and Appx II, Figs 4 and 6) leads to hypotheses of how exchange between different land masses can have occurred. Meliaceae are a pantropical family, but the age estimates found for the family (c. 67-68 Mya) easily out-date the breakup of Gondwana, so different vicariant hypotheses and/or long-distance dispersal hypotheses will have to be found.
38

The ancestral area reconstruction was done under the parsimony criterion. While this method is suitable, recent advancements in ancestral area reconstruction methods now also allow for statistical modelling of dispersal-vicariance analyses (S-DIVA, Yu et al., 2010) or implementation of a dispersal, local extinction and cladogenesis model (the DEC-model, Ree & Smith, 2008). It is recommended to use these methods in further analyses to check for congruence between the different methods and evaluate the robustness of the results with topological uncertainties taken into account in S-DIVA.
OriginFrom the ancestral area reconstruction (Fig. 13), it is clear that the most recent
common ancestor (mrca) of Melioideae, and probably also of Meliaceae, lived in either India or Madagascar. Those two areas actually formed a continuous landmass together until approximately 88 Mya (Storey et al., 1995), when the northward movement of India was initiated after a volcanic hotspot at the south of Indo-Madagascar came into being. India then broke off and rifted along the Eastern side of Madagascar and the Seychelles plateau, until it finally got separated from the Seychelles plateau around the Cretaceous-Tertiary boundary (KT-boundary) at 65 Mya (Plummer & Belle, 1995). Meliaceae seem to have originated before the KT-boundary, which is congruent with the most basal lineages of Melioideae all occurring predominantly in Madagascar and India. That does imply, however, that exchange of lineages between Madagascar and India has remained possible up until and for some time after the KT-boundary, over the Seychelles plateau. That is namely the period in which the origin and initial cladogenesis in Meliaceae must have occurred in these areas. A study in a clade of frogs (Van Bocxlaer, 2006), also suggests three separate vicariance events between Madagascar and India around the KT-boundary. And as amphibians are salt-intolerant and do not easily disperse across open sea, that age does suggest the last moment that a more or less contiguous land mass existed. A prolonged period of biotic exchange between India and Madagascar is also suggested by several authors (Krause et al., 1997; Biggs, 2003; Rage, 2003; Yoder & Nowak, 2006).
The finding that Meliaceae would have originated on the Indian-Malagasy continent is quite special: it suggests that the lineage leading to Meliaceae would have been present on that continent after vicariance of Gondwana and that it has subsequently reached Asia upon collision with India and dispersed from Madgascar to Africa. Especially the latter is of special interest, since the Malagasy flora (and fauna) is thought to have been shaped predominantly by dispersal (Yoder & Nowak, 2006) and that Gondwanan relicts are rare. Meliaceae would be the first example of a pantropical family to have originated on Madagascar with subsequent migration/dispersal to other continents instead of vice versa.
Muellner et al. (2006) suggests a similar hypothesis of dispersal/migration routes for Meliaceae, however, a different origin was hypothesized: Western Gondwana, in what is now Africa. The stem node of Meliaceae might be Gondwanan, as is also in line with fossil findings in Senegal from the Campanian/Maastrichtian boundary (70,6 Mya) that are “similar to living Meliaceae” (Muellner et al., 2006). However, the results of this study imply that the most recent common ancestor of Meliaceae did not live in Africa, but in Indo-Madagascar, and that the lineage leading to it, if Gondwanan, must have gone extinct in Africa.
Differences in age estimatesThe age estimates of Muellner et al. (2006, 2008b, 2010) differ considerably from
those in this study (see Table 3). Most strikingly is the different age estimate for Cedreleae compared to that of Muellner et al. (2010). The difference is easily explained through the different calibration of the clade in both studies. Cedreleae are suggested to have migrated from Europe to North America over the North Atlantic and subsequently to Asia across the Bering Sea (Toona) and to Central- and South-America
39

(Cedrela) (Muellner et al., 2006, 2010). Therefore, the fossils from the London Clay (early Eocene) that are intermediate to Cedrela and Toona (Muellner et al., 2010), should be placed on the branch leading to Cedreleae. For this reason, the stem node of Cedreleae was calibrated with a lognormal prior, so that its age would pre-date the age of the fossil. Muellner et al. (2010) calibrated the crown node of Cedreleae with a normal prior with the age of this fossil. In that case, the age of the fossil would be equal to the age of the divergence of Cedrela and Toona, which is clearly false. Remarkably, Muellner et al. (2008b) did use the same fossil calibration point for the stem node of Cedreleae to calibrate their Aglaieae phylogeny.
Muellner et al. (2006) have estimated the crown age of Meliaceae to be much older than the KT-boundary, at approximately 81.8 or even 103 Mya, with crown ages of both subfamilies also well older than 65 Mya (Table 3). These ages are not congruent with the estimated crown age of Sapindales (c. 60-76 Mya) as found by Wang et al. (2009). The difference in these crown age estimates could in part be attributed to the difference in date estimation methods, the aforementioned age estimates of Muellner et al. (2006) were estimated with non-parametric rate smoothing (NPRS) and penalized likelihood, respectively. However, most of the differences will be caused by a different calibration of the root. Muellner et al. either did not constrain the root of the tree (2006) or used the onset of Angiosperm radiation (c. 137 Mya) as the maximum age for the root (2008b). Apparently, their fossil calibration points have pushed back the root age considerably in their analyses. I have used the maximum estimate of Wang et al. (2009) for the crown age of Sapindales as a soft maximum bound in my analyses, which seems to be a more sensible maximum age of Meliaceae than the onset of Angiosperm radiation. Wikström et al. (2001) have also published age estimates for many nodes within the Angiosperm phylogeny, but their estimates for Sapindales (57 Mya) are younger than the estimates of Wang et al. and those for Meliaceae (c. 36-43) are much younger than those found by Muellner et al. and in this study. Their age estimate for Meliaceae is easily refuted by the fossil record, where fossils from the London Clay (early Eocene) have unambiguously been assigned to Meliaceae (Muellner et al., 2006, 2010). Therefore, the estimate of Wang et al. was preferred for constraining the root of the tree and it yielded estimates that are trodding the middle ground between those of Muellner et al. (2006 and 2008b) and those of Wikström et al. (2001). Whether the ages for the deeper nodes of the tree are correct or not thus also depends greatly on the use of the root constraint. However, based on the fossil record and the ancestral areas of the basal lineages in the tree, Meliaceae are not expected to be much younger than the KT-boundary. On the other hand, a much older age would imply a greatly incomplete fossil record for Meliaceae, as the oldest unambiguous fossils are from the Eocene (Muellner et al., 2006). However, the family might have been restricted to Indo-Madagascar for a long time after the break-up of Gondwana. In that case, fossil findings of the family from that period can only be found in India or on Madagascar, which might explain their absence in the fossil record. The age estimate for Sapindales of Wang et al. (2009) would have to be re-evaluated if further dating studies of Meliaceae or Sapindales would suggest an older age for Meliaceae then those found in this study.
Diversification of MelioideaeTribes Melieae and Sandoricea and a clade of Astrotrichilia, Lepidotrichilia,
Quivisianthe and Walsura form the most basal lineages of Melioideae. The branching order in this part of the phylogeny is unclear, with contrasting topologies in different analyses (Figs 5 and 8-10). This might be an effect of the long branches of these basal lineages. Melieae form a small clade/tribe, with two species in India and one in Malesia, and is sister to all other Melioideae (Muellner et al., 2008) or to Sandoriceae (this study, fig. 10, though undecided in relaxed clock analysis, fig 9). Sandoriceae are also a small tribe, with only one genus, Sandoricum, which occurs in India and Malesia. Astrotrichilia and Quivisianthe are endemic to Madagascar and Lepidotrichilia is a
40

primarily Malagasy genus with one species in East Africa. Walsura is Indo-Malayan and the estimated divergence date between Walsura and Quivisianthe ranges between 43-36 Mya, which suggests long-distance dispersal over the Indian ocean, perhaps through island “stepping-stones”. On the other hand, since taxon sampling is rather incomplete for these genera and both are sitting on quite long branches, the inferred relationship might be incorrect. In any case, all the aforementioned basal lineages are occurring predominantly in India and Madagascar (Fig. 12).
Most basal lineages of the clade of Trichilieae and Turraeeae are also occurring predominantly in India and on Madagascar. One lineage (Pseudoclauseana) in the clade migrated into Malesia from India, while multiple dispersal events from Madagascar to Africa occurred (Nymania, Turraea and Trichilia). Ekebergia seems to have reached Africa from India through an Arabian corridor because of the later timing and the genus is also present in North-East Africa. Turraeeae without Munronia form a clade that is nested within Trichilieae, as was found by Muellner et al. (2008c). Trichilia is sister to Turraeeae and the Madagascan endemic Malleastrum. Trichilia originated in Africa and migrated to the Americas at the start of the Oligocene (c. 33.7 Mya). Interestingly, the African endemic Pterorhachis is nested in Neotropical Trichilia, which is congruent with the occurrence of stellate hairs in both Pterorhachis and some species of Neotropical Trichilia. The age of divergence between Pterorhachis and its Neotropical sister species would indicate a dispersal event from the New World back to Europe/Africa.
“Core” Guareeae and Aglaieae (node 7 in Fig. 12) seem to have a Eurasian mrca that lived in the Eocene. An “out-of-Africa” scenario for both Asian and Neotropical lineages, as was hypothesised for this study, has to be rejected. But African lineages are older than the Neotropical lineage of Ruagea and Guarea, which does fit the “out-of-Africa” scenario as it is nested within African Guareeae. Most of the expansion of the geographical area in which Meliaceae occur, might have taken place during the warm Eocene (Morley, 2003), which holds true for Guareeae. Migration of megathermal (frost-intolerant) lineages was better facilitated in the Eocene due to the presence of suitable habitats throughout much of the Earth, when even Antarctica and Greenland have sustained tropical rainforests. Two different possible routes to reach Eurasia can be hypothesized: being transported to the continent by India or via Antarctica to Australia and eventually to Asia. The first hypothesis is a much shorter route and fits with the timing of collision of India and Eurasia during the Eocene (Biggs, 2003; Morley, 2003). However, the other seems supported by the position of Anthocarpa (Figs. 5 and 8-10) and Synoum (Fig. 5 and 8), both occurring in Australia (Synoum endemic), as sister to the rest of Guareeae and Aglaieae.
In Asia, Guareeae have spread throughout the region and even reached several Pacific Islands. Even further dispersal to South America across the Pacific Ocean has also occurred as is evident from a sister-relationship between the Neotropical monotypic genus Cabralea and Dysoxylum spectabile L. native to New Zealand. At the geographical opposite, the lineage probably migrated easily through the now temperate regions of Eurasia to Africa. The divergence between African and American Guareeae was estimated at a similar age as in Trichilia (c. 30.8 and 33.7 Mya, respectively), at the start of the Oligocene. For both lineages to have reached the Americas through long-distance dispersal at roughly the same time would be highly coincidental. Therefore, a North-Atlantic land-bridge hypothesis therefore seems a better explanation of this pattern of migration and has been suggested before in the literature (e.g. Davis et al., 2002; Morley, 2003), including for Meliaceae (Muellner et al., 2006, 2010). The cooler temperatures in the Oligocene would have forced the ancestors of both American and African lineages to migrate Southwards, which would have caused initial geographical separation and subsequent divergence of ancestral populations.
After Ruagea/Guarea had reached the Americas, it seems that a dispersal event to South America has resulted in the divergence of the Andean genus Ruagea. Guarea,
41

with its most basal lineages found to be Central American, only reached South America when the landmasses of both Americas had come into close proximity prior to the formation of the Panamian isthmus. Guarea seems to have then undergone rapid radiative speciation in South America, with the crown node of the largest part (“core Guarea” in Table 3) of the 75 species of the genus being only c. 9.2-7.9 Mya, while the crown node of the whole genus is estimated at c. 25-26 Mya. This is the only known rapid radiation in Meliaceae, other large genera in the family seem to have had relatively constant speciation rates (Aglaia, Muellner et al., 2008b; Trichilia and Dysoxylum, this study), although for Chisocheton this cannot be concluded due to limited taxon sampling.
4.3. ConclusionsIn this study, analyses under different models in Bayesian MCMC phylogeny
estimation led to slightly different results. Perhaps with the use of more markers, a more robust estimate of phylogeny could be achieved. However, to acquire enough informative characters either long chloroplast datasets or low copy number nuclear genes would have to be used. The phylogenetic estimates presented here do not provide good resolution at the species level. Not only could the species history be very different from the one found here because of the lack of data power, but also through other problems that might occur in species-level phylogenetics. For example incomplete lineage sorting, multiple ITS-types or persisting chloroplast haplotypes are problems that cannot be resolved at this resolution. It requires sampling many more accessions per species, which is difficult to achieve in a tropical group of species as this one. The focus of this study was to resolve generic relationships, and it can be seen as a reasonably successful attempt at achieving that. Further taxon sampling in undersampled groups (South-East Asian Guareeae, Trichilieae, Turreeae and basal lineages in Melioideae) and the use of additional markers can possibly lead to a fully resolved genus-level phylogeny of Melioideae. Species-level phylogenies are perhaps also less important for classification purposes and are more interesting to study processes of speciation. At the moment, it seems that in many plant groups, especially in the tropics, genus-level phylogenetic studies are still very much needed to arrive at a robust natural classification of plants. From field-collected material and herbarium specimens a dense enough taxon sampling can be achieved for tropical groups to study their generic relationships. Marker choice is relatively limited then though, as amplification of low copy number nuclear markers is often hampered by degradation of the DNA in herbarium specimens.
This study provides the first extensive phylogenetic estimate of the tribe Guareeae. The phylogenetic trees and the network analysis show relationships that are congruent with the proposed generic classification of Koenen & De Wilde (in prep.) and the hypotheses on delimitation of African genera of Guareeae are not rejected. Species delimitation hypotheses cannot be accurately tested with the given data, but the Upper Guinean populations/species of Leplaea appear to be distinct from Central African, although gene flow between the Upper and Lower Guinean populations of L. thompsonii cannot be ruled out. A sister-relationship between Guarea and Chisocheton and a single origin for indeterminate leaf growth in the family is rejected. Most likely, the character developed from the same ancestral character, an imparipinnate leaf with a terminal leaflet. Therefore, this can be explained by parallel evolution. Intermittent growth, though not intermediate, might have already been present in the most recent common ancestor of the two genera.
Through ancestral area reconstruction and molecular dating studies, Meliaceae are shown to be of Indo-Malagasy origin at approximately 67-68 (±8) Mya (crown age). Initial diversification of Melioideae took place on the then separated landmasses of India and Madagascar, with exchange of lineages possibly occurring through the Seychelles plateau. As was hypothesised on basis of higher generic diversity in the species-poor African Guareeae, the African lineages indeed seem to be older than the
42

Neotropical Guareeae, where the higher species number in the Neotropics is mainly due to rapid radiation of Guarea in South-America. Guarea/Ruagea and Trichilia are both shown to have reached the New World in the early Oligocene, when the African and Neotropical lineages diverged. An Eocene presence in Europe and North-America for these lineages is suggested, with subsequent cooling of the climate in the Oligocene forcing the lineages to move Southwards and diverge. Concurrent long-distance dispersal of Guarea/Ruagea and Trichilia across the Atlantic Ocean is thought to be less likely.
43

Literature cited
Altekar, G., S. Dwarkadas, J. P. Huelsenbeck, & F. Ronquist. 2004. Parallel Metropolis-coupled Markov chain Monte Carlo for Bayesian phylogenetic inference. Bioinformatics 20: 407–415.
Álvarez, I. & J.F. Wendel. 2003. Ribosomal ITS sequences and plant phylogenetic inference. Mol. Phylogenet. Evol. 29: 417–434.
Bausher, M.G., N.D. Singh, S. Lee, R.K. Jansen & H. Daniell. 2006. The complete chloroplast genome sequence of Citrus sinensis (L.) Osbeck var 'Ridge Pineapple': organization and phylogenetic relationships to other angiosperms. BMC Plant Biol. 6: 21–32
Bernhart, H., I.L. Hofacker, S. Will, A.R. Gruber & P.F. Stadler. 2008. RNAalifold: improved consensus structure prediction for RNA alignments. BMC Bioinformatics 9: 474
Biggs, J.C. 2003. The Biogeographic and tectonic history of India. J. Biogeogr. 30: 381–388.
Blattner, F.R. 1999. Direct amplification of the entire ITS region from poorly preserved plant material using recombinant PCR. Biotechniques 27: 1180–1186.
Brown, J.M. & A.R. Lemmon. 2007. The importance of data partitioning and the utility of Bayes factors in Bayesian phylogenetics. Syst. Biol. 56:643–655.
Chase, M.W., & H.G. Hills. 1991. Silica gel: an ideal desiccant for preserving field-collected leaves for use in molecular studies. Taxon 40: 215–220.
Cowan, R.S., M.W. Chase, J. Kress & V. Savolainen. 2006. 300.000 species to identify: problems, progress, and prospects in DNA barcoding of land plants. Taxon 55: 611–616.
Dauby, G., J. Duminil, M. Heuritz & O.J. Hardy. 2010. Chloroplast DNA polymorphism and phylogeography of a Central African tree species widespread in mature rainforests: Greenwayodendron suaveolens (Annonaceae). Tropical Plant Biol. 3: 4–13.
Davis, C.C., C.D. Bell, S. Mathews & M.J. Donoghue. 2002. Laurasian migration explains Gondwanan disjunctions: Evidence from Malpighiaceae. PNAS 99: 6833–6837.
Douzery, E.J.P., F. Delsuc, M.J. Stanhope & D. Huchon. 2003. Local molecular clocks in three nuclear genes: Divergence times for rodents and other mammals and incompatibility among fossil calibrations. J. Mol. Evol. 57: S201–S213.
Doyle, J.J., & J.L. Doyle. 1987. A rapid DNA isolation procedure from small quantities of fresh leaf tissue. Phytochem. Bull. 19: 11–15.
Drummond, A.J., S.Y.W. Ho, M.J. Phillips & A. Rambaut. 2006. Relaxed phylogenetics and dating with confidence. PLoS Biology 4: e88.
Drummond, A.J. & A. Rambaut. 2007. BEAST: Bayesian evolutionary analysis by sampling trees. BMC Evol. Biol. 7: 214.
44
Drummond, A.J. & M.A. Suchard. 2010. Bayesian random local clocks or one rate to rule them all. BMC Biol. 8: 114.
Edwards, S.V., L. Liu & D.K. Pearl. 2007. High-resolution species trees without concatenation. PNAS 104: 5936–5941.
Fan, Y., R. Wu, M. Chen, L. Kuo & P.O. Lewis. 2010. Choosing among partition models in Bayesian phylogenetics. Mol. Biol. Evol. 28: 523–532.
Feliner, G.N. & J.A. Rosselló. 2007. Better the devil you know? Guidelines for insightful utilization of nrDNA ITS in species-level evolutionary studies in plants. Mol. Phylogenet. Evol. 44: 911–919.
Fisher, J.B. And R. Rutishauer. 1990. Leaves and epiphyllous shoots in Chisocheton (Meliaceae): a continuum of woody leaf and stem axes. Can. J. Bot. 68: 2316–1328.
Fisher, J.B. 1992. Grafting and Rooting of Leaves of Guarea (Meliaceae): Experimental Studies on Leaf Autonomy. Am. J. Bot. 79: 155–165.
Fukuda T., J. Yokoyama & H. Tsukaya. 2003. Phylogenetic relationships among species in the genera Chisocheton and Guarea that have unique indeterminate leaves as inferred from sequences of chloroplast DNA. Int. J. Plant Sci. 164: 13–24.
Gernandt, D.S., S. Hernández-León, E. Salgado-Hernández, & J.A. Pérez de la Rosa. 2009. Phylogenetic relationships of Pinus subsection Ponderosae inferred from rapidly evolving cpDNA regions. Syst. Bot. 34: 481–491
Gowri-Shankar, V. & M. Rattray. 2007. A reversible jump method for Bayesian phylogenetic inference with a non-homogeneous substitution model. Mol. Biol. Evol. 24: 1286–1299
Harms, H. 1940. Meliaceae. In: A. Engler & K. Prantl, Die natuerlichen Pflanzenfamilien. ed. 2, 19B-1: 1–172. Engelmann, Leipzig, Germany.
Heckman, K.L. & L.R. Pease. 2007. Gene splicing and mutagenesis by PCR-driven overlap extension. Nature Protocols 2: 924–932.
Heled, J. & A.J. Drummond. 2010. Bayesian inference of species trees from multilocus data. Mol. Biol. Evol. 27: 570–580.
Huson, D.H. and D. Bryant. 2006. Application of Phylogenetic Networks in Evolutionary Studies, Mol. Biol. Evol., 23: 254–267.
IUCN. 2010. IUCN Red List of Threatened Species. Version 2010.4. <www.iucnredlist.org>. (Accessed on 22 November 2010).
Jakob, S.S. & F.R. Blattner. 2006. A chloroplast genealogy of Hordeum (Poaceae): Long-term persisting haplotypes, incomplete lineage sorting, regional extinction, and the consequences for phylogenetic inference. Mol. Biol. Evol. 23: 1602–1612.
Katoh, K. & H. Toh. 2008a. Recent developments in the MAFFT multiple sequence alignment program. Brief. Bioinform. 9: 286–298
45

Katoh, K. & H. Toh. 2008b. Improved accuracy of multiple ncRNA alignment by incorporating structural information into a MAFFT-based framework. BMC Bioinformatics 9: 212.
Kay, K.M., J.B. Whittall & S.A. Hodges. 2006. A survey of nuclear ribosomal internal transcribed spacer substitution rates across angiosperms: an approximate molecular clock with life history effects. BMC Evol. Biol. 6: 36.
Kenfack, D. 2011. Resurrection in Carapa (Meliaceae): a reassessment of morphological variation and species boundaries using multivariate methods in a phylogenetic context. Bot. J. Linn. Soc. 165: 186–221.
Krause, D.W., G.V.R. Prasad, W. von Koenigswald, A. Sahni, F.E. Grine. 1997. Cosmopolitanism among Gondwanan Late Cretaceous mammals. Nature 390: 504–507.
Lartillot, N. & H. Philippe. 2006. Computing Bayes factors using thermodynamic integration. Syst. Biol. 55: 195–207.
Loytynoja, A. & N. Goldman. 2005. An algorithm for progressive multiple alignment of sequences with insertions. PNAS 102: 10557–10562.
Liu, L. 2008. BEST: Bayesian estimation of species trees under the coalescent model. Bioinformatics 24: 2542–2543.
Mabberley, D.J. 1979. The species of Chisocheton (Meliaceae). Bull. Brit. Mus. (Nat. Hist.) Bot. 6: 301–386.
Mabberley D.J., C.M. Pannell & A.M. Sing. 1995. Meliaceae. Flora Malesiana, Series 1, Volume 12. Rijksherbarium/Hortus Botanicus, Leiden University, Leiden, the Netherlands.
Maddison, W.P. 2007. Gene trees in species trees. Syst. Biol. 46(3): 523–536.
Maddison, W.P. & D.R. Maddison. 2010. Mesquite: a modular system for evolutionary analysis. Version 2.74. http://mesquiteproject.org.
Morley, R.J. 2003. Interplate dispersal paths for megathermal angiosperms. Pers. Pl. Ecol. Evol. Syst. 6: 5–20.
Mort, M.E. & D.J. Crawford. 2004. The continuing search: low-copy nuclear sequences for lower-level plant molecular phylogenetic studies. Taxon 53: 257–261.
Muellner, A.N., R. Samuel, S.A. Johnson, M. Cheek, T.D. Pennington & M.W. Chase. 2003. Molecular phylogenetics of Meliaceae (Sapindales) based on nuclear and plastid DNA sequences. Am. J. Bot. 90: 471–480.
Muellner, A.N., R. Samuel, M.W. Chase, C.M. Pannell & H.Greger. 2005. Aglaia (Meliaceae): an evaluation of taxonomic concepts based on DNA data and secondary metabolites. Am. J. Bot. 92: 534–543.
Muellner, A.N., V. Savolainen, R. Samuel & M.W. Chase. 2006. The mahogany family “out-of-Africa”: divergence time estimation, global biogeographic patterns inferred from plastid rbcL DNA sequences, extant and fossil distribution of diversity. Molec. Phylogen. Evol. 40: 236–250.
46

Muellner, A.N., D.D. Vassiliades & S.S. Renner. 2007. Placing Biebersteiniaceae, a herbaceous clade of Sapindales, in a temporal and geographic context. Pl. Syst. Evol. 266: 233–252.
Muellner, A.N., R. Samuel, M.W. Chase, A. Coleman & T.F. Stuessy. 2008a. An evaluation of tribes and of generic relationships in Melioideae (Meliaceae) based on nuclear ITS ribosomal DNA. Taxon 57: 98–108.
Muellner, A.N., C.M. Pannell, A. Coleman, & M.W. Chase. 2008b: The origin and evolution of Indomalesian, Australasian and Pacific island biotas: insights from Aglaieae (Meliaceae, Sapindales). J. Biogeogr. 35: 1769–1789.
Muellner, A.N. & D.J. Mabberley. 2008c. Phylogenetic position and taxonomic disposition of Turraea breviflora (Meliaceae), a hitherto enigmatic species. Blumea 53: 607–616.
Muellner, A.N., T.D. Pennington & M.W. Chase. 2009. Molecular phylogenetics of Neotropical Cedreleae (mahogany family, Meliaceae) based on nuclear and plastid DNA sequences reveal multiple origins of “Cedrela odorata”. Molec. Phylogen. Evol. 52: 461–469.
Muellner, A.N., T.D. Pennington, A. Valerie Koecke & S.S. Renner. 2010. Biogeography of Cedrela (Meliaceae, Sapindales) in Central and South America. Am. J. Bot. 97: 511–518.
Neubig, K.M., W.M. Whitten, B.S. Carlsward, M.A. Blanco, L. Endara, N.H. Williams & M. Moore. 2009. Phylogenetic utility of ycf1 in orchids: a plastid gene more variable than matK. Plant Syst. Evol. 277: 75–84.
Neubig, K.M. & J.R. Abbott. 2010. Primer development for the plastid region ycf1 in Annonaceae and other Magnoliids. Am. J. Bot.: e52–e55.
Newton, M.A., and A.E. Raftery. 1994. Approximating Bayesian inference with the weighted likelihood bootstrap. J.R.Stat.Soc. B 56: 3–48.
Nylander, J.A.A., F. Ronquist, J.P. Huelsenbeck, J. Nieves-Aldrey. 2004. Bayesian phylogenetic analysis of combined data. Syst. Biol. 53: 47–67.
Nylander, J.A.A.. U. Olsson, P. Alström & I. Sanmartín. 2008. Accounting for phylogenetic uncertainty in biogeography: A Bayesian approach to dispersal-vicariance analysis of the Thrushes (Aves: Turdus). Syst. Biol. 57: 257–268.
Oyen, L.P.A. and N.X. Dung (eds). 1999. PROSEA (Plant Resources of South-East Asia) Foundation, Bogor, Indonesia. <proseanet.org>. (Accessed on 22 November 2010).
Parks, M., R. Cronn., & A. Liston. 2009. Increasing phylogenetic resolution at low taxonomic levels using massively parallel sequencing of chloroplast genomes. BMC Biol. 7: 84.
Pellegrin, F. 1939. Les Guarea (Méliacées) africains. Bull. Soc. Bot. France 86: 146–154.
Pennington, T. D. & B. T. Styles. 1975. A generic monograph of the Meliaceae. Blumea 22: 419–540.
47

Pennington, T.D., B.T. Styles & D.A.H. Taylor. 1981. Meliaceae. Flora Neotropica, Vol. 28. NYBG Press, Bronx, New York, USA.
Pennington, T.D. & A.N. Muellner. 2010. A monograph of Cedrela (Meliaceae). DH Books, Sherborne, UK.
Posada, D. & K.A. Crandall. 1998. Modeltest: testing the model of DNA substitution. Bioinformatics 14: 817–818.
Rage, J. 2003. Relationships of the Malagasy fauna during the Late Cretaceous: Northern or Southern routes? Acta Palaeaontol. Pol. 48: 661–662.
Ree, R.H. & S.A. Smith. 2008. Maximum likelihood inference of geographic range evolution by dispersal, local extinction and cladogenesis. Syst. Biol. 57: 4–14.
Renner, S. 2004. Plant dispersal across the tropical Atlantic by wind and sea currents. Int. J. Plant Sci. 165: S22-S33.
Rokas, A., B.L. Williams, N. King & S.B. Carroll. 2003. Genome-scale approaches to resolving incongruence in molecular phylogenetics. Nature 425: 798–804.
Ronquist, F. and J. P. Huelsenbeck. 2003. MrBayes 3: Bayesian phylogenetic inference under mixed models. Bioinformatics 19: 1572–1574.
Sanderson, M.J., J.L. Thorne, N. Wikström & K. Bremer. 2004. Molecular evidence on plant divergence times. Am. J. Bot. 91: 1656–1665.
Staden & al. 1996. The Staden sequence analysis package. Mol Biotechnol. 5: 233–241.
Staner, P. 1941. Les Méliacées du Congo Belge. Bull. Jard. Bot. État 16, 2–3: 109–251.
Steingraeber D.A. & J.B. Fisher. 1986. Indeterminate Growth of Leaves in Guarea (Meliaceae): A Twig Analogue. Am. J. Bot. 73: 852–862.
Storey, M., A.D. Saunders, R.A. Duncan, S.P. Kelley, & M.F. Coffin. 1995. Timing of hotspot-related volcanism and the breakup of Madagascar and India. Science 267: 852–855.
Sukumaran, J. & M.T. Holder. 2010. DendroPy: A Python library for phylogenetic computing. Bioinformatics 26: 1569–1571.
Thompson, J. D., T. J. Gibson, F. Plewniak, F. Jeanmougin, & D. G. Higgins. 1997. The ClustalX windows interface: flexible strategies for multiple sequence alignment aided by quality analysis tools. Nucleic Acids Res. 24: 4876–4882.
Thorne, J.L. & H. Kishino. 2002. Divergence time and evolutionary rate estimation with multilocus data. Syst. Biol. 51: 689–702.
Tillier, E. and R. Collins. 1998. High apparent rate of simultaneous compensatory basepair substitutions in ribosomal RNA. Genetics 148: 1993–2002.
Van Bocxlaer, I., K. Roelants, S.D. Biju, J. Nagaraju & F. Bossuyt. 2006. Late cretaceous vicariance in Gondwanan amphibians. PloS ONE 1: e74.
48

Wang, H., M.J. Moore, P.S. Soltis, C.D. Bell, S.F. Brockington, R. Alexandre, C.C. Davis, M. Latvis, S.R. Manchester & D.E. Soltis. 2009. Rosid radiation and the rapid rise of angiosperm-dominated forests. PNAS 106: 3853–3858.
Wertheim, J.O., M.J. Sanderson, M. Worobey & A. Bjork. 2010. Relaxed molecular clocks, the bias-variance trade-off, and the quality of phylogenetic inference. Syst. Biol. 59: 1–8.
White, F. 1979. The Guineo-Congolian region and its relationships to other phytochoria. Bull. Jard. Bot. Nat. Belg. 49: 11–55.
White, T.J., T. Bruns, S. Lee & J. Taylor. 1990. Amplification and direct sequencing of fungal ribosomal RNA genes for phylogenetics. In M.A. Innis, D.H. Gelfand, J.J. Sninsky, and T.J. White [eds.], PCR protocols: a guide to methods and applications, 315–322. Academic Press, San Diego, California, USA.
Wikström, N., V. Savolainen & M.W. Chase. 2001. Evolution of the angiosperms: calibrating the family tree. Proc. R. Soc. Lond. B 268: 2211–2220.
Wolfe, K.H., W. Li & P.M. Sharp. 1987. Rates of nucleotide substitution vary greatly among plant mitochondrial, chloroplast, and nuclear DNAs. PNAS 84: 9054–9058.
Wolfe, A.D. & C.P. Randle. 2004. Recombination, Heteroplasmy, Haplotype Polymorphism, and Paralogy in Plastid Genes: Implications for Plant Molecular Systematics. Syst. Bot. 29: 1011-1020.
Wright, S., J. Keeling, & L. Gillman. 2006. The road from Santa Rosalia: A faster tempo of evolution in tropical climates. PNAS 103: 7718–7722.
Yang, Z. & B. Rannala. 2005. Branch-length prior influences Bayesian posterior probability of phylogeny. Syst. Biol. 54: 455–470.
Yoder, A.D. & Z. Yang. 2000. Estimation of primate speciation dates using local molecular clocks. Mol. Biol. Evol. 17: 1081–1090.
Yoder, A.D. & M.D. Nowak. 2006. Has vicariance or dispersal been the predominant biogeographic force in Madagascar? Only time will tell. Annu. Revu. Ecol. Evol. Syst. 37: 405–431.
Yu, Y., A.J. Harris & X. He. 2010. S-DIVA (Statistical Dispersal-Vicariance Analysis): A tool for inferring biogeographic histories. Mol. Phylogenet. Evol.56: 848–850.
Zwickl, D.J. & D.M. Hillis. 2002. Increased taxon sampling greatly reduces phylogenetic error. Syst. Biol. 51: 588–598.
Zwickl, D.J. & M.T. Holder. 2004. Model parameterization, prior distributions, and the general time-reversible model in Bayesian phylogenetics. Syst. Biol. 53: 877–888.
49

Appendix I. List of vouchers
Taxon name Voucher Herbaria Origin Genbank accession #ITS ycf1
Aglaia archboldiana A.C.Smith Greger 696 WU Fiji AY695524Aglaia coriacea Korth. ex Miq. Muellner 2032 BRUN, K Brunei EF491263 unpublishedAglaia edulis (Roxb.) Wall. Greger 905 WU Thailand AY695534Aglaia elaeagnoidea (A.Juss.) Benth. Greger 650 WU Australia AY695536Aglaia eximia Miq. Greger 540 WU Thailand AY695541Aglaia korthalsii Miq. Muellner 2041 BRUN, K Brunei EF491264 unpublishedAglaia lawii (Wight) Saldanha ex Ramamoorthy Greger 576 WU Thailand AY695575Aglaia macrocarpa (Miq.) C.M.Pannell Church et al. 775 K Indonesia AY695576Aglaia silvestris (M.Roemer) Merrill Greger 719 WU Thailand AY695563Aglaia spectabilis (Miq.) Jain & Bennet Greger 864 WU Thailand AY695580Aglaia teysmanniana (Miq.) Miq. Greger 757 WU Bangladesh AY695582Aglaia tomentosa Teijsm. & Binn. Greger 698 WU Thailand AY695567Anthocarpa nitidula (Benth.) T.D.Penn. ex Mabb. Chase 3313 K Australia DQ861616Anthocarpa nitidula (Benth.) T.D.Penn. ex Mabb. Chanel 1110 K Melanesia DQ861615Aphanamixis borneensis (Miq.) Merr. Beaman 8208 K Malaysia AY695583Aphanamixis polystachya (Wall.) R.Parker Samuel 14 WU Sri Lanka AY695584Astrotrichilia asterotricha (Radlk.) Cheek ?* ?* Madagascar FJ518866Azadirachta indica A.Juss. Samuel 5 WU Sri Lanka AY695594Cabralea canjerana (Vell.) Mart. Wasum et al. 1196 B, HVCS Brazil unpublished unpublishedCabralea canjerana (Vell.) Mart. Pennington 17067 K Peru DQ861617Calodecaryia crassifolia Leroy Croat 31521 K Madagascar DQ861631Capuronianthus mahafalensis J.-F.Leroy Fosberg 52439 MO Madagascar FJ518868Carapa procera DC. ?* ?* ?( Upper Guinea)* FJ518880Cedrela odorata L. Agra et al. 5014 K Brazil FJ462471Chisocheton cumingianus (C.DC.) Harms L. Lamothe MEL28 L New Guinea unpublished
* From an unpublished study by D. Kenfack et al.** Provided by J.J. Clarkson and/or T.D. Pennington without further voucher details.*** From Wright et al. (2006), published without specifying vouchers.
50

Chisocheton macrophyllus King Chase 1309 K Indonesia DQ861613 unpublishedChisocheton patens Blume S. Tingki SAN135706 L Malaysia unpublished unpublishedChisocheton polyandrus Merr. Mabberley 1708 L Malaysia unpublishedChukrasia tabularis A.Juss. ?* ?* ?* FJ518894Cipadessa baccifera (Roth) Miq. Chase 1310 K Indonesia DQ861627Dysoxylum alliaceum (Blume) Blume Ferry Slik SWPRI-785 L Indonesia unpublished unpublished
Dysoxylum arborescens (Blume) Miq. ?*** ?***Papua New Guinea DQ499101
Dysoxylum bijugum (Labill.) Seem. Pat Curry 1552 L Vanuatu unpublishedDysoxylum cyrtobotryum Miq. Ambri & Arifin W795 L Indonesia unpublished unpublishedDysoxylum gaudichaudianum (A.Juss.) Miq. Chase 1312 K Indonesia DQ861619 unpublishedDysoxylum rufescens Vieill. ex Pancher & Sebert
M. v. Balgooy 7020 L New Caledonia unpublished unpublishedDysoxylum spectabile (G.Forst.) Hook.f. ?*** ?*** New Zealand DQ499100
Ekebergia capensis Sparrm. MG 246Cynthia Morton South Africa DQ861623
Guarea anomala ined. Mori & Benton, 12995 K Brazil unpublishedGuarea blanchetii C.DC. Jardim et al., 225 K Brazil unpublished unpublishedGuarea blanchetii C.DC. Sant' Ana et al., 360 NY Brazil unpublishedGuarea blanchetii C.DC. Kallunki et al., 585 K Brazil unpublishedGuarea bullata Radlk. ?** ?** ?** unpublished
Guarea carapoides HarmsVasquez & Jaramillo,
20267 K Peru unpublishedGuarea carinata Ducke Freire & Cerda 149 K Ecuador unpublishedGuarea chiricana Standl. ?** ?** ?** unpublishedGuarea cinnamomea Harms Pennington et al. 17417 K Peru unpublished unpublishedGuarea costata A.Juss. de Granville et al. 8072 K French Guiana unpublished
Guarea cristata T.D.Penn.Vasquez & Jaramillo,
4609 K Peru unpublished
Guarea cristata T.D.Penn.Duivenvoorden et al.,
2766 K Colombia unpublishedGuarea ecuadoriensis W.Palacios Palacios, 3193 K Ecuador unpublishedGuarea fissicalyx Harms McDaniel & Rimachi K Peru unpublished
* From an unpublished study by D. Kenfack et al.** Provided by J.J. Clarkson and/or T.D. Pennington without further voucher details.*** From Wright et al. (2006), published without specifying vouchers.
51

23667Guarea glabra Vahl Chase 336 NCU USA AY695591Guarea gracilia ined. Oliveira, 344A K Brazil unpublishedGuarea guentheri Harms Toasa & Tirado 8731 K Ecuador unpublishedGuarea guidonia (L.) Sleumer Pabon et al., 296 K Ecuador unpublished
Guarea kunthiana A.Juss.Pennington & Daza
16807 K Peru unpublishedGuarea macrocalyx Al.Rodr. ?** ?** ?** unpublishedGuarea panamensis ined. McPherson, 11866 MO Panama unpublishedGuarea pendula R.da Silva Ramalho, A.L.Pinheiro & T.D.Penn. Mexia, 4555 K Brazil unpublished
Guarea penningtoniana M.E.Morales Revilla 3668 K Peru unpublished unpublishedGuarea pterorhachis Harms Campbell et al. 8935 K Brazil unpublishedGuarea pubescens (Rich.) A.Juss. Pennington et al. 16514 K Peru unpublished unpublishedGuarea purusana C.DC. Cardiel & Caballal 139 K Bolivia unpublished unpublishedGuarea pyriformis T.D.Penn. Harmon 33 K Costa Rica unpublishedGuarea riparia W.Palacios Palacios, 6613 K Ecuador unpublishedGuarea silvatica C.DC. NH200415 CAY French Guiana FJ037836Guarea silvatica C.DC. Sothers & Silva 456 K Brazil unpublished unpublishedGuarea sprucei C.DC. Daly et al. 5452 K Brazil unpublishedGuarea subandina W.Palacios Chimbo & Chambo, 34 K Ecuador unpublishedGuarea tafae-malekui Al.Rodr. ?** ?** ?** unpublishedGuarea tonduzii C.DC. ?** ?** ?** unpublishedGuarea velutina A.Juss. Cid Ferreira et al. 7945 K Brazil unpublishedHeckeldora sp. Chase 3311 K Cameroon AY695592Heckeldora jongkindii J.J.de Wilde Jongkind 8949 WAG Liberia unpublished unpublishedHeckeldora ledermannii (Harms) J.J.de Wilde Leeuwenberg 8813 WAG Cameroon unpublishedHeckeldora leonensis (Hutch. & Dalziel) E.J.M.Koenen Jongkind 6473 WAG Liberia unpublished unpublishedHeckeldora leptotricha (Harms) J.J.de Wilde Wieringa 5805 WAG Cameroon unpublished unpublishedHeckeldora staudtii (Harms) Staner T van Andel 3676 WAG Cameroon unpublishedHeckeldora trifoliolata J.J.de Wilde v. Valkenburg 2715 WAG Gabon unpublishedHeckeldora zenkeri (Harms) Staner Breteler 15727 WAG Gabon unpublished unpublished
* From an unpublished study by D. Kenfack et al.** Provided by J.J. Clarkson and/or T.D. Pennington without further voucher details.*** From Wright et al. (2006), published without specifying vouchers.
52

Humbertioturraea sp. (H. labatii sp.nov. ined.?) Bardot-Vaucoulon 160 K Madagascar DQ861632Lansium domesticum Correa Chase 2113 K Indonesia AY695586 unpublishedLepidotrichilia volkensii (Gürke) J.-F.Leroy ex B.T.Styles & F.White Hughes 189 K Tanzania DQ861620
Leplaea adenopunctata E.J.M.Koenen & J.J.de WildeVersteegh & Den Outer
182 WAG Ivory Coast unpublishedLeplaea adenopunctata E.J.M.Koenen & J.J.de Wilde Nimba Bot. team WD473 WAG Guinea unpublished unpublishedLeplaea cauliflora E.J.M.Koenen & J.J.de Wilde Wieringa 6270 WAG, LBV Gabon unpublished unpublishedLeplaea cedrata (A.Chev.) E.J.M.Koenen & J.J.de Wilde Sosef 2709 WAG, LBV Gabon unpublished unpublishedLeplaea laurentii (De Wild.) E.J.M.Koenen & J.J.de Wilde Koenen 66 WAG, LBV Gabon unpublished unpublishedLeplaea mangenotiana (Aké Assi & Lorougnon) E.J.M.Koenen & J.J.de Wilde Jongkind 4479 WAG Ivory Coast unpublished unpublished
Leplaea mayombensis (Pellegr.) Staner v. Valkenburg 2778 WAG Gabon unpublished unpublishedLeplaea thompsonii (Sprague & Hutch.) E.J.M.Koenen & J.J.de Wilde Breteler 2181 WAG Cameroon unpublished
Leplaea thompsonii (Sprague & Hutch.) E.J.M.Koenen & J.J.de Wilde Reitsma 1970 WAG Gabon unpublished
Leplaea thompsonii (Sprague & Hutch.) E.J.M.Koenen & J.J.de Wilde Jongkind 9059 WAG Liberia unpublished
Leplaea thompsonii (Sprague & Hutch.) E.J.M.Koenen & J.J.de Wilde Leeuwenberg 2648 WAG Ivory Coast unpublished
Leplaea thompsonii (Sprague & Hutch.) E.J.M.Koenen & J.J.de Wilde Nemba & Mambo 653 WAG Cameroon unpublished
Leplaea thompsonii (Sprague & Hutch.) E.J.M.Koenen & J.J.de Wilde Breteler 15389 WAG Gabon unpublished unpublished
Lovoa trichilioides Harms ?* ?* ?* FJ518899Malleastrum mandenense J.-F.Leroy Cheek et al. 3-17-5 K Madagascar DQ861626Melia azedarach L. Chase 2867 K K Living Collection AY695595 unpublished
Munronia breviflora (Ridl.) Mabb. & MuellnerKamarudin KEP FRI
51354 KEP FRI Malaysia FJ194497
Munronia humilis Harms Maxwell 75-239 L Thailand
FJ194495 and
FJ194496Naregamia alata Wight & Arn. Kanodia 89603 K India DQ861629
* From an unpublished study by D. Kenfack et al.** Provided by J.J. Clarkson and/or T.D. Pennington without further voucher details.*** From Wright et al. (2006), published without specifying vouchers.
53

Neobeguea mahafalensis J.-F.Leroy Labat & Du Puy 2032 MO Madagascar FJ518901Neoguarea glomerulata (Harms) E.J.M.Koenen & J.J.de Wilde v. Valkenburg 3068 WAG Gabon unpublished
Neoguarea glomerulata (Harms) E.J.M.Koenen & J.J.de Wilde Koenen 44 WAG Gabon unpublished unpublished
Nymania capensis Lindb. Chase 270 NCU South Africa DQ861633Owenia vernicosa F.Muell. Evans M3071 unknown Australia DQ861622Pseudoclausena chrysogyne (Miq.) T.P.Clark Muellner 2052 FR Malaysia DQ861602Pterorhachis zenkeri Harms Breteler 2741 WAG, K Cameroon DQ861628Quivisianthe papinae Baill. Philipson 1650 K Madagascar DQ861605
Reinwardtiodendron cinereum (Hiern) Mabb. F.R.I. (Forestry Res.
Inst.) 26877 K Malaysia AY695588Reinwardtiodendron humile (Hassk.) Mabb. Trichon 641 FHO Indonesia DQ861612 unpublishedRuagea insignis (C.DC.) T.D.Penn. Palacios 3346 K ?* unpublished
Ruagea pubescens H.Karst.Pennington & Frere
13761 K Ecuador AY695593Ruagea tomentosa Cuatrec. Vargas et al. 4046 K ?* unpublished unpublishedSandoricum koetjape (Burm. f.) Merr. Muellner 131 FR Thailand DQ861600Sandoricum cf. borneense Miq. Chase 1313 K Indonesia DQ861601
Schmardaea microphylla (Hook.) H.Karst. ex Müll.Stuttg. Kenfack & Quizpe 2162 MO Ecuador FJ518904Sphaerosacme decandra (Wall.) T.D.Penn. Williams & Stainton 8533 K Ecuador (!?) AY695590Swietenia macrophylla King Chase 250 NCU USA DQ861609Synoum glandulosum (Sm.) A.Juss. Schodde 5101 K Australia DQ861618 unpublishedTrichilia breviflora S.F.Blake & Standl. Contreras 9190 K Guatemala unpublishedTrichilia cipo (A.Juss.) C.DC. NL110135 CAY French Guiana FJ037838
Trichilia elegans A.Juss.Pendry & Pennington
676 K Bolivia unpublishedTrichilia emetica Vahl. Sieglstetter 15 FR West Africa EF136577
Trichilia hirta L.Hawthorne & Hughes
336 FHO Grenada unpublishedTrichilia monadelpha (Thonn.) J.J.de Wilde Koenen 24 WAG Gabon unpublished unpublished
Trichilia multifoliola C.DC.Pennington & Saldias
13446 K Bolivia unpublished
* From an unpublished study by D. Kenfack et al.** Provided by J.J. Clarkson and/or T.D. Pennington without further voucher details.*** From Wright et al. (2006), published without specifying vouchers.
54

Trichilia pallida Sw. NL110315 CAY French Guiana FJ037840
Trichilia pleeana (A.Juss.) C.DC.Pennington & Daza
16706 K Peru unpublishedTrichilia prieureana A.Juss. Neumann 1518 FR West Africa EF136576Trichilia silvatica C.DC. Thomas et al. 10256a K Brazil unpublishedTrichilia surinamensis (Miq.) C.DC. NL110145 CAY French Guiana FJ037839
Trichilia trimera ined.Gottsberger & Doring
G19-4888 K Peru unpublishedTurraea heterophylla Sm. Kuppers 2212 FR West Africa EF136578Turraea sericea Sm. Civeyrel 1336 K Madagascar DQ861630Turraeanthus africanus (Welw. ex C.DC.) Pellegr. Jongkind 7937 WAG Guinea unpublished unpublishedTurraeanthus africanus (Welw. ex C.DC.) Pellegr. Carvalho 4348-1 K Equatorial Guinea DQ861614Turraeanthus longipes Baill. Chatrou 564 WAG Cameroon unpublished unpublishedTurraeanthus mannii Baill. DW Thomas 4832 WAG Nigeria unpublished unpublishedWalsura tubulata Hiern. Chase 1314 K Indonesia DQ861625
* From an unpublished study by D. Kenfack et al.** Provided by J.J. Clarkson and/or T.D. Pennington without further voucher details.*** From Wright et al. (2006), published without specifying vouchers.
55

Appendix II. Supplementary figures
Figure 1. Majority rule consensus tree of a MrBayes analysis (30 million generations) of a concatenated dataset of ITS and ycf1 of 105 accessions of Melioideae. Burn-in was set to 25%.
56

Figure 2. Consensus network of MrBayes analyses of ITS and ycf1 with 34 taxa, with 5000 trees from both analyses sampled. Edge weights (branch lengths) are all equal, to reveal reticulate patterns.
57

Figure 3. MCC-tree of the uncorrelated lognormal relaxed clock analysis (2 independent runs of 30 million generations each) of ITS, with 119 accessions of Meliaceae. The first 5 million generations of each run are discarded as burn-in. Branches are coloured from blue to red to indicate slower and faster rates, respectively. Values above branches indicate the specific rate for each branch. The scale on the x-axis represents millions of years ago (Mya).
58

Figure 4. The same MCC-tree as shown in Figure 3, but with the age estimate for each node with support >0.5 pp indicated, with the blue bars representing the 95% confidence interval.
59

Figure 5. MCC-tree of the random local clock analysis (4 independent runs of 30 million generations each) of ITS, with 119 accessions of Meliaceae. The first 5 million generations of each run are discarded as burn-in. Branches are coloured from blue to red to indicate slower and faster rates, respectively. Values above branches indicate the specific rate for each branch. The scale on the x-axis represents millions of years ago (Mya).
60

Figure 6. The same MCC-tree as shown in Figure 5, but with the age estimate for each node with support >0.5 pp indicated, with the blue bars representing the 95% confidence interval.
61