Photovoltaic Recovery of All Printable Mesoporous‐Carbon ...
9
Photovoltaic Recovery of All Printable Mesoporous-Carbon- based Perovskite Solar Cells Stav Alon, Maayan Sohmer, Chandra Shakher Pathak, Iris Visoly-Fisher, and Lioz Etgar* 1. Introduction Perovskite solar cells demonstrated a significant progress in their power conversion efficiency (PCE) since its first use as a light harvester in 2009. [1] The lead halide perovskites contain 3D arrays of inorganic PbX 6 anions surrounded by organic or inor- ganic counter ions (for example, Cs þ ). [2] The lead halide perov- skite exhibits a large absorption coefficient, long-range photocarrier diffusion lengths, and a suitable bandgap in the visible range. [3–6] Hybrid perovskites can be used in several solar cells architectures such as mesoporous, planar, inverted, and even without hole transport material (HTM). [3,7–9] The elimination of HTM can lower the cost of the solar cell and sim- plify its fabrication process. An interesting HTM free solar cell structure is based on a mesoporous carbon electrode. In this solar cell architecture, the perovskite is deposited at the last step and penetrats through the whole mesoporous structure (see Figure 1a). [10] Mesoporous-carbon-based perovskite solar cells (mC-PSCs) have sev- eral unique features making them an attractive solar cell structure and a good candidate for commercialization. They can be fabricated using fast and simple pro- cesses such as screen printing, moreover they do not require an evaporation of the cathode making them a low-cost technology. [11] The elimination of a metallic back electrode is expected to have significant advantages for the photostability of such cells, as the well-documented metal-induced degradation mechanism [12–14] is prevented. Indeed, mC-PSCs have previously demonstrated impressive photostability [15–18] with embedded MAPbI 3 with ammoniumvaleric acid (AVA)-based additives. Stability studies of mC-PSCs therefore allow studying intrinsic stability, degrada- tion, and recovery phenomena, which are not masked by the metal contact-related ones. Over the past years, mC-PSCs demonstrated an increase in their PCE achieving up to 16% efficiency. [19,20] A major concern in these mC-PSCs is how to achieve complete and uniform pen- etration of the perovskite through the porous structure which usually has a thickness of several micrometers. Toward that end, several reports modified the perovskite composition, while others changed the perovskite’s precursor solution. [19,21–24] There are two common ways to deposit the perovskite, i.e., one-step and two-step methods. In the one-step deposition, the perovskite’s precursors are mixed in one solution, whereas in the two-step deposition first the lead halide is dropped over the electrode, and in the second step, the cell is dipped into the cations’ solution. [10,25,26] In carbon-based perovskite solar cells, the one-step deposition is more frequently used [21,22,24,27] compared with the two-step deposition. [28,29] The use of two-step deposition can be advantageous for mC-PSCs as there are more options for selection of solvents for the deposition, better control S. Alon, M. Sohmer, Prof. L. Etgar Institute of Chemistry The Center for Nanoscience and Nanotechnology Casali Center for Applied Chemistry The Hebrew University of Jerusalem Jerusalem 91904, Israel E-mail: [email protected] Dr. C. S. Pathak, Prof. I. Visoly-Fisher Department of Solar Energy and Environmental Physics Swiss Institute for Dryland Environmental and Energy Research Jacob Blaustein Institutes for Desert Research Ben-Gurion University of the Negev Midreshet Ben-Gurion 8499000, Israel The ORCID identification number(s) for the author(s) of this article can be found under https://doi.org/10.1002/solr.202100028. DOI: 10.1002/solr.202100028 Lead halide perovskites attract much attention in recent years as a realistic solution for efficient and low-cost solar cells. One of the interesting solar cell structures is the fully mesoporous-carbon-based perovskite solar cells. The mesoporous layers can be fabricated entirely by screen printing with the potential for upscaling. Herein, the two-step deposition of perovskite in mesoporous- carbon-based perovskite solar cells is studied. The influence of the dipping time on the photovoltaic parameters is investigated using charge extraction and intensity-modulated photovoltage spectroscopy (IMVS) measurements. A power conversion efficiency of 15% is observed for cells fabricated using two-step deposition which is one of the highest reported for this solar cell structure. Stability characterizations at maximum power point (MPP) tracking show degradation with time, however a complete recovery of the devices in the dark is revealed. Analyzing the mechanism for this shows that the perovskite’s unit cell shrinks during the recovery process due to internal stress relief. This interesting phenomenon opens the possibility to optimize the stability of these solar cells for commercial applications. RESEARCH ARTICLE www.solar-rrl.com Sol. RRL 2021, 2100028 2100028 (1 of 9) © 2021 Wiley-VCH GmbH
Transcript of Photovoltaic Recovery of All Printable Mesoporous‐Carbon ...
Photovoltaic Recovery of All Printable Mesoporous-Carbon-based Perovskite Solar Cells
Stav Alon, Maayan Sohmer, Chandra Shakher Pathak, Iris Visoly-Fisher,and Lioz Etgar*
1. Introduction
Perovskite solar cells demonstrated a significant progress in theirpower conversion efficiency (PCE) since its first use as a lightharvester in 2009.[1] The lead halide perovskites contain 3Darrays of inorganic PbX6 anions surrounded by organic or inor-ganic counter ions (for example, Csþ).[2] The lead halide perov-skite exhibits a large absorption coefficient, long-rangephotocarrier diffusion lengths, and a suitable bandgap in the
visible range.[3–6] Hybrid perovskites canbe used in several solar cells architecturessuch as mesoporous, planar, inverted, andeven without hole transport material(HTM).[3,7–9] The elimination of HTMcan lower the cost of the solar cell and sim-plify its fabrication process. An interestingHTM free solar cell structure is based on amesoporous carbon electrode. In this solarcell architecture, the perovskite is depositedat the last step and penetrats throughthe whole mesoporous structure (seeFigure 1a).[10] Mesoporous-carbon-basedperovskite solar cells (mC-PSCs) have sev-eral unique features making them anattractive solar cell structure and a goodcandidate for commercialization. Theycan be fabricated using fast and simple pro-cesses such as screen printing, moreoverthey do not require an evaporation ofthe cathode making them a low-costtechnology.[11] The elimination of ametallic back electrode is expected to have
significant advantages for the photostability of such cells, as thewell-documented metal-induced degradation mechanism[12–14] isprevented. Indeed, mC-PSCs have previously demonstratedimpressive photostability[15–18] with embedded MAPbI3 withammoniumvaleric acid (AVA)-based additives. Stability studiesof mC-PSCs therefore allow studying intrinsic stability, degrada-tion, and recovery phenomena, which are not masked by themetal contact-related ones.
Over the past years, mC-PSCs demonstrated an increase intheir PCE achieving up to 16% efficiency.[19,20] A major concernin these mC-PSCs is how to achieve complete and uniform pen-etration of the perovskite through the porous structure whichusually has a thickness of several micrometers. Toward thatend, several reports modified the perovskite composition, whileothers changed the perovskite’s precursor solution.[19,21–24]
There are two common ways to deposit the perovskite, i.e.,one-step and two-step methods. In the one-step deposition,the perovskite’s precursors are mixed in one solution, whereasin the two-step deposition first the lead halide is dropped overthe electrode, and in the second step, the cell is dipped intothe cations’ solution.[10,25,26] In carbon-based perovskite solarcells, the one-step deposition is more frequently used[21,22,24,27]
compared with the two-step deposition.[28,29] The use of two-stepdeposition can be advantageous for mC-PSCs as there are moreoptions for selection of solvents for the deposition, better control
S. Alon, M. Sohmer, Prof. L. EtgarInstitute of ChemistryThe Center for Nanoscience and NanotechnologyCasali Center for Applied ChemistryThe Hebrew University of JerusalemJerusalem 91904, IsraelE-mail: [email protected]
Dr. C. S. Pathak, Prof. I. Visoly-FisherDepartment of Solar Energy and Environmental PhysicsSwiss Institute for Dryland Environmental and Energy ResearchJacob Blaustein Institutes for Desert ResearchBen-Gurion University of the NegevMidreshet Ben-Gurion 8499000, Israel
The ORCID identification number(s) for the author(s) of this articlecan be found under https://doi.org/10.1002/solr.202100028.
DOI: 10.1002/solr.202100028
Lead halide perovskites attract much attention in recent years as a realisticsolution for efficient and low-cost solar cells. One of the interesting solar cellstructures is the fully mesoporous-carbon-based perovskite solar cells. Themesoporous layers can be fabricated entirely by screen printing with the potentialfor upscaling. Herein, the two-step deposition of perovskite in mesoporous-carbon-based perovskite solar cells is studied. The influence of the dipping timeon the photovoltaic parameters is investigated using charge extraction andintensity-modulated photovoltage spectroscopy (IMVS) measurements. A powerconversion efficiency of 15% is observed for cells fabricated using two-stepdeposition which is one of the highest reported for this solar cell structure.Stability characterizations at maximum power point (MPP) tracking showdegradation with time, however a complete recovery of the devices in the dark isrevealed. Analyzing the mechanism for this shows that the perovskite’s unit cellshrinks during the recovery process due to internal stress relief. This interestingphenomenon opens the possibility to optimize the stability of these solar cells forcommercial applications.
RESEARCH ARTICLEwww.solar-rrl.com
Sol. RRL 2021, 2100028 2100028 (1 of 9) © 2021 Wiley-VCH GmbH

over the pore filling, which is critical in this solar cell structure,and improved reproducibility.[30,31] It allows better control of theperovskite morphology for improved cell performance, com-pared with one-step deposition,[32–34] and the development of sta-ble Sn-based perovskite solar cells (PSCs).[35] Our work haspreviously demonstrated that two-step deposited mC-PSCsundergo a shorter “maturation process” after fabrication, andallow increased crystalline orientation of the perovskite, com-pared with one-step deposited mC-PSCs.[28] The two-step depo-sition was also recently utilized for the fabrication of all-inorganicmC-PSCs with exceptional stability,[36] further demonstrating thesignificance of this fabrication method.
In this work, we concentrate on achieving highly efficient mC-PSCs using the two-step deposition process of the perovskite. Wemodified several parameters during the deposition processachieving 15% efficiency. Charge extraction (CE) and intensity-modulated photovoltage spectroscopy (IMVS) measurementswere used to elucidate the detailed photovoltaic (PV) mechanismof those cell structures. Stability measurements under maximumpower point (MPP) tracking reveal significant recovery of the PVparameters after 1 day in the dark. The mechanism for this recov-ery is discussed in detail.
2. Results and Discussion
Figure 1a shows the structure of the mC-PSC. The cell’s struc-ture includes �0.7 μm mesoporous TiO2 which acts as an elec-tron transport material (ETM), �9 μm of mesoporous carbonwhich act as the cathode, and �1 μm of intermediate mesopo-rous ZrO2 which prevent a direct contact between the TiO2
and the carbon. The perovskite penetrates through all devicelayers from the top to the bottom. Figure 1a shows a cross sectionmade by focused ion beam (FIB) milling of this solar cell whereall the layers can be observed. Upon illumination from the glassside, electrons and holes are generated in the perovskite whereelectrons are injected to the TiO2 and holes are collected by thecarbon electrode.
Here, we concentrate on two-step deposition for the mC-PSCwhere we studied the effect of the different depositionparameters on the PV performance and stability.MA0.15FA0.85Pb(I0.85Br0.15)3 perovskite was used for this study(FA- formamidinium, MA-methyl ammonium). This perovskitecomposition was chosen as it is one of the compositions thatshow high PV performance in perovskite solar cells.[37,38] Asin this study we investigate the two-step deposition process, itwas not possible to add Csþ cation to the perovskite compositiondue to the fact that the Csþ cation cannot be dissolved in the dip-ping cation solution without the presence of lead halide. Theabsorbance of this perovskite composition is presented inFigure S1, Supporting Information, where the formamidiniumshifts the bandgap absorption edge to wavelength of over800 nm. The two-step process is shown in Figure 1b, briefly adrop of lead halide solution is placed on the active area followedby annealing, then the cell is dipped into the cation solutionfor a certain dipping time. The crystallization of the perovskiteis finalized by an annealing step. No antisolvent treatment isused in the deposition process.
Initially, to find the optimized conditions for this study,we varied the solution’s concentration of the first step (Pbhalide solution in dimethylformamide(DMF):dimethyl sulfoxide[DMSO]), whereas the second step (i.e., dipping) remained
Figure 1. a) Schematic description of the mesoporous carbon perovskite-based solar cells structure and its scanning electron microscope-focused ionbeam cross-sectional image. b) Schematic illustration of the two-step deposition process. The first stage includes dropping of the PbI2þ PbBr2 solution,the second step includes dipping into the cation solution of FAIþMABr.
www.advancedsciencenews.com www.solar-rrl.com
Sol. RRL 2021, 2100028 2100028 (2 of 9) © 2021 Wiley-VCH GmbH
constant. The solution of the first step was composed of PbI2 andPbBr2 at a weight ratio of 85:15 in DMF:DMSO (85:15 vol%) mix-ture. Three different concentrations were studied, 1, 1.5, and 2 M
(Table S1, Supporting Information). The 2 M achieved the bestresults in all PV parameters; this concentration is relatively highrelated to standard two-step deposition processes. The reason forthat lies in the thickness of the device, where the perovskite hasto penetrate several micrometers (see Figure 1a, 2) and high con-centration can guarantee that.
Next, we varied the Br concentration in the perovskite. It iswell known that the bromide content affects the perovskitebandgap, as more bromide shifts the bandgap to the blueregion.[39] The Br concentration was varied between 0% (fulliodide) to 25% of the halide content, as shown in Table S2,Supporting Information. A high open-circuit voltage (Voc) canbe observed with high Br concentrations of 10% and 15%, more-over the current density ( Jsc) is also increased in these cases com-pared with other concentrations. The best performance in thiscase was achieved for 15% Br. Interestingly, even though the15% Br concentration is supposed to increase the perovskitebandgap, the Jsc is still increased. As reported earlier, at lowBr concentrations, the band gap is not altered, as the bromidesfill vacancies and traps in the perovskite crystal, therefore they donot affect the bandgap.[40]
Based on these optimized parameters, we modified the dip-ping time in the second step of the deposition. This parametershould have a major influence on the PV performance of the
mC-PSC as the cell structure consists of several micrometersof mesoporous scaffold where the perovskite has to penetratethrough it. The dipping time is a critical parameter, as it deter-mines the time which is required for the perovskite solution topenetrate along the porous scaffold without crystalizing on theway. The dipping solution contains formamidinium iodide(FAI) and methylammonium bromide (MABr) at a weight ratioof 85:15 in isopropyl alcohol (IPA).
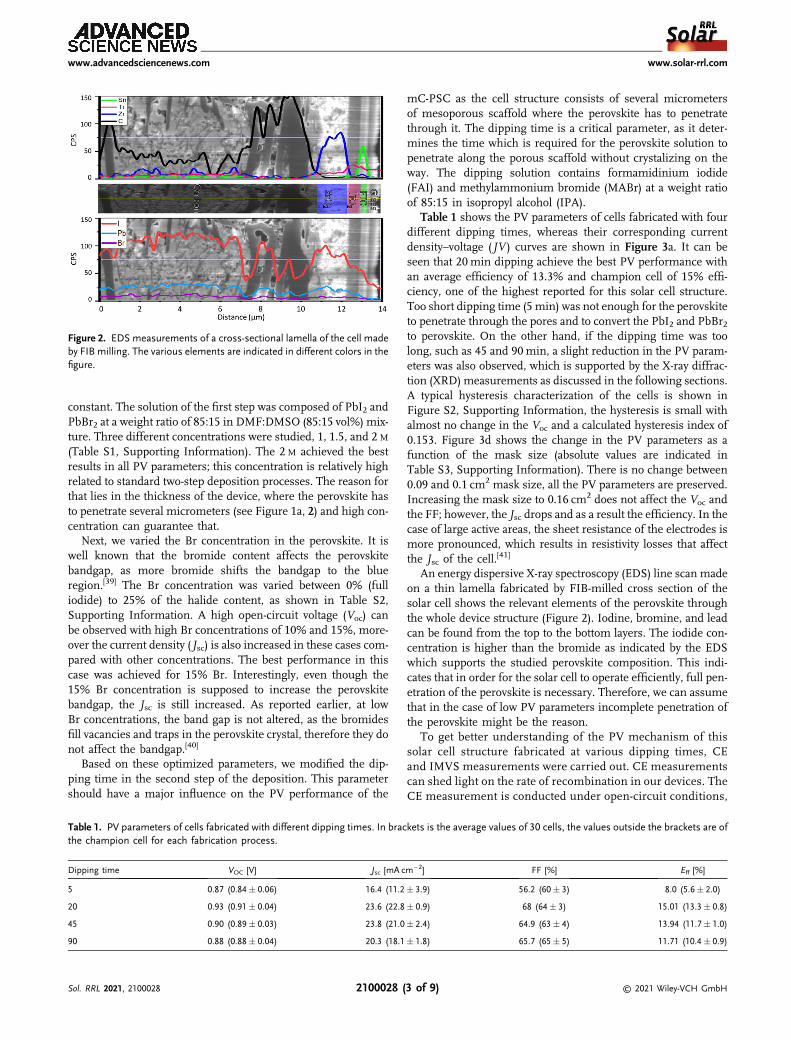
Table 1 shows the PV parameters of cells fabricated with fourdifferent dipping times, whereas their corresponding currentdensity–voltage ( JV ) curves are shown in Figure 3a. It can beseen that 20min dipping achieve the best PV performance withan average efficiency of 13.3% and champion cell of 15% effi-ciency, one of the highest reported for this solar cell structure.Too short dipping time (5min) was not enough for the perovskiteto penetrate through the pores and to convert the PbI2 and PbBr2to perovskite. On the other hand, if the dipping time was toolong, such as 45 and 90min, a slight reduction in the PV param-eters was also observed, which is supported by the X-ray diffrac-tion (XRD) measurements as discussed in the following sections.A typical hysteresis characterization of the cells is shown inFigure S2, Supporting Information, the hysteresis is small withalmost no change in the Voc and a calculated hysteresis index of0.153. Figure 3d shows the change in the PV parameters as afunction of the mask size (absolute values are indicated inTable S3, Supporting Information). There is no change between0.09 and 0.1 cm2 mask size, all the PV parameters are preserved.Increasing the mask size to 0.16 cm2 does not affect the Voc andthe FF; however, the Jsc drops and as a result the efficiency. In thecase of large active areas, the sheet resistance of the electrodes ismore pronounced, which results in resistivity losses that affectthe Jsc of the cell.[41]
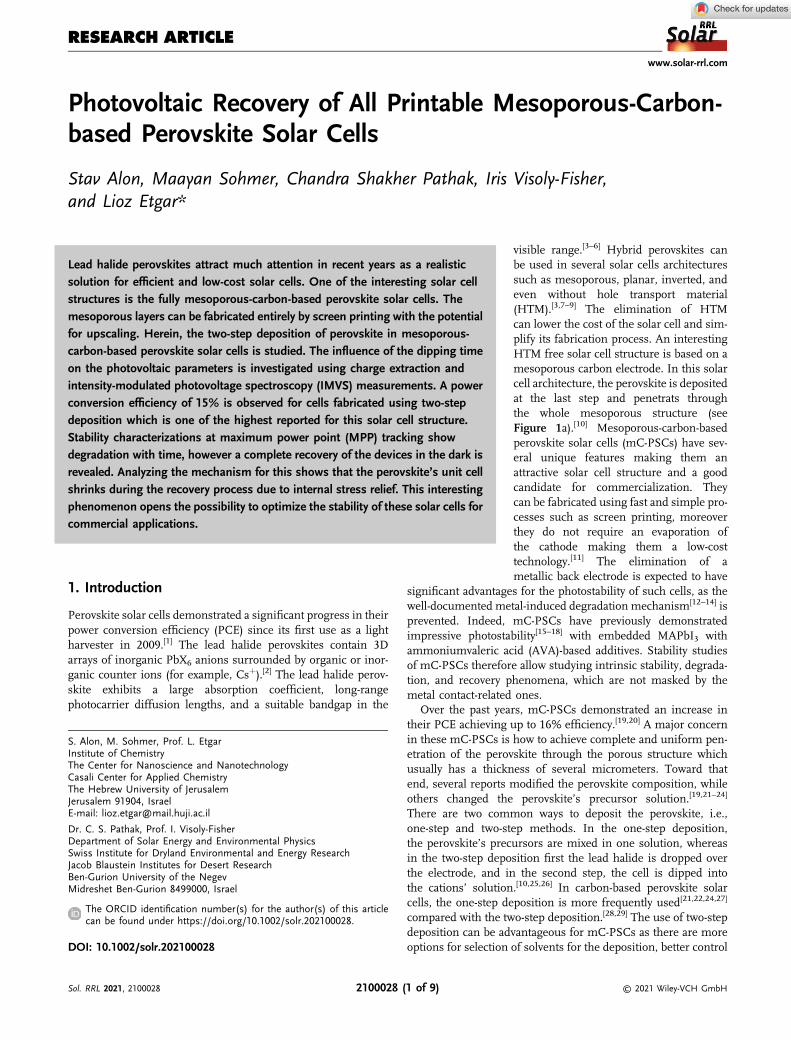
An energy dispersive X-ray spectroscopy (EDS) line scan madeon a thin lamella fabricated by FIB-milled cross section of thesolar cell shows the relevant elements of the perovskite throughthe whole device structure (Figure 2). Iodine, bromine, and leadcan be found from the top to the bottom layers. The iodide con-centration is higher than the bromide as indicated by the EDSwhich supports the studied perovskite composition. This indi-cates that in order for the solar cell to operate efficiently, full pen-etration of the perovskite is necessary. Therefore, we can assumethat in the case of low PV parameters incomplete penetration ofthe perovskite might be the reason.
To get better understanding of the PV mechanism of thissolar cell structure fabricated at various dipping times, CEand IMVS measurements were carried out. CE measurementscan shed light on the rate of recombination in our devices. TheCE measurement is conducted under open-circuit conditions,
Figure 2. EDS measurements of a cross-sectional lamella of the cell madeby FIB milling. The various elements are indicated in different colors in thefigure.
Table 1. PV parameters of cells fabricated with different dipping times. In brackets is the average values of 30 cells, the values outside the brackets are ofthe champion cell for each fabrication process.
Dipping time VOC [V] Jsc [mA cm�2] FF [%] Eff [%]
5 0.87 (0.84� 0.06) 16.4 (11.2� 3.9) 56.2 (60� 3) 8.0 (5.6� 2.0)
20 0.93 (0.91� 0.04) 23.6 (22.8� 0.9) 68 (64� 3) 15.01 (13.3� 0.8)
45 0.90 (0.89� 0.03) 23.8 (21.0� 2.4) 64.9 (63� 4) 13.94 (11.7� 1.0)
90 0.88 (0.88� 0.04) 20.3 (18.1� 1.8) 65.7 (65� 5) 11.71 (10.4� 0.9)
www.advancedsciencenews.com www.solar-rrl.com
Sol. RRL 2021, 2100028 2100028 (3 of 9) © 2021 Wiley-VCH GmbH
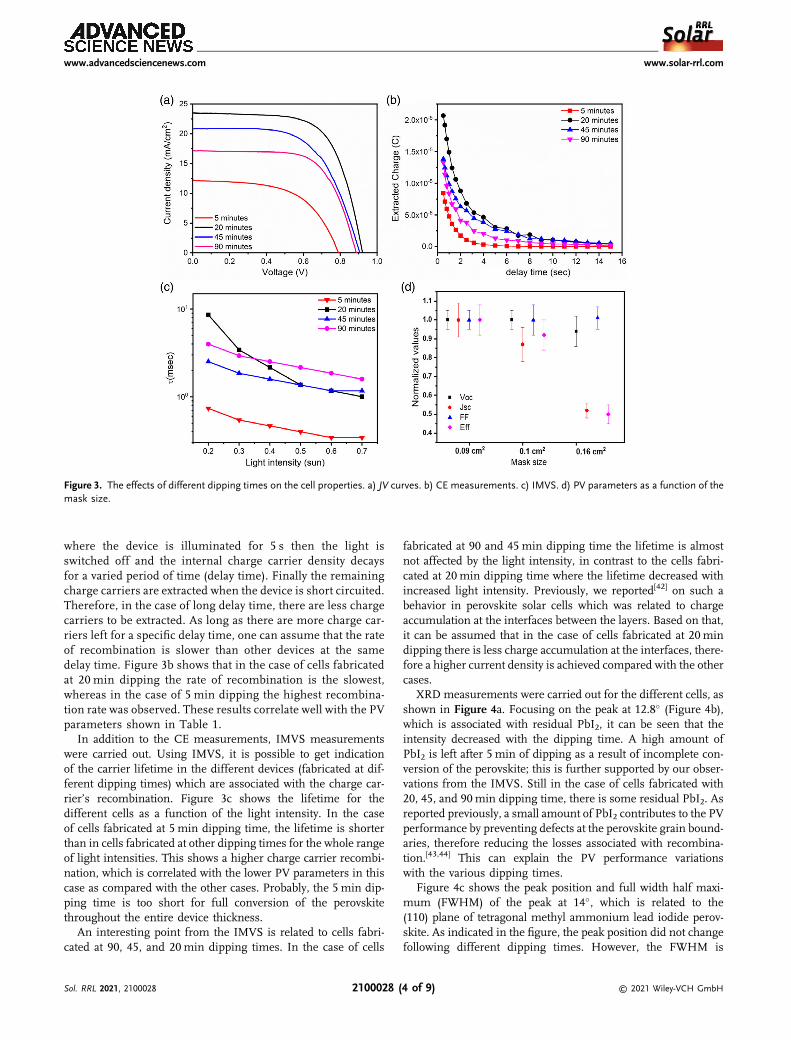
where the device is illuminated for 5 s then the light isswitched off and the internal charge carrier density decaysfor a varied period of time (delay time). Finally the remainingcharge carriers are extracted when the device is short circuited.Therefore, in the case of long delay time, there are less chargecarriers to be extracted. As long as there are more charge car-riers left for a specific delay time, one can assume that the rateof recombination is slower than other devices at the samedelay time. Figure 3b shows that in the case of cells fabricatedat 20 min dipping the rate of recombination is the slowest,whereas in the case of 5 min dipping the highest recombina-tion rate was observed. These results correlate well with the PVparameters shown in Table 1.
In addition to the CE measurements, IMVS measurementswere carried out. Using IMVS, it is possible to get indicationof the carrier lifetime in the different devices (fabricated at dif-ferent dipping times) which are associated with the charge car-rier’s recombination. Figure 3c shows the lifetime for thedifferent cells as a function of the light intensity. In the caseof cells fabricated at 5min dipping time, the lifetime is shorterthan in cells fabricated at other dipping times for the whole rangeof light intensities. This shows a higher charge carrier recombi-nation, which is correlated with the lower PV parameters in thiscase as compared with the other cases. Probably, the 5min dip-ping time is too short for full conversion of the perovskitethroughout the entire device thickness.
An interesting point from the IMVS is related to cells fabri-cated at 90, 45, and 20min dipping times. In the case of cells
fabricated at 90 and 45min dipping time the lifetime is almostnot affected by the light intensity, in contrast to the cells fabri-cated at 20min dipping time where the lifetime decreased withincreased light intensity. Previously, we reported[42] on such abehavior in perovskite solar cells which was related to chargeaccumulation at the interfaces between the layers. Based on that,it can be assumed that in the case of cells fabricated at 20mindipping there is less charge accumulation at the interfaces, there-fore a higher current density is achieved compared with the othercases.
XRD measurements were carried out for the different cells, asshown in Figure 4a. Focusing on the peak at 12.8� (Figure 4b),which is associated with residual PbI2, it can be seen that theintensity decreased with the dipping time. A high amount ofPbI2 is left after 5min of dipping as a result of incomplete con-version of the perovskite; this is further supported by our obser-vations from the IMVS. Still in the case of cells fabricated with20, 45, and 90min dipping time, there is some residual PbI2. Asreported previously, a small amount of PbI2 contributes to the PVperformance by preventing defects at the perovskite grain bound-aries, therefore reducing the losses associated with recombina-tion.[43,44] This can explain the PV performance variationswith the various dipping times.
Figure 4c shows the peak position and full width half maxi-mum (FWHM) of the peak at 14�, which is related to the(110) plane of tetragonal methyl ammonium lead iodide perov-skite. As indicated in the figure, the peak position did not changefollowing different dipping times. However, the FWHM is
Figure 3. The effects of different dipping times on the cell properties. a) JV curves. b) CE measurements. c) IMVS. d) PV parameters as a function of themask size.
www.advancedsciencenews.com www.solar-rrl.com
Sol. RRL 2021, 2100028 2100028 (4 of 9) © 2021 Wiley-VCH GmbH

Figure 4. a) XRD measurements of cells fabricated at different dipping times. The graphite peak is very intense; therefore, it was shortcut at the end.b) Magnification of the PbI2 XRD peak at �12.8�. c) Peak position and the FWHM for the 14� peak as a function of the dipping time.
Figure 5. Variation of normalized PV parameters (averaged for four devices) under 1 sun illumination at MPP tracking under nitrogen environmentfollowed by recovery in the dark for 1 day.
www.advancedsciencenews.com www.solar-rrl.com
Sol. RRL 2021, 2100028 2100028 (5 of 9) © 2021 Wiley-VCH GmbH

reduced with longer dipping times. The main drop in FWHMoccurs between 5 and 20min. Following longer dipping times,the reduction in the FWHM is more moderate. The reduction inthe FWHM indicates improved crystallinity, which correlateswith the PV performance of these cells.
Stability studies of mC-PSCs were conducted toward under-standing intrinsic perovskite stability, degradation, and recoveryphenomena, at the absence of metal contact-induced degrada-tion. The stability measurements were carried out outdoor undernatural 1 sun illumination using MPP tracking in sealed N2 envi-ronment or in ambient (Figure 5 and Figure S3, SupportingInformation). JV curves were measured 6 times during 3 h ofstressing, followed by 1-day recovery in the dark. Figure 5 showsthat all the PV parameters decreased after three outdoor exposurehours at MPP, with a PCE average decrease to �65% of its initialvalue. This relatively fast degradation is attributed to the type ofperovskite used as absorber herein, MA0.15FA0.85Pb(I0.85Br0.15)3,as it is not stabilized by Cs addition.[45] The PCE decrease is cor-related with the decrease in Jsc, which is the most significantlyaffected PV parameter (Figure 5), probably indicating initialperovskite intrinsic degradation. Indeed, variations of the perov-skite-related XRD peaks show small decrease in peak intensitiesafter 3 h of light exposure (after normalization of all diffracto-grams to the graphite peak intensity, Figure 6b–e). Similar pat-terns in PV parameter variations were observed during airstressing outdoors, though the extent of degradation was much
larger after 3 stressing hours: PCE decreased to about 25% andJsc decreased to �30% of their initial values (Figure S3,Supporting Information).
However, our main interest was in the outstanding recoverydemonstrated by all cells within 1 day in the dark (Figure 3and 5). Figure 5 shows that the efficiency of cells stressed inN2 recovered to 94% of its initial value, the Voc recovered to98% of its initial value, the FF recovered to 95% of its initialvalue, where the Jsc recovered completely to its initial value.mC-PSCs stressed in ambient recovered to 65� 15% of their ini-tial PCE and Jsc. The smaller extent of recovery in ambient-stressed cells is probably due to nonreversible perovskite reactionwith humidity and oxygen, which is hampered by the hydropho-bic graphite but not completely eliminated. Indeed, superoxideformation was demonstrated in ambient photostressing ofmC-PSCs, at a slower rate compared with perovskite on meso-porous metal-oxide substrates likely thanks to inhibition of mois-ture penetration by the carbon layer.[46] It was already reportedthat N2-protected mC-PSCs can recover in the dark,[47] however,the mechanism was not studied in details. The almost completerecovery of the PV parameters after 1 day in the dark is uniquefor this cell structure, whereas for a standard perovskite solar cellarchitecture, the extent of recovery is typically more limited, espe-cially at later stages of cell performance degradation.[48] Theimpressive recovery in Jsc hints to intrinsic recovery of theperovskite.
Figure 6. a) XRD of the same cell before illumination, after 3 h of illumination, and after 24 h recovery in the dark. b) Magnification of the peaks at 2θ of26.6� related to graphite peak; c) Magnification of the peaks at 2θ of 14.1� related to perovskite (001) planes; d) Magnification of the peaks at 2θ of 20.0�
related to perovskite (011) planes, and e) Magnification of the peaks at 2θ of 31.8� angle related to perovskite (012) planes. The peak intensities werenormalized with respect to the carbon peak, which was assumed to be constant in all XRD measurements.
www.advancedsciencenews.com www.solar-rrl.com
Sol. RRL 2021, 2100028 2100028 (6 of 9) © 2021 Wiley-VCH GmbH

XRD measurements were carried out before illumination,after 3 h of illumination and after 24 h of recovery in the dark(Figure 6), to study the perovskite structure following stressingand recovery. A shift in perovskite-related peak positions to largerangles is observed, accompanied by peak intensity increase, fol-lowing the recovery stage (Figure 6c–e). A shift of several tenthsof degrees, as observed here, is well above the step size of thetechnique, i.e., its resolution limit. The shift to larger angles indi-cates the contraction of the crystalline unit cell. Such contractionmay be related to relaxed tensile stresses in the perovskite.Indeed, tensile stresses were previously detected in as-processedperovskite films as a result of the thermal treatment during filmfabrication,[49,50] as used also herein. We therefore propose thatpartial perovskite decomposition and recrystallization occurwithin the carbon electrode pores during light exposure and sub-sequent dark recovery, respectively, relieving internal stresses inthe perovskite. We note that ion migration and trap formationwere previously suggested to account for perovskite recovery,[37]
and could not be ruled out. However, it is hard to believe thatsuch mechanisms can account for the observed decrease andsubsequent increase in XRD peak intensities, as well as theobserved changes in the crystalline dimensions. If the contrac-tion in dimensions is to be related to ion out-migration, recoveryshould result in subsequent increase in these dimensions andreturn to the original XRD peak position, which is not observed.
Recrystallization can occur when the perovskite’s componentsare in close proximity to each other,[51,52] and was previouslyshown in mC-PSCs exposed to prolonged humidity-assisted heattreatment.[53] As the solar cell structure is composed of mesopo-rous networks which keep the distance between the perovskitecomponents close even after decomposition, recrystallizationin the pores is feasible. Comparison of the XRD peak intensitiessupports this hypothesis: the perovskite-related peak intensitiesdecrease following degradation and increase during recovery(Figure 6). As internal stresses are known to negatively affectPSC stability,[50] such degradation–recovery cycles inducingstress relief may contribute to improved device operational sta-bility. We postulate that this explains the discrepancy betweenfast degradation observed under continuous illumination andrelative stability at outdoor measurements of mC-PSCs describedby De Rossi et al.[47] Our characterization therefore suggests thatdegradation–recrystallization cycles may sometimes be beneficialfor mC-PSC operational stability, and further highlights theimportance of light cycling in PSC stability measurements.[54]
3. Conclusion
In this work, we study two-step perovskite deposition inall-printable mC-PSCs. By modifying the perovskite precursors’concentration and the dipping time, a PCE of 15% was achieved.The dipping time in the perovskite deposition of this solar cellstructure is critical due to its thickness and mesoporous struc-ture. CE and IMVS show a lower recombination rate and longercarrier lifetime for cells fabricated with dipping time of 20min.
An interesting observation was revealed in stability character-ization. The cells showed almost complete recovery in all PVparameters after their degradation in N2, and impressive recov-ery also after degradation in ambient. The close proximity of the
perovskite’s components within the mesoporous carbon struc-ture assist the recovery process in this case, as was observedby XRD measurements. We propose that partial perovskitedecomposition and recrystallization occur within the carbon elec-trode pores during light exposure and subsequent dark recovery,respectively, relieving internal stresses in the perovskite. Asinternal stresses are known to negatively affect PSC stability,such degradation-recovery cycles inducing stress relief may con-tribute to improved device operational stability.
4. Experimental Section
Materials and Solvents: Hellmanex III, titanium diisopopoxidebis(acetylacetonate) (75% wt. in isopropanol), lead iodide (99%),N,N-dimethylformamide (anhydrous 99.8%), and isopropyl alcohol(anhydrous 99.5%) were purchased from Sigma-Aldrich.Formamidinium iodide (FAI), methylammonium bromide (MABr), andTiO2 paste (90T) were purchased from GreatCell Solar Company.Titanium (IV) chloride (TiCl4) was purchased from Wako. Zr-nanoxideZT/SP (46411) was purchased from Solaronix. Ethanol absolute(99.5%) and DMSO (99.7% extra dry) were purchased from AcrosOrganics. A hyperthermic conductive carbon paste was purchased fromFEIMING Chemical Ltd. All perovskite precursors and anhydrous solventswere kept in a nitrogen-filled glovebox.
Device Preparation: A fluorine-doped tin oxide (FTO)-coated glassetched by laser to disconnect the anode and cathode sides was usedas the substrate. The glass substrates were cleaned and sonicated for threecycles of 30min in soap, Hellmanex 1%, and a mix of ethanol and acetonein water. After that, the glass was treated in oxygen plasma for 10min.Next, the substrates were spin coated with a 13.3% solution of titaniumdiisopopoxide bis(acetylacetonate) in ethanol absolute (5000 rpm, 30 s)and annealed on a hot plate (30min, 450 �C). After cooling down, the sub-strates were treated by dipping in a water-based TiCl4 solution (1.6mL TiCl4150mL triple distilled water) and transferred into an oven at 70 �C for 30minand then washed, dried, and annealed at 450 �C for 30min. After coolingagain, TiO2 paste was screen printed using a 130 mesh polymer screenand sintered at 500 �C for 30min on a hot plate. Then, the same processof TiCl4 treatment was repeated. Next, ZrO2 paste was screen printed usinga 130 mesh polymer screen and sintered (500 �C, 30min). The carbonpaste was screen printed using a 43 mesh polymer screen and sintered(500 �C, 30min). Cell data presented in the Supporting Information wascalculated from 12 devices with a single pixel in each device.
Perovskite Deposition: The substrates were then moved into a nitrogenglovebox. A 2 M solution of PbI2 and PbBr2 at ratio of 85:15 in a DMF:DMSO (85:15) mixture was prepared. About 2 μL of the solution wasdrop-casted onto the substrate active area, and annealed on a 70 �Cfor 30min. The substrates were then dipped in a 0.06 M solution ofFAI:MABr at a ratio of 85:15 in isopropyl alcohol for different times from5 to 90min, and then dipped in clean isopropyl alcohol for 5 s. Finally, thecells were annealed on a hot plate (70 �C) for 2 h.
PV Characterization: JV curves and standard PV properties wereobtained using a Newport solar simulator system consisting of anOriel I–V test station using an Oriel Sol3A simulator. The solar simulatorwas class AAA for spectral performance, uniformity of irradiance, and tem-poral stability. It is equipped with a 450W xenon lamp. The output powerwas adjusted to match AM1.5 global sunlight (100mW cm�2). The spec-tral match classifications were IEC60904-9 2007, JIC C 8912, and ASTME927-05. J–V curves were obtained by applying a varying external biason the cell and measuring the generated photocurrent with a Keithleymodel 2400 digital source meter. The bias voltage was scanned from 1to �0.1 V in steps of 10 mV with a dwell time of 40ms at each step.The PV performance was measured using a mask with a window areaof 0.085 cm2. A silicon reference cell was used to calibrate the solar simu-lator. All PV measurements were carried out under ambient conditions inthe air.
www.advancedsciencenews.com www.solar-rrl.com
Sol. RRL 2021, 2100028 2100028 (7 of 9) © 2021 Wiley-VCH GmbH

CE and IMVS: CE and IMVS were measured using Autolab Potentiostat-Galvanostat (PGSTAT) with a FRA32M LED driver equipped with a coolwhite light source. A Nova 2.1 software program was used to collectand analyze the obtained data. The CE measurement parameters usedwere as follows—discharge time of 2 s, illumination time of 5 s, delaytimes measured were 0.5, 0.6, 0.8, 1, 1.3, 1.61, 2, 2.5, 3.2, 4, 5, 6, 7, 8,9, 10, 11, 12, 13, 14, and 15 s. The IMVS measurements were conductedby illuminating the sample at different light intensities, varying from 0.1 to0.7 sun, with a sinusoidal wave modulation, with frequencies rangingfrom 1Hz to 50 kHz. Lifetimes were calculated using the formula:τ¼ 1/(2π·frequency at a minimum of semicircle).
XRD: First, powder XRD characterization was measured on the fulldevices fabricated at the four different dipping times. The second charac-terization was measured on the same device in three stages—fresh, after3 h illumination (Oriel Sol3A simulator) at open circuit, and after 1-dayrecovery in the dark. During that time, the device was kept under nitrogenenvironment, excluding the time of the XRD measurements. Immediatelyafter each stage the device was taken for XRDmeasurements. All measure-ments were carried out using a D8 Advance diffractometer (Bruker AXS,Karlsruhe, Germany). The diffractometer was operated in grazing inci-dence X-ray diffraction (GIXRD) mode with a grazing incidence angle valueof 2.5�. The diffractometer was equipped with a 217.5mm radius goniom-eter, a secondary graphite monochromator, 2� Soller slits, and a 0.2mmreceiving slit. XRD patterns were recorded using Cu Kα radiation (l 1/41.5418�A) with a tube voltage of 40 kV and a tube current of 40 mA. Astep-scan mode was used with a step size of 0.02� 2θ, and a countingtime of between 1 and 3 s per step. Measurements were carried out atroom temperature.
Stability Measurements: All outdoor exposure experiments wereconducted during clear sky day (10:00 a.m. to 14:00 p.m.) in SedeBoqer, Israel (latitude, 30.8�N; longitude, 34.8�E; altitude, 475m). Thesunlight spectrum measured in the daytime at Sede Boqer was very closeto the AM1.5G spectrum.[50] The cells used for stability studies were fab-ricated using the optimized procedure described above, with 20min dip-ping. Some of the cells were sealed in an environmental box in theglovebox then the cells were exposed in outdoor natural sunlight throughthe glass substrate in N2 environment. After the required time interval ofexposure, the cells were taken inside the lab, the box opened, and J–Vmea-sured in air. After the measurements, the box and cells were taken into theglovebox again and sealed in the glovebox and the process was repeated.Recovery occurred during dark storage under N2. Ambient-exposed cellswere measured similarly without the box, and recovery occurred duringstorage in indoor lab ambient.
Supporting InformationSupporting Information is available from the Wiley Online Library or fromthe author.
AcknowledgementsL.E. thanks the Ministry of Energy and the Israel Science Foundation (grantno. 2552/17) for the financial support for this project. C.S.P. gratefullyacknowledges support from BGU’s Kreitman post-doctoral fellowship.This research was also supported by the Israel Science Foundation (grantno. 71/1271). L.E. and I.V-F. gratefully acknowledge support by Israel’sMinistry of Energy (grant no. 215-11-037).
Conflict of InterestThe authors declare no conflict of interest.
Data Availability StatementResearch data are not shared.
Keywordsdipping times, mesoporous carbon cells, perovskites, stabilities, two-stepdeposition
Received: January 11, 2021Published online:
[1] T. Miyasaka, A. Kojima, K. Teshima, Y. Shirai, J. Am. Chem. Soc. 2009,131, 6050.
[2] D. B. Mitzi, Inorg. Chem. 2000, 39, 6107.[3] M. M. Lee, J. Teuscher, T. Miyasaka, T. N. Murakami, H. J. Snaith,
Science 2012, 338, 643.[4] C. Roldán-Carmona, O. Malinkiewicz, R. Betancur, G. Longo,
C. Momblona, F. Jaramillo, L. Camacho, H. J. Bolink, EnergyEnviron. Sci. 2014, 7, 2968.
[5] S. D. Stranks, G. E. Eperon, G. Grancini, C. Menelaou, M. J. Alcocer,T. Leijtens, L. M. Herz, A. Petrozza, H. J. Snaith, Science 2013, 342,341.
[6] A. M. Leguy, P. Azarhoosh, M. I. Alonso, M. Campoy-Quiles,O. J. Weber, J. Yao, D. Bryant, M. T. Weller, J. Nelson, A. Walsh,M. Van Schilfgaarde, Nanoscale 2016, 8, 6317.
[7] M. Liu, M. B. Johnston, H. J. Snaith, Nature 2013, 501, 395.[8] J. Y. Jeng, Y. F. Chiang, M. H. Lee, S. R. Peng, T. F. Guo, P. Chen,
T. C. Wen, Adv. Mater. 2013, 25, 3727.[9] L. Etgar, P. Gao, Z. Xue, Q. Peng, A. K. Chandiran, B. Liu,
M. K. Nazeeruddin, M. Grätzel, J. Am. Chem. Soc. 2012, 134, 17396.[10] Z. Ku, Y. Rong, M. Xu, T. Liu, H. Han, Sci. Rep. 2013, 3, 1.[11] Y. Rong, Y. Hu, A. Mei, H. Tan, M. I. Saidaminov, S. I. Seok,
M. D. McGehee, E. H. Sargent, H. Han, Science 2018, 6408, 361.[12] C. C. Boyd, R. Cheacharoen, K. A. Bush, R. Prasanna, T. Leijtens,
M. D. McGehee, ACS Energy Lett. 2018, 3, 1772.[13] K. Domanski, J. P. Correa-Baena, N. Mine, M. K. Nazeeruddin,
A. Abate, M. Saliba, W. Tress, A. Hagfeldt, M. Grätzel, ACS Nano2016, 10, 6306.
[14] S. He, L. Qiu, L. K. Ono, Y. Qi, Mater. Sci. Eng. R: Rep. 2020, 140,100545.
[15] S. G. Hashmi, A. Tiihonen, D. Martineau, M. Ozkan, P. Vivo,K. Kaunisto, V. Ulla, S. M. Zakeeruddin, M. Grätzel, J. Mater.Chem. A 2017, 5, 4797.
[16] X. Li, M. Tschumi, H. Han, S. S. Babkair, R. A. Alzubaydi, A. A. Ansari,S. S. Habib, M. K. Nazeeruddin, S. M. Zakeeruddin, M. Grätzel,Energy Technol. 2015, 3, 551.
[17] Y. Hu, S. Si, A. Mei, Y. Rong, H. Liu, X. Li, H. Han, Sol. RRL 2017, 1,1600019.
[18] G. Grancini, C. Roldán-Carmona, I. Zimmermann, E. Mosconi, X. Lee,D. Martineau, S. Narbey, F. Oswald, F. De Angelis, M. Graetzel,M. K. Nazeeruddin, Nat. Commun. 2017, 8, 1.
[19] Q. Wang, W. Zhang, Z. Zhang, S. Liu, J. Wu, Y. Guan, A. Mei, Y. Rong,Y. Hu, H. Han, Adv. Energy Mater. 2020, 10, 1.
[20] J. Wu, W. Zhang, Q. Wang, S. Liu, J. Du, A. Mei, Y. Rong, Y. Hu,H. Han, J. Mater. Chem. A 2020, 8, 11148.
[21] A. Mei, X. Li, L. Liu, Z. Ku, T. Liu, Y. Rong, M. Xu, M. Hu, J. Chen,Y. Yang, M. Grätzel, Science 2014, 345, 295.
[22] Y. Hu, Z. Zhang, A. Mei, Y. Jiang, X. Hou, Q. Wang, K. Du, Y. Rong,Y. Zhou, G. Xu, H. Han, Adv. Mater. 2018, 30, 1.
www.advancedsciencenews.com www.solar-rrl.com
Sol. RRL 2021, 2100028 2100028 (8 of 9) © 2021 Wiley-VCH GmbH

[23] X. Hou, M. Xu, C. Tong, W. Ji, Z. Fu, Z. Wan, F. Hao, Y. Ming, S. Liu,Y. Hu, H. Han, J. Power Sources 2019, 415, 105.
[24] J. Chen, Y. Xiong, Y. Rong, A. Mei, Y. Sheng, P. Jiang, Y. Hu, X. Li,H. Han, Nano Energy 2016, 27, 130.
[25] K. Liang, D. B. Mitzi, M. T. Prikas, Chem. Mater. 1998, 10, 403.[26] J. Burschka, N. Pellet, S. J. Moon, R. Humphry-Baker, P. Gao,
M. K. Nazeeruddin, M. Grätzel, Nature 2013, 499, 316.[27] S. G. Hashmi, D. Martineau, X. Li, M. Ozkan, A. Tiihonen, M. I. Dar,
T. Sarikka, S. M. Zakeeruddin, J. Paltakari, P. D. Lund, M. Grätzel, Adv.Mater. Technol. 2017, 2, 1600183.
[28] A. Schneider, S. Alon, L. Etgar, Energy Technol. 2019, 7, 1900481.[29] H. Min, L. Linfeng, M. Anyi, Y. Ying, L. Tongfa, H. Hongwei, J. Mater.
Chem. A 2014, 2, 17115.[30] H. Abdy, Z. Heydari, A. Aletayeb, M. Kolahdouz, E. Asl-Soleimani,
J. Mater. Sci.: Mater. Electron. 2020.[31] M. Wang, Y. Feng, J. Bian, H. Liu, Y. Shi, Chem. Phys. Lett. 2017, 692.[32] X. Duan, X. Li, L. Tan, Z. Huang, J. Yang, G. Liu, Z. Lin, Y. Chen, Adv.
Mater. 2020, 32, 2000617.[33] L. Qiu, J. Zou, W. Chen, L. Dong, D. Mei, L. Song, J. Wang, P. Jiang,
P. Du, J. Xiong, Sustainable Energy Fuels 2021, 5, 469.[34] B. Li, J. Shi, J. Lu, W. L. Tan, W. Yin, J. Sun, L. Jiang, R. T. Jones,
P. Pigram, C. R. McNeill, Y. Cheng, J. J. Jasieniak, ACS Appl.Energy Mater. 2020, 3, 3358.
[35] S. Shahbazi, M. Li, A. Fathi, E. W. Diau, ACS Energy Lett. 2020, 5, 2508.[36] S. Wang, W. Shen, Y. Chu, W. Zhang, L. Hong, A. Mei, Y. Rong,
Y. Tang, Y. Hu, H. Han, J. Phys. Chem. Lett. 2020, 11, 9689.[37] N. J. Jeon, J. H. Noh, W. S. Yang, Y. C. Kim, S. Ryu, J. Seo, S. I. Seok,
Nature 2015, 517, 476.[38] P. Gratia, G. Grancini, J. N. Audinot, X. Jeanbourquin, E. Mosconi,
I. Zimmermann, D. Dowsett, Y. Lee, M. Grätzel, F. De Angelis,K. K. Sivula, J. Am. Chem. Soc. 2016, 138, 15821.
[39] H. F. Zarick, N. Soetan, W. R. Erwin, R. Bardhan, J. Mater. Chem. A2018, 5507.
[40] E. Mosconi, A. Amat, M. K. Nazeeruddin, M. Grätzel, F. De Angelis,J. Phys. Chem. C 2013, 117, 13902.
[41] Y. Galagan, E. W. C. Coenen, W. J. H. Verhees, R. Andriessen,J. Mater. Chem. A 2016, 4, 5700.
[42] E. Avigad, L. Etgar, ACS Energy Lett. 2018, 3, 2240.[43] Y. C. Kim, N. J. Jeon, J. H. Noh, W. S. Yang, J. Seo, J. S. Yun,
A. Ho-Baillie, S. Huang, M. A. Green, J. Seidel, T. K. Ahn, Adv.Energy Mater. 2016, 6, 1502104.
[44] B. W. Park, N. Kedem, M. Kulbak, W. S. Yang, N. J. Jeon, J. Seo,G. Kim, K. J. Kim, T. J. Shin, G. Hodes, D. Cahen, Nat. Commun.2018, 9, 1.
[45] M. Saliba, T. Matsui, J. Y. Seo, K. Domanski, J. P. Correa-Baena,M. K. Nazeeruddin, S. M. Zakeeruddin, W. Tress, A. Abate,A. Hagfeldt, M. Grätzel, Energy Environ. Sci. 2016, 9, 1989.
[46] E. V. Péan, C. S. De Castro, S. Dimitrov, F. De Rossi, S. Meroni,J. Baker, T. Watson, M. L. Davies, Adv. Funct. Mater. 2020, 30,1909839.
[47] F. De Rossi, J. Barbé, D. M. Tanenbaum, L. Cinà, L. A. Castriotta,V. Stoichkov, Z. Wei, W. C. Tsoi, J. Kettle, A. Sadula, J. Chircop,Energy Technol. 2020, 8, 2000134.
[48] M. V. Khenkin, A. KM, I. Visoly-Fisher, S. Kolusheva, Y. Galagan,F. Di Giacomo, O. Vukovic, B. R. Patil, G. Sherafatipour,V. Turkovic, H. G. Rubahn, ACS Appl. Energy Mater. 2018, 1, 799.
[49] C. Zhu, X. Niu, Y. Fu, N. Li, C. Hu, Y. Chen, X. He, G. Na, P. Liu,H. Zai, Y. Ge, Nat. Commun. 2019, 10, 1.
[50] N. Rolston, K. A. Bush, A. D. Printz, A. Gold-Parker, Y. Ding,M. F. Toney, M. D. McGehee, R. H. Dauskardt, Adv. Energy Mater.2018, 8, 1802139.
[51] Y. Rakita, I. Lubomirsky, D. Cahen, Mater. Horizons 2019, 6,1297.
[52] D. R. Ceratti, Y. Rakita, L. Cremonesi, R. Tenne, V. Kalchenko,M. Elbaum, D. Oron, M. A. C. Potenza, G. Hodes, D. Cahen, Adv.Mater. 2018, 30, 1706273.
[53] S. G. Hashmi, D. Martineau, M. I. Dar, T. T. Myllymäki, T. Sarikka,V. Ulla, S. M. Zakeeruddin, M. Grätzel, J. Mater. Chem. A 2017, 5,12060.
[54] M. V. Khenkin, E. A. Katz, A. Abate, G. Bardizza, J. J. Berry, C. Brabec,F. Brunetti, V. Bulovic, Q. Burlingame, A. Di Carlo, R. Cheacharoen,Nat. Energy 2020, 5, 35.
[55] D. Berman, D. Faiman, Sol. Energy Mater. Sol. Cells 1997,45, 401.
www.advancedsciencenews.com www.solar-rrl.com
Sol. RRL 2021, 2100028 2100028 (9 of 9) © 2021 Wiley-VCH GmbH