Phase Two of the 10-Year Vision 2018 – 2027 INVESTMENT PLAN
112
APPROVED JUNE 28, 2018 tenyearvision.translink.ca Phase Two of the 10-Year Vision 2018 – 2027 INVESTMENT PLAN
Transcript of Phase Two of the 10-Year Vision 2018 – 2027 INVESTMENT PLAN

APPROVED JUNE 28, 2018
tenyearvision.translink.ca
Phase Two of the 10-Year Vision
2018 – 2027 INVESTMENT PLAN


TRANSLINK BOARD OF DIRECTORS
Lorraine Cunningham, Chair
Larry Beasley
Jim Chu
Sarah Clark
Derek Corrigan Mayor, City of Burnaby
Murray Dinwoodie
Anne Giardini
Tony Gugliotta
Karen Horcher
Marcella Szel
Richard Walton Mayor, District of North Vancouver
MAYORS’ COUNCIL ON REGIONAL TRANSPORTATION
Derek Corrigan, Chair Mayor, City of Burnaby
Richard Walton, Vice-chair Mayor, District of North Vancouver
Wayne Baldwin Mayor, City of White Rock
John Becker Mayor, City of Pitt Meadows
Malcom Brodie Mayor, City of Richmond
Karl Buhr Mayor, Village of Lions Bay
Mike Clay Mayor, City of Port Moody
Jonathan Coté Mayor, City of New Westminster
Ralph Drew Mayor, Village of Belcarra
Jack Froese Mayor, Township of Langley
Maria Harris Director, Electoral Area ‘A’
Linda Hepner Mayor, City of Surrey
Lois Jackson Mayor, City of Delta
Greg Moore Mayor, City of Port Coquitlam
John McEwen Mayor, Village of Anmore
Darrell Mussatto Mayor, City of North Vancouver
Nicole Read Mayor, District of Maple Ridge
Gregor Robertson Mayor, City of Vancouver
Ted Schaffer Mayor, City of Langley
Murray Skeels Mayor, Bowen Island Municipality
Michael Smith Mayor, District of West Vancouver
Richard Stewart Mayor, City of Coquitlam
Bryce Williams Chief, Tsawwassen First Nation
For the purpose of the South Coast British Columbia Transportation Authority Act, this document constitutes
the investment plan prepared in 2017 and 2018 for the 2018-27 period. This document will serve as TransLink’s
strategic and financial plan beginning July 1, 2018, until a replacement investment plan is approved.
ii. 2018 – 2027 INVESTMENT PLAN
ABOUT TRANSLINK
The South Coast British Columbia Transportation
Authority (TransLink) is Metro Vancouver’s regional
transportation authority. TransLink is responsible
for planning, financing, and managing the regional
transportation system to move people and goods.
TransLink operates and maintains regional transit
service and infrastructure, including bus, SkyTrain,
SeaBus, HandyDART and West Coast Express, with the
assistance of its operating subsidiaries and contractors.
TransLink also owns and maintains five of the region’s
bridges and shares responsibility for major regional
roads and walking and cycling infrastructure with local
governments. TransLink is the first transportation
authority in North America to be responsible for
planning, financing, and managing all public transit in
addition to major regional roads, bridges, and cycling
infrastructure.
ABOUT INVESTMENT PLANS
This investment plan, known as the “Phase Two Plan”,
outlines TransLink revenues, expenditures, services,
and initiatives for the years 2018 to 2027 (the Plan
period). Over the course of 2017 and 2018, the TransLink
Board of Directors and Mayors’ Council on Regional
Transportation worked collaboratively with the region’s
local governments and other partner agencies to guide the
development of this investment plan.
The South Coast British Columbia Transportation Authority
Act (SCBCTA Act) requires TransLink to develop an
investment plan that identifies planned transportation
services, initiatives, and capital investments for the
next ten years. In each year, planned expenditures must
balance against established funding, revenues, and
borrowing limits. The SCBCTA Act requires that TransLink
updates its investment plan every three years or more
frequently.
The TransLink Board of Directors is responsible for
preparing the investment plan, and provides it to
the Mayors’ Council on Regional Transportation for
approval. After both governing bodies have approved the
investment plan, it serves as TransLink’s strategic and
financial plan for the Plan period.
CAUTION REGARDING FORWARD-LOOKING STATEMENTS
From time to time, TransLink makes written and/or oral forward-looking statements, including in this document and in other communications. In addition, representatives of TransLink may make forward-looking statements orally to analysts, investors, the media, and others.
Forward-looking statements, by their nature, require TransLink to make assumptions and are subject to inherent risk and uncertainties. In light of the uncertainty related to the financial, economy, and regulatory environments, such risks and uncertainties, many of which are beyond TransLink’s control, and the effects of which can be difficult to predict, may cause actual results to differ materially from the expectations expressed in the forward-looking statements.
WHAT IS METRO VANCOUVER?
Under the SCBCTA Act, TransLink’s
service region includes all of the
areas located in the Metro Vancouver
Regional District, namely 21
municipalities, one electoral area,
and one Treaty First Nation. Together,
these areas are often referred to as
“Metro Vancouver”.

iii. 2018 – 2027 INVESTMENT PLAN
PHASE TWO PLAN EXECUTIVE SUMMARY
Transportation is one of the most pressing issues affecting quality of life and the economy in
Metro Vancouver. To address the transportation challenges of our region, the Mayors’ Council on
Regional Transportation developed a 10-Year Vision of the new transportation investments needed
to keep our region moving over the next decade. These transportation investments will not only
improve mobility for residents, but also make progress towards the broader social, economic, and
environmental goals of our region’s long-term transportation and regional growth strategies
In 2016, the TransLink Board and Mayors’ Council approved the Phase One Plan, which funded
the first phase of transportation improvements in the 10-Year Vision. The Phase One Plan included
improvements to the transit system to reduce overcrowding and increase service quality so that
people could travel across the region more quickly and conveniently. The Phase One Plan also
provided new funding for roads, cycling, and walking infrastructure and project development for
rapid transit expansion.
Building on the success and momentum of the Phase One Plan, the TransLink Board and Mayors’
Council is proceeding with the Phase Two Plan, which funds the second phase of transportation
improvements in the 10-Year Vision. The Phase Two Plan is an historic investment in transportation
infrastructure and transit service in this region and will transform how people travel. The time is now
to invest in our transportation system so that people across the region will have more convenient
and sustainable transportation options, increased access to work and education opportunities, and
improved quality of life in their communities.

iv. 2018 – 2027 INVESTMENT PLAN
HIGHLIGHTS OF THE PHASE TWO PLAN
The Phase Two Plan funds the second phase of transportation improvements in the 10-Year
Vision, including:
• construction and operation of the Surrey-Newton-Guildford Line (Light Rail Transit)
• construction and operation of the Millennium Line Broadway Extension
• modernization of Expo-Millennium Line infrastructure, including significant capacity and
reliability upgrades to systems and stations, and additional SkyTrain cars for the Expo and
Millennium lines to increase capacity and accommodate growth
• project development and potential early works for the Surrey-Langley Line (Light Rail Transit)
• a 7% increase in HandyDART service, 8% increase in bus service and 42% increase in rail
service across the region
• two new B-Line routes, as well as transit priority and enhanced passenger amenities on
other new B-Lines from the 10-Year Vision
• new funding to municipalities for upgrades to walking and cycling infrastructure, such as
sidewalks and bikeways
• new funding to municipalities for upgrades to major roads, including seismic upgrades
• planning for a potential gondola to SFU Burnaby campus and rapid transit to UBC Point Grey
campus

FUNDING THE PHASE TWO PLAN
New, sustainable funding sources are required in order for our region to build and operate the
transportation infrastructure that people will need both today and in the future.
A partnership between all levels of government
The Phase Two Plan includes funding from all levels of government: federal, provincial, and regional.
The Government of Canada and Government of British Columbia have committed an unprecedented amount
of funding to cost-share the new transportation investments in the Phase Two Plan. TransLink has requested:
• $2.0 billion from the Government of Canada for the capital costs of Phase Two projects, and
• $2.5 billion from the Government of British Columbia for their commitment to contribute 40%
of the capital costs of Phase Two projects.
With the availability of this new federal and provincial funding, the region has a chance to improve
the transportation system at a significantly reduced burden to local taxpayers.
A balanced approach to regional funding
To complete the regional share, the Mayors’ Council proposes the following changes to regional
funding for transportation:
• Transit fare increase: an increase to transit fares in 2020 and 2021 (10 to 15 cents on a single
fare, 50 cents to $1 on a monthly pass), in addition to increases approved in the Phase One Plan.
• Property tax increase: an increase to property taxes beginning in 2019, estimated at $5.50 per
average household.
• Development cost charge (DCC): an increase in annual revenues generated by the Development
Cost Charge (DCC) for transit, with fee coming into effect in 2020.
• Commercial revenues: collection of new commercial revenues (retail, filming, fibre optics) around
SkyTrain infrastructure.
• Parking tax increase: a 3 percentage point increase to the parking tax beginning in 2019, pending
provincial legislation.
• New regional funding capacity of $30 million per year to be enabled by the Province. The Government
of British Columbia has committed to introducing legislation to increase the cap on the regional motor
fuel tax to 18.5 cents per litre to enable TransLink to increase the motor fuel tax by spring 2019.
The proposed changes are intended to be modest and balanced across Metro Vancouver residents, workers
and visitors. The changes would affect transit users, drivers, property owners, and real estate developers.
The revenue from the proposed changes would fund approximately 8.6% of the total new expenditures in the
Phase Two Plan, or an average of $73 million annually beginning in 2019.
v. 2018 – 2027 INVESTMENT PLAN

vi. 2018 – 2027 INVESTMENT PLAN
CONSULTATION ON THE PHASE TWO PLAN
TransLink received comments on the Plan through various public and stakeholder consultation
activities, and by working closely with municipal and provincial partners and elected officials. Over
900 people attended the open houses, and more than 2,700 questionnaires were completed. In
addition to the public consultation questionnaire, an independent research survey of a random
sample of 2,000 Metro Vancouver adults was conducted by the external polling group, NRG.
Throughout the development of the Phase Two Plan TransLink also consulted separately on Phase
One B-Lines, Area Transport Plans, Transit Fare Review, and the major rapid transit projects.
During the public and stakeholder consultation period for the Phase Two Plan, Metro Vancouver
residents expressed general support for the new transit and transportation improvements and
funding sources.
OUTCOMES OF THE PHASE TWO PLAN
As a result of the investments in the Phase Two Plan, transit ridership is forecast to increase from
248 million journeys in 2017 to 316 million journeys in 2027. By 2027, people in the region
will make an estimated 42 million more journeys per year by transit than they would without the
Phase Two Plan investments. These increases in transit ridership will enable the region to make
progress towards:
• Regional Growth Strategy and Regional Transportation Strategy objectives, including making
half of all trips in this region by walking, cycling, and transit; and reducing the distances
driven in this region by one-third,
• Meeting demand for transportation resulting from anticipated population growth in, and
economic development of, the region,
• Provincial and regional environmental objectives, including air quality and greenhouse gas
emission reduction objectives, and
• Provincial transportation and economic objectives.
2017 RIDERSHIP ACTUAL
2018 RIDERSHIP FORECAST
2027 RIDERSHIP FORECAST WITHOUT PHASE TWO
2027 RIDERSHIP FORECAST WITH PHASE TWO
247.8 million 251.7 million 274.1 million 316.3 million

FUTURE INVESTMENT PLANS
While the Phase Two Plan is an unprecedented level of transit expansion in the history of our region,
it does not include all of the projects in the entire 10-Year Vision. To complete the 10-Year Vision,
TransLink passed the Phase One Plan which funded 10-Year Vision expansion projects primarily for
the years 2017, 2018 and 2019. This Phase Two Plan would fund 10-Year Vision expansion projects
primarily for the years 2020 and 2021.
TransLink anticipates developing a Phase Three Plan in the coming years, which would fund
10-Year Vision expansion projects for the remaining years of 2022-2026. This would include all
the remaining bus, rail, walking, cycling, and road improvements in the 10-Year Vision, including
construction and operation of the Surrey-Langley Line.
2017 2018 2019 2020 2021 2022 2023 2024 2025 2026 2027 2028 2029 2030
2017 INVESTMENT PLAN PHASE 1
2018 INVESTMENT PLAN PHASE 2
2020 INVESTMENT PLAN PHASE 3
vii. 2018 – 2027 INVESTMENT PLAN

WHAT IS THE MAYORS’ COUNCIL ON REGIONAL TRANSPORTATION?
TransLink’s 23-member Mayors’ Council on Regional Transportation is made up of representatives from each of the 21
municipalities within the transportation service region, as well as Electoral Area ‘A’ (which includes the University of
British Columbia and the University Endowment Lands) and the Tsawwassen First Nation. Together, members of the
Mayors’ Council collectively represent the viewpoints and interests of the citizens of the Metro Vancouver region as they
develop and approve TransLink’s investment plans and long-term strategies.
THE 10-YEAR VISION
Metro Vancouver is one of Canada’s most diverse and livable regions. As the population and economy have grown over
the last decade, however, demand for public transit has surged and traffic congestion on our roads has worsened. At
the same time, the funding sources available for TransLink to maintain and expand the transit system and major road
network – transit fares, property tax, and fuel sales tax – have not kept up with increased demand for transportation.
To address these challenges, the Mayors’ Council on Regional Transportation outlined priority transportation
improvements for the region in the 10-Year Vision. The 10-Year Vision reflects the consensus of local governments in
Metro Vancouver and has been broadly supported by community, environmental, labour, and business stakeholders.
In 2016, the Mayors’ Council and the Government of British Columbia reached a funding agreement for Phase One of
the 10-Year Vision. In collaboration with the Government of British Columbia, the Mayors’ Council has now reached a
funding agreement to advance Phase Two of the 10-Year Vision.

LOOKING AHEAD – THE REGIONAL TRANSPORTATION STRATEGY
While we work to fund the remaining
investments of the 10-Year Vision, we are
also starting to consider the transportation
investments and policies that our region will
need in the medium- to long-term after the 10-
Year Vision is completed.
The Regional Transportation Strategy (RTS) is
the 30-year strategy for the region’s multimodal
transportation system. The projects and
investments in the 10-Year Vision were designed
to help achieve the goals and policies of the
RTS, including: making half of all trips in this
region by walking, cycling, and transit; and
reducing the distances driven in this region by
one-third.
TransLink updates the RTS every five years, as
required by provincial legislation. The RTS will
identify key priorities for what comes after the
10-Year Vision is completed.
WHAT ABOUT PHASE ONE OF THE 10-YEAR VISION?
In just one year, TransLink has already delivered many
of the transportation improvements in the Phase One
Plan, including the largest increase in transit service in
this region since 2010. Highlights from 2016 and 2017
include:
• More frequent service or other improvements on
more than 60 different bus routes, including new
bus service in Burke Mountain, Clayton Heights,
Morgan Creek, and Silver Valley, as well as the new
95 B-Line on Hastings Street
• 85,000 additional trips available on HandyDART
• Increased service on the Expo Line, Millennium
Line, and Canada Line
• More SeaBus service to provide sailings every 15
minutes, every day of the week
• $13 million awarded to municipalities for
improvements to major roads
• $10 million awarded to municipalities for
improvements to walking and cycling infrastructure
Along with the opening of the Evergreen Extension,
this led to 407 million transit boardings in 2017 – the
highest ever in this region. In fact, transit ridership
grew more in Metro Vancouver than any other region in
Canada and the United States in 2017.


TABLE OF CONTENTS
TransLink Board of Directors ............................................................................ i
Mayors' Council on Regional Transportation ..................................................... i
About TransLink ............................................................................................. ii
About investment plans .................................................................................. ii
Phase Two Plan executive summary ............................................................... iii
Highlights of the Phase Two Plan ................................................................ iv
Funding the Phase Two Plan ........................................................................ v
Consultation on the Phase Two Plan ........................................................... vi
Outcomes of the Phase Two Plan ................................................................ vi
Data table ..................................................................................................... vi
Future investment plans ............................................................................... vii
1. NEW TRANSPORTATION INVESTMENTS IN THE PHASE TWO PLAN .......2Building new rapid transit ............................................................................... 5
Upgrading the existing rail network ................................................................. 9
New bus and HandyDART investments .......................................................... 11
New road investments .................................................................................. 13
New cycling investments .............................................................................. 14
New mobility investments ............................................................................ 16
2. MANAGE ....................................................................................................................... 18Make travel safe and secure ......................................................................... 19
Make travel easy and informative .................................................................. 20
Make travel more efficient and reliable.......................................................... 22
Price the transportation system to reduce congestion and overcrowding, improve fairness, and support transportation investment ........ 23
3. PARTNER ...................................................................................................................... 24Align transportation and land use ................................................................. 25
Innovate through new partnerships .............................................................. 27
4. FUNDING THE PHASE TWO PLAN ....................................................................... 2810-Year totals ............................................................................................... 31
What's new in Phase Two .............................................................................. 31
2017 vs. 2027 annual operating expenditures .............................................. 35
Revenue sources .......................................................................................... 36
Capital funding and partner government contributions ................................. 42
Established borrowing limit .......................................................................... 43
5. CONSULTATION ON THE PHASE TWO PLAN .................................................. 44
APPENDICES .................................................................................................................... 48

PHASE TWO OF THE TEN YEAR VISION – INVESTMENT PLAN 2
NEW TRANSPORTATION
INVESTMENTS IN THE PHASE
TWO PLANNOTE: EXCEPT WHERE NOTED OTHERWISE,
ALL FIGURES IN THIS SECTION ARE IN YEAR OF EXPENDITURE DOLLARS.
1

3 PHASE TWO OF THE TEN YEAR VISION – INVESTMENT PLAN
The Phase Two Plan maintains the existing
transportation system in a state of good
repair and makes new investments in every
mode of transportation – transit, roads,
walking, and cycling. These new investments
will accommodate future growth, transform
how people travel in Metro Vancouver and
will deliver infrastructure and services that
have been anticipated in this region for
decades. The Phase Two Plan will be a major
step in meeting our region’s transportation
needs, building on the success of
investments made in the Phase One –
especially as transit ridership continues to
grow at record levels.
ACCESS TRANSIT IMPROVEMENTS
TransLink’s Access Transit program
improves the accessibility and
experience of transit services for people
with disabilities and seniors. The
program is guided by the feedback and
needs of our customers. Access Transit
initiatives in the Plan can be found on
the following pages
NEW SERVICE INVESTMENTS
• HandyDART service – page 11
• Stations, exchange and bus stop
upgrades – page 21
NEW AND ONGOING ACCESS TRANSIT INITIATIVES
• Universally accessible transit
implementation plan – page 21
• Modernize HandyDART
service – page 21
bowenisland
Introduce service to 68th Avenue
Introduce service to East Fraser Heights
Introduce service to East Fraser Lands
Expand service to growing employment area, including Harbourside
Maple Ridge - Pitt Meadows network re-structure
Improved integration with West Coast Express and 2019 Lougheed B-Line
Better access to residential and employment areas
Langley network re-structure
SeaBus sailing to meet the last Canada Line train
vancouver
richmond
delta
surrey
langleytownship
whiterock
mapleridge
pittmeadows
portcoquitlam
burnaby
newwestminster
belcarra
anmore
portmoody
northvancouver
district
westvancouver
lionsbay
coquitlam
dow ntow n
ubc/uel
langleycity
tsawwassenfirst nation
northvancouver
city
electoral area a
Route to be Improved
Phase One B-Line
Increased service to address overcrowding*
*Projects to address overcrowding will be determined based on need closer to the date of implementation. Map is for illustrative purposes only
7% Increase in HandyDART Service
Implementing flexible service (e.g. vanpool and on-demand transit) pilots throughout the region
Proposed Phase Two B-Line (routing subject to further study)
Rail:
Bus:
Other Improvements (not shown on map)
Improved or ExpandedService Areas
Expo Line
Millennium Line
Urban Area
Agricultural Land Reserve, parks & other unpopulated areas
Proposed Millennium LineBroadway Extension
Proposed Surrey - Newton - Guildford Light Rail Transit
SeaBus
West Coast Express
Canada Line
Transit Improvements
Additional Map Elements
Phase Two Planned Transit Improvements

PHASE TWO OF THE TEN YEAR VISION – INVESTMENT PLAN 4
bowenisland
Introduce service to 68th Avenue
Introduce service to East Fraser Heights
Introduce service to East Fraser Lands
Expand service to growing employment area, including Harbourside
Maple Ridge - Pitt Meadows network re-structure
Improved integration with West Coast Express and 2019 Lougheed B-Line
Better access to residential and employment areas
Langley network re-structure
SeaBus sailing to meet the last Canada Line train
vancouver
richmond
delta
surrey
langleytownship
whiterock
mapleridge
pittmeadows
portcoquitlam
burnaby
newwestminster
belcarra
anmore
portmoody
northvancouver
district
westvancouver
lionsbay
coquitlam
dow ntow n
ubc/uel
langleycity
tsawwassenfirst nation
northvancouver
city
electoral area a
Route to be Improved
Phase One B-Line
Increased service to address overcrowding*
*Projects to address overcrowding will be determined based on need closer to the date of implementation. Map is for illustrative purposes only
7% Increase in HandyDART Service
Implementing flexible service (e.g. vanpool and on-demand transit) pilots throughout the region
Proposed Phase Two B-Line (routing subject to further study)
Rail:
Bus:
Other Improvements (not shown on map)
Improved or ExpandedService Areas
Expo Line
Millennium Line
Urban Area
Agricultural Land Reserve, parks & other unpopulated areas
Proposed Millennium LineBroadway Extension
Proposed Surrey - Newton - Guildford Light Rail Transit
SeaBus
West Coast Express
Canada Line
Transit Improvements
Additional Map Elements
Phase Two Planned Transit Improvements

5 PHASE TWO OF THE TEN YEAR VISION – INVESTMENT PLAN
BUILDING NEW RAPID TRANSIT
New rapid transit lines will dramatically change how and where people in the region travel,
and will accommodate new residents and new development in the region. The Phase Two Plan
expands rapid transit across Metro Vancouver according to the priorities established in the 10-
Year Vision. It completes the rapid transit early works investments begun in Phase One, including
the Millennium Line Broadway Extension and the Surrey-Newton-Guildford Line. These new rapid
transit lines will significantly increase mobility and livability in the region.
Investments already funded in Phase One
New investments funded in Phase Two
MAJOR RAPID TRANSIT PROJECTS
• Project development and early works
for the Millennium Line Broadway
Extension and Surrey-Newton-
Guildford Line (Light Rail Transit)
• Working with local and senior
government partners to confirm
land use, affordable housing and
transportation related commitments
that support achieving the
objectives of the Millennium Line
Broadway Extension and Surrey-
Newton-Guildford Line
• Construction and operation of the Millennium Line Broadway
Extension
• Construction and operation of the Surrey-Newton-Guildford
Line (Light Rail Transit)
• Project development and potential early works for the
Surrey-Langley Line (Light Rail Transit), including
• Planning, design, and engineering to prepare for
procurement
• Collaborating with local and senior government
partners to implement land use, affordable housing and
transportation related policies and bylaws to achieve
project objectives, including city-building, transit-oriented
development and seamless integration with surrounding
communities
• Working with government partners to confirm funding for
construction and operation in the Phase Three Plan
• Planning, with partners, to support:
• A potential gondola from the Millennium Line to SFU
Burnaby Campus
• Rapid transit to UBC Point Grey campus
TransLink has worked closely with the City of Vancouver and City of Surrey to develop Project
Partnership Agreements for the Millennium Line Broadway Extension and Surrey-Newton-Guildford
Line. The purpose of the Project Partnership Agreements is to identify municipal contributions and
ensure that supportive land use, housing, and transportation policies will be in place to help the new
rapid transit lines meet local and regional objectives, such as: more transit ridership; less driving;
economic development; increased housing supply; affordable housing; and seamless integration of
the new rapid transit lines with their surrounding communities. TransLink has worked closely with the
City of Vancouver and the City of Surrey to develop and approve Project Partnership Agreements for
both the Millennium Line Broadway Extension and Surrey-Newton-Guildford Line. In coordination with
the municipalities, TransLink will also conduct a detailed review of security needs to support the new
rapid transit lines. Similar agreements will be required for future rapid transit projects.

PHASE TWO OF THE TEN YEAR VISION – INVESTMENT PLAN 6
VCC–Clark
km
Legend
Canada Line
Expo Line
Millennium LineMillennium Line BroadwayExtension
Elevated SkyTrainTunneled SkyTrainand Stations
West Coast Express
KNIG
HT ST
FRASER ST
MAIN
ST
CAMBIE ST
OAK ST
GRAN
VILLE ST
ARBUTU
S ST
W BROADWAY
MILLENNIUM LINE BROADWAY EXTENSION
The Millennium Line Broadway Extension is a project to extend the Millennium Line along Broadway in Vancouver. It will
increase transit capacity, decrease travel times, and improve travel reliability in one of the busiest destinations in the region.
The Broadway corridor includes the largest hospital in western Canada, the second largest employment centre in British
Columbia, and the busiest bus route in Canada and the United States. The Project Partnership Agreement identifies recent
commitments made by the City of Vancouver to planning processes related to affordable housing supply in the corridor.
The Millennium Line Broadway Extension will begin at VCC–Clark Station and end at Arbutus Street. While the eastern part of
the extension will be elevated above ground, most of it will be a bored tunnel beneath Broadway. The extension will include
six new stations. Project highlights include:
• Trains are expected to run every 3 to 4 minutes during peak periods, and every 6 to 8 minutes during off-peak periods,
on opening day.
• People will be able to travel from Lafarge Lake-Douglas Station in Coquitlam to Arbutus Street in Vancouver in
approximately 46 minutes – one train, no transfers.
• The extension will be able to move 5,100 more passengers per hour per direction on opening day than the 99 B-Line –
a capacity increase of 250%. It will be built to allow for additional increases in capacity over time.
Construction on the Millennium Line Broadway Extension is anticipated to be completed by 2025. The total cost of the
Millennium Line Broadway Extension is estimated at $2.83 billion; $47 million of project costs were already funded in the
Phase One Plan. Cost estimates may be refined through additional technical analysis, public input and design modifications,
and will be finalized at the end of the procurement process.
For more information visit broadwayextension.ca.

7 PHASE TWO OF THE TEN YEAR VISION – INVESTMENT PLAN
SURRE Y-NEW TON-GUILDFORD LINE
The Surrey–Newton–Guildford Line is a new
light rail line and the first stage of the South of
Fraser Rapid Transit project. It will increase transit
capacity, reduce commute times, and create
integrated, pedestrian-friendly communities in two
of Surrey’s busiest corridors. The South of Fraser
communities are the fastest growing in the region.
The Project Partnership Agreement identifies
recent commitments made by the City of Surrey to
planning processes related to affordable housing
supply in the corridor.
The Surrey-Newton-Guildford Line will connect
Guildford Exchange to Surrey Central Station via
104 Avenue, and connect Surrey Central Station to
Newton Exchange via City Parkway and King George
Boulevard. It will be at street level and include
eleven new stations. Project highlights include:
• Trains are expected to run every 5 minutes
during peak periods, every 7.5 minutes during
the mid-day, and every 10 minutes in the evenings. Trains will be modern and accessible low-floor vehicles.
• People will be able to travel from Guildford to Surrey Centre in approximately 9 minutes, and from Newton to King George
Station in approximately 13 minutes.
• The line will operate within dedicated train-only lanes on the road. Along with modern intersection signal optimization
technology to be implemented in coordination with the City of Surrey, this will allow the trains to bypass traffic queues,
provide efficient and reliable service, and meet target travel times.
• The line will be seamlessly integrated into the Compass fare payment system.
Construction on the Surrey-Newton-Guildford Line is anticipated to be completed by 2024. The total cost of the Surrey-
Newton-Guildford Line is estimated at $1.65 billion; $43 million of project costs were already funded in the Phase One Plan.
Cost estimates may be refined through additional technical analysis, public input and design modifications, and will be
finalized at the end of the procurement process.
For more information visit surreylightrail.ca.
The Surrey-Langley Line is the second stage of the South of Fraser Rapid Transit Project. The Surrey-Langley Line would
connect Surrey City Centre to Langley City Centre via light rail transit on Fraser Highway. The Phase Two Plan includes funding
for project development and potential early works for the Surrey-Langley Line, but not construction and operation. The
Governments of Canada and British Columbia have each made commitments to work with TransLink, Surrey and Langley to
build the Surrey-Langley Line as part of the 10-Year Vision subject to the completion and review of final business cases.
Km
76 Ave
80 Ave
88 Ave
96 Ave
104 Ave
148
St
152
St
King
Geo
rge
Blvd
Fraser Hwy
144
St
140
St
72 Ave
64 Ave
To Langley Centre
Legend
Expo LinePhase 1: Surrey–Newton–Guildford LRT
Phase 2: Surrey–Langley LineConnection Station
newton
fleetwood
guildford
Gateway
Surrey Central
King George
Surrey City Hall
SFUGuildfordExchange
Scott Road
Newton Exchange

PHASE TWO OF THE TEN YEAR VISION – INVESTMENT PLAN 8
PARTNERING WITH MUNICIPALITIES TO DELIVER MAJOR PROJECTS
The 10-Year Vision calls for establishing Project Partnership Agreements between TransLink and
local governments whenever the region is making major investment decisions that 1) involve
significant cost and risk, and 2) require higher degrees of coordination and collaboration
between multiple partners for success.
Further project-related agreements will be required to detail the responsibilities of each
partner. In recognition of the benefits accruing to municipal and regional residents and
consistent with the principle of partnership among public agencies, project-related agreements
between each municipality and TransLink should not seek to allocate liability associated with
their own negligence to the other agency.

9 PHASE TWO OF THE TEN YEAR VISION – INVESTMENT PLAN
UPGRADING THE EXISTING RAIL NETWORK
The Phase Two Plan would continue to increase service on the existing rail network, as well as
modernize and upgrade aging infrastructure along the Expo and Millennium Lines.1
Investments already funded in Phase One
New investments funded in Phase Two
SKYTRAIN • Increase Expo and Millennium Line
service during the mid-day, early
evening, and weekends, starting
January 2017
• Increase Canada Line service
during high-demand times,
starting January 2017
• 56 new SkyTrain cars for the Expo
and Millennium Lines, as well as
45 new SkyTrain cars to replace
aging fleet
• 24 new SkyTrain cars for the
Canada Line
• Station upgrades to improve
safety, accessibility, and
passenger amenities, including
design and construction of Burrard
station upgrades
• Increase Expo and Millennium Line service during rush hours,
mid-day, and weekends, starting in 2019
• Increase Canada Line service during rush hours, evenings, and
weekends, starting in 2020
• 108 new SkyTrain cars to provide increased service on the
Expo and Millennium Lines, as well as 50 new SkyTrain cars to
replace aging fleet
• Modernization of Expo-Millennium Line infrastructure,
including significant upgrades to power, control systems,
storage, and stations
WEST COAST EXPRESS • Purchase 2 and refurbish 6
locomotives for the West Coast
Express
• Work with the Port of Vancouver, railroads, and other
stakeholders to plan expanded West Coast Express capacity in
Phase Three of the 10-Year Vision.

PHASE TWO OF THE TEN YEAR VISION – INVESTMENT PLAN 10
EXPO AND MILLENNIUM LINE UPGRADESThe Expo Line, the region’s first rail rapid transit line, opened in 1986. In the three decades since, the region has
extended the original Expo Line to cover nearly 60 km of track, including the Millennium Line and the Evergreen
Extension. Annual ridership on the Expo and Millennium Lines reached 105 million boardings in 2017 and is projected
to grow significantly in the coming decade.
The existing Expo and Millennium Line infrastructure requires significant upgrades in order to support longer trains and
more frequent service. When complete, the Expo Line will be able to move 17,500 passengers per hour per direction,
and the Millennium Line will be able to move 7,500 passengers per hour per direction. This represents a 32 and 96
percent increase respectively over the existing capacity.
Highlights of the planned upgrades in the Phase Two Plan include:
• Purchase and delivery of 158 new train cars to expand capacity and replace aging fleet, in addition to the delivery
of 101 new train cars purchased in the Phase One Plan. Higher capacity trains will be introduced to maximize
space for passengers.
• Expanded vehicle storage to accommodate new fleet.
• Upgrades to operations and maintenance centres, mainline power, and control systems to support more frequent
train service and longer trains on both Expo and Millennium Lines.
• Station upgrades to increase passenger capacity, accessibility, amenities, and improve neighbourhood
integration:
• Construction of upgrades at Brentwood station.
• Design of future upgrades, including Columbia, Edmonds, and Stadium-Chinatown stations.
• Trains are expected to run every 100-110 seconds on the busiest segment of the Expo Line during peak periods.
The estimated capital cost of the Expo and Millennium Line upgrade program in the Phase Two Plan is $1.30 billion.
This is in addition to approximately $579 million of upgrades that were already funded in the Phase One Plan. The
specific projects in the Expo and Millennium Line upgrade program will proceed based on review and approval by
senior government.

11 PHASE TWO OF THE TEN YEAR VISION – INVESTMENT PLAN
NEW BUS AND HANDYDART INVESTMENTS
The Phase Two Plan would continue to increase bus and HandyDART service across the region.1
Investments already funded in Phase One
New investments funded in Phase Two
BUS • Increase bus service by 10% across the region from
2017 to 2019
• Improved service on at least 78 different bus routes,
which serve 400,000 boardings across the region
every weekday
• Five new B-Lines by 2019: 41st Avenue; Fraser
Highway; Hastings Street; Lougheed Highway; Marine
Drive-Main Street
• New bus service to the following communities: Burke
Mountain in Coquitlam; Clayton and Morgan Creek in
Surrey; Silver Valley in Maple Ridge; Willoughby
in Langley
• 171 new buses for Phase One bus service improvements,
in addition to new buses to replace aging fleet
• Planning and design work to prepare for implementation
of two new B-Lines in Phase Two of the 10-Year Vision
• Upgrades to bus exchanges, such as operational
improvements, customer amenities, safety and
accessibility enhancements
• Provide $57 million in new funding for transit priority
projects and enhanced passenger amenities on new
B-Line corridors
• Provide $4 million in new funding for regional transit
priority on bus services across the region to improve bus
speed and reliability
• Increase bus service by 8% across the region from
2020 to 2021
• Improved service on at least 75 different bus
routes, which serve 350,000 boardings across
the region every weekday
• Two new B-Lines in 2021: Richmond to Expo Line;
Scott Road (120th Street)
• New bus service to the following communities:
East Fraser Lands in Vancouver; 68th Avenue
Crosstown in Surrey (Scottsdale to Sullivan);
East Fraser Heights in Surrey; Harbourside in
North Vancouver
• Restructure and add service in Pitt Meadows,
Maple Ridge and Langley communities based
on the 2018-19 Area Plan
• 151 new buses for Phase Two bus service
improvements, in addition to new buses to replace
aging fleet
• Provide $87 million in new funding for transit
priority projects and enhanced passenger amenities
on new B-Line corridors
• Provide $12 million in new funding for regional
transit priority on bus services across the region to
improve bus speed and reliability
SEABUS • SeaBus sailings every 10 minutes during peak periods
and every 15 minutes at other times
• New SeaBus vessel
• SeaBus sailing to meet the last Canada Line train
HANDYDART • Increase HandyDART service by 15% from 2017 to 2019
• 23 new buses for Phase One HandyDART service
improvements, in addition to new buses to replace
aging fleet.
• Increase HandyDART service by 7% from 2020 to 2021
• 20 new buses for Phase Two HandyDART service
improvements, in addition to new buses to replace
aging fleet.
Figures in table are in year of expenditure dollars. Percentage service increases are relative to 2016 budgeted service.

PHASE TWO OF THE TEN YEAR VISION – INVESTMENT PLAN 12
B-LINE OR BETTER BUS SERVICES
B-Line or Better bus services are fast, very frequent, reliable,
high-capacity bus routes. Enhanced passenger amenities
and transit priority along the routes help make B-Line or
Better bus services faster, more reliable, more cost-effective,
and help accommodate new residents and new development
in the region.
The 10-Year Vision identified 12 new B-Line or Better routes
for the region. Together, Phase One and Phase Two of the
10-Year Vision will provide new fleet and operating costs of
seven new B-Line or Better bus services:
Phase One
• Hastings Street – service began in 2016
• 41st Avenue – in service in 2019
• Fraser Highway – in service in 2019
• Lougheed Highway – in service in 2019
• Marine Drive-Main Street – in service in 2019
Phase Two
• Richmond to Expo Line – in service in 2021
• Scott Road (120th Street) – in service in 2021
The Phase Two Plan provides $32 million in new funding
for passenger amenities and transit priority measures (e.g.,
signal priority and dedicated transit lanes) along the new
B-Line or Better routes, in addition to the $57 million of
funding allocated in Phase One. These improvements will
be dependent on municipal collaboration with TransLink:
in order for bus service to be fast and reliable in B-Line or
Better corridors, municipalities must prioritize public transit
over single-occupancy cars.
The Phase Two Plan also provides $55 million for a new
cost-sharing program from 2020-27 for transit priority and
passenger amenities along B-Line routes. For more details,
see “TransLink cost-sharing programs for local governments”
on page 15.
REGIONAL BUS PRIORITY
The Phase Two Plan provides $12
million for a new cost-sharing
program for transit priority initiatives
on bus services across the region.
These investments will be dependent
on municipal contributions and
collaboration with TransLink, and will
help accommodate new residents
and new development in the region.
For more details, see “TransLink
cost-sharing programs for local
governments” on page 15.

13 PHASE TWO OF THE TEN YEAR VISION – INVESTMENT PLAN
NEW ROAD INVESTMENTS
The Phase Two Plan includes new investment in the region’s road network. The Phase Two Plan
continues funding for municipalities to pave roads, add lanes, fix bottlenecks, and upgrade
overpasses and other structures to meet seismic standards.1
Investments already funded in Phase One
New investments funded in Phase Two
MINOR CAPITAL UPGRADES
• Provide $50.0 million to municipalities
from 2017 to 2019 for minor capital
upgrades to the Major Road Network (MRN),
such as improving safety and addressing
bottlenecks
• Provide $45.9 million to municipalities from 2020 to 2021 for
minor capital upgrades to the MRN, such as improving safety
and addressing bottlenecks
STRUCTURE REHABILITATION AND SEISMIC UPGRADES
• Provide $32.5 million to municipalities
from 2017 to 2019 to rehabilitate and make
seismic retrofits to structures on the MRN,
such as overpasses, retaining walls, and
bridges
• Provide $29.8 million to municipalities from 2020 to 2021 to
rehabilitate and make seismic retrofits to structures on the
MRN, such as overpasses, retaining walls, and bridges
OPERATIONS, MAINTENANCE, AND REHABILITATION OF THE MAJOR ROAD NETWORK
• Increase the number of lane-kilometres of
MRN to be funded in the region by 10% in
2018
• Fund operations, maintenance, and
rehabilitation of the MRN through 2026.
Funding will be distributed to local
governments based on the number of lane-
kilometres of MRN in their jurisdiction
• Fund operations, maintenance, and rehabilitation of the MRN
through 2027. Funding will be distributed to local governments
based on the number of lane-kilometres of MRN in their
jurisdiction
TRANSLINK-OWNED BRIDGES
• Maintain and operate TransLink-owned
bridges through 2026
• Maintain and operate TransLink-owned bridges through 2027
Figures in table are in year of expenditure dollars.

PHASE TWO OF THE TEN YEAR VISION – INVESTMENT PLAN 14
Investments already funded in Phase One
New investments to be funded in Phase Two
WALKING ACCESS TO TRANSIT
• Provide $12.5 million to municipalities from 2017 to
2019 for pedestrian infrastructure projects, such as
sidewalks, crosswalks, and pedestrian signals
• Provide $11.5 to municipalities
from 2020 to 2021 for pedestrian
infrastructure projects, such as
sidewalks, crosswalks, and pedestrian
signals
REGIONAL CYCLING INFRASTRUCTURE
• Provide $29.8 million to municipalities from 2017
to 2019 for cycling infrastructure projects, such as
protected bike lanes and multi-use paths, in addition to
existing funding
• Provide $27.3 million to municipalities
from 2020 to 2021 for cycling
infrastructure projects, such as protected
bike lanes and multi-use paths, in
addition to existing funding
TRANSLINK-OWNED CYCLING INFRASTRUCTURE
• Provide $11.5 million for upgrades to TransLink-owned
cycling infrastructure, in addition to existing funding
• Provide $10.6 million for upgrades to
TransLink-owned cycling infrastructure,
in addition to existing funding
Figures in table are in year of expenditure dollars.
NEW WALKING AND CYCLING INVESTMENTS
The Phase Two Plan delivers new investment in walking and cycling infrastructure across the
region. It provides funding for municipalities to construct new sidewalks and bikeways and for
TransLink to upgrade cycling infrastructure.1 Projects will be selected through a performance-
based process and cost-shared with local government partners.
WHAT ABOUT THE PATTULLO BRIDGE?
In February 2018, the Province agreed to fund and build a new bridge to
replace the Pattullo Bridge. Previously, TransLink had funded and completed
the planning and preliminary engineering of the replacement bridge.
Construction of the replacement bridge is anticipated to begin in late
2019 and to be completed by 2023. The Province will own and operate the
replacement bridge, while TransLink will continue to own the existing bridge
until it is decommissioned.

15 PHASE TWO OF THE TEN YEAR VISION – INVESTMENT PLAN
TRANSLINK COST-SHARING PROGRAMS FOR LOCAL GOVERNMENTS
As the regional transportation authority, TransLink provides funding to local governments to help
upgrade roads, walking, and cycling infrastructure. The table below outlines funding available to local
governments through these cost-sharing programs.
AVAILABLE FUNDING THROUGH COST-SHARING PROGRAMS (MILLIONS)
COST-SHARING PROGRAM
2017 2018 2019 2020 2021 2022 2023 2024 2025 2026 2027 TOTAL
B-Line or Better infrastructure
- - - $6.37 $6.49 $6.62 $6.76 $6.89 $7.03 $7.17 $7.31 $54.65
Regional bus priority
- - $2.00 $4.13 $4.36 $5.56 - - - - - $16.05
Walking access to transit
$2.50 $5.00 $5.00 $5.62 $5.85 - - - - - - $23.97
Regional cycling infrastructure
$7.55 $13.45 $13.45 $14.94 $15.47 - - - - - - $64.86
Major road network minor capital upgrades
$10.00 $20.00 $20.00 $22.50 $23.40 - - - - - - $95.89
Major road network structure rehabilitation and seismic upgrades
$6.50 $13.00 $13.00 $14.62 $15.21 - - - - - - $62.33
Figures in table are in year of expenditure dollars, to take into account forecasted inflation costs.

PHASE TWO OF THE TEN YEAR VISION – INVESTMENT PLAN 16
NEW MOBILITY INVESTMENTS
The Phase Two Plan provides new investment to support pilots and field testing for flexible,
shared-use services including commuter vanpooling, demand-responsive transit services,
and first- and last-mile partnerships. The New Mobility program was established in the Phase
One Plan to leverage new technologies and business models for providing people with more
mobility options.
Investments already funded in Phase One
New investments funded in Phase Two
NEW MOBILITY • Provide $24 million from 2017 to 2026 to
pilot, field test, and scale new technologies
and service concepts
• Provide $5 million from 2018 to 2021 to pilot, field test,
and scale flexible, shared-use services
Figures in table are in year of expenditure dollars.
1 In the scenario that new provincially-enabled revenue capacity (motor fuel tax) or parking tax increase are not
enabled and implemented in 2019, and are not offset by greater than anticipated revenues from other sources,
then a portion of the Phase Two Plan expansion would be deferred. See Appendix B for details.
17 PHASE TWO OF THE TEN YEAR VISION – INVESTMENT PLAN

PHASE TWO OF THE TEN YEAR VISION – INVESTMENT PLAN 18
2MANAGE
TransLink develops and implements a wide range of policies and strategies
in order to make the region’s integrated transportation system –
including transit, roads, walking, and cycling infrastructure – more efficient
and effective for users.

19 PHASE TWO OF THE TEN YEAR VISION – INVESTMENT PLAN
Make travel safe and secureTransLink is committed to continuously improving the safety and security of travel across the
region’s integrated transportation system.
Safety & emergency planning
• Continue development of a formal Emergency Management and Business Continuity System
to ensure that the transit system is resilient to natural disasters and other emergencies.
• Establish formal Safety Management Systems at TransLink and its subsidiaries to
systematically identify safety hazards, evaluate risks, and implement mitigation strategies
to ensure the safety of our employees, customers, and the public.
Security operations
• Implement the Metro Vancouver Transit Police Strategic Plan to protect people (transit
customers and transit personnel), property, and revenue with an effective and efficient
service delivery model.
• Improve community safety and complement local policing by addressing operational
priorities: reducing sexual offending; reducing violence against transit staff; providing
support for vulnerable people who experience crises on the transit system; and protecting
transit system infrastructure.
Technology & cyber-security
• Manage and maintain business software and hardware assets in a state of good repair to
ensure secure and reliable operations.

PHASE TWO OF THE TEN YEAR VISION – INVESTMENT PLAN 20
Make travel easy and informativeTransLink prioritizes the needs of customers and works to ensure that people of all ages and
abilities can have an enjoyable experience moving about the region independently, with
confidence and in comfort from the beginning to the end of their journey.
Key actions for the Plan period include:
Customer experience planning
• Develop and implement a comprehensive Customer Experience Business Plan.
• Implement consistent customer service standards across the enterprise and contract service
providers.
• Engage TransLink employees and adapt business processes to move the organization
towards a more customer-centric culture.
Customer information & communication
• Improve the timeliness and clarity of information provided to customers, to make it easier to
understand and navigate the transportation system, including:
» improving digital customer services across the multi-modal transportation system;
» modernizing the TransLink website;
» improving travel information and wayfinding at transit stops and stations, including
digital signage providing information in real time; and,
» improving communication and messaging around transit service alerts and service
disruptions and responding faster and more consistently through an increased number
of channels, including digital alerts and audio announcements.
• Explore technology options to provide front-line transit employees with information to
respond to customer inquiries more quickly.
• Explore technology options for people to more easily communicate with TransLink,
• Support and enable technology options for people to more easily and seamlessly plan, book
and pay for multi-modal journeys.

21 PHASE TWO OF THE TEN YEAR VISION – INVESTMENT PLAN
Public art
• Utilize public art to create a welcoming environment for transit customers, integrate
transportation into the community and enhance the travel experience.
Accessibility
• Develop an implementation plan for a more universally accessible transit service including
continued improvements to the HandyDART service.
• Implement enhanced travel training for persons with disabilities on conventional transit.
• Implement more universally accessible features at transit stops and stations.

PHASE TWO OF THE TEN YEAR VISION – INVESTMENT PLAN 22
Make travel more efficient and reliableTransLink works to ensure that the regional transportation system is more environmentally-efficient and
keeps our economy moving. Key actions for the Plan period include:
Transit network performance
• Manage the transit network to maintain efficiency and productivity, including by continuing to
monitor, and adjust or restructure specific services.
• Collaborate with municipalities and other partners to implement transit priority measures such as
signal priority and dedicated transit lanes to improve bus speed and reliability in the face of growing
traffic congestion.
• Ensure operational needs of the growing bus and rail fleet are met by planning and investing in bus
operations & maintenance facilities.
Road network performance
• Develop a Regional Road Network Strategy (RRNS) and annual monitoring and reporting process to
help better define and manage performance of the region’s road network.
Harmonizing regulations
• Continue to work towards harmonizing truck regulations and centralizing truck permitting across the
region.
• Improve regional road network operations including freight wayfinding and trip planning tools.
Low-carbon fleet
• Finalize a Low-Carbon Fleet Strategy to reduce emissions from transit vehicles across the region,
including evaluation of low- and zero-emissions vehicles, such as electric buses.

23 PHASE TWO OF THE TEN YEAR VISION – INVESTMENT PLAN
Price the transportation system to reduce congestion and overcrowding, improve fairness, and support transportation investmentThe 10-Year Vision includes implementing an integrated approach to pricing parking, roads,
transit and other shared-use modes in order to reduce congestion and overcrowding, improve
fairness, and support transportation investment.
In May 2018, TransLink introduced contactless credit card and smartphone payments on buses
and at fare gates. Over the course of this Plan period, TransLink will deliver the next phase of the
Compass system.
Key actions for the Plan period include:
Payment
• Continue to introduce additional innovative ways to facilitate payment of fees for parking,
transit, and other shared-use modes.
• Further promote the “Compass for Organizations” program to enable employers and
associations to provide convenient payment options for their employees and members.
Transit
• Complete and implement the recommendations of the Transit Fare Review.
Parking
• Continue to monitor and adjust pricing at Park & Ride lots and secure bicycle parking
facilities to ensure optimal use.
Roads
• Building on the report of the Mobility Pricing Independent Commission, undertake
additional work, research and engagement to further explore key issues and questions
related to decongestion charging especially related to affordability and equity in order to
support future policy decisions.

PHASE TWO OF THE TEN YEAR VISION – INVESTMENT PLAN 24
3PARTNER
TransLink collaborates with a broad range of partners and stakeholders
in order to maximize the value and effectiveness of the region’s
transportation services and infrastructure and to achieve the
best regional planning outcomes.
25 PHASE TWO OF THE TEN YEAR VISION – INVESTMENT PLAN
Align transportation and land use TransLink works with local governments, Metro Vancouver, senior levels of government, other key
partner agencies, and developers to ensure land use and transportation plans and priorities are
as aligned as possible. Key actions for the Plan period include:
With partner agencies
• Continue to develop and implement Corridor Plans, Station and Exchange Plans, and Area
Plans to identify local priorities for integrating transit, walking, and cycling investments with
land use which is supportive of sustainable transportation modes.
• Continue to work with partner agencies to ensure alignment of planned land use and
transportation investments, in support of both the Regional Transportation Strategy
(RTS) and Metro Vancouver’s Regional Growth Strategy. In particular, support the focus of
population and jobs growth in Urban Centres, Frequent Transit Development Areas, and
along the Frequent Transit Network (FTN). Consistent with the RTS, TransLink is committed to
improving and expanding the FTN over time.
• Continue to work with partner agencies to support affordable rental housing along the FTN
and the implementation of Metro Vancouver’s Regional Affordable Housing Strategy.
• Continue to engage on partner agency plans that have implications for the regional
transportation system; develop tools to support partner agencies in consulting and
communicating with TransLink on these plans.
• Continue to coordinate with Metro Vancouver to support the shared goals of the RGS.
• Coordinate with Metro Vancouver, the Province, the region’s local governments, and other
key stakeholders on the update of the Regional Transportation Strategy.

PHASE TWO OF THE TEN YEAR VISION – INVESTMENT PLAN 26
With real estate and commercial partners
• Continue to develop real estate and commercial partnerships that support sustainable
transportation and generate non-tax revenue, including:
» Facilitate and integrate development adjacent to TransLink infrastructure through the
Adjacent and Integrated Development (AID) Project Consent Process.
» Increase retail opportunities for passenger-friendly businesses at transit stations and
exchanges.
» Provide customer amenities on TransLink infrastructure through revenue- generating
agreements with commercial entities.
Develop and Implement Project Partnership Agreements
The 10-Year Vision calls for establishing Project Partnership Agreements between TransLink and
local governments whenever the region is making major investment decisions that 1) involve
significant cost and risk, and 2) require higher degrees of coordination and collaboration
between multiple partners for success. Key actions for the Plan period include:
• Monitor the implementation of integrated land use and transportation commitments with
the City of Vancouver and City of Surrey for the Millennium Line Broadway Extension and
Surrey-Newton-Guildford Light Rail, respectively.
• Collaborate on integrated land use and transportation planning for the Surrey-Langley Line
of South of Fraser Rapid Transit with the City of Surrey and City of Langley. Document in the
future Project Partnership Agreements the commitments for project-supportive land use and
transportation actions, as well as project contributions.
• Bring forward to the Mayors' Council Project Partnership Agreements, approved by the
TransLink Board and applicable municipalities as were developed for the Millennium Line
Broadway Extension and Surrey-Newton-Guildford projects.

27 PHASE TWO OF THE TEN YEAR VISION – INVESTMENT PLAN
Innovate through new partnershipsAdvances in transportation and communications technologies are rapidly changing the way
people, goods, and services move in our region. To ensure that these technologies advance
our regional goals, TransLink must innovate and coordinate with both public and private sector
partners.
Key actions for the Plan period include:
With goods movement partners
• Continue working with the Greater Vancouver Urban Freight Council with public and private
sector partners to:
» Champion priorities identified in the Regional Goods Movement Strategy.
» Coordinate initiatives and exchange knowledge and information on urban freight issues,
including protection of rail rights-of-way and access to waterways for goods movement.
With new mobility partners
• Expand TransLink’s role in providing mobility options that serve the region’s diverse
transportation needs, including:
» Pilot options for on-demand shared use services to supplement existing fixed-route
services.
» Evaluate these pilots to assess how they might be incorporated into TransLink’s regular
offerings to increase transportation options.
• Accelerate innovation by generating and supporting new ideas that are aligned with
TransLink’s goals and objectives. This will be done through a recurring Open Innovation Call.
• Collaborate with industry, academic, and local government partners to explore “new
mobility” concepts within the delivery model of a regional transportation authority, such as:
» Support the facilitation and regulation of shared- use mobility services (bikesharing,
carsharing, ridehailing, and ridesharing) that provide alternatives to private car
ownership.
» Leverage vehicle automation to advance regional objectives, such as compact land use,
Improvements in safety, and reductions in driving.
» Continue to explore “Mobility as a Service” or “MaaS” systems for integrating incentives
and payment across transportation services.

PHASE TWO OF THE TEN YEAR VISION – INVESTMENT PLAN 28
FUNDING THE PHASE TWO PLAN
NOTE: EXCEPT WHERE NOTED OTHERWISE, ALL FIGURES IN THIS SECTION ARE IN YEAR
OF EXPENDITURE DOLLARS.
4

29 PHASE TWO OF THE TEN YEAR VISION – INVESTMENT PLAN
KEY MILESTONES IN REGIONAL TRANSPORTATION FUNDING
2014
JUNE Mayors’ Council develops the 10-Year Vision. Mayors’ Council proposes carbon tax and mobility pricing as preferred new funding sources for the 10-Year Vision, as well as land value capture as a supporting new funding source.
DECEMBER Mayors’ Council and Province agree to a regional plebiscite on increasing the provincial sales tax by 0.5% to fund the 10-Year Vision.
2015
JULY Plebiscite to increase the provincial sales tax does not pass.
NOVEMBER Mayors’ Council develops “fair-share” funding framework for cost-sharing between region, provincial and federal governments.
2016
MARCH Federal government announces Public Transit Infrastructure Fund (PTIF) which provides short-term funding of $3.4 billion across Canada, to accelerate investments in the rehabilitation of transit systems, new capital projects, and planning and studies for future transit expansion.
JUNE Federal government commits $370 million for Phase One of the 10-Year Vision through the PTIF Program.
Provincial government commits funding to Phase One of the 10-Year Vision.
SEPTEMBER Mayors’ Council proposes regional funding sources for Phase One of the 10-Year Vision. The public provides input on Phase One of the 10-Year Vision during the consultation period.
NOVEMBER TransLink Board and Mayors’ Council approve the Phase One Plan.
2017
MARCH Federal government allocates approximately $2.2 billion to building rapid transit projects in Metro Vancouver, through the continuation of the PTIF Program.
JULY TransLink Board and Mayors’ Council approve an update to the Phase One Plan, to accelerate the purchase of 28 SkyTrain cars to meet stronger than anticipated ridership growth.
SEPTEMBER Provincial government commits funding to Phase Two of the 10-Year Vision.
2018
FEBRUARY Following the removal of tolls on the Port Mann and Golden Ears Bridges, the Province assumed responsibility for funding, owning and delivering the $1.3 billion Pattullo Bridge replacement.
MARCH Provincial government removes plebiscite requirement for new transportation funding sources.
Mayors’ Council proposes regional funding sources for Phase Two of the 10-Year Vision.
MAY Public consultation on Phase Two of the 10-Year Vision.
Provincial government passes legislation enabling TransLink to levy a development cost charge for certain types of eligible projects.
JUNE Phase Two Plan submitted to Mayors’ Council and TransLink Board of Directors for approval.
PHASE TWO OF THE TEN YEAR VISION – INVESTMENT PLAN 30
New, sustainable funding sources are required in order for our region to build and operate the
transportation infrastructure that people will need both today and in the future.
Due to population growth, a strong economy, and denser, transit-oriented patterns of
development, demand for transportation – especially transit – is increasing at a much faster rate
than TransLink’s existing funding sources. From 2000 to 2016, transit ridership in our region
increased 80%; in comparison, the regional population only grew 20% over the same time.
While TransLink’s existing funding keeps the current transportation system running, new funding
is needed in order to expand the transportation system and meet the increasing demand for
transportation across the region.
To address this challenge, in collaboration with the Government of Canada and Government of
British Columbia, the Mayors’ Council on Regional Transportation have developed a proposal to
fund Phase Two of the 10-Year Vision.
The Government of BC has committed to funding 40% of the capital costs of Phase Two of the
Mayors' Council Vision. In addition, the Government of Canada, through the Integrated Bilateral
Agreement, is investing significantly in BC infrastructure including public transit. With the
availability of this new federal and provincial funding, the region has a chance to improve the
transportation system at a substantially lower cost to local taxpayers.
To fully leverage these new federal and provincial contributions, the region must provide its share
of funding for the Phase Two Plan. Most of the regional share will come from TransLink and other
regional government resources, such as: borrowing and private financing; future revenues, such
as gas tax revenues allocated through the Greater Vancouver Regional Fund and anticipated fare
revenues from increased transit ridership; and new TransLink revenue capacity, to be enabled by
the Government of British Columbia in the form of an increase to the regional motor fuel tax. The
remaining portion of the regional share will come from increases to: the property tax, parking tax,
transit fares, commercial revenues, and development cost charges. These changes are intended
to be modest and balanced across Metro Vancouver residents, affecting transit users, drivers,
property owners, and real estate developers.
In total, this investment plan will require $10.5 billion for capital investments, $15.1 billion for
operating investments, and $2.5 billion for financing costs.
Of this total, the Phase Two Plan expansion will require: $6.4 billion for capital investments,
$854 million for operating investments, and $361 million for financing costs. The new services
and infrastructure delivered with this funding will be a major step in meeting our region’s
transportation needs.

31 PHASE TWO OF THE TEN YEAR VISION – INVESTMENT PLAN
2018-27 CAPITAL FUNDINGThe charts on this page illustrate the capital funding that TransLink anticipates over the next decade from its
established funding sources, accumulated funding resources, and borrowing within established limits.
TOTAL CAPITAL FUNDING
This investment plan includes a
total of $10.45 billion of capital
funding over the next decade.
Notes: “Other sources” include internal funding and a partnership agreement for Capstan Way Station. Figures have been rounded and may not total to 100%.
WHAT’S NEW?
Of the total capital funding in this investment
plan, $6.41 billion is for the new expansion
projects and programs in Phase Two.
Borrowing and private financing $2.98 billion (29% of total capital funding)
Borrowing and private financing $1.46 billion (23% of new capital funding)
Provincial contribution $2.78 billion (27%)
Provincial contributions $2.5 billion (40%)
Federal contributions $2.0 billion (31%)
Federal contribution $2.19 billion (21%)
Greater Vancouver Regional Fund $1.74 billion (17%)
Greater Vancouver Regional Fund $176 million (3%)
Sale of surplus property $290 million (3%)
Development fee $65 million (1%)
Development fee $252 million (2%)
Local government contributions $117 million (1%)
Local government contributions $112 million (2%)
Other sources $44 million (1%)
Other sources $109 million (1%)

PHASE TWO OF THE TEN YEAR VISION – INVESTMENT PLAN 32
2018-27 CAPITAL EXPENDITURESThe charts on this page illustrate the capital expenditures that TransLink has planned over the
next decade to maintain and expand the regional transportation system.
Notes: Figures have been rounded and may not total to 100%.
TOTAL CAPITAL EXPENDITURES
This investment plan includes a
total of $10.45 billion of capital
expenditures over the next decade.
WHAT’S NEW?
Of the total capital funding in this investment
plan, $6.41 billion is for the new expansion
projects and programs in Phase Two.
Rail $7.00 billion (67% of total capital expenditures)
Rail $5.76 billion (90% of new capital expenditures)
Bus $2.57 billion (25%)
Roads and bridges $516 million (5%)
Corporate $275 million (3%)
Cycling and walking $93 million (1%)
Bus $528 million (8%)
Roads $76 million (1%)
Cycling and walking $49 million (1%)

2018-27 OPERATING REVENUEThe charts on this page illustrate the operating revenue that TransLink anticipates over the next decade from
its established funding sources, accumulated funding resources, and borrowing within established limit.
TOTAL OPERATING REVENUE
This investment plan includes a total
of $18.84 billion of operating revenue
over the next decade.
WHAT’S NEW?
Of the total operating revenues in this investment
plan, $1.22 billion is for the new expansion projects
and programs in Phase Two.
Notes: “Transit revenues” include fare revenue, commercial revenue, and other revenue related to the transit system. “Other sources” include interest income and other internal sources. “What’s new” operating revenues consist of revenues available to fund operations and exclude capital contributions, amortization of deferred concessionaire credit and restricted investment income. Figures have been rounded and may not total to 100%.
Parking tax $89 million (7%)
Commercial revenue $17 million (1%)
Fare revenue from fare increase $104 million (9%)
Property tax $109 million (9%)
New provincially-enabled revenue capacity (motor fuel tax) $270 million (22%)
Fare revenue from increased transit service $537 million (44% of new operating revenues)
Other sources $91 million (7%)
Transit Revenues $7.75 billion (41% of total operating revenues)
Property taxes $4.75 billion (25%)
Motor fuel taxes $3.88 billion (21%)
Parking tax $855 million (5%)
Replacement for toll revenues $689 million (4%)
New provincially-enabled revenue capacity (motor fuel tax) $270 million (2.2%)
Hydro levy $227 million (2%)
Provincial contributions $192 million (1%)
Interest income $169 million (1%)
Revenue recoveries and other $57 million (<1%)
33 PHASE TWO OF THE TEN YEAR VISION – INVESTMENT PLAN
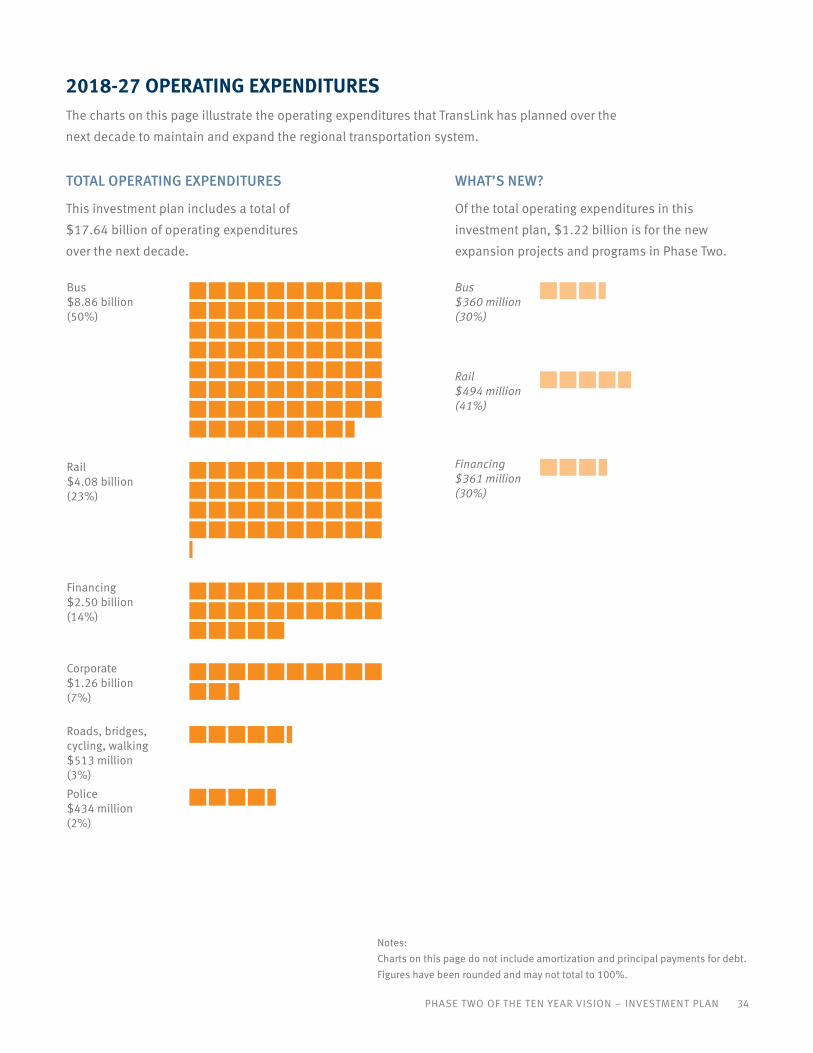
PHASE TWO OF THE TEN YEAR VISION – INVESTMENT PLAN 34
2018-27 OPERATING EXPENDITURESThe charts on this page illustrate the operating expenditures that TransLink has planned over the
next decade to maintain and expand the regional transportation system.
TOTAL OPERATING EXPENDITURES
This investment plan includes a total of
$17.64 billion of operating expenditures
over the next decade.
WHAT’S NEW?
Of the total operating expenditures in this
investment plan, $1.22 billion is for the new
expansion projects and programs in Phase Two.
Notes: Charts on this page do not include amortization and principal payments for debt. Figures have been rounded and may not total to 100%.
Bus $8.86 billion (50%)
Bus $360 million (30%)
Rail $4.08 billion (23%)
Rail $494 million (41%)
Financing $361 million (30%)
Financing $2.50 billion (14%)
Corporate $1.26 billion (7%)
Roads, bridges, cycling, walking $513 million (3%)
Police $434 million (2%)

35 PHASE TWO OF THE TEN YEAR VISION – INVESTMENT PLAN
ANNUAL OPERATING EXPENDITURESThe charts on this page illustrate how TransLink’s annual operating expenditures are planned to
change over the next decade.
2018 OPERATING EXPENDITURES
In the first year of this investment plan, TransLink’s
annual operating expenditures are estimated to
total $1.44 billion.
2027 OPERATING EXPENDITURES
In the last year of this investment plan, TransLink’s
annual operating expenditures are estimated to
total $2.05 billion.
Notes: Charts on this page do not include amortization and principal payments for debt. Figures have been rounded and may not total to 100%.
Bus $733 million (51% of 2018 operating expenditures)
Bus $999 million (49% of 2027 operating expenditures)
Rail $310 million (22%)
Rail $508 million (25%)
Financing $181 million (13%)
Financing $302 million (15%)
Corporate (including one-time expenses) $126 million (9%)
Corporate (including one-time expenses) $133 million (6%)
Roads, bridges, cycling, walking $51 million (4%)
Roads, bridges, cycling, walking $57 million (3%)
Police $38 million (3%)
Police $48 million (2%)
PHASE TWO OF THE TEN YEAR VISION – INVESTMENT PLAN 36
REVENUE SOURCESTotal annual revenues under this Plan are forecast in Table 2 and include the revenue sources
described below.
The tables in Appendix A assume that all funding sources for the Phase Two Plan are implemented
by 2019.
The tables in Appendix B assume that neither the parking tax nor the new regional funding capacity
are implemented by 2019. To the extent that this revenue shortfall is not offset by greater than
anticipated revenues from other sources, part of the expansion contemplated in the Phase Two Plan
would need to be deferred.
TRANSIT REVENUES
TransLink collects revenues from transit fares, as well as from other transit system-related sources,
such as fare infractions, transit advertising and commercial opportunities. TransLink anticipates
$7,752 million in transit revenues from 2018-27.
Fare Revenues
Fares are an important source of funding for transit service. TransLink currently recovers more than
half of its transit operating costs from fares. In total, TransLink anticipates $7,506 million in transit
fare revenues from 2018-27.
The Phase Two Plan increases transit fares in 2020 and 2021, in addition to the increases approved
in the Phase One Plan. Conventional and custom transit cash fares and discounted stored value
rates increase from 10 to 15 cents, while monthly passes increase from 50 cents to $1 beyond the
rates in the Phase One Plan; West Coast Express fares remain unchanged from the Phase One Plan.
Forecasts indicate that as a result of these fare increases, transit users would pay an average of 2%
more per transit journey over the next 10 years than they would have otherwise paid with the Phase
One Plan fare increases.
To minimize affordability impacts, the fare increases contemplated in the Phase Two Plan are small
and gradual. Discounted fares will continue to be available to customers who use the Compass
card. The Phase Two fare increases have been timed to match the start date of new transit services.
Actual fare increases will continue to be reviewed and voted on by the TransLink Board before they
are implemented.

37 PHASE TWO OF THE TEN YEAR VISION – INVESTMENT PLAN
TRANSIT FARE REVIEW
Through the Transit Fare
Review, TransLink is developing
recommendations for making
the transit fare structure more
simple, fair, and affordable. The
Transit Fare Review included three
phases of public consultation in
2016 and 2017. Once the Transit
Fare Review is completed, the fare
rates proposed in the Phase Two
Plan may be updated to reflect any
recommended improvements to the
transit fare structure.
WHAT ARE “TARGETED FARES”?
Provincial legislation defines the “targeted fare” for a fare
product as the 2008 fare rate increased by 2% per year.
Fare increases that exceed the “targeted fare” must be
approved by the Mayors’ Council.
In the last decade, TransLink has maintained fares far
below the “targeted fare” levels. The Phase One Plan
included gradual fare increases such that some fare
products would meet the “targeted fare” rates beginning
in 2021. Since the Phase Two Plan includes additional
fare increases beyond those approved in the Phase One
Plan, cash fares would exceed the “targeted fare” rates by
10 to 15 cents and DayPasses would by 25 cents in the
next ten years. As part of the development of the Phase
Two Plan, TransLink submitted an application to the
Mayors’ Council to approve increased fares beyond the
“targeted fare” level.
With both the Phase One and Phase Two fare increases:
• By 2021, a youth or senior would pay $59.50 for unlimited travel across the region on a
monthly pass (an increase of $6.50 compared to today), and an adult would pay $105
to 189 for a monthly pass, depending on the number of zones (an increase of $12 to 17
compared to today). These prices are comparable to those of similar transit passes in
Toronto and Montreal today.
• By 2021, a youth or senior who takes transit only a few times a month on weekday evenings
or weekends would pay $2.15 for a trip of any distance with a Compass card (an increase of
35 cents compared to today), and an adult would pay $2.70 for a trip of any distance with a
Compass Card (an increase of 50 cents compared to today). During those times, people can
travel all the way from Maple Ridge to Vancouver or from Delta to Bowen Island, on a one-
zone transit fare – a much farther distance than is possible for that price in other regions in
Canada.
Table 12 includes a detailed table of proposed fares for every fare product type, including both
the Phase One and Phase Two fare increases.

PHASE TWO OF THE TEN YEAR VISION – INVESTMENT PLAN 38
COMMERCIAL OPPORTUNITIES
TransLink generates revenue from a variety of transit-related commercial opportunities.
TransLink and the City of Vancouver have reached an agreement to permit commercial activity on
transit and transportation infrastructure located on City of Vancouver property. These commercial
rights include revenue from commercial retail units, licensing fees for fibre optics, and permitting
fees from third party filming activities on transit infrastructure. The commercial rights are
estimated to increase commercial revenues for TransLink by $0.6 million in 2019, growing to
$2.8 million in 2027. In total, TransLink anticipates $52 million in commercial revenues from
2018-27.
PARKING TAX
TransLink currently administers a 21% parking tax for all off-street paid parking (hourly, monthly,
and annually) within TransLink’s service area in Metro Vancouver. This tax is sometimes referred
to as the “parking rights tax”.
The Government of British Columbia has committed to introducing legislation to enable TransLink
to increase the parking tax by fall 2018. The Phase Two Plan includes an increase to the parking
tax rate by 3 percentage points, from 21% to 24%, beginning in 2019. For a parkade that charges
$5 per hour, this would increase the cost of parking by 12 cents per hour. This change will
increase parking tax revenue by $89 million from 2018-27. In total, TransLink anticipates $855
million in parking tax revenues from 2018-27.
39 PHASE TWO OF THE TEN YEAR VISION – INVESTMENT PLAN
PROPERTY TAX
A portion of property taxes collected in the region is used to support transit, roads, bridges, and
walking and cycling infrastructure. The TransLink property tax includes the Standard Property Tax and
the Replacement Tax. Under the SCBCTA Act, total Standard Property Tax revenues grow by 3% per year,
plus any additional amount included in an approved investment plan. Replacement Tax revenues are
legislatively capped at $18 million per year.
The Phase Two Plan includes the following property tax revenues:
• Standard Property Tax revenues:
» An additional increase to Standard Property Tax revenues of $10 million in 2019. After
2019, this incremental revenue will increase at the same rate as other Standard Property
Tax revenues. On average, the proposed increase is estimated to be an additional $5.50 per
household in 2019.
» Annual increases to Standard Property Tax revenues of 3% per year, plus an additional
percentage increase for Annual Development Growth (ADG). ADG quantifies the portion
of the annual increase in assessed property value in the Metro Vancouver resulting from
development and construction. The Phase Two Plan assumes annual percentage Annual
Development Growth (ADG) of:
– 1.90% in 2018,
– 2.30 % in 2019 through 2021, and
– 1.50% in 2020 through 2027.
The actual ADG percentage that TransLink would apply each year would be the lower of the
actual growth or the assumed ADG rate.
• Replacement Tax revenues of $18 million per year.
In total, TransLink anticipates $4,747 million in Standard Property Tax and Replacement Tax revenues
from 2018-27.
DEVELOPMENT COST CHARGE
In spring 2018, the provincial government amended legislation to enable TransLink to levy a DCC
for certain types of eligible projects required for the regional transportation system. Development
Cost Charges (DCCs) are charges that real estate developers pay towards the capital costs of certain
types of projects required for the regional transportation system. Since new development increases
demand on public infrastructure throughout the transportation service region, the purpose of DCCs is
to ensure that a fair share of those capital costs are paid for by new development. Collection entities
(municipalities in the region, UBC and Metro Vancouver) will collect the DCCs from developers on
behalf of TransLink when obtaining approvals for subdivision or building permits for new development.
The DCCs will be collected throughout the entire Metro Vancouver transportation service region.

PHASE TWO OF THE TEN YEAR VISION – INVESTMENT PLAN 40
The DCCs may, by bylaw or regulation, be waived for certain types of developments (for example,
affordable rental housing projects). The cost of a DCC tends to be borne by land owners who are selling
property for development, not by homeowners or renters. A new DCC generally reduces the amount that
developers would otherwise be willing to pay for land for development sites. As part of setting the DCC
rates, TransLink considers a variety of factors, including whether the charges will deter development in
the transportation service region or discourage the construction of reasonably priced housing, which
may impact housing affordability. TransLink plans on waiving the DCC for most types of not-for-profit
rental affordable housing.
The Phase One Plan included $127 million in new DCC revenues to 2026. This is currently estimated at
$21.5 million per year. The Phase Two Plan includes an estimated additional $7.5 million per year of
DCC revenues. Collection of the DCC fees is expected to begin in 2020. In total, TransLink anticipates
$252 million in DCC revenues from 2018-27.
NEW REGIONAL FUNDING CAPACITY TO BE ENABLED:
The Province of British Columbia will enable new funding capacity for TransLink equivalent to $30
million per year, starting in 2019. They have committed to introducing legislation to increase the cap on
the regional motor fuel tax to 18.5 cents per litre to enable TransLink to increase the motor fuel tax by
spring 2019. The Phase Two Plan includes an increase to the motor fuel tax of 1.5 cents, to 18.5 cents
per litre, beginning in 2019. This change will increase motor fuel tax revenue by approximately $30
million per year, beginning 2019.
GOVERNMENT TRANSFERS
Total transfers from government are estimated at $3,832 million from 2018-27.
GOLDEN EARS BRIDGE REPLACEMENT TOLL REVENUE
TransLink receives compensation from the Province of British Columbia for foregone projected toll
revenues from the Golden Ears Bridge. In total, TransLink anticipates $689 million in replacement toll
revenue from 2018-27.
CANADA LINE OPERATIONS
TransLink receives an operating contribution from the Province of British Columbia representing
deferred provincial contributions for the Canada Line. In total, TransLink anticipates $192 million in
provincial contributions towards Canada Line operating expenditures from 2018-27.

41 PHASE TWO OF THE TEN YEAR VISION – INVESTMENT PLAN
MOTOR FUEL SALES TAX
Under the Motor Fuel Tax Act, TransLink receives a portion (17 cents per litre) of the tax assessed
on clear gasoline and diesel fuel sold in Metro Vancouver.
TransLink anticipates $3.88 billion in motor fuel sales tax revenues from 2018-27. Per the section
above on New Regional Funding Capacity, the Province of British Columbia has committed to
introducing legislation to increase the cap on the regional motor fuel tax to 18.5 cents per litre
to enable TransLink to increase the motor fuel tax by spring 2019. This increase would bring the
total anticipated motor fuel sales tax revenues from 2018-27 to $4.15 billion. Motor fuel sales
are assumed to stay constant year over year, due to declining per capita vehicle kilometres
travelled and increasing fuel efficiency.
HYDRO LEVY
TransLink collects a hydro levy on every dwelling unit account with the British Columbia Hydro
and Power Authority in the region. Under the SCBCTA Act, TransLink may levy $1.90 per account
per month. This levy is sometimes referred to as the “Power levy”.
The Phase Two Plan maintains the power levy at the statutory maximum of $1.90 per account per
month. In total, TransLink anticipates $227 million in power levy revenues from 2018-27.
REVENUE RECOVERIES
TransLink anticipates $62 million in revenue recoveries from 2018-27.
AMORTIZATION OF DEFERRED CONCESSIONAIRE CREDIT
TransLink amortizes contributions made by the Canada Line concessionaire to design and
construct the Canada Line in exchange for the right to operate over the concession term. These
dollars are not available to fund operations. TransLink anticipates amortization of $233 million
from the deferred concessionaire credit from 2018-27.
INTEREST INCOME
TransLink earns interest on sinking funds, capital contributions, debt reserve funds, and cash
balances. Most of this interest income is restricted and cannot be used to fund operations,
with the exception of interest from cash balances. Unrestricted Interest from cash balances are
anticipated at $169 million from 2018-27. In total, TransLink anticipates $656 million in interest
income from 2018-27.

PHASE TWO OF THE TEN YEAR VISION – INVESTMENT PLAN 42
CAPITAL FUNDING AND PARTNER GOVERNMENT CONTRIBUTIONSThe Phase Two Plan includes funding from all three levels of government: federal, provincial,
and regional. Partner governments contribute to TransLink’s capital projects through a variety of
funding programs, including the Public Transit Infrastructure Fund, Building Canada Fund, and the
Greater Vancouver Regional Fund.
See Table 6 for a table of capital funding, which includes:
PUBLIC TRANSIT INFRASTRUCTURE FUND
The Public Transit Infrastructure Fund (PTIF) is a federal funding program to strengthen
communities and grow the economy by investing in expansion, rehabilitation, modernization,
and optimization of public transit infrastructure.
The Phase One Plan included $370 million committed by the Government of Canada from the
first round of PTIF for capital projects. The Phase Two Plan includes $2.0 billion committed by the
Government of Canada from the second round of PTIF for capital projects, including construction
of the Millennium Line Broadway Extension and Surrey-Newton-Guildford Line; modernization
and expansion of Expo and Millennium Lines; and project development and potential early works
for the Surrey-Langley Line. See Table 7 for a list of projects to be funded by PTIF.
PROVINCIAL CONTRIBUTION TOWARDS 10-YEAR VISION
The Government of British Columbia has committed to funding 40% of the Phase Two expansion
capital costs of the 10-Year Vision.
The Phase One Plan included $246 million in provincial contributions towards capital projects
from the 10-Year Vision. The Phase Two Plan anticipates $2.5 billion in provincial contributions
for capital projects from the 10-Year Vision.
GREATER VANCOUVER REGIONAL FUND
The Greater Vancouver Regional Fund (GVRF) pools 95% of the per capital allocation of federal
gas tax funds of the Metro Vancouver Regional District and its member governments to support
eligible regional transportation projects delivered by TransLink. This funding is administered by
Metro Vancouver and MVRD Board must approve TransLink’s submittal of eligible projects.
The Plan includes $1.74 billion in GVRF contributions from 2018-27 to support eligible transit
fleet expansion and system modernization projects. See Table 8 for a list of projects to be funded
by the GVRF.

43 PHASE TWO OF THE TEN YEAR VISION – INVESTMENT PLAN
BUILDING CANADA FUND
The Building Canada Fund (BCF) is a federal funding program that preceded the Public Transit
Infrastructure Fund (PTIF). TransLink has received funding from the BCF for SkyTrain station
upgrades.
TransLink continues to apply BCF contributions to projects underway. See Table 9 for a list of
projects to be funded by the BCF.
SALE OF SURPLUS PROPERTY
TransLink will apply proceeds from the sale of surplus property to the properties required for the
Phase 2 Plan transit expansion. The proceeds utilized are assumed as $290 million from 2018-27.
ESTABLISHED BORROWING LIMITTransLink previously had an established borrowing limit of $4.0 billion. The Phase Two Plan
increases the amount TransLink may borrow by $1.5 billion so that the revised borrowing
limit becomes $5.5 billion. This supports TransLink’s ability to deliver the regional share of
capital expenditures in this plan. In accordance with the SCBCTA Act, the Mayors’ Council has
consulted with the Metro Vancouver Board of Directors on this change to the borrowing limit.
On June 14, 2018 the Metro Vancouver Board of Directors transmitted a letter to the Mayors'
Council communicating its support for the proposed borrowing limit increase. See Table 5 for the
borrowing limit and gross direct borrowing by year, along with selected financial policies.

PHASE TWO OF THE TEN YEAR VISION – INVESTMENT PLAN 44
5CONSULTATION ON THE PHASE
TWO PLAN

45 PHASE TWO OF THE TEN YEAR VISION – INVESTMENT PLAN
The SCBCTA Act requires that TransLink consult with the following groups on the investment plan:
• the public in the transportation service region,
• the Mayors’ Council on Regional Transportation,
• Metro Vancouver Regional District, and
• any municipality and other organization that TransLink considers will be affected.
During the development of the Phase Two Plan in 2017 and 2018, TransLink met these statutory
requirements for consultation by:
• Holding eight open house events across the region (Coquitlam, Vancouver, City of North
Vancouver, Maple Ridge, Richmond, Surrey,Burnaby, City of Langley) and one informational
session (White Rock).
• Providing information on the proposed plan and an online questionnaire at tenyearvision.
translink.ca, as well as commissioning an independent research survey of area residents
• Convening workshops with the Mayors’ Council, senior staff from local governments, and
region MLAs on proposed investments
• Presentation to the Regional Planning Committee of Metro Vancouver
• Meeting with industry associations and stakeholder groups
Additionally, by practice TransLink consults with the public and stakeholders on major initiatives,
including those funded through the Phase Two Plan. Throughout the development period of the
Phase Two Plan TransLink also consulted separately on Phase One B-Lines, Area Transport Plans,
Transit Fare Review, and the major rapid transit projects. TransLink will continue to consult with
the public through project development and implementation and through regular area planning
updates.
TransLink received comments on the Plan through various public and stakeholder consultation
activities. Most of the comments received during the consultation period were collected through
the questionnaire, which was also made available at open houses on tablet computers and
in paper format. A small number of organizations submitted letters to TransLink about the
Plan. Over 900 people attended the open houses, and more than 2,700 questionnaires were
completed.
In addition to the public consultation questionnaire, an independent research survey was
conducted by the external polling group, NRG. The research survey asked the same questions as
the public consultation survey, but using a random sample of 2,000 Metro Vancouver adults. The
results were then weighted to more accurately represent the known population proportions of
age, gender and area of residence.

PHASE TWO OF THE TEN YEAR VISION – INVESTMENT PLAN 46
TRANSIT AND TRANSPORTATION IMPROVEMENTS
SUMMARY OF INPUT
Questionnaire participants were asked to rate how important they felt each proposed
transportation improvement was for the region. More than two-thirds (66%) of respondents
indicated that building the Millennium Line Broadway Extension, more SkyTrain service, and
more bus service were “Extremely Important” or “Very important.”
A majority of respondents – more than 50% - rated upgrades to the Expo-Millennium line and
upgrading major roads as “Extremely Important” or “Very important.”
Relative to the other improvements, upgrades to cycling and pedestrian infrastructure, more
HandyDART service, and building the Surrey-Newton Guildford LRT were more likely to be rated
as only “slightly important” or “not at all important.” Still, over 50% of respondents agreed
that these improvements were either “Moderately important”, “Very important” or “Extremely
important.”
The research survey yielded similar results, but with higher importance given to Surrey-Newton-
Guildford LRT (61% of respondents rated the investment as “moderately”, “very”, or “extremely”
important), and to upgrading major roads (89% viewed the investment as “moderately”, “very”,
or “extremely” important). Respondents to the research survey placed a lower importance on
cycling and pedestrian infrastructure investments – only 26% of respondents felt these upgrades
were “extremely” or “very” important.
ASSESSMENT AND RESPONSE TO INPUT
In general there was strong support for increased bus and SkyTrain service across the region,
including service to new areas, and for expanding rapid transit as laid out in the Mayors’ 10-Year
Vision. Respondents emphasized the urgent need to deliver on the investments in Phase Two and
also stressed the need to go further – to contemplate funding the final phase of investments in
the Mayors’ Vision.

47 PHASE TWO OF THE TEN YEAR VISION – INVESTMENT PLAN
FUNDING SOURCES
SUMMARY OF INPUT
When asked to weigh in on the fairness of each option, the Development Cost Charge on new
development received the most favourable response. Approximately 73% of respondents view
this source as “Very fair” or “Somewhat fair.” An increase to property taxes received the least
favourable response, although respondents were evenly split in their views. Roughly 42% of
respondents found a property tax increase to be an unfair source of funding, rating it as either
“Somewhat unfair” or “Very unfair,” while 43% of respondents indicated that a property tax
increase was a fair source, rating it as “Very fair” or “Somewhat fair.”
Respondents rated an increase to transit fares and an increase to the parking tax similarly, as
less fair than a DCC, but more fair than property taxes. 58% and 59% of respondents believed an
increase to transit fares and an increase to the parking tax increase as “Very fair” or “Somewhat
fair,” respectively. 29% and 28% of respondents thought an increase to the parking tax and an
increase to transit fares were “Somewhat unfair” or “Very unfair,” respectively.
Results from the research survey were in line with results from the public questionnaire, where
the development cost charge was seen as the fairest funding source and an increase property
taxes as the least fare. On average, research survey respondents viewed all funding sources
slightly less favourably than respondents to the public questionnaire.
ASSESSMENT AND RESPONSE TO INPUT
While some respondents were apprehensive about the increases to various funding sources and
concerned about a disproportionate burden on different users or groups, many respondents
acknowledged that the proposed sources were fair, especially given the existing revenue tools
currently available to the region.

PHASE TWO OF THE TEN YEAR VISION – INVESTMENT PLAN 48
APPENDICES

49 PHASE TWO OF THE TEN YEAR VISION – INVESTMENT PLAN

PHASE TWO OF THE TEN YEAR VISION – INVESTMENT PLAN 50
The Phase Two Plan anticipates revenues from existing and modified sources such as fare
revenues and property taxes, but it also contemplates revenue from sources that require enabling
legislation from the provincial government, including:
• An increase to the parking tax that is anticipated to generate $10 million per year in
additional revenue beginning in 2019, and
• An increase to the motor fuel tax that is anticipated to generate $30 million per year in
additional revenue beginning in 2019.
The provincial government has committed to advancing the necessary legislative changes for
these funding sources by spring 2019. However, if the enabling legislation is delayed or not
passed and those funding sources cannot be implemented on the anticipated timeline, this
plan will have a revenue shortfall. To the extent that this shortfall is not offset by greater than
anticipated revenues from other sources, then part of the expansion that has been contemplated
in the Phase Two Plan would need to be deferred as outlined in the table below.
To fulfill the requirements of the SCBCTA Act, this Plan includes schedules for both scenarios:
Appendix A provides summary schedules assuming that all required funding sources are enabled
and implemented in 2019.
Appendix B provides summary schedules assuming the new provincially-enabled revenue capacity
(motor fuel tax) or increases to the parking tax are not enabled and implemented in 2019.
The remaining appendices include:
Appendix C provides more detail on planned bus service improvements by sub-region.
Appendix D identifies a list of eligible projects to be funded in part by the new regional development
cost charge. The funds would be accessed from a reserve fund that will be set up for the
development cost charge.
EXPANSION IN THE PHASE TWO PLAN
INVESTMENT CATEGORY WITH FULL FUNDING WITH FUNDING REDUCED BY $40 MILLION PER YEAR
Conventional bus service 8% increase over previous service levels <1% increase over previous service levels
HandyDART Service 7% increase over previous service levels No increase over previous service levels
SkyTrain service 42% increase over previous service levels 37% increase over previous service levels
Roads, walking, & cycling $125 million in funding for roads, walking & cycling No additional funding for roads, walking & cycling
Notes: Previous service levels are defined as budgeted service levels in 2016, the year before implementation of the 10-Year Vision began. Conventional bus service includes both directly operated and contracted bus services.

51 PHASE TWO OF THE TEN YEAR VISION – APPENDIX A
Appendix A: Schedules with Full FundingThis appendix provides summary schedules for the Phase Two Plan, assuming that all required
funding sources are enabled and implemented in 2019.
If the provincial government does not pass the necessary enabling legislation, and to the extent
that this is not offset by greater than anticipated revenues from other sources, then part of the
expansion that has been contemplated for 2019 and later would need to be deferred. Schedules
for these circumstances can be found in Appendix B.
All amounts in Appendix A are in year of expenditure dollars.

PHASE TWO OF THE TEN YEAR VISION – INVESTMENT PLAN 52
1 The Accumulated Surplus is derived under Public Sector Accounting Standards and does not represent cash available. A large driver of the increase in accumulated surplus is due to revenue from government transfers for funding capital investments. The related amortization expense, which is based on the useful life of the asset, will offset this increase in government transfers revenue over time.
TABLE 1 : CONSOLIDATED STATEMENT OF FINANCIAL POSITION ($ THOUSANDS)For the years ending 31 Dec.
2018 2019 2020 2021 2022 2023 2024 2025 2026 2027
Financial assets
Cash and investments 330,776 443,889 430,433 410,688 398,455 404,692 368,089 307,221 286,513 295,155
Accounts receivable 115,208 118,664 122,224 125,891 129,668 133,558 137,565 141,692 145,942 150,321
Loan receivable 250,734 190,009 127,997 64,670 - - - - - -
Restricted cash and investments 623,774 624,803 683,892 826,437 984,055 1,095,231 1,222,023 1,229,462 1,361,640 1,444,762
Debt reserve deposits 29,549 28,182 28,882 26,878 24,370 24,978 23,178 21,816 11,077 6,766
1,350,040 1,405,547 1,393,428 1,454,564 1,536,548 1,658,459 1,750,855 1,700,190 1,805,172 1,897,004
Liabilities
Accounts payable and accrued liabilities
(320,201) (325,004) (329,879) (334,827) (339,850) (344,947) (350,122) (355,373) (360,704) (366,115)
Debt (2,720,678) (3,112,511) (3,300,530) (3,677,554) (3,898,875) (4,283,270) (4,410,682) (4,355,696) (4,413,482) (4,437,566)
Deferred government transfers
(970,392) (948,792) (1,005,088) (1,115,307) (1,167,545) (1,198,826) (1,057,746) (927,707) (781,592) (643,524)
P3 contractor liability (1,039,955) (1,061,753) (1,226,825) (1,276,560) (1,320,449) (1,211,935) (1,167,024) (1,117,071) (1,061,659) (1,000,338)
Deferred concessionaire credit
(502,448) (479,111) (455,774) (432,437) (409,099) (385,762) (362,425) (339,088) (315,751) (292,413)
Employee future benefits (138,403) (141,608) (148,245) (155,861) (164,106) (173,277) (183,211) (193,518) (204,357) (215,021)
Deferred lease inducements (11,648) (10,811) (9,973) (9,136) (8,298) (7,461) (6,623) (5,785) (4,948) (4,110)
(5,703,726) (6,079,589) (6,476,314) (7,001,680) (7,308,221) (7,605,479) (7,537,833) (7,294,239) (7,142,492) (6,959,087)
Net debt (4,353,686) (4,674,043) (5,082,886) (5,547,117) (5,771,674) (5,947,020) (5,786,978) (5,594,048) (5,337,320) (5,062,083)
Non-financial assets
Tangible capital assets 5,561,228 5,981,076 6,563,766 7,004,522 7,201,998 7,501,172 7,498,428 7,358,120 7,333,103 7,401,780
Supplies inventory 67,252 69,269 71,347 73,488 75,692 77,963 80,302 82,711 85,193 87,748
Prepaid expenses 22,045 22,706 23,388 24,089 24,812 25,556 26,323 27,113 27,926 28,764
5,650,525 6,073,052 6,658,502 7,102,099 7,302,503 7,604,691 7,605,053 7,467,944 7,446,222 7,518,292
Accumulated surplus1 1,296,839 1,399,009 1,575,615 1,554,982 1,530,829 1,657,671 1,818,075 1,873,895 2,108,902 2,456,209

TABLE 2 : CONSOLIDATED STATEMENT OF OPERATIONS ($ THOUSANDS)
2018 2019 2020 2021 2022 2023 2024 2025 2026 2027 TOTAL 2018-2027
Revenue
Taxation 825,072 890,856 947,311 971,643 993,730 1,016,728 1,040,664 1,065,591 1,091,553 1,118,594 9,961,742
Fuel tax 358,409 388,986 389,568 390,156 390,750 391,350 391,955 392,567 393,185 393,809 3,880,735
Property tax
Standard Property Tax: Previous Year + 3%
355,882 366,558 396,286 417,289 439,405 459,179 479,842 501,435 523,999 547,579 4,487,455
Standard Property Tax: Additional - 18,185 8,849 9,318 6,399 6,687 6,988 7,302 7,631 7,974 79,335
Replacement tax 18,000 18,000 18,000 18,000 18,000 18,000 18,000 18,000 18,000 18,000 180,000
Parking Rights 71,523 77,541 83,704 84,959 86,234 87,527 88,840 90,173 91,525 92,898 854,923
Hydro levy 21,258 21,585 21,905 22,225 22,534 22,847 23,153 23,463 23,778 24,096 226,843
Development cost charges - - 29,000 29,696 30,409 31,139 31,886 32,651 33,435 34,237 252,452
Transit
Fares 585,172 617,514 654,591 688,901 731,786 763,146 803,561 856,535 885,601 918,833 7,505,641
Other transit 21,634 23,254 22,985 24,270 23,902 25,136 25,661 26,680 26,101 27,125 246,748
New provincially-enabled regional revenue capacity
- 30,000 30,000 30,000 30,000 30,000 30,000 30,000 30,000 30,000 270,000
Government transfers - Capital 340,877 219,320 326,713 174,903 105,529 259,991 351,564 259,394 409,951 502,484 2,950,726
Government transfers - Operating 19,227 19,227 19,227 19,227 19,227 19,227 19,227 19,227 19,227 19,227 192,270
Government transfers - Golden Ears Bridge tolling replacement
57,866 60,072 62,366 64,751 67,231 69,810 72,492 75,281 78,181 81,197 689,248
Pattullo Bridge Operational Cost Subsidy
- - - - - - - - - - -
Investment income - Restricted 42,585 40,013 41,562 43,931 45,339 46,557 53,395 57,544 59,971 56,195 487,091
Investment income - Unrestricted 9,355 11,402 13,812 15,401 19,074 21,497 22,530 20,227 18,235 17,606 169,139
Amortization of deferred concessionaire credit
23,337 23,337 23,337 23,337 23,337 23,337 23,337 23,337 23,337 23,337 233,372
Revenue Recoveries 6,036 6,481 6,218 6,265 5,888 6,002 6,101 6,220 6,341 6,464 62,016
Sub Total Continuing Operations Revenue 1,931,161 1,941,475 2,148,122 2,062,630 2,065,043 2,281,431 2,448,533 2,440,036 2,648,498 2,801,064 22,767,994
Gain on disposal (447) (456) (465) (475) (484) (494) (504) (514) (524) (534) (4,896)
Total Revenue (PSAB) 1,930,714 1,941,019 2,147,657 2,062,155 2,064,559 2,280,938 2,448,029 2,439,522 2,647,974 2,800,530 22,763,097
53 PHASE TWO OF THE TEN YEAR VISION – APPENDIX A

PHASE TWO OF THE TEN YEAR VISION – INVESTMENT PLAN 54
TABLE 2 : CONSOLIDATED STATEMENT OF OPERATIONS CONT'D ($ THOUSANDS)
2018 2019 2020 2021 2022 2023 2024 2025 2026 2027 TOTAL 2018-2027
Expenditures
Bus 733,402 764,285 814,142 864,667 897,650 917,172 936,524 957,055 977,637 999,069 8,861,602
Corporate 95,175 94,500 101,513 106,033 107,610 111,129 115,384 120,725 124,195 127,184 1,103,449
Rail 309,736 332,478 356,810 362,433 388,243 398,136 436,794 486,132 496,983 508,078 4,075,822
Roads and bridges 104,255 149,646 138,626 140,568 76,865 79,237 81,671 84,247 86,578 90,280 1,031,974
Transit Police 38,397 40,912 41,381 42,208 43,053 43,914 44,792 45,688 46,601 47,534 434,480
Amortization of tangible capital assets1
220,618 253,145 283,741 307,952 324,627 354,698 376,681 371,787 366,440 373,529 3,233,218
Interest 181,471 192,126 209,047 225,343 233,259 244,270 290,178 310,329 307,732 301,758 2,495,512
Sub Total Continuing Operations Expenditures
1,683,055 1,827,092 1,945,260 2,049,204 2,071,306 2,148,555 2,282,024 2,375,963 2,406,166 2,447,431 21,236,056
Corporate - onetime expenditures 31,136 11,758 25,791 33,584 17,406 5,541 5,601 7,738 6,802 5,791 151,147
Total Expenditures (PSAB) 1,714,190 1,838,850 1,971,051 2,082,788 2,088,712 2,154,096 2,287,626 2,383,701 2,412,968 2,453,223 21,387,204
Surplus (Deficit) for the period (PSAB) 216,524 102,170 176,606 (20,633) (24,153) 126,842 160,404 55,820 235,007 347,307 1,375,894
Accumulated Surplus1, beginning of the year 1,080,315 1,296,839 1,399,009 1,575,615 1,554,982 1,530,829 1,657,671 1,818,075 1,873,895 2,108,902 1,080,315
Accumulated Surplus1, end of the year 1,296,839 1,399,009 1,575,615 1,554,982 1,530,829 1,657,671 1,818,075 1,873,895 2,108,902 2,456,209 2,456,209
1 The Accumulated Surplus is derived under Public Sector Accounting Standards and does not represent cash available. A large driver of the increase in accumulated surplus is due to revenue from government transfers for funding capital investments. The related amortization expense, which is based on the useful life of the asset, will offset this increase in government transfers revenue over time.

55 PHASE TWO OF THE TEN YEAR VISION – APPENDIX A
TABLE 3: CONSOLIDATED STATEMENT OF CHANGES IN NET DEBT ($ THOUSANDS)
2018 2019 2020 2021 2022 2023 2024 2025 2026 2027
Surplus for the year 216,524 102,170 176,606 (20,633) (24,153) 126,842 160,404 55,820 235,007 347,307
Acquisition of tangible capital assets
(786,358) (672,992) (866,431) (748,707) (522,104) (653,871) (373,937) (231,479) (341,424) (442,206)
Amortization of tangible capital assets
220,618 253,145 283,741 307,952 324,627 354,698 376,681 371,787 366,440 373,529
Gain on disposal of tangible capital assets
- - - - - - - - - -
Net Proceeds from disposal of tangible capital assets
- - - - - - - - - -
Tangible capital assets contributed to (from) municipalities
(12,000) - - - - - - - - -
Write-down of tangible capital assets
(577,740) (419,848) (582,690) (440,755) (197,477) (299,173) 2,744 140,308 25,016 (68,677)
Changes in supplies inventory (1,959) (2,018) (2,078) (2,140) (2,205) (2,271) (2,339) (2,409) (2,481) (2,556)
Changes in prepaid expenses (642) (661) (681) (702) (723) (744) (767) (790) (813) (838)
(2,601) (2,679) (2,759) (2,842) (2,927) (3,015) (3,106) (3,199) (3,295) (3,394)
(Increase) decrease in net debt (363,817) (320,357) (408,844) (464,231) (224,557) (175,347) 160,042 192,930 256,728 275,237
Net debt, beginning of year (3,989,869) (4,353,686) (4,674,043) (5,082,886) (5,547,117) (5,771,674) (5,947,020) (5,786,978) (5,594,048) (5,337,320)
Net debt, end of year (4,353,686) (4,674,043) (5,082,886) (5,547,117) (5,771,674) (5,947,020) (5,786,978) (5,594,048) (5,337,320) (5,062,083)

TABLE 4 : CONSOLIDATED STATEMENT OF CASH FLOW ($ THOUSANDS)
2018 2019 2020 2021 2022 2023 2024 2025 2026 2027 TOTAL 2018-2027
Cash provided by (used for):
Operating Transactions
Surplus for the year 216,524 102,170 176,606 (20,633) (24,153) 126,842 160,404 55,820 235,007 347,307 1,375,894
Non-cash changes to operations:
Amortization of capital assets 220,618 253,145 283,741 307,952 324,627 354,698 376,681 371,787 366,440 373,529 3,233,218
Amortization of bond issue costs (100) (279) (261) (613) (634) (646) (577) (736) (786) (825) (5,457)
Amortization of Deferred Concessionaire credits
(23,337) (23,337) (23,337) (23,337) (23,337) (23,337) (23,337) (23,337) (23,337) (23,337) (233,372)
Amortization of deferred government transfers
(340,877) (219,320) (326,713) (174,903) (105,529) (259,991) (351,564) (259,394) (409,951) (502,484) (2,950,726)
Write-down of capital assets/deferred lease inducements
(838) (838) (838) (838) (838) (838) (838) (838) (838) (838) (8,376)
Net change in contractor liability
65,905 65,525 65,023 64,390 63,614 64,242 79,166 75,727 71,912 67,693 683,197
Loan Receivables interest - transfer from restricted fund
(6,536) (5,275) (3,988) (2,673) (1,330) - - - - - (19,803)
Non-cash changes to operations (85,166) 69,620 (6,373) 169,978 256,573 134,129 79,532 163,209 3,441 (86,261) 698,682
Changes in non-cash operating working capital
15,276 1,873 5,193 6,055 6,564 7,364 7,996 8,233 8,624 8,304 75,480
146,634 173,663 175,427 155,400 238,984 268,334 247,932 227,262 247,071 269,349 2,150,055
Capital transactions:
Net Proceed/(Purchase) for Real Estate Transactions
44,611 118,964 26,425 - - - - - - - 190,000
Purchase of capital assets (excluding MRN)
(786,358) (672,992) (866,431) (748,707) (522,104) (653,871) (373,937) (231,479) (341,424) (442,206) (5,639,510)
(741,747) (554,028) (840,006) (748,707) (522,104) (653,871) (373,937) (231,479) (341,424) (442,206) (5,449,510)
PHASE TWO OF THE TEN YEAR VISION – INVESTMENT PLAN 56

TABLE 4 : CONSOLIDATED STATEMENT OF CASH FLOW CONT'D ($ THOUSANDS)
2018 2019 2020 2021 2022 2023 2024 2025 2026 2027 TOTAL 2018-2027
Investing transactions:
(Increase)/decrease in Self-administered sinking fund
(51,686) (62,445) (27,586) (84,350) (99,179) (110,110) (124,353) (4,377) (128,462) (87,253) (779,802)
(Increase)/decrease in Cash restricted
10,000 9,280 8,441 7,490 7,275 7,051 6,782 6,527 6,257 5,969 75,072
Decrease/(increase) in debt reserve fund deposits
3,205 1,367 (700) 2,004 2,508 (608) 1,800 1,362 10,739 4,311 25,988
External Funding of Assets (non-government funding)
- 29,209 174,454 61,245 57,686 (90,164) - - - - 232,429
(38,482) (22,590) 154,609 (13,611) (31,711) (193,831) (115,772) 3,513 (111,466) (76,972) (446,313)
Financing transactions:
Bonds issued 345,874 484,396 336,048 485,647 326,191 480,979 217,682 160,021 139,063 144,382 3,120,283
Sinking Funds Maturities 138,800 50,000
- 66,200 80,000 - 65,000 - 280,000 260,000 940,000
Sinking Fund interest (27,981) (24,646) (24,981) (27,513) (26,843) (25,331) (27,602) (26,717) (28,918) (20,008) (260,540)
Sinking Fund payments (44,012) (36,357) (34,700) (34,700) (32,698) (30,278) (30,278) (28,313) (28,313) (18,910) (318,558)
P3 contractor liability payment (71,507) (72,936) (74,405) (75,900) (77,410) (82,591) (124,077) (125,679) (127,324) (129,014) (960,845)
Government transfers received for capital additions
338,635 192,867 377,326 278,864 150,246 283,154 201,264 119,765 253,863 354,044 2,550,028
Short-term debt repayments (15,696) (28,752) (35,493) (43,139) (41,968) (37,531) (28,945) (26,300) (23,260) (22,023) (303,107)
Bonds matured (141,266) (52,529) (52,593) (68,859) (82,727) (2,797) (67,868) (132,941) (280,000) (310,000) (1,191,581)
Payments received for Land Reserve net to unrestricted
2,712 4,026 5,313 6,573 7,807 - - - - - 26,432
525,560 516,069 496,514 587,173 302,598 585,605 205,175 (60,164) 185,110 258,472 3,602,112
Increase/(decrease) in cash (108,035) 113,113 (13,456) (19,745) (12,233) 6,236 (36,603) (60,868) (20,708) 8,642 (143,656)
Cash, beginning of period 438,811 330,776 443,889 430,433 410,688 398,455 404,692 368,089 307,221 286,513 438,811
Cash, end of period 330,776 443,889 430,433 410,688 398,455 404,692 368,089 307,221 286,513 295,155 295,155
57 PHASE TWO OF THE TEN YEAR VISION – APPENDIX A

PHASE TWO OF THE TEN YEAR VISION – INVESTMENT PLAN 58
TABLE 5: PROJECTED BORROWING COMPARED TO BORROWING LIMIT AND SELECT FINANCIAL RATIOS ($ MILLLIONS)
2018 2019 2020 2021 2022 2023 2024 2025 2026 2027
Established Borrowing Limit - Gross Direct Debt
5,500 5,500 5,500 5,500 5,500 5,500 5,500 5,500 5,500 5,500
Closing Gross Direct Borrowing 3,301 3,704 3,952 4,325 4,525 4,965 5,086 5,086 4,921 4,724
Total Closing Net Direct Borrowing 2,434 2,765 2,924 3,219 3,344 3,617 3,622 3,564 3,504 3,454
Net MFA Debt, net of DRF 557 494 431 367 307 247 188 131 83 48
Net TL Direct 1,877 2,270 2,493 2,852 3,037 3,370 3,434 3,434 3,421 3,406
Net Debt (Closing Net Borrowing)1 3,976 4,305 4,607 4,928 5,073 5,215 5,152 5,020 4,882 4,747
New Direct Borrowing for Capital2 346 484 336 486 326 481 218 160 139 144
Net Debt / Operating Revenues <300% 262% 261% 264% 273% 271% 270% 258% 241% 228% 216%
Gross Interest / Operating Revenues <20%
12% 12% 12% 12% 12% 13% 15% 15% 14% 14%
Net Debt per capita3 <$2,000 1,520 1,623 1,713 1,808 1,837 1,863 1,816 1,746 1,676 1,608
Accumulated Funding Resources (AFR)4 331 444 430 411 398 405 368 307 287 295
AFR as a percentage of Total Funding Requirements 5
21.4% 27.6% 24.8% 22.3% 20.9% 20.9% 17.7% 14.1% 13.0% 13.2%
Minimum AFR required to meet Policy (%): 15% 15% 15% 12% 12% 12% 12% 12% 12% 12%
Excess/(shortfall) from minimum 99 203 170 190 170 172 119 45 21 26
1: Includes TransLink's Direct Debt, net of sinking funds and debt reserve deposits2: Excludes debt refinancing3: Includes all Direct and Indirect Debt4: Accumulated Funding Resources (AFR) = Unrestricted Cash & Investments5: Funding Requirements = Total Expenses (excluding Depreciation and Capital funding to Municipalities) + Debt Service costs

TABLE 6A : CAPITAL EXPENDITURES AND INFRASTRUCTURE CONTRIBUTIONS ($ MILLIONS)
CAPITAL EXPENDITURES 2018 2019 2020 2021 2022 2023 2024 2025 2026 2027 TOTAL 2018-2027
Bus
Base Capital
Equipment 21 3 1 5 5 - - - - - 34
Facilities 24 30 5 3 3 4 3 3 7 2 84
Infrastructure 51 45 41 25 21 13 13 14 8 12 241
Technology 2 4 2 - - - - - - - 7
Vehicles 297 115 144 27 24 137 197 111 281 393 1,726
New For Phase 2
Infrastructure 32 10 40 121 45 3 2 2 2 2 258
Vehicles - - 119 76 - - - - 1 1 196
Bus Total 428 206 350 256 98 156 214 130 299 410 2,547
Rail
Base Capital
Equipment 24 32 26 13 3 - - - - - 97
Facilities 11 20 2 2 3 3 - - - - 41
Infrastructure 97 124 48 46 47 23 20 32 16 11 463
Technology 12 14 11 9 - 1 - 1 - - 47
Vehicles 36 25 13 1 9 97 92 21 - - 294
New For Phase 2
Facilities 41 9 25 27 2 1 28 29 1 1 165
Infrastructure 60 174 359 354 337 350 - - - - 1,634
Rail Total 279 398 484 451 401 475 140 83 18 12 2,741
Corporate
Facilities 3 3 - - - - - - - - 6
Infrastructure 57 4 - - - - - - - - 61
Technology 14 26 20 23 21 22 17 18 23 19 201
Non-Revenue Vehicles 1 - - - 1 1 1 - - 1 5
Corporate Total 73 33 21 24 22 22 18 18 24 20 273
TransLink-Owned Roads and Bridges
TransLink-Owned Cycling - Base 6 8 1 1 1 1 1 1 1 1 22
TransLink-Owned Cycling - New for Phase Two
- - 5 5 - - - - - - 11
TransLink-Owned Cycling 6 8 6 6 1 1 1 1 1 1 33
TransLink-Owned Roads and Bridges 13 28 5 12 - - - - - - 58
TransLink-Owned Roads and Bridges Total 19 36 12 18 1 1 1 1 1 1 91
Sub-total TransLink Capital Expenditures
799 673 866 749 522 654 374 231 341 442 5,652
59 PHASE TWO OF THE TEN YEAR VISION – APPENDIX A

PHASE TWO OF THE TEN YEAR VISION – INVESTMENT PLAN 60
TABLE 6B : CAPITAL EXPENDITURES AND INFRASTRUCTURE CONTRIBUTIONS ($ MILLIONS)
CAPITAL INFRASTRUCTURE CONTRIBUTIONS 2018 2019 2020 2021 2022 2023 2024 2025 2026 2027 TOTAL
2018-2027
Municipal-Owned Walking and Cycling
Walking
Base 1 5 - - - - - - - - 6
New for Phase Two - - 6 6 - - - - - - 11
Total 1 5 6 6 - - - - - - 18
Regional Cycling
Base 8 21 5 4 2 2 2 2 2 2 48
New for Phase Two - - 13 14 - - - - - - 27
Total 8 21 19 18 2 2 2 2 2 2 75
Municipal-Owned Walking and Cycling Total 10 26 24 24 2 2 2 2 2 2 93
Municipal-Owned Roads
MRN Pavement Rehab
Base 22 22 23 24 25 26 28 29 29 32 261
New for Phase Two - - - - - - - - - - -
Total 22 22 23 24 25 26 28 29 29 32 261
MRN Upgrades
Base 15 34 4 3 - - - - - - 56
New for Phase Two - - 22 23 - - - - - - 46
Total 15 34 27 26 - - - - - - 102
MRN Seismic
Base 7 21 3 2 - - - - - - 33
New for Phase Two - - 15 15 - - - - - - 30
Total 7 21 17 17 - - - - - - 62
Municipal-Owned Roads Total 43 77 67 68 25 26 28 29 29 32 425
Sub-total Capital Infrastructure Contributions
53 103 91 92 27 28 29 30 31 33 518
Total Capital Expenditures and Infrastructure Contributions
852 776 958 841 549 682 403 262 372 475 6,170

TABLE 6C : CAPITAL EXPENDITURES AND INFRASTRUCTURE CONTRIBUTIONS ($ MILLIONS)
CAPITAL FUNDING CONTRIBUTIONS 2018 2019 2020 2021 2022 2023 2024 2025 2026 2027 TOTAL
2018-2027
Federal
Federal Public Transit Infrastructure Fund (PTIF)
85 53 133 187 129 155 20 20 1 1 784
Municipal 13 1 1 1 1 1 1 1 1 - 18
Regional
Greater Vancouver Regional Fund (GVRF)
251 117 244 91 21 127 181 99 253 353 1,737
Additional Regional Proceeds from Sale of Assets
60 60 60 5 5 - - - - - 190
Regional Proceeds from Sale of Assets
10 10 10 10 10 10 10 10 10 10 100
P3 & Bridge Finance - 29 174 61 58 50 - - - - 373
Other 87 22 - - - - - - - - 109
Total Capital Funding Contributions 506 292 622 355 223 343 211 130 264 364 3,310
Note: TransLink’s financial statements reflect the financial assets that are owned by TransLink. As part of the investment plan, the province will be contributing funds for which they will be receiving assets. These funds and assets are treated as recoveries and are not recognized on TransLink’s financial statements. In addition to the provincial funds contributed, the province will also receive a proportional share of the federal funds contributed towards the expansion projects which are also treated as recoveries and not included in TransLink’s financial statements. See below for respective Federal and Provincial contributions.
ANTICIPATED PROVINCIAL ASSETS 2018 2019 2020 2021 2022 2023 2024 2025 2026 2027 TOTAL
2018-2027
Federal 61 70 72 293 184 131 262 254 76 4 1,408
Provincial 303 315 396 417 291 241 304 396 106 6 2,776
61 PHASE TWO OF THE TEN YEAR VISION – APPENDIX A
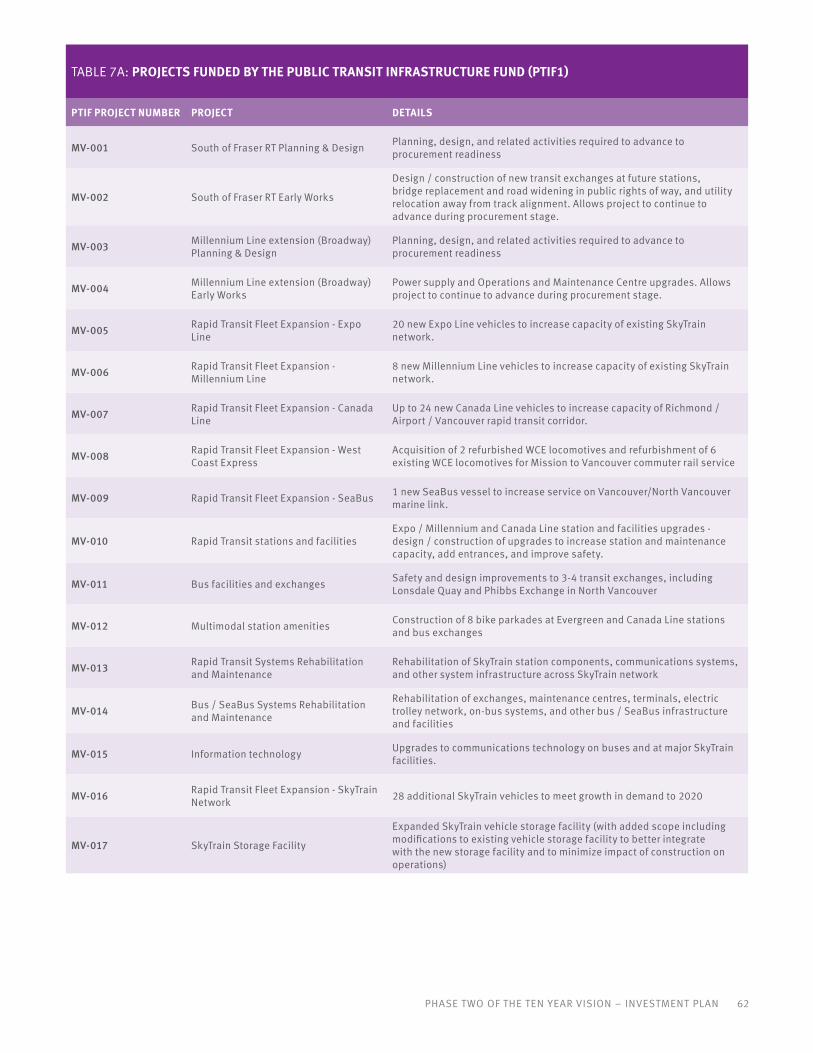
PHASE TWO OF THE TEN YEAR VISION – INVESTMENT PLAN 62
TABLE 7A: PROJECTS FUNDED BY THE PUBLIC TRANSIT INFRASTRUCTURE FUND (PTIF1)
PTIF PROJECT NUMBER PROJECT DETAILS
MV-001 South of Fraser RT Planning & Design Planning, design, and related activities required to advance to procurement readiness
MV-002 South of Fraser RT Early Works
Design / construction of new transit exchanges at future stations, bridge replacement and road widening in public rights of way, and utility relocation away from track alignment. Allows project to continue to advance during procurement stage.
MV-003 Millennium Line extension (Broadway) Planning & Design
Planning, design, and related activities required to advance to procurement readiness
MV-004 Millennium Line extension (Broadway) Early Works
Power supply and Operations and Maintenance Centre upgrades. Allows project to continue to advance during procurement stage.
MV-005 Rapid Transit Fleet Expansion - Expo Line
20 new Expo Line vehicles to increase capacity of existing SkyTrain network.
MV-006 Rapid Transit Fleet Expansion - Millennium Line
8 new Millennium Line vehicles to increase capacity of existing SkyTrain network.
MV-007 Rapid Transit Fleet Expansion - Canada Line
Up to 24 new Canada Line vehicles to increase capacity of Richmond / Airport / Vancouver rapid transit corridor.
MV-008 Rapid Transit Fleet Expansion - West Coast Express
Acquisition of 2 refurbished WCE locomotives and refurbishment of 6 existing WCE locomotives for Mission to Vancouver commuter rail service
MV-009 Rapid Transit Fleet Expansion - SeaBus 1 new SeaBus vessel to increase service on Vancouver/North Vancouver marine link.
MV-010 Rapid Transit stations and facilitiesExpo / Millennium and Canada Line station and facilities upgrades - design / construction of upgrades to increase station and maintenance capacity, add entrances, and improve safety.
MV-011 Bus facilities and exchanges Safety and design improvements to 3-4 transit exchanges, including Lonsdale Quay and Phibbs Exchange in North Vancouver
MV-012 Multimodal station amenities Construction of 8 bike parkades at Evergreen and Canada Line stations and bus exchanges
MV-013 Rapid Transit Systems Rehabilitation and Maintenance
Rehabilitation of SkyTrain station components, communications systems, and other system infrastructure across SkyTrain network
MV-014 Bus / SeaBus Systems Rehabilitation and Maintenance
Rehabilitation of exchanges, maintenance centres, terminals, electric trolley network, on-bus systems, and other bus / SeaBus infrastructure and facilities
MV-015 Information technology Upgrades to communications technology on buses and at major SkyTrain facilities.
MV-016 Rapid Transit Fleet Expansion - SkyTrain Network 28 additional SkyTrain vehicles to meet growth in demand to 2020
MV-017 SkyTrain Storage Facility
Expanded SkyTrain vehicle storage facility (with added scope including modifications to existing vehicle storage facility to better integrate with the new storage facility and to minimize impact of construction on operations)

TABLE 7B: PROJECTS FUNDED BY THE PUBLIC TRANSIT INFRASTRUCTURE FUND (PTIF2)
PROJECT DETAILS
Surrey-Newton-Guildford LRTSurrey-Newton-Guildford Light Rail Transit (SNG LRT) project is a 10.5-kilometre LRT line extending from Surrey City Centre east along 104 Avenue to Guildford Town Centre and south down King George Boulevard to Newton Town Centre.
Millennium Line Broadway ExtensionMillennium Line Broadway Extension (MLBE) is a 5.7-kilometre SkyTrain extension to the existing Millennium Line SkyTrain system from its current terminus at VCC-Clark Station to a new western terminus station at Arbutus Street.
Expo/Millennium Line UpgradeThe Expo and Millennium Upgrade Program (EMUP) expands the capacity of the existing Expo and Millennium Lines addressing shortfalls in capacity in the existing rapid transit network and supporting planned expansions including the Millennium Line Broadway Extension (MLBE).
Investments in bus infrastructure, roads, cycling and walking
Construction of a new Transit Depot and upgrades to existing depots, improvements to B-Line corridors and bus speed/reliability improvements along with investments in roads, cycling networks and walking access to transit.
Surrey-Langley Line LRT Project development and early works for Surrey-Langley line.
63 PHASE TWO OF THE TEN YEAR VISION – APPENDIX A

PHASE TWO OF THE TEN YEAR VISION – INVESTMENT PLAN 64
TABLE 8: PROJECTS FUNDED BY THE GREATER VANCOUVER REGIONAL FUND
CATEGORY YEAR PROJECT
Bus Infrastructure 2014 TOH Metrotown Group Rectifier Replacement
Bus Fleet 2015 Community Shuttle Replacement
2015 Conventional Replacement Buses
2015 2016 Conventional Bus Replacement
2016 Community Shuttle Replacement
2016 2017 Conventional Bus Replacement
2017 HandyDART Vehicle Replacement (AIP)
2017 Community Shuttle Replacement
2017 Equipment for Deferred Retirement Program
2018 Community Shuttle Replacement
2018 Conventional Bus Replacement
2018 HandyDART Vehicle Replacement
Bus-Vehicles Conventional 40
Bus-Vehicles Conventional 60
Community Shuttle Vehicles (Expansion)
CUTRIC Battery Electric Bus Trial
HandyDART Vehicles
2018 2019 Community Shuttle Replacement
2019 Conventional Bus Expansion (40H)
2019 Conventional Bus Replacement
2019 HandyDART Vehicles Expansion
2019 HandyDart Vehicle Replacement
2019 Bus-Vehicles Conventional 40 (Expansion)
Bus-Vehicles Conventional 60 (Expansion)
Community Shuttle Vehicles (Expansion)
Community Shuttle Vehicles Replacement
Conventional Bus Replacement
HandyDART Vehicles (Expansion)
HandyDART Vehicle Replacement
HandyDART Vehicle Replacement

TABLE 8: PROJECTS FUNDED BY THE GREATER VANCOUVER REGIONAL FUND CONT'D
CATEGORY YEAR PROJECT
Bus Fleet 2020 Community Shuttle Replacement
HandyDART Vehicle Replacement
2021 Community Shuttle Replacement
HandyDART Vehicle Replacement
2022 Community Shuttle Replacement
Conventional Bus Replacement
HandyDART Vehicle Replacement
2023 Community Shuttle Replacement
Conventional Bus Replacement
HandyDART Vehicle Replacement
2024 Community Shuttle Vehicles Replacement
Conventional Bus Replacement
HandyDART Vehicle Replacement
2025 Community Shuttle Replacement
Conventional Bus Replacement
HandyDART Vehicle Replacement
2026 Community Shuttle Replacement
Conventional Bus Replacement
HandyDART Vehicle Replacement
2027 Community Shuttle Replacement
Conventional Bus Replacement
HandyDART Vehicle Replacement
Rail 2014 ATC Existing Equipment Replacement-Phase 2
2012 100-400 Series MK I Refurbishment Project
2019 MK refurb/overhaul
2020 MKI refurbishment (500-600 series will be 30 years old in 2021) - 16 cars
2023 MKII Mid-Life Overhaul (1300-1400 series) - 48 cars
TABLE 9: PROJECTS FUNDED BY THE BUILDING CANADA FUND
CATEGORY PROJECT
Rail Surrey Central Station Upgrades Construction
65 PHASE TWO OF THE TEN YEAR VISION – APPENDIX A

TABLE 10: MAJOR CAPITAL PROJECTS OVER $50 MILLION ($ MILLIONS)
PROJECTPROJECT
START YEAR
GROSS PROJECT
COST
CASH FLOW
2020 2021 2022 2023 2024 2025 2026 2027
TOTAL 2018-20272018 2019
Fleet Replacement
2016 Conventional Bus Replacements 2015 89 5 31 - - - - - - - - 37
2017 Conventional Bus Replacements 2016 97 95 2 - - - - - - - - 97
2018 Conventional Bus Replacements 2017 65 62 3 - - - - - - - - 65
2020 Conventional Bus Replacements 2019 71 - - 67 4 - - - - - - 71
2023 Conventional Bus Replacements 2022 125 - - - - - 122 3 - - - 125
2024 Conventional Bus Replacements 2023 179 - - - - - - 170 9 - - 179
2025 Conventional Bus Replacements 2024 95 - - - - - - - 93 2 - 95
2026 Conventional Bus Replacements 2025 268 - - - - - - - - 252 16 268
2027 Conventional Bus Replacements 2026 351 - - - - - - - - - 351 351
Replacement of SkyTrain MKI Vehicles 2021 205 - - - - 9 90 85 21 - - 205
Fleet Expansion
Expansion of 40-ft Conventional Bus Fleet 2017 68 68 - - - - - - - - - 68
Expansion of 40-ft Conventional Bus Fleet 2018 51 - 51 - - - - - - - - 51
Expansion of 60-ft Conventional Bus Fleet 2019 82 - - 82 - - - - - - - 82
Canada Line Fleet Expansion 2017 88 44 0 - - - - - - - - 44
Expo/Millennium Line Fleet Expansion (56 cars) 2017 215 68 63 4 - - - - - - - 135
Expo/Millennium Line Fleet Expansion (108 cars) 2020 488 - - 12 116 64 54 131 68 43 - 488
Expo/Millennium Line Fleet Expansion (50 cars) 2024 237 - - - - - - 9 99 129 - 237
Upgrades to Existing Infrastructure
Expo Line Burrard Station Upgrade 2018 64 6 9 16 16 17 - - - - - 64
SkyTrain OMC Upgrades 2019 59 5 5 12 13 13 6 - - - - 54
Expo Line Guideway Seismic Upgrade 2020 53 - - 3 10 10 10 10 10 - - 53
Expo/Millennium Line Upgrade - Storage 2018 267 73 16 42 43 - - 46 47 - - 267
Expo/Millennium Line Upgrade - Maintenance 2019 72 - 13 14 14 15 15 - - - - 72
Expo/Millennium Line Upgrade - Power 2018 79 7 7 - 9 9 9 9 9 10 10 79
Expo/Millennium Line Upgrade - System 2018 96 4 15 28 29 19 1 - - - - 96
Metrotown Station and Exchange Upgrade Construction 2012 69 15 - - - - - - - - - 15
Commercial Broadway SkyTrain Station Phase 2 Upgrade Construction 2012 73 28 - - - - - - - - - 28
Infrastructure Expansion
Bus Depot 2018 207 31 5 30 107 33 1 - - - - 207
Surrey-Newton-Guildford LRT 2018 1,646 77 188 352 348 331 350 - - - - 1,646
Millennium Line Broadway Extension * 2018 2,833 218 234 818 510 361 289 392 - - - 2,823
Total Major Capital Project Gross Costs 8,292 807 643 1,479 1,219 881 948 856 356 436 377 8,001
Other Capital Projects 457 416 305 240 117 78 84 76 87 75 1,935
Capital Infrastructure Contributions 53 103 91 92 27 28 29 30 31 33 518
Total Capital Project Gross Costs 1,316 1,162 1,876 1,551 1,025 1,054 968 462 554 485 10,454
Millennium Line Broadway Extension TL portion if Province Delivers 1 33 26 14 10 16 40 8 - - 148
Note: Any cash flow data beyond 10 years that constitute part of gross project cost is not included in above cash flow projection table* Total project reported if TransLink delivers, if Province delivers TransLink's portion is shown below.
PHASE TWO OF THE TEN YEAR VISION – INVESTMENT PLAN 66

TABLE 11A: CONVENTIONAL TRANSIT SERVICE LEVELS (THOUSANDS OF SERVICE HOURS)
2018 2019 2020 2021 2022 2023 2024 2025 2026 2027 TOTAL 2018-2027
Bus*
Existing 5,295 5,386 5,502 5,502 5,502 5,502 5,502 5,502 5,502 5,502 54,701
New in this Plan - - 165 398 420 420 420 420 420 420 3,086
Total 5,295 5,386 5,667 5,900 5,923 5,923 5,923 5,923 5,923 5,923 57,786
SeaBus
Existing 12 13 14 14 14 14 14 14 14 14 136
New in this Plan - - - - - - - - - - -
Total 12 13 14 14 14 14 14 14 14 14 136
Rail#
Existing 1,550 1,560 1,646 1,634 1,647 1,544 1,485 1,473 1,465 1,467 15,472
New in this Plan - - - - 100 246 358 700 709 722 2,835
Total 1,550 1,560 1,646 1,634 1,747 1,790 1,843 2,173 2,174 2,188 18,307
Total Service Hours (Excluding HandyDart) 6,858 6,960 7,327 7,548 7,684 7,727 7,780 8,110 8,111 8,125 76,229
TABLE 11B: CUSTOM TRANSIT SERVICE LEVELS (THOUSANDS OF TRIPS)
2018 2019 2020 2021 2022 2023 2024 2025 2026 2027 TOTAL 2018-2027
HandyDART Vehicle Trips Available
Existing 1,233 1,271 1,271 1,271 1,271 1,271 1,271 1,271 1,271 1,271 12,672
New in this Plan - - 38 76 76 76 76 76 76 76 570
Total 1,233 1,271 1,309 1,347 1,347 1,347 1,347 1,347 1,347 1,347 13,242
Taxi-Provided HandyDART Trips Available
Existing 102 102 102 102 102 102 102 102 102 102 1,020
New in this Plan - - - - - - - - - - -
Total 102 102 102 102 102 102 102 102 102 102 1,020
Total Custom Transit Trips Available 1,335 1,373 1,411 1,449 1,449 1,449 1,449 1,449 1,449 1,449 14,262
* During the construction of the Millennium Line Broadway Extension, TransLink will be providing an additional 39,000 service hours from mid-2020 through 2024, not included in these figures.
# - TransLink will be replacing the 150 Mark I SkyTrain cars with Mark III cars between 2018-2027. The Mark III cars are larger allowing the same amount of capacity to be provided with fewer vehicles and fewer service hours. Between 2018 and 2021 the Phase Two Plan increases carrying capacity by approximately 7% while service hours remain essentially the same.
67 PHASE TWO OF THE TEN YEAR VISION – APPENDIX A

PHASE TWO OF THE TEN YEAR VISION – INVESTMENT PLAN 68
TABLE 12A: TRANSIT FARE RATES
SHORT TERM FARE PRODUCTS 2018 2019 2020 2021 2022 2023 2024 2025 2026 2027TOTAL
INCREASE 2018-2027
Conventional Transit Adult Cash 1-Zone $2.95 $3.00 $3.20 $3.35 $3.45 $3.50 $3.55 $3.65 $3.70 $3.75 $0.80
2-Zone $4.20 $4.25 $4.50 $4.65 $4.80 $4.95 $5.10 $5.20 $5.40 $5.55 $1.35
3-Zone $5.70 $5.75 $6.00 $6.25 $6.45 $6.60 $6.80 $7.00 $7.20 $7.40 $1.70
Daypass All zones $10.25 $10.50 $10.75 $11.50 $11.75 $12.00 $12.50 $12.75 $13.00 $13.25 $3.00
Concession Cash 1-Zone $1.90 $2.00 $2.10 $2.20 $2.30 $2.35 $2.40 $2.50 $2.55 $2.65 $0.75
2-Zone $2.90 $3.00 $3.15 $3.30 $3.40 $3.45 $3.50 $3.60 $3.65 $3.70 $0.80
3-Zone $3.90 $4.00 $4.15 $4.35 $4.45 $4.60 $4.75 $4.90 $5.00 $5.15 $1.25
DayPass All Zones $8.00 $8.25 $8.50 $9.00 $9.25 $9.50 $9.75 $10.00 $10.25 $10.25 $2.25
Custom Transit Cash All
Zones $2.95 $3.00 $3.20 $3.35 $3.45 $3.50 $3.55 $3.65 $3.70 $3.75 $0.80
DISCOUNTED OR NON-SHORT TERM FARE PRODUCTS
Conventional Transit Adult Stored
Value 1-Zone $2.30 $2.40 $2.55 $2.70 $2.75 $2.85 $2.95 $3.00 $3.10 $3.20 $0.90
2-Zone $3.35 $3.45 $3.65 $3.80 $3.90 $4.05 $4.15 $4.25 $4.40 $4.50 $1.15
3-Zone $4.40 $4.50 $4.75 $4.90 $5.05 $5.20 $5.35 $5.50 $5.70 $5.85 $1.45
Monthly Pass 1-Zone $95.00 $98.00 $101.00 $105.00 $108.00 $111.00 $114.00 $116.00 $119.00 $121.00 $26.00
2-Zone $128.00 $131.00 $135.00 $140.00 $144.00 $148.00 $153.00 $157.00 $161.00 $165.00 $37.00
3-Zone $174.00 $177.00 $182.00 $189.00 $194.00 $200.00 $206.00 $212.00 $219.00 $225.00 $51.00
Concession Stored Value 1-Zone $1.85 $1.95 $2.05 $2.15 $2.25 $2.25 $2.30 $2.35 $2.40 $2.45 $0.60
2-Zone $2.85 $2.95 $3.05 $3.20 $3.25 $3.30 $3.35 $3.45 $3.50 $3.60 $0.75
3-Zone $3.85 $3.95 $4.10 $4.30 $4.40 $4.55 $4.70 $4.75 $4.85 $4.95 $1.10
Monthly Pass
All zones $54.00 $56.00 $58.00 $59.50 $61.50 $63.50 $65.50 $66.50 $67.50 $69.50 $15.50
Custom Transit
Stored Value
All zones $2.30 $2.40 $2.55 $2.70 $2.75 $2.85 $2.95 $3.00 $3.10 $3.20 $0.90
Note: Fares shown in table are assumed to be effective on July 1 of each year.
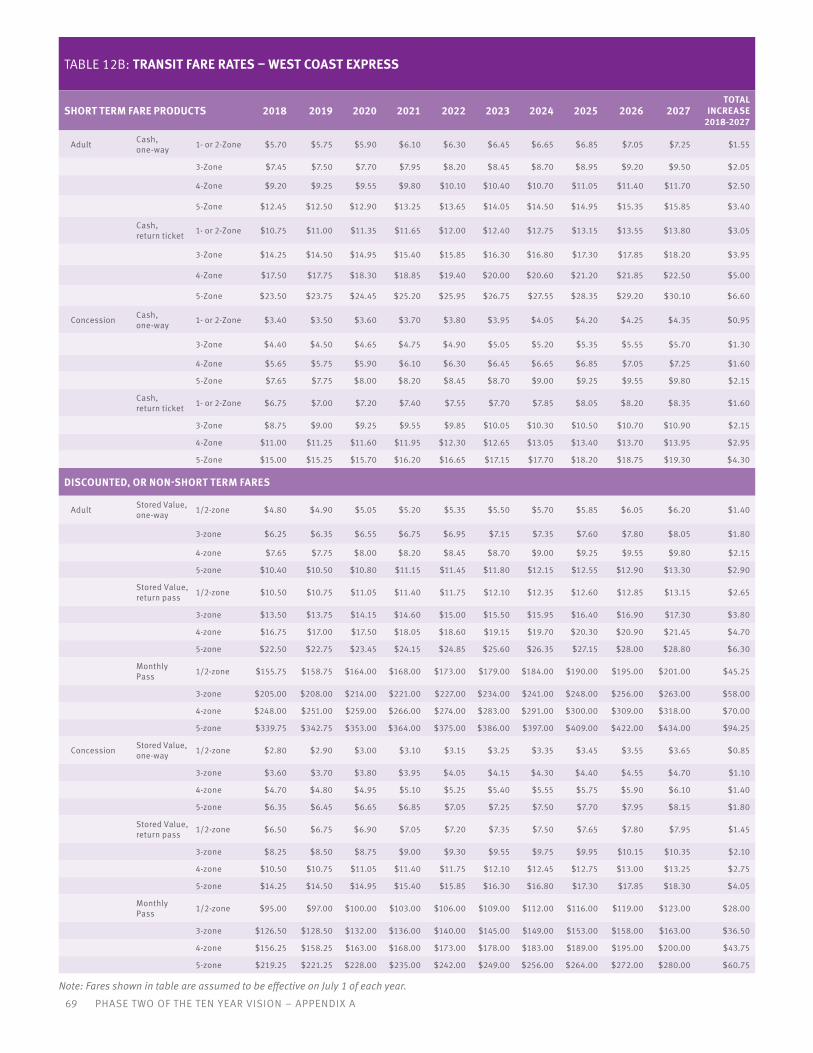
TABLE 12B: TRANSIT FARE RATES – WEST COAST EXPRESS
SHORT TERM FARE PRODUCTS 2018 2019 2020 2021 2022 2023 2024 2025 2026 2027TOTAL
INCREASE 2018-2027
Adult Cash, one-way 1- or 2-Zone $5.70 $5.75 $5.90 $6.10 $6.30 $6.45 $6.65 $6.85 $7.05 $7.25 $1.55
3-Zone $7.45 $7.50 $7.70 $7.95 $8.20 $8.45 $8.70 $8.95 $9.20 $9.50 $2.05
4-Zone $9.20 $9.25 $9.55 $9.80 $10.10 $10.40 $10.70 $11.05 $11.40 $11.70 $2.50
5-Zone $12.45 $12.50 $12.90 $13.25 $13.65 $14.05 $14.50 $14.95 $15.35 $15.85 $3.40
Cash, return ticket 1- or 2-Zone $10.75 $11.00 $11.35 $11.65 $12.00 $12.40 $12.75 $13.15 $13.55 $13.80 $3.05
3-Zone $14.25 $14.50 $14.95 $15.40 $15.85 $16.30 $16.80 $17.30 $17.85 $18.20 $3.95
4-Zone $17.50 $17.75 $18.30 $18.85 $19.40 $20.00 $20.60 $21.20 $21.85 $22.50 $5.00
5-Zone $23.50 $23.75 $24.45 $25.20 $25.95 $26.75 $27.55 $28.35 $29.20 $30.10 $6.60
Concession Cash, one-way 1- or 2-Zone $3.40 $3.50 $3.60 $3.70 $3.80 $3.95 $4.05 $4.20 $4.25 $4.35 $0.95
3-Zone $4.40 $4.50 $4.65 $4.75 $4.90 $5.05 $5.20 $5.35 $5.55 $5.70 $1.30
4-Zone $5.65 $5.75 $5.90 $6.10 $6.30 $6.45 $6.65 $6.85 $7.05 $7.25 $1.60
5-Zone $7.65 $7.75 $8.00 $8.20 $8.45 $8.70 $9.00 $9.25 $9.55 $9.80 $2.15
Cash, return ticket 1- or 2-Zone $6.75 $7.00 $7.20 $7.40 $7.55 $7.70 $7.85 $8.05 $8.20 $8.35 $1.60
3-Zone $8.75 $9.00 $9.25 $9.55 $9.85 $10.05 $10.30 $10.50 $10.70 $10.90 $2.15
4-Zone $11.00 $11.25 $11.60 $11.95 $12.30 $12.65 $13.05 $13.40 $13.70 $13.95 $2.95
5-Zone $15.00 $15.25 $15.70 $16.20 $16.65 $17.15 $17.70 $18.20 $18.75 $19.30 $4.30
DISCOUNTED, OR NON-SHORT TERM FARES
Adult Stored Value, one-way 1/2-zone $4.80 $4.90 $5.05 $5.20 $5.35 $5.50 $5.70 $5.85 $6.05 $6.20 $1.40
3-zone $6.25 $6.35 $6.55 $6.75 $6.95 $7.15 $7.35 $7.60 $7.80 $8.05 $1.80
4-zone $7.65 $7.75 $8.00 $8.20 $8.45 $8.70 $9.00 $9.25 $9.55 $9.80 $2.15
5-zone $10.40 $10.50 $10.80 $11.15 $11.45 $11.80 $12.15 $12.55 $12.90 $13.30 $2.90
Stored Value, return pass 1/2-zone $10.50 $10.75 $11.05 $11.40 $11.75 $12.10 $12.35 $12.60 $12.85 $13.15 $2.65
3-zone $13.50 $13.75 $14.15 $14.60 $15.00 $15.50 $15.95 $16.40 $16.90 $17.30 $3.80
4-zone $16.75 $17.00 $17.50 $18.05 $18.60 $19.15 $19.70 $20.30 $20.90 $21.45 $4.70
5-zone $22.50 $22.75 $23.45 $24.15 $24.85 $25.60 $26.35 $27.15 $28.00 $28.80 $6.30
Monthly Pass 1/2-zone $155.75 $158.75 $164.00 $168.00 $173.00 $179.00 $184.00 $190.00 $195.00 $201.00 $45.25
3-zone $205.00 $208.00 $214.00 $221.00 $227.00 $234.00 $241.00 $248.00 $256.00 $263.00 $58.00
4-zone $248.00 $251.00 $259.00 $266.00 $274.00 $283.00 $291.00 $300.00 $309.00 $318.00 $70.00
5-zone $339.75 $342.75 $353.00 $364.00 $375.00 $386.00 $397.00 $409.00 $422.00 $434.00 $94.25
Concession Stored Value, one-way 1/2-zone $2.80 $2.90 $3.00 $3.10 $3.15 $3.25 $3.35 $3.45 $3.55 $3.65 $0.85
3-zone $3.60 $3.70 $3.80 $3.95 $4.05 $4.15 $4.30 $4.40 $4.55 $4.70 $1.10
4-zone $4.70 $4.80 $4.95 $5.10 $5.25 $5.40 $5.55 $5.75 $5.90 $6.10 $1.40
5-zone $6.35 $6.45 $6.65 $6.85 $7.05 $7.25 $7.50 $7.70 $7.95 $8.15 $1.80
Stored Value, return pass 1/2-zone $6.50 $6.75 $6.90 $7.05 $7.20 $7.35 $7.50 $7.65 $7.80 $7.95 $1.45
3-zone $8.25 $8.50 $8.75 $9.00 $9.30 $9.55 $9.75 $9.95 $10.15 $10.35 $2.10
4-zone $10.50 $10.75 $11.05 $11.40 $11.75 $12.10 $12.45 $12.75 $13.00 $13.25 $2.75
5-zone $14.25 $14.50 $14.95 $15.40 $15.85 $16.30 $16.80 $17.30 $17.85 $18.30 $4.05
Monthly Pass 1/2-zone $95.00 $97.00 $100.00 $103.00 $106.00 $109.00 $112.00 $116.00 $119.00 $123.00 $28.00
3-zone $126.50 $128.50 $132.00 $136.00 $140.00 $145.00 $149.00 $153.00 $158.00 $163.00 $36.50
4-zone $156.25 $158.25 $163.00 $168.00 $173.00 $178.00 $183.00 $189.00 $195.00 $200.00 $43.75
5-zone $219.25 $221.25 $228.00 $235.00 $242.00 $249.00 $256.00 $264.00 $272.00 $280.00 $60.75
Note: Fares shown in table are assumed to be effective on July 1 of each year.
69 PHASE TWO OF THE TEN YEAR VISION – APPENDIX A

PHASE TWO OF THE TEN YEAR VISION – INVESTMENT PLAN 70
TABLE 13: PROJECTED FARE REVENUE BY FARE TYPE ($ MILLIONS)
2018 2019 2020 2021 2022 2023 2024 2025 2026 2027 TOTAL 2018-2027
Regular, Short Term Fares $90 $93 $97 $101 $106 $108 $112 $118 $119 $121 $1,065
Discounted, Short Term Fares $188 $203 $219 $235 $255 $269 $287 $311 $324 $340 $2,631
Non-Short Term Fares $194 $204 $216 $227 $241 $252 $267 $287 $297 $308 $2,492
Total $471 $499 $532 $563 $602 $629 $666 $715 $740 $769 $6,187
Short Term Fares as a Percentage of Total 59% 59% 59% 60% 60% 60% 60% 60% 60% 60% 60%
Program Revenues $114 $118 $122 $125 $129 $134 $138 $142 $145 $150 $1,318
Total Fare Revenues $585 $618 $655 $689 $732 $763 $804 $857 $886 $919 $7,506
TABLE 14: PROJECTED RIDERSHIP FORECASTS
2018 2019 2020 2021 2022 2023 2024 2025 2026 2027 TOTAL 2018-2027
Ridership (millions of transit journeys) 252 259 267 271 280 285 294 308 312 316 2,844
Annual Increase (over previous year) 2.6% 3.0% 3.1% 1.4% 3.1% 1.9% 3.1% 5.0% 1.2% 1.4%
TABLE 15: MAJOR ROAD NETWORK EXPANSION
MAJOR ROAD NETWORK EXPANSION (LANE-KILOMETRES) 2018 2019 2020 2021 2022 2023 2024 2025 2026 2027
Length of the Major Road Network 2,657 2,684 2,710 2,738 2,765 2,793 2,820 2,849 2,877 2,906
Annual Increase (Over Previous Year) 11% 1% 1% 1% 1% 1% 1% 1% 1% 1%

Appendix B: Schedules without new provincially-enabled revenue capacity (motor fuel tax) or parking tax increaseThis appendix provides summary schedules for the Phase Two Plan, in the scenario that new
provincially-enabled revenue capacity (motor fuel tax) or parking tax increase are not enabled
and implemented in 2019, and are not offset by greater than anticipated revenues from other
sources. In these circumstances, a portion of the Phase Two Plan expansion would be deferred,
as outlined in the introduction to the Appendices.
All amounts in Appendix B are in year of expenditure dollars.
71 PHASE TWO OF THE TEN YEAR VISION – APPENDIX B
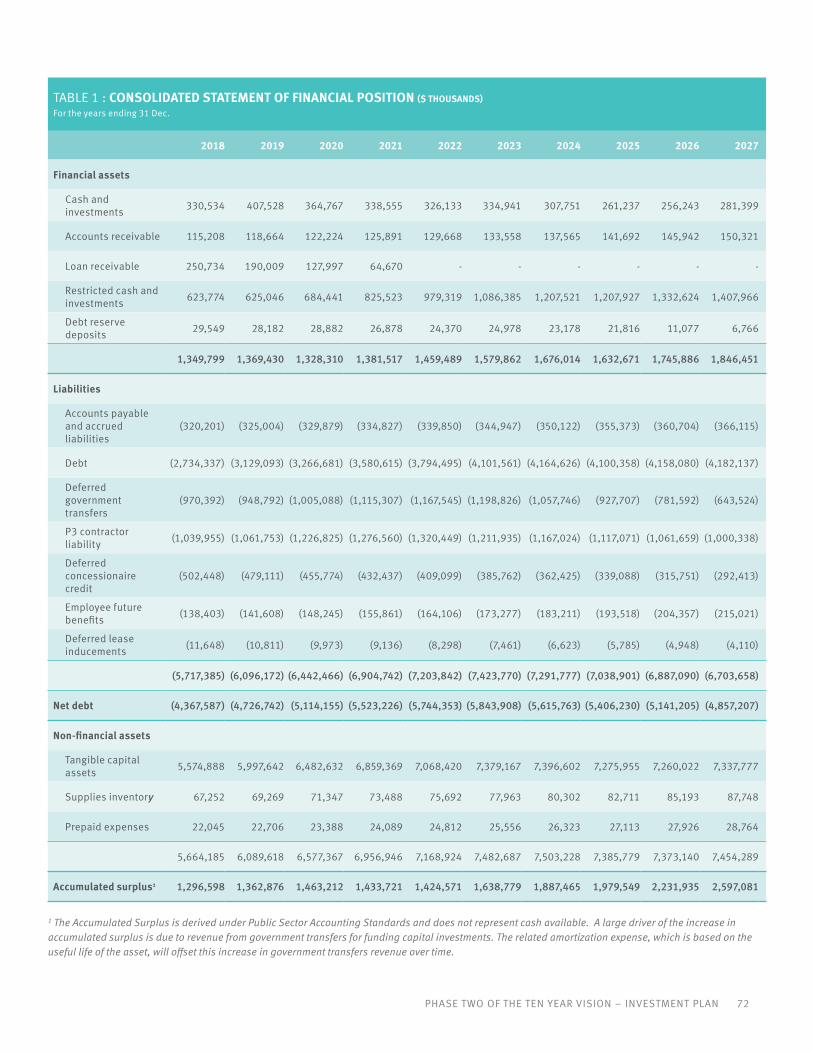
PHASE TWO OF THE TEN YEAR VISION – INVESTMENT PLAN 72
1 The Accumulated Surplus is derived under Public Sector Accounting Standards and does not represent cash available. A large driver of the increase in accumulated surplus is due to revenue from government transfers for funding capital investments. The related amortization expense, which is based on the useful life of the asset, will offset this increase in government transfers revenue over time.
TABLE 1 : CONSOLIDATED STATEMENT OF FINANCIAL POSITION ($ THOUSANDS)For the years ending 31 Dec.
2018 2019 2020 2021 2022 2023 2024 2025 2026 2027
Financial assets
Cash and investments 330,534 407,528 364,767 338,555 326,133 334,941 307,751 261,237 256,243 281,399
Accounts receivable 115,208 118,664 122,224 125,891 129,668 133,558 137,565 141,692 145,942 150,321
Loan receivable 250,734 190,009 127,997 64,670 - - - - - -
Restricted cash and investments 623,774 625,046 684,441 825,523 979,319 1,086,385 1,207,521 1,207,927 1,332,624 1,407,966
Debt reserve deposits 29,549 28,182 28,882 26,878 24,370 24,978 23,178 21,816 11,077 6,766
1,349,799 1,369,430 1,328,310 1,381,517 1,459,489 1,579,862 1,676,014 1,632,671 1,745,886 1,846,451
Liabilities
Accounts payable and accrued liabilities
(320,201) (325,004) (329,879) (334,827) (339,850) (344,947) (350,122) (355,373) (360,704) (366,115)
Debt (2,734,337) (3,129,093) (3,266,681) (3,580,615) (3,794,495) (4,101,561) (4,164,626) (4,100,358) (4,158,080) (4,182,137)
Deferred government transfers
(970,392) (948,792) (1,005,088) (1,115,307) (1,167,545) (1,198,826) (1,057,746) (927,707) (781,592) (643,524)
P3 contractor liability (1,039,955) (1,061,753) (1,226,825) (1,276,560) (1,320,449) (1,211,935) (1,167,024) (1,117,071) (1,061,659) (1,000,338)
Deferred concessionaire credit
(502,448) (479,111) (455,774) (432,437) (409,099) (385,762) (362,425) (339,088) (315,751) (292,413)
Employee future benefits (138,403) (141,608) (148,245) (155,861) (164,106) (173,277) (183,211) (193,518) (204,357) (215,021)
Deferred lease inducements (11,648) (10,811) (9,973) (9,136) (8,298) (7,461) (6,623) (5,785) (4,948) (4,110)
(5,717,385) (6,096,172) (6,442,466) (6,904,742) (7,203,842) (7,423,770) (7,291,777) (7,038,901) (6,887,090) (6,703,658)
Net debt (4,367,587) (4,726,742) (5,114,155) (5,523,226) (5,744,353) (5,843,908) (5,615,763) (5,406,230) (5,141,205) (4,857,207)
Non-financial assets
Tangible capital assets 5,574,888 5,997,642 6,482,632 6,859,369 7,068,420 7,379,167 7,396,602 7,275,955 7,260,022 7,337,777
Supplies inventory 67,252 69,269 71,347 73,488 75,692 77,963 80,302 82,711 85,193 87,748
Prepaid expenses 22,045 22,706 23,388 24,089 24,812 25,556 26,323 27,113 27,926 28,764
5,664,185 6,089,618 6,577,367 6,956,946 7,168,924 7,482,687 7,503,228 7,385,779 7,373,140 7,454,289
Accumulated surplus1 1,296,598 1,362,876 1,463,212 1,433,721 1,424,571 1,638,779 1,887,465 1,979,549 2,231,935 2,597,081
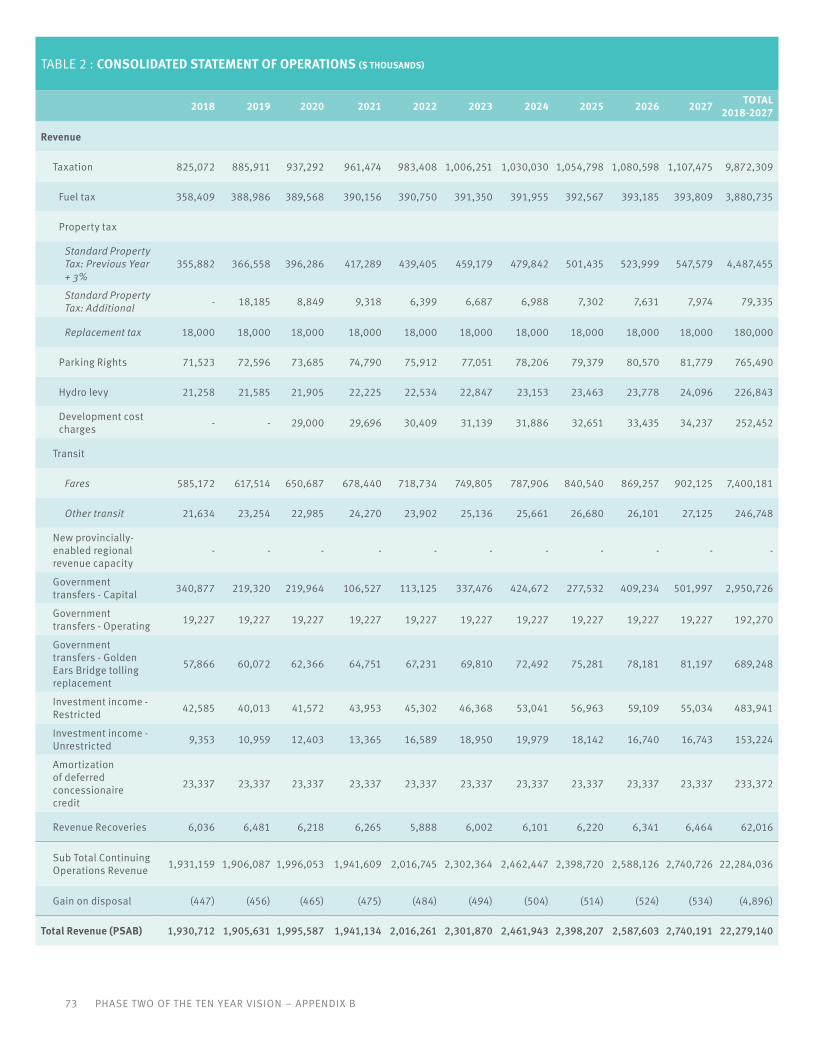
73 PHASE TWO OF THE TEN YEAR VISION – APPENDIX B
TABLE 2 : CONSOLIDATED STATEMENT OF OPERATIONS ($ THOUSANDS)
2018 2019 2020 2021 2022 2023 2024 2025 2026 2027 TOTAL 2018-2027
Revenue
Taxation 825,072 885,911 937,292 961,474 983,408 1,006,251 1,030,030 1,054,798 1,080,598 1,107,475 9,872,309
Fuel tax 358,409 388,986 389,568 390,156 390,750 391,350 391,955 392,567 393,185 393,809 3,880,735
Property tax
Standard Property Tax: Previous Year + 3%
355,882 366,558 396,286 417,289 439,405 459,179 479,842 501,435 523,999 547,579 4,487,455
Standard Property Tax: Additional - 18,185 8,849 9,318 6,399 6,687 6,988 7,302 7,631 7,974 79,335
Replacement tax 18,000 18,000 18,000 18,000 18,000 18,000 18,000 18,000 18,000 18,000 180,000
Parking Rights 71,523 72,596 73,685 74,790 75,912 77,051 78,206 79,379 80,570 81,779 765,490
Hydro levy 21,258 21,585 21,905 22,225 22,534 22,847 23,153 23,463 23,778 24,096 226,843
Development cost charges - - 29,000 29,696 30,409 31,139 31,886 32,651 33,435 34,237 252,452
Transit
Fares 585,172 617,514 650,687 678,440 718,734 749,805 787,906 840,540 869,257 902,125 7,400,181
Other transit 21,634 23,254 22,985 24,270 23,902 25,136 25,661 26,680 26,101 27,125 246,748
New provincially-enabled regional revenue capacity
- - - - - - - - - - -
Government transfers - Capital 340,877 219,320 219,964 106,527 113,125 337,476 424,672 277,532 409,234 501,997 2,950,726
Government transfers - Operating 19,227 19,227 19,227 19,227 19,227 19,227 19,227 19,227 19,227 19,227 192,270
Government transfers - Golden Ears Bridge tolling replacement
57,866 60,072 62,366 64,751 67,231 69,810 72,492 75,281 78,181 81,197 689,248
Investment income - Restricted 42,585 40,013 41,572 43,953 45,302 46,368 53,041 56,963 59,109 55,034 483,941
Investment income - Unrestricted 9,353 10,959 12,403 13,365 16,589 18,950 19,979 18,142 16,740 16,743 153,224
Amortization of deferred concessionaire credit
23,337 23,337 23,337 23,337 23,337 23,337 23,337 23,337 23,337 23,337 233,372
Revenue Recoveries 6,036 6,481 6,218 6,265 5,888 6,002 6,101 6,220 6,341 6,464 62,016
Sub Total Continuing Operations Revenue 1,931,159 1,906,087 1,996,053 1,941,609 2,016,745 2,302,364 2,462,447 2,398,720 2,588,126 2,740,726 22,284,036
Gain on disposal (447) (456) (465) (475) (484) (494) (504) (514) (524) (534) (4,896)
Total Revenue (PSAB) 1,930,712 1,905,631 1,995,587 1,941,134 2,016,261 2,301,870 2,461,943 2,398,207 2,587,603 2,740,191 22,279,140
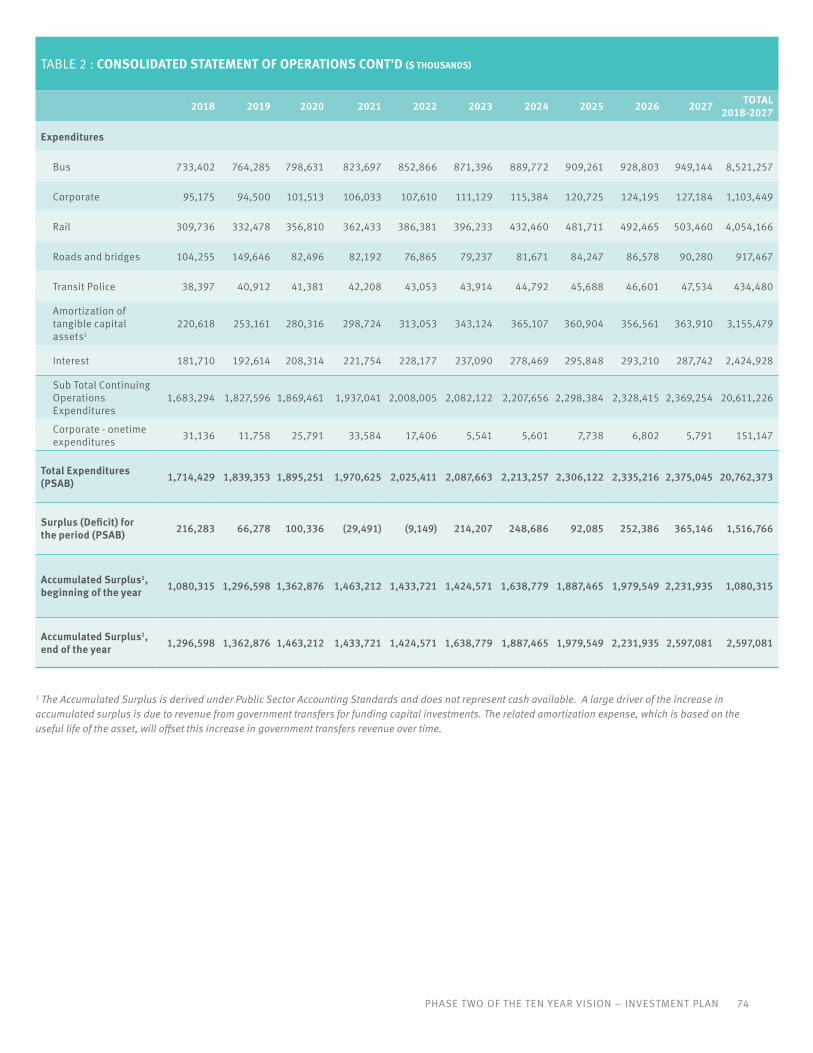
PHASE TWO OF THE TEN YEAR VISION – INVESTMENT PLAN 74
TABLE 2 : CONSOLIDATED STATEMENT OF OPERATIONS CONT'D ($ THOUSANDS)
2018 2019 2020 2021 2022 2023 2024 2025 2026 2027 TOTAL 2018-2027
Expenditures
Bus 733,402 764,285 798,631 823,697 852,866 871,396 889,772 909,261 928,803 949,144 8,521,257
Corporate 95,175 94,500 101,513 106,033 107,610 111,129 115,384 120,725 124,195 127,184 1,103,449
Rail 309,736 332,478 356,810 362,433 386,381 396,233 432,460 481,711 492,465 503,460 4,054,166
Roads and bridges 104,255 149,646 82,496 82,192 76,865 79,237 81,671 84,247 86,578 90,280 917,467
Transit Police 38,397 40,912 41,381 42,208 43,053 43,914 44,792 45,688 46,601 47,534 434,480
Amortization of tangible capital assets1
220,618 253,161 280,316 298,724 313,053 343,124 365,107 360,904 356,561 363,910 3,155,479
Interest 181,710 192,614 208,314 221,754 228,177 237,090 278,469 295,848 293,210 287,742 2,424,928
Sub Total Continuing Operations Expenditures
1,683,294 1,827,596 1,869,461 1,937,041 2,008,005 2,082,122 2,207,656 2,298,384 2,328,415 2,369,254 20,611,226
Corporate - onetime expenditures 31,136 11,758 25,791 33,584 17,406 5,541 5,601 7,738 6,802 5,791 151,147
Total Expenditures (PSAB) 1,714,429 1,839,353 1,895,251 1,970,625 2,025,411 2,087,663 2,213,257 2,306,122 2,335,216 2,375,045 20,762,373
Surplus (Deficit) for the period (PSAB) 216,283 66,278 100,336 (29,491) (9,149) 214,207 248,686 92,085 252,386 365,146 1,516,766
Accumulated Surplus1, beginning of the year 1,080,315 1,296,598 1,362,876 1,463,212 1,433,721 1,424,571 1,638,779 1,887,465 1,979,549 2,231,935 1,080,315
Accumulated Surplus1, end of the year 1,296,598 1,362,876 1,463,212 1,433,721 1,424,571 1,638,779 1,887,465 1,979,549 2,231,935 2,597,081 2,597,081
1 The Accumulated Surplus is derived under Public Sector Accounting Standards and does not represent cash available. A large driver of the increase in accumulated surplus is due to revenue from government transfers for funding capital investments. The related amortization expense, which is based on the useful life of the asset, will offset this increase in government transfers revenue over time.

75 PHASE TWO OF THE TEN YEAR VISION – APPENDIX B
TABLE 3: CONSOLIDATED STATEMENT OF CHANGES IN NET DEBT ($ THOUSANDS)
2018 2019 2020 2021 2022 2023 2024 2025 2026 2027
Surplus for the year 216,283 66,278 100,336 (29,491) (9,149) 214,207 248,686 92,085 252,386 365,146
Acquisition of tangible capital assets
(800,018) (675,915) (765,306) (675,461) (522,104) (653,871) (382,543) (240,257) (340,628) (441,665)
Amortization of tangible capital assets
220,618 253,161 280,316 298,724 313,053 343,124 365,107 360,904 356,561 363,910
Tangible capital assets contributed to (from) municipalities
(12,000) - - - - - - - - -
(591,399) (422,754) (484,990) (376,737) (209,050) (310,747) (17,435) 120,647 15,934 (77,755)
Changes in supplies inventory (1,959) (2,018) (2,078) (2,140) (2,205) (2,271) (2,339) (2,409) (2,481) (2,556)
Changes in prepaid expenses (642) (661) (681) (702) (723) (744) (767) (790) (813) (838)
(2,601) (2,679) (2,759) (2,842) (2,927) (3,015) (3,106) (3,199) (3,295) (3,394)
(Increase) decrease in net debt (377,718) (359,155) (387,413) (409,070) (221,127) (99,555) 228,145 209,533 265,025 283,997
Net debt, beginning of year (3,989,869) (4,367,587) (4,726,742) (5,114,155) (5,523,226) (5,744,353) (5,843,908) (5,615,763) (5,406,230) (5,141,205)
Net debt, end of year (4,367,587) (4,726,742) (5,114,155) (5,523,226) (5,744,353) (5,843,908) (5,615,763) (5,406,230) (5,141,205) (4,857,207)

TABLE 4 : CONSOLIDATED STATEMENT OF CASH FLOW ($ THOUSANDS)
2018 2019 2020 2021 2022 2023 2024 2025 2026 2027 TOTAL 2018-2027
Cash provided by (used for):
Operating Transactions
Surplus for the year 216,283 66,278 100,336 (29,491) (9,149) 214,207 248,686 92,085 252,386 365,146 1,516,766
Non-cash changes to operations:
Amortization of capital assets 220,618 253,161 280,316 298,724 313,053 343,124 365,107 360,904 356,561 363,910 3,155,479
Amortization of bond issue costs
(100) (279) (261) (613) (634) (646) (577) (736) (786) (825) (5,457)
Amortization of Deferred Concessionaire credits
(23,337) (23,337) (23,337) (23,337) (23,337) (23,337) (23,337) (23,337) (23,337) (23,337) (233,372)
Amortization of deferred government transfers
(340,877) (219,320) (219,964) (106,527) (113,125) (337,476) (424,672) (277,532) (409,234) (501,997) (2,950,726)
Write-down of capital assets/deferred lease inducements
(838) (838) (838) (838) (838) (838) (838) (838) (838) (838) (8,376)
Net change in contractor liability
65,905 65,525 65,023 64,390 63,614 64,242 79,166 75,727 71,912 67,693 683,197
Loan Receivables interest - transfer from restricted fund
(6,536) (5,275) (3,988) (2,673) (1,330) - - - - - (19,803)
Non-cash changes to operations (85,166) 69,636 96,951 229,127 237,403 45,069 (5,150) 134,188 (5,722) (95,394) 620,942
Changes in non-cash operating working capital
15,276 1,873 5,193 6,055 6,564 7,364 7,996 8,233 8,624 8,304 75,480
146,393 137,787 202,480 205,691 234,817 266,640 251,532 234,505 255,288 278,056 2,213,189
Capital transactions:
Net Proceed/(Purchase) for Real Estate Transactions
44,611 118,964 26,425 - 0 - - - - - 190,000
Purchase of capital assets (excluding MRN)
(800,018) (675,915) (765,306) (675,461) (522,104) (653,871) (382,543) (240,257) (340,628) (441,665) (5,497,767)
(755,407) (556,951) (738,881) (675,461) (522,104) (653,871) (382,543) (240,257) (340,628) (441,665) (5,307,767)
PHASE TWO OF THE TEN YEAR VISION – INVESTMENT PLAN 76
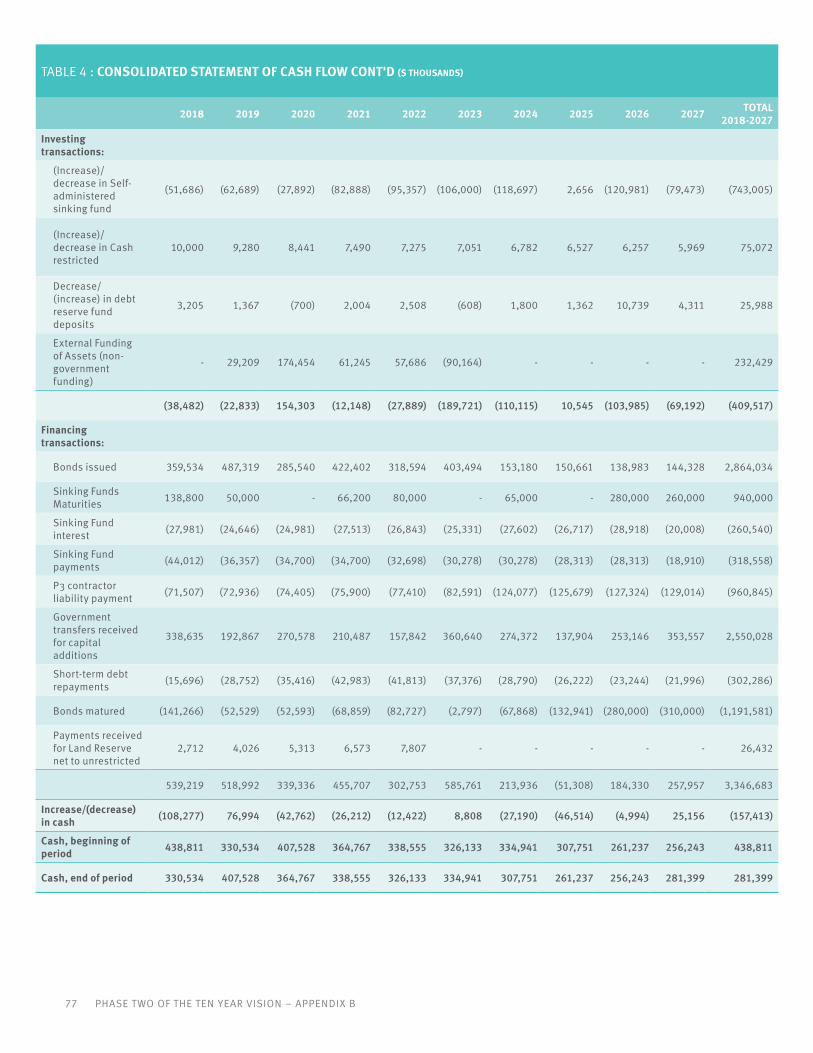
77 PHASE TWO OF THE TEN YEAR VISION – APPENDIX B
TABLE 4 : CONSOLIDATED STATEMENT OF CASH FLOW CONT'D ($ THOUSANDS)
2018 2019 2020 2021 2022 2023 2024 2025 2026 2027 TOTAL 2018-2027
Investing transactions:
(Increase)/decrease in Self-administered sinking fund
(51,686) (62,689) (27,892) (82,888) (95,357) (106,000) (118,697) 2,656 (120,981) (79,473) (743,005)
(Increase)/decrease in Cash restricted
10,000 9,280 8,441 7,490 7,275 7,051 6,782 6,527 6,257 5,969 75,072
Decrease/(increase) in debt reserve fund deposits
3,205 1,367 (700) 2,004 2,508 (608) 1,800 1,362 10,739 4,311 25,988
External Funding of Assets (non-government funding)
- 29,209 174,454 61,245 57,686 (90,164) - - - - 232,429
(38,482) (22,833) 154,303 (12,148) (27,889) (189,721) (110,115) 10,545 (103,985) (69,192) (409,517)
Financing transactions:
Bonds issued 359,534 487,319 285,540 422,402 318,594 403,494 153,180 150,661 138,983 144,328 2,864,034
Sinking Funds Maturities 138,800 50,000 - 66,200 80,000 - 65,000 - 280,000 260,000 940,000
Sinking Fund interest (27,981) (24,646) (24,981) (27,513) (26,843) (25,331) (27,602) (26,717) (28,918) (20,008) (260,540)
Sinking Fund payments (44,012) (36,357) (34,700) (34,700) (32,698) (30,278) (30,278) (28,313) (28,313) (18,910) (318,558)
P3 contractor liability payment (71,507) (72,936) (74,405) (75,900) (77,410) (82,591) (124,077) (125,679) (127,324) (129,014) (960,845)
Government transfers received for capital additions
338,635 192,867 270,578 210,487 157,842 360,640 274,372 137,904 253,146 353,557 2,550,028
Short-term debt repayments (15,696) (28,752) (35,416) (42,983) (41,813) (37,376) (28,790) (26,222) (23,244) (21,996) (302,286)
Bonds matured (141,266) (52,529) (52,593) (68,859) (82,727) (2,797) (67,868) (132,941) (280,000) (310,000) (1,191,581)
Payments received for Land Reserve net to unrestricted
2,712 4,026 5,313 6,573 7,807 - - - - - 26,432
539,219 518,992 339,336 455,707 302,753 585,761 213,936 (51,308) 184,330 257,957 3,346,683
Increase/(decrease) in cash (108,277) 76,994 (42,762) (26,212) (12,422) 8,808 (27,190) (46,514) (4,994) 25,156 (157,413)
Cash, beginning of period 438,811 330,534 407,528 364,767 338,555 326,133 334,941 307,751 261,237 256,243 438,811
Cash, end of period 330,534 407,528 364,767 338,555 326,133 334,941 307,751 261,237 256,243 281,399 281,399

PHASE TWO OF THE TEN YEAR VISION – INVESTMENT PLAN 78
TABLE 5: PROJECTED BORROWING COMPARED TO BORROWING LIMIT AND SELECT FINANCIAL RATIOS ($ MILLLIONS)
2018 2019 2020 2021 2022 2023 2024 2025 2026 2027
Established Borrowing Limit - Gross Direct Debt
5,500 5,500 5,500 5,500 5,500 5,500 5,500 5,500 5,500 5,500
Closing Gross Direct Borrowing 3,315 3,720 3,918 4,228 4,421 4,784 4,840 4,830 4,665 4,468
Total Closing Net Direct Borrowing 2,447 2,781 2,890 3,123 3,244 3,444 3,391 3,330 3,278 3,235
Net MFA Debt, net of DRF 557 494 431 367 307 247 188 131 83 48
Net TL Direct 1,891 2,287 2,459 2,756 2,937 3,197 3,203 3,200 3,195 3,187
Net Debt (Closing Net Borrowing)1 3,990 4,322 4,573 4,832 4,974 5,042 4,920 4,787 4,655 4,528
New Direct Borrowing for Capital2 360 487 286 422 319 403 153 151 139 144
Net Debt / Operating Revenues <300% 263% 268% 269% 275% 274% 269% 253% 237% 224% 211%
Gross Interest / Operating Revenues <20%
12% 12% 12% 13% 13% 13% 14% 15% 14% 13%
Net Debt per capita3 <$2,000 1,525 1,629 1,700 1,773 1,801 1,801 1,734 1,665 1,598 1,534
Accumulated Funding Resources (AFR)4 331 408 365 339 326 335 308 261 256 281
AFR as a percentage of Total Funding Requirements 5
21.4% 25.4% 21.2% 18.9% 17.7% 17.8% 15.3% 12.4% 12.0% 13.0%
Minimum AFR required to meet Policy (%): 15% 15% 15% 12% 12% 12% 12% 12% 12% 12%
Excess/(shortfall) from minimum 99 166 107 124 105 109 67 8 0 22
1: Includes TransLink's Direct Debt, net of sinking funds and debt reserve deposits2: Excludes debt refinancing3: Includes all Direct and Indirect Debt4: Accumulated Funding Resources (AFR) = Unrestricted Cash & Investments5: Funding Requirements = Total Expenses (excluding Depreciation and Capital funding to Municipalities) + Debt Service costs

79 PHASE TWO OF THE TEN YEAR VISION – APPENDIX B
TABLE 6A : CAPITAL EXPENDITURES AND INFRASTRUCTURE CONTRIBUTIONS ($ MILLIONS)
CAPITAL EXPENDITURES 2018 2019 2020 2021 2022 2023 2024 2025 2026 2027 TOTAL 2018-2027
Bus
Base Capital
Equipment 21 3 1 5 5 - - - - 34
Facilities 24 30 5 3 3 4 3 3 7 2 84
Infrastructure 51 45 41 25 21 13 13 14 8 12 241
Technology 2 4 2 - - - - - - - 7
Vehicles 297 115 144 27 24 137 197 111 281 393 1,726
New For Phase 2
Infrastructure 32 10 40 121 45 3 2 2 2 2 258
Vehicles - - 15 - - - - - - - 15
Bus Total 428 206 246 180 98 156 214 130 298 409 2,365
Rail
Base Capital
Equipment 24 32 26 13 3 - - - - - 97
Facilities 11 20 2 2 3 3 - 41
Infrastructure 97 124 48 46 47 23 20 32 16 11 463
Technology 12 14 11 9 - 1 - 1 - - 47
Vehicles 36 25 13 1 9 97 92 21 294
New For Phase 2
Facilities 55 12 33 35 2 1 37 38 1 1 215
Infrastructure 60 174 359 354 337 350 - - - - 1,634
Rail Total 293 401 492 459 401 475 149 92 18 12 2,791
Corporate
Facilities 3 3 - - - - - - - - 6
Infrastructure 57 4 - - - - - - - - 61
Technology 14 26 20 23 21 22 17 18 23 19 201
Non-Revenue Vehicles 1 - - - 1 1 1 - - 1 5
Corporate Total 73 33 21 24 22 22 18 18 24 20 273
TransLink-Owned Roads and Bridges
TransLink-Owned Cycling - Base 6 8 1 1 1 1 1 1 1 1 22
TransLink-Owned Cycling - New for Phase Two
- - - - - - - - - - -
TransLink-Owned Cycling 6 8 1 1 1 1 1 1 1 1 22
TransLink-Owned Roads and Bridges 13 28 5 12 - - - - - 58
TransLink-Owned Roads and Bridges Total 19 36 7 13 1 1 1 1 1 1 81
Sub-total TransLink Capital Expenditures
813 676 765 675 522 654 383 240 341 442 5,510

PHASE TWO OF THE TEN YEAR VISION – INVESTMENT PLAN 80
TABLE 6B : CAPITAL EXPENDITURES AND INFRASTRUCTURE CONTRIBUTIONS ($ MILLIONS)
CAPITAL INFRASTRUCTURE CONTRIBUTIONS 2018 2019 2020 2021 2022 2023 2024 2025 2026 2027 TOTAL
2018-2027
Municipal-Owned Walking and Cycling
Walking
Base 1 5 - - - - - - - 6
New for Phase Two - - - - - - - - - - -
Total 1 5 - - - - - - - 6
Regional Cycling
Base 8 21 5 4 2 2 2 2 2 2 48
New for Phase Two - - - - - - - - - - -
Total 8 21 5 4 2 2 2 2 2 2 48
Municipal-Owned Walking and Cycling Total 10 26 5 4 2 2 2 2 2 2 54
Municipal-Owned Roads
MRN Pavement Rehab
Base 22 22 23 24 25 26 28 29 29 32 261
New for Phase Two - - - - - - - - - - -
Total 22 22 23 24 25 26 28 29 29 32 261
MRN Upgrades
Base 15 34 4 3 - - - - - - 56
New for Phase Two - - - - - - - - - - -
Total 15 34 4 3 - - - - - - 56
MRN Seismic
Base 7 21 3 2 - - - - - - 33
New for Phase Two - - - - - - - - - - -
Total 7 21 3 2 - - - - - - 33
Municipal-Owned Roads Total 43 77 30 29 25 26 28 29 29 32 349
Sub-total Capital Infrastructure Contributions
53 103 35 34 27 28 29 30 31 33 404
Total Capital Expenditures and Infrastructure Contributions
865 779 801 709 549 682 412 270 372 475 5,914

TABLE 6C : CAPITAL EXPENDITURES AND INFRASTRUCTURE CONTRIBUTIONS ($ MILLIONS)
CAPITAL FUNDING CONTRIBUTIONS 2018 2019 2020 2021 2022 2023 2024 2025 2026 2027 TOTAL
2018-2027
Federal
Federal Public Transit Infrastructure Fund (PTIF)
85 53 133 187 129 155 20 20 1 1 784
Municipal 13 1 1 1 1 1 1 1 1 - 18
Regional
Greater Vancouver Regional Fund (GVRF)
251 117 137 22 28 205 254 117 252 353 1,737
Additional Regional Proceeds from Sale of Assets
60 60 60 5 5 - - - - - 190
Regional Proceeds from Sale of Assets
10 10 10 10 10 10 10 10 10 10 100
P3 & Bridge Finance - 29 174 61 58 50 - - - - 373
Other 87 22 - - - - - - - - 109
Total Capital Funding Contributions 506 292 515 287 231 421 284 148 263 364 3,310
81 PHASE TWO OF THE TEN YEAR VISION – APPENDIX B
Note: TransLink’s financial statements reflect the financial assets that are owned by TransLink. As part of the investment plan, the province will be contributing funds for which they will be receiving assets. These funds and assets are treated as recoveries and are not recognized on TransLink’s financial statements. In addition to the provincial funds contributed, the province will also receive a proportional share of the federal funds contributed towards the expansion projects which are also treated as recoveries and not included in TransLink’s financial statements. See below for respective Federal and Provincial contributions.
ANTICIPATED PROVINCIAL ASSETS 2018 2019 2020 2021 2022 2023 2024 2025 2026 2027 TOTAL
2018-2027
Federal 61 70 72 293 184 131 262 254 76 4 1,408
Provincial 290 312 388 409 291 241 295 388 106 6 2,726
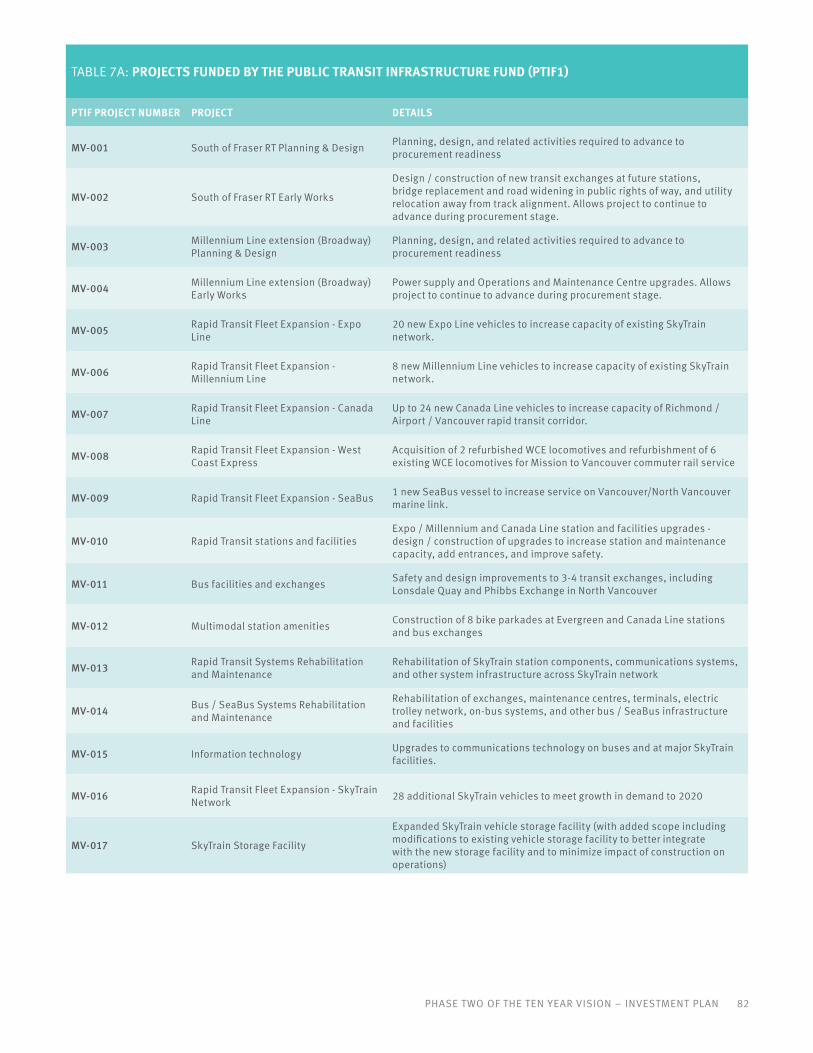
PHASE TWO OF THE TEN YEAR VISION – INVESTMENT PLAN 82
TABLE 7A: PROJECTS FUNDED BY THE PUBLIC TRANSIT INFRASTRUCTURE FUND (PTIF1)
PTIF PROJECT NUMBER PROJECT DETAILS
MV-001 South of Fraser RT Planning & Design Planning, design, and related activities required to advance to procurement readiness
MV-002 South of Fraser RT Early Works
Design / construction of new transit exchanges at future stations, bridge replacement and road widening in public rights of way, and utility relocation away from track alignment. Allows project to continue to advance during procurement stage.
MV-003 Millennium Line extension (Broadway) Planning & Design
Planning, design, and related activities required to advance to procurement readiness
MV-004 Millennium Line extension (Broadway) Early Works
Power supply and Operations and Maintenance Centre upgrades. Allows project to continue to advance during procurement stage.
MV-005 Rapid Transit Fleet Expansion - Expo Line
20 new Expo Line vehicles to increase capacity of existing SkyTrain network.
MV-006 Rapid Transit Fleet Expansion - Millennium Line
8 new Millennium Line vehicles to increase capacity of existing SkyTrain network.
MV-007 Rapid Transit Fleet Expansion - Canada Line
Up to 24 new Canada Line vehicles to increase capacity of Richmond / Airport / Vancouver rapid transit corridor.
MV-008 Rapid Transit Fleet Expansion - West Coast Express
Acquisition of 2 refurbished WCE locomotives and refurbishment of 6 existing WCE locomotives for Mission to Vancouver commuter rail service
MV-009 Rapid Transit Fleet Expansion - SeaBus 1 new SeaBus vessel to increase service on Vancouver/North Vancouver marine link.
MV-010 Rapid Transit stations and facilitiesExpo / Millennium and Canada Line station and facilities upgrades - design / construction of upgrades to increase station and maintenance capacity, add entrances, and improve safety.
MV-011 Bus facilities and exchanges Safety and design improvements to 3-4 transit exchanges, including Lonsdale Quay and Phibbs Exchange in North Vancouver
MV-012 Multimodal station amenities Construction of 8 bike parkades at Evergreen and Canada Line stations and bus exchanges
MV-013 Rapid Transit Systems Rehabilitation and Maintenance
Rehabilitation of SkyTrain station components, communications systems, and other system infrastructure across SkyTrain network
MV-014 Bus / SeaBus Systems Rehabilitation and Maintenance
Rehabilitation of exchanges, maintenance centres, terminals, electric trolley network, on-bus systems, and other bus / SeaBus infrastructure and facilities
MV-015 Information technology Upgrades to communications technology on buses and at major SkyTrain facilities.
MV-016 Rapid Transit Fleet Expansion - SkyTrain Network 28 additional SkyTrain vehicles to meet growth in demand to 2020
MV-017 SkyTrain Storage Facility
Expanded SkyTrain vehicle storage facility (with added scope including modifications to existing vehicle storage facility to better integrate with the new storage facility and to minimize impact of construction on operations)

TABLE 7B: PROJECTS FUNDED BY THE PUBLIC TRANSIT INFRASTRUCTURE FUND (PTIF2)
PROJECT DETAILS
Surrey-Newton-Guildford LRTSurrey-Newton-Guildford Light Rail Transit (SNG LRT) project is a 10.5-kilometre LRT line extending from Surrey City Centre east along 104 Avenue to Guildford Town Centre and south down King George Boulevard to Newton Town Centre.
Millennium Line Broadway ExtensionMillennium Line Broadway Extension (MLBE) is a 5.7-kilometre SkyTrain extension to the existing Millennium Line SkyTrain system from its current terminus at VCC-Clark Station to a new western terminus station at Arbutus Street.
Expo/Millennium Line UpgradeThe Expo and Millennium Upgrade Program (EMUP) expands the capacity of the existing Expo and Millennium Lines addressing shortfalls in capacity in the existing rapid transit network and supporting planned expansions including the Millennium Line Broadway Extension (MLBE).
Investments in bus infrastructure Construction of a new Transit Depot and upgrades to existing depots, improvements to B-Line corridors and bus speed/reliability improvements.
Surrey-Langley Line LRT Project development and early works for Surrey-Langley line.
83 PHASE TWO OF THE TEN YEAR VISION – APPENDIX B

PHASE TWO OF THE TEN YEAR VISION – INVESTMENT PLAN 84
TABLE 8: PROJECTS FUNDED BY THE GREATER VANCOUVER REGIONAL FUND
CATEGORY YEAR PROJECT
Bus Infrastructure 2014 TOH Metrotown Group Rectifier Replacement
Bus Fleet 2015 Community Shuttle Replacement
2015 Conventional Replacement Buses
2015 2016 Conventional Bus Replacement
2016 Community Shuttle Replacement
2016 2017 Conventional Bus Replacement
2017 HandyDART Vehicle Replacement (AIP)
2017 Community Shuttle Replacement
2017 Equipment for Deferred Retirement Program
2018 Community Shuttle Replacement
2018 Conventional Bus Replacement
2018 HandyDART Vehicle Replacement
Bus-Vehicles Conventional 40
Bus-Vehicles Conventional 60
Community Shuttle Vehicles (Expansion)
CUTRIC Battery Electric Bus Trial
HandyDART Vehicles
2018 2019 Community Shuttle Replacement
2019 Conventional Bus Expansion (40H)
2019 Conventional Bus Replacement
2019 HandyDART Vehicles Expansion
2019 HandyDart Vehicle Replacement
2019 Bus-Vehicles Conventional 60 (Expansion)
Conventional Bus Replacement
HandyDART Vehicle Replacement

TABLE 9: PROJECTS FUNDED BY THE BUILDING CANADA FUND
CATEGORY PROJECT
Rail Surrey Central Station Upgrades Construction
85 PHASE TWO OF THE TEN YEAR VISION – APPENDIX B
TABLE 8: PROJECTS FUNDED BY THE GREATER VANCOUVER REGIONAL FUND CONT'D
CATEGORY YEAR PROJECT
Bus Fleet 2020 Community Shuttle Replacement
HandyDART Vehicle Replacement
2021 Community Shuttle Replacement
HandyDART Vehicle Replacement
2022 Community Shuttle Replacement
Conventional Bus Replacement
HandyDART Vehicle Replacement
2023 Community Shuttle Replacement
Conventional Bus Replacement
HandyDART Vehicle Replacement
2024 Community Shuttle Vehicles Replacement
Conventional Bus Replacement
HandyDART Vehicle Replacement
2025 Community Shuttle Replacement
Conventional Bus Replacement
HandyDART Vehicle Replacement
2026 Community Shuttle Replacement
Conventional Bus Replacement
HandyDART Vehicle Replacement
2027 Community Shuttle Replacement
Conventional Bus Replacement
HandyDART Vehicle Replacement
Rail 2014 ATC Existing Equipment Replacement-Phase 2
2012 100-400 Series MK I Refurbishment Project
2019 MK refurb/overhaul
EXPO-Millennium RAIL Replacement of Mk1s - Vehicles
2020 MKI refurbishment (500-600 series will be 30 years old in 2021) - 16 cars
2023 MKII Mid-Life Overhaul (1300-1400 series) - 48 cars

Millennium Line Broadway Extension TL portion if Province Delivers 1 33 26 14 10 16 40 8 148
Note: Any cash flow data beyond 10 years that constitute part of gross project cost is not included in above cash flow projection table* Total project reported if TransLink delivers, if Province delivers TransLink's portion is shown below.
TABLE 10: MAJOR CAPITAL PROJECTS OVER $50 MILLION ($ MILLIONS)
PROJECTPROJECT
START YEAR
GROSS PROJECT
COST
CASH FLOW
2020 2021 2022 2023 2024 2025 2026 2027
TOTAL 2018-20272018 2019
2016 Conventional Bus Replacements 2015 89 5 31 - - - - - - - - 37
2017 Conventional Bus Replacements 2016 97 95 2 - - - - - - - - 97
2018 Conventional Bus Replacements 2017 65 62 3 - - - - - - - - 65
2020 Conventional Bus Replacements 2019 71 - - 67 4 - - - - - - 71
2023 Conventional Bus Replacements 2022 125 - - - - - 122 3 - - - 125
2024 Conventional Bus Replacements 2023 179 - - - - - - 170 9 - - 179
2025 Conventional Bus Replacements 2024 95 - - - - - - - 93 2 - 95
2026 Conventional Bus Replacements 2025 268 - - - - - - - - 252 16 268
2027 Conventional Bus Replacements 2026 351 - - - - - - - - - 351 351
Replacement of SkyTrain MKI Vehicles 2021 205 - - - - 9 90 85 21 - - 205
Fleet Expansion
Expansion of 40-ft Conventional Bus Fleet 2017 68 68 - - - - - - - - - 68
Expansion of 40-ft Conventional Bus Fleet 2018 51 - 51 - - - - - - - - 51
Canada Line Fleet Expansion 2017 88 44 0 - - - - - - - - 44
Expo/Millennium Line Fleet Expansion (56 cars) 2017 215 68 63 4 - - - - - - - 135
Expo/Millennium Line Fleet Expansion (108 cars) 2020 488 - - 12 116 64 54 131 68 43 - 488
Expo/Millennium Line Fleet Expansion (50 cars) 2024 237 - - - - - - 9 99 129 - 237
Upgrades to Existing Infrastructure
Expo Line Burrard Station Upgrade 2018 64 6 9 16 16 17 - - - - - 64
SkyTrain OMC Upgrades 2019 59 5 5 12 13 13 6 - - - - 54
Expo Line Guideway Seismic Upgrade 2020 53 - - 3 10 10 10 10 10 - - 53
Expo/Millennium Line Upgrade - Storage 2018 267 73 16 42 43 - - 46 47 - - 267
Expo/Millennium Line Upgrade - Maintenance 2019 72 - 13 14 14 15 15 - - - - 72
Expo/Millennium Line Upgrade - Power 2018 79 7 7 - 9 9 9 9 9 10 10 79
Expo/Millennium Line Upgrade - System 2018 96 4 15 28 29 19 1 - - - - 96
Metrotown Station and Exchange Upgrade Construction 2012 69 15 - - - - - - - - - 15
Commercial Broadway SkyTrain Station Phase 2 Upgrade Construction 2012 73 28 - - - - - - - - - 28
Infrastructure Expansion
Bus Depot 2018 207 31 5 30 107 33 1 - - - - 207
Surrey-Newton-Guildford LRT 2018 1,646 77 188 352 348 331 350 - - - - 1,646
Millennium Line Broadway Extension * 2018 2,833 218 234 818 510 361 289 392 - - - 2,823
Total Major Capital Project Gross Costs 8,210 807 643 1,398 1,219 881 948 856 356 436 377 7,919
Other Capital Projects 457 416 278 159 117 78 84 76 87 75 1,825
Capital Infrastructure Contributions 53 103 35 34 27 28 29 30 31 33 404
Total Capital Project Gross Costs 1,316 1,162 1,711 1,411 1,025 1,054 968 462 553 485 10,147
PHASE TWO OF THE TEN YEAR VISION – INVESTMENT PLAN 86

TABLE 11A: CONVENTIONAL TRANSIT SERVICE LEVELS (THOUSANDS OF SERVICE HOURS)
2018 2019 2020 2021 2022 2023 2024 2025 2026 2027 TOTAL 2018-2027
Bus*
Existing 5,295 5,386 5,502 5,502 5,502 5,502 5,502 5,502 5,502 5,502 54,701
New in this Plan 0 0 15 15 15 15 15 15 15 15 118
Total 5,295 5,386 5,517 5,517 5,517 5,517 5,517 5,517 5,517 5,517 54,818
SeaBus
Existing 12 13 14 14 14 14 14 14 14 14 136
New in this Plan - - - - - - - - - - -
Total 12 13 14 14 14 14 14 14 14 14 136
Rail#
Existing 1,550 1,560 1,646 1,634 1,647 1,544 1,485 1,473 1,465 1,467 15,472
New in this Plan - - - - 67 212 292 634 643 656 2,503
Total 1,550 1,560 1,646 1,634 1,713 1,756 1,777 2,107 2,108 2,122 17,975
Total Service Hours (Excluding HandyDart) 6,858 6,960 7,177 7,165 7,244 7,287 7,308 7,638 7,639 7,653 72,929
TABLE 11B: CUSTOM TRANSIT SERVICE LEVELS (THOUSANDS OF TRIPS)
2018 2019 2020 2021 2022 2023 2024 2025 2026 2027 TOTAL 2018-2027
HandyDART Vehicle Trips Available
Existing 1,233 1,271 1,271 1,271 1,271 1,271 1,271 1,271 1,271 1,271 12,672
New in this Plan - - - - - - - - - - -
Total 1,233 1,271 1,271 1,271 1,271 1,271 1,271 1,271 1,271 1,271 12,672
Taxi-Provided HandyDART Trips Available
Existing 102 102 102 102 102 102 102 102 102 102 1,020
New in this Plan - - - - - - - - - - -
Total 102 102 102 102 102 102 102 102 102 102 1,020
Total Custom Transit Trips Available 1,335 1,373 1,373 1,373 1,373 1,373 1,373 1,373 1,373 1,373 13,692
87 PHASE TWO OF THE TEN YEAR VISION – APPENDIX B
* During the construction of the Millennium Line Broadway Extension, TransLink will be providing an additional 39,000 service hours from mid-2020 through 2024, not included in these figures.
# - TransLink will be replacing the 150 Mark I SkyTrain cars with Mark III cars between 2018-2027. The Mark III cars are larger allowing the same amount of capacity to be provided with fewer vehicles and fewer service hours. Between 2018 and 2021 the Phase Two Plan increases carrying capacity by approximately 7% while service hours remain essentially the same.

PHASE TWO OF THE TEN YEAR VISION – INVESTMENT PLAN 88
TABLE 12A: TRANSIT FARE RATES
SHORT TERM FARE PRODUCTS 2018 2019 2020 2021 2022 2023 2024 2025 2026 2027TOTAL
INCREASE 2018-2027
Conventional Transit Adult Cash 1-Zone $2.95 $3.00 $3.20 $3.35 $3.45 $3.50 $3.55 $3.65 $3.70 $3.75 $0.80
2-Zone $4.20 $4.25 $4.50 $4.65 $4.80 $4.95 $5.10 $5.20 $5.40 $5.55 $1.35
3-Zone $5.70 $5.75 $6.00 $6.25 $6.45 $6.60 $6.80 $7.00 $7.20 $7.40 $1.70
Daypass All zones $10.25 $10.50 $10.75 $11.50 $11.75 $12.00 $12.50 $12.75 $13.00 $13.25 $3.00
Concession Cash 1-Zone $1.90 $2.00 $2.10 $2.20 $2.30 $2.35 $2.40 $2.50 $2.55 $2.65 $0.75
2-Zone $2.90 $3.00 $3.15 $3.30 $3.40 $3.45 $3.50 $3.60 $3.65 $3.70 $0.80
3-Zone $3.90 $4.00 $4.15 $4.35 $4.45 $4.60 $4.75 $4.90 $5.00 $5.15 $1.25
DayPass All Zones $8.00 $8.25 $8.50 $9.00 $9.25 $9.50 $9.75 $10.00 $10.25 $10.25 $2.25
Custom Transit Cash All
Zones $2.95 $3.00 $3.20 $3.35 $3.45 $3.50 $3.55 $3.65 $3.70 $3.75 $0.80
DISCOUNTED OR NON-SHORT TERM FARE PRODUCTS
Conventional Transit Adult Stored
Value 1-zone $2.30 $2.40 $2.55 $2.70 $2.75 $2.85 $2.95 $3.00 $3.10 $3.20 $0.90
2-zone $3.35 $3.45 $3.65 $3.80 $3.90 $4.05 $4.15 $4.25 $4.40 $4.50 $1.15
3-zone $4.40 $4.50 $4.75 $4.90 $5.05 $5.20 $5.35 $5.50 $5.70 $5.85 $1.45
Monthly Pass 1-zone $95.00 $98.00 $101.00 $105.00 $108.00 $111.00 $114.00 $116.00 $119.00 $121.00 $26.00
2-zone $128.00 $131.00 $135.00 $140.00 $144.00 $148.00 $153.00 $157.00 $161.00 $165.00 $37.00
3-zone $174.00 $177.00 $182.00 $189.00 $194.00 $200.00 $206.00 $212.00 $219.00 $225.00 $51.00
Concession Stored Value 1-zone $1.85 $1.95 $2.05 $2.15 $2.25 $2.25 $2.30 $2.35 $2.40 $2.45 $0.60
2-zone $2.85 $2.95 $3.05 $3.20 $3.25 $3.30 $3.35 $3.45 $3.50 $3.60 $0.75
3-zone $3.85 $3.95 $4.10 $4.30 $4.40 $4.55 $4.70 $4.75 $4.85 $4.95 $1.10
Monthly Pass
All zones $54.00 $56.00 $58.00 $59.50 $61.50 $63.50 $65.50 $66.50 $67.50 $69.50 $15.50
Custom Transit
Stored Value
All zones $2.30 $2.40 $2.55 $2.70 $2.75 $2.85 $2.95 $3.00 $3.10 $3.20 $0.90
Note: Fares shown in table are assumed to be effective on July 1 of each year.

TABLE 12B: TRANSIT FARE RATES – WEST COAST EXPRESS
SHORT TERM FARE PRODUCTS 2018 2019 2020 2021 2022 2023 2024 2025 2026 2027TOTAL
INCREASE 2018-2027
Adult Cash, one-way 1- or 2-Zone $5.70 $5.75 $5.90 $6.10 $6.30 $6.45 $6.65 $6.85 $7.05 $7.25 $1.55
3-Zone $7.45 $7.50 $7.70 $7.95 $8.20 $8.45 $8.70 $8.95 $9.20 $9.50 $2.05
4-Zone $9.20 $9.25 $9.55 $9.80 $10.10 $10.40 $10.70 $11.05 $11.40 $11.70 $2.50
5-Zone $12.45 $12.50 $12.90 $13.25 $13.65 $14.05 $14.50 $14.95 $15.35 $15.85 $3.40
Cash, return ticket 1- or 2-Zone $10.75 $11.00 $11.35 $11.65 $12.00 $12.40 $12.75 $13.15 $13.55 $13.80 $3.05
3-Zone $14.25 $14.50 $14.95 $15.40 $15.85 $16.30 $16.80 $17.30 $17.85 $18.20 $3.95
4-Zone $17.50 $17.75 $18.30 $18.85 $19.40 $20.00 $20.60 $21.20 $21.85 $22.50 $5.00
5-Zone $23.50 $23.75 $24.45 $25.20 $25.95 $26.75 $27.55 $28.35 $29.20 $30.10 $6.60
Concession Cash, one-way 1- or 2-Zone $3.40 $3.50 $3.60 $3.70 $3.80 $3.95 $4.05 $4.20 $4.25 $4.35 $0.95
3-Zone $4.40 $4.50 $4.65 $4.75 $4.90 $5.05 $5.20 $5.35 $5.55 $5.70 $1.30
4-Zone $5.65 $5.75 $5.90 $6.10 $6.30 $6.45 $6.65 $6.85 $7.05 $7.25 $1.60
5-Zone $7.65 $7.75 $8.00 $8.20 $8.45 $8.70 $9.00 $9.25 $9.55 $9.80 $2.15
Cash, return ticket 1- or 2-Zone $6.75 $7.00 $7.20 $7.40 $7.55 $7.70 $7.85 $8.05 $8.20 $8.35 $1.60
3-Zone $8.75 $9.00 $9.25 $9.55 $9.85 $10.05 $10.30 $10.50 $10.70 $10.90 $2.15
4-Zone $11.00 $11.25 $11.60 $11.95 $12.30 $12.65 $13.05 $13.40 $13.70 $13.95 $2.95
5-Zone $15.00 $15.25 $15.70 $16.20 $16.65 $17.15 $17.70 $18.20 $18.75 $19.30 $4.30
DISCOUNTED, OR NON- SHORT TERM FARES
Adult Stored Value, one-way 1/2-zone $4.80 $4.90 $5.05 $5.20 $5.35 $5.50 $5.70 $5.85 $6.05 $6.20 $1.40
3-zone $6.25 $6.35 $6.55 $6.75 $6.95 $7.15 $7.35 $7.60 $7.80 $8.05 $1.80
4-zone $7.65 $7.75 $8.00 $8.20 $8.45 $8.70 $9.00 $9.25 $9.55 $9.80 $2.15
5-zone $10.40 $10.50 $10.80 $11.15 $11.45 $11.80 $12.15 $12.55 $12.90 $13.30 $2.90
Stored Value, return pass 1/2-zone $10.50 $10.75 $11.05 $11.40 $11.75 $12.10 $12.35 $12.60 $12.85 $13.15 $2.65
3-zone $13.50 $13.75 $14.15 $14.60 $15.00 $15.50 $15.95 $16.40 $16.90 $17.30 $3.80
4-zone $16.75 $17.00 $17.50 $18.05 $18.60 $19.15 $19.70 $20.30 $20.90 $21.45 $4.70
5-zone $22.50 $22.75 $23.45 $24.15 $24.85 $25.60 $26.35 $27.15 $28.00 $28.80 $6.30
Monthly Pass 1/2-zone $155.75 $158.75 $164.00 $168.00 $173.00 $179.00 $184.00 $190.00 $195.00 $201.00 $45.25
3-zone $205.00 $208.00 $214.00 $221.00 $227.00 $234.00 $241.00 $248.00 $256.00 $263.00 $58.00
4-zone $248.00 $251.00 $259.00 $266.00 $274.00 $283.00 $291.00 $300.00 $309.00 $318.00 $70.00
5-zone $339.75 $342.75 $353.00 $364.00 $375.00 $386.00 $397.00 $409.00 $422.00 $434.00 $94.25
Concession Stored Value, one-way 1/2-zone $2.80 $2.90 $3.00 $3.10 $3.15 $3.25 $3.35 $3.45 $3.55 $3.65 $0.85
3-zone $3.60 $3.70 $3.80 $3.95 $4.05 $4.15 $4.30 $4.40 $4.55 $4.70 $1.10
4-zone $4.70 $4.80 $4.95 $5.10 $5.25 $5.40 $5.55 $5.75 $5.90 $6.10 $1.40
5-zone $6.35 $6.45 $6.65 $6.85 $7.05 $7.25 $7.50 $7.70 $7.95 $8.15 $1.80
Stored Value, return pass 1/2-zone $6.50 $6.75 $6.90 $7.05 $7.20 $7.35 $7.50 $7.65 $7.80 $7.95 $1.45
3-zone $8.25 $8.50 $8.75 $9.00 $9.30 $9.55 $9.75 $9.95 $10.15 $10.35 $2.10
4-zone $10.50 $10.75 $11.05 $11.40 $11.75 $12.10 $12.45 $12.75 $13.00 $13.25 $2.75
5-zone $14.25 $14.50 $14.95 $15.40 $15.85 $16.30 $16.80 $17.30 $17.85 $18.30 $4.05
Monthly Pass 1/2-zone $95.00 $97.00 $100.00 $103.00 $106.00 $109.00 $112.00 $116.00 $119.00 $123.00 $28.00
3-zone $126.50 $128.50 $132.00 $136.00 $140.00 $145.00 $149.00 $153.00 $158.00 $163.00 $36.50
4-zone $156.25 $158.25 $163.00 $168.00 $173.00 $178.00 $183.00 $189.00 $195.00 $200.00 $43.75
5-zone $219.25 $221.25 $228.00 $235.00 $242.00 $249.00 $256.00 $264.00 $272.00 $280.00 $60.75
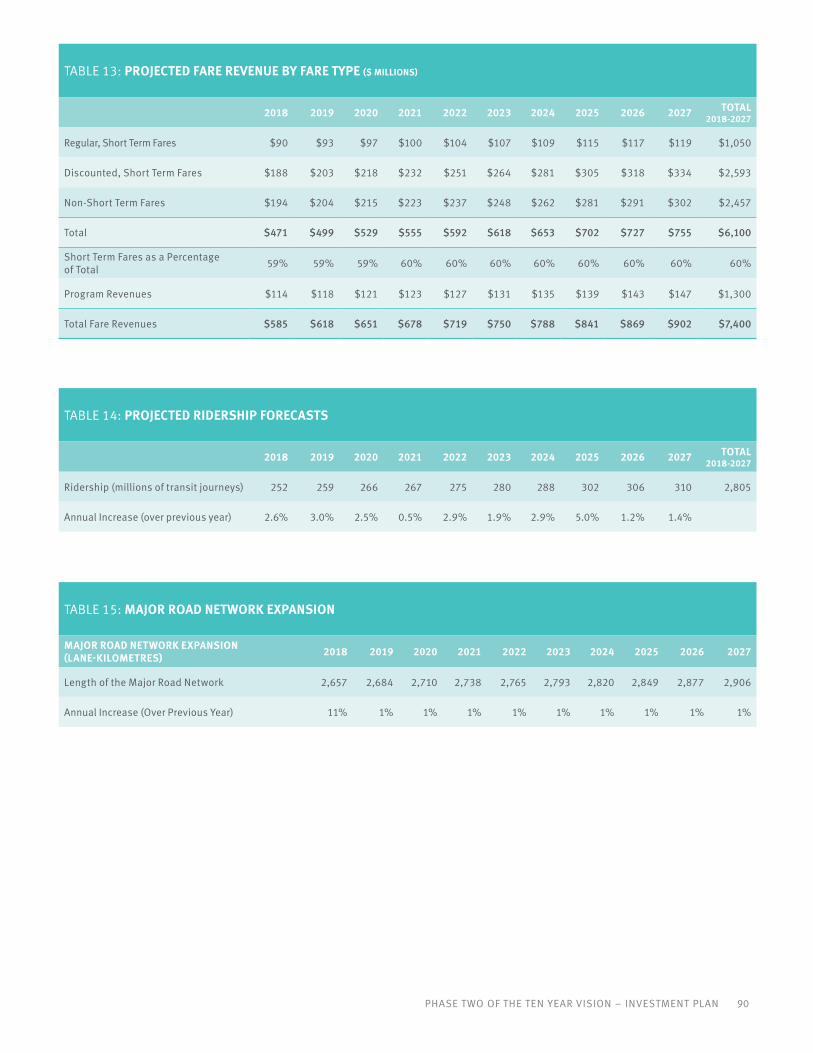
PHASE TWO OF THE TEN YEAR VISION – INVESTMENT PLAN 90
TABLE 13: PROJECTED FARE REVENUE BY FARE TYPE ($ MILLIONS)
2018 2019 2020 2021 2022 2023 2024 2025 2026 2027 TOTAL 2018-2027
Regular, Short Term Fares $90 $93 $97 $100 $104 $107 $109 $115 $117 $119 $1,050
Discounted, Short Term Fares $188 $203 $218 $232 $251 $264 $281 $305 $318 $334 $2,593
Non-Short Term Fares $194 $204 $215 $223 $237 $248 $262 $281 $291 $302 $2,457
Total $471 $499 $529 $555 $592 $618 $653 $702 $727 $755 $6,100
Short Term Fares as a Percentage of Total 59% 59% 59% 60% 60% 60% 60% 60% 60% 60% 60%
Program Revenues $114 $118 $121 $123 $127 $131 $135 $139 $143 $147 $1,300
Total Fare Revenues $585 $618 $651 $678 $719 $750 $788 $841 $869 $902 $7,400
TABLE 14: PROJECTED RIDERSHIP FORECASTS
2018 2019 2020 2021 2022 2023 2024 2025 2026 2027 TOTAL 2018-2027
Ridership (millions of transit journeys) 252 259 266 267 275 280 288 302 306 310 2,805
Annual Increase (over previous year) 2.6% 3.0% 2.5% 0.5% 2.9% 1.9% 2.9% 5.0% 1.2% 1.4%
TABLE 15: MAJOR ROAD NETWORK EXPANSION
MAJOR ROAD NETWORK EXPANSION (LANE-KILOMETRES) 2018 2019 2020 2021 2022 2023 2024 2025 2026 2027
Length of the Major Road Network 2,657 2,684 2,710 2,738 2,765 2,793 2,820 2,849 2,877 2,906
Annual Increase (Over Previous Year) 11% 1% 1% 1% 1% 1% 1% 1% 1% 1%

Appendix C: Planned bus improvements by sub-region
BURNABY AND NEW WESTMINSTER
B-Line New service Richmond to Expo Line B-Line
95 B-Line Potential upgrades, such as transit priority and enhanced passenger amenities
Expand the Frequent Transit Network 112 Edmonds Station/New West Station
128 Braid Station/22nd Street Station
144 SFU/Metrotown Station
Improve or expand service area N9 Downtown/Lougheed Station/Coquitlam Central Station NightBus
Extend hours of service 104 22nd St Station/Annacis Island
388 Walnut Grove/22nd St Station
N9 Downtown/Lougheed Station/Coquitlam Central Station
N19 Downtown/Surrey Central Station NightBus
Reduce wait times 26 Joyce Station/29th Avenue Station
28 Capilano University/Phibbs Exchange/Joyce Station
100 22nd St Station/Marpole Loop
101 Lougheed Station/22nd Street Station
116 Edmonds Station/Metrotown Station
156 Braid Station/Lougheed Station
Reduce overcrowding* 25 Brentwood Station/UBC
49 Metrotown Station/UBC
95 B-Line SFU/Burrard Station B-Line
130 Metrotown/Hastings/Kootenay/Capilano University
*The overcrowding improvements listed above are examples only based on 2016 ridership data. The specific routes that will be selected for overcrowding improvements will be finalized closer to the date of implementation (2020-21).
MAPLE RIDGE AND PITT MEADOWS
B-Line Lougheed Highway B-Line
Potential upgrades, such as transit priority and enhanced passenger amenities
Extend hours of service 595 Maple Meadows Station/Langley Centre
Improve or expand service area Maple Ridge and Pitt Meadows transit routes
Restructure shuttle network based on outcome of comprehensive Area Transport Plan process underway
91 PHASE TWO OF THE TEN YEAR VISION – APPENDIX C
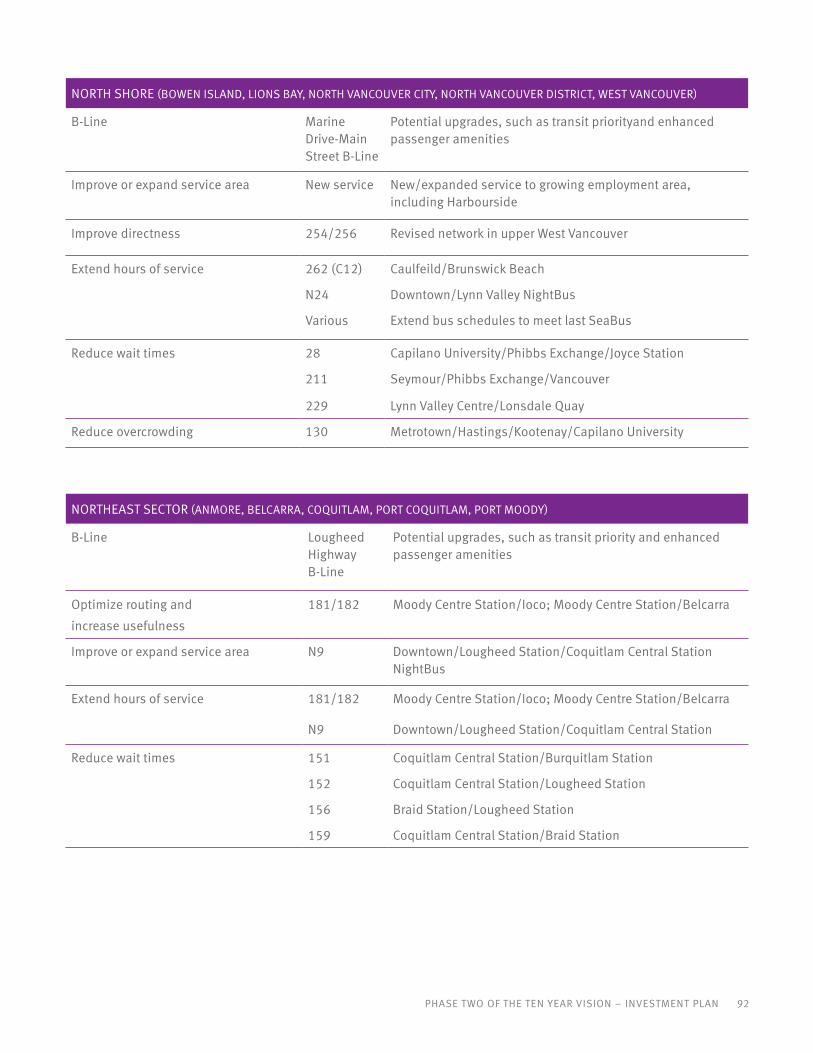
PHASE TWO OF THE TEN YEAR VISION – INVESTMENT PLAN 92
NORTH SHORE (BOWEN ISLAND, LIONS BAY, NORTH VANCOUVER CITY, NORTH VANCOUVER DISTRICT, WEST VANCOUVER)
B-Line Marine Drive-Main Street B-Line
Potential upgrades, such as transit priorityand enhanced passenger amenities
Improve or expand service area New service New/expanded service to growing employment area, including Harbourside
Improve directness 254/256 Revised network in upper West Vancouver
Extend hours of service 262 (C12) Caulfeild/Brunswick Beach
N24 Downtown/Lynn Valley NightBus
Various Extend bus schedules to meet last SeaBus
Reduce wait times 28 Capilano University/Phibbs Exchange/Joyce Station
211 Seymour/Phibbs Exchange/Vancouver
229 Lynn Valley Centre/Lonsdale Quay
Reduce overcrowding 130 Metrotown/Hastings/Kootenay/Capilano University
NORTHEAST SECTOR (ANMORE, BELCARRA, COQUITLAM, PORT COQUITLAM, PORT MOODY)
B-Line Lougheed Highway B-Line
Potential upgrades, such as transit priority and enhanced passenger amenities
Optimize routing and
increase usefulness
181/182 Moody Centre Station/Ioco; Moody Centre Station/Belcarra
Improve or expand service area N9 Downtown/Lougheed Station/Coquitlam Central Station NightBus
Extend hours of service 181/182 Moody Centre Station/Ioco; Moody Centre Station/Belcarra
N9 Downtown/Lougheed Station/Coquitlam Central Station
Reduce wait times 151 Coquitlam Central Station/Burquitlam Station
152 Coquitlam Central Station/Lougheed Station
156 Braid Station/Lougheed Station
159 Coquitlam Central Station/Braid Station

SOUTH OF FRASER (NORTH DELTA, LANGLEY CITY, LANGLEY TOWNSHIP, SURREY, WHITE ROCK)
B-Line New service Scott Road (120th Street) B-Line, including transit priority and enhanced passenger amenities
Fraser Highway B-Line
Potential upgrades, such as transit priority and enhanced passenger amenities
Improve or expand service area New service New 68th Avenue Crosstown
New service East Fraser Heights
Langley transit routes Restructure Langley shuttle network
640 Extend connections to Tsawwassen Ferry Terminal
Expand the Frequent Transit Network 323 Newton Exchange/Surrey Central Station
Extend hours of service 96 Guildford Exchange/Newton Exchange B-Line
104 22nd St Station/Annacis Island
322 (C75) Newton Exchange/Scottsdale
324 Newton Exchange/Surrey Central Station
341 Guildford/Newton Exchange
342 Langley Centre/Newton Exchange
363 Southpoint/Peace Arch Hospital
364 Langley Centre/ Scottsdale Exchange
388 Walnut Grove/22nd Street Station
531 White Rock Centre/Willowbrook
560/561 (C60) Langley Centre/Langley Hospital
595 Maple Meadows Station/Langley Centre
N19 Downtown/Surrey Central Station NightBus
Reduce wait times 301 Newton Exchange/Brighouse Station
312 Scottsdale/Scott Road Station
316 Surrey Central Station/Scottsdale
325 Newton Exchange/Surrey Central Station
341 Guildford/Newton Exchange
342 Langley Centre/Newton Exchange
364 Langley Centre/ Scottsdale Exchange
375 White Rock/White Rock South/Guildford
501 Langley Centre/Surrey Central Station
555 Lougheed Station/Carvolth Exchange
Reduce overcrowding* 351 Crescent Beach/Bridgeport Station
555 Lougheed Station/Carvolth Exchange
*The overcrowding improvements listed above are examples only based on 2016 ridership data. The specific routes that will be selected for overcrowding improvements will be finalized closer to the date of implementation (2020-21).
93 PHASE TWO OF THE TEN YEAR VISION – APPENDIX C

PHASE TWO OF THE TEN YEAR VISION – INVESTMENT PLAN 94
SOUTHWEST (SOUTH DELTA, RICHMOND, TSAWWASSEN FIRST NATION)
B-Line New service Richmond to Expo Line B-Line, including transit priority and enhanced passenger amenities
Improved or expand service area 640 Extend connections to Tsawwassen Ferry Terminal
Improve directness N10/N15 Downtown/Cambie/Richmond NightBus
Expand the Frequent Transit Network 403 Bridgeport Station/Three Road
601 South Delta/Boundary Bay/Bridgeport
Extend hours of service 606 Ladner Ring
608 Ladner Ring
N10 Downtown/Richmond NightBus
N15 Downtown/Cambie/NightBus
Reduce wait times 301 Newton Exchange/Brighouse Station
401 One Road/Garden City
402 Two Road/Brighouse Station
407 Gilbert/Bridgeport
Reduce overcrowding* 351 Crescent Beach/Bridgeport Station
*The overcrowding improvements listed above are examples only based on 2016 ridership data. The specific routes that will be selected for overcrowding improvements will be finalized closer to the date of implementation (2020-21).

VANCOUVER, UBC, AND UEL
B-Line 95 B-Line
41st Avenue B-Line
Potential upgrades, such as transit priority and enhanced passenger amenities
Potential upgrades, such as transit priority and enhanced passenger amenities
Improve or expand service area New service East Fraser Lands (River District)
N9 Downtown/Lougheed Station/Coquitlam Central Station NightBus
Improve directness N10/N15 Downtown/Cambie/Richmond NightBus
Extend hours of service N8 Downtown/Fraser NightBus
N9 Downtown/Lougheed Station/Coquitlam Central Station NightBus
N10 Downtown/Richmond NightBus
N15 Downtown/Cambie NightBus
N17 Downtown/UBC NightBus
N19 Downtown/Surrey Central Station NightBus
N20 Downtown/Victoria NightBus
N22 Downtown/Macdonald NightBus
N24 Downtown/Lynn Valley NightBus
Reduce wait times 26 Joyce Station/29th Avenue Station
27 Kootenay Loop/Joyce Station
28 Capilano University/Phibbs Exchange/Joyce Station
44 UBC/Downtown
100 22nd Street Station/Marpole Loop
Reduce overcrowding* 2 Macdonald-16th Ave/Burrard Station
4 Powell/Downtown/UBC
14 Hastings/UBC
25 Brentwood Station/UBC
44 UBC/Downtown
49 Metrotown Station/Dunbar Loop/UBC
84 UBC/VCC Station
95 B-Line SFU/Burrard Station B-Line
130 Metrotown/Hastings/Kootenay/Capilano University
*The overcrowding improvements listed above are examples only based on 2016 ridership data. The specific routes that will be selected for overcrowding improvements will be finalized closer to the date of implementation (2020-21).
95 PHASE TWO OF THE TEN YEAR VISION – APPENDIX C
PHASE TWO OF THE TEN YEAR VISION – INVESTMENT PLAN 96
Appendix D: Regional Transportation Development Cost Charge Eligible ProjectsIn May 2018, the provincial government passed legislation enabling TransLink to levy a new
region-wide development cost charge (DCC) to fund certain types of transit and regional
transportation capital projects related to growth. To contribute to the regional share of funding
for paying for growth related expansion and upgrade projects in Phase One and Phase Two of the
10-Year Vision, TransLink will impose a new region-wide development cost charge (DCC).
A list of all projects from Phase One and Phase Two of the 10-Year Vision that are eligible for
funding by the DCC is presented in Table 1 below, including an estimate of the money TransLink
will be required to pay in each year of the Plan to fund these eligible projects. These projects are
required for TransLink to expand the regional transportation system and accommodate projected
population growth resulting from development in TransLink’s service region. A significant
amount of travel demand in Metro Vancouver is for trips that cross municipal boundaries; new
development throughout the transportation service region is expected to increase demand and
put capacity pressure on the entire regional transportation system. The projects to be funded
by the DCC will assist TransLink in addressing these capacity and growth-related issues. The
total cost for funding these capacity expansion capital projects in Phase One and Phase Two
is estimated at $6.3 billion. Revenue from the DCC would contribute approximately 4% of the
funding for these eligible projects. The remaining revenue comes from federal and provincial
contributions, TransLink’s existing resources, and new regional funding. For more detail on
funding, see section 4 of this Plan.
From 2018 to 2027, TransLink anticipates receiving $252 million in revenue from the DCC; the
bottom of Table 1 outlines the total amount of money anticipated each year. This revenue will
be deposited into a reserve fund from which expenditures related to the eligible projects will
be paid; specific expenditures will be confirmed through TransLink’s annual capital planning
process.

TABLE 1: REGIONAL TRANSPORTATION DEVELOPMENT COST CHARGE PROGRAM – ELIGIBLE PROJECTS AND ANNUAL ESTIMATED CAPITAL COSTS, AND ANTICIPATED DCC REVENUE ($ MILLLIONS)
BUS EXCHANGE/DEPOT AND SEABUS EXPANSION 2018 2019 2020 2021 2022 2023 2024 2025 2026 2027
Newton Exchange Expansion Upgrade •
Nanaimo Exchange Upgrade •
Metrotown Exchange Upgrade •
Phibbs Exchange Upgrade •
Capacity Expansion at Existing Bus Depots* • • • • •
New Marpole Bus Depot • • • • • •
B-Line Infrastructure Expansion • • • • • • • • •
Regional Bus Priority Infrastructure Expansion • • • •
SeaBus Fleet Expansion • •
1 Development cost charges may not be used to fund capital costs related to motor vehicles (other than ferries), vehicles capable of being propelled by muscular power, or parking facilities. A motor vehicle is defined in the South Coast British Columbia Transportation Authority Act as “…a vehicle propelled, other than by muscular power, but does not include (a) airplanes, (b) the cars of electric and steam railways, or (c) other vehicles running only on rails or tracks.”
97 PHASE TWO OF THE TEN YEAR VISION – APPENDIX D
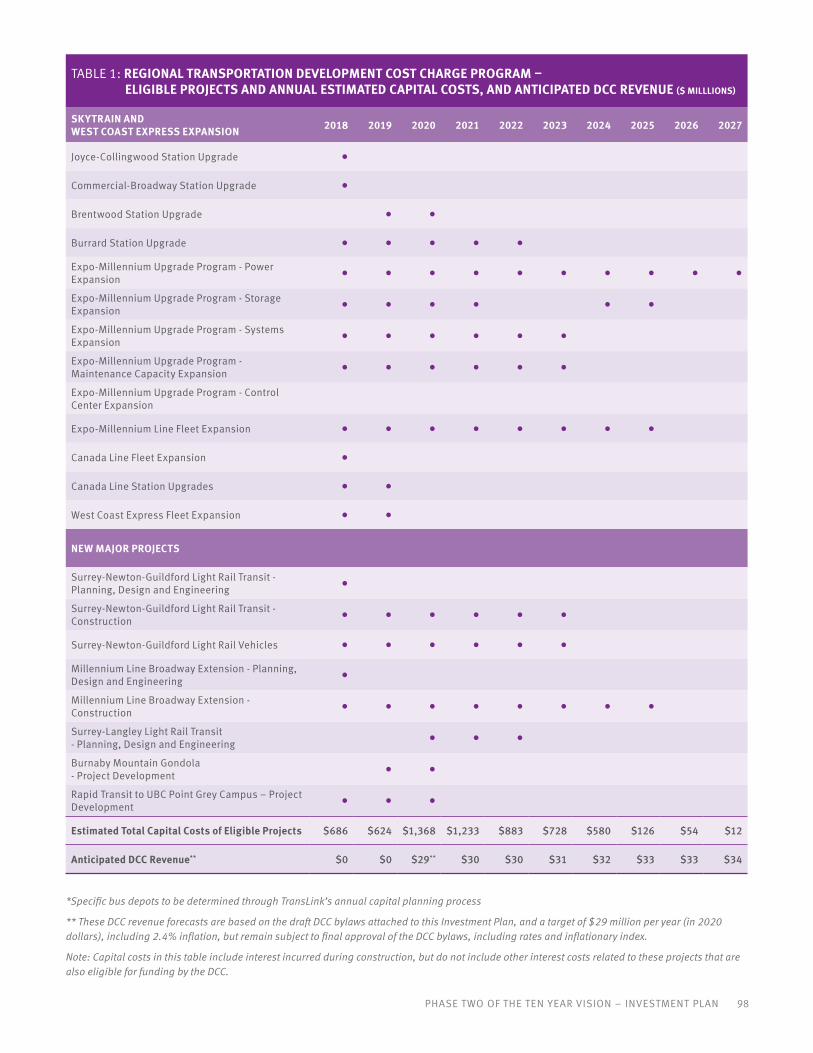
*Specific bus depots to be determined through TransLink’s annual capital planning process
** These DCC revenue forecasts are based on the draft DCC bylaws attached to this Investment Plan, and a target of $29 million per year (in 2020 dollars), including 2.4% inflation, but remain subject to final approval of the DCC bylaws, including rates and inflationary index.
Note: Capital costs in this table include interest incurred during construction, but do not include other interest costs related to these projects that are also eligible for funding by the DCC.
TABLE 1: REGIONAL TRANSPORTATION DEVELOPMENT COST CHARGE PROGRAM – ELIGIBLE PROJECTS AND ANNUAL ESTIMATED CAPITAL COSTS, AND ANTICIPATED DCC REVENUE ($ MILLLIONS)
SKYTRAIN AND WEST COAST EXPRESS EXPANSION 2018 2019 2020 2021 2022 2023 2024 2025 2026 2027
Joyce-Collingwood Station Upgrade •
Commercial-Broadway Station Upgrade •
Brentwood Station Upgrade • •
Burrard Station Upgrade • • • • •
Expo-Millennium Upgrade Program - Power Expansion • • • • • • • • • •
Expo-Millennium Upgrade Program - Storage Expansion • • • • • •
Expo-Millennium Upgrade Program - Systems Expansion • • • • • •
Expo-Millennium Upgrade Program - Maintenance Capacity Expansion • • • • • •
Expo-Millennium Upgrade Program - Control Center Expansion
Expo-Millennium Line Fleet Expansion • • • • • • • •
Canada Line Fleet Expansion •
Canada Line Station Upgrades • •
West Coast Express Fleet Expansion • •
NEW MAJOR PROJECTS
Surrey-Newton-Guildford Light Rail Transit - Planning, Design and Engineering •
Surrey-Newton-Guildford Light Rail Transit - Construction • • • • • •
Surrey-Newton-Guildford Light Rail Vehicles • • • • • •
Millennium Line Broadway Extension - Planning, Design and Engineering •
Millennium Line Broadway Extension - Construction • • • • • • • •
Surrey-Langley Light Rail Transit - Planning, Design and Engineering • • •
Burnaby Mountain Gondola - Project Development • •
Rapid Transit to UBC Point Grey Campus – Project Development • • •
Estimated Total Capital Costs of Eligible Projects $686 $624 $1,368 $1,233 $883 $728 $580 $126 $54 $12
Anticipated DCC Revenue** $0 $0 $29** $30 $30 $31 $32 $33 $33 $34
PHASE TWO OF THE TEN YEAR VISION – INVESTMENT PLAN 98

PHASE TWO OF THE TEN YEAR VISION – INVESTMENT PLAN 99 tenyearvision.translink.ca