
Phase-locked stereoscopic PIV measurements of the - DTU Orbit
13
General rights Copyright and moral rights for the publications made accessible in the public portal are retained by the authors and/or other copyright owners and it is a condition of accessing publications that users recognise and abide by the legal requirements associated with these rights. Users may download and print one copy of any publication from the public portal for the purpose of private study or research. You may not further distribute the material or use it for any profit-making activity or commercial gain You may freely distribute the URL identifying the publication in the public portal If you believe that this document breaches copyright please contact us providing details, and we will remove access to the work immediately and investigate your claim. Downloaded from orbit.dtu.dk on: Feb 28, 2022 Phase-locked stereoscopic PIV measurements of the turbulent swirling flow in a dynamic model of a uniflow-scavenged two-stroke engine cylinder Ingvorsen, Kristian Mark; Meyer, Knud Erik; Walther, Jens Honore; Mayer, Stefan Published in: Proceedings of the 10th International Symposium on Particle Image Velocimetry Publication date: 2013 Link back to DTU Orbit Citation (APA): Ingvorsen, K. M., Meyer, K. E., Walther, J. H., & Mayer, S. (2013). Phase-locked stereoscopic PIV measurements of the turbulent swirling flow in a dynamic model of a uniflow-scavenged two-stroke engine cylinder. In Proceedings of the 10th International Symposium on Particle Image Velocimetry TU Delft. http://www.piv2013.org/
Transcript of Phase-locked stereoscopic PIV measurements of the - DTU Orbit
General rights Copyright and moral rights for the publications made accessible in the public portal are retained by the authors and/or other copyright owners and it is a condition of accessing publications that users recognise and abide by the legal requirements associated with these rights.
Users may download and print one copy of any publication from the public portal for the purpose of private study or research.
You may not further distribute the material or use it for any profit-making activity or commercial gain
You may freely distribute the URL identifying the publication in the public portal If you believe that this document breaches copyright please contact us providing details, and we will remove access to the work immediately and investigate your claim.
Downloaded from orbit.dtu.dk on: Feb 28, 2022
Phase-locked stereoscopic PIV measurements of the turbulent swirling flow in adynamic model of a uniflow-scavenged two-stroke engine cylinder
Ingvorsen, Kristian Mark; Meyer, Knud Erik; Walther, Jens Honore; Mayer, Stefan
Published in:Proceedings of the 10th International Symposium on Particle Image Velocimetry
Publication date:2013
Link back to DTU Orbit
Citation (APA):Ingvorsen, K. M., Meyer, K. E., Walther, J. H., & Mayer, S. (2013). Phase-locked stereoscopic PIVmeasurements of the turbulent swirling flow in a dynamic model of a uniflow-scavenged two-stroke enginecylinder. In Proceedings of the 10th International Symposium on Particle Image Velocimetry TU Delft.http://www.piv2013.org/
10TH INTERNATIONAL SYMPOSIUM ON PARTICLE IMAGE VELOCIMETRY - PIV13Delft, The Netherlands, July 1-3, 2013
Phase-locked stereoscopic PIV measurements of the turbule nt swirling flow in adynamic model of a uniflow-scavenged two-stroke engine cyli nder
Kristian Mark Ingvorsen 1, Knud Erik Meyer 1, Jens Honor e Walther 1,2, and Stefan Mayer 3
1 Department of Mechanical Engineering, Technical University of Denmark, Kgs. Lyngby, [email protected]
2 Computational Science and Engineering Laboratory, ETH Zurich, Zurich, Switzerland
3 MAN Diesel & Turbo SE, Copenhagen, Denmark
ABSTRACT
It is desirable to use computational fluid dynamics for the optimization of in-cylinder processes in large two-stroke low-speed uniflow-scavenged marine diesel engines. However, the complex nature of the turbulent swirling in-cylinder flow necessitates experimentaldata for validation of the used turbulence models. In the present work, the flow in a dynamic scale model of a uniflow-scavengedcylinder is investigated experimentally. The model has a transparent cylinder and a movable piston driven by a linear motor. The flowis investigated using phase-locked stereoscopic particleimage velocimetry (PIV) and time resolved laser Doppler anemometry (LDA).Radial profiles of the phase-averaged mean velocities are computed from the velocity fields recorded with PIV and the validity of theobtained profiles is demonstrated by comparison with reference LDA measurements. Radial profiles are measured at five axial positionsfor 15 different times during the engine cycle and shows the temporal and spatial development of the swirling in-cylinder flow. Thetangential velocity profiles in the bottom of the cylinder near the end of the scavenging process are characterized by a concentratedswirl resulting in wake-like axial velocity profiles and theoccurrence of a vortex breakdown. After scavenge port closing the axialvelocity profiles indicate that large transient swirl-induced structures exists in the cylinder. Comparison with profiles obtained understeady-flow conditions shows that the steady profiles in general will not be representative for the dynamic conditions. The temporaldevelopment of the swirl strength is investigated by computing the angular momentum. The swirl strength shows an exponential decayfrom scavenge port closing to scavenge port opening corresponding to a reduction of 34%.
1. Introduction
1.1 Background and motivation
Large two-stroke low-speed uniflow-scavenged marine diesel engines are used to power the largest marine vessels such astankers andcontainer ships. A key process for these engines is the scavenging process [15]. The scavenging process is the gas exchange where thecombustion gas from the previous cycle is replaced by fresh air for the next cycle. Large two-stroke low-speed marine diesel enginesuse the uniflow scavenging method in a configuration with scavenge ports located in the cylinder liner near the bottom of the cylinderand a single centered exhaust valve in the cylinder head. As the piston approaches the bottom dead center (BDC), it uncovers thescavenge ports and compressed air is blown into the cylinderforcing the combustion gas out through the exhaust valve in acombineddisplacement and mixing process. The scavenge ports are cutat an angle, typically in the range 15-25◦, with respect to the radialdirection creating a swirling in-cylinder flow. The swirl improves the scavenging process and enhances the fuel-air mixing during thecombustion phase [5]. In addition, the scavenging flow also provides cooling of the combustion chamber surfaces. To reduce emissionlevels, enhance engine efficiency, and analyze combustion chamber temperatures it is desirable to use computational fluid dynamics(CFD) simulations. However, turbulent swirling flows, suchas the in-cylinder flow in a uniflow-scavenged engine, are known to bevery difficult to predict using CFD tools owing to their complex nature [9]. Experimental results are therefore needed inorder to serveas validation data and to aid the development of turbulence models. Despite the need for experimental data on the turbulent swirlingflow in uniflow-scavenged engines almost no works exist in theopen literature presenting results suitable for validation purposes. It isthis lack of experimental data that has motivated the present work.
1.2 Previous work
The swirling in-cylinder flow in uniflow-scavenged engines have been the subject of earlier works, and investigations have been basedon both CFD (e.g. [19, 2, 20, 3, 13, 17]) and experiments (e.g.[14, 12, 16, 4, 8, 7]). Due to the costs and limitations of experimentalinvestigations on full-scale engines the majority of the experimental work have been performed on simplified scale models, and oftenunder steady-flow conditions. Ingvorsen et al. [7] developed a simplified experimental scale model of the MAN Diesel & Turbo4T50ME-X research engine [6], which is a production sized low-speed marine diesel engine. The flow in the model was investigatedunder steady-flow conditions through extensive measurements using stereoscopic particle image velocimetry (PIV) andlaser Doppleranemometry (LDA). For a 20◦ port angle, it was found, that the radial profiles of tangential velocity correspond to a concentratedvortex, with the highest velocities occurring near the cylinder axis. The axial profiles have a wake-like shape created by a velocitydeficit at the axis. In the bottom of the cylinder a central recirculation zone exists and near the cylinder head the vortexcore is observed
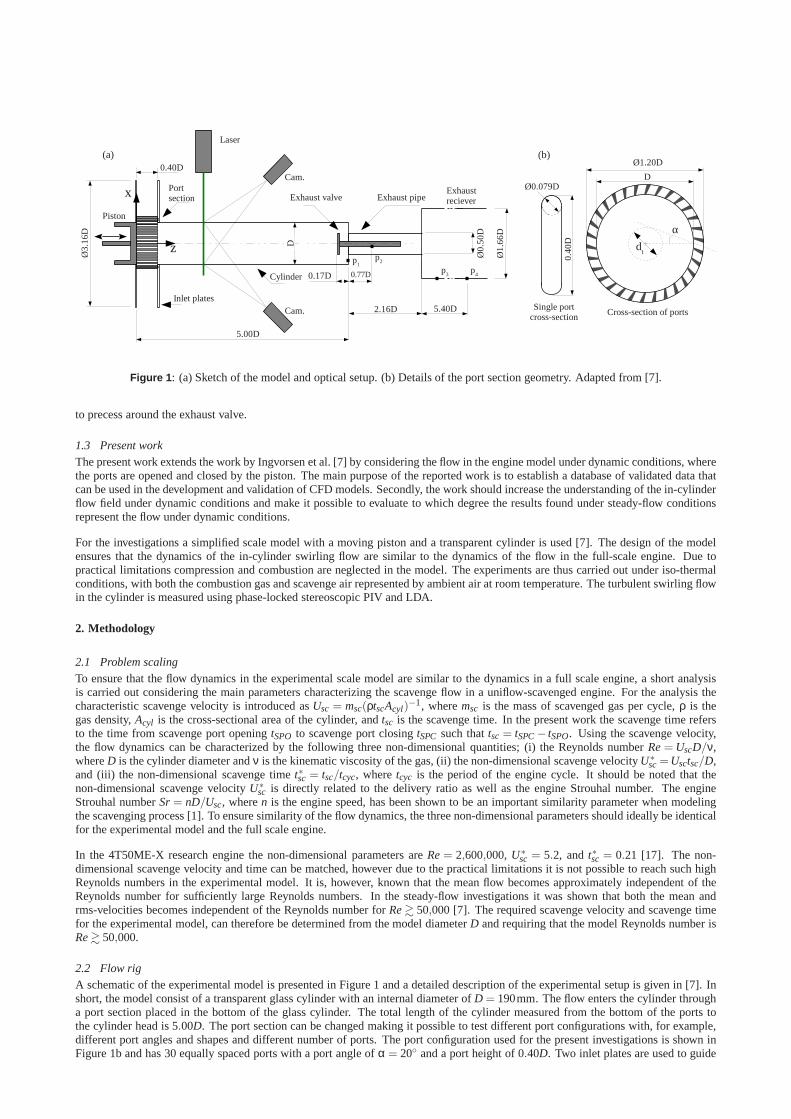
Figure 1 : (a) Sketch of the model and optical setup. (b) Details of theport section geometry. Adapted from [7].
to precess around the exhaust valve.
1.3 Present work
The present work extends the work by Ingvorsen et al. [7] by considering the flow in the engine model under dynamic conditions, wherethe ports are opened and closed by the piston. The main purpose of the reported work is to establish a database of validateddata thatcan be used in the development and validation of CFD models. Secondly, the work should increase the understanding of the in-cylinderflow field under dynamic conditions and make it possible to evaluate to which degree the results found under steady-flow conditionsrepresent the flow under dynamic conditions.
For the investigations a simplified scale model with a movingpiston and a transparent cylinder is used [7]. The design of the modelensures that the dynamics of the in-cylinder swirling flow are similar to the dynamics of the flow in the full-scale engine.Due topractical limitations compression and combustion are neglected in the model. The experiments are thus carried out under iso-thermalconditions, with both the combustion gas and scavenge air represented by ambient air at room temperature. The turbulentswirling flowin the cylinder is measured using phase-locked stereoscopic PIV and LDA.
2. Methodology
2.1 Problem scaling
To ensure that the flow dynamics in the experimental scale model are similar to the dynamics in a full scale engine, a short analysisis carried out considering the main parameters characterizing the scavenge flow in a uniflow-scavenged engine. For the analysis thecharacteristic scavenge velocity is introduced asUsc = msc(ρtscAcyl)
−1, wheremsc is the mass of scavenged gas per cycle,ρ is thegas density,Acyl is the cross-sectional area of the cylinder, andtsc is the scavenge time. In the present work the scavenge time refersto the time from scavenge port openingtSPO to scavenge port closingtSPC such thattsc = tSPC− tSPO. Using the scavenge velocity,the flow dynamics can be characterized by the following threenon-dimensional quantities; (i) the Reynolds numberRe= UscD/ν,whereD is the cylinder diameter andν is the kinematic viscosity of the gas, (ii) the non-dimensional scavenge velocityU∗
sc=Usctsc/D,and (iii) the non-dimensional scavenge timet∗sc = tsc/tcyc, wheretcyc is the period of the engine cycle. It should be noted that thenon-dimensional scavenge velocityU∗
sc is directly related to the delivery ratio as well as the engine Strouhal number. The engineStrouhal numberSr= nD/Usc, wheren is the engine speed, has been shown to be an important similarity parameter when modelingthe scavenging process [1]. To ensure similarity of the flow dynamics, the three non-dimensional parameters should ideally be identicalfor the experimental model and the full scale engine.
In the 4T50ME-X research engine the non-dimensional parameters areRe= 2,600,000, U∗sc = 5.2, andt∗sc = 0.21 [17]. The non-
dimensional scavenge velocity and time can be matched, however due to the practical limitations it is not possible to reach such highReynolds numbers in the experimental model. It is, however,known that the mean flow becomes approximately independent of theReynolds number for sufficiently large Reynolds numbers. Inthe steady-flow investigations it was shown that both the mean andrms-velocities becomes independent of the Reynolds numberfor Re& 50,000 [7]. The required scavenge velocity and scavenge timefor the experimental model, can therefore be determined from the model diameterD and requiring that the model Reynolds number isRe& 50,000.
2.2 Flow rig
A schematic of the experimental model is presented in Figure1 and a detailed description of the experimental setup is given in [7]. Inshort, the model consist of a transparent glass cylinder with an internal diameter ofD = 190mm. The flow enters the cylinder througha port section placed in the bottom of the glass cylinder. Thetotal length of the cylinder measured from the bottom of the ports tothe cylinder head is 5.00D. The port section can be changed making it possible to test different port configurations with, for example,different port angles and shapes and different number of ports. The port configuration used for the present investigations is shown inFigure 1b and has 30 equally spaced ports with a port angle ofα = 20◦ and a port height of 0.40D. Two inlet plates are used to guide
the ambient air from the surroundings to the ports. The flow exits the cylinder through an exhaust pipe with a diameter of 0.50D. Toenter the exhaust pipe the flow must go around a static exhaustvalve with an opening corresponding to full valve lift in theengine.From the exhaust pipe the flow enters the exhaust receiver which is a large cylindrical volume with a diameter of 1.66D and length of6.77D. The exhaust receiver is connected to a frequency controlled centrifugal fan by a contraction. The fan drives the flow throughthe model and exhausts directly into the ambient air. Both the cylinder head, the exhaust valve, and the piston surface are flat. Thegap between the piston side and cylinder wall is 0.005D and is sealed by two custom made piston rings. The piston rings are made inTeflon to reduce friction and limit abrasion of the glass wall. The axial distance from the piston surface to the contact point between thefirst piston ring and the cylinder wall is 0.03D, meaning that the effective port opening occurs slightly before the piston surface movesbelow the top of the scavenge ports. A coordinate system is defined as shown in Figure 1a with thez-axis coincident with the cylinderaxis and the origin at the axial position corresponding to the bottom of the ports.
The piston motion is controlled by a linear motor and a programmable servo controller. At the cycle start the piston is located with thepiston surface atz/D = 1.00, it then moves toz/D = 0.00, corresponding to 100% open ports, and back toz/D = 1.00 in a sinusoidalmotion. Having returned toz/D= 1.00 the piston has a standstill period before the cycle is repeated. The total cycle time istcyc= 1.20sand both the motion and standstill period are1
2tcyc in duration. Defining the time of port opening and closing as the times when thepiston surface is atz/D = 0.40D, the port opening and closing occur attSPO= 0.14tcyc andtSPC= 0.36tcyc, respectively. To relatethe velocity and pressure measurements to the piston motiona trigger signal is sent from the servo controller at port opening. The fanspeed is adjusted such that the Reynolds number based on the scavenge velocity isRe= 50,000, which for standard ambient conditions(20◦ C, 1atm) corresponds toUsc= 3.96m/s. The non-dimensional scavenge velocity and scavenge timefor the model thus becomeU∗
sc= 5.4 andt∗sc= 0.22, respectively. These are approximately the same as in thefull-scale engine and it can therefore be expected thatthe flow physics in the model and the engine are similar. It should be noted, that when adjusting the fan speed, the scavengevelocityis estimated from time resolved measurements of the pressure difference over the valve using a pressure drop coefficientdeterminedunder steady-flow conditions.
The scavenge velocity based on the pressure difference is not sufficiently accurate for normalization purposes. Instead, the bulk velocityat t/tcyc= 0.25, corresponding to fully open ports, is used to normalize the results in the remainder of the paper. The bulk velocity isdenotedVb and is estimated from the radial profile of axial velocity measured with PIV atz/D = 1.50, and is found to beVb = 4.70m/s.The PIV and LDA measurements are performed at five axial positions correspondingz/D = {1.00,1.50,2.00,3.00,4.00}
2.3 Pressure measurements
The pressure in the model is measured using four wall pressure tabs. The pressure tabs are located in the cylinder head, onthe exhaustvalve rod, and on the side of the exhaust receiver 0.37D and 5.40D downstream the inlet to the exhaust receiver c.f. Figure 1a.Thepressure is measured with pressure transducers and sampledwith a rate of 5.0kHz using a LabVIEW acquisition system. The pressureis measured for 50 consecutive cycles and the phase-averaged pressure is calculated.
2.4 Laser Doppler anemometry (LDA)
The details of the used laser Doppler anemometry (LDA) system are given in [7]. Due to the optical distortions created by the curvedglass wall, the LDA system is limited to measurements of the axial velocity component in a horizontal plane going throughthe cylinderaxis. The system is operated in burst mode which results in velocity measurements randomly distributed in time. In orderto estimatethe phase-averaged velocity, a temporal binning is carriedout using a window size of 10−3tcyc. The seeding used for the measurementsis di-ethyl-hexyl-sebacate (DEHS) droplets with diameters in the range 0.1–2.0µm generate by a Laskin nozzle.
2.5 Stereoscopic particle image velocimetry (PIV)
System:Stereoscopic particle image velocimetry (PIV) measurements are carried out using a commercial PIV system consisting of two camerasand a laser. The laser is a 200mJ double cavity Nd:YAG laser. The light sheet thickness in the field of view is 2–3mm and the laser isoperated at full power for the measurements. The cameras are12bit gray-scale CCD cameras (Dantec Dynamics HiSense Mk II) witha chip size of 1,344×1,024pixels and a pixel pitch of 6.45µm. The cameras are fitted with 60mm lenses using Scheimpflug mountsand the F-number is set to 11 for both cameras. A schematic of the PIV setup is included in Figure 1. The laser is positioned next to themodel such that the light sheet illuminates the cylinder cross section. The cameras are positioned at the downstream side of the lightsheet with one camera on the same side as the laser (backward scatter position) and one camera on the opposite side of the cylinder(forward scatter position). Due to the angular dependency of the intensity for Mie scattering, the camera in the backward scatter positionreceives significantly less light than the camera in the forward scatter position. This difference is accounted for by increasing the gainlevel on the camera in the backward scatter position. The laser and cameras are mounted on a traverse aligned with the cylinder axisallowing measurements to be taken at different axial positions using the same camera calibration. The camera calibration, acquisition,and processing of particle images are carried out using the Dantec Dynamics DynamicStudio version 3.3 software. Beforeanalyzingthe particle images, background images are subtracted to enhance the image quality. The used background images are calculated asthe temporal minimum image of their respective measurementseries. The particle images are processed using a three-step adaptivecorrelation algorithm with a final interrogation area size of 32×32pixels and 50% overlap. Spurious vectors are detected using a localmedian criterion and replaced by interpolation.
To obtain phase-locked measurements, the timing of the laser and cameras is controlled by the trigger signal sent from the servo-controller. By specifying a trigger delay in the software, it is possible to measure at arbitrary times during the cycle.Measurementsare performed at 15 different times during the cycle. The measurement times are presented in Table 1 together with the correspondingpiston positions, and port opening ratios.
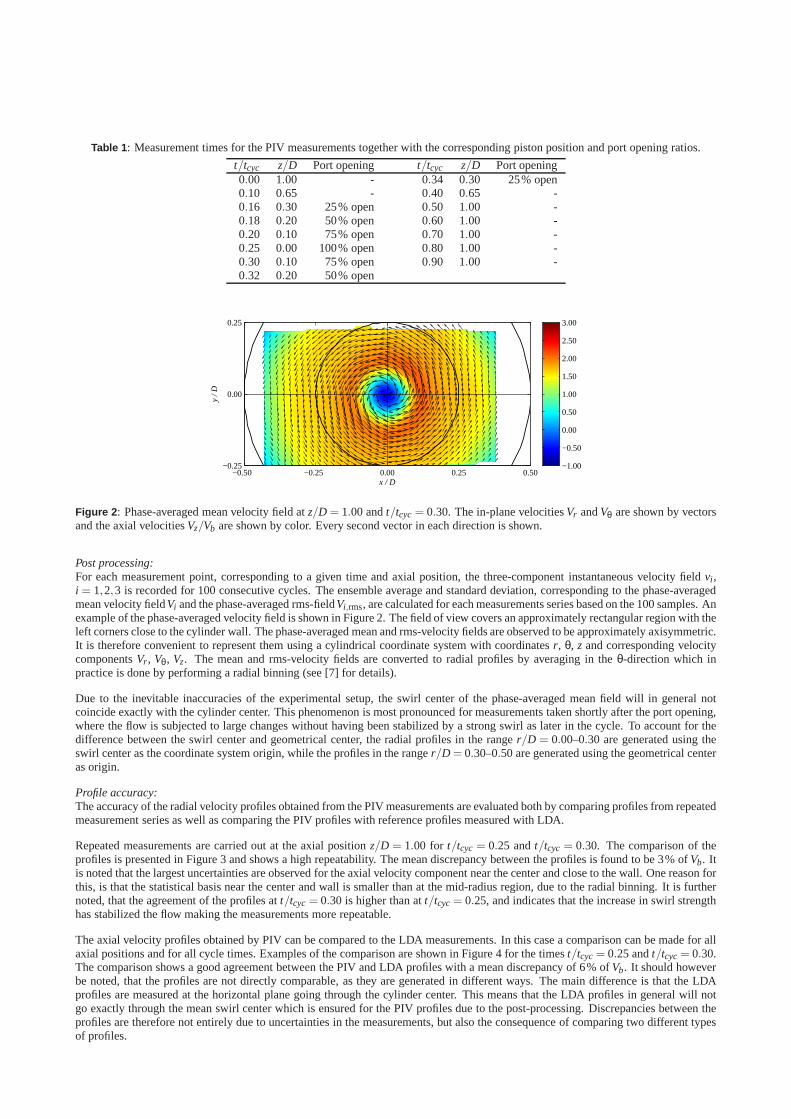
Table 1 : Measurement times for the PIV measurements together with the corresponding piston position and port opening ratios.
t/tcyc z/D Port opening t/tcyc z/D Port opening0.00 1.00 - 0.34 0.30 25% open0.10 0.65 - 0.40 0.65 -0.16 0.30 25% open 0.50 1.00 -0.18 0.20 50% open 0.60 1.00 -0.20 0.10 75% open 0.70 1.00 -0.25 0.00 100% open 0.80 1.00 -0.30 0.10 75% open 0.90 1.00 -0.32 0.20 50% open
x / D
y /
D
−0.50 −0.25 0.00 0.25 0.50−0.25
0.00
0.25
−1.00
−0.50
0.00
0.50
1.00
1.50
2.00
2.50
3.00
Figure 2 : Phase-averaged mean velocity field atz/D = 1.00 andt/tcyc= 0.30. The in-plane velocitiesVr andVθ are shown by vectorsand the axial velocitiesVz/Vb are shown by color. Every second vector in each direction is shown.
Post processing:For each measurement point, corresponding to a given time and axial position, the three-component instantaneous velocity field vi ,i = 1,2,3 is recorded for 100 consecutive cycles. The ensemble average and standard deviation, corresponding to the phase-averagedmean velocity fieldVi and the phase-averaged rms-fieldVi,rms, are calculated for each measurements series based on the 100 samples. Anexample of the phase-averaged velocity field is shown in Figure 2. The field of view covers an approximately rectangular region with theleft corners close to the cylinder wall. The phase-averagedmean and rms-velocity fields are observed to be approximately axisymmetric.It is therefore convenient to represent them using a cylindrical coordinate system with coordinatesr, θ, z and corresponding velocitycomponentsVr , Vθ, Vz. The mean and rms-velocity fields are converted to radial profiles by averaging in theθ-direction which inpractice is done by performing a radial binning (see [7] for details).
Due to the inevitable inaccuracies of the experimental setup, the swirl center of the phase-averaged mean field will in general notcoincide exactly with the cylinder center. This phenomenonis most pronounced for measurements taken shortly after theport opening,where the flow is subjected to large changes without having been stabilized by a strong swirl as later in the cycle. To account for thedifference between the swirl center and geometrical center, the radial profiles in the ranger/D = 0.00–0.30 are generated using theswirl center as the coordinate system origin, while the profiles in the ranger/D = 0.30–0.50 are generated using the geometrical centeras origin.
Profile accuracy:The accuracy of the radial velocity profiles obtained from the PIV measurements are evaluated both by comparing profiles from repeatedmeasurement series as well as comparing the PIV profiles withreference profiles measured with LDA.
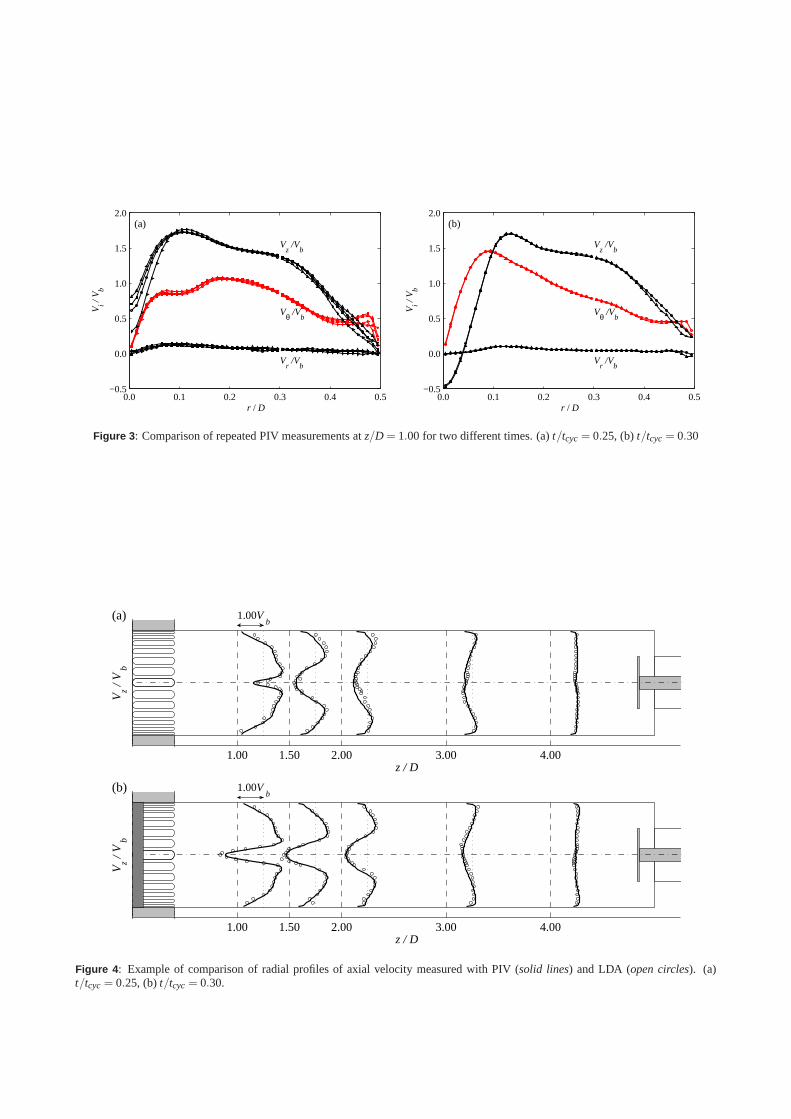
Repeated measurements are carried out at the axial positionz/D = 1.00 for t/tcyc = 0.25 andt/tcyc = 0.30. The comparison of theprofiles is presented in Figure 3 and shows a high repeatability. The mean discrepancy between the profiles is found to be 3%of Vb. Itis noted that the largest uncertainties are observed for theaxial velocity component near the center and close to the wall. One reason forthis, is that the statistical basis near the center and wall is smaller than at the mid-radius region, due to the radial binning. It is furthernoted, that the agreement of the profiles att/tcyc= 0.30 is higher than att/tcyc= 0.25, and indicates that the increase in swirl strengthhas stabilized the flow making the measurements more repeatable.
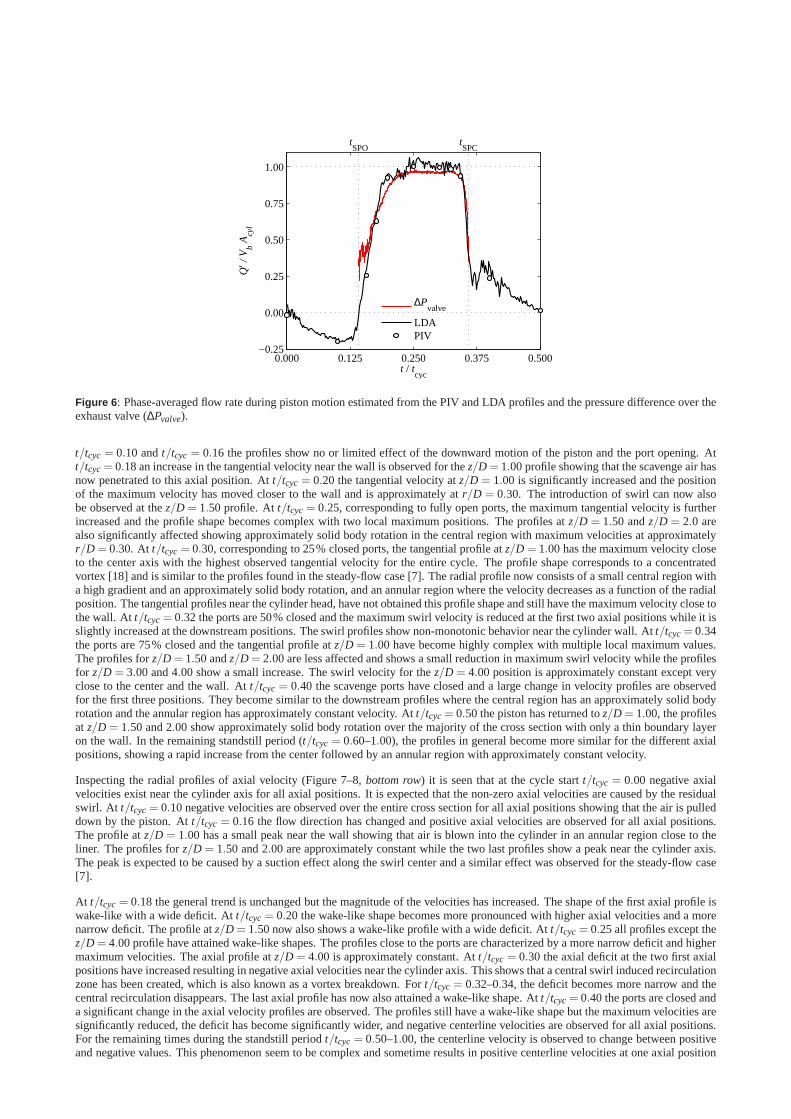
The axial velocity profiles obtained by PIV can be compared tothe LDA measurements. In this case a comparison can be made for allaxial positions and for all cycle times. Examples of the comparison are shown in Figure 4 for the timest/tcyc= 0.25 andt/tcyc= 0.30.The comparison shows a good agreement between the PIV and LDAprofiles with a mean discrepancy of 6% ofVb. It should howeverbe noted, that the profiles are not directly comparable, as they are generated in different ways. The main difference is that the LDAprofiles are measured at the horizontal plane going through the cylinder center. This means that the LDA profiles in general will notgo exactly through the mean swirl center which is ensured forthe PIV profiles due to the post-processing. Discrepancies between theprofiles are therefore not entirely due to uncertainties in the measurements, but also the consequence of comparing two different typesof profiles.
0.0 0.1 0.2 0.3 0.4 0.5−0.5
0.0
0.5
1.0
1.5
2.0
r / D
Vi /
Vb
(a)
Vθ /Vb
Vz /V
b
Vr /V
b
0.0 0.1 0.2 0.3 0.4 0.5−0.5
0.0
0.5
1.0
1.5
2.0
r / D V
i / V
b
(b)
Vθ /Vb
Vz /V
b
Vr /V
b
Figure 3 : Comparison of repeated PIV measurements atz/D = 1.00 for two different times. (a)t/tcyc= 0.25, (b)t/tcyc= 0.30
1.00 1.50 2.00 3.00 4.00z / D
1.00Vb
Vz /
Vb
(a)
1.00 1.50 2.00 3.00 4.00z / D
1.00Vb
Vz /
Vb
(b)
Figure 4 : Example of comparison of radial profiles of axial velocity measured with PIV (solid lines) and LDA (open circles). (a)t/tcyc= 0.25, (b)t/tcyc= 0.30.

0.00 0.25 0.50 0.75 1.00−100
−80
−60
−40
−20
0
t / tcyc
P/(
1 2ρV
2 b
)
tSPO
tSPC
P
1
P4
Figure 5 : Phase-averaged pressureP as a function of time measured at the cylinder headP1 and at the exhaust receiver outletP4.
3. Results
3.1 Pressure
The phase-averaged pressure at the cylinder headP1 and at the exhaust receiver outletP4 are presented in Figure 5. At scavengeport opening a rapid increase is observed at both locations.The pressure at the cylinder head continues to increase reaching anapproximately constant value att/tcyc = 0.23. During the scavenging fast oscillations are observed inthe cylinder pressure with afrequency off = c/(4L), wherec is the speed of sound andL is the cylinder length. This is the fundamental frequency for a cylinderwith one end open and one end closed [21]. This shows that the bottom end of the cylinder acts as an open end when the ports areuncovered while the top end acts as closed even though the exhaust valve is open. This behavior is consistent with oscillations observedin measurements and simulations of a full-scale fired engine[17].
After the initial increase following the port opening the pressure at the exhaust receiver outletP4 is reduced again, reaching an ap-proximately constant value ofP/
( 12ρV2
b
)
= 42 att/tcyc= 0.23. At scavenge port closing (SPC) both pressures show a rapid reductionresulting in a new series of large oscillations. The oscillations after port closure are significantly slower than the in-cylinder oscillationsobserved under scavenging and are expected to be the result of a Helmholtz resonator phenomenon where the cylinder and exhaustreceiver volumes acts as springs and the exhaust pipe volumeacts as a mass. The oscillations are quickly damped out and the pressurebecomes approximately constant att/tcyc= 0.60.
3.2 Flow rate
The phase-averaged flow rateQ′ through the cylinder during the period with piston motion (t/tcyc= 0.00–0.50) is shown in Figure 6.The flow rate is estimated by integrating the radial profiles of axial velocity obtained from the PIV and LDA measurements at z/D =1.50. The flow rate estimated from the pressure difference overthe exhaust valve is also included. It is expected that the flow rateestimated from the PIV profiles is the most accurate, howeverthe estimates based on the LDA and pressure measurements aretimeresolved and therefore give a more complete description of the flow development. In general good agreement is observed between thePIV and LDA estimates, while the estimates based on the pressure difference over the exhaust valve shows a lag after port opening anda lower maximum flow rate. The larger uncertainties on the estimates based on the pressure difference compared to the PIV and LDAestimates are expected, as the used pressure drop coefficient was obtained under steady-flow conditions.
From the cycle start to the scavenge port opening, the flow rate is negative due to the downward motion of the piston c.f. Figure 6.After port opening the flow direction changes and the flow rateincreases to an approximately constant value shortly before the pistonreachesz/D = 0.00. The flow rate remains approximately constant until the ports are almost completely covered, at which point itshows a rapid decrease. The relatively slow change in flow rate at port opening compared to port closing, is the result of fluid inertia.At the time of port opening the air is being pulled into the cylinder through the exhaust valve by the piston motion. The flowdirectiontherefore has to change before the scavenging can commence.This is different to the process in a fired engine, where the gas is beingblown out of the cylinder before port opening due to the high in-cylinder pressure created by the combustion.
3.3 Phase-averaged velocity profiles
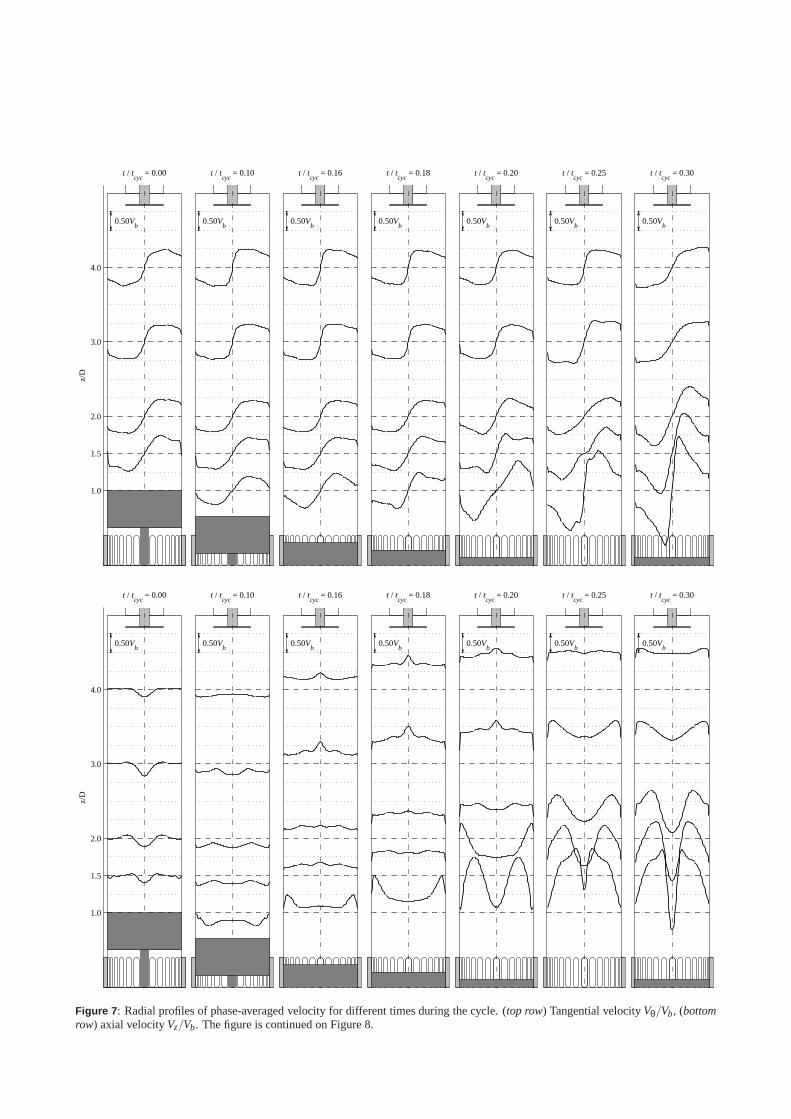
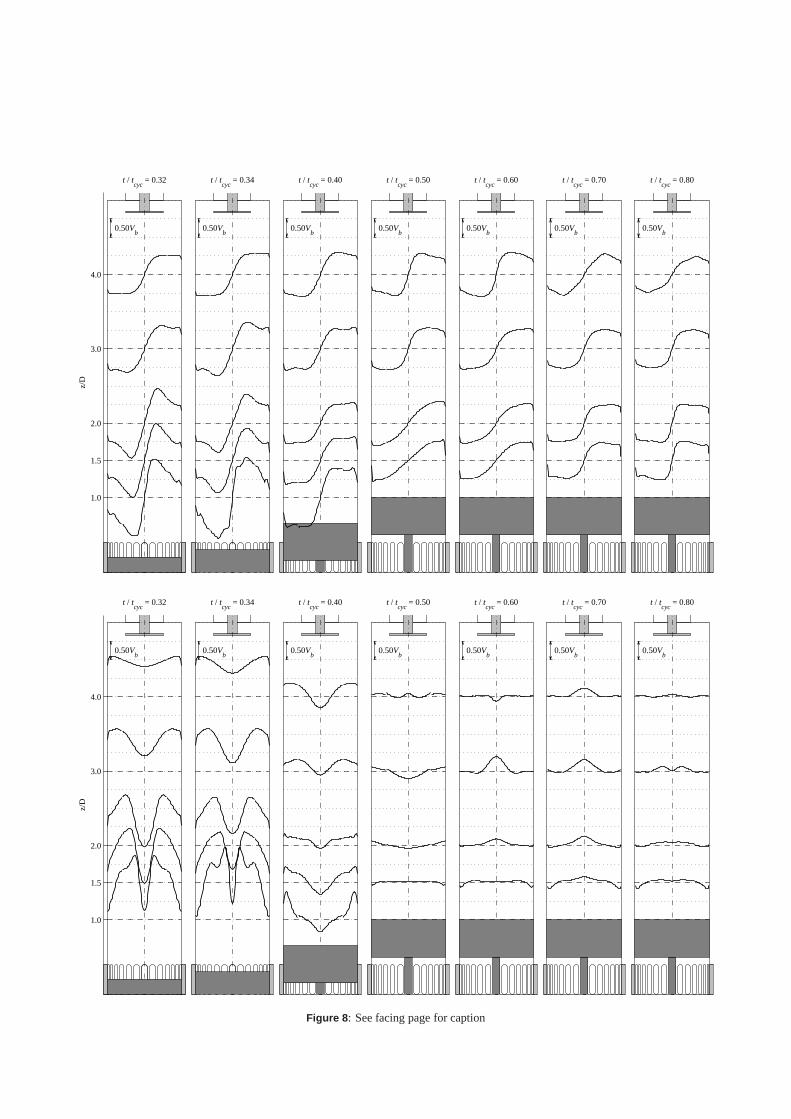
The radial profiles of phase-averaged tangentialVθ and axial velocityVz are presented in Figure 7 and 8 for different times during thecycle. To aid the interpretation of the results, the profilesare plotted in the model geometry, where also the piston position is shown.The axial profiles are mirrored in the cylinder axis and the tangential profiles are mirrored both in the cylinder axis and the datum lines.
Considering first the development of the tangential velocity (Figure 7–8,top row) the following is noted. At the cycle startt/tcyc= 0.00a pre-swirl or residual swirl exist and the swirl strength isapproximately the same for the different axial positions. The profiles consistof a central region where the velocity increases with radialposition, an annular region where the velocity is approximately constantor slightly decreasing as a function of radial position, anda thin wall boundary layer where the velocity shows a rapid decrease. For
0.000 0.125 0.250 0.375 0.500−0.25
0.00
0.25
0.50
0.75
1.00
t / tcyc
Q′ /
Vb A
cyl
tSPO
tSPC
∆Pvalve
LDAPIV
Figure 6 : Phase-averaged flow rate during piston motion estimated from the PIV and LDA profiles and the pressure difference over theexhaust valve (∆Pvalve).
t/tcyc = 0.10 andt/tcyc= 0.16 the profiles show no or limited effect of the downward motion of the piston and the port opening. Att/tcyc= 0.18 an increase in the tangential velocity near the wall is observed for thez/D = 1.00 profile showing that the scavenge air hasnow penetrated to this axial position. Att/tcyc= 0.20 the tangential velocity atz/D = 1.00 is significantly increased and the positionof the maximum velocity has moved closer to the wall and is approximately atr/D = 0.30. The introduction of swirl can now alsobe observed at thez/D = 1.50 profile. Att/tcyc= 0.25, corresponding to fully open ports, the maximum tangential velocity is furtherincreased and the profile shape becomes complex with two local maximum positions. The profiles atz/D = 1.50 andz/D = 2.0 arealso significantly affected showing approximately solid body rotation in the central region with maximum velocities atapproximatelyr/D = 0.30. At t/tcyc= 0.30, corresponding to 25% closed ports, the tangential profile atz/D = 1.00 has the maximum velocity closeto the center axis with the highest observed tangential velocity for the entire cycle. The profile shape corresponds to a concentratedvortex [18] and is similar to the profiles found in the steady-flow case [7]. The radial profile now consists of a small central region witha high gradient and an approximately solid body rotation, and an annular region where the velocity decreases as a function of the radialposition. The tangential profiles near the cylinder head, have not obtained this profile shape and still have the maximum velocity close tothe wall. Att/tcyc= 0.32 the ports are 50% closed and the maximum swirl velocity is reduced at the first two axial positions while it isslightly increased at the downstream positions. The swirl profiles show non-monotonic behavior near the cylinder wall.At t/tcyc= 0.34the ports are 75% closed and the tangential profile atz/D = 1.00 have become highly complex with multiple local maximum values.The profiles forz/D = 1.50 andz/D = 2.00 are less affected and shows a small reduction in maximum swirl velocity while the profilesfor z/D = 3.00 and 4.00 show a small increase. The swirl velocity for thez/D = 4.00 position is approximately constant except veryclose to the center and the wall. Att/tcyc= 0.40 the scavenge ports have closed and a large change in velocity profiles are observedfor the first three positions. They become similar to the downstream profiles where the central region has an approximately solid bodyrotation and the annular region has approximately constantvelocity. At t/tcyc= 0.50 the piston has returned toz/D = 1.00, the profilesat z/D = 1.50 and 2.00 show approximately solid body rotation over the majorityof the cross section with only a thin boundary layeron the wall. In the remaining standstill period (t/tcyc= 0.60–1.00), the profiles in general become more similar for the different axialpositions, showing a rapid increase from the center followed by an annular region with approximately constant velocity.
Inspecting the radial profiles of axial velocity (Figure 7–8, bottom row) it is seen that at the cycle startt/tcyc = 0.00 negative axialvelocities exist near the cylinder axis for all axial positions. It is expected that the non-zero axial velocities are caused by the residualswirl. At t/tcyc= 0.10 negative velocities are observed over the entire cross section for all axial positions showing that the air is pulleddown by the piston. Att/tcyc = 0.16 the flow direction has changed and positive axial velocities are observed for all axial positions.The profile atz/D = 1.00 has a small peak near the wall showing that air is blown intothe cylinder in an annular region close to theliner. The profiles forz/D = 1.50 and 2.00 are approximately constant while the two last profiles show a peak near the cylinder axis.The peak is expected to be caused by a suction effect along theswirl center and a similar effect was observed for the steady-flow case[7].
At t/tcyc= 0.18 the general trend is unchanged but the magnitude of the velocities has increased. The shape of the first axial profile iswake-like with a wide deficit. Att/tcyc= 0.20 the wake-like shape becomes more pronounced with higher axial velocities and a morenarrow deficit. The profile atz/D = 1.50 now also shows a wake-like profile with a wide deficit. Att/tcyc= 0.25 all profiles except thez/D = 4.00 profile have attained wake-like shapes. The profiles closeto the ports are characterized by a more narrow deficit and highermaximum velocities. The axial profile atz/D = 4.00 is approximately constant. Att/tcyc= 0.30 the axial deficit at the two first axialpositions have increased resulting in negative axial velocities near the cylinder axis. This shows that a central swirlinduced recirculationzone has been created, which is also known as a vortex breakdown. Fort/tcyc= 0.32–0.34, the deficit becomes more narrow and thecentral recirculation disappears. The last axial profile has now also attained a wake-like shape. Att/tcyc= 0.40 the ports are closed anda significant change in the axial velocity profiles are observed. The profiles still have a wake-like shape but the maximum velocities aresignificantly reduced, the deficit has become significantly wider, and negative centerline velocities are observed for all axial positions.For the remaining times during the standstill periodt/tcyc= 0.50–1.00, the centerline velocity is observed to change between positiveand negative values. This phenomenon seem to be complex and sometime results in positive centerline velocities at one axial position
1.0
1.5
2.0
3.0
4.0
0.50Vb
z/D
t / tcyc
= 0.00
0.50Vb
t / tcyc
= 0.10
0.50Vb
t / tcyc
= 0.16
0.50Vb
t / tcyc
= 0.18
0.50Vb
t / tcyc
= 0.20
0.50Vb
t / tcyc
= 0.25
0.50Vb
t / tcyc
= 0.30
1.0
1.5
2.0
3.0
4.0
0.50Vb
z/D
t / tcyc
= 0.00
0.50Vb
t / tcyc
= 0.10
0.50Vb
t / tcyc
= 0.16
0.50Vb
t / tcyc
= 0.18
0.50Vb
t / tcyc
= 0.20
0.50Vb
t / tcyc
= 0.25
0.50Vb
t / tcyc
= 0.30
Figure 7 : Radial profiles of phase-averaged velocity for different times during the cycle. (top row) Tangential velocityVθ/Vb, (bottomrow) axial velocityVz/Vb. The figure is continued on Figure 8.
1.0
1.5
2.0
3.0
4.0
0.50Vb
z/D
t / tcyc
= 0.32
0.50Vb
t / tcyc
= 0.34
0.50Vb
t / tcyc
= 0.40
0.50Vb
t / tcyc
= 0.50
0.50Vb
t / tcyc
= 0.60
0.50Vb
t / tcyc
= 0.70
0.50Vb
t / tcyc
= 0.80
1.0
1.5
2.0
3.0
4.0
0.50Vb
z/D
t / tcyc
= 0.32
0.50Vb
t / tcyc
= 0.34
0.50Vb
t / tcyc
= 0.40
0.50Vb
t / tcyc
= 0.50
0.50Vb
t / tcyc
= 0.60
0.50Vb
t / tcyc
= 0.70
0.50Vb
t / tcyc
= 0.80
Figure 8 : See facing page for caption
0.0 0.1 0.2 0.3 0.4 0.5−0.5
0.0
0.5
1.0
1.5
r / D
Vθ/V
b, V
z/Vb
(a)
Vθ/Vb
Vz/V
b
SteadyDynamic
0.0 0.1 0.2 0.3 0.4 0.5−0.5
0.0
0.5
1.0
1.5
r / D
Vθ/V
b, V
z/Vb
(b)
Vθ/Vb
Vz/V
b
SteadyDynamic
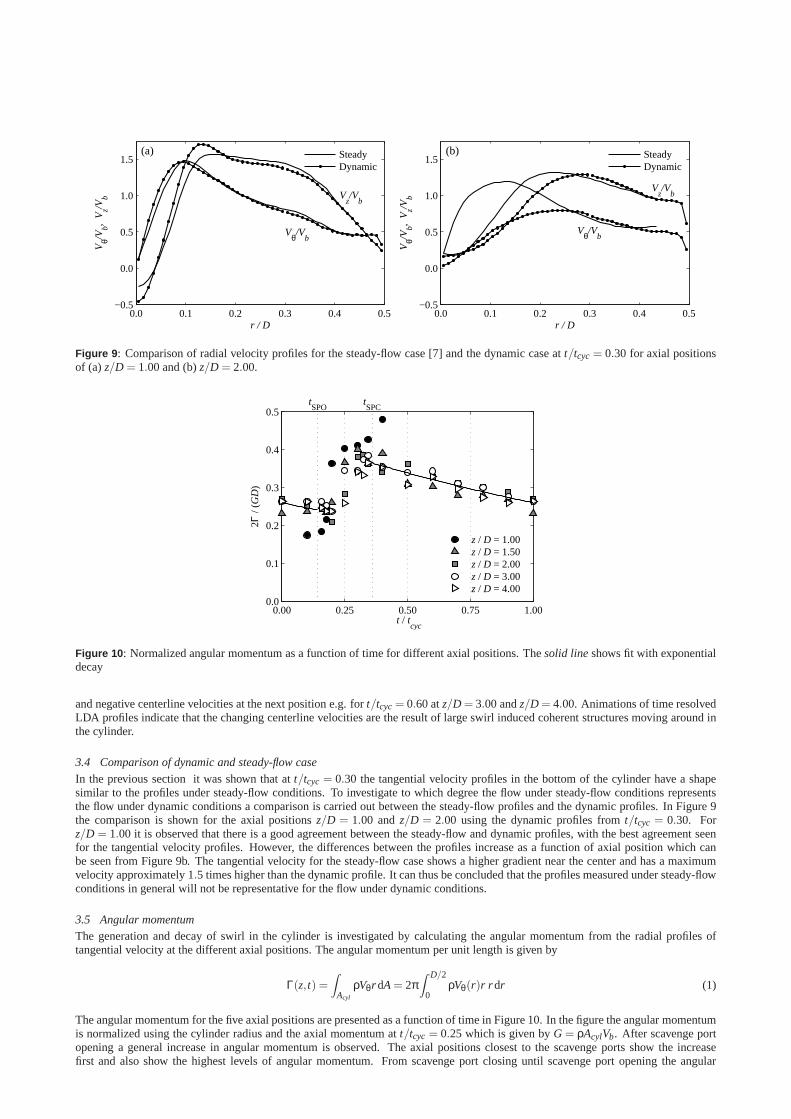
Figure 9 : Comparison of radial velocity profiles for the steady-flow case [7] and the dynamic case att/tcyc= 0.30 for axial positionsof (a) z/D = 1.00 and (b)z/D = 2.00.
0.00 0.25 0.50 0.75 1.000.0
0.1
0.2
0.3
0.4
0.5
t / tcyc
2Γ /
(GD
)
tSPO
tSPC
z / D = 1.00z / D = 1.50z / D = 2.00z / D = 3.00z / D = 4.00
Figure 10 : Normalized angular momentum as a function of time for different axial positions. Thesolid lineshows fit with exponentialdecay
and negative centerline velocities at the next position e.g. for t/tcyc= 0.60 atz/D = 3.00 andz/D = 4.00. Animations of time resolvedLDA profiles indicate that the changing centerline velocities are the result of large swirl induced coherent structuresmoving around inthe cylinder.
3.4 Comparison of dynamic and steady-flow case
In the previous section it was shown that att/tcyc = 0.30 the tangential velocity profiles in the bottom of the cylinder have a shapesimilar to the profiles under steady-flow conditions. To investigate to which degree the flow under steady-flow conditionsrepresentsthe flow under dynamic conditions a comparison is carried outbetween the steady-flow profiles and the dynamic profiles. In Figure 9the comparison is shown for the axial positionsz/D = 1.00 andz/D = 2.00 using the dynamic profiles fromt/tcyc = 0.30. Forz/D = 1.00 it is observed that there is a good agreement between the steady-flow and dynamic profiles, with the best agreement seenfor the tangential velocity profiles. However, the differences between the profiles increase as a function of axial position which canbe seen from Figure 9b. The tangential velocity for the steady-flow case shows a higher gradient near the center and has a maximumvelocity approximately 1.5 times higher than the dynamic profile. It can thus be concluded that the profiles measured under steady-flowconditions in general will not be representative for the flowunder dynamic conditions.
3.5 Angular momentum
The generation and decay of swirl in the cylinder is investigated by calculating the angular momentum from the radial profiles oftangential velocity at the different axial positions. The angular momentum per unit length is given by
Γ(z, t) =∫
Acyl
ρVθr dA= 2π∫ D/2
0ρVθ(r)r r dr (1)
The angular momentum for the five axial positions are presented as a function of time in Figure 10. In the figure the angular momentumis normalized using the cylinder radius and the axial momentum att/tcyc= 0.25 which is given byG= ρAcylVb. After scavenge portopening a general increase in angular momentum is observed.The axial positions closest to the scavenge ports show the increasefirst and also show the highest levels of angular momentum. From scavenge port closing until scavenge port opening the angular
momentum shows a monotonic decreasing trend and a reductionin the the axial variation. Turbulent swirling flows in pipesareknown to show an exponential decay [10, 11]. The decay rate ofthe swirl is estimated by fitting an exponential function of the formΓ(t) = Γ0exp(−λt/tcyc), whereλ is the decay rate, to the angular momentum from port closing to port opening. The decay rate is foundto beλ = 0.53 corresponding to a reduction of 34% from scavenge port closing to scavenge port opening. For engines it is reportedthat typically 25–33% of the initial swirl is lost at TDC [5] which agrees well with the model result.
4. Conclusions
The turbulent swirling flow in a dynamic scale model of a largetwo-stroke low-speed uniflow-scavenged marine Diesel engine isinvestigated experimentally. The flow is characterized using phase-locked stereoscopic particle image velocimetry (PIV) and laserDoppler anemometry (LDA). Radial velocity profiles are generated from the PIV data and the accuracy of the profiles are evaluatedthrough repeated measurements and comparison with LDA. Themain conclusions of the work are as listed below
• A database of experimental results suitable for CFD validation purposes is established. The experimental velocity profiles areshown to have an uncertainty corresponding to approximately 3% of the bulk velocity at fully open ports.
• The temporal development of the in-cylinder flow is shown to be highly complex. In the period where the ports are closed, thetangential velocity profiles are characterized by a centralregion with approximately solid body rotation and an annular regionwith approximately constant velocity. In the same period, the axial velocity profiles show non-zero velocities indicating thatlarge unsteady swirl induced flow structures exist.
• Comparison of profiles obtained under steady-flow and dynamic conditions, shows that results obtained under steady-flowconditions in general will not be representative for the flowin the dynamic model.
• The swirl strength is investigated by computing the angularmomentum from the tangential velocity profiles. The swirl strengthshows an exponential decay from scavenge port closing to scavenge port opening corresponding to a reduction of 34%.
REFERENCES
[1] Gordon P. Blair.Design and Simulation of Two-Stroke Engines. SAE International, 400 Commonwealth Drive, Warrendale, 1996.
[2] R. Diwakar. Three-dimensional modeling of the in-cylinder gas exchange processes in a uniflow-scavenged two-stroke engine.SAE Tech. Paper Ser., page 870596, 1987.
[3] S. Scott Goldsborough and Peter Van Blarigan. Optimizing the scavenging system for a two-stroke cycle, free piston engine forhigh efficiency and low emissions: A computational approach. SAE Tech. Paper Ser., 1:1–22, 2003.
[4] S. Haider, T. Schnipper, A. Obeidat, K. E. Meyer, V. L. Okulov, S. Mayer, and J. H. Walther. PIV study of the effect of pistonposition on the in-cylinder swirling flow during the scavenging process in large two-stroke marine Diesel engines.J. Mar. Sci.Tech., 18:133–143, 2013.
[5] J. B. Heywood.Internal combustion engine fundamentals. McGraw Hill, Inc., 1988.
[6] J. Hult and S. Mayer. A methodology for laser diagnosticsin large-bore marine two-stroke diesel engines.Meas. Sci. Technol.,24(4):1–10, 2013.
[7] K. M. Ingvorsen, K. E. Meyer, J. H. Walther, and S. Mayer. Turbulent swirling flow in a model of a uniflow scavenged two-strokeengine.Exp. Fluids, 54:1494, 2013.
[8] Kristian M. Ingvorsen, Knud Erik Meyer, Teis Schnipper,Jens H. Walther, and Stefan Mayer. Swirling flow in model of largetwo-stroke diesel engine. In16th Int. Symp. on Applications of Laser Techniques to FluidMechanics, Lisbon, Portugal, July 2012.
[9] S. Jakirlic, K. Hanjalic, and C. Tropea. Modeling rotating and swirling turbulent flows: A perpetual challenge.AIAA J.,40(10):1984–1996, 2002.
[10] Osami Kitoh. Experimental study of turbulent swirlingflow in a straight pipe.J. Fluid Mech., 225:445–479, 1991.
[11] Frank Kreith and O. K. Sonju. The decay of a turbulent swirl in a pipe.J. Fluid Mech., 22(2):257–271, 1965.
[12] Hiroshi Nakagawa, Satoshi Kato, Mataji Tateishi, Takeshi Adachi, Harutaka Tsujimura, and Masayoshi Nakashima. Airflow inthe cylinder of a 2-stoke cycle uniform scavenging diesel engine during compression stroke.Jpn. Soc. Mech. Eng., 33(3):591–598,1990.
[13] A. Obeidat, S. Haider, K. E. Meyer, and J. H. Walther. Large eddy simulations of the influence on piston position on theswirlingflow in a model Diesel engine.Int. J. Num. Meth. for Heat & Fluid Flow, 2013. accepted.
[14] W. H. Percival. Method of scavenging analysis for 2-stroke-cycle diesel cylinders.SAE Trans., 63:737–751, 1955.
[15] P. H. Schweitzer.Scavenging of two-stroke cycle Diesel engines. Macmillan Publishing Company, 1949.

[16] E. Sher, I. Hossain, Q. Zhang, and D. E. Winterbone. Calculation and measurements in the cylinder of a two-stroke uniflow-scavenged engine under steady flow conditions.Exp. Therm. Fluid Sci., 4:418–431, 1991.
[17] E. Sigurdsson, K. M. Ingvorsen, M. V. Jensen, S. Mayer, S. Matlok, and J. H. Walther. Numerical analysis of scavenge flow andconvective heat transfer in large two-stroke marine dieselengines.Appl. Energy, 2013. in preparation.
[18] W. Steenbergen and J. Voskamp. The rate of decay of swirlin turbulent pipe flow.Flow Mea. Instru., 9(2):67–78, 1998.
[19] Nak Won Sung and Donald J. Patterson. Air motion in a two stroke engine cylinder — the effects of exhaust geometry.SAETrans., pages 2534–2544, 1982. Paper No. 820751.
[20] T. Uzkan. The effects of engine speed on the scavenging characteristics of a two-cycle engine.J. Engng. Gas Turbines and Power,110:523–530, 1988.
[21] Hugh D. Young and Roger A. Freedman.Sears and Zemansky’s university physics: with modern physics. Addison-WesleyPublishing Company, Sansome St., San Fransico, 11 edition,2004.