pg 23. Unseasonal Weather! pg 26. INTERVIEW: Sisir Pillai...
36
A PhillipCapital India Publication 1 sr – 31 st May 2014 . Vol 1 Issue 3 . For Private Circulation Only pg 23. Unseasonal Weather! pg 26. INTERVIEW: Sisir Pillai pg 29. Indian Economy – Trend indicators
Transcript of pg 23. Unseasonal Weather! pg 26. INTERVIEW: Sisir Pillai...

A PhillipCapital India Publication
1sr – 31st May 2014 . Vol 1 Issue 3 . For Private Circulation Only
pg 23. Unseasonal Weather!
pg 26. INTERVIEW: Sisir Pillai
pg 29. Indian Economy – Trend indicators

3GROUND ZERO GROUND ZERO 1 - 31 May 2014 1- 31 May 2014 2
GROUND ZERO - PREVIOUS ISSUES
Vineet Bhatnagar- Managing Director and CEO
EDITORIAL BOARD:Naveen Kulkarni Manish AgarwallaKinshuk Bharti Tiwari Dhawal Doshi
COVER & MAGAZINE DESIGN Chaitanya Modak, www.inhousedesign.co.in
FOR EDITORIAL QUERIES:PhillipCapital (India) Private LimitedNo. 1, 2nd Floor, Modern Centr e, 101 K.K. Marg, Jacob Circle, Mahalaxmi, Mumbai 400 011
RESEARCH Automobiles Deepak Jain, Priya Ranjan
Banking, NBFCs Manish Agarwalla, Sachit Motwani, Paresh Jain
Consumer, Media, Telecom Naveen Kulkarni, Vivekanand Subbaraman, Manish Pushkar
Cement Vaibhav Agarwal
Economics Anjali Verma
Engineering, Capital Goods Ankur Sharma, Aditya Bahety
Infrastructure & IT Services Vibhor Singhal, Varun Vijayan
Metals Dhawal Doshi, Dharmesh Shah
Oil & Gas, Agri Inputs Gauri Anand, Deepak Pareek
Pharmaceuticals Surya Patra
Retail, Real Estate Abhishek Ranganathan, Neha Garg
Technicals Subodh Gupta
Production Manager Ganesh Deorukhkar
Database Manager Vishal Randive
Sr. Manager – Equities Support Rosie Ferns
SALES & DISTRIBUTION Kinshuk Tiwari, Ashvin Patil, Shubhangi Agrawal Kishor Binwal, Sidharth Agrawal, Dipesh Sohani, Varun Kumar
VOL 1 . ISSUE 3 . 1ST - 31ST MAY 2014

3GROUND ZERO GROUND ZERO 1 - 31 May 2014 1- 31 May 2014 2
4. COVER STORY: Jewelry Retailing - When South Meets North
Ground Zero explores the opportunity and chal-lenges for south based jewelers as they enter the North India Market
23. How seasoned farmers faced the Unseasonal Weather!
26. INTERVIEW: Sisir Pillai
Sisir Pillai, a cable television industry veteran, shares his views on the implementation of cable TV digitisation in India
29. Indian Economy – Trend indicators
31. PhillipCapital Coverage Universe: Valuation Summary
LETTER FROM THE MANAGING DIRECTORGold had been a standard for monetary policy be-
fore it was supplanted by fiat currency in the 1930s.
The last gold certificate and gold coin currencies
were issued in the US in 1932. A total of 174,100
tonnes of gold have been mined in the human
history, according to Gold Field Mineral Services.
Globally 50% of gold is consumed for jewellery,
40% in investments and 10% in industry.
India is said to have over 21,000 tonnes of gold and
is the world’s largest gold consumer and the south
Indian markets account for the bulk of the con-
sumption. On Akshaya Tritiya, when gold is among
the most searched word on the internet in India
and one of the biggest occasions to purchase gold,
we publish our cover story on jewelry retailing. The
story “When South meets North” penned by retail
analysts Abhishek Ranganathan and Neha Garg is
an interesting tale of some of the biggest southern
jewelers making forays in the northern market. The
story brings out the fascinating trends and nuances
of gold consumption in the two markets that holds
the key to the success and a lasting change in the
competitive landscape of the country. It is purely
coincidental that the analysts are from south and
north India respectively!
In this issue, we have also assessed the impact of
the recent hail storms on farm output with first-
hand interaction with farmers in Maharashtra,
Karnataka, MP and UP. Lastly, a free-wheeling
interaction with the Guru of the Cable distribution
industry, provides a peek into the recent develop-
ments and challenges in the space.
15 more days to go for the election results!! Let’s
hope for the best!!
Best Wishes
Vineet
CONTENTS

5GROUND ZERO GROUND ZERO 1 - 31 May 2014 1- 31 May 2014 4
Lalitha Jewellery store in Chennai - Daily Sale (average) of 6kg gold jewelry

5GROUND ZERO GROUND ZERO 1 - 31 May 2014 1- 31 May 2014 4
COVER STORY
While south India remains the largest consumer of gold within India, some of the biggest
southern players have entered the north. Malabar Gold, Kalyan Jewellers and Joyalukkas
(incidentally all from Kerala) have been aggressively expanding outside south India. All
three put together have an estimated turnover of Rs 300bn. As they venture into north
India, Ground Zero explores the differences between the operating environment in the two
regions and the strengths and weaknesses of these players and tries to answer the question
— will southern players succeed in the North?
We explore some of the largest gold consuming cities of south India to look at current
demand trends and buying behavior. We also try to understand the operating environment
and business models of south jewelers as they go north. We found uncanny similarities
and stark differences. Ground Zero research came across very interesting nuances peculiar
to individual states where breaking the barrier doesn’t seem all that easy. Trust, cultural
beliefs, designs, and loyalty would test the business models, while the willingness to adapt
and establish robust supply-chain management would determine sustainability. This story
is about a confluence of cultures — a challenge to move towards de-centralized control of
business. Mirroring Bollywood, our south meets north story evokes excitement, but has its
twists, turns, and pitfalls.
BY ABHISHEK RANGANATHAN & NEHA GARG
pg. 6 South Indian jewelry market The dynamics of the south jewelry market – mature and competitive___________________________________________pg.14 North Indian jewelry market The 2D market - Design and Diamonds___________________________________________pg.16 The Battleground Entering North India___________________________________________pg.21 The Warriors Major players in the Indian Jewelry market___________________________________________

7GROUND ZERO GROUND ZERO 1 - 31 May 2014 1- 31 May 2014 6
As per the WGC, 40% of India’s gold
consumption is in South India. It is
home to the largest gold consuming
state (Tamil Nadu) and the highest
per-capita gold-consuming state (Kerala).
The dynamics of the south jewelry market – mature and competitive
S O U T H I N D I A N J E W E L R Y M A R K E T
Sour
ce: P
hilli
pCap
ital I
ndia
Res
earc
h
“70% of the gold consumed in the country is actually bought on ‘occasions’ (weddings, engagements, festivals, etc.)”
– Amresh Acharaya, Director Investments, World Gold Council (WGC).
Kerala —Average sale of 100kg Gold per dayTamil Nadu — Average sale 200kg Gold per day; Chennai alone contributes to half of this
Decoding the buyers mindset

7GROUND ZERO GROUND ZERO 1 - 31 May 2014 1- 31 May 2014 6
Moreover, south India seems to purchase gold with
implicit investment motive. Motive is clearer and
more evident in the South as gold coins and bars
account for more than a third of gold purchases in
many places. Interactions with members of the Ma-
dras Jewelry Association (MJA) indicate that around
30-40% of the purchased gold is in the form of coins
and bars. As per WGC, 36% of gold is bought in the
form of bars and coins. This number was 16% 10
years ago.
Gold continues to be perceived as an investment
— at the very least it straddles both savings and
investment. Mr. Acharya explains, “People don’t
consider gold to be an expense. More than 50%
gold is bought in rural areas where they have limited
avenues to invest their savings. Only 40% of people
have access to banking services. In India, 5% of sav-
ings is in physical gold and the percentage has been
maintained over the years. 55% of savings are physi-
cal in nature and the rest are financial.” The percep-
tion of gold in tier-3, 4, and 5 towns continues to be
skewed towards investments compared to cities. So
urce
: Wor
ld G
old
Coun
cil, P
hilli
pCap
ital I
ndia
Res
earc
h
“Gold is amongst the top two searched words on the internet. The top-most searched word is stock market. During Akshay Tritiya, gold is the most searched word,”
— Amresh Acharya, WGC.
“In cities there are more avenues and distractions such as cars, luxury goods to spend money on, whereas these avenues are limited in smaller towns and cities. Hence propensity to consume gold there is higher.”
— Mr. Rajesh Vummidi, member of the Madras Jewelry Association (MJA) corroborates
Gold consumption in India has been largely inelastic despite price rise
The total corpus of Exchange Traded Funds (ETFs) is Rs 90bn of which around 50% are by corporates and family offices.
ETF vs. physical gold for India
Sour
ce: A
mfi
Indi
a, W
orld
Gol
d Co
uncil
, Phi
llipC
apita
l Ind
ia R
esea
rch
In the south, investment is a major motive

9GROUND ZERO GROUND ZERO 1 - 31 May 2014 1- 31 May 2014 8
The real wedding planners
Sour
ce: W
orld
Gol
d Co
uncil
, Phi
llipC
apita
l Ind
ia R
esea
rch
So what drives the sales of coins and bars? “We can’t classify
gold as investment as it’s seldom sold,” says Mr. Acharya of
WGC. Most coins and bars are bought as a planned purchase
for weddings in the family rather than as a pure financial in-
vestment. Trying to explain the buyer’s mindset Mr. Vummidi
of the MJA says, “As wedding jewelry designs change with
time and can’t be planned 25 years in advance, families in TN
buy gold in the form of coins and bars at regular intervals.
This helps the family mitigate gold price inflation over this
duration and is the most cost effective way of procuring gold
as it entails very little making charges.”
“We can’t classify gold as investment as it’s seldom sold,”
— says Mr. Acharya of WGC.
Investment demand (measured in Coins/bars) for gold has increased over last 10 years
Therefore, recycling gold is a popular trend. Tamil Nadu has
the highest share of recycled gold jewelry. Interactions and
surveys across largest players firmly indicated that over 40%
of the jewelry sales are from recycled gold. While this number
does look high, it should be read keeping in mind the high
share of coins/bars, which eventually get recycled mostly for
weddings.
“Over 50% of the country’s gold is bought for marriages or associated with marriages. It’s seen as a way of giving wealth to the daughter or daughter-in-law”— Amresh Acharya, WGC.
However, the timing and planning of gold purchase
varies from state to state. In Kerala, the wedding
jewelry is purchased closer to the wedding date and
does not entail as much planning, says an associate
of one the largest south-based jewelers. He further
adds, “In Kerala, wedding purchases happen just be-
fore the wedding, hence it can be tracked, whereas
in TN it’s a planned purchase.” Basically, purchases
of gold are planned from the day a child is born into
the family — a leading south jeweler said that the
initial purchase of gold (in TN) will be in the form of
coins and bars, not jewelry.
In this robust and intriguing market what drives the
choice of the jeweler?
Proportion of recycled gold increased due to import restrictions on gold in FY14
Sour
ce: W
orld
Gol
d Co
uncil
, Phi
llipC
apita
l Ind
ia R
esea
rch
Composition of gold sale in Chennai
Sour
ce: M
JA, P
hilli
pCap
ital I
ndia
Res
earc
h

9GROUND ZERO GROUND ZERO 1 - 31 May 2014 1- 31 May 2014 8
Quality conscious and extremely choosy customer
Buyers in south India, especially Kerala and TN, are extremely
quality conscious and are well aware of purity and hallmark-
ing. All the jewelers surveyed, including some family jewel-
ers, in these states clearly said that purity was of paramount
importance.
Buyers are willing to pay a premium for purchases from
reputed regional and national chains. Regional players in the
south, especially in Kerala and Chennai, have kept pace with
the customer’s awareness and almost all the large players are
considered to offer quality (purity). However, awareness and
practice both would be lower in the smaller towns.
Preference for only gold, traditional and heavy designs;
diamonds a distant runner up
The south India jewelry market is skewed towards gold and
traditional designs; it is also extremely competitive. Conse-
quently, the consumer awareness of making charges is very
high. Unusually low making charges usually mean that there
have been compromises on quality of workmanship by reduc-
ing man-hours.
The average making charges in south India for gold jewelry is
around 10-15% and 15-25% for diamonds. However, the de-
signs are more traditional and heavy. As one regional jeweler
stated, “Customers want to bargain on making charges. Gen-
“Purity and quality is a first and foremost parameter for a consumer when it comes to the choice of jeweler,” - says Mr. Vummidi, MJA.
A visit to a Tanishq store and we were urged to test our existing gold jewelry on the famed Karat meter. On asking about their high making charges, we were told how purity was not uniform across non-Tanishq products, while a Tanishq product will always have uniform karatage and thus the customer always gets the promised purity.
One store manager, also an ex Tanishq Management Agent employee, now with a niche diamond brand stated that Tanishq gained market share in 2006-07 in Chennai after it repositioned itself on lines of purity and trust.
uine negotiation is for only about 2-3% of total price
but it’s more about the satisfaction of bargaining”.
Jewelers concur that on some differentiated prod-
ucts one can charge higher making charges. The av-
erage gold consumed during a wedding in Chennai
is 100gms. However, there are signs of change in the
South from heavy gold jewelry to lighter weights. As
Mr. Vummidi of MJA pointed out, “Now the focus
is on light-weight jewelry, even in weddings. Earlier
a wedding kasu mala (neckwear) used to weigh
60gm. Now the new designs in kasu mala weigh
only around 30gms and the balance 30gm is used
for light-weight jewelry, which can be used more
frequently/daily.”
Kasu Mala – A traditional South Indian Wedding Neckwear
“Customers want to bargain on making charges. Genuine negotiation is for only about 2-3% of total price but it’s more about the satisfaction of bargaining”.

11GROUND ZERO GROUND ZERO 1 - 31 May 2014 1- 31 May 2014 10
A visit to two of the best-performing stores in Chennai and we
find a promotion on making charges on wedding jewelry [pic-
ture]. When we asked about the high making charges (wastage
as it is called in the south) the sales executive gave us a point-by-
point answer with the help of a calendar-like brochure:
In the south, barring major cities such as Chennai and Hyder-
abad, diamonds are not very popular. “In the south, dia-
monds have to be colorless as colored ones are considered
inauspicious”, says Mr. Vummidi of MJA. He believes that
diamonds are slowly gaining popularity in the south; existing
gold buyers are willing to try diamonds. However, diamonds
are still only 15-20% of the market.
Another Kerala-based player added that diamond jewelry
would be approximately 7-10% of the market and studded
(with stones) jewelry is growing fast. His view is that Kerala is
a modern market and studded jewelry will gain share there
over a period of time.
In general, most regional/local jewelers indicated that the
large players such as Tanishq and Malabar have higher mak-
ing charges. We delved deeper and had an insightful
interaction with an ex-employee of Tanishq who is
now employed with a competitor.
The gentleman who obviously does not want to be
named stated that 60% of the designs in a Tanishq
store are unique — the main reason given to cus-
tomers about why their making charges seem high.
Other regional players have common vendors and
hence design is not necessarily unique. One of Tan-
ishq’s major competitors (south-based) also agreed
that Tanishq’s designs are unique and contemporary
and hence the clientele base is different. Tanishq
has its own state-of-the-art manufacturing unit and
karigar (craftsman) park and in-house design team.
Visit to a Tanishq store in Chennai
filtering. All diamonds in the jewelry are of the same
size, dimensions, and quality.
Process – The most interesting bit. The input used in
soldering a Tanishq product is indium whereas others
use the much cheaper cadmium. Cadmium poses
long-term health hazards to the karigars/gold smiths.
Interestingly, indium costs 300x more than cadmium.
Designs – Designs are from across the country and in-
house design teams send latest designs.
Finishing – As it controls the manufacturing process,
the finishing of the product is top-notch and even
across the product with no rough edges.
The brochure used to explain various distinct qualities of a Tanishq product
Purity – It’s even across a product (e.g., every portion of a ring
would have even karatage, thus taking care of comparison with
hallmarked gold).
Diamonds – Use the best quality diamonds after significant
The Karat Meter- Used to test the purity of customer’s old jewelry
11GROUND ZERO GROUND ZERO 1 - 31 May 2014 1- 31 May 2014 10
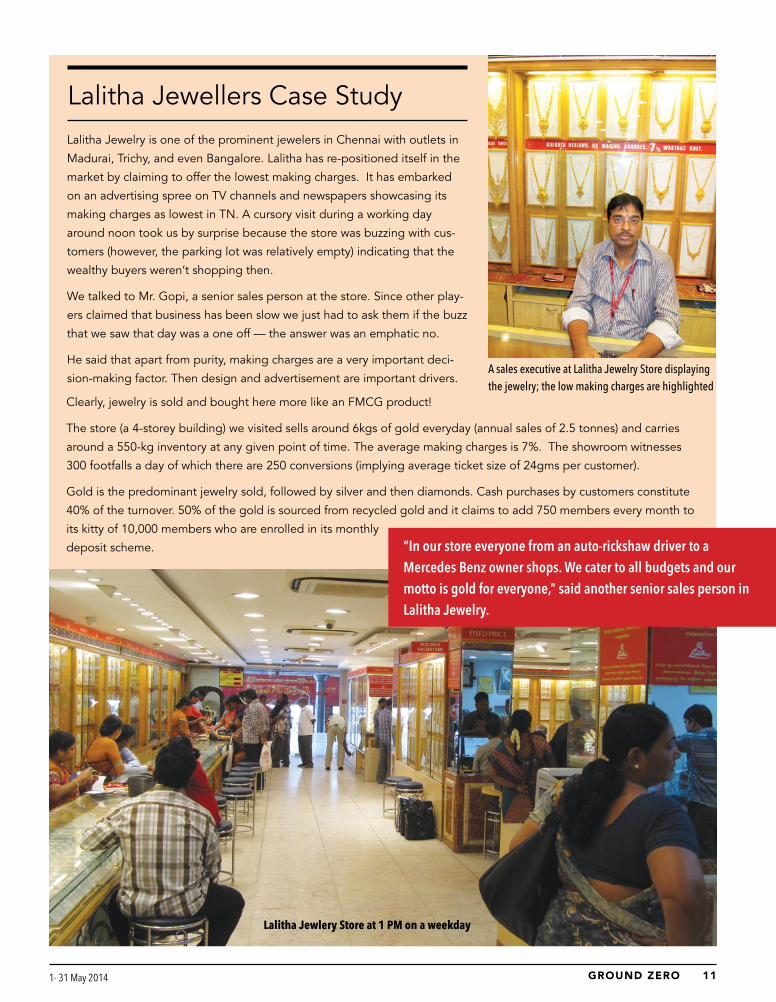
Lalitha Jewelry is one of the prominent jewelers in Chennai with outlets in
Madurai, Trichy, and even Bangalore. Lalitha has re-positioned itself in the
market by claiming to offer the lowest making charges. It has embarked
on an advertising spree on TV channels and newspapers showcasing its
making charges as lowest in TN. A cursory visit during a working day
around noon took us by surprise because the store was buzzing with cus-
tomers (however, the parking lot was relatively empty) indicating that the
wealthy buyers weren’t shopping then.
We talked to Mr. Gopi, a senior sales person at the store. Since other play-
ers claimed that business has been slow we just had to ask them if the buzz
that we saw that day was a one off — the answer was an emphatic no.
He said that apart from purity, making charges are a very important deci-
sion-making factor. Then design and advertisement are important drivers.
Lalitha Jewellers Case Study
“In our store everyone from an auto-rickshaw driver to a Mercedes Benz owner shops. We cater to all budgets and our motto is gold for everyone,” said another senior sales person in Lalitha Jewelry.
Lalitha Jewlery Store at 1 PM on a weekday
A sales executive at Lalitha Jewelry Store displaying the jewelry; the low making charges are highlighted
Clearly, jewelry is sold and bought here more like an FMCG product!
The store (a 4-storey building) we visited sells around 6kgs of gold everyday (annual sales of 2.5 tonnes) and carries
around a 550-kg inventory at any given point of time. The average making charges is 7%. The showroom witnesses
300 footfalls a day of which there are 250 conversions (implying average ticket size of 24gms per customer).
Gold is the predominant jewelry sold, followed by silver and then diamonds. Cash purchases by customers constitute
40% of the turnover. 50% of the gold is sourced from recycled gold and it claims to add 750 members every month to
its kitty of 10,000 members who are enrolled in its monthly
deposit scheme.

13GROUND ZERO GROUND ZERO 1 - 31 May 2014 1- 31 May 2014 12
Another intriguing aspect of the market is the tremendous
customer loyalty that regional jewelers there enjoy. As gold
and jewelry are planned purchases down south, jewelers have
adapted and grown through a variety of monthly gold deposit
schemes, where at the end of tenure, the buyer can purchase
jewelry/gold for some discount or freebies. It is estimated that
there are 11,000 gold savings schemes in the country.
GRT’s Gold Saving Schemes
GRT’s Gold Saving Schemes – uses a chit-fund model (notice the numerical code scribbled on the enrollment form) to pool deposits
Lalitha’s Gold Deposit Scheme and Making Charges

13GROUND ZERO GROUND ZERO 1 - 31 May 2014 1- 31 May 2014 12
Gold deposit scheme first originated in TN and GR
Thangamaligai (GRT) is one of the largest players
there. Customer loyalty in TN is largely through
the monthly gold deposit schemes. “Chennai is
perhaps the most matured market for gold jewelry.
The array of deposit schemes and competitiveness
in pricing and promotions is tremendous,” says
Baidik Sarkar, a finance professional and native of
Chennai. He further adds, “In a GRT jewelry store,
I can coax him into reducing the price further by
saying Anna (means brother) konjum (some) dis-
count…this way I have built a relationship with the
jeweler over the years.”
One family jeweler claimed that 20-25% of his
business comes from deposit schemes. The aver-
age size of deposit is Rs 5,000 per month. Some
schemes allow the buying of coins while schemes
that waive off the one-month deposit are only for buying jew-
elry. Interestingly, the quantum of up-trading by his customers
was in the range of 20-25% of the total deposit amount.
It is quite evident that market in the South is mature with cus-
tomers making systematic allocations towards gold purchases
(as an asset or for weddings), high level of awareness of purity
and making charges, and an array of deposit schemes and
strong loyalty to the regional jewelers.
GRT’s Diamond section GRT’s Gold section where all the action is...
“Chennai is perhaps the most matured market for gold jewelry. The array of deposit schemes and competitiveness in pricing and promotions is tremendous,” says Baidik Sarkar, a finance professional and native of Chennai.

15GROUND ZERO GROUND ZERO 1 - 31 May 2014 1- 31 May 2014 14
The 2D market - Design and Diamonds
N O R T H I N D I A N J E W E L R Y M A R K E T
The demand drivers in north and west India remain wedding and events
The investment is in style and design
More than investment, the north Indian jewel-
ry market is driven and motivated by end use,
design, and style. Diamond jewelry comprises a
larger share of the market — north is India’s largest
diamond jewelry market with a share of around
40%.
Mr. Sanjeev Bhatia, CFO, PC Jewellers succinctly
describes the market, “In the north, the average
buyer’s implicit motive seems to be driven by
fashion rather than investment.” He goes on to
add that, “Share of diamond jewelry is significantly
high in the North. The sale of gold coins and bars
is low. Gold coins and bars account for only 3-4%
of PC Jewellers’ turnover”. Another interesting
data, which validates this, is that recycled gold for
jewelers in north is much lower than that in the
south (40%). Jewelry out of recycled gold is on
an average at only 10% for PC Jewellers. This is
largely attributable to the preference for diamond
and designer jewelry, where making charges are
higher, and the accessory mindset of the con-
sumer, whereas lower sale of coins means lower
recycling.
Gold is purchased closer to weddings and ‘occa-
sions’ and in the form of jewelry and coins. Coins
and bars are used for gifting purposes during
marriages. The biggest festival for gold coins
purchases in the north is Dhanteras. However,
when prices fell in Q1FY14, people across India
including in the north bought gold six months
before Dhanteras, which is quite unlike typical
north Indian behavior. The average ticket size for
gold consumption here is around 17gms says one
leading jeweler.
Interestingly, diamond purchases also spike during
‘occasions’. One of the leading diamond players
explains, “Karva Chaut is very big for diamonds.
Women coax their husbands into buying diamond
rings and sets as a reward for fasting.”
The popularity of deposit and loyalty schemes
is naturally low as the purchase of jewelry is not
planned too much in advance. Most players use
the deposit schemes as a means to draw cus-
tomers into the store. It is positioned to help a
housewife make small ticket purchases.
Gold is less of an investment in the North Gold demand spiked in Q2CY13 when prices fell steeply
Sour
ce: C
PPR
(Cen
tre fo
r Com
para
tive
Stud
ies)
, Phi
llipC
apita
l Ind
ia R
esea
rch

15GROUND ZERO GROUND ZERO 1 - 31 May 2014 1- 31 May 2014 14
The wedding par-
ty starts late and
continues longer
Here, 70% of the
market is driven
by weddings and
‘occasions’ related
to weddings such as engagements, mehandi,
sangeet ceremonies and cocktail parties, says Mr.
Bhatia. People in the north buy wedding jewelry
closer to the wedding date, to match with their
wedding trousseau such as lehenga, etc.
Kundan and minakar are the two popular varieties
of north Indian jewelry. They have been inspired
from the designs and craftwork of Mughals and
reflect the Mughal dynasty. A leading diamond
player explains, “Uncut diamonds such as polkis
is very popular in the North. We wouldn’t be able
to sell these in South where ruby jewelry is more
popular.”
The average gold consumed during a North wed-
ding is around 100 gm and diamonds is around 3
carats.
In search of purity
In the north, purity still remains an unaddressed
issue. “80% of North Indian jewelry market is
unorganized. Unlike the south where there are
prominent players such as GRT or PC Chandra
in the East, north doesn’t have major organized
players like us,” says Mr. Sanjeev Bhatia, CFO, PC
Jewellers.
Though buyers are aware of trust and purity
issues, they continue to patronize the unorganized
market as the price points there are lower and it
suits their budget. As Mr. Acharya of WGC puts
it, customers know they are being ripped off.
However, leading players say that even the actual
awareness levels drops in tier-3, 4, and 5 towns.
Increased awareness of purity and trust will gradu-
ally shift demand to organized jewelers .
In the absence of large regional players, Titan’s
Tanishq has spearheaded the agenda of purity
and under-karatage. However, standardization/
certification of purity still remains an issue.
“Design is not for philosophy it’s for life.” Issey
Miyake
Demand is shifting from unorganized players to
organized ones as branded players also offer
higher variety and range. While explaining the
north-Indian buyer Mr. Bhatia says, “For the north
Indian customers, design and diamonds-size
matter more.” As the buyer places design and
studded jewelry as a priority over gold as an
investment, she is willing to pay the higher mak-
ing charges that these entail. Buyers are aware
of making charges, but they are more aware of
designs. Bhatia believes that customers enter a PC
Jewellers store for the variety and range it offers.
A north Indian customer is fickle minded says a
person associated with a niche pan-India jeweler
— “A customer doesn’t have loyalty to any par-
ticular store and will jump shops if there is a better
design elsewhere.”
The market is thus relatively complex with a larger
share of unorganized players, lower degree of fair
trade practice (for purity), and with customers who
are focused on design and fashion and are fickle
minded.
“80% of North Indian jewelry market is unorganized. Unlike the south where there are prominent players such as GRT or PC Chandra in the East, north doesn’t have major organized players like us,”
- says Mr. Sanjeev Bhatia, CFO, PC Jewellers.
As Mr. Acharya of WGC puts it, customers know they are being ripped off. However, leading players say that even the actual awareness levels drops in tier-3, 4, and 5 towns. Increased awareness of purity and trust will gradually shift demand to organized jewelers .
Classic combination of Kundan and Minakari

17GROUND ZERO GROUND ZERO 1 - 31 May 2014 1- 31 May 2014 16
Entering North India
T H E B A T T L E G R O U N D
Making a mark and sustaining can be very challenging
One of the leading south-based players told us
that, “It takes around three years to establish trust
and reputation outside the home market. And it’s
not an easy business as it is all about satisfying the
consumer and it entails product range, service,
and flexibility. The customer needs lot of pamper-
ing.” Since south India as a market is already sat-
urated, the south-based players (Malabar, Kalyan,
and Joyalukkas) are looking at making their mark
on the north Indian jewelry market, which is still
largely unorganized.
under-karatage is deeply prevalent there.”
Inventory and supply chain – the challenge
behind all that glitter
South-based players come with the experience on
operating a network of stores. A large network of
stores and presence across India helps in strength-
ening a jewelry brand. However, with scale come
the perils of managing high-value inventory across
different locations. The fact that none of these
players hedge gold is a risk to the balance sheet
of the business as they expand. Titan is one of the
few players to hedge gold.
As the variety of inventory increases, managing it
becomes more complex. The inventory varies in
every micro market within a region as well, and
moving it over locations is challenging. Moreover,
the inventory designed for the heterogonous north
market may turn slower in a relatively homoge-
nous south and vice versa, thus multiplying the
complexity. The south players need to accept this
and move away from centralized proprietary de-
cision making to a de-centralized system. A case
in point is the recent closure of Kirtilals’ Ludhiana
store within three years of opening. Kirtilals is an
extremely reputed diamond jeweler from TN and
has been in the business for over 75 years in TN
and has a strong presence across south India.
One of the associates of a largest south based
player acknowledged that, “Ability to have the
right stock at the right location and a robust
supply chain is fundamental to succeed in this
business as we scale up.”
Zone-wise Malabar Kalyan Joyalukkas
North 2 5 2
South 65 41 40
West 5 8 5
East 1 0 1
Total stores 73 54 48
Presence of South based players in North)
The purity card
Mr. Acharya of WGC said that, “Out of half a mil-
lion jewelry retailers in India, only 10,000 outlets
retail hallmarked gold. Awareness levels are low
and choices are limited.” Moreover, the practice
and level of under-karatage is very high in the
North.
Purity is one the positioning points for the South
based players in North. As a west-based player
put it, “South jewelers are considered more trust-
worthy. The north Indian market is fragmented and
Mr. Acharya of WGC said that, “Out of half a million jewelry retailers in India, only 10,000 outlets retail hallmarked gold. Awareness levels are low and choices are limited.”
The inventory designed for the heterogonous north market may turn slower in a relatively homogenous south and vice versa, thus multiplying the complexity.

17GROUND ZERO GROUND ZERO 1 - 31 May 2014 1- 31 May 2014 16
Titan has been the leader of the pack in this aspect and runs
a well-oiled supply chain seamlessly across its network. Ti-
tan’s ability to manage inventory across 162 stores (including
those operated by franchisees), integrate a robust demand
forecasting mechanism with its supply chain, and manage its
tail (slow-moving designs) sets it apart and helps it introduce
new designs frequently.
Can low making charges substitute for designs? No
The other aspect which they would play on is pricing. As one
the players puts it, “We come from a very competitive market
where customer expects good pricing, great designs, and
excellent service”
South players entering the north will be competitive in
terms of pricing at least in the initial years as they establish
a presence in the region. While all of them maintain that it’s
the unorganized market that will move towards them, the
fact is that the unorganized market still continues to thrive
because of its competitive price points. Kalyan Jeweller’s ad
campaigns in the west and the north was to position itself
on purity and low making charges. However, one of Kalyans’
competitors states, “Kalyan advertises low making charges
but actually they are higher. For every like-to-like product,
our making charges are lower.”
In any case, making charges is not the magic ingredient in
the north. Mr. Acharya of WGC says, “Making charges are
relevant to the consumer but not all important as they don’t
materially affect the cost.” Mr. Bhatia of PC Jewellers corrob-
orates that “Making charges are linked more to the designs
than for brand and purity. If there is another organized player
nearby then purity is not an USP.” Designer items and unique
designs tend to command a premium as there is seldom any
direct comparison. According to Mr. Bhatia, “For designer
items, making charges cannot be compared. It can be com-
pared for items such as machine-made bangles and chains”.
Here begins the challenge for the South-based players —
how to deliver unique designs and diamond jewelry up north
vs. delivering more conservative and traditional designs, gold
jewelry, and coins to the investment-motivated South Indian.
The jewelry purchased in north India for weddings compris-
es studded, diamond, and kundan, and is generally more
contemporary.
A Mumbai-based player with a presence in the north adds,
“A customer enters the store for variety and range, then she
likes the design, and then she enquires about making charg-
es. South-based players tend to stock more south-Indian
designs and more plain gold jewelry. Their customer base in
the North seems to be south-Indians residing in the north.”
Some of the differences in designs are the setting of dia-
monds – south-based players tend to retail closed-setting
diamonds (popular in the south) while in the north, open
setting is preferred.
A quick survey at a Kalyan Jewellers’ store reveals that
designs seem skewed towards south Indian designs and
inventory towards gold.
Design is given much higher preference in the North
South Indian designs at a Kalyan Jewellers Store in North India
Sour
ce: C
PPR
(Cen
tre fo
r Com
para
tive
Stud
ies)
, Phi
llipC
apita
l Ind
ia R
esea
rch

19GROUND ZERO GROUND ZERO 1 - 31 May 2014 1- 31 May 2014 18
The 2-D challenge – Designs and Diamonds
“There has been a push towards studded jewel-
ry because it’s a very opaque market. Diamond
doesn’t have a proper secondary market. Con-
sumers buy more diamonds because of marketing
efforts by De Beers. It’s (diamonds) marketed as an
aspirational product. De Beers has done a fantastic
job. It was never marketed as an investment purely
an aspirational product.” A gold industry expert
However, he cautions that diamond jewelry is
an opaque market and only a few jewelers have
technical knowledge about diamonds and the rest
go by the certification of the suppliers. Therefore,
customer trust becomes very important in an era
where customers are researching more (on the
internet) before they buy.
The south players, which are used to catering
to gold-oriented purchases, are facing a totally
different market in the north, where the diamond
market is large and designs are based on larger
stones. The shift to diamonds has happened faster
in the North. Mr. Bhatia of PC Jewellers says,
“Upper class has already shifted to diamonds as
they don’t won’t adorn themselves with only gold.
If someone was buying four sets of gold wedding
jewelry earlier, they buy one or two diamond sets
now.”
The established players in the north such as PC Jew-
ellers and Tanishq are very strong in diamond and
the studded jewelry segment courtesy their designs
and trust they enjoy. Kalyan Jewellers’ collection in
the west and north is skewed towards gold and their
diamond collections sport south Indian designs.
Literally cashing in on the brand
The option of making large-ticket purchases in cash
at large branded stores will attract clientele. Near-
ly 40-50% of jewelry purchases across north are
in cash. This is true for the south as well but there
recycled gold accounts for 40% of sales. Therefore,
the discerning spender of cash at unorganized out-
lets now has the choice of spending it in a branded
outlet without worrying about compliance. The rule,
basically mandates furnishing of PAN card for any
purchase in Cash over Rs 500,000. But most jewelers
easily break it by splitting the bills.
Every player and store (with the exception of some
organized players such as Tanishq, Orra etc) we visit-
ed in both the south and north stated that they deal
in cash including high-ticket items above Rs 500,000.
One of the players there said, “We are praying for
the elections more than the politicians as business
is severely hit since April 2014. Due to the model
code of conduct, customers are scared to carry large
amount of cash for jewelry purchases and that has
severely impacted the biz.”
We visited many of the stores during this period
and not surprisingly found that store with maximum
footfalls was Tanishq, which possibly enjoys strong
patronage from the white-collared class.
Diamond Jewelry Market in India (based on sale of rough and polished diamonds)
One of the players there said, “We are praying for the elections more than the politicians as business is severely hit since April 2014. Due to the model code of conduct, customers are scared to carry large amount of cash for jewelry purchases and that has severely impacted the biz.”
Sour
ce: P
hilli
pCap
ital I
ndia
Res
earc
h

19GROUND ZERO GROUND ZERO 1 - 31 May 2014 1- 31 May 2014 18
Even as some of the larger players deal in cash
transactions with ease, Tanishq stores clearly stated
that they would require Permanent Account Number
(PAN) card details to conclude any cash transaction
above Rs 500,000. One of the employees cited
an example of how a customer who had finalized
a purchased of Rs 700,000 refused to close the
transaction as he was asked to furnish his PAN card.
Apparently, the customer’s argument was that he
had just purchased jewelry worth Rs 800,000 in cash
from another large jeweler in the vicinity without any
“problem”.
This ability to deal with cash transactions will help
south players to gain market share from the unor-
ganized market. However, even as they garner more
share of the cash transactions, the risk of stringent
regulations being put in place is always there.
Customer service – pitfalls of expansion and lack
of woman power
Once the customer likes a design and it falls in her
budget, what clinches the transaction for the jeweler
is the sales service. As one of players puts it, “The
level of service is very important. It’s like a stay in a
luxury hotel, the customer needs pampering.”
Mr. Bhatia of PC Jewellers adds, “The role of the
sales person is to help the buyer and when re-
quired reinforce the view by saying its looks good
on her.”
The established players such as Tanishq and PC
Jewellers are known for excellent sales service.
One of the major competitors also gave credit
to the Tata brand saying, “Tanishq has excellent
service levels and they are the benchmark.”
While the players from south may have these
qualities as well, there are challenges. Some of the
chains such as Kalyan Jewellers have more south
Indian staff, even in the stores in the west and
north — this is to keep costs and attrition lower,
and because they trust their native staff. Moreover,
there are very few sales women (most of the sales
staff is men). In a business where the customer
and decision maker is the lady, female staff and
communicating in the local language becomes
very important.
One of the customers visiting a Kalyan store in
Mumbai said, “Amitabh Bachchan can speak Hindi
but I am not too sure their staff can.” Another
Most of the staff at a Kalyan Jewellers store in the North was male

21GROUND ZERO GROUND ZERO 1 - 31 May 2014 1- 31 May 2014 20
south-based competitor to Kalyan adds, “Advertis-
ing campaigns can boost footfalls but what builds
the business after initial euphoria is the product,
design, and service, which translates to customer
loyalty.” Ability to converse in the local language
helps understand the customer needs. Moreover,
this helps overcome community bias — north Indi-
ans may be apprehensive of entering a store with
a south Indian ambience.
Decentralizing the business management —
Easier said than thought
The issue of having different designs, higher
mix of slower-moving diamonds, higher level of
customer service (would increase the cost), and
managing this inventory across diverse consump-
tion locations needs system-driven processes
and devolution of power. Accepting this and
many other cultural changes as they enter newer
geographies requires a change in the mindset of
regional entrepreneurs and needs a professional
approach towards building an organized manage-
ment structure.
Designs for a new market need a good and new
merchandising team. Retailing requires skilled staff
(including women) that has an ability to communi-
cate and connect with the customer in their local
language. Managing the diverse inventory across
stores requires investment in systems, processes,
back-end, and people.
“Hiring native (south Indian) staff is a substitute
to establishing processes and systems for checks
and balances. Most of the promoters still run the
business like a proprietorship. To achieve scale this
has to change first,” says the head of retail of an
organized jeweler.
One of the leading diamond players adds, “Many
times, family members interfere in the day-to-day
operations with whimsical demands and impose
their ideas. Professionals find it difficult to adapt in
such organizations and end up quitting. Profes-
sionals can’t help bring about desired changes
unless the “Lala” mentality changes.”
Cracking the north Indian market is anything but
easy. Lower pricing comes at the cost of designs
and customer service, which in many ways seem
non-negotiable in this geography. Above all, the
key to running this business (as any other) is look-
ing at the bigger picture and changing your own
mindset, which, empirically, has never been easy.
As one player put it, “It takes around three years
to establish the brand, win the trust, and gain cus-
tomer loyalty.” It hasn’t been easy at home and
it won’t be easy so far away from home either.
One of the customers visiting a Kalyan store in Mumbai said, “Amitabh Bachchan can speak Hindi but I am not too sure their staff can.”
“Hiring native (south Indian) staff is a substitute to establishing processes and systems for checks and balances. Most of the promoters still run the business like a proprietorship. To achieve scale this has to change first,”
Staff at Kalyan Jewellers store in the North

21GROUND ZERO GROUND ZERO 1 - 31 May 2014 1- 31 May 2014 20
“Hiring native (south Indian) staff is a substitute to establishing processes and systems for checks and balances. Most of the promoters still run the business like a proprietorship. To achieve scale this has to change first,”
Major players in the Indian Jewelry market
T H E W A R R I O R S
Making a mark and sustaining can be very challenging
The Indian jewelry market is largely fragmented
with local and family independent stores (with
whom customers have relationships over gener-
ations) constituting ~80% of the overall market.
However, the past decade has seen the emer-
Share of national chains, regional chains, and local and independent stores
Particulars Malabar Kalyan Joyalukkas Pc jeweller Tanishq TBZ
Store Network 73 54 48 40 162 27
Dominant Region presence
South Sou th South North Pan India Western
Region with minor presence
Delhi, Mumbai & Gujarat
Gujarat & Mumbai
Delhi & Mumbai
Central South
Region for expansion in FY14
North, Central & West
Pan India Pan India South & West Pan India; Mostly East
Pan India
Gold/ Diamond Mix 10-15% 10% 15% 31% 28% 23%
Revenue (Rs bn) 120 90 40 30 80 16
Sales psf 500000 270000 200000 159000 255000
Operating Margin 7-8% 8-9% 12.49% 10.10% 9.20%
Overview of the Major Players
gence of organized regional and national players.
Between 2008 and 2013, the share of national
chains grew to 5% (from 3%) while the share of
regional chains rose to 17% (from 7%).
Sour
ce: A
T Kea
rney
, All
that
glit
ters
is G
old,
Phi
llipC
apita
l Ind
ia R
esea
rch

23GROUND ZERO GROUND ZERO 1 - 31 May 2014 1- 31 May 2014 22
Brief profile of organized players
Tanishq
Tanishq is a division of Titan Company Limited, a
company promoted by the Tata Group, in collabo-
ration with the Tamil Nadu Industrial Development
Corporation (TIDCO). It started its jewelry operations
in 1994 to challenge the established family jewelry
system prevalent in India. Today, Tanishq is consid-
ered one of the pioneers in branded jewelry and or-
naments in India with a network of 162 stores spread
across 90 cities. It has increased awareness among
customers by introducing innovative technology like
Karatmeter that helps customers gauge the quality
of their gold. It has a robust supply chain (managing
9 tonnes of inventories) and a demand-forecasting
mechanism that places the company in a position to
tap new categories and design products according
to consumers’ needs.
Malabar Gold & Diamonds
Malabar Gold & Diamond is niche Kerala-based
jewelry retailer founded in 1993 by Mr. M P Ahmed.
The company has a store network of ~110 stores,
out of which 76 are in India and of which 33 are in
Kerala. The group has achieved robust growth with
a domestic turnover of around Rs 120bn (one of
the largest players in India). It also operates on the
franchise model (forms a separate private limited
company), where it owns a minority stake in the fran-
chisee and gets royalty on sales. However, Malabar
manages the entire store network and supply chain.
The stores are on an average 3,000 sq. ft. The com-
pany has been positioning itself as a value-for-mon-
ey jeweler with one of the lowest making charges in
the industry.
Kalyan Jewellers
Kalyan Jewellers is the flagship of the 100-year old
Kalyan Group with its origins in textile manufactur-
ing and retailing. The group’s forayed into jewelry
retailing two decades ago in 1993, and has a retail
network of 51 stores with most of its stores spread
across the four southern states. The company is
considered to be leader with highest market share
in Tamil Nadu (highest gold consuming state). It is
known for its large-format stores and managing the
largest inventory (keeping enough variety of all kinds
of jewelry and designs). It has clocked a turnover of
around Rs 100bn in FY13.
PC Jewellers
PC Jeweller is a leading north-based company with
a strong presence across north and central India.
It started operations in 2005 and is promoted by
Padam Chand Gupta and Balram Garg. It offers a
wide range of products but focuses on diamond
and wedding jewelry. It operates through 40 stores
located across 33 cities. PC Jeweller has adapted a
four-pronged strategy to gain market share — retail
expansion, focus on high-ticket wedding and dia-
mond jewelry, managing gold price volatility through
loans, and customer-oriented marketing initiatives.
It has a sales density of Rs 200,000 per sq. ft. Na-
tional Capital Region (NCR) dominates its domestic
sales with 60%+ contribution. It has taken aggressive
expansion (2.5x increase in retail space) over FY10-13
to 166,000 sq. ft. and has lined up further expansion
over the next two years, which is expected to lower
its dependence on NCR.
TBZ
Tribhovandas Bhimji Zaveri Ltd is a Mumbai-based
jewelry retailer established in 1864. It runs its business
through “TBZ – the original since 1864” brand name.
It has 27 stores spread in 21 cities across 8 states. It
gets around 70% of its revenue from gold jewelry and
around 23% from diamond-studded jewelry. It was
the first company to offer a buy-back guarantee on
its jewelry in 1931. It has a dedicated design team,
currently comprising 25 designers.
Joyalukkas
Joyalukkas India Ltd is a leading South India-based
company engaged in retail jewelry business with
focus on large-format stores. The company retails
textiles, apparels, and accessories alongside jewelry,
through its Wedding Centers located across Kerala.
The Joyalukkas Group was established in the year
1988 by Alukkas Varghese Joy and began operations
in the United Arab Emirates in jewelry retail business.
It operates through 48 stores.

23GROUND ZERO GROUND ZERO 1 - 31 May 2014 1- 31 May 2014 22
Of all the states, Maharashtra has been the worst
affected due to the recent and unexpected hailstorm
and heavy rains. To get first-hand feedback and
assess the damage to agri produce and the affected
areas, Ground Zero spoke to a few farmers and
representatives — the situation seems grave in some
areas and normal in others; the discrepancy seems
to exist because rains and hailstorms have been
scattered and inconsistent.
How seasoned farmers faced the
BY ASHVIN PATIL
Our take
Crops in many areas are affected in terms of yield
and quality. Fruits and wheat in particular are
affected in most areas as the timing of harvest
matched the hailstorm and rains. Thus, despite
good monsoon across the state in H1FY14, the
late rains have unbalanced the equation for agri-
culturist. While supply of fruits and wheat will be
curtailed, the quality of pulses and vegetables is
likely to be affected, and the sowing pattern for
next year might be disturbed.
We spoke to farmers in UP (Agra), Western Maha-
rashtra (Sangli), MP (Indore), Marathawada (Parli)
and visited a few farmers in Vidarbha (Akola and
Amravati). What we gather is that the rain was
totally unexpected and abrupt and thus gave no
chance to farmers to prepare any defense (such
as early removal or processing of the produce or
covering whatever is standing in the fields).
A Sangli-based farmer, who is also a leader of the
farmers movement, told us that fruit plantation
suffered large damage and to some extent the
sugarcane crop. A large area near Pune (especially
near Baramati) suffered heavily. These places are
high-yield capital-intensive farming areas, thus the
damage is material in value terms. Most farmers
are not keen on the one-time aid for such damage
but want structurally higher prices for farm output.
In Marathwada, we gathered from a farmer (who
grows vegetables (mainly ladies’ finger) and sup-
Unseasonal Weather!
plies it to Pune and Mumbai daily) that the story
remains the same — most of the damage was
suffered by fruit/horticulture farmers while the reg-
ular cash crops (pulses/cotton or even vegetables)
were partly affected. This particular farmer was not
as aggrieved, since his crop is little affected (his
produce is plucked on a daily basis as vegetables
have a shorter shelf life). However, he did say that
some pomegranate plantations in the area had
suffered. He claimed that many orchards around
his farm would have suffered damage to the ex-
tent of Rs2000,000-4000,000 (quite sizable!).
The milestone is almost a feet under hailstones

25GROUND ZERO GROUND ZERO 1 - 31 May 2014 1- 31 May 2014 24
In Vidarbha (eastern-most part of Maharashtra),
the rains and hailstorm did create havoc with
damage to orange farmers and short-cycle crops
such as pulses, soya bean, etc. In many parts of
the region orange and sweet lime were destroyed
— the yield is reduced to abysmally low levels and
the quality of the fruits saved is poor. A visit to a
few farms and farmers in Amravati and Akola dis-
trict revealed that largely the chana (Bengal gram,
the 2nd crop of the season) crop was affected. In
many places, the yield had fallen to almost nil from
the usual 8-10 quintals (800-1,000kgs) per acre.
When this rain occurred most non-irrigated farms
were through with one crop (typically soya bean,
cotton first yield, tuvar (yellow pigeons pea), etc.).
Fortunately, this first crop has been remunerative
in terms of yield and prices.
The Indore farmer was not as unhappy with the
weather gods because even though his main crop
(wheat) did see some yields erosion (largely indic-
ative for the entire Malwa region), he was happy
with the pricing scenario.
An Agra farmer shared that the main crop dam-
aged was potato and according to him the area
surrounding Agra, which is primarily a potato
sowing region, could see a yield drop of approx-
imately 20-40%. His view was that in Punjab the
loss in potato was close to 50%. But that said,
farmers don’t seem to have too much of margin
losses, as lower yields are compensated by higher
prices. Even for most of the sarson (mustard) and
wheat, the crop had ripened and was saved before
the weather turned unfavourable.
It’s interesting to hear the farmers belief — “Jahan
ghata hua hai, wahan agle saal munafa Hoga”
“Whatever losses we have suffered this year, we
will make up next year” — their mentality is to not
immediately jump to the next crop if there is a loss
one year.
In most of the places that we surveyed, the main
damage was to longer-cycle crops such as fruits
(papaya, grapes and pomegranate), sugarcane,
and vegetables while the cash crops or the
short-cycle crops such as pulses, oil seeds, and
proteins were not subject to large scale damage.
Blessings in disguise — cotton yields rise, fed
by the late rains
In some areas in Vidarbha the hailstorm and late
rains have had a favorable effect particularly for
the cotton plantation, with yields rising by almost
20-40%. Typically, cotton yields 6-15 quintals (600-
1,500kgs) per acre (average range for the past few
years). The hailstorm came after the end of the fi-
nal plucking of cotton (2nd yield) with most places
yielding an average 8-10 quintals (800-1,000kgs)
per acre. With the incremental rain, the existing
Area mn hectare sowings as % of India Area impacted due to hailstorm
Overall as a % of India
Uttar Pradesh 10 32 18 1.8
Madhya Pradesh 5 18 18 1
Punjab 4 12 28 1
Rajasthan 3 10 24 0.7
Maharashtra 2 3 30 0.2
Total 4.7
Estimate of damage by the Government: Almost 4.7% of wheat crop damaged
Picture from the area where a severe hailstorm occurred

25GROUND ZERO GROUND ZERO 1 - 31 May 2014 1- 31 May 2014 24
cotton plants flourished giving an additional yield
of 2-5 quintals (200-500kgs) per acre. Moreover,
cotton prices at the mandis (markets) are around
Rs 5,000/quintal (which are higher than the past
few years’ MSP of around Rs 4000/quintal).
However, this unexpected bounty may also pose a
different problem for the upcoming sowing season
— it might marginally delay farm preparation and
thus sowing in some cases.
Since the weather events occurred just before
voting, most political parties, especially the local
leaders, demanded compensation for the damage
ranging from Rs 20,000 to Rs 100,000 per acre.
However, the reality remains that the farmers want
structurally higher prices for their produce rather
than one-time help from the government. The
state government did announce some packages to
the farmers in proportion to their estimate of the
damage in specific areas.
What should one expect the trend in FY15 to
be?
Cotton acreage is likely to increase at the cost of
soya bean and other crops (mainly pulses). Not
many farmers are fully aware and concerned about
the strong possibility of El Nino in this season
(June-Sept 2014) and the likely adverse impact.
The met department has not issued an explicit
El Nino warning yet, but a strong EL Nino might
derail the agriculture projections for the country.
Stronger El Nino, higher impact
As per our weather expert, World Weather Inc,
an impressive warming in the subsurface of the
eastern Pacific Ocean is under way. An upwelling
current is expected to bring the warm water to the
surface of the ocean within the next few weeks
to initiate the transition to El Nino conditions.
The impact will bring changes in weather around
the world with drought in Indonesia, Malaysia,
and eastern Australia high on the list of potential
impacts during the Northern Hemisphere’s mid to
late spring and summer.
Recent sea surface temperatures in the tropical
equatorial Pacific Ocean have been cooler than
usual. The cool conditions have given the impres-
sion that ocean temperatures were trending more
toward a La Nina event than an El Nino. But signif-
icant changes below the surface of the ocean are
telling a completely different tale. The transition
from neutral ENSO conditions to an El Nino event
is expected to occur over a relatively short period
of time (AprilMay).
Some of the scientists are expecting 2014 El Nino
to be worse than the record El Nino event of 1997-
98, when food grain output for India declined by
3.6% and agri GDP by 2.6%. Assuming El Nino
starts in May-June, impact on Indian weather
will be in the form of below average rainfall and
precipitation.
We looked at the rainfall, food production, and
food inflation data during the years El Nino af-
fected India. We saw that medium-strong El Nino
substantially impacted foodgrain output and food
inflation while a weak El Nino’s impact was muted.
However, unseasonal rainfall has already hurt
India’s rabi output and food inflation has remained
high despite good monsoon in the last few years.
Thus, a bout of poor rainfall and agricultural out-
put may seriously worsen food inflation.
Area mn hectare sowings as % of India Area impacted due to hailstorm
Overall as a % of India
Madhya Pradesh 5 23 10 0.5
Maharashtra 3 14 6 0.2
Rajasthan 3 14 4 0.1
Uttar Pradesh 2 10 6 0.1
Andhra Pradesh 2 8 4 0.1
Total 1.1
Almost 1% of pulses crop damaged

27GROUND ZERO GROUND ZERO 1 - 31 May 2014 1- 31 May 2014 26
Sisir Pillai, a cable television industry veteran,
In a freewheeling interaction with Ground Zero, Mr. Sisir Pillai, Chief Strategy Officer – Digi Cable, talks about the implementation of cable TV dig-itisation in India, the pitfalls, and the challenges that the television content distribution industry faces. (Views are personal)
Digi Cable is a large, independent, unlisted, mul-ti-system operator (MSO) with operations spread across western, northern, and eastern Indian states. Mr. Sisir Pillai has been with Digi Cable since 2007 and has close to 25 years of experi-ence in cable television, broadcasting, marketing and advertising sales. He has been associated with the cable television industry since its incep-tion and has worked with most major MSOs. On the broadcasting front, his experience spans chan-nel distribution and placement with Zee Turner, CNBC TV18, ETC Network, and Sahara.
BY VIVEKANAND SUBBARAMAN
shares his views on the implementation of cable TV digitisation in India
Here are excerpts of the interaction:
How do you rate the progress of implementation of digi-
tisation addressable cable TV systems in India?
The Indian television industry has immense potential as it is
one of the largest cable television markets in the world (Next
only to China) and is today the fastest growing cable and
pay TV Market. The addressable market size is estimated at
about 100mn cable homes out of a total TV market of about
160 Mn (and still growing). The annual subscription revenue
generated today at an ARPU of say INR 200/- per subscriber,
per month is ~Rs 230bn. India’s pay TV ARPU is among the
lowest in the world, but when compared with the number
of channels offered at this ARPU it makes for a very dismal
picture. Following extensive regulatory consultations, India
embarked on a journey of digitisation in 2012.
Digitisation in India began on a very promising note as
large MSOs who run cable TV networks deployed digital
set top boxes (STBs) at a very rapid pace to meet the
regulatory deadlines of Analog Sunset. What we have wit-
Sisir Pillai, Chief Strategy Officer – Digi Cable Limited

27GROUND ZERO GROUND ZERO 1 - 31 May 2014 1- 31 May 2014 26
nessed is probably the world’s fastest
deployment of over 25 mn STB’s, com-
pleted in just about 14 to 15 months
period (deployment started sometime
in Jan. 2012 and by March 2013, more
than 25 Mn STB were deployed in 42
markets).
Kudos to the ministry, the regulator and
all the stake holders, viz, broadcasters,
MSO’s, last mile owners (LMO’s) and
the consumers who together worked
to achieve this feat. While any change
in a business ecosystem is very slow
and gradual process (it is believed
the conversion to Digital from
Analog even in a mature market like
the US has taken ~8 to 10 years) we
could have seen better compliance, if
all the stakeholders would have put
in some more effort.
What went wrong with the imple-
mentation of digitisation?
Speed-to-market was probably one
of the biggest reasons for most of the
challenges that the industry experi-
enced in digitization. Broadly, one can
summarize the challenges experienced
as:
Implementation challenge: to change
the mindset of all stakeholders who are
conditioned to 20 years of analog tel-
evision culture; funding & investment
challenges; technology challenge;
regulatory & legal challenges & finally
the consumer challenge: changing
consumer mindset to accept and adopt
the digital ecosystem.
As a result, STB deployments were
done haphazardly and therefore inven-
tory management and tracking of STB’s
remains a challenge – this means that
the capital deployed on the ground
cannot be tracked or managed effi-
ciently. Addressability a key feature
and requirement of DAS was never
implemented from day-one, resulting
in STB’s getting entitlements without
the consumer having to pay for the
services.
Packaging, if implemented effec-
tively would have resulted in lower
broadcaster payouts for the MSO’s
and optimisation of subscription rev-
enues, but till date we are yet to see
this take-off. RIO’s – Reference inter-
connect offers which would have been
one of the foundations of creating a
basic legal agreement/understanding
between the various stakeholders
(whether between the Broadcaster and
the MSO or between the MSO and the
LMO’s and the filling of the Subscriber/
customer application form, SAF/CAF)
was never effectively implemented,
resulting in arbitrary deals.
Billing, which in DAS was expected to
ensure a completely transparent regime
in managing services and payments has
instead become a major problem area.
This is despite the fact that both the
conditional access system (CAS) and
the subscriber management system
(SMS) are housed at the MSO’s head-
end (or in the cloud). On-the-ground
collections from consumers are done
by the LMO’s and the MSO is not privy
to this payment information.
Apart from weak collections, you
said that MSOs are not packaging?
Why aren’t they doing so and why
is all content being available on all
boxes?
Packaging is again very critical to
the business of MSO’s in DAS. In a
country like India with such diverse
demographics and varying consumer
preferences, it is very important to work
on multiple packages rather than offer
just a few packages with most consum-
ers being offered a standard package
with almost all channels. As men-
tioned earlier, by not offering the right
packaging, MSO’s are paying more to
the broadcasters and at the same time
unable to generate more revenue from
consumers.
The reason for not creating the right
packaging is the MSO’s failure to
obtain the critical consumer data
(know your customer through SAF
and Package application form, PAF)
which should ideally contain a com-
plete demographic and psychographic
profile of each and every consumer
household. MSO’s have either got
incomplete or fictitious subscriber
information and are unable to formu-
Implementation of Digital Addressable Cable TV systems (DAS) in IndiaAs per Media Partners Asia, in 2013 India had 262mn households, of which 162mn (62%) have television sets. Total cable and satellite households are 144mn — this includes 98mn cable TV homes and 46mn gross DTH subscribers. After extensive consultations conducted by the Telecom Regulatory Authority of India, the Informa-tion and Broadcasting Ministry came up with the following schedule for mandatory digitisation of the television landscape in India:Phase-1: Deadline Oct 31, 2012 covering four metros – Chennai, Delhi, Kolkata and Mumbai. Digitisation in Chennai hasn’t been done due to pending litigations.Phase-2: Deadline Mar 31, 2013 covering 38 cities with a population of over one million.Phase-3: Deadline Sep 30, 2014 covering the rest of the urban areas in India.Phase-4: Deadline Dec 31, 2014 covering the rest of the country.

29GROUND ZERO GROUND ZERO 1 - 31 May 2014 1- 31 May 2014 28
late the right services at the optimum
price points to enable them generate
commensurate subscription income.
What should the MSO industry do to
succeed in a DAS environment?
MSOs need to revamp their systems
and processes to ensure they’ve the
correct information on the number of
STB’s issued to their LMO’s and that
which is active in the system (Cable
TV in India is still unidirectional and this
poses a challenge in understanding the
exact number of active subscribers),
get all the RIOs fully documented and
deposited with the regulator, enforce
packaging and start billing consumers.
This will be key to the short-term suc-
cess of the business.
In the medium term, the business will
have to migrate from a unidirection-
al to a bi-directional system which
will enable delivery of content and
services in a non-linear fashion.
The long-term perspective would be
to invest in upgrading the infrastruc-
ture at the last mile to ensure deliv-
ery of both digital cable services and
broadband services over the same
pipe and to become the medium of
choice for delivery of content & ser-
vices, any-time, any-place to multiple
access devices in multiple formats.
How can regulators facilitate the
evolution of a more constructive
roadmap for digitisation?
The regulator alongwith the ministry
has done a commendable job in usher-
ing in phase 1 & 2 of DAS; now I would
love to see the regulator play the role
of a mentor ensuring a
more level playing for
the various stakeholders
especially those investing
capital in digitization.
The regulator should
look to evolve a retail
pricing mechanism (where broadcast-
ers have the freedom to decide on
the retail price – the regulator should
however work on fixing a maximum
and minimum retail price wherein on
cannot provide more than 15 to 20%
discount) and strive towards working
an acceptable revenue sharing formula
between the stakeholders and work
towards greater transparency. The reg-
ulator could further streamline channel
distributors/aggregators addressing
vertical/horizontal ownership challeng-
es which need to be regulated.
From a medium to long terms per-
spective, regulations should help the
industry transition from unidirectional
to bi-directional signal transmission,
facilitate non-linear delivery of services
and help in offering both broadband
and cable TV services over the same
pipe.
What about digitisation of phases 3
and 4?
Phase 3 & 4 presents an immense
opportunity as there are estimated
75 to 80mn homes that still needs to
be digitised, but having said this the
bitter experience in implementation
in phases 1 and 2 has made the large
MSOs cautious in entering into this
market.
However, I must also point out that the
market structure in phases 3 and 4 is far
more conducive for investment as there
is limited competition; players who op-
erate in these markets don’t have the
economies of scale nor the expertise to
invest, operate and manage the digital
infrastructure.
What is your view on the long-term
prospects of the television content
distribution space?
Despite the challenges, the Indian
television industry has immense mone-
tisation potential as viewer preferences
are changing. Gone are the days when
television was just a family entertainer.
The MSO industry needs to gear up for
non-linear content delivery, multiple
device viewing, and high-speed broad-
band needs of consumers.
Immense investments need to be
made in conversion of one-way cable
TV lines to two-way and installation
of servers/equipments. The quantum
of investment could be as much as Rs
10,000-20,000/subscriber, but this is a
one-time spend.
If leveraged appropriately, this invest-
ment can be justified in the following
manner — customer ARPUs from con-
tent need to increase from Rs 200-300
to Rs 500-600 per month. This coupled
with high-speed broadband access for
Rs 500-600 per month implies a total
ARPU of Rs 1,000/month. Even if the
MSO parts with 50% of the customer
ARPU with the LMO, viz. Rs 500/month,
pay content providers a net amount
of Rs 100/month (vis-a-vis a negligible
amount right now due to carriage) and
bandwidth charges of Rs 100/month,
an MSO is able to retain Rs 300/month.
This implies that such an investment
has a 3-year payback for an MSO, while
the infrastructural investment is for life.
The business prospects are immense,
but work needs to be done on the
ground, in overcoming implemen-
tation challenges and lastly, not to
mention getting the right funding to
tap into growth.
Addressability, packaging, and other key aspects of digital addressable systems (DAS) are yet to be implemented

29GROUND ZERO GROUND ZERO 1 - 31 May 2014 1- 31 May 2014 28
Indian Economy – Trend Indicators
Monthly Economic Indicators
Quarterly Economic Indicators
Growth Rates (%) Jan-13 Feb-13 Mar-13 Apr-13 May-13 Jun-13 Jul-13 Aug-13 Sep-13 Oct-13 Nov-13 Dec-13 Jan-14 Feb-14
IIP 2.5 0.6 3.5 1.5 -2.5 -1.8 2.6 0.4 2.7 -1.2 -1.3 -0.2 0.8 - 1.9
PMI 53.2 54.2 52.0 51.0 50.1 50.3 50.1 48.5 49.6 49.6 51.3 50.7 51.4 52.5
Core sector 8.3 1.3 7.0 2.3 2.3 0.1 3.1 3.7 8.0 -0.6 1.7 2.1 1.6 4.5
WPI 7.3 7.3 5.7 4.8 4.6 5.2 5.9 7.0 7.0 7.2 7.5 6.4 5.2 4.7
CPI 10.8 10.9 10.4 9.4 9.3 9.9 9.6 9.5 9.8 10.2 11.2 9.9 8.8 8.1
Money Supply 12.7 12.8 13.6 12.4 12.1 12.8 12.5 12.2 12.5 13.0 14.5 14.9 14.5 14.5
Deposit 13.2 12.8 14.4 13.4 13.5 13.8 13.5 13.1 14.1 14.4 16.1 15.8 15.7 15.9
Credit 16.1 16.3 14.1 14.6 14.2 13.7 14.9 17.1 17.8 16.6 15.5 14.5 14.7 14.4
Exports 1.6 5.9 5.9 1.7 -1.1 -4.6 11.6 13.0 11.2 13.5 5.9 3.5 3.8 -3.7
Imports 4.8 1.7 -3.4 11.0 7.0 -0.4 -6.2 -0.7 -18.1 -14.5 -16.4 -15.2 -18.1 -17.1
Trade deficit (USD Bn) -19.0 -14.1 -10.4 -17.8 -20.1 -12.2 -12.3 -10.9 -6.8 -10.6 -9.2 -10.1 -9.9 -8.1
Net FDI (USD Bn) 2.7 2.2 1.3 2.8 1.9 1.8 1.7 1.7 3.3 1.8 2.4 1.9 0.4 -0.1
FII (USD Bn) 6.1 4.2 1.2 1.6 6.7 -8.7 -4.7 -2.0 0.2 -0.4 0.0 2.9 2.6 1.5
ECB (USD Bn) 3.5 2.3 5.1 1.1 2.5 2.0 3.7 2.3 3.3 1.9 2.2 4.6 1.8 4.3
NRI Deposits (USD Bn) 0.7 0.7 0.7 1.3 1.7 2.5 1.3 1.2 5.9 4.5 14.6 2.0 0.7 0.7
Dollar-Rupee 54.3 53.8 54.4 54.4 55.1 58.4 60.6 63.0 63.8 61.6 62.6 61.9 62.1 62.2
FOREX Reserves (USD Bn) 295.8 291.9 293.4 296.4 287.9 284.6 280.2 275.5 276.3 283.0 291.3 295.7 292.2 294.4
Balance of Payment (USD Bn) Q3FY12 Q4FY12 Q1FY13 Q2FY13 Q3FY13 Q4FY13 Q1FY14 Q2FY14 Q3FY14Exports 71.1 80.2 75 72.6 74.2 84.8 73.9 81.2 79.8Imports 118.8 131.7 118.9 120.4 132.6 130.4 124.4 114.5 112.9Trade deficit -47.7 -51.5 -43.8 -47.8 -58.4 -45.6 -50.5 -33.3 -33.2Net Invisibles 28.3 29.8 26.8 26.7 26.6 27.5 28.7 28.1 29.1CAD -19.4 -21.8 -17.1 -21.1 -31.8 -18.2 -21.8 -5.2 -4.1CAD (% of GDP) 4.2 4.4 4 5.1 6.5 3.6 4.9 1.2 0.8Capital Account 8 16.6 16.5 20.7 31.5 20.5 20.6 -4.8 23.8BoP -12.8 -5.7 0.5 -0.2 0.8 2.7 -0.3 -10.4 19.1
GDP and its Components (YoY, %) Q3FY12 Q4FY12 Q1FY13 Q2FY13 Q3FY13 Q4FY13 Q1FY14 Q2FY14 Q3FY14Agriculture & allied activities 6.7 2.0 1.8 1.8 0.8 1.4 2.7 4.6 3.6Industry 4.4 3.9 -0.6 0.1 2.0 2.0 -0.9 1.5 -1.2Mining & Quarrying -0.4 4.2 -1.1 -0.1 -2.0 -3.1 -2.8 -0.4 -1.6Manufacturing 4.5 3.6 -1.1 0.0 2.5 2.6 -1.2 1.0 -1.9Electricity, Gas & Water Supply 9.7 5.6 4.2 1.3 2.6 2.8 3.7 7.7 5.0Services 6.4 7.5 6.7 6.5 6.1 6.3 6.3 5.8 6.7Construction 7.6 6.9 2.8 -1.9 1.0 4.4 2.8 4.3 0.6Trade, Hotel, Transport and Communications 3.9 6.1 4.0 5.6 5.9 6.2 3.9 4.0 4.3Finance, Insurance, Real Estate & Business Services 11.0 11.3 11.7 10.6 10.2 9.1 8.9 10.0 12.5Community, Social & Personal Services 4.7 6.0 7.6 7.4 4.0 4.0 9.4 4.2 7.0GDP at FC 6.1 6.0 4.5 4.6 4.4 4.8 4.4 4.8 4.7

31GROUND ZERO GROUND ZERO 1 - 31 May 2014 1- 31 May 2014 30
Annual Economic Indicators and Forecasts
Indicators Units FY6 FY7 FY8 FY9 FY10 FY11 FY12 FY13 FY14E FY15E
Real GDP growth % 9.5 9.6 9.3 6.7 8.6 8.9 6.7 4.5 4.6 5.2
Agriculture % 5.1 4.2 5.8 0.1 0.8 8.6 5.0 1.4 4.0 2.4
Industry % 8.5 12.9 9.2 4.1 10.2 8.3 6.7 0.9 0.0 2.6
Services % 11.1 10.1 10.3 9.4 10.0 9.2 7.1 6.2 6.0 6.6
Real GDP Rs Bn 32531 35644 38966 41587 45161 49185 52475 54821 57486 60475
Real GDP US$ Bn 733 787 967 908 953 1079 1096 1008 958 1008
Nominal GDP Rs Bn 36925 42937 49864 56301 64778 77841 90097 101133 113205 126723
Nominal GDP US$ Bn 832 948 1237 1229 1367 1707 1881 1859 1887 2112
Population Mn 1106 1122 1138 1154 1170 1186 1202 1219 1236 1254
Per Capita Income US$ 753 845 1087 1065 1168 1439 1565 1525 1526 1685
WPI (Average) % 4.5 6.6 4.7 8.1 3.8 9.6 8.7 7.4 6.0 5-5.5
CPI (Average) % 4.2 6.8 6.4 9.0 12.4 10.4 8.3 10.2 9.5 7.5-8
Money Supply % 15.5 20.0 22.1 20.5 19.2 16.2 15.8 13.6 13.0 14.0
CRR % 5.00 6.00 7.50 5.00 5.75 6.00 4.75 4.00 4.00 4.00
Repo rate % 6.50 7.50 7.75 5.00 5.00 6.75 8.50 7.50 8.00 8.00
Reverse repo rate % 5.50 6.00 6.00 3.50 3.50 5.75 7.50 6.50 7.00 7.00
Bank Deposit growth % 24.0 23.8 22.4 19.9 17.2 15.9 13.5 14.4 14.0 15.0
Bank Credit growth % 37.0 28.1 22.3 17.5 16.9 21.5 17.0 15.0 15.0 16.0
Centre Fiscal Deficit Rs Bn 1464 1426 1437 3370 4140 3736 5160 5209 5245 5798
Centre Fiscal Deficit % of GDP 4.0 3.3 2.9 6.0 6.4 4.8 5.7 5.2 4.6 4.6
Gross Central Govt Borrowings Rs Bn 1310 1460 1681 2730 4510 4370 5098 5580 5639 6656
Net Central Govt Borrowings Rs Bn 954 1104 1318 2336 3984 3254 4362 4674 4233 4759
State Fiscal Deficit % of GDP 2.4 1.8 1.5 2.4 2.9 2.1 2.3 2.2 2.5 2.5
Consolidted Fiscal Deficit % of GDP 6.4 5.1 4.4 8.4 9.3 6.9 8.1 7.4 7.1 7.1
Exports US$ Bn 105.2 128.9 166.2 189.0 182.4 251.1 309.8 306.6 316.7 326.2
YoY Growth % 23.4 22.6 28.9 13.7 -3.5 37.6 23.4 -1.0 3.3 3.0
Imports US$ Bn 157.1 190.7 257.6 308.5 300.6 381.1 499.5 502.2 465.9 500.2
YoY Growth % 32.1 21.4 35.1 19.7 -2.5 26.7 31.1 0.5 -7.2 7.4
Trade Balance US$ Bn -51.9 -61.8 -91.5 -119.5 -118.2 -129.9 -189.8 -195.6 -149.2 -174.0
Net Invisibles US$ Bn 42.0 52.2 75.7 91.6 80.0 84.6 111.604 107.5 111.4 119.7
Current Account Deficit US$ Bn -9.9 -9.6 -15.7 -27.9 -38.2 -45.3 -78.2 -88.2 -37.8 -54.3
CAD (% of GDP) % -1.2 -1.0 -1.3 -2.3 -2.8 -2.6 -4.2 -4.7 -2.0 -2.6
Capital Account Balance US$ Bn 25.5 45.2 106.6 7.8 51.6 62.0 67.8 89.3 52.5 64.5
Dollar-Rupee (Average) 44.4 45.3 40.3 45.8 47.4 45.6 47.9 54.4 60.0 60.0
Source: RBI, CSO, CGA, Ministry of Agriculture, Ministry of commerce, Bloomberg, PhillipCapital India Research

31GROUND ZERO GROUND ZERO 1 - 31 May 2014 1- 31 May 2014 30
CMP
Mkt
Cap
Net S
ales
EBID
TAPA
TEP
S (Rs
) EP
S Gro
wth
(%)
P/E (
x) P
/B (x
)EV
/EBI
TDA
(x)
ROE (
%)
ROCE
(%)
Nam
e of
com
pany
Secto
rRs
Rs m
nFY
14E
FY15
EFY
14E
FY15
EFY
14E
FY15
EFY
14E
FY15
EFY
14E
FY15
EFY
14E
FY15
EFY
14E
FY15
EFY
14E
FY15
EFY
14E
FY15
EFY
14E
FY15
E
Cham
bal F
ertil
iser
sAg
ri In
puts
42 1
7,27
1 8
6,90
3 8
7,44
1 6
,120
7
,829
2
,595
3
,260
6.
27.
814
.525
.66.
75.
30.
90.
88.
66.
213
.215
.24.
76.
0
Coro
man
del F
ertil
iser
sAg
ri In
puts
220
62,
187
99,
682
109
,141
7
,886
1
0,01
0 3
,686
5
,348
13
.018
.9-1
4.8
45.1
16.9
11.6
2.6
2.3
11.5
9.0
15.3
19.6
13.9
18.4
Tata
Che
mica
ls Lt
dAg
ri In
puts
296
75,
306
161
,003
1
55,4
04
19,
820
20,
983
5,3
31
6,5
88
20.9
25.9
-41.
623
.614
.111
.41.
11.
16.
75.
87.
99.
27.
57.
3
Deep
ak Fe
rtilis
ers
Agri
Inpu
ts12
8 1
1,32
1 3
1,49
8 3
2,74
4 4
,862
4
,882
1
,901
2
,251
21
.625
.547
.318
.46.
05.
00.
80.
74.
44.
114
.115
.19.
710
.1
Kave
ri Se
eds
Agri
Inpu
ts63
2 4
3,53
9 1
0,22
0 1
1,89
6 2
,194
2
,604
2
,096
2
,456
30
.635
.865
.417
.220
.717
.68.
56.
219
.215
.941
.435
.347
.840
.3
PI In
dust
ries
Agri
Inpu
ts25
0 3
4,04
8 1
6,39
5 1
9,70
2 2
,948
3
,533
1
,773
2
,184
13
.016
.081
.323
.119
.215
.64.
83.
712
.09.
925
.123
.724
.324
.6
Ralli
s Ind
iaAg
ri In
puts
190
36,
969
17,
466
19,
423
2,6
13
3,1
40
1,5
19
1,8
13
7.8
9.3
23.2
19.3
24.3
20.4
5.1
4.4
14.3
11.8
21.2
21.5
20.0
20.5
Unite
d Ph
osph
orus
Agri
Inpu
ts27
7 1
18,6
81
105
,800
1
21,1
45
20,
196
20,
464
10,
145
11,
775
23.7
27.5
29.4
16.1
11.7
10.1
2.3
1.9
6.8
6.6
19.7
19.7
13.1
14.1
Baja
j Aut
oAu
tom
obile
s19
85 5
74,5
09
200
,505
2
23,7
39
42,
374
46,
397
34,
670
37,
851
119.
813
0.8
12.0
9.2
16.6
15.2
6.0
4.9
13.5
12.3
36.3
32.0
37.0
33.0
Bhar
at Fo
rge
Auto
mob
iles
413
96,
051
59,
170
59,
525
10,
228
11,
528
4,2
04
5,3
57
18.1
23.0
84.5
27.4
22.9
17.9
3.8
3.3
10.9
9.4
16.5
18.4
11.7
13.0
Hero
Mot
oCor
pAu
tom
obile
s21
65 4
32,3
33
250
,923
2
73,6
22
35,
286
38,
087
20,
510
26,
135
102.
713
0.9
-3.2
27.4
21.1
16.5
7.8
6.6
12.2
11.3
37.0
40.1
37.6
42.0
Asho
k Le
ylan
dAu
tom
obile
s23
61,
861
107
,470
1
27,0
60
4,4
99
9,2
68
(3,3
14)
1,2
08
-1.2
0.5
-329
.9-1
36.4
-18.
751
.21.
61.
624
.612
.1-8
.33.
1-0
.24.
1
Mah
indr
a &
Mah
indr
aAu
tom
obile
s10
65 6
56,1
72
424
,945
4
82,5
19
48,
919
55,
617
34,
833
39,
670
56.7
64.6
3.7
13.9
18.8
16.5
3.8
3.2
13.8
12.1
20.0
19.3
17.0
17.0
Mar
uti S
uzuk
iAu
tom
obile
s19
52 5
89,7
81
426
,448
4
54,2
13
50,
900
59,
501
27,
831
33,
411
92.1
110.
616
.320
.121
.217
.72.
82.
511
.39.
513
.414
.113
.113
.9
Apol
lo Ty
res
Auto
mob
iles
164
82,
610
134
,807
1
44,5
50
17,
067
18,
011
8,0
72
9,0
24
16.0
17.9
39.7
11.8
10.2
9.2
2.0
1.6
6.1
5.6
21.3
19.6
15.0
14.8
Tata
Mot
ors
Auto
mob
iles
417
1,23
3,28
2 2,
375,
241
2,7
42,0
17
369
,394
4
33,7
13
160
,526
1
82,4
78
50.3
57.2
62.3
13.7
8.3
7.3
2.4
1.8
4.0
3.5
29.4
25.1
16.7
16.0
ABB
Indi
aCa
p Goo
ds82
5 1
74,7
29
76,
158
80,
624
4,2
65
7,3
54
2,1
21
4,1
65
10.0
19.7
-19.
696
.382
.442
.06.
45.
941
.523
.97.
814
.07.
812
.2
BGR
Ener
gyCa
p Goo
ds13
3 9
,587
3
5,20
4 4
0,64
0 4
,281
4
,820
1
,329
1
,622
18
.422
.5-1
8.0
22.1
7.2
5.9
0.7
0.7
6.6
7.2
10.2
11.6
5.9
5.9
BHEL
Cap G
oods
187
457
,089
3
84,0
99
354
,635
4
5,92
1 3
9,20
5 3
4,28
4 2
8,22
0 14
.011
.5-4
8.2
-17.
713
.316
.21.
41.
38.
39.
410
.58.
18.
56.
9
Alst
om T&
DCa
p Goo
ds27
2 6
9,52
9 3
4,32
6 3
8,09
3 3
,103
4
,015
1
,119
1
,879
4.
47.
3-1
0.8
67.9
62.1
37.0
5.6
5.0
23.3
17.6
10.4
14.3
10.8
12.7
Crom
pton
Gre
aves
Cap G
oods
178
111
,655
1
34,3
14
144
,354
6
,872
1
1,07
4 2
,674
5
,391
4.
38.
622
3.6
101.
641
.820
.72.
82.
618
.811
.46.
812
.55.
59.
1
Jyot
i Stru
ctur
esCa
p Goo
ds39
3,1
72
30,
703
30,
855
2,9
64
2,9
47
722
6
41
8.8
7.8
11.3
-11.
44.
45.
00.
40.
43.
93.
88.
97.
410
.910
.9
KEC
Inte
rnat
iona
lCa
p Goo
ds78
20,
130
79,
751
84,
659
5,0
46
6,2
93
1,0
39
1,8
10
4.0
7.0
59.4
74.3
19.4
11.1
1.6
1.5
8.0
6.3
8.4
13.1
8.4
9.8
Lars
en &
Toub
roCa
p Goo
ds13
29 1,
232,
758
571
,938
6
51,8
97
59,
142
69,
195
42,
338
48,
237
45.9
52.3
-7.3
13.9
29.0
25.4
3.8
3.4
21.5
18.2
13.1
13.4
11.2
11.3
Siem
ens
Cap G
oods
745
265
,202
1
11,4
52
112
,300
4
,831
6
,718
4
,313
4
,478
12
.112
.6-1
8.8
3.8
61.5
59.2
6.6
6.2
53.6
38.4
10.7
10.5
7.8
8.1
Cum
min
s Ind
iaCa
p Goo
ds55
4 1
53,6
52
39,
772
44,
183
6,2
53
7,2
23
6,0
48
6,7
35
21.8
24.3
-8.8
11.4
25.4
22.8
5.8
5.3
23.9
20.8
22.9
23.1
20.1
20.6
Ther
max
Cap G
oods
740
88,
170
51,
341
58,
176
4,1
40
5,6
22
2,6
93
3,4
04
22.6
28.6
-11.
426
.432
.725
.94.
33.
921
.315
.413
.315
.111
.213
.6
VA Te
ch W
abag
Cap G
oods
795
21,
151
20,
211
27,
626
1,5
57
2,3
59
912
1
,366
34
.451
.41.
049
.723
.215
.52.
72.
411
.88.
111
.615
.310
.113
.2
Volta
sCa
p Goo
ds16
4 5
4,36
4 5
2,42
6 5
4,53
1 2
,427
3
,020
1
,818
2
,340
5.
57.
1-6
.828
.729
.923
.23.
12.
821
.617
.210
.412
.210
.512
.1
ACC
Cem
ent
1287
241
,600
1
09,0
84
124
,747
1
3,69
0 1
9,90
1 1
0,94
7 1
1,87
6 58
.263
.2-2
1.5
8.5
22.1
20.4
3.1
2.9
15.8
11.8
14.0
14.3
11.7
11.4
Ambu
ja C
emen
tCe
men
t20
0 3
09,5
15
91,
180
231
,471
1
5,68
9 4
3,73
9 1
2,53
8 2
1,58
7 8.
110
.9-2
0.6
34.3
24.6
18.4
3.3
2.1
17.2
6.7
13.3
11.5
11.8
15.7
Indi
a Ce
men
tCe
men
t70
21,
595
53,
635
59,
954
6,8
56
7,7
78
18
686
0.
12.
2-9
9.2
3807
.312
30.4
31.5
0.5
0.6
7.5
6.3
0.0
1.7
3.2
4.2
Man
gala
m C
emen
tCe
men
t13
5 3
,610
7
,117
1
0,17
1 4
84
1,2
89
156
3
88
5.8
14.5
-79.
914
9.2
23.2
9.3
0.7
0.7
16.5
6.2
3.1
7.3
2.4
5.9
Shre
e Ce
men
tCe
men
t57
40 1
99,9
81
61,
817
73,
661
14,
288
19,
555
7,1
02
10,
178
203.
929
2.1
-29.
343
.328
.219
.64.
43.
713
.59.
815
.818
.714
.817
.8
Phill
ipC
apita
l Ind
ia C
over
age
Uni
vers
e: V
alua
tio
n Su
mm
ary
Note
: For
ban
ks, E
BITD
A is
pre-
prov
ision
pro
fit

33GROUND ZERO GROUND ZERO 1 - 31 May 2014 1- 31 May 2014 32
CMP
Mkt
Cap
Net S
ales
EBID
TA
PAT
EPS (
Rs)
EPS G
row
th (%
) P/
E (x)
P
/B (x
) E
V/EB
ITDA
(x)
ROE (
%)
ROCE
(%)
Nam
e of c
ompa
nySe
ctor
RsRs
mn
FY14
EFY
15E
FY14
EFY
15E
FY14
EFY
15E
FY14
EFY
15E
FY14
EFY
15E
FY14
EFY
15E
FY14
EFY
15E
FY14
EFY
15E
FY14
EFY
15E
FY14
EFY
15E
Ultra
tech
Cem
ent
Cem
ent
2051
562
,414
2
14,4
37
268
,219
3
8,26
4 5
6,54
5 2
2,06
0 3
3,94
3 80
.412
3.8
-17.
653
.925
.516
.63.
32.
815
.310
.412
.816
.99.
013
.1
OCL I
ndia
Cem
ent
178
10,
140
19,
195
22,
072
2,9
24
3,4
24
1,0
50
734
18
.412
.9-3
4.2
-30.
19.
713
.80.
90.
86.
86.
19.
16.
06.
86.
0
JK La
kshm
i Cem
ent
Cem
ent
113
13,
332
20,
290
22,
694
2,9
48
3,8
98
465
6
35
4.0
5.4
-75.
736
.528
.721
.01.
01.
09.
27.
53.
64.
74.
05.
1
Heid
elbe
rgCe
men
t Ind
iaCe
men
t42
9,4
72
13,
824
16,
925
1,0
76
2,0
82
(195
) 1
36
-0.9
0.6
-163
.2-1
69.5
-48.
669
.91.
11.
119
.810
.2-2
.31.
62.
23.
6
JK C
emen
tCe
men
t23
6 1
6,50
2 2
8,17
8 3
8,39
4 3
,449
4
,737
7
58
1,3
63
10.8
19.5
-67.
179
.721
.812
.10.
90.
911
.87.
44.
37.
44.
36.
2
Dalm
ia B
hara
t Ltd
Cem
ent
261
21,
215
27,
439
36,
197
4,4
11
6,6
59
29
1,1
86
0.4
14.6
-98.
539
82.7
730.
217
.90.
70.
713
.39.
00.
13.
72.
84.
7
Andh
ra B
ank
Finan
cials
67 3
9,62
2 4
1,37
0 4
6,98
6 4
1,37
0 4
6,98
6 1
2,18
0 1
4,37
0 21
.825
.7-5
.518
.03.
12.
60.
40.
4NM
NM13
.814
.70.
80.
8
Bank
of B
arod
a Fin
ancia
ls82
2 3
52,7
86
120
,696
1
43,4
19
120
,696
1
43,4
19
46,
500
52,
094
108.
012
1.0
0.1
12.0
7.6
6.8
1.0
0.9
NMNM
14.4
14.6
0.8
0.8
Bank
of I
ndia
Fin
ancia
ls24
4 1
56,7
12
106
,289
1
28,6
52
106
,289
1
28,6
52
30,
691
37,
211
47.7
57.9
3.6
21.2
5.1
4.2
0.6
0.5
NMNM
12.6
13.6
0.6
0.6
Cana
ra B
ank
Finan
cials
295
135
,933
8
7,18
8 1
06,4
93
87,
188
106
,493
2
2,32
9 3
1,77
9 48
.468
.9-2
5.3
42.3
6.1
4.3
0.6
0.5
NMNM
9.3
12.4
0.5
0.6
Corp
orat
ion
bank
Finan
cials
295
49,
425
38,
750
44,
906
38,
750
44,
906
13,
743
16,
500
79.5
85.5
-15.
37.
63.
73.
40.
50.
4NM
NM13
.213
.30.
70.
7
HDFC
Ban
kFin
ancia
ls72
5 1
,740
,031
1
84,2
34
222
,367
1
84,2
34
222
,367
8
5,36
4 1
01,9
08
35.9
42.8
26.9
19.4
20.2
16.9
4.0
3.4
NMNM
21.6
21.8
2.0
2.0
ICIC
I Ban
kFin
ancia
ls12
74 1
,471
,176
1
64,7
56
186
,898
1
64,7
56
186
,898
9
8,10
6 1
09,3
57
84.9
94.5
17.7
11.2
15.0
13.5
2.0
1.8
NMNM
14.0
14.3
1.7
1.7
IOB
Finan
cials
55 6
8,12
9 5
7,90
2 6
7,31
8 5
7,90
2 6
7,31
8 7
,740
1
1,13
4 6.
67.
97.
420
.28.
47.
00.
50.
5NM
NM5.
87.
30.
30.
4
Orie
ntal
Ban
k Fin
ancia
ls25
5 7
6,35
6 5
1,01
1 5
7,04
5 5
1,01
1 5
7,04
5 1
1,18
0 1
3,86
2 37
.346
.2-1
8.1
24.0
6.8
5.5
0.6
0.5
NMNM
8.9
10.2
0.5
0.6
PNB
Finan
cials
796
288
,244
1
65,1
27
188
,758
1
65,1
27
188
,758
3
4,91
1 4
5,40
7 98
.812
8.5
-26.
530
.18.
16.
20.
80.
8NM
NM10
.712
.80.
70.
8
SBI
Finan
cials
2105
1,5
71,7
60
673
,371
7
93,5
49
673
,371
7
93,5
49
136
,339
1
60,7
17
182.
621
5.3
-30.
317
.911
.59.
81.
01.
0NM
NM9.
710
.20.
60.
6
Unio
n Ba
nk
Finan
cials
158
99,
651
78,
033
87,
433
78,
033
87,
433
15,
610
18,
265
24.8
29.0
-31.
517
.06.
45.
50.
60.
5NM
NM9.
510
.30.
50.
5
HDFC
Finan
cials
885
1,3
80,9
84
74,
608
86,
872
78,
513
91,
217
56,
585
65,
676
36.3
42.1
15.7
16.1
24.4
21.0
5.0
4.4
NMNM
21.2
21.7
2.8
2.7
Indi
an B
ank
Finan
cials
130
60,
384
44,
320
52,
207
44,
320
52,
207
11,
246
13,
504
24.2
31.4
-34.
229
.85.
44.
10.
50.
4NM
NM10
.211
.20.
60.
7
Deve
lopm
ent C
redi
t Ban
kFin
ancia
ls63
15,
709
3,6
84
4,3
10
3,6
84
4,3
10
1,5
05
1,7
30
6.0
6.9
47.3
15.0
10.4
9.1
1.4
1.2
NMNM
14.7
14.6
1.2
1.2
AXIS
Ban
kFin
ancia
ls15
30 7
19,3
76
119
,516
1
34,9
17
119
,516
1
34,9
17
62,
174
72,
053
132.
315
2.6
19.6
15.3
11.6
10.0
1.9
1.6
NMNM
17.4
17.4
1.7
1.7
Indu
sind
Bank
Finan
cials
494
259
,648
2
8,90
7 3
4,20
8 2
8,90
7 3
4,20
8 1
4,11
4 1
7,25
8 26
.932
.832
.322
.318
.415
.03.
02.
6NM
NM17
.618
.41.
81.
8
Shrir
am Tr
ansp
ort F
inan
ceFin
ancia
ls77
7 1
76,3
33
36,
479
40,
567
28,
574
31,
615
12,
642
14,
377
55.7
63.4
-7.1
13.8
13.9
12.3
2.1
2.0
NMNM
16.3
16.7
2.7
2.7
LIC
Hous
ing
Finan
ceFin
ancia
ls27
1 1
36,7
13
18,
645
22,
158
18,
259
21,
504
12,
927
15,
406
25.6
30.5
26.3
19.2
10.6
8.9
1.8
1.5
NMNM
18.4
18.8
1.5
1.5
Hind
usta
n Un
ileve
rFM
CG58
1 1
,255
,661
2
74,0
83
301
,628
5
0,80
8 5
6,92
9 3
6,13
7 3
9,57
4 16
.718
.38.
09.
534
.731
.732
.323
.024
.221
.393
.072
.611
0.7
85.1
Mar
ico In
dust
ries
FMCG
205
131
,909
4
8,32
6 5
4,54
8 7
,148
8
,685
4
,654
5
,280
7.
28.
227
.713
.528
.325
.09.
18.
218
.915
.532
.132
.819
.124
.0
Jubi
lant
Food
wor
ksFM
CG96
8 6
3,31
2 1
7,51
8 2
2,60
0 2
,679
3
,113
1
,346
1
,542
20
.623
.6-0
.414
.646
.941
.011
.18.
723
.720
.123
.621
.326
.323
.2
Godr
ej C
onsu
mer
FMCG
783
266
,601
7
8,13
6 8
9,35
5 1
1,45
1 1
3,52
1 7
,686
9
,132
22
.626
.83.
418
.834
.729
.27.
16.
124
.320
.220
.521
.014
.918
.0
ITCFM
CG34
2 2
,720
,386
3
27,3
41
379
,301
1
21,8
88
143
,439
8
4,97
1 1
00,2
19
10.8
12.7
13.8
17.9
31.8
27.0
10.5
8.9
21.9
18.3
33.1
32.9
27.4
28.4
Nest
leFM
CG47
15 4
54,6
29
92,
304
106
,565
2
0,65
0 2
3,78
7 1
1,53
6 1
3,69
1 11
9.6
142.
08.
118
.739
.433
.219
.815
.822
.119
.050
.247
.638
.038
.2
Colg
ate
FMCG
1472
200
,229
3
5,32
4 4
0,82
5 6
,475
7
,699
4
,879
5
,643
35
.941
.5-1
.815
.741
.035
.537
.333
.030
.325
.590
.893
.010
4.3
98.6
Glax
o Sm
ithkl
ine C
onsu
mer
FMCG
4216
177
,325
3
5,64
0 4
1,25
0 5
,271
6
,586
5
,165
6
,289
12
2.8
149.
518
.321
.834
.328
.211
.09.
630
.624
.332
.133
.934
.636
.2
Agro
Tech
Food
sFM
CG49
8 1
2,13
1 7
,622
8
,407
6
78
729
4
26
459
17
.518
.82.
27.
628
.526
.44.
33.
818
.016
.515
.114
.316
.214
.6
Dabu
rFM
CG18
0 3
14,1
48
70,
891
82,
186
11,
799
14,
523
9,0
06
11,
232
5.2
6.5
16.9
24.7
34.8
27.9
11.2
9.1
26.9
21.5
32.3
32.5
25.3
26.7
Phill
ipC
apita
l Ind
ia C
over
age
Uni
vers
e: V
alua
tio
n Su
mm
ary
Note
: For
ban
ks, E
BITD
A is
pre-
prov
ision
pro
fit

33GROUND ZERO GROUND ZERO 1 - 31 May 2014 1- 31 May 2014 32
CMP
Mkt
Cap
Ne
t Sal
es
EBID
TA
PAT
EPS
(Rs)
EP
S Gr
owth
(%)
P/E
(x)
P/B
(x)
EV/E
BITD
A (x
) R
OE (%
) RO
CE (%
)
Nam
e of
com
pany
Sect
orRs
Rs m
nFY
14E
FY15
EFY
14E
FY15
EFY
14E
FY15
EFY
14E
FY15
EFY
14E
FY15
EFY
14E
FY15
EFY
14E
FY15
EFY
14E
FY15
EFY
14E
FY15
EFY
14E
FY15
E
Emam
iFM
CG47
1 1
06,9
93
18,
837
22,
014
4,2
42
4,8
09
3,8
15
4,2
24
16.8
18.6
21.2
10.7
28.0
25.3
11.2
8.8
24.7
21.3
40.0
34.8
38.6
35.0
Brita
nnia
FMCG
889
106
,554
6
9,89
2 8
0,17
9 5
,969
7
,137
3
,950
5
,011
33
.141
.952
.126
.826
.921
.213
.710
.118
.314
.850
.947
.738
.842
.1
Baja
j Cor
pFM
CG22
2 3
2,67
1 6
,984
8
,494
1
,801
2
,113
1
,744
1
,986
11
.813
.54.
113
.918
.716
.56.
56.
517
.714
.934
.939
.228
.627
.6
Zydu
s Wel
lnes
sFM
CG51
9 2
0,28
6 4
,246
4
,898
1
,057
1
,208
1
,101
1
,232
28
.231
.513
.411
.818
.416
.56.
14.
816
.713
.932
.929
.237
.232
.7
Asia
n Pa
ints
FMCG
501
480
,558
1
24,9
01
145
,719
1
9,60
3 2
2,74
9 1
2,29
8 1
4,39
8 12
.815
.010
.417
.139
.133
.411
.910
.024
.320
.630
.530
.030
.831
.0
Balra
mpu
r Chi
niFM
CG58
14,
262
31,
031
33,
081
2,6
77
3,2
61
374
7
73
1.5
3.2
-76.
810
6.7
38.0
18.4
1.1
1.1
9.6
8.0
2.9
5.7
4.4
6.1
Tila
knag
arFM
CG62
7,7
05
8,7
90
10,
626
1,9
05
2,3
96
735
9
27
6.0
7.6
21.3
26.1
10.3
8.2
1.3
1.2
7.8
6.6
12.6
14.1
12.4
13.3
Radi
co K
haita
nFM
CG11
0 1
4,60
8 1
4,18
8 1
6,12
2 2
,217
2
,612
9
57
1,2
04
7.2
9.1
23.8
25.8
15.2
12.1
1.8
1.6
10.1
8.7
11.8
13.1
11.0
11.9
Berg
er P
aint
sFM
CG24
3 8
4,09
1 3
8,95
8 4
5,68
9 4
,340
5
,237
2
,553
3
,041
7.
48.
813
.519
.132
.927
.67.
56.
320
.316
.922
.822
.821
.421
.9
GMR
Infra
stru
ctur
eIn
frastr
uctu
re26
102
,566
8
4,57
8 9
4,73
6 2
5,75
1 3
6,67
8 (1
4,88
1) (5
,221
)-3
.8-1
.322
6.4
-64.
9-6
.9-1
9.6
1.2
1.3
16.4
11.2
-17.
0-6
.42.
72.
6
GVK
Pow
erIn
frastr
uctu
re13
20,
798
20,
272
28,
909
10,
172
17,
228
(2,2
17)
(7,0
74)
-1.4
-4.5
-34.
021
9.1
-9.4
-2.9
0.7
0.8
23.2
13.9
-7.2
-27.
51.
21.
0
IRB
Infra
stru
ctur
eIn
frastr
uctu
re11
7 3
8,83
7 3
7,03
4 3
6,83
5 1
7,23
7 2
0,19
3 4
,472
4
,238
13
.512
.8-1
9.7
-5.2
8.7
9.2
1.0
0.9
7.4
7.3
12.1
10.3
7.1
6.6
Adan
i Por
ts &
SEZ
Infra
struc
ture
193
398
,588
4
3,54
2 4
4,52
4 2
8,08
1 3
1,87
0 2
2,30
5 2
3,99
0 10
.811
.622
.17.
617
.916
.64.
23.
515
.513
.223
.821
.213
.613
.2
HCL T
echn
olog
ies
IT Se
rvice
s14
19 9
92,7
13
257
,694
3
29,6
25
57,
539
86,
787
40,
142
62,
283
56.9
88.1
63.3
54.8
24.9
16.1
7.0
5.3
17.5
11.6
28.1
32.8
26.3
33.0
Info
sys
IT Se
rvice
s31
78 1
,825
,009
5
01,3
30
532
,469
1
34,1
50
143
,356
1
06,4
80
113
,284
18
6.3
198.
313
.06.
417
.116
.03.
83.
311
.410
.422
.420
.424
.422
.0
TCS
IT Se
rvice
s21
91 4
,292
,063
8
18,0
94
944
,007
2
51,3
22
283
,764
1
91,0
87
230
,915
97
.611
7.9
37.0
20.8
22.5
18.6
7.8
6.1
17.0
15.0
34.5
32.8
38.2
35.5
Tech
Mah
indr
aIT
Serv
ices
1823
425
,801
1
88,8
02
224
,116
4
2,03
5 4
9,88
6 3
1,49
7 3
3,75
0 13
2.6
141.
748
.46.
913
.812
.93.
93.
09.
47.
728
.323
.529
.225
.4
Wip
roIT
Serv
ices
529
1,3
04,9
96
434
,269
4
75,4
40
99,
942
106
,211
7
7,96
6 8
8,97
1 31
.736
.127
.014
.116
.714
.63.
83.
212
.511
.622
.722
.223
.722
.8
Pers
iste
nt S
yste
ms
IT Se
rvice
s10
40 4
1,58
2 1
6,69
2 1
9,28
9 4
,303
4
,970
2
,493
3
,200
62
.380
.032
.928
.416
.713
.03.
42.
89.
48.
220
.421
.819
.421
.4
KPIT
Tech
nolo
gies
IT Se
rvice
s17
2 3
3,29
3 2
6,94
0 3
0,05
8 4
,233
4
,750
2
,391
3
,005
12
.816
.318
.527
.013
.410
.62.
52.
08.
57.
418
.819
.417
.317
.2
Zee
Ente
rtain
men
tM
edia
269
258
,649
4
3,41
4 4
9,89
6 1
1,81
1 1
4,92
2 7
,545
9
,466
7.
99.
95.
525
.534
.127
.16.
65.
821
.516
.819
.321
.523
.024
.5
HT M
edia
Med
ia93
21,
564
22,
064
23,
766
3,1
14
3,4
93
1,8
91
2,1
83
8.0
9.3
12.8
15.4
11.5
10.0
1.2
1.1
4.4
3.3
10.3
10.5
11.4
11.5
Sun
TV N
etw
ork
Med
ia39
3 1
54,9
15
22,
147
25,
169
11,
186
13,
279
7,1
45
8,2
94
18.1
21.0
0.7
16.1
21.7
18.7
4.7
4.0
13.6
11.1
21.6
21.2
22.9
23.1
Jagr
an P
raka
shan
Med
ia10
4 3
4,13
0 1
7,24
3 1
9,08
0 4
,009
4
,331
2
,037
2
,396
6.
47.
6-4
.117
.616
.213
.83.
32.
99.
78.
720
.121
.014
.213
.9
Den
Netw
orks
Med
ia17
5 3
1,15
8 1
0,96
1 1
8,84
0 2
,951
6
,227
4
11
1,9
34
2.8
13.2
-42.
537
0.0
62.3
13.2
1.4
1.3
8.5
5.1
2.3
9.7
6.3
10.8
Dish
TVM
edia
50 5
2,76
6 2
4,06
6 2
6,88
6 5
,565
6
,390
(1
,030
) (2
47)
-1.0
-0.2
56.0
-76.
0-5
1.2
-213
.6-2
0.4
-18.
611
.19.
539
.88.
7-2
.69.
0
Hath
way
Cab
leM
edia
245
37,
187
15,
734
22,
845
3,2
86
6,0
28
(823
) 1
,003
-5
.66.
6-6
.2-2
18.2
-43.
837
.14.
03.
714
.48.
9-9
.210
.01.
07.
7
Hind
alco
Inds
Met
als
141
291
,626
8
39,3
51
942
,250
8
3,02
8 1
03,9
72
24,
848
23,
802
12.0
11.5
-23.
9-4
.211
.712
.30.
70.
710
.38.
66.
45.
84.
04.
3
NALC
O M
etal
s40
102
,316
6
6,68
3 7
2,62
4 9
,126
1
1,96
1 6
,834
8
,591
2.
73.
315
.325
.715
.011
.90.
80.
86.
65.
35.
66.
85.
16.
2
Hind
usta
n Zi
ncM
etal
s13
0 5
49,7
14
134
,590
1
36,6
42
69,
615
67,
705
69,
663
67,
680
16.5
16.0
0.7
-2.8
7.9
8.1
1.5
1.3
4.2
3.7
18.6
15.9
18.6
15.9
Tata
Ste
elM
etal
s42
6 4
13,6
41
1,4
84,3
24
1,5
38,7
20
157
,001
1
72,8
54
36,
801
36,
567
37.8
37.6
1005
.6-0
.611
.311
.31.
11.
16.
96.
510
.19.
46.
46.
3
JSW
Ste
elM
etal
s11
16 2
69,8
10
498
,936
5
24,6
69
91,
138
104
,815
2
3,77
1 2
9,09
3 98
.312
1.2
57.5
23.3
11.4
9.2
1.3
1.1
6.5
5.7
11.3
12.3
5.2
8.6
SAIL
Met
als
72 2
95,7
13
463
,345
5
11,9
13
43,
534
59,
861
19,
639
19,
884
4.8
4.8
-16.
71.
215
.114
.90.
70.
711
.89.
54.
64.
54.
63.
8
Sesa
Ste
rlite
Met
als
193
572
,330
6
40,9
87
838
,983
2
11,0
86
306
,021
6
0,16
5 8
1,95
2 20
.327
.6-2
3.4
36.2
9.5
7.0
0.8
0.7
5.6
3.5
8.4
10.4
14.5
10.4
Jind
al S
teel
& P
ower
Met
als
273
250
,176
2
02,5
39
267
,549
6
1,18
9 8
5,24
7 2
0,02
3 2
1,84
8 21
.423
.4-3
1.2
9.1
12.8
11.7
1.1
1.0
9.4
6.5
8.7
8.7
5.2
5.7
Jind
al S
awM
etal
s58
16,
035
65,
531
70,
919
6,4
74
7,7
51
1,5
72
2,2
22
5.7
8.0
-13.
441
.410
.27.
20.
40.
410
.49.
24.
15.
63.
64.
1
Note
: For
ban
ks, E
BITD
A is
pre-
prov
ision
pro
fit

35GROUND ZERO GROUND ZERO 1 - 31 May 2014 1- 31 May 2014 34
Note
: For
ban
ks, E
BITD
A is
pre-
prov
ision
pro
fit
CMP
Mkt
Cap
Ne
t Sal
es
EBID
TA
PAT
EPS
(Rs)
EPS
Grow
th (%
) P
/E (x
) P
/B (x
) EV
/EBI
TDA
(x)
ROE
(%)
ROCE
(%)
Nam
e of
com
pany
Sect
orRs
Rs m
nFY
14E
FY15
EFY
14E
FY15
EFY
14E
FY15
EFY
14E
FY15
EFY
14E
FY15
EFY
14E
FY15
EFY
14E
FY15
EFY
14E
FY15
EFY
14E
FY15
EFY
14E
FY15
E
ONGC
Oil &
Gas
321
2,7
48,8
79
1,7
42,8
64
1,9
20,1
85
585
,001
7
26,3
30
278
,691
3
31,9
20
32.6
38.8
15.1
19.1
9.9
8.3
1.7
1.5
4.9
3.9
17.6
18.3
12.6
14.5
Petro
net L
NGOi
l & G
as14
0 1
05,2
25
384
,540
4
59,7
07
14,
881
18,
121
7,0
71
8,0
36
9.4
10.7
-38.
513
.714
.913
.12.
11.
98.
67.
114
.314
.69.
89.
8
Cairn
Indi
aOi
l & G
as33
5 6
38,7
70
188
,439
1
81,0
06
141
,607
1
30,1
21
117
,750
1
07,0
13
61.9
56.3
2.0
-9.1
5.4
5.9
1.1
1.0
4.4
4.4
20.5
16.4
21.8
16.0
GAIL
Oil &
Gas
371
470
,986
5
86,3
57
592
,534
7
2,42
0 7
9,47
7 4
8,09
2 4
7,64
9 35
.937
.613
.14.
710
.49.
91.
71.
57.
76.
716
.615
.512
.811
.6
Indr
apra
stha
Gas
Oil &
Gas
286
40,
047
39,
432
46,
838
7,9
97
8,2
93
3,6
76
3,8
98
26.3
27.8
3.8
6.0
10.9
10.3
2.3
2.0
5.3
4.9
22.6
20.6
16.6
15.4
Guja
rat S
tate
Pet
rone
tOi
l & G
as73
41,
108
10,
770
10,
731
9,9
19
9,8
67
4,8
83
4,8
58
8.7
8.6
0.1
-0.5
8.4
8.5
1.2
1.1
5.7
5.6
15.3
13.5
9.7
8.3
HSIL
Ltd
Othe
r14
7 9
,725
1
7,75
9 2
0,23
1 2
,313
2
,976
3
87
732
5.
911
.1-3
3.7
89.0
25.1
13.3
0.9
0.9
8.2
6.3
3.7
6.8
2.2
4.1
Gree
nply
Indu
strie
sOt
her
409
9,8
72
21,
665
23,
853
2,7
95
3,0
06
1,1
24
1,2
40
46.6
51.4
-1.5
10.4
8.8
8.0
1.7
1.4
5.7
5.2
19.3
17.8
12.4
12.6
Tran
sfor
mer
s & R
ectifi
ers
Othe
r11
4 1
,638
6
,659
7
,216
3
30
432
1
32
192
10
.214
.917
8.9
45.3
11.2
7.7
0.4
0.4
8.4
6.4
3.8
5.3
4.4
5.6
Kaja
ria C
eram
icsOt
her
437
33,
060
18,
603
22,
051
2,7
16
3,4
18
1,1
61
1,5
30
15.4
20.2
8.1
31.7
28.5
21.6
6.7
5.4
12.9
10.2
23.4
24.9
26.2
29.2
Have
lls Lt
dOt
her
952
118
,886
4
7,52
0 5
3,16
5 6
,409
7
,283
4
,645
5
,284
37
.242
.325
.113
.725
.622
.55.
34.
517
.715
.220
.920
.021
.720
.8
Auro
bind
o Ph
arm
aPh
arm
a58
9 1
71,6
97
77,
683
116
,931
1
8,17
8 1
8,82
6 1
1,23
3 1
1,43
5 38
.639
.315
9.7
1.8
15.3
15.0
4.7
3.6
11.3
11.2
30.7
24.1
21.3
17.7
Bioc
onPh
arm
a47
6 9
5,18
0 2
7,97
9 3
3,21
0 6
,878
7
,927
4
,333
5
,176
21
.725
.924
.419
.522
.018
.43.
12.
813
.812
.113
.715
.212
.013
.2
Cadi
la H
ealth
care
Phar
ma
982
201
,155
7
0,12
0 8
1,34
0 1
2,09
7 1
5,43
0 7
,395
9
,614
36
.147
.010
.430
.027
.220
.95.
95.
018
.714
.621
.824
.013
.015
.3
Divi
's La
bora
torie
sPh
arm
a13
97 1
85,4
50
25,
319
30,
991
10,
432
12,
489
7,8
38
9,4
60
59.1
71.4
30.5
20.7
23.6
19.6
6.0
4.8
17.5
14.5
25.2
24.5
0.0
0.0
Dr R
eddy
's La
bs.
Phar
ma
2672
454
,398
1
32,8
81
155
,422
3
2,95
4 3
7,30
1 2
0,85
8 2
3,79
7 12
2.6
139.
923
.314
.121
.819
.15.
04.
014
.412
.522
.821
.115
.315
.3
Glen
mar
k Ph
arm
aPh
arm
a58
1 1
57,4
72
59,
847
69,
994
12,
810
15,
472
6,9
65
8,7
43
25.7
32.3
11.1
25.5
22.6
18.0
4.8
3.9
13.8
11.2
21.3
21.4
11.9
15.4
Ipca
Labo
rato
ries
Phar
ma
820
103
,516
3
1,63
2 3
7,01
6 8
,066
9
,477
5
,097
6
,110
40
.748
.829
.619
.920
.216
.85.
14.
013
.611
.525
.423
.820
.920
.6
Lupi
nPh
arm
a99
9 4
48,0
62
110
,145
1
33,1
89
27,
610
33,
251
16,
635
19,
933
37.2
44.5
25.4
19.8
26.9
22.4
6.7
5.3
16.2
13.2
25.1
23.8
31.4
30.9
Sun
Phar
ma
Phar
ma
635
1,3
15,5
64
159
,338
1
78,0
15
70,
373
75,
376
50,
886
52,
098
24.6
25.2
40.0
2.4
25.9
25.3
6.8
5.5
18.0
16.4
26.3
22.0
25.5
20.7
Phoe
nix
Mill
s Re
al E
state
252
36,
487
12,
165
15,
674
5,6
34
7,7
98
2,2
04
3,4
70
15.2
24.0
168.
857
.516
.610
.51.
71.
710
.17.
311
.315
.48.
110
.1
DLF
Real
Esta
te15
4 2
74,4
33
83,
499
102
,193
2
8,52
9 3
6,26
2 8
,199
9
,484
4.
85.
67.
015
.732
.127
.70.
90.
916
.513
.12.
83.
25.
15.
4
Unite
ch Lt
dRe
al E
state
17 4
4,94
4 2
7,84
4 3
2,50
5 5
,012
7
,586
3
,244
5
,141
1.
22.
054
.858
.513
.98.
70.
40.
419
.913
.02.
84.
32.
02.
9
Ober
oi R
ealty
Real
Esta
te21
7 7
1,35
8 6
,748
1
6,87
5 3
,871
9
,474
2
,953
6
,284
9.
019
.1-4
1.5
112.
824
.211
.41.
61.
517
.38.
46.
813
.16.
913
.8
Futu
re R
etai
lRe
tail
129
28,
899
117
,347
1
05,2
09
10,
327
9,8
90
(179
) 3
03
-0.8
1.3
-126
.0-2
69.6
-167
.698
.80.
90.
97.
88.
7-0
.50.
94.
44.
3
Shop
pers
Sto
pRe
tail
361
30,
062
38,
393
46,
532
1,1
85
1,8
89
(76)
216
-0
.92.
6-2
7.7
-385
.0-3
96.1
139.
06.
15.
831
.019
.6-1
.54.
2-1
.22.
9
Raym
ond
Ltd
Reta
il31
2 1
9,13
5 4
4,90
8 5
0,61
4 4
,895
5
,821
1
,413
2
,029
23
.033
.114
5.0
43.5
13.5
9.4
1.3
1.1
6.7
5.4
9.5
12.1
7.8
9.1
Bata
Indi
aRe
tail
1098
70,
565
20,
319
24,
512
2,8
87
3,9
46
1,6
77
2,5
39
26.1
39.5
-2.5
51.3
42.1
27.8
8.4
6.8
23.6
16.4
20.0
24.5
20.6
27.1
Tita
n Co
mpa
nyRe
tail
258
229
,138
1
11,5
93
124
,509
1
0,60
1 1
2,70
0 7
,342
8
,717
8.
39.
81.
318
.731
.226
.39.
07.
221
.817
.932
.630
.429
.524
.2
Tren
tRe
tail
985
32,
726
25,
290
30,
836
643
1
,471
4
10
1,0
12
12.3
30.4
78.7
146.
879
.932
.42.
62.
453
.823
.33.
27.
32.
95.
9
Bhar
ti Ai
rtel
Tele
com
338
1,3
50,7
21
862
,528
9
62,6
25
278
,232
3
15,4
23
20,
626
54,
185
5.2
13.5
107.
216
2.7
65.5
24.9
2.4
2.1
7.0
5.8
3.6
8.5
4.7
6.6
Relia
nce
Com
mun
icatio
nsTe
leco
m13
2 2
72,1
42
217
,643
2
31,5
52
74,
698
81,
152
10,
638
17,
083
5.2
8.3
42.6
60.6
25.6
15.9
0.9
0.9
8.5
7.3
3.6
5.4
4.0
4.3
Bhar
ti In
frate
lTe
leco
m21
3 4
03,0
82
65,
790
73,
406
43,
929
49,
327
15,
107
17,
791
8.0
9.4
51.0
17.8
26.7
22.6
2.2
2.2
10.4
7.5
8.4
9.8
7.3
8.0
Idea
Cel
lula
rTe
leco
m14
1 4
67,2
38
265
,189
3
05,2
94
83,
336
99,
943
18,
513
18,
821
5.2
5.3
71.7
1.7
26.8
26.4
3.0
2.3
8.0
7.5
11.2
8.5
7.1
6.3
OnM
obile
Glo
bal
Tele
com
36 4
,072
8
,970
1
0,36
1 1
,569
2
,207
2
41
626
2.
05.
1-5
2.1
159.
918
.06.
90.
40.
41.
40.
62.
45.
82.
65.
8
Tata
Com
mun
icatio
nTe
leco
m30
5 8
6,82
5 1
94,4
99
213
,875
3
0,61
7 3
6,73
1 2
,577
6
,356
9.
022
.3-1
35.4
146.
733
.713
.75.
54.
16.
45.
016
.330
.04.
56.
0
Phill
ipC
apita
l Ind
ia C
over
age
Uni
vers
e: V
alua
tio
n Su
mm
ary

35GROUND ZERO GROUND ZERO 1 - 31 May 2014 1- 31 May 2014 34
Disclosures and Disclaimers
PhillipCapital (India) Pvt. Ltd. has three independent equity research groups: Institutional Equities, Institutional Equity Derivatives and Private Client Group. This report has been prepared by Institutional Equities Group. The views and opinions expressed in this document may or may not match or may be contrary at times with the views, estimates, rating, target price of the other equity research groups of PhillipCapital (India) Pvt. Ltd.
This report is issued by PhillipCapital (India) Pvt. Ltd. which is regulated by SEBI. PhillipCapital (India) Pvt. Ltd. is a subsidiary of Phillip (Mauritius) Pvt. Ltd. References to "PCIPL" in this report shall mean PhillipCapital (India) Pvt. Ltd unless otherwise stated. This report is prepared and distributed by PCIPL for information purposes only and neither the information contained herein nor any opinion expressed should be construed or deemed to be construed as solicitation or as offering advice for the purposes of the purchase or sale of any security, investment or derivatives. The information and opinions contained in the Report were considered by PCIPL to be valid when published. The report also contains information provided to PCIPL by third parties. The source of such information will usually be disclosed in the report. Whilst PCIPL has taken all reasonable steps to ensure that this information is correct, PCIPL does not offer any warranty as to the accuracy or complete-ness of such information. Any person placing reliance on the report to undertake trading does so entirely at his or her own risk and PCIPL does not accept any liability as a result. Securities and Derivatives markets may be subject to rapid and unexpected price movements and past performance is not necessarily an indication to future performance.
This report does not have regard to the specific investment objec-tives, financial situation and the particular needs of any specific person who may receive this report. Investors must undertake independent analysis with their own legal, tax and financial advisors and reach their own regarding the appropriateness of investing in any securities or investment strategies discussed or recommended in this report and should understand that statements regarding future prospects may not be realized. In no circumstances it be used or considered as an offer to sell or a solicitation of any offer to buy or sell the Securities mentioned in it. The information contained in the research reports may have been taken from trade and statistical services and other sources, which we believe are reliable. PhillipCapital (India) Pvt. Ltd. or any of its group/associate/affiliate companies do not guarantee that such information is accurate or complete and it should not be relied upon as such. Any opinions expressed reflect judgments at this date and are subject to change without notice
Important: These disclosures and disclaimers must be read in conjunction with the research report of which it forms part. Receipt and use of the research report is subject to all aspects of these disclosures and disclaimers. Additional information about the issuers and securities discussed in this research report is available on request.
Certifications: The research analyst(s) who prepared this research report hereby certifies that the views expressed in this research report accurately reflect the research analyst’s personal views about all of the subject issuers and/or securities, that the analyst have no known conflict of interest and no part of the research analyst’s compensation was, is or will be, directly or indirectly, related to the specific views or recommen-dations contained in this research report. The Research Analyst certifies that he /she or his / her family members does not own the stock(s) covered in this research report.
Independence: PhillipCapital (India) Pvt. Ltd. has not had an investment banking relationship with, and has not received any compensation for investment banking services from, the subject issuers in the past twelve (12) months, and PhillipCapital (India) Pvt. Ltd does not anticipate receiving or intend to seek compensation for investment banking services from the subject issuers in the next three (3) months.
PhillipCapital (India) Pvt. Ltd is not a market maker in the securities mentioned in this research report, although it or its affiliates may hold either long or short positions in such securities. PhillipCapital (India) Pvt. Ltd does not hold more than 1% of the shares of the company(ies) covered in this report.
Suitability and Risks: This research report is for informational purposes only and is not tailored to the specific investment objectives, financial situation or particular requirements of any individual recipient hereof. Certain securities may give rise to substantial risks and may not be suitable for certain investors. Each investor must make its own deter-mination as to the appropriateness of any securities referred to in this research report based upon the legal, tax and accounting considerations applicable to such investor and its own investment objectives or strate-gy, its financial situation and its investing experience. The value of any security may be positively or adversely affected by changes in foreign exchange or interest rates, as well as by other financial, economic or political factors. Past performance is not necessarily indicative of future performance or results.
Sources, Completeness and Accuracy: The material herein is based upon information obtained from sources that PCIPL and the research analyst believe to be reliable, but neither PCIPL nor the research analyst represents or guarantees that the information contained herein is accurate or complete and it should not be relied upon as such. Opinions expressed herein are current opinions as of the date appearing on this material and are subject to change without notice. Furthermore, PCIPL is under no obligation to update or keep the information current.
Copyright: The copyright in this research report belongs exclusively to PCIPL. All rights are reserved. Any unauthorized use or disclosure is prohibited. No reprinting or reproduction, in whole or in part, is permit-ted without the PCIPL’s prior consent, except that a recipient may reprint it for internal circulation only and only if it is reprinted in its entirety.
Caution: Risk of loss in trading in can be substantial. You should carefully consider whether trading is appropriate for you in light of your experience, objectives, financial resources and other relevant circumstances.
For U.S. persons only: This research report is a product of Phillip-Capital (India) Pvt Ltd. which is the employer of the research analyst(s) who has prepared the research report. The research analyst(s) preparing the research report is/are resident outside the United States (U.S.) and are not associated persons of any U.S. regulated broker-dealer and therefore the analyst(s) is/are not subject to supervision by a U.S. broker-dealer, and is/are not required to satisfy the regulatory licensing requirements of FINRA or required to otherwise comply with U.S. rules or regulations regarding, among other things, communications with a subject company, public appearances and trading securities held by a research analyst account.
This report is intended for distribution by PhillipCapital (India) Pvt Ltd. only to "Major Institutional Investors" as defined by Rule 15a-6(b)(4) of the U.S. Securities andExchange Act, 1934 (the Exchange Act) and interpretations thereof by U.S. Securities and Exchange Commission (SEC) in reliance on Rule 15a 6(a)(2). If the recipient of this report is not a Major Institutional Investor as specified above, then it should not act upon this report and return the same to the sender. Further, this report may not be copied, duplicated and/or transmitted onward to any U.S. person, which is not the Major Institutional Investor.
In reliance on the exemption from registration provided by Rule 15a-6 of the Exchange Act and interpretations thereof by the SEC in order to conduct certain business with Major Institutional Investors, PhillipCapi-tal (India) Pvt Ltd. has entered into an agreement with a U.S. registered broker-dealer, Marco Polo Securities Inc. ("Marco Polo").Transactions in securities discussed in this research report should be effected through Marco Polo or another U.S. registered broker dealer

PBGROUND ZERO GROUND ZERO 1 - 31 May 2014 1- 31 May 2014 36