pg 42. INTERVIEW: Dhruv Goel, MD, SteelMint pg 45....
52
15 TH – 30 TH Nov 2014 . Vol 1 Issue 11 . For Private Circulation Only pg 42. INTERVIEW: Dhruv Goel, MD, SteelMint pg 45. Indian Economy – Trend indicators
Transcript of pg 42. INTERVIEW: Dhruv Goel, MD, SteelMint pg 45....
15TH – 30TH Nov 2014 . Vol 1 Issue 11 . For Private Circulation Only
pg 42. INTERVIEW: Dhruv Goel, MD, SteelMint
pg 45. Indian Economy – Trend indicators

3GROUND ZERO GROUND ZERO 15 - 30 Nov 2014 15 - 30 Nov 2014 2
VOL 1 . ISSUE 11 . 15TH - 30TH NOV 2014
Vineet Bhatnagar- Managing Director and CEO
EDITORIAL BOARD:Naveen Kulkarni Manish AgarwallaKinshuk Bharti Tiwari Dhawal Doshi
COVER & MAGAZINE DESIGN Chaitanya Modak, www.inhousedesign.co.in
FOR EDITORIAL QUERIES:PhillipCapital (India) Private LimitedNo. 1, 18th Floor, Urmi Estate, 95 Ganpatrao Kadam Marg, Lower Parel West, Mumbai 400 013
RESEARCH Automobiles Dhawal Doshi, Priya Ranjan
Banking, NBFCs Manish Agarwalla, Pradeep Agrawal, Paresh Jain
Consumer, Media, Telecom Naveen Kulkarni, Jubil Jain, Manish Pushkar
Cement Vaibhav Agarwal
Economics Anjali Verma
Engineering, Capital Goods Ankur Sharma, Hrishikesh Bhagat
Infrastructure & IT Services Vibhor Singhal, Varun Vijayan
Metals Dhawal Doshi, Ankit Gor
Mid-caps Vikram Suryavanshi
Oil & Gas, Agri Inputs Gauri Anand, Deepak Pareek
Pharmaceuticals Surya Patra
Retail, Real Estate Abhishek Ranganathan, Neha Garg
Technicals Subodh Gupta
Production Manager Ganesh Deorukhkar
Database Manager Vishal Randive
Sr. Manager – Equities Support Rosie Ferns
SALES & DISTRIBUTION Kinshuk Tiwari, Ashvin Patil, Shubhangi Agrawal, Kishor Binwal, Sidharth Agrawal, Bhavin Shah, Dipesh Sohani, Varun Kumar
CORPORATE COMMUNICATIONS Zarine Damania
GROUND ZERO - PREVIOUS ISSUES
16th Aug 2014 Issue 8
1st Sep 2014 Issue 9
1st July 2014 Issue 6
1st Aug 2014 Issue 7
16th June 2014 Issue 5
1st Oct 2014 Issue 10

3GROUND ZERO GROUND ZERO 15 - 30 Nov 2014 15 - 30 Nov 2014 2
LETTER FROM THE MANAGING DIRECTORThe latest buzz in retail is ecommerce or etailing
as many call it and it has already reached most
cities in India, even the smaller ones. The Indian
ecommerce market has grown at a rapid pace over
the last couple of years and customers are excited,
investors are bullish, and competition is now taking
it very very seriously. What was once considered
the ‘little brother’ of Indian retail now seems a lot
bigger, accounting for nearly 10% of organised re-
tail in a fragmented market. In October 2014, US$
300mn worth of goods are estimated to have been
sold in a series of big online shopping events held
by major etailers in India.
With ecommerce grabbing headlines in India like
never before and offline retailers raring to go on-
line, we publish our cover story on ecommerce and
omni-channel retailing. The story “Offline retail:
‘Omni’ous or Oblivious to Online?” penned by re-
tail analysts Abhishek Ranganathan and Neha Garg
is an interesting analysis of the Indian ecommerce
market, the business models of these players, and
the way ahead for offline retailers. The story pro-
vides insights on the dynamics of etailing in India
as well as China and the lessons that may lead to
the evolution of a sustainable business model. Until
then, let’s enjoy the deep discounts.
Along with the etail story, we have interviewed Mr
Dhruv Goel, MD SteelMint. He highlights various
challenges and logistical constraints faced by the
steel industry due to the mining restrictions in vari-
ous states in India.
Best Wishes
Vineet
4. COVER STORY: Offline retail: ‘Omni’ous or Oblivious to Online?
Ground Zero evaluates the ecommerce business models, the dynamics, the threats and opportunities to offline. With many offline retailers looking to bridge the ‘online’ gap, we look at the viability of an omni-channel strategy
42. INTERVIEW: Dhruv Goel, MD, SteelMint
Highlights operating challenges for steel producers post mining restrictions in iron ore
45. Indian Economy – Trend indicators
47. PhillipCapital Coverage Universe: Valuation Summary
CONTENTS

5GROUND ZERO GROUND ZERO 15 - 30 Nov 2014 15 - 30 Nov 2014 4
Various shopping apps now bring the store to the consumer anywhere and anytime

5GROUND ZERO GROUND ZERO 15 - 30 Nov 2014 15 - 30 Nov 2014 4
COVER STORY
Online retailing or ecommerce is catching fire in India — while it is less than 1% of overall
Indian retail, it is already 10% of organized retail and many predict it will be 8% of the total
retail market by 2020!! Chinese online ecommerce giant Alibaba’s success seems to have
spurred Indian ecommerce players. As the competition hots up, we take a good look at
the Indian ecommerce market, its leading players, and their business models including
the viability of what all of us love — discounts. We try to understand if Alibaba’s business
model may have lessons for Indian retailers. We came across uncanny similarities between
offline and online retailers, despite their many differences. The fundamentals of doing
business online are not radically different from offline and the laws of economics will catch
up with the former as well. With many offline retailers looking to bridge the ‘online’ gap,
we looked at the viability of an omni-channel strategy, deployed successfully in developed
countries. The competition to offline is real and business models will have to evolve — it
will be an ominous threat to those who are oblivious. The online retailers’ products may be
delivered in a day, but a winner will not emerge so quickly — out of the rollercoaster ride
of discounts, mega sales, and promotions may emerge a business model that is unique to
India, just as Alibaba’s is unique to China.
BY ABHISHEK RANGANATHAN & NEHA GARG
pg. 6 Ecommerce in India Drivers of e-biz models: opportunities and discounts galore___________________________________________pg.18 The Chinese Ecommerce Market Lessons from Alibaba for Indian retailers – offline & online___________________________________________pg.24 Building an Omni Channel Necessity driven by competition but is it for every offline retailer?___________________________________________pg.30 Ecommerce vs. Physical stores The battle has just begun - discounts and funding to continue___________________________________________pg.34 Every battle has its winners & losers Shop till you drop or till the website drops – sustainability remains ignored___________________________________________

7GROUND ZERO GROUND ZERO 15 - 30 Nov 2014 15 - 30 Nov 2014 6
The words ‘retail therapy’ or ‘going
shopping’ were long associated with
physical, brick-and-mortar retail. But
with stores and brands going clicky
(websites) and appy (mobile apps) these terms
have already widened to accommodate online
shopping. Over the last couple of years, the
Indian ecommerce space has filled up with home-
grown players such as Flipkart, Snapdeal, and the
big daddy of ecommerce, Amazon. Online shop-
ping has captured the imagination and attention
of consumers, media, brick-and-mortar players,
brands, and of late, even the tax authorities and
the government.
Various studies estimate Indian ecommerce to
be about US$ 3bn as of now, which is just 0.8%
Drivers of e-biz models: opportunities and discounts galore
E C O M M E R C E I N I N D I A
of the Indian retail market. However, this share is
expected to increase rapidly as more people shop
online. Of the 200mn people in India who access
the internet, 28-30mn (less than 3% of India’s
population) shop online. However, this number
can move up to touch 100mn by 2015 and a
whopping 200mn by 2017, which is the same as
the number of Indian internet users in India today.
Nitin Bawankule, Director, Google India Ecom-
merce, says that, “Even now, there are at least
200mn people who can purchase online in India”.
The market is redefining itself rapidly as etailers
advertise, reach out, and offer deals and discounts
to consumers.
Growth drivers for ecommerce — growing internet users Current online spending
So how big is the Indian Retail market?
During GOSF 2013 (held over three days in December 2013), over 60mn people visited online shopping sites and 16mn unique customers shopped at the event. Myntra.com claimed that it made over 100,000 shipments for orders placed in those three days.
Sour
ce: E
urom
onito
r Int
erna
tiona
l
Source: KPMG

7GROUND ZERO GROUND ZERO 15 - 30 Nov 2014 15 - 30 Nov 2014 6
An interesting example of increasing online shop-
ping is the Great Online Shopping Festival (GOSF)
hosted by Google. During GOSF 2013 (held over
three days in December 2013), over 60mn people
visited online shopping sites and 16mn unique cus-
tomers shopped at the event. Myntra.com claimed
that it made over 100,000 shipments for orders
placed in those three days.
The average Indian online buyer is between the
ages of 25 and 30 and ‘affluent’ — he/she has
access to websites seamlessly through personal
computers and smart phones. Interestingly, the
share of tier-2 and tier-3 cities is higher for most
online players. Snapdeal claims that over 60% of
the orders to its website are from tier-2 and tier-3
Rise in internet penetration
Particulars 2009 2010 2011 2012 2013 2017-20(E)
E-tailing ($ bn) 3.8 5.3 7 9.5 12.6 40-50% CAGR
E-commerce 0.4 0.6 1 1.5 2.3 10-20% CAGRSource: Crisil, IAMAI, PwC analysis and Industry experts
Industry growth forecast for e-commerce
Who is buying online?
cities. Even in the case of pure-play apparel players
such as Jabong, these statistics hold true — 62% of
Jabong’s shipments in Q2FY14 were to tier-2 and
tier-3 markets. This demand is driven by the fact that
many of the brands have limited presence in tier-2
and tier-3 markets due to shortage of quality retail
space or unviable economics, given limited popula-
tion in a location.
Interestingly, the share of tier-2 and tier-3 cities is higher for most online players .62% of Jabong’s shipments in Q2FY14 were to tier-2 and tier-3 markets.
No. of SKUs 139,000
Brands 1,600
Lifestyle Category 9
Facebook followers (mn) 3.2
Postal codes covered 12,000
Order rate on same day delivery 70%
Share of Tier-2 & 3 cities 62%
Current share of sales from smart phones 27%
Monthly average visits using mobile devices (mn) 14 Source: Company, PhillipCapital research
Snapshot of Jabong’s operations
Jabong’s growing orders per day
Sour
ce:
KPM
G
Sour
ce: C
ompa
ny, P
hilli
pCap
ital r
esea
rch

9GROUND ZERO GROUND ZERO 15 - 30 Nov 2014 15 - 30 Nov 2014 8
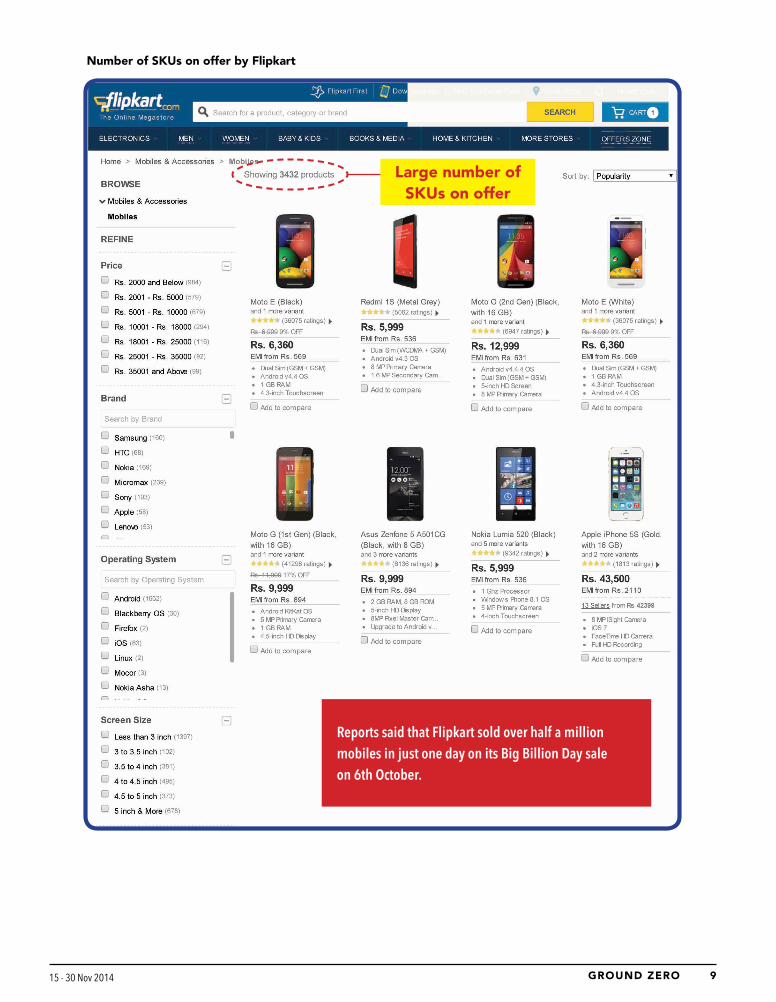
What are Indians buying online?
Electronics and CDIT (consumer durables informa-
tion technology) products dominate the current
online buying space. In terms of value, electronics is
the largest category — it has a 47% share of the on-
line retail market. Within electronics, mobile phones,
laptops, tablets, and cameras are big purchases. A
large logistics company that partners with ecom-
merce players for deliveries said that electronics (and
particularly mobiles) form a very large share of their
deliveries. Reports said that Flipkart sold over half a
million mobiles in just one day on its Big Billion Day
sale on 6th October. Flipkart and Snapdeal list over
3,000 stock-keeping units (SKUs) and 5,000 SKUs of
mobiles respectively on their portals. The average
ticket size in electronics is estimated to be Rs 5,000.
Apparels, footwear, and accessories are the next
largest categories bought online, with a 31% share.
While this category has a lower share (in value
terms) than electronics, it clocks the highest volume
amongst all categories. The average ticket size in
this segment is around Rs 2,000. The rest of the
online pie is fragmented between books, home
furnishing, baby products and others.
Share of overall retail market, 2013
Online retail market-Category break-up (by value), 2014
Jabong has had the number of its unique visitors double in the last 2 years
Sour
ce: C
ompa
ny, P
hilli
pCap
ital r
esea
rch
Source: KPMG
Source: Technopak Analysis
Jabong’s category wise revenue-mix
Source: Company, PhillipCapital research
9GROUND ZERO GROUND ZERO 15 - 30 Nov 2014 15 - 30 Nov 2014 8
Reports said that Flipkart sold over half a million mobiles in just one day on its Big Billion Day sale on 6th October.
Number of SKUs on offer by Flipkart
Large number of SKUs on offer

11GROUND ZERO GROUND ZERO 15 - 30 Nov 2014 15 - 30 Nov 2014 10
India’s online market comprises of various players
with different models. Players that retail pretty much
everything from electronics to FMCG products
follow a version of the ‘marketplace’ model. Amazon
and Snapdeal operate on this kind of a model where
their role is to facilitate the sale and fulfil it — that is
handle logistics, deliveries, and returns. In this mod-
el, the portals do not hold any inventory on their
books. Flipkart used to operate on a hybrid model,
where it held its own inventory and also acted as a
The categories, the major players, and business models
Number of SKUs on offer by Snapdeal
marketplace. However, it has now moved to a mar-
ketplace model, albeit with far lower sellers/vendors
than Amazon or Snapdeal, since WS Retail (erstwhile
Flipkart group company) still contributes a significant
portion of its sales. Vendors and sellers usually sign
up with these marketplace online retailers for a fee,
depending on the category.
Players such as Myntra and Jabong, which are
primarily apparel portals, have an inventory model.
They have moved to a hybrid market place, but it is
still skewed towards the inventory-led model.
Mobiles is a major category here as well
Vendors and sellers usually sign up with these marketplace online retailers for a fee, depending on the category.
11GROUND ZERO GROUND ZERO 15 - 30 Nov 2014 15 - 30 Nov 2014 10
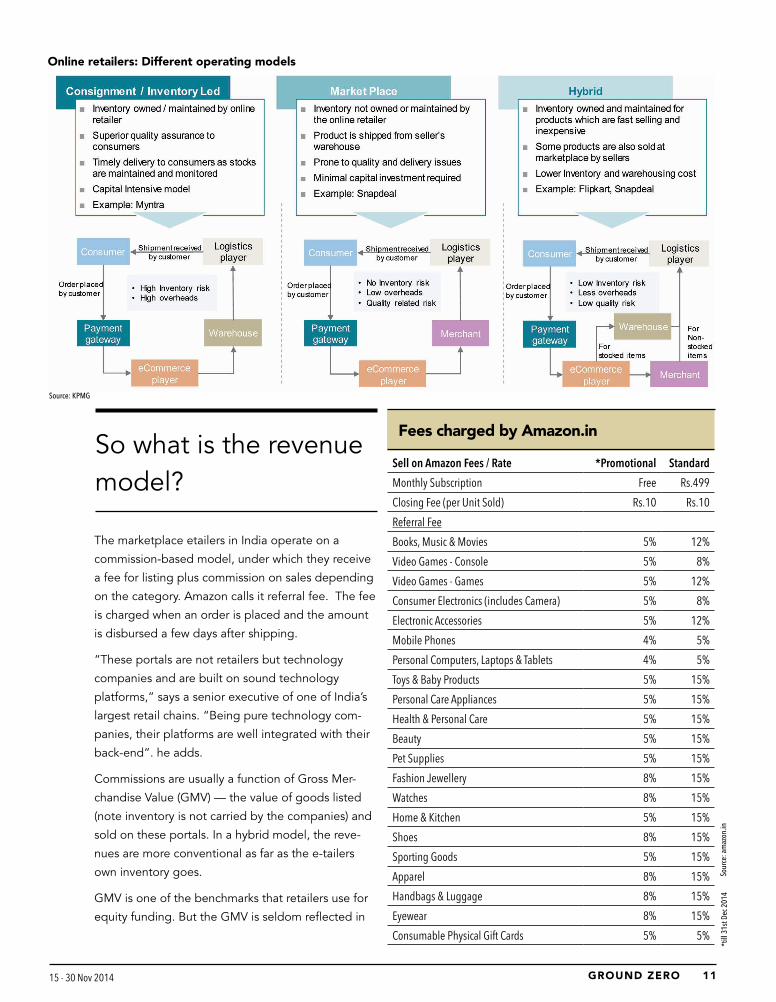
So what is the revenue model?
The marketplace etailers in India operate on a
commission-based model, under which they receive
a fee for listing plus commission on sales depending
on the category. Amazon calls it referral fee. The fee
is charged when an order is placed and the amount
is disbursed a few days after shipping.
“These portals are not retailers but technology
companies and are built on sound technology
platforms,” says a senior executive of one of India’s
largest retail chains. “Being pure technology com-
panies, their platforms are well integrated with their
back-end”. he adds.
Commissions are usually a function of Gross Mer-
chandise Value (GMV) — the value of goods listed
(note inventory is not carried by the companies) and
sold on these portals. In a hybrid model, the reve-
nues are more conventional as far as the e-tailers
own inventory goes.
GMV is one of the benchmarks that retailers use for
equity funding. But the GMV is seldom reflected in
Online retailers: Different operating models
Sell on Amazon Fees / Rate *Promotional Standard
Monthly Subscription Free Rs.499
Closing Fee (per Unit Sold) Rs.10 Rs.10
Referral Fee
Books, Music & Movies 5% 12%
Video Games - Console 5% 8%
Video Games - Games 5% 12%
Consumer Electronics (includes Camera) 5% 8%
Electronic Accessories 5% 12%
Mobile Phones 4% 5%
Personal Computers, Laptops & Tablets 4% 5%
Toys & Baby Products 5% 15%
Personal Care Appliances 5% 15%
Health & Personal Care 5% 15%
Beauty 5% 15%
Pet Supplies 5% 15%
Fashion Jewellery 8% 15%
Watches 8% 15%
Home & Kitchen 5% 15%
Shoes 8% 15%
Sporting Goods 5% 15%
Apparel 8% 15%
Handbags & Luggage 8% 15%
Eyewear 8% 15%
Consumable Physical Gift Cards 5% 5%
Fees charged by Amazon.in
*till
31s
t Dec
201
4
Source: KPMG
Sour
ce: a
maz
on.in

13GROUND ZERO GROUND ZERO 15 - 30 Nov 2014 15 - 30 Nov 2014 12
their books of accounts due to either the holding
structure (complicated in the case of Flipkart and
Myntra) or because revenue recognised is purely
commission based (Snapdeal). However, numbers
do talk and the numbers of some of the players
talk more and give us an interesting insight into the
operations of the sector.
GMV - Grossly misstated value?
GMV is before all discounts, couponing, vouchers,
and taxes. So when we read about a GMV of US$
100mn in a day or US$ 1bn, it is the gross value
of products before discounting and couponing.
But what the customer pays is net of all discounts,
vouchers, and coupons. GMV is open to interpreta-
tion and different retailers may compute it different-
ly. India, unlike many developed countries, follows
a maximum retail price (MRP) regime for sale of
goods. Discounts are offered on MRPs. But then,
one company may choose to compute GMV on MRP
while another may compute GMV on the list price
(MRP minus discounts that the brands/seller offers).
While MRP is relevant in most consumer products
sold anywhere in the country, it’s the least relevant
in electronics. When was the last time anyone sold
a mobile or a television or home appliance at MRP?
Since electronics form nearly 50% of the e-tail in
India, it is natural that the GMV calculated on MRP
will be skewed. GMV is reported on the current run
rate rather than the achieved figure. So GMVs for
Flipkart and Snapdeal could be misleading given the
high mix of electronics.
In e-tail shopping, there is almost always a coupon –
a coupon or a voucher code is essentially a discount
over and above the listed price, which may or may
not be discounted. These are at the discretion of the
e-tailer and not under the control of the brand. It’s
more commonly used by apparel e-tailers such as
Jabong and Myntra. It’s noteworthy that Flipkart and
Amazon seldom use couponing. One of the industry
observers said that, “Coupons are a mechanism of
customer acquisition and in apparels, the customer
doesn’t necessarily visit the website very frequently,
and to get him/her to do this, coupons are offered
regularly.”
Marketplaces such as Flipkart and Amazon, catering
to a large variety of products, rarely offer coupons
as the customer ends up visiting the site for some
category or the other. Apparels/fashion have the
maximum margin. Interestingly, GMV includes the
value of vouchers/coupons as well, which means
it is calculated before any coupons are offered to
the customer. As one of India’s largest retailers puts
it, “If it were net of any of these discounts then it
should be called net merchandising value not GMV.”
As one of India’s largest retailers puts it, “If it were net of any of these discounts then it should be called net merchandising value not GMV.” “If you don’t want a good price, we will still offer you a coupon.”
Portal Alexa Rankings for India
Categories Model No of Registered users (mn)
No of products on offer (mn)
GMV Rs mn)
Flipkart.com 5 Electonics, Apparel, Accessories, Footwear, General Merchandise, FMCG
Marketplace 22 15 40,000
Amazon.in 7 Electonics, Apparel, Accessories, Footwear, General Merchandise, FMCG
Marketplace 15 17 na
Snapdeal.com 10 Electonics, Apparel, Accessories, Footwear, General Merchandise, FMCG
Marketplace 20 5 30,000
Jabong.com 14 Apparel, Footwear and Accessories Hybrid 2.9 0.139 6,000
ebay.in 16 Electonics, Apparel, Accessories, Footwear, General Merchandise, FMCG
Marketplace 2.1 NA na
Myntra.com 30 Apparel, Footwear and Accessories Hybrid 1mn 0.05 4,000Source: Similarweb.com, media reports, PhillipCapital research
Website traffic for Indian e-commerce websites and product offering

13GROUND ZERO GROUND ZERO 15 - 30 Nov 2014 15 - 30 Nov 2014 12
How to avail of couponing…
How couponing happens …
Discounting at cart level by couponing
No discount at brand level

15GROUND ZERO GROUND ZERO 15 - 30 Nov 2014 15 - 30 Nov 2014 14
Couponing between rival portals is continuous. An
offline retailers said, “If you don’t want a good price,
we will still offer you a coupon.” What this means is
that even if a product is displayed on full price, the
customer is still offered a discount coupon when he
checks out his purchases (just before the payment
stage).
Show me the money
The underlying revenue model of most of the enti-
ties that operate e-tailing portals are commissions
and gross profits — if they also follow the hybrid
model. But the costs of e-tailing are intriguing and
they cause of a lot of heartburn to offline retailers as
well as brands. Contrary to perception that online
retail entails lower costs as there are no costs asso-
ciated with operating stores, these businesses have
high costs in the form of discounts, free delivery for
products (where cost of the product is sometimes
lower than delivery costs), and customer returns. In
e-tailing parlance, some of these costs are known as
‘customer acquisition costs’.
Customer acquisitions cost: In-fact, the largest cost
for e-tailers in a nascent ecommerce market such as
India is customer acquisition costs — this is because
it includes discounts offered on owned merchandise
or the cost of funding discounts in a marketplace
model. These discounts are offered over and above
the discounts offered by brands or sellers of the
product and are usually offered to customers in the
form of coupons. They are known as cart discounts
because they can be availed once the customer adds
the product to his or her cart. The discounts some-
times tantamount to losses at the gross level (trans-
action level) in the hybrid model; in a marketplace
model, they sometimes exceed the commissions that
the e-tailer earns. E-tailers bear these losses for cus-
tomer acquisition. However, these discounts are not
limited to a one-time purchase and are often open
for all — they don’t distinguish between old and
new customers. This implies that they are given not
only for customer acquisition but also for customer
retention. Of course, there are cases where coupons
are offered for registering on the portal. Clearly, the
e-tailers’ losses are the customer’s gains.
“The Prime Minister says ‘make in India’ ….but given
the recent funding the e-tailers have received, one
would imagine it’s the best time to Buy in India. It’s a
Investee company Amount raised (US$ mn)
Snapdeal 902
Flipkart 2,090
Amazon 2,000
Myntra 70
Jabong 240Source: Media Reports
Funding received till date by leading ecommerce players
“The Prime Minister says make in India….but given the recent funding the e-tailers have received, one would imagine it’s the best time to Buy in India. It’s a direct benefit transfer – from shareholders to customers,” says a senior executive of one of India’s largest retail chains.
Promotions to use mobile apps

15GROUND ZERO GROUND ZERO 15 - 30 Nov 2014 15 - 30 Nov 2014 14
For FY14 *Flip-kart
Myntra Snapdeal Jabong **Home shop 18
Revenue (Rs mn) 30,252 2,635 1,682 4,386 2,441
GMV (Rs mn) 40,000 4,000 30,000 6,000 9,988
Profit/Losses of E-tailers
(7,163) (26) (2,646) (2,934) (1,546)
Source: Company, Media reports, PhillipCapital Research. **FY13
Key metrics of leading ecommerce players
direct benefit transfer – from shareholder to custom-
ers,” says a senior executive of one of India’s largest
retail chains.
Discounting is the key driver to buy today. A
consumer will buy standardised products for con-
venience but the first greed is price. Mr Biyani of
Future Group explains, “Anything which sells in a
matter of seconds is usually a product where the
price is lower than the perceived value. For exam-
ple a Xiaomi mobile (which usually gets sold out in
seconds).”
But customer acquisition costs don’t end here. The
other significant costs are Search Engine Marketing
(SEM) costs. These are costs that ecommerce players
incur to direct traffic to their portals on leading
search engines such as Google. Typically, searches
for key words associated with the merchandise on
offer on a portal will direct the traffic to the portal.
For e.g., if one searches for ‘buy shoes’ online, the
search results will throw up names of portals that sell
shoes and to ensure that the e-tailer’s name appears
in the top-5 search results, or in the first page of
search results, these portals incur search engine
marketing costs.
“The Prime Minister says make in India….but given the recent funding the e-tailers have received, one would imagine it’s the best time to Buy in India. It’s a direct benefit transfer – from shareholders to customers,” says a senior executive of one of India’s largest retail chains.
Jabong (FY14) *Homeshop18 (FY13)
Revenue (Rs mn) 4,386 460
GMV (Rs mn) 6,000 3,056
Gross Profit (Rs mn) (447) 140
Gross Margins (rhs) -10% 30%
EBITDA (2,492) (259)
EBITDA Margins -57% -56%Source: Company, PhillipCapital Research *only internet segment
Operating metrics of Jabong and Homeshop18
One of the most interesting cases of SEM costs is
when flipkart.com ran its big billion day sale on 6th
October 2014. When one searched for “big billion
day” on Google the search actually led to amazon.
in instead of Flipkart!! – it seems like Amazon paid
Google to direct the search to their website.
Logistics costs
One of the peculiarities of the Indian ecommerce
market is the high share of cash on delivery (CoD)
orders. Unlike most other countries, the share of
prepaid orders is very low in India for many reasons.
Most buyers either don’t have a credit card or net
banking (not really surprising for a country where
more than 40% of the population doesn’t have bank
accounts). More than 50% of the orders that are
placed on Indian ecommerce websites are CoD
orders says Mr Bawankule of Google India. CoD
has inherent problems — it allows customers to
change their mind after their purchase has been
shipped and sometimes couriers have to wait for
customers to make a payment, which in some cases
may not happen quickly for want of ready cash.
Homeshop18’s return rate for COD and non-COD
Customer acquisition cost (as % of GMV) for HomeShop18 (internet segment) and gross commision as % of GMV
More than 50% of the orders that are placed on Indian ecommerce websites are CoD orders says Mr Bawankule of Google India.
Sour
ce: H
omes
hop1
8, P
hilli
pCap
ital R
esea
rch
*Flipkart (India) Pvt. Ltd. & Flipkart Internet Pvt. Ltd.

17GROUND ZERO GROUND ZERO 15 - 30 Nov 2014 15 - 30 Nov 2014 16
transactions was approximately 21.4% and 2.8% in
FY13, respectively. A logistics company executive
states that there are instances when the customer
doesn’t have ready cash at home and the courier
has to wait till he withdraws cash and returns home
for collecting the payment.
Adding to this complication is the reach of logistics
companies to various parts of the country. A KPMG
report estimates that most logistics companies ser-
vice around 6,000 area pin codes out of the 22,000
area pin codes in India (less than 30%). To overcome
this problem of reach, some online players such as
Flipkart and Amazon have established their own
logistics team alongside using third-party logistics
companies. However, the rationale for establishing
their own logistics network is not reach alone — an
executive with a leading logistics player said that
CoD deliveries (by third party logistics vendors) cost
more because they are more time consuming and
need checks and balances (given the cash handling).
Some of the checks and balances include mid-day
reconciliation and deposit of cash collected. There-
fore, the logistics companies are unable to make
optimum number of deliveries and this cost is billed
into the CoD orders. Moreover, air shipments (more
expensive) still constitute over 80% of the total
shipments.
This does make one wonder if operating your own
logistics is viable? The logistics executive’s view on
the matter is, “Actually own logistics is not profita-
ble as there is a fixed cost involved and it is seldom
able to make optimum orders given the complica-
tions of CoD. Our operations are tuned to make de-
liveries across a designated area irrespective of who
the shipper is, hence our efficiencies will be high.
The fundamental reason why ecommerce players
get into their own delivery logistics apart from han-
dling COD orders is working capital requirements.
Logistics companies can take anywhere between
5 days to 15 days to remit the cash collected on
delivery to the ecommerce players and that robs
them of working capital.” Given that most ecom-
merce companies are operating on losses, working
capital management becomes imperative. Mr Basrur,
Head eCommerce at Raymond Ltd (also one of
the founding members of Quikr.com – a classifieds
website) observes, “In-house logistics capabilities of
ecommerce players are not going to be too different
from those of third-party vendors. It’s a function of
where the product is (known as fulfilment centre) and
where the customer is. However, costs still may not
be justified for own logistics as number of deliveries
made are likely to be sub-optimum.”
Discounts, free delivery, cash on delivery, easy
returns — who wouldn’t want to be an online con-
sumer. But one of the main reasons why consumers
continue to flock online is the range of products
and the convenience of not having to step out of
your home and buying everything under one roof,
says Mr Bawankule of Google. While for a consumer
in developed markets convenience and range are
most important, for the Indian consumer it’s price
and range. Online stores, especially marketplaces,
literally bring the store to the consumers’ desktop or
mobile. The variety and categories on offer at a click
or touch are unparalleled. And to top it all, there are
apps and websites which guide you on best pricing
Need more reasons to buy online?
“Actually own logistics is not profitable as there is a fixed cost involved and it is seldom able to make optimum orders given the complications of CoD. Our operations are tuned to make deliveries across a designated area irrespective of who the shipper is, hence our efficiencies will be high.”
The fundamental reason why ecommerce players get into their own delivery logistics apart from handling COD orders is working capital requirements. Logistics companies can take anywhere between a 5 days to 15 days to remit the cash collected on delivery to the ecommerce players and that robs them of working capital.”

17GROUND ZERO GROUND ZERO 15 - 30 Nov 2014 15 - 30 Nov 2014 16
of the product. Ever tried mysmartprice.com? The
website actually aggregates the best prices of the
product and sorts the websites retailing the products
in ascending order of prices.
Indian e-commerce is rapidly evolving as consumers
embrace technology and lap up products available
online. While consumers would continue to benefit,
offline players seem to have been caught off-guard
in most categories. Like any new development,
e-commerce has disrupted the market and many
players have branded it as an agent of chaos that is
unlikely to ever make money and will be one whose
ship will sink.
Since March 2014, nearly US$ 4bn of private equity
money has been invested in just 3 players – Flipkart,
Amazon and Snapdeal. Even if half of it finds its way
to customers in the form of discounts, there could
be another US$ 5-8bn of discounted sales coming
the customers’ way. Therefore, offline retailers will
have to gear up, adapt, and more importantly, adopt
unconventional and possibly untested strategies
to counter the disruption caused by ecommerce. If
offline retailers do not evolve, they might as well be
writing their own obituary.
Illustration of price comparison tool

19GROUND ZERO GROUND ZERO 15 - 30 Nov 2014 15 - 30 Nov 2014 18
T H E C H I N E S E E C O M M E R C E M A R K E T
Lessons from Alibaba for Indian retailers – offline & online
Alibaba Group’s FY14 GMV was more
than Amazon’s and Ebay’s combined
GMV (US$ 158bn). The group sold a
GMV of US$ 296bn, which is nearly
60% of the overall Indian retail market. The com-
pany enjoys EBITDA margins of 48% (FY14) while
Amazon made operating margins of just 1% and
Ebay made 21%. It is pertinent to highlight that
Alibaba operates as a pure ecommerce facilita-
tor while Amazon is a B2C player. Also, so far,
Alibaba has had lesser competition than others
have had in markets outside China; so it has
benefited from operating leverage on the scale it
has achieved.
The Chinese ecommerce giant also shares its
name with one of the famous Arabian Nights fa-
bles – Alibaba and the 40 Thieves. The Indian mar-
ket may turn out to be more competitive than the
Chinese one (in fact, it already is) and the chase for
the consumers’ wallet share may well hold some
yet untold lessons for the entire retail space — not
just its subset, the ecommerce industry.
The Chinese Ecommerce Market
Internet users in China grew from 298mn (23% of
China’s total population) in 2008 to 618mn (46%)
in 2013, according to CNNIC, the administrative
agency responsible for internet affairs under the
Ministry of Information Industry of the People’s
Republic of China. The agency reckons there
were 302mn Internet shoppers in China in 2013,
representing 49% of its total internet users. Mobile
Internet population ( Dec 2013) 618mn
Online shoppers (Dec 2013) 302mn
Broadband Accounts 130 mn
Mobile Internet user 500mn
Size of e-tailing market ($ billion) $190–$210
E-tailing as % of retail 5-6%
Marketplaces’ share of e-tailing (%) 90%
C2C’s share of e-tailing >70%
Biggest product category Apparel
Mobile commerce’s share of e-tailing 2%
Smartphone penetration in population 10%
Coverage of next-day delivery by major express delivery companies
Mostly in Tier 1 and Tier 2 cities
Cash on delivery by independent B2C Common
Third-party payment systems/bank cards Majority
Dynamics of the Chinese e-com market
China online retail market: category break-up
(USD$ mn) Amazon Ebay Alibaba
Revenue 74,452 16,047 8,583
EBITDA 3,998 4,771 4,351
Net Profit 274 2,856 3,826
ROE (%) 3.1% 12.8% 40.2%
GMV 100,000 83,330 296,000 Source: Company, Media reports
Operating metrics
Source: McKinseySour
ce: C
NNIC
, McK
inse
y Glo
bal I
nstit
ute
anal
ysis

19GROUND ZERO GROUND ZERO 15 - 30 Nov 2014 15 - 30 Nov 2014 18
shoppers will bypass the conventional mode of
internet purchases and make it more convenient for
purchasing online. China’s mobile internet user base
reached 500mn as of December 31, 2013, according
to CNNIC. Smartphone shipments in China reached
351mn in 2013 and will exceed 435mn in 2014,
according to projections by IDC (International Data
Corporation). Market research company iResearch
believes that online shopping, which represented 8%
of China’s total consumption in 2013, is projected to
grow at a CAGR of 36% from 2013 to 2016, as more
consumers shop online and e-commerce spending
per consumer increases.
Tapping the opportunity in smaller towns and
cities
According to Euro monitor International, the top-20
offline retailers in China had a combined market
share of approximately 11.6% in 2013 vs. 40% in
the United States. This sort of fragmentation in
the market is favourable for creating a large online
marketplace. For China too (like in India), the online
opportunity is not restricted to its big cities. In 2012,
approximately 60% of China’s online retail sales were
in regions outside of tier-1 and tier-2 cities (National
Macro indicators of tier-1 and tier-2 cities and other regions in China
Online consumption per online shopper
The growth of ecommerce in China and Alibaba
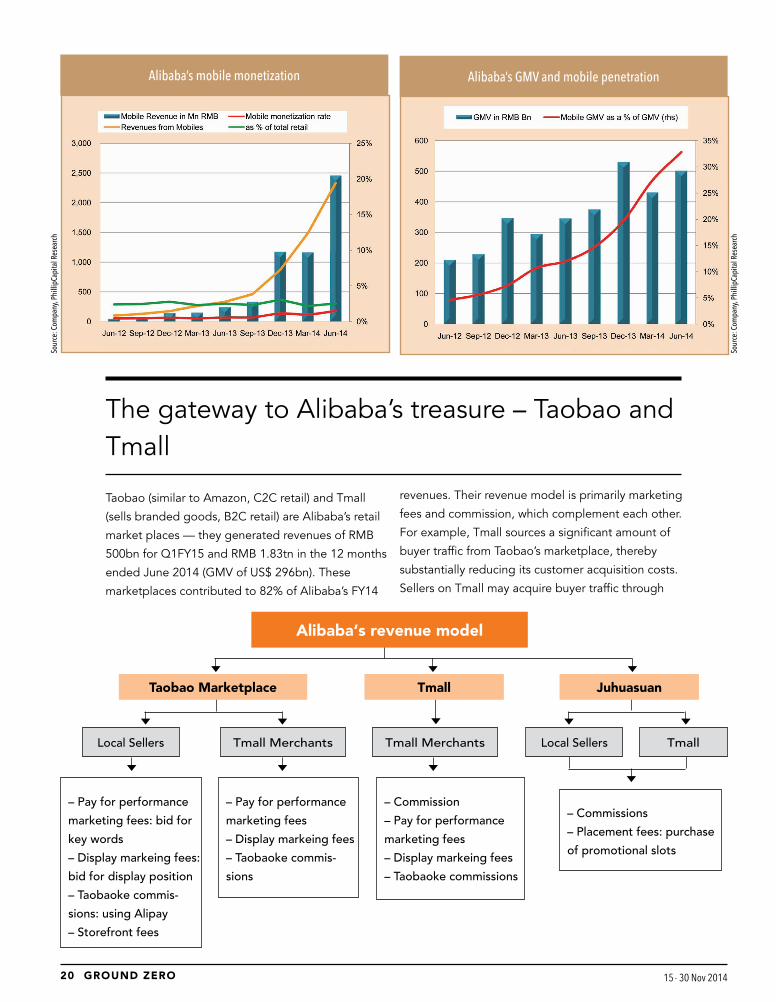
Alibaba’s GMV has seen a breakneck speed of 56%
CAGR over 2011-14. During this period, the Chinese
ecommerce market grew by 52%. Leadership in mo-
bile commerce has played a vital role in its growth.
Alibaba is the leader in mobile commerce in China in
terms of mobile retail GMV, with mobile GMV trans-
acted on its China retail marketplaces accounting for
86% of the total mobile retail GMV in China (in the
three months ended June 30, 2014, according to
iResearch).
Bureau of Statistics of China).
In addition to the 35 tier-1 and tier-2 cities that have
populations of over 1 million each, there are 92
other cities with population greater than one million
as of December 31, 2012, according to the Na-
tional Bureau of Statistics of China. In these smaller
cities and towns, China’s offline retail market faces
significant challenges due to few nationwide brick-
and-mortar retailers, an underdeveloped physical
retail infrastructure, limited product selection, and
inconsistent product quality.
According to Euro monitor International, the top-20 offline retailers in China had a combined market share of approximately 11.6% in 2013 vs. 40% in the United States.
Sour
ce: M
cKin
sey
Sour
ce: M
cKin
sey
21GROUND ZERO GROUND ZERO 15 - 30 Nov 2014 15 - 30 Nov 2014 20
Alibaba’s mobile monetization
Taobao (similar to Amazon, C2C retail) and Tmall
(sells branded goods, B2C retail) are Alibaba’s retail
market places — they generated revenues of RMB
500bn for Q1FY15 and RMB 1.83tn in the 12 months
ended June 2014 (GMV of US$ 296bn). These
marketplaces contributed to 82% of Alibaba’s FY14
The gateway to Alibaba’s treasure – Taobao and Tmall
revenues. Their revenue model is primarily marketing
fees and commission, which complement each other.
For example, Tmall sources a significant amount of
buyer traffic from Taobao’s marketplace, thereby
substantially reducing its customer acquisition costs.
Sellers on Tmall may acquire buyer traffic through
Taobao Marketplace Tmall Juhuasuan
Local Sellers
– Pay for performance
marketing fees: bid for
key words
– Display markeing fees:
bid for display position
– Taobaoke commis-
sions: using Alipay
– Storefront fees
– Pay for performance
marketing fees
– Display markeing fees
– Taobaoke commis-
sions
– Commission
– Pay for performance
marketing fees
– Display markeing fees
– Taobaoke commissions
– Commissions
– Placement fees: purchase
of promotional slots
Local SellersTmall Merchants Tmall Merchants Tmall
Alibaba‘s revenue model
Alibaba’s GMV and mobile penetration
Sour
ce: C
ompa
ny, P
hilli
pCap
ital R
esea
rch
Sour
ce: C
ompa
ny, P
hilli
pCap
ital R
esea
rch
21GROUND ZERO GROUND ZERO 15 - 30 Nov 2014 15 - 30 Nov 2014 20
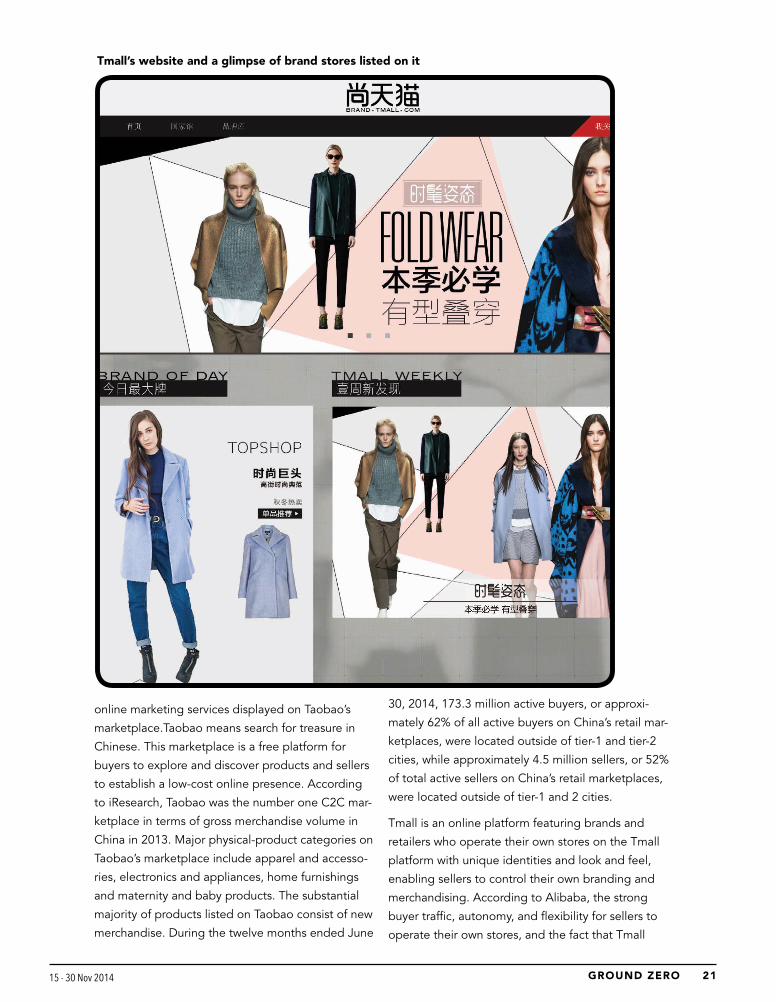
Tmall’s website and a glimpse of brand stores listed on it
online marketing services displayed on Taobao’s
marketplace.Taobao means search for treasure in
Chinese. This marketplace is a free platform for
buyers to explore and discover products and sellers
to establish a low-cost online presence. According
to iResearch, Taobao was the number one C2C mar-
ketplace in terms of gross merchandise volume in
China in 2013. Major physical-product categories on
Taobao’s marketplace include apparel and accesso-
ries, electronics and appliances, home furnishings
and maternity and baby products. The substantial
majority of products listed on Taobao consist of new
merchandise. During the twelve months ended June
30, 2014, 173.3 million active buyers, or approxi-
mately 62% of all active buyers on China’s retail mar-
ketplaces, were located outside of tier-1 and tier-2
cities, while approximately 4.5 million sellers, or 52%
of total active sellers on China’s retail marketplaces,
were located outside of tier-1 and 2 cities.
Tmall is an online platform featuring brands and
retailers who operate their own stores on the Tmall
platform with unique identities and look and feel,
enabling sellers to control their own branding and
merchandising. According to Alibaba, the strong
buyer traffic, autonomy, and flexibility for sellers to
operate their own stores, and the fact that Tmall

23GROUND ZERO GROUND ZERO 15 - 30 Nov 2014 15 - 30 Nov 2014 22
Alibaba (FY14)
JD.com (CY13)
GMV ($ Bn) 270 20.7
No of Employees (as on 31 March 2014) 22,072 50,122
EBITDA % 50.7% (0.4%)
Capital Employed ($mn) 13,103 1,627
RoE 40.2% NA
Comparison between Alibaba and JD
Amazon China 24
Ebay China 1,081
JD.com 34
Taobao 2
Website traffic ranking of popular e-com-merce websites
does not operate a direct sale business to compete
for customer traffic, makes it the platform of choice
for brands and retailers.
Major physical product categories on Tmall include
apparel and accessories, electronics and appliances,
home furnishings, home appliances and materni-
ty and baby products. Sellers on Tmall and Tmall
Global pay commissions based on pre-determined
percentages (0.3% to 5% depending on the product
category) of GMV for transactions settled through
Alipay. Sellers also pay an annual upfront service fee,
up to 100% of which may be refunded depending
on sales volume achieved by the seller within each
year.
For all of Alibaba’s success, Indian ecommerce
companies seem to follow JD.COM
Alibaba’s next biggest (though distant) competitor is
JD.com, China’s largest online direct sales company.
JD clocked a GMV of US$ 20.7bn (63% electron-
ics) in 2013 – less than 10% of Alibaba’s GMV. The
fundamental difference is that JD procures and
manages its own inventories, sells products directly
to consumers online, and provides delivery and af-
ter-sales services. It is modelled on Amazon with the
addition of making the last-mile delivery itself. It had
over 50,000 employees in April 2014 and nearly half
of those were for delivery of products. JD reported
an operating loss of US$ 96mn on a turnover of US$
11.45bn for the calendar year 2013. Interestingly, its
gross margin increased from 8.4% in 2012 to 9.9% in
2013, primarily due to the increase in net revenues
from services and others attributable to its online
marketplace and higher share of general merchan-
dise.
JD is an important reference point for the Indian
context, says an expert. He explained that players
such as Flipkart and Amazon are replicating the JD
model of last-mile delivery. It possibly explains why
Flipkart may end up with 25,000 employees on a
US$ 3bn GMV for FY15. The expert gives further in-
sight into Amazon’s strategy in India. He says that in
the US, Amazon doesn’t make the last-mile delivery
— however, for the Indian market it seems to have
picked up the strategy from JD and is building its
own delivery network.
But why is there no model like Alibaba? An ex-
pert explains that, “Taobao, a C2C market place
like Ebay, succeeded in China because of its huge
manufacturing base and export market. In a C2C
model, even an individual can sell his product on
the platform unlike in a B2C, which restricts itself
to vendors and businesses.” Alibaba succeeded
because it connected Chinese suppliers with over-
seas buyers. China has a huge manufacturing base
and most households manufacture something — it
could be toys, furniture, sports goods, just about
anything. Hence there are multiple sellers that have
a large variety of products, thus attracting buyers
to the marketplace. Taobao is the platform for such
producers and buyers. Our expert suggests that in
India, software is our biggest exports and we need
to have a strong manufacturing base for an Indian
Taobao to evolve.
Alibaba’s competitors misread the market and went
with the wrong business model. What went wrong
for Ebay and Amazon in China? The expert ex-
plains that Ebay failed to understand local market
demands and payment systems, which Taobao
leveraged on. Alipay, Alibaba’s payment solutions
platform is fundamental to its success. For a market
where cash-on-delivery payments are high (33% for
JD in 2013), Alipay, which functions as an escrow
account for buyers and sellers, changed the game.
Buyers preferred CoD, whereas sellers were unwill-
ing to ship the products until they were assured that
Sour
ce: C
ompa
ny, B
loom
berg
, Phi
llipC
apita
l Res
earc
hSo
urce
: Ale
xa

23GROUND ZERO GROUND ZERO 15 - 30 Nov 2014 15 - 30 Nov 2014 22
The Indian ecommerce market is smaller at about
US$ 4bn and is more competitive. In the Arabian
Nights, Alibaba had to contend with the 40 thieves
vying for the treasure. The Indian ecommerce market
is no different. While almost every player aspires to
be the Indian version of the Alibaba Group, there are
many learnings for the players in Indian market, both
online and offline.
n Competition – There are over 30 active ecom-
merce sites vying for consumers’ wallets and
models are evolving. The market is big, un-
tapped, and more importantly, open. Amazon
was nowhere in the picture till 2013 and has
rapidly scaled up operations in India, adopting
a marketplace model, something it hasn’t been
able to do in China.
n Alibaba is a pure market place – As highlight-
ed in the earlier section, the Indian market has
many hybrid models or companies that have
evolved from hybrid models. Snapdeal and
Ebay seem to be pure-play marketplace models.
Amazon is reported to have an indirect stake in
some of its vendors. In any case, all Indian com-
panies are already building up scale. Alibaba,
with US$ 300bn GMV had around 26,000 em-
ployees in China as on June 2014. Flipkart (with
a US$ 1bn GMV in FY14) has 13,000 employees
and plans to add another 12,000 employees in
FY15. Snapdeal has around 1,300 employees
and plans to double the headcount soon.
n Mobile is the way ahead – Access to smart-
phones bridges the gap of internet availability
to India’s 150mn (and growing) mobile internet
users just as it is has in China. Businesses have
to evolve beyond ecommerce – they have to be
ecommerce ready - be it mobile websites (web-
sites which are optimised for viewing in smart
phones) or mobile apps. The share of Jabong’s
mobile transactions increased from 4.4% in
the first quarter of 2013 to 27% in the second
quarter of 2014, while its monthly average visits
using mobile devices increased from 1.8 million
to 13.5 million over the same period.
n Striking similarities – India and China both have
underpenetrated retail markets. The opportunity
becomes even larger in tier-3 cities and beyond.
Technology is the new and one-stop store for
these locations. Opening stores rapidly is passé
— reaching through technology is the future.
n The competition for offline is only going to
intensify — Alibaba’s success has increased
investors’ risk appetite to invest in ecommerce
companies in India. And these investors are will-
ing to back some players in the hope of winner
takes it all. This means funding (that has already
touched US$ 4bn in 2014) will only increase.
Indian smartphone penetration
Lessons for the Indian market – China possibly didn’t have the 40 thieves but India sure has
payment was forthcoming. This lack of trust posed
a stifling challenge for the development of online
commerce in China. Alipay introduced its escrow
service as a solution to this problem. Alipay is Aliba-
ba’s password to the treasure cave.
Amazon entered China by acquiring joyo.com;
however, it faced integration issues and this perhaps
explains why it set up its business from scratch in
India instead of acquiring an existing entity.
Sour
ce: E
urom
onito
r Int
erna
tiona
l

25GROUND ZERO GROUND ZERO 15 - 30 Nov 2014 15 - 30 Nov 2014 24
Necessity driven by competition, but is it for every offline retailer?
B U I L D I N G A N O M N I C H A N N E L
In developed markets such as the US, ‘om-
ni-channel’ was a response to the threat posed
by low-cost online retailers. Retailers such as
Macy’s, John Lewis , and Burberry successfully
implemented an omni-channel strategy.
“Omni channel is a multi-channel touch point.
It combines brick and mortar with virtual chan-
nels - be it the website or mobile,” says Sanjay
Chakravarti, CFO, Shoppers Stop. Both formats,
i.e., brick and mortar and virtual, are seamlessly
synchronised in omni-channel retailing. If the cus-
tomer doesn’t get a particular product in the store,
he or she can browse for it on a kiosk or on the
website/app and complete the order.
What is omni channel retailing?
Omni-channel illustration
“Customers are becoming increasingly agnostic
to the channels they are buying from. It’s going
to be an integrated market, but the reality is that
we haven’t reached there yet in India,” says an
industry expert. The industry participants that we
interacted with, including leading ecommerce
practitioners (each involved in some major initia-
tive) concur that going forward, omni is the future.
When asked whether they were already behind
the curve, most of them said that it’s just the
beginning. Mr Rakesh Biyani, Jt MD Future Retail,
says, “We are going online because the custom-
er wants this. Businesses have to fundamentally
adapt to technology. We initiated the process
over a year ago, when the buzz in Indian online
was nowhere near what it is today.” He goes on
to say that, “consumers’ perception of technol-
ogy and service has undergone a change and it
is only evolving. Consumers today want to shop
from anyplace and anywhere, and interestingly,
are willing to wait for the product. Online play-
ers haven’t triggered any decision making for us.
The reason we adopted omni-channel is because
we had already migrated our operations to run a
centralised warehouse/distribution centre, assort-
Why Omni?
Mr Rakesh Biyani, Jt MD Future Group, says, “We are going online because the customer wants this. Businesses have to fundamentally adapt to technology. We initiated the process over a year ago, when the buzz in Indian online was nowhere near what it is today. ”

25GROUND ZERO GROUND ZERO 15 - 30 Nov 2014 15 - 30 Nov 2014 24
ment approach, and back end — it just happened to
coincide with the noise around ecommerce. We felt
the need to invest in technology to move to the next
leg.”
“Omni channel makes sense for any brand which
has a large retail presence”, says Mr Vijay Basrur
of Raymond. The 89-year old brand has been one
of the few Indian brands to have launched its own
ecommerce venture Raymondnext.com. The Aditya
Birla group has launched trendin.com which retails
its brands including some of India’s largest brands
such as Louis Philippe. But no one is anywhere close
to creating a great shopping experience, says Mr
Bawankule of Google.
Nevertheless, Omni Channel has multiple benefits
when executed well. Even in the developed markets
(US and UK) 85-90% retail is still offline. The reality
is that most of the retail is anchored around physical
assets of manufacturing, product strategy, stores,
and distribution set up. Omni-channel brings real
assets to compliment online stores so that they don’t
eat into each other’s sales but rather, complement
each other — sales strategies under omni-channel
include click-and-pick, reserve the product, and
shipping from the store instead of the distribution
centre.
A solution to one of the biggest challenges for
retailers – Inventory
A brick-and-mortar retailer holds inventory in the
store as well as at the distribution centre (DC). The
Advantages of Omni Channel
assortment in the store is limited due to space con-
straints. The supply chain runs once a day to twice a
month depending on the type of store (format, loca-
tion). Hence, there is limitation to turn the inventory
better. Omni-channel gives access to the product
(listed on website/app) in the system, store as well
as DC, to a customer — it also does this to custom-
ers who are beyond the (physical) catchment of the
store and possibly where there are no stores. Thus,
it helps improve the stock turns. Mr Biyani offers a
deeper insight into this. He explains that, “With the
omni-approach and by delivering the product to the
consumer’s home, the replenishment system chang-
es to a certain extent. We can pick a single product
from the system (be it a store or the DC) to fulfil a
customer’s order. Thereby, the space constraint in
the store reduces and we can offer twice the assort-
ment (variety) by cutting the depth (number of piec-
es) and making less of the same product available.
Thus, we can improve the store performance.”
Logistics and warehousing
Logistics is easier for a store network. “Shipping
from a store is cheap,” says Mr Vinay Bhatia, Head of
Ecommerce & Customer Loyalty Program, Shopper’s
Stop. Mr Basrur of Raymond concurs and says,
“Delivery times are dramatically cut short and are at
lower costs as deliveries can be made by the nearest
store as there are logistic partners in place. From
logistics perspective, there will be cost savings. If
the product is there in the city, then it will get dis-
patched locally.”
Sale of a product is piece by piece (a shirt, a dress, pair of shoes) basis but replenishment in the store is in batch-es (economic order quantity). If a single product can be picked to fulfil an order made online then the same capability can be created for the store. The store is also a customer. Extending this capability to the top-performing stores we can maximise the assortment in these stores and use the others to take orders (through website or kiosks or through tablets that showcase the entire range), creating a hub-and-spoke model. This is known as the endless aisle concept in which shelf space is extended to the brand’s full catalogue of products.
Omni-channel brings real assets to compliment online stores so that they don’t eat into each other’s sales but rather, complement each other.

27GROUND ZERO GROUND ZERO 15 - 30 Nov 2014 15 - 30 Nov 2014 26
Most retailers would be keen to popularise click-
and-pick, which essentially means that the customer
can buy online and opt to collect it from the nearest
store. It helps the customer get the product quicker
— more so if it’s already in a nearby store. A custom-
er is also likely to make more purchases when he or
she comes to the shop to collect the order. And of
course, there are no shipping costs.
While click-and-pick would be an ideal scenario, it is
a function of reach. Not all chains are present across
most places in India, and the reality is that to satiate
demand from locations where there are no stores or
distribution centres, third-party logistics will have to
be used. Even for orders from locations where stores
are present, retailers may have to use third-party
logistics to fulfil orders until the time click-and-pick
gets more popular (may have to incentivise the
customer). However, Mr Biyani believes that the ex-
isting employees in a store can be used to fulfil the
delivery to customers in location that have stores.
The only incremental cost could be the addition of a
few 2-wheelers to facilitate local delivery.
Going omni channel, results in warehousing efficien-
cies and lower costs. Logically, by more sweating
of the store inventory, warehousing needs should
reduce. However, it depends on the stage of the
business and the format, i.e., brand or third-party
retailer, says Mr Basrur. Brands have multiple distri-
bution channels and hence will have a centralised
inventory for its online business. So initially, ware-
housing capacity will be high for brands — this will
reduce as they go omni and the stores come into
play. Departmental stores are enablers and hence
stock more inventories in the store unlike brands as
they have longer and diverse supply chains.
Particulars Lifestyle Panta-loons
Shoppers Stop
Trent Central
Tier-1 71% 44% 54% 39% 38%
Tier-2 & 3 29% 56% 46% 61% 62%
Total stores 42 86 71 80 29
No. of cities 26 47 32 53 15Source: Company, PhillipCapital Research
Geographical dispersion of leading departmental stores in India
Capturing more wallet share
Mr Bhatia of Shoppers Stop states the real ben-
efit from this strategy is from increased customer
spreads as the assortment is wider. Internationally,
there is enough data to show that omni-channel cus-
tomers spends are twice single-channel customers’.
According to IDC, multi-channel shoppers spend on
an average 15-30% more with a retailer than some-
one who uses only one channel — and omni-channel
shoppers will spend 15-30% more than multi-chan-
nel consumers.
Mr Biyani of Future Group explains how having a
wider variety helps. He gives us “The Dinner Set”
example:
Typically in a store we can offer 4-20 designs due to
space constraints. But I can have 50 designs in the
backend. So a customer may see some colours of a
design on display and others on a screen or tablet
in the store. If the piece is not in the store, it will get
shipped from the backend where the customer will
have the option of picking it up from the store or get
it delivered home.
Mr Basrur of Raymond explains how Burberry has
optimised this channel. “One can walk into any
Burberry store and the customer can see the entire
collection. One can select the SKUs online and
Burberry can make the SKU available at the near-
est store. Burberry has almost all of its collection
in all its stores in a city. Since it is a luxury brand it
doesn’t have too many SKUs – this helps.”
To go omni, brands and retailers have to make
changes in the backend, technology, and above all,
their strategic mind-set. Mr Bawankule of Google
surmises, “Brick-and-mortar players have to make
technology investments and create internet plat-
forms. Importantly, it (omni) has to be treated as a
new business or a new store in a new location.”
What will it take to go omni?

27GROUND ZERO GROUND ZERO 15 - 30 Nov 2014 15 - 30 Nov 2014 26
Integrating the existing offline business with online is
a three-part process:
1. Going digital/setting up a website, thereby
allowing consumers to buy online. A brand can
also sell without a proper back-end. Fila sells
online in India through a distributor. Managing
website traffic is a function of technology capa-
bility. Most companies today rely on amazon web
services or cloud services or hosted solutions
for managing this. Therefore, scaling up and
handling increase/spikes in website traffic is not a
major challenge.
2. Centralisation of data/finance. Most of the offline
retailers have IT systems that are tuned for brick-
and-mortar operations. Once they start selling
online, there has to be synchronisation and data
has to be viewed real-time as customers buy
across channels at different times of the day. That
data has to be integrated into in the company’s
IT system so that it knows where the stock is.
Another aspect is stock movement — inventory is
in the store and as it gets sold it has reflect in the
system real-time so that a consumer shopping
online will know if the stock is available or not at
any given point of time.
How is it done? A master data management
(MDM) layer is used to integrate old systems. It is
essentially a middleware that talks to legacy sys-
tems sitting in the stores. The integration is not
an easy process and it is not real time to begin
with. ERP, designed for stores, was used for end-
of-the day processing (e.g. stock taking).
3. Going omni and servicing the customer from the
nearest store.
Mr Bawankule of Google surmises, “Brick-and-mortar players have to make technology investments and create internet platforms. Importantly, it (omni) has to be treated as a new business or a new store in a new location.”
Inventory Inventory
Pricing
WebSphere
Enterprise
Service BUS
(WESB)
Mediation
Module
Pricing
Order Order
Promotions Promotions
Web channel
online Store
Direct Calls
MIDDLE WARE
FR
ON
T-E
ND B
AC
K E
ND
WebSphere
Commerce
Sterling Order
Management
JMS Queues
Call Centre Store
Illustration of the front end, back end and middleware for omni channel
Sour
ce: I
BM

29GROUND ZERO GROUND ZERO 15 - 30 Nov 2014 15 - 30 Nov 2014 28
While middleware is an important cog in the
omni-channel wheel, Future Group opted for the
alternative, i.e. seamless integration (no middle layer
between existing systems and website) using Hybris,
a SAP enterprise. A seamless interface using Hybris
is possible if one is on SAP. However, not everyone
is on SAP and many brands say that it is expensive
in the context of their size and operations. However,
for an entity like Future Group, when the number of
SKUs is high, complexities of integration increase —
it deals with over 40,000 SKUs (Shoppers Stop deals
with 2,500), seamless integration is preferred over
middleware. The others have the option of choosing
different vendors for middleware and the front-end
— e.g., IBM Websphere (for front end), Oracle ATG
(for front end), IBM0 sterling management (middle-
ware).
Warehousing investments
Most brands have large warehousing capabili-
ties as they deal with multiple channels – dealers,
departmental stores, franchisees. However, these
warehouses may not necessarily support sin-
gle-piece-picking to satisfy orders from distribution
centres (DCs). They need to do so as retailers go
omni and establish an online presence. Online pres-
ence can be established even before the company
goes omni and to service this one would need a
new-age DC that can fulfil single-piece picking.
Therefore, brands may make short-term (outsource)
investments in warehousing. For brands, the
warehousing requirement will increase in the short
term, as the online channel will be serviced through
new-age DCs; but as stores come into play to fulfil
orders, the requirement will come down. However,
for departmental stores such as Shoppers Stop, most
of the stock is in store, and its warehousing require-
Macy’s omni-channel in a nutshell: Macy’s website installs 24 different tracking cookies on a visitor’s browser. Its TV ads (inci-dentally, featuring teenage pop sensation Justin Bieber) urge people to download its mobile app, which tells them which of the chain’s stores is closest to their location. Once customers are inside the store, they can use the app to get customer reviews and can also scan the QR code to watch videos, visit URLs, and find out more about a product or a promotion for anything — a pillowcase or a pair of shoes. Online orders now ship from the backrooms of 500 Macy’s stores that this year began acting as mini distribution centres.
Source: Beyond the check-out cart, MIT Technology Review
ment will only increase when online crosses 10-15%
of their topline; therefore, in the short term, it won’t
need additional investment for warehousing, says Mr
Bhatia of Shoppers Stop.
John Lewis, UK’s largest departmental store, faced
competition from online players in the UK and
subsequently invested in going omni. However,
the journey wasn’t easy as it integrated its stores as
well as Waitrose stores as fulfilment centres. John
Lewis offers added incentives such as free Wi-Fi so
customers can check out prices — it has a policy of
never knowingly offering a price that is higher than
a national high-street competitor. The extended
reach of Waitrose stores (over 300) is an important
factor in John Lewis’s successful implementation of
omni-channel.
Things John Lewis did in chronological order:
2009 - 35% increase in the lines offered on the web-
site; started click and collect
2010 - Increased the number of lines available and
started express delivery.
2011 - Increased the number of products sold
online. Invested further in the development of dis-
tribution facility. Extended services such as Click &
Collect to all 29 John Lewis branches.
2012 - Online trade fully integrated into the John
Lewis multi-channel operations. At the year end,
‘Click & collect’ was available in all 35 John Lewis
shops and 94 Waitrose branches. Two-thirds of
its shops had free Wi-Fi to enable customers to
check prices as they shop. Launched over 30 new
John Lewis Case Study
29GROUND ZERO GROUND ZERO 15 - 30 Nov 2014 15 - 30 Nov 2014 28
brand introductions, new own-brand ranges, and
more designer collaborations. There was a £ 34.1m
decline in profits as a result of the decision to
ensure there was absolutely no compromise on
quality, service or value for customers.
2013 - Nearly two thirds of all transactions involved
customers visiting both shops and online channels.
Click & collect, available in all 39 John Lewis and
193 Waitrose outlets, was a key part of this change
in shopping behaviour. Orders almost doubled
year-on-year, with 43% of purchases collected from
Waitrose branches.
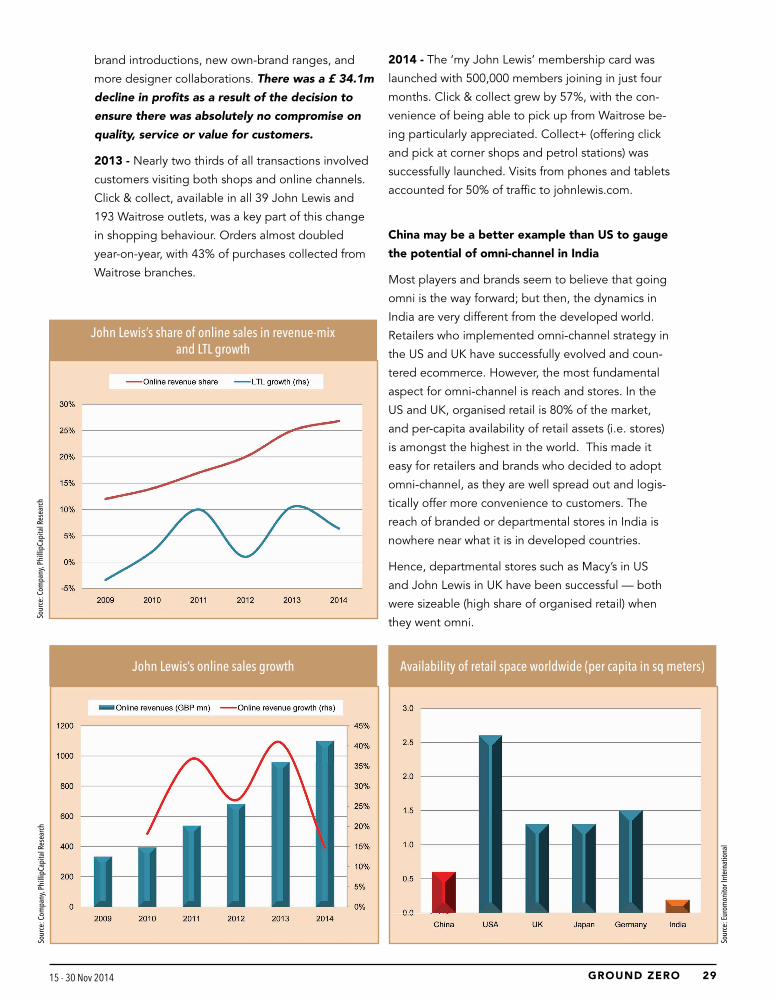
John Lewis’s share of online sales in revenue-mix and LTL growth
John Lewis’s online sales growth
2014 - The ‘my John Lewis’ membership card was
launched with 500,000 members joining in just four
months. Click & collect grew by 57%, with the con-
venience of being able to pick up from Waitrose be-
ing particularly appreciated. Collect+ (offering click
and pick at corner shops and petrol stations) was
successfully launched. Visits from phones and tablets
accounted for 50% of traffic to johnlewis.com.
China may be a better example than US to gauge
the potential of omni-channel in India
Most players and brands seem to believe that going
omni is the way forward; but then, the dynamics in
India are very different from the developed world.
Retailers who implemented omni-channel strategy in
the US and UK have successfully evolved and coun-
tered ecommerce. However, the most fundamental
aspect for omni-channel is reach and stores. In the
US and UK, organised retail is 80% of the market,
and per-capita availability of retail assets (i.e. stores)
is amongst the highest in the world. This made it
easy for retailers and brands who decided to adopt
omni-channel, as they are well spread out and logis-
tically offer more convenience to customers. The
reach of branded or departmental stores in India is
nowhere near what it is in developed countries.
Hence, departmental stores such as Macy’s in US
and John Lewis in UK have been successful — both
were sizeable (high share of organised retail) when
they went omni.
Availability of retail space worldwide (per capita in sq meters)
Sour
ce: C
ompa
ny, P
hilli
pCap
ital R
esea
rch
Sour
ce: C
ompa
ny, P
hilli
pCap
ital R
esea
rch
Sour
ce: E
urom
onito
r Int
erna
tiona
l
31GROUND ZERO GROUND ZERO 15 - 30 Nov 2014 15 - 30 Nov 2014 30
E C O M M E R C E V S . P H Y S I C A L S T O R E S
The battle has just begun - discounts and funding to continue
The battle between ecommerce and
offline retailers in India intensified after
Flipkart’s big billion day sale, where
the online retailers faced allegations of
undercutting and selling below costs. Ecommerce
has been branded as a discounting channel by
most of its offline peers. The availability of FDI
(foreign direct investment) in the form of private
equity to ecommerce players through compli-
cated corporate structures is another bone of
contention for offline players. Mr Biyani of Future
Retail says, “Online market places are funded
by foreign money and Indian players don’t have
access to it.”
But not everyone agrees with this. “Online is
just another competition, but the way you react
to it is different,” says Mr Bawankule of Google.
“Everyone is saying price is the bogie, but if that
were the only case then physical retail should
close down as it would lose significant business
to online. Ecommerce players also have to make
a strategy to acquire customers, then retain them
using loyalty, pricing, service, etc.”
A catchment area of an offline retailer can be easi-
ly disturbed even in physical retail when a com-
petitors sets shop there or for that matter in many
“Online is just another competition, but the way you react to it is different,” says Mr Bawankule of Google.
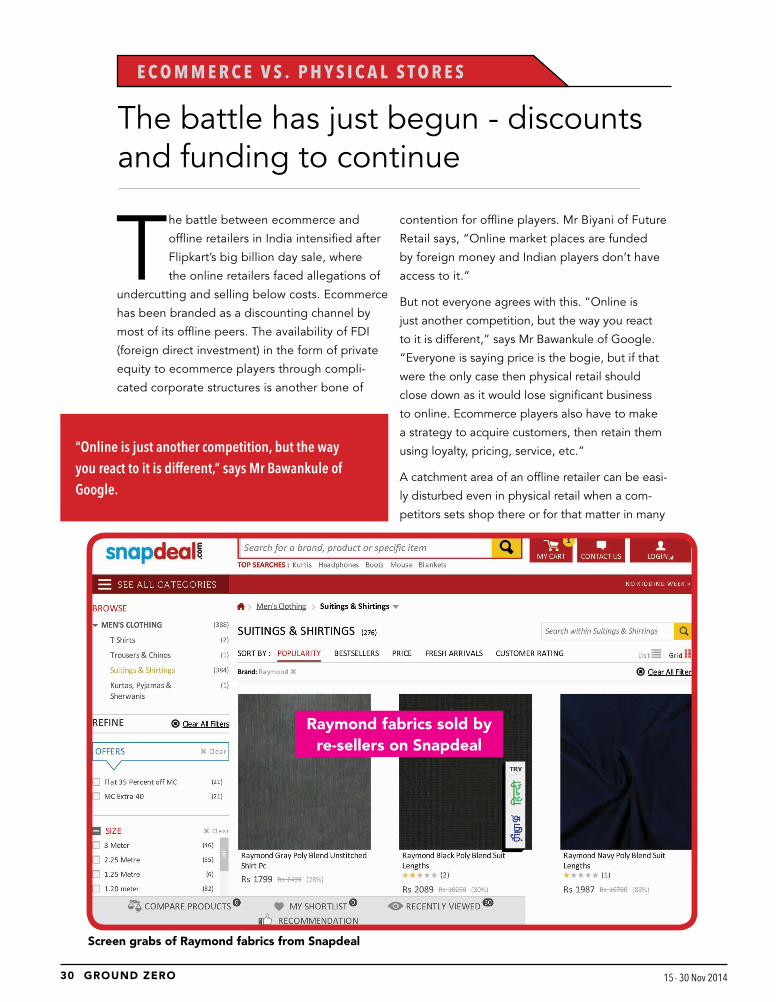
Screen grabs of Raymond fabrics from Snapdeal
Raymond fabrics sold by re-sellers on Snapdeal

31GROUND ZERO GROUND ZERO 15 - 30 Nov 2014 15 - 30 Nov 2014 30
Similarities between online and offline
In many ways, the offline competition from unorgan-
ised players is spilling over into online. For example,
any MBO (multi-brand outlet) can sell online.
The physical world will mirror itself on the online
world. The difference is that the customer will come
to the online store instead of the offline store.
The share of national apparel brands online is not
significant and it is the same in the offline world,
even though these brands have existed for years.
Mr Basrur from Raymond says, “It is just that the
unorganised segment has got a bit more authenticity
selling online.” A significant portion of the turnover
of online players such as Myntra and Jabong will be
from smaller brands (which in the offline world would
pass off as unorganized) and private labels, says an
industry observer.
Mr Basrur adds, “Doing business online has its own
set of costs — warehousing, logistics. The advan-
tage is that it has the ability to showcase the entire
inventory to the customer”. But customer acquisi-
tion online is the most challenging part. Just as for
physical stores, a brand or retailer tries to draw the
customer from another brand or store by advertising
or through new stores and offers, online players have
to draw customers. They also incur costs for market-
ing (website), advertisement, and search engine op-
timisation. In fact, customers have high expectations
from online players such as discounts, free deliveries,
and returns. Thus cost of doing business online is
mirroring offline. Online is more efficient only if there
is vast product range.
Inventory challenges exist both offline and online.
Aggressive expansion by offline players to expand
their retail footprint resulted in high inventory and
debt levels. Some large ecommerce players face
these issues too.
However, all said and done, brands need online
channels as much as online players need them. A
brand cannot survive only on own exclusive brand
outlets — most already depend on departmental
The physical world will mirror itself on the online world. The difference is that the customer will come to the online store instead of the offline store.
such catchments. The retailer (rather than reacting
and complaining), then has to respond by chang-
ing his strategy (product mix, promotions etc.) to
counter competition. Therefore, businesses have to
evolve and respond to competition rather than react.
Lesser known brands retailed on Amazon.in...

33GROUND ZERO GROUND ZERO 15 - 30 Nov 2014 15 - 30 Nov 2014 32
stores. Similarly, a brand cannot grow only using its
own website — they will need to use major ecom-
merce players as they offer reach into 2/3-tier cities,
which will help brands penetrate deeper without
investing in stores.
The offline marketplace is getting replicated
online
An industry expert explains the disruptive aspects
of ecommerce in the context of physical retail —
he says ecommerce is disruptive on two counts
— technology to reach the consumer anywhere
and disintermediation. Explaining further, he says,
ecommerce has disruptive power as it can reach any
customer, anywhere, and anytime. Therefore it can
threaten the fundamentals of the offline business-
es — for example, books chains across the world
have been wiped out because of online sales. The
same thing is happening to mobiles. The degree of
invasion will vary and brands have to be careful how
they engage online.
There was a time when Target and Macy’s were part
of Amazon but they didn’t benefit and went their
separate ways, after which they had to build online
platforms from scratch and play catch up. The sec-
ond aspect is disintermediation - if there are three
channel partners sharing total 30% margin, then by
reducing the chain, the customer benefits. But it kills
the physical stores. Departmental stores and small
Jabong’s reach compared with the distribution of urban population in India
Source: Company, PhillipCapital research
One of Jabong’s private labels
Private labels account for every fifth item shipped for Jabong.
33GROUND ZERO GROUND ZERO 15 - 30 Nov 2014 15 - 30 Nov 2014 32
multi-brand outlets are offline marketplaces in their
own right as they sell multiple brands and products
under one roof. But online marketplaces have no
space constraints and hence can offer many times
more stock than even a conventional departmental
store. Jabong offers over 139,000 SKUs whereas
Shoppers Stop can offer about 2,500 SKUs.
So are Indian retailers behind the curve and is
going omni the best way ahead?
“Brick-and-mortar retailers are vulnerable due to
internal issues, inefficiencies, and complacency,”
says Mr Bawankule . He is of the view that discount-
ing is here to stay not just because of PE funding but
because of the very nature of the business. He says,
“Discounting will continue for life and discounting
is not customer acquisition. Even brick-and-mor-
tar does it. US’ Black Friday is the largest sale day
because of discounts. Consumers are deal seekers.
If you don’t discount, then sales velocity may not be
high and cash flows will be lower.” He is of the view
that retailers must extend their reach and launch ex-
clusive collections like Myntra has done. The success
of going omni hinges on many things such as having
reach, integrating reach with technology, offering
convenience, and exclusive assortment. A retailer
like Shoppers Stop with over 20 years of experience,
merchandising relations with brands, and long-run-
ning customer loyalty program must go omni, says
an industry observer.
However, omni-channel retailing, in its current form,
may not be the best way ahead for most Indian
players. An executive with a large Indian conglom-
erate explains, “Retailers outside are of critical size,
therefore they can roll out their own omni-channel
strategy. Most retailers in India are not of critical
size.”
The positioning of the brand also matters. Brands
such as Zara, which have high fashion quotient, fresh
designs every fortnight, and emphasis on latest
fits, have continued to do well from physical stores
model. It is estimated that Zara’s draws only 5% of its
global turnover from its online channel.
Organised retail is just 8% of India’s US$ 500bn retail
market and online retail is already US$ 3bn, almost
10% of the organised retail. Therefore, brands as
well as retailers face challenges of different kinds.
Third-party retailers face price competition from
ecommerce players while brands face the conun-
drum of dilution of brand value due to discounts
with benefits of reach. To face these challenges,
there is no formula. The third-party retailers have
to go omni to face up to the challenge. However,
for brands, omni might turn out to be expensive.
An expert explains,” The cost of doing good om-
ni-channel platform and associated logistics entails
an investment of Rs 800 mn. The brand has to also
incur Rs 1bn over 3 years on marketing initiatives to
make this channel grow.”
An executive with a leading national brand says,
“It will be ideal for brands if departmental stores
go online. Departmental stores will feel the heat
from ecommerce. Even though physical retail is still
major for all the players, ecommerce could be big
and hence brands have to gear up. If these players
(departmental stores) don’t gear up then we have to
be prepared. As this market evolves, it makes sense
for brands to go online as there are better margins
from disintermediation.”
Brands continue to engage with ecommerce players
because of the reach they offer and also because
they are a channel for liquidation of old inventory.
If third-party retailers such as departmental stores
can offer them the reach, brands would be happy
to support them as they have more rational pricing
norms and don’t discount recklessly on the back of
PE funding.
“Retailers outside are of critical size, therefore they can roll out their own omni-channel strategy. Most retailers in India are not of critical size.”
”The cost of doing good omni-channel platform and associated logistics entails an investment of Rs 800 mn. The brand has to also incur Rs 1bn over 3 years on marketing initiatives to make this channel grow.”
Private labels account for every fifth item shipped for Jabong.
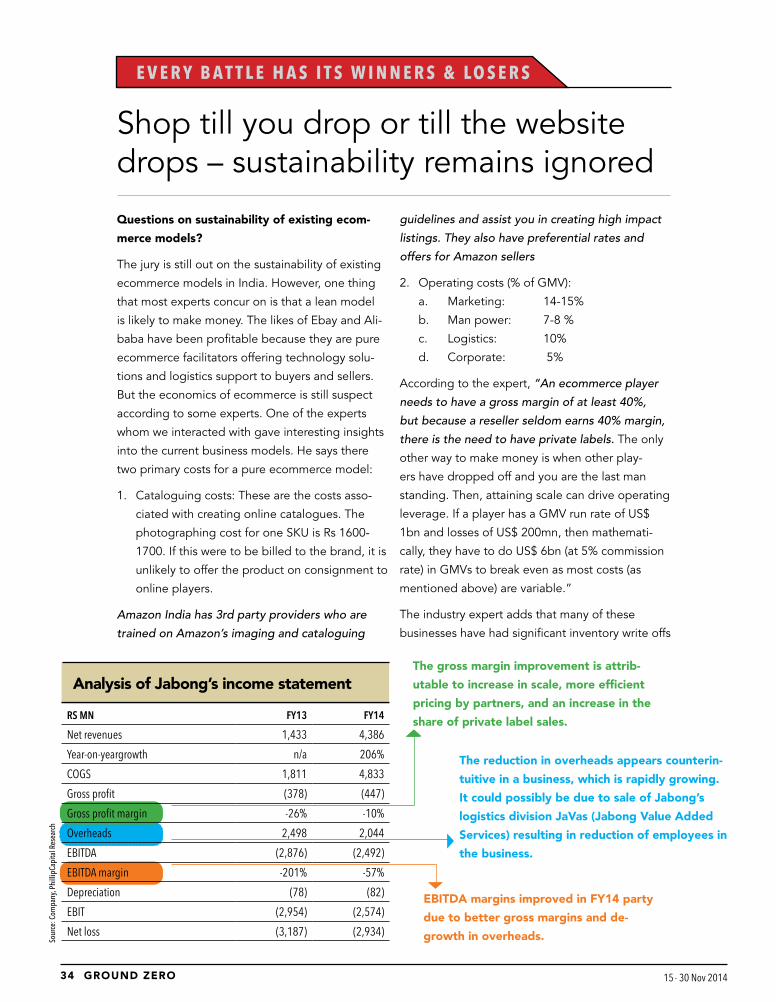
35GROUND ZERO GROUND ZERO 15 - 30 Nov 2014 15 - 30 Nov 2014 34
E V E R Y B A T T L E H A S I T S W I N N E R S & LO S E R S
Shop till you drop or till the website drops – sustainability remains ignored
Questions on sustainability of existing ecom-
merce models?
The jury is still out on the sustainability of existing
ecommerce models in India. However, one thing
that most experts concur on is that a lean model
is likely to make money. The likes of Ebay and Ali-
baba have been profitable because they are pure
ecommerce facilitators offering technology solu-
tions and logistics support to buyers and sellers.
But the economics of ecommerce is still suspect
according to some experts. One of the experts
whom we interacted with gave interesting insights
into the current business models. He says there
two primary costs for a pure ecommerce model:
1. Cataloguing costs: These are the costs asso-
ciated with creating online catalogues. The
photographing cost for one SKU is Rs 1600-
1700. If this were to be billed to the brand, it is
unlikely to offer the product on consignment to
online players.
Amazon India has 3rd party providers who are
trained on Amazon’s imaging and cataloguing
guidelines and assist you in creating high impact
listings. They also have preferential rates and
offers for Amazon sellers
2. Operating costs (% of GMV):
a. Marketing: 14-15%
b. Man power: 7-8 %
c. Logistics: 10%
d. Corporate: 5%
According to the expert, “An ecommerce player
needs to have a gross margin of at least 40%,
but because a reseller seldom earns 40% margin,
there is the need to have private labels. The only
other way to make money is when other play-
ers have dropped off and you are the last man
standing. Then, attaining scale can drive operating
leverage. If a player has a GMV run rate of US$
1bn and losses of US$ 200mn, then mathemati-
cally, they have to do US$ 6bn (at 5% commission
rate) in GMVs to break even as most costs (as
mentioned above) are variable.”
The industry expert adds that many of these
businesses have had significant inventory write offs
RS MN FY13 FY14
Net revenues 1,433 4,386
Year-on-yeargrowth n/a 206%
COGS 1,811 4,833
Gross profit (378) (447)
Gross profit margin -26% -10%
Overheads 2,498 2,044
EBITDA (2,876) (2,492)
EBITDA margin -201% -57%
Depreciation (78) (82)
EBIT (2,954) (2,574)
Net loss (3,187) (2,934)
Analysis of Jabong’s income statement
EBITDA margins improved in FY14 party
due to better gross margins and de-
growth in overheads. Sour
ce: C
ompa
ny, P
hilli
pCap
ital R
esea
rch
The gross margin improvement is attrib-
utable to increase in scale, more efficient
pricing by partners, and an increase in the
share of private label sales.
The reduction in overheads appears counterin-
tuitive in a business, which is rapidly growing.
It could possibly be due to sale of Jabong’s
logistics division JaVas (Jabong Value Added
Services) resulting in reduction of employees in
the business.
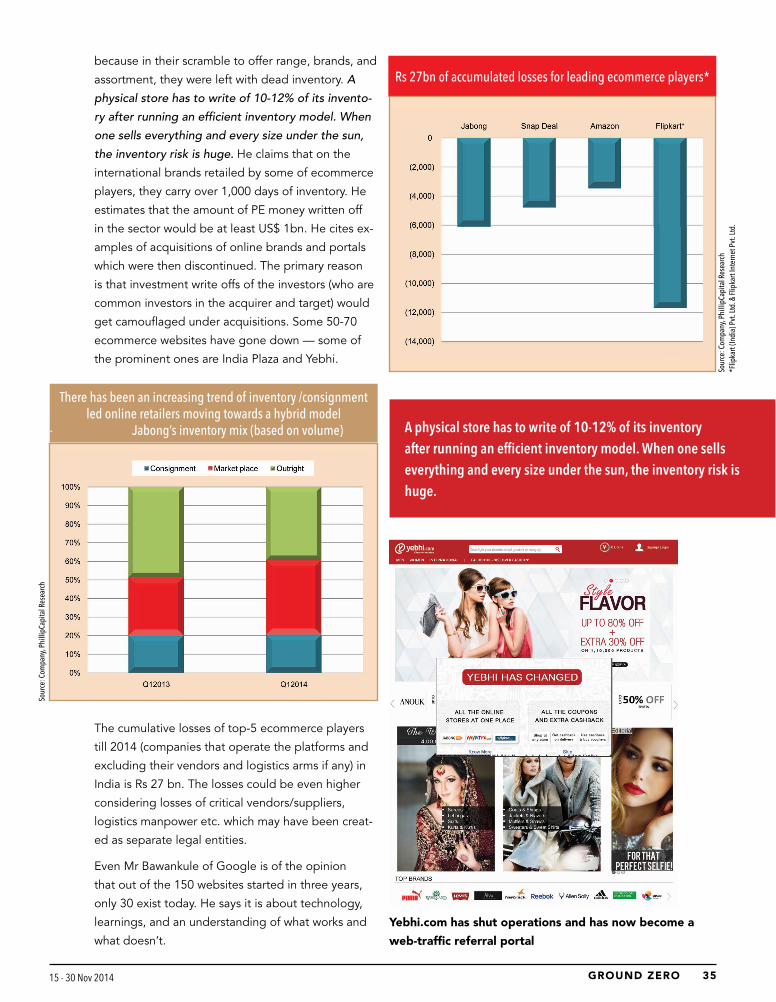
35GROUND ZERO GROUND ZERO 15 - 30 Nov 2014 15 - 30 Nov 2014 34
because in their scramble to offer range, brands, and
assortment, they were left with dead inventory. A
physical store has to write of 10-12% of its invento-
ry after running an efficient inventory model. When
one sells everything and every size under the sun,
the inventory risk is huge. He claims that on the
international brands retailed by some of ecommerce
players, they carry over 1,000 days of inventory. He
estimates that the amount of PE money written off
in the sector would be at least US$ 1bn. He cites ex-
amples of acquisitions of online brands and portals
which were then discontinued. The primary reason
is that investment write offs of the investors (who are
common investors in the acquirer and target) would
get camouflaged under acquisitions. Some 50-70
ecommerce websites have gone down — some of
the prominent ones are India Plaza and Yebhi.
There has been an increasing trend of inventory /consignment led online retailers moving towards a hybrid model
- Jabong’s inventory mix (based on volume)
Rs 27bn of accumulated losses for leading ecommerce players*
Sour
ce: C
ompa
ny, P
hilli
pCap
ital R
esea
rch
*Flip
kart
(Indi
a) P
vt. L
td. &
Flip
kart
Inte
rnet
Pvt
. Ltd
.
Yebhi.com has shut operations and has now become a
web-traffic referral portal
A physical store has to write of 10-12% of its inventory after running an efficient inventory model. When one sells everything and every size under the sun, the inventory risk is huge.
Sour
ce: C
ompa
ny, P
hilli
pCap
ital R
esea
rch
The cumulative losses of top-5 ecommerce players
till 2014 (companies that operate the platforms and
excluding their vendors and logistics arms if any) in
India is Rs 27 bn. The losses could be even higher
considering losses of critical vendors/suppliers,
logistics manpower etc. which may have been creat-
ed as separate legal entities.
Even Mr Bawankule of Google is of the opinion
that out of the 150 websites started in three years,
only 30 exist today. He says it is about technology,
learnings, and an understanding of what works and
what doesn’t.
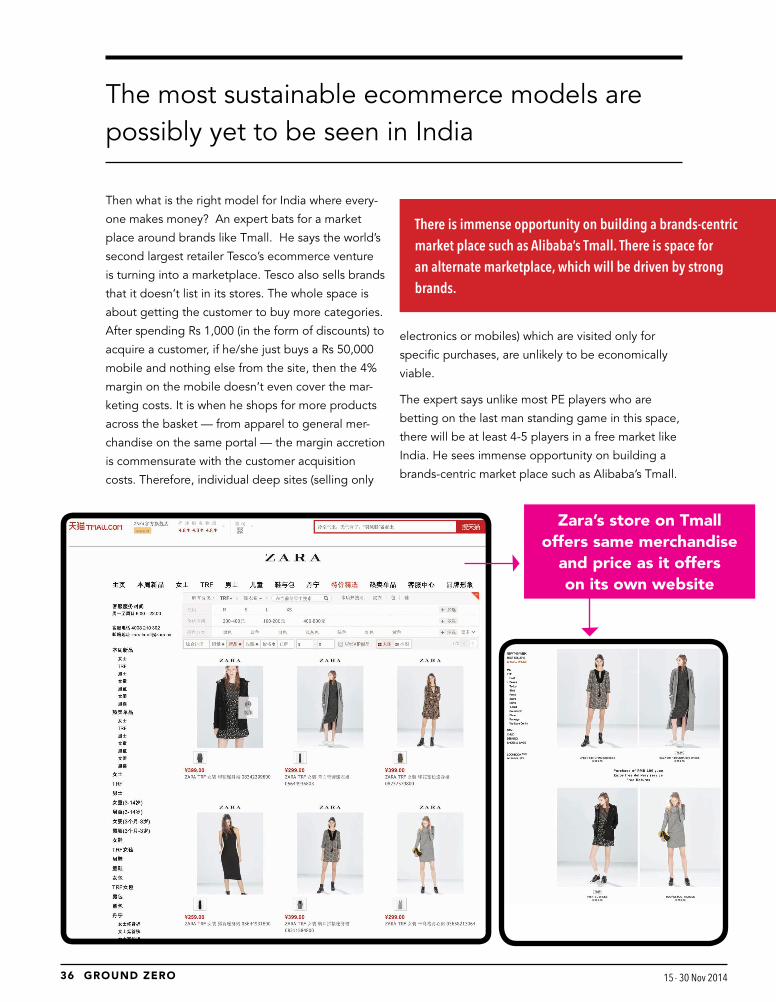
37GROUND ZERO GROUND ZERO 15 - 30 Nov 2014 15 - 30 Nov 2014 36
Then what is the right model for India where every-
one makes money? An expert bats for a market
place around brands like Tmall. He says the world’s
second largest retailer Tesco’s ecommerce venture
is turning into a marketplace. Tesco also sells brands
that it doesn’t list in its stores. The whole space is
about getting the customer to buy more categories.
After spending Rs 1,000 (in the form of discounts) to
acquire a customer, if he/she just buys a Rs 50,000
mobile and nothing else from the site, then the 4%
margin on the mobile doesn’t even cover the mar-
keting costs. It is when he shops for more products
across the basket — from apparel to general mer-
chandise on the same portal — the margin accretion
is commensurate with the customer acquisition
costs. Therefore, individual deep sites (selling only
The most sustainable ecommerce models are possibly yet to be seen in India
electronics or mobiles) which are visited only for
specific purchases, are unlikely to be economically
viable.
The expert says unlike most PE players who are
betting on the last man standing game in this space,
there will be at least 4-5 players in a free market like
India. He sees immense opportunity on building a
brands-centric market place such as Alibaba’s Tmall.
Zara’s store on Tmall offers same merchandise
and price as it offers on its own website
There is immense opportunity on building a brands-centric market place such as Alibaba’s Tmall. There is space for an alternate marketplace, which will be driven by strong brands.

37GROUND ZERO GROUND ZERO 15 - 30 Nov 2014 15 - 30 Nov 2014 36
He believes there is space for an alternate market-
place, which will be driven by strong brands. Logical-
ly, any conglomerate which has its portfolio brands
across categories can anchor this market place.
Snapdeal is one of the few pure-play market places
that don’t carry inventory and are a pure B2C player
modelled around ebay. Such players are likely to
emerge as strong and long-term players in the
industry.
Tmall is so popular that even Zara in China entered
Tmall in October 2014 to gain a stronger foothold
in China. Zara has been operating its own ecom-
merce portal since 2010. It is interesting to note
that Zara’s china website traffic ranking is at 6685 as
against Tmall’s 5th rank.
“The Tata group has such a wide presence that
logically it can anchor a market place — it depends
on how it wants to position itself (single platform or
multiple),” says Mr Bawankule of Google.
An industry expert explains, “Individual brands
or retail formats may not have appetite to make
high investments in building a brand-centric mar-
ketplace. Retail companies’ forte is product and
merchandise and they should focus on it. They
don’t have to get drawn into technology, scientific
marketing and data analytics that goes into building
a credible online marketplace. These are distrac-
tions for retailers.” But then, why hasn’t any major
retailer abroad started its own marketplace? The
industry expert says that, “Organized retail is 85%
of the retail market in developed markets and hence
retailers individually are of critical size and scale — it
does not make sense for them to be marketplaces
—it made more economic sense for them to evolve
their own online business models — for example,
Wal-Mart had 11.4% of US retail sales — no Indian
retailer will be anywhere close to that number.”
Tmall of India
“Individual brands or retail formats may not have appetite to make high investments in building a brand-centric marketplace. Retail companies’ forte is product and merchandise and they should focus on it. They don’t have to get drawn into technology, scientific marketing and data analytics that goes into building a credible online marketplace. These are distractions for retailers.”
“Official brand sites in China account for very small % of searches made by consumers…underscoring the importance
of identifying the relevant platforms and its parts to reach the shopper”
Sour
ce: B
CG
Search for deals (group buy)
Tmall or other busi-ness-to-consumer sites
Search for product or brand
Taobao (a consumer- to-consumer site)
Browse products or sites
Search engine
Search for specific websites
Information site (eg. Sina.com)
40% 24% 34%
2%
19%11%
32%
24%
15%
2%2%
2%
10% 15%

39GROUND ZERO GROUND ZERO 15 - 30 Nov 2014 15 - 30 Nov 2014 38
TATA GROUP OF COMPANIES
Titan Company LtdInfiniti Retail
Trent
Tata Global Beverages
Casa Decor Tata Industries
Tata Ceramics
– Croma chain of electronic stores
– Luxury Furnishing – CAT, Merrell, Aerosoles footwear– Leather accesories such as bags
Jewellery: Tanishq, Goldplus, ZoyaWatches: World of Titan, Sonata, Ver-sace, Seiko, Hugo Boss, Citizen, Fossil, Titan, Xylys, Esprit, Tommy Hilfiger, etcTitan Eye plus
Sells fine-bone china crockery and tableware
Tata Tea, Tetley, Good Earth, Tata Coffee, Himalayan Water etc
Westside: Pvt label dept storesStar Bazaar,: Hypermarket Landmark: Books, Toys, Stationaries etcZara : International fast fashion brand
dous brand equity. Trent’s Westside is a private label
driven departmental store and it controls the entire
experience from the product to retailing. Titan’s Mia
range (daily wear & small ticket sizes) of jewellery
could find wider markets when sold online, sup-
ported by Tanishq’s strong store network, supply
chain and customer trust. Tata group’s association
with international brands such as Zara is an added
advantage. The advantage a new player entering
the market will have is that it can learn from the
mistakes the existing players have made and hence
the learning curve will be shorter, says the expert.
In a platform such as Tmall, responsibilities are
demarcated and divided between brands and
marketplace on the basis of inherent strengths and
capabilities. Some of the things that brands have
The advantage a new player entering the market will have is that it can learn from the mistakes the existing players have made and hence the learning curve will be shorter.
The marketplace needs to have as many categories
as possible. The Indian Tmall, with an omni-channel
proposition, will be a unique offering. A marketplace
is like a mall and will always draw more visitors than
a standalone website (a store) selling one category. If
a certain conglomerate is present in multiple catego-
ries, then it would be logical for it to anchor such a
brand-centric market place and subsequently tie up
with players in categories that are not in the portfo-
lio. An expert emphasises that, “It is how efficiently
one takes the brand to the consumer.” He cites the
example of Aditya Birla and Tata groups, which can
leverage on such platforms as they are present in
multiple categories. The Tata group is present in all
major categories from apparel (Westside) to books
to watches and jewellery (Titan) and enjoys tremen-
So what will the Tmall of India look like?
Sour
ce: T
ata
Grou
p, P
hilli
pCap
ital R
esea
rch

39GROUND ZERO GROUND ZERO 15 - 30 Nov 2014 15 - 30 Nov 2014 38
to manage will be pricing, merchandise range, and
ecosystem. Brands will have to provide the full-range
to the platform, while the marketplace manages the
technology and logistics and sets up an omni-chan-
nel infrastructure. Therefore, the realisation per SKU
is higher and margin shared will be commensurate.
The absolute investment will be just 5% of what one
would have incurred if it were to go omni on its own,
as even the marketing expenses will be managed by
the marketplace (due to the multiple categories it
offers).
Customer acquisition for such a marketplace may
be easier due to the existing loyalty programs of
the brands under a group’s umbrella. Customers
can continue to get loyalty on purchasing from this
platform. Using points to buy other categories will
be stage two, as the entire loyalty program needs to
integrate.
Going omni alone has its pitfalls. When an offline re-
tailer goes online, it’s not his forte or area of strength
to operate a shopping website. There is always a
channel conflict of offline vs. online - what stock
to offer, how much discount to offer — all of these
conflicts get addressed usually in favour of offline.
Therefore, the online business grows in the shadow
of the big tree. The online business requires a differ-
ent mind-set and skill set hence has to be separately
funded entity and with a team of specialists. That
perhaps explains why Tata Group’s ecommerce initia-
tive is said to be under Tata Industries and is being
driven independently with a dedicated team of spe-
cialists. The venture is reportedly being put together
by Ashutosh Pandey, former COO of Landmark and
it has also reportedly roped in Sarvesh Dwivedi, who
was heading the lifestyle division of eBay India.
“In the month of October 2014, the 3 big online
sales by Flipkart (including Myntra), Snapdeal and
Amazon clocked a turnover of Rs 10 bn in the
fashion category, accounting for nearly 5% of overall
category sales for the period,” says Mr Sanjay Behl,
CEO Lifestyle Business, Raymond.
Online players don’t have significant advantage
on sourcing merchandise, says an executive with a
national brand. Shopper’s Stop may carry limited
lines due to limited shelf space. Online players don’t
have constraints to display, but they still have to buy
inventory. Online player are scouring products from
mainline brands but brands are wary of launching
new introductions and better lines online. For e.g.,
Van Heusen introduces new lines every week. Myntra
or Jabong, like any other sellers with inventory
models, have to buy from the brand — they will
take a call on which lines to buy, thus narrowing the
collection. Thereafter, if they get stuck with some
inventory, it limits the ability to buy the next round of
inventory, thus limiting the lines of the brand it can
carry.
We came across interesting patterns and cues on
brands and their relationship with ecommerce play-
ers. Madura Garments’ largest brand Louis Philippe
doesn’t retail on Myntra, Jabong, or Flipkart. How-
ever it does retail on Snapdeal, courtesy a reseller.
These are possibly measures taken by the brands
to protect the brand image and the interests of its
offline partners (from unreasonable discounting).
Threat to departmental stores is clear but not present
In a platform such as Tmall, responsibilities are demarcated and divided between brands and marketplace on the basis of inherent strengths and capabilities. Brands will have to provide the full-range to the platform, while the marketplace manages the technology and logistics and sets up an omni-channel infrastructure.
One of the key draws for brands to participate in a
marketplace or give preference to a particular mar-
ket place is providing data analytics — for example,
providing data on best-selling stocks to the brands.
This helps the brands plan their next season’s inven-
tory better. Existing market places don’t share the
data with the brands as - their currency is customer
data.

41GROUND ZERO GROUND ZERO 15 - 30 Nov 2014 15 - 30 Nov 2014 40
Madura Garments’s Louis Philippe has very limited presence online, however
it retails on Shoppersstop.com
Louis Philippe - only non apparel is sold on major ecom portals

41GROUND ZERO GROUND ZERO 15 - 30 Nov 2014 15 - 30 Nov 2014 40
New Biba collection sold online at no discounts
Brands are wary of online channels – for an online
portal, a product is a product (that is, it will not
differentiate between black shoes of two different
brands) and it will discount it despite the brand
proposition. However, brands do use online chan-
nels for liquidating inventory. These two reasons put
together conspire to create a small range for online
stores by any brand. Therefore, there is no direct
competition yet in merchandise as far as apparel is
concerned.
Conclusion: The Winner may not be born yet
The entire retailing space is rapidly changing
and businesses will reinvent and new models will
emerge challenging even the existing disrupters.
From the existing bunch of ecommerce players,
structurally sound and lean business models will
thrive. Third-party retailers have the opportunity to
revolutionise their businesses and become relevant
online marketplaces for the brands. India could see a
brand-based market place akin to Tmall, with strong
logistics and technology support — this could help
Indian brands grow. A brand such as Bata, with a
large physical store network of over 1,400 stores,
is conceptually well suited for such an omni-chan-
nel enterprise and maybe the Tata group’s ecom-
merce initiative (with Trent and Titan playing vital
roles) could very well be a rewarding offering for its
participants as against the current winner takes it all
charade.
“In the month of October 2014, the 3 big online sales by Flipkart (including Myntra), Snapdeal and Amazon clocked a turnover of Rs 10 bn in the fashion category, accounting for nearly 5% of overall category sales for the period,” says Mr Sanjay Behl, CEO Lifestyle Business, Raymond.
New Biba collection in stores also sold online but at no discount
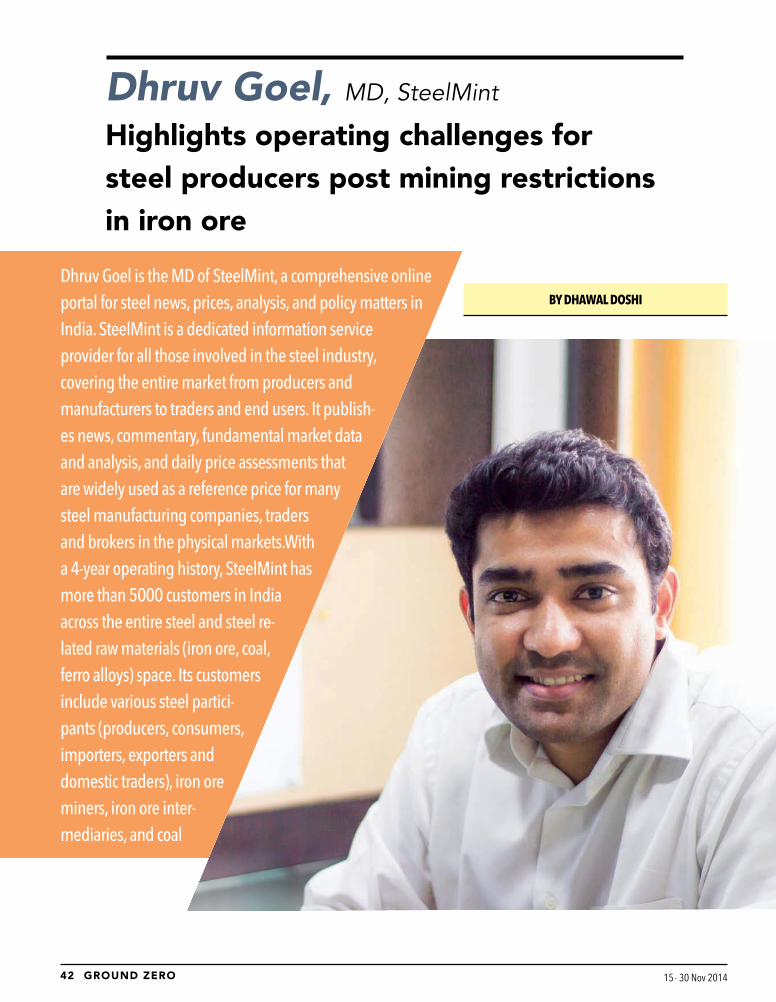
43GROUND ZERO GROUND ZERO 15 - 30 Nov 2014 15 - 30 Nov 2014 42
Dhruv Goel, MD, SteelMint
Highlights operating challenges for steel producers post mining restrictions in iron ore
BY DHAWAL DOSHI
Dhruv Goel is the MD of SteelMint, a comprehensive online portal for steel news, prices, analysis, and policy matters in India. SteelMint is a dedicated information service provider for all those involved in the steel industry, covering the entire market from producers and manufacturers to traders and end users. It publish-es news, commentary, fundamental market data and analysis, and daily price assessments that are widely used as a reference price for many steel manufacturing companies, traders and brokers in the physical markets.With a 4-year operating history, SteelMint has more than 5000 customers in India across the entire steel and steel re-lated raw materials (iron ore, coal, ferro alloys) space. Its customers include various steel partici-pants (producers, consumers, importers, exporters and domestic traders), iron ore miners, iron ore inter-mediaries, and coal
43GROUND ZERO GROUND ZERO 15 - 30 Nov 2014 15 - 30 Nov 2014 42
What is the current iron-ore mining situation in various
states?
The iron ore situation in India has been going from bad to
worse because various restrictions are being imposed and
there are delays in getting approvals to start mining. In FY15,
iron ore output and availability will see a sharp drop across
major states except Chhattisgarh. Although Karnataka will
see its output increase from 18mn tonnes in FY14 to around
20-21mn tonnes in FY15 this is a bit misleading —10mn
tonnes of dumps (that is 5mn tonnes of usable iron ore) were
auctioned in FY14, which is why FY15 will see a drop in iron
ore availability.
For Karnataka, in FY16, iron ore output should move up to
24-25mn tonnes because some mines may get approvals
to start operations. Mineral Enterprises is waiting for final
approval — this will see a 3mn-tonne mine opening up. Sesa
Sterlite is waiting for MoEF’s clearance and lease renewals
after which it will be able to re-start its iron ore mine—this is
expected to take around 6 months.
Orissa will see a sharp fall in its output in FY15 if there are
further delays in opening up the 18 mines that are shut
because they haven’t got lease renewals yet. Orissa’s iron ore
output should fall by at least 15-20mn tonnes in FY15 (it was
72mn tonnes in FY14). In the first half of FY15, output was
22mn tonnes, which is a yoy fall of 25-30%.
We haven’t seen any further progress in the process of
renewing the leases of these 18 mines after CEC submit-
ted its report to the Supreme Court. Orissa’s government
has requested a 3-month extension to the Supreme Court’s
deadline of 16th November 2014 for taking a final call on
renewing the leases. The state is trying to partly compensate
for the drop in output by increasing the mining done by
Orissa Mining Corporation (OMC). OMC plans to increase
its iron ore production from 1.8mn tonnes in FY14 to 3.3mn
tonnes in FY15 and 4mn tonnes in FY16. Its eventual plan is
to increase the capacity to 18mn tonnes by FY20.
The situation is similarly bad in Jharkhand where large iron
ore mines have been shut for want of lease renewals. This
issue will probably find some kind of solution only after state
elections or court interventions.
Can iron ore imports meet the domestic shortages? What
has been the trend of iron ore imports into India?
Iron ore imports into India have seen a significant jump over
the past few months and JSW Steel and Tata group are the
leading importers. But, these imports face various logistic
bottlenecks and the inland freight costs are also very high —
these are deterrents for large-scale imports. Iron ore imports
into India between April and October 2014 were 5.2mn
tonnes – in the same period last year, they were just 300,000
tonnes. Total imports in FY15 should come up to 10-11mn
tonnes — and even these will not be sufficient enough to
meet domestic shortages.
Can you highlight the various logistic bottlenecks in im-
porting iron ore into India?
The major issues that iron ore importers face are higher
waiting time for vessels to berth (at ports) and rake availabil-
ity. Within ports, Krishnapatnam has emerged as the best to
import iron ore. The waiting time for berthing in ports like
Paradeep and Haldia is 10-15 days but in Krishnapatnam it is
just 1-2 days. This higher waiting time not only leads to high-
er demurrage costs, but it also leads to uncertainty, given
that global iron ore and steel prices are so volatile —see, a
4-day wait for a vessel carrying 50,000-60,000 tonnes of iron
ore increases the total cost by about US$ 1 per tonne!
Rake availability is also a major issue for importing iron ore,
because preference is given to coal supplies. Except Krishna-
patnam port (which is currently loading 20-21 rakes a day)
other ports are getting only 4-5 rakes a day for loading iron
ore. Krishnapatnam is expected to handle the largest quan-
tum of iron ore imports in FY15. It has already exceeded its
full-year target of handling 3mn tonnes of ore during the first
seven months of FY15. April-October 2014 iron ore imports
at the port stand at 3.5mn tonnes, which represents 62% of
total iron ore imports into India.
Has the recent jump in pellet capacities partially offset
shortage of iron ore lumps?
Pellet capacities in India (merchant and captive) have jumped
from 67mn tonnes in FY14 to 88mn tonnes in FY15. How-
ever,these increases have not helped ease off the scarcity in
iron ore lumps because most of the merchant pellet plants
across India are operating at just around 40-50% utilisations.
Shortage of iron ore fines has forced various producers to cut
back on their production. Pellet producers situated at Barbill
(hub for iron ore trading in Orissa) are also finding it difficult
to source fines and hence they have limited production. Pel-
let production using imported fines is not economical, even if
the logistics are arranged.
45GROUND ZERO GROUND ZERO 15 - 30 Nov 2014 15 - 30 Nov 2014 44
How are iron ore prices expected to behave, given the
scarcity in India?
Because of the domestic shortages, its price is firm in India
even when international iron ore prices are falling. There is
strong demand from various pellet producers and blast fur-
nace operators and this has helped iron ore miners in Orissa
and Jharkhand to hike iron ore fines prices recently. In fact,
these prices can go up by another 300-500 rupees per tonne
if the lease renewal issue for iron ore mines in Jharkhand
is not resolved soon. Because of higher fines prices and
shrinking volumes, the margins of pellet producers have seen
significant erosion.
Unlike fines, there is not much room for price increases in
iron ore lumps prices, despite the shortages. This is because
sponge iron producers are already operating at thin margins
and this has limited miners’ ability to hike prices. If the miners
hike lumps prices any further, sponge iron production will get
affected negatively, and this will pull down volumes. This has
been the major factor in the 200 rupees per tonne price cut
by NMDC for November 2014 shipments.
How have the secondary steel and sponge iron sectors
performed given the constraints in sourcing iron ore and
coal?
A fall in e-auction coal volumes and iron ore shortages have
significantly impacted sponge iron producers in the eastern
belt of India. Sponge iron production is estimated to be
around 21mn tonnes in FY15 compared to 24mn tonnes in
FY14. The smaller producers have felt the impact badly —
they are larger in number and account for 50% of sponge
production. Small producers include plants with a per day
capacity of 100/200/300 tonnes. The larger guys have
managed their production levels. Higher cost and falling
realisations (which have corrected by Rs 400-500 per tonne
compared to Rs 1000-1500 for long steel products) have
significantly pressured the margins for these small sponge
iron producers. Any further fall in prices or increase in cost
will see further production cuts from them.
Declining steel scrap prices is a major risk to sponge iron
prices and production. Imported scrap prices have corrected
by US$ 40 per tonne over the last month. This can pressure
sponge iron prices and eventually impact production.
Have production disruptions of the secondary sector
benefitted larger steel producers?
The lower steel demand over the past year has already seen
primary producers capture a good amount of market from
the secondary producers. However, further disruptions in
secondary steel production will not significantly benefit
primary producers as these are getting replaced via imports.
Long steel imports have seen a strong pickup in the past
couple of months because of the fall in global steel prices.
April-October 2014 long-steel imports have touched 720,000
tonnes as against insignificant imports in prior years. These
are not expected to jump much further from current levels
(monthly rate) as expectation of anti-dumping duty has been
acting as a deterrent for any large scale imports. The Central
Board of Excise & Customs has also recently issued a circular
asking for steel imports to be compliant with BIS norms. This
will make the rate of imports slow down further as only a few
Chinese steel mills are BIS compliant.
Full year long-steel imports are expected to be in the range
of 1mn to 1.5mn tonnes in FY15. To give you a perspective,
total long-steel production in India in FY14 has been 30mn
tonnes and in the first half of FY15, it has been 15mn tonnes.
Of the total long production, around 2/3rd is produced by
the secondary steel sector.
At what premium/discount are the domestic steel prices
quoting compared to imports? Can the domestic prices
see further declines?
Domestic steel prices are still trading at significant premiums
to the imported prices, especially in the long-steel segment.
These subdued prices (internationally) along with lower de-
mand can put pressure on local prices going ahead.
Primary producers can see further price falls to the tune of Rs
500-1000 per tonne in flats as well as long products. Import
offers from China for Longs vary between US$ 440-450 CIF
India, which is similar to secondary steel prices, but still at a
significant discount to primary producer prices. Offers from
primary producers are currently at Rs 39,000/39,500 per
tonne in Mumbai. Relatively lower import volumes (com-
pared to size of the longs industry) and pre-qualification for
primary producers in various government projects will see
this premium continuing.
Import offers from China for flat products vary around US$
490-500 CIF India. This amounts to a premium of Rs 3000
per tonne, much higher than the normal premiums to import-
ed prices, which range between Rs 1500 and Rs 2000 per
tonne.

45GROUND ZERO GROUND ZERO 15 - 30 Nov 2014 15 - 30 Nov 2014 44
Indian Economy – Trend Indicators
Monthly Economic Indicators
Quarterly Economic Indicators
Growth Rates (%) Sep-13 Oct-13 Nov-13 Dec-13 Jan-14 Feb-14 Mar-14 Apr-14 May-14 Jun-14 Jul-14 Aug-14 Sep-14 Oct-14
IIP 2.7 -1.2 -1.3 0.1 1.1 -2.0 -0.5 3.7 5.6 4.3 0.4 0.5 2.5 -
PMI 49.6 49.6 51.3 50.7 51.4 52.5 51.3 51.3 51.4 51.5 52.2 50.6 51.0 51.6
Core sector 9.0 -0.6 1.7 2.1 1.6 4.5 2.5 4.2 2.3 7.3 2.7 5.8 1.9 -
WPI 7.0 7.2 7.5 6.4 5.1 5.0 6.0 5.5 6.2 5.7 5.4 3.9 2.4 1.8
CPI 9.8 10.2 11.2 9.9 8.8 8.0 8.3 8.6 8.3 7.5 8.0 7.7 6.5 5.5
Money Supply 12.5 13.0 14.5 14.9 14.5 14.5 13.5 13.9 13.2 12.2 12.7 13.0 12.7 12.0
Deposit 14.1 14.4 16.1 15.8 15.7 15.9 14.6 15.1 13.8 12.2 12.7 13.2 13.0 12.4
Credit 17.8 16.6 15.5 14.5 14.7 14.4 14.3 14.1 12.8 13.1 13.1 10.6 9.4 10.8
Exports 13.0 13.5 5.9 3.5 3.8 -3.7 -3.2 5.3 12.4 10.2 7.3 2.4 2.7 -
Imports -18.5 -14.5 -16.4 -15.2 -18.1 -17.1 -2.1 -15.0 -11.4 8.3 4.3 2.1 26.0 -
Trade deficit (USD Bn) -6.1 -10.6 -9.2 -10.1 -9.9 -8.1 -10.5 -10.1 -11.2 -11.8 -12.2 -10.8 -14.2 -
Net FDI (USD Bn) 4.5 1.8 2.4 1.9 0.4 -0.1 2.1 2.0 4.8 2.4 3.6 2.5 3.6 -
FII (USD Bn) 0.2 -0.4 0.0 2.9 2.6 1.5 5.4 -0.1 7.7 4.8 5.4 2.1 2.4 -
ECB (USD Bn) 3.3 1.9 2.2 4.6 1.8 4.3 3.6 3.2 1.5 1.9 3.7 0.5 3.2 -
NRI Deposits (USD Bn) 5.9 4.5 14.6 2.0 0.7 0.7 2.5 1.4 1.1 0.0 0.0 0.0 0.0 0.0
Dollar-Rupee 63.8 61.6 62.6 61.9 62.1 62.2 61.0 60.4 59.3 60.2 60.1 60.9 61.8 61.4
FOREX Reserves (USD Bn) 276.3 283.0 291.3 295.7 292.2 294.4 303.7 309.9 312.4 315.8 320.6 318.6 314.2 315.9
Balance of Payment (USD Bn) Q1FY13 Q2FY13 Q3FY13 Q4FY13 Q1FY14 Q2FY14 Q3FY14 Q4FY14 Q1FY15Exports 75.0 72.6 74.2 84.8 73.9 81.2 79.8 83.7 81.7Imports 118.9 120.4 132.6 130.4 124.4 114.5 112.9 114.3 116.4Trade deficit (43.8) (47.8) (58.4) (45.6) (50.5) (33.3) (33.2) (30.7) (34.6)Net Invisibles 26.8 26.7 26.6 27.5 28.7 28.1 29.1 29.3 26.8CAD (17.1) (21.1) (31.8) (18.2) (21.8) (5.2) (4.1) (1.3) (7.9)CAD (% of GDP) 4.0 5.1 6.5 3.5 4.9 1.2 0.8 0.3 1.7Capital Account 16.5 20.7 31.5 20.5 20.6 (4.8) 23.8 9.2 19.8BoP 0.5 (0.2) 0.8 2.7 (0.3) (10.4) 19.1 7.1 11.2
GDP and its Components (YoY, %) Q1FY13 Q2FY13 Q3FY13 Q4FY13 Q1FY14 Q2FY14 Q3FY14 Q4FY14 Q1FY15Agriculture & allied activities 1.8 1.8 0.8 1.6 4.0 5.0 3.7 6.3 3.8 Industry (0.6) 0.1 2.0 2.0 (0.9) 1.8 (0.9) (0.5) 4.0 Mining & Quarrying (1.1) (0.1) (2.0) (4.8) (3.9) - (1.2) (0.4) 2.1 Manufacturing (1.1) (0.0) 2.5 3.0 (1.2) 1.3 (1.5) (1.4) 3.5 Electricity, Gas & Water Supply 4.2 1.3 2.6 0.9 3.8 7.8 5.0 7.2 10.2 Services 6.7 6.5 6.1 5.8 6.5 6.1 6.4 5.8 6.6 Construction 2.8 (1.9) 1.0 2.4 1.1 4.4 0.6 0.7 4.8 Trade, Hotel, Transport and Communications 4.0 5.6 5.9 4.8 1.6 3.6 2.9 3.9 2.8 Finance, Insurance, Real Estate & Business Services 11.7 10.6 10.2 11.2 12.9 12.1 14.1 12.4 10.4 Community, Social & Personal Services 7.6 7.4 4.0 2.8 10.6 3.6 5.7 3.3 9.1 GDP at FC 4.5 4.6 4.4 4.4 4.7 5.2 4.6 4.6 5.7

47GROUND ZERO GROUND ZERO 15 - 30 Nov 2014 15 - 30 Nov 2014 46
Annual Economic Indicators and Forecasts Indicators Units FY6 FY7 FY8 FY9 FY10 FY11 FY12 FY13 FY14E FY15E
Real GDP growth % 9.5 9.6 9.3 6.7 8.6 8.9 6.7 4.5 4.7 5.4
Agriculture % 5.1 4.2 5.8 0.1 0.8 8.6 5 1.4 4.7 1.6
Industry % 8.5 12.9 9.2 4.1 10.2 8.3 6.7 0.9 (0.1) 2.8
Services % 11.1 10.1 10.3 9.4 10 9.2 7.1 6.2 6.0 7.0
Real GDP Rs Bn 32,531 35,644 38,966 41,587 45,161 49,185 52,475 54,821 57,418 60,691
Real GDP US$ Bn 733 787 967 908 953 1,079 1,096 1,008 950 1,012
Nominal GDP Rs Bn 36,925 42,937 49,864 56,301 64,778 77,841 90,097 101,133 113,551 127,643
Nominal GDP US$ Bn 832 948 1,237 1,229 1,367 1,707 1,881 1,859 1,878 2,127
Population Mn 1,106 1,122 1,138 1,154 1,170 1,186 1,202 1,219 1,236 1,254
Per Capita Income US$ 753 845 1,087 1,065 1,168 1,439 1,565 1,525 1,519 1,697
WPI (Average) % 4.5 6.6 4.7 8.1 3.8 9.6 8.7 7.4 6.0 4.0
CPI (Average) % 4.2 6.8 6.4 9 12.4 10.4 8.3 10.2 9.5 7.0
Money Supply % 15.5 20 22.1 20.5 19.2 16.2 15.8 13.6 13.5 14.0
CRR % 5 6 7.5 5 5.75 6 4.75 4.0 4.0 4.0
Repo rate % 6.5 7.5 7.75 5 5 6.75 8.5 7.5 8.0 8.0
Reverse repo rate % 5.5 6 6 3.5 3.5 5.75 7.5 6.5 7.0 7.0
Bank Deposit growth % 24 23.8 22.4 19.9 17.2 15.9 13.5 14.4 14.6 15.0
Bank Credit growth % 37 28.1 22.3 17.5 16.9 21.5 17.0 15.0 14.3 16.0
Centre Fiscal Deficit Rs Bn 1,464 1,426 1,437 3,370 4,140 3,736 5,160 5,209 5,245 5,312
Centre Fiscal Deficit % of GDP 4 3.3 2.9 6 6.4 4.8 5.7 5.2 4.6 4.1
Gross Central Govt Borrowings Rs Bn 1,310 1,460 1,681 2,730 4,510 4,370 5,098 5,580 5,639 5,970
Net Central Govt Borrowings Rs Bn 954 1,104 1,318 2,336 3,984 3,254 4,362 4,674 4,689 4,573
State Fiscal Deficit % of GDP 2.4 1.8 1.5 2.4 2.9 2.1 2.3 2.2 2.5 2.5
Consolidted Fiscal Deficit % of GDP 6.4 5.1 4.4 8.4 9.3 6.9 8.1 7.4 7.1 6.6
Exports US$ Bn 105.2 128.9 166.2 189.0 182.4 251.1 309.8 306.6 318.6 331.4
YoY Growth % 23.4 22.6 28.9 13.7 -3.5 37.6 23.4 -1.0 3.9 4.0
Imports US$ Bn 157.1 190.7 257.6 308.5 300.6 381.1 499.5 502.2 466.2 482.0
YoY Growth % 32.1 21.4 35.1 19.7 -2.5 26.7 31.1 0.5 -7.2 3.4
Trade Balance US$ Bn -51.9 -61.8 -91.5 -119.5 -118.2 -129.9 -189.8 -195.6 -147.6 -150.6
Net Invisibles US$ Bn 42.0 52.2 75.7 91.6 80.0 84.6 111.6 107.5 115.2 114.9
Current Account Deficit US$ Bn -9.9 -9.6 -15.7 -27.9 -38.2 -45.3 -78.2 -88.2 -32.4 -35.7
CAD (% of GDP) % -1.2 -1.0 -1.3 -2.3 -2.8 -2.6 -4.2 -4.7 -1.7 -1.7
Capital Account Balance US$ Bn 25.5 45.2 106.6 7.8 51.6 62.0 67.8 89.3 48.8 59.5
Dollar-Rupee (Average) 44.4 45.3 40.3 45.8 47.4 45.6 47.9 54.4 60.5 60.0
Source: RBI, CSO, CGA, Ministry of Agriculture, Ministry of commerce, Bloomberg, PhillipCapital India Research

47GROUND ZERO GROUND ZERO 15 - 30 Nov 2014 15 - 30 Nov 2014 46
Note
: For
ban
ks, E
BITD
A is
pre-
prov
ision
pro
fit
Phill
ipC
apita
l Ind
ia C
over
age
Uni
vers
e: V
alua
tio
n Su
mm
ary
CMP
Mkt
Cap
Ne
t Sal
es (R
s mn)
EB
IDTA
(Rs
mn)
PAT (
Rs m
n)EP
S (R
s)
EPS
Grow
th (%
) P
/E (x
) P
/B (x
) EV
/EBI
TDA
(x)
ROE
(%)
ROCE
(%)
Nam
e of
com
pany
Sect
orRs
Rs m
nFY
14E
FY15
EFY
14E
FY15
EFY
14E
FY15
EFY
14E
FY15
EFY
14E
FY15
EFY
14E
FY15
EFY
14E
FY15
EFY
14E
FY15
EFY
14E
FY15
EFY
14E
FY15
E
Cham
bal F
ertil
iser
sAg
ri In
puts
62 2
5,84
4 8
9,84
0 8
7,43
6 7
,036
7
,824
3
,328
3
,257
8.
07.
846
.9-2
.17.
87.
91.
21.
18.
87.
216
.614
.75.
75.
9
Coro
man
del F
ert L
tdAg
ri In
puts
330
94,
311
100
,586
1
09,9
67
7,7
57
9,3
49
3,6
94
5,1
34
12.9
18.0
-15.
439
.025
.518
.44.
13.
413
.712
.316
.218
.614
.918
.7
Tata
Che
mica
ls Lt
dAg
ri In
puts
406
103
,342
1
57,3
53
153
,438
1
8,09
4 2
0,86
7 3
,882
6
,961
15
.227
.3-5
5.3
79.3
26.6
14.8
1.9
2.2
9.5
8.0
7.0
15.1
14.3
7.2
Deep
ak Fe
rtilis
ers
Agri
Inpu
ts15
6 1
3,77
3 3
9,20
4 3
2,74
4 5
,636
4
,882
2
,519
2
,309
28
.626
.295
.1-8
.35.
56.
00.
90.
93.
74.
018
.415
.013
.110
.9
Kave
ri Se
eds
Agri
Inpu
ts91
8 6
3,27
4 1
0,11
2 1
2,21
0 2
,213
3
,241
2
,092
3
,049
30
.444
.564
.546
.230
.220
.612
.38.
328
.619
.140
.640
.346
.546
.7
PI In
dust
ries
Agri
Inpu
ts44
5 6
0,77
6 1
5,95
5 1
8,92
8 2
,892
3
,480
1
,884
2
,337
13
.817
.292
.624
.032
.125
.98.
96.
921
.217
.327
.626
.625
.325
.5
Ralli
s Ind
iaAg
ri In
puts
230
44,
767
17,
466
19,
423
2,6
13
3,1
40
1,5
19
1,8
13
7.8
9.3
23.2
19.3
29.5
24.7
6.2
5.3
17.3
14.3
21.2
21.5
20.0
20.5
Unite
d Ph
osph
orus
Agri
Inpu
ts34
7 1
48,5
11
105
,800
1
21,1
45
20,
196
20,
948
10,
145
12,
153
23.7
28.4
29.4
19.8
14.6
12.2
2.8
2.3
8.3
7.9
19.7
20.3
13.1
14.5
Baja
j Aut
oAu
tom
obile
s26
00 7
52,3
54
197
,176
2
18,1
08
41,
057
44,
476
32,
433
34,
364
112.
111
8.8
6.6
6.0
23.2
21.9
7.8
6.6
18.2
16.8
33.8
30.3
35.4
31.5
Bhar
at Fo
rge
Auto
mob
iles
818
190
,414
6
6,43
5 6
9,50
5 1
0,27
1 1
2,32
9 4
,179
6
,060
17
.926
.083
.445
.045
.631
.47.
36.
320
.216
.516
.119
.910
.814
.2
Hero
Mot
oCor
pAu
tom
obile
s30
95 6
18,0
33
251
,249
2
91,2
52
35,
401
39,
735
23,
475
27,
120
117.
613
5.8
7.0
15.5
26.3
22.8
11.0
9.4
17.4
15.5
41.9
41.3
44.3
45.6
Asho
k Le
ylan
dAu
tom
obile
s46
131
,764
9
5,40
4 1
07,9
36
1,6
64
6,5
82
(4,7
64)
(417
)-1
.8-0
.2-4
31.2
-91.
2-2
5.9
-295
.42.
72.
810
7.2
26.7
-10.
6-0
.9-1
.92.
2
Mah
& M
ahAu
tom
obile
s13
04 8
09,7
18
395
,934
4
33,6
53
47,
680
52,
264
36,
459
37,
608
59.4
61.3
8.5
3.2
22.0
21.3
4.7
4.0
17.2
15.8
21.6
19.0
16.2
16.3
Mar
uti S
uzuk
iAu
tom
obile
s33
34 1
,007
,135
4
26,4
48
502
,634
5
0,95
9 6
2,82
1 2
7,83
0 3
5,84
0 92
.111
8.6
16.3
28.8
36.2
28.1
4.8
4.2
20.0
15.9
13.3
15.0
13.0
14.6
Apol
lo Ty
res
Auto
mob
iles
221
112
,316
1
33,1
27
137
,896
1
7,76
2 1
8,56
1 9
,526
9
,973
18
.919
.864
.84.
711
.711
.22.
52.
17.
46.
624
.520
.616
.715
.9
Tata
Mot
ors
Auto
mob
iles
533
1,5
97,9
28
2,3
06,7
71
2,7
42,0
17
374
,029
4
33,7
13
139
,910
1
80,5
77
43.9
56.6
41.4
29.1
12.2
9.4
3.2
2.4
4.8
4.2
26.1
25.3
16.7
16.2
ABB
Indi
aCa
p Go
ods
1167
247
,223
7
6,31
6 7
9,45
0 4
,036
5
,733
1
,899
3
,452
9.
016
.3-2
8.0
81.8
130.
271
.69.
28.
662
.043
.77.
112
.07.
611
.0
BHEL
Cap
Good
s25
6 6
26,4
63
383
,888
3
41,5
74
47,
064
40,
737
36,
534
31,
809
14.9
13.0
-44.
8-1
2.9
17.1
19.7
1.9
1.8
11.4
11.2
11.1
9.0
8.6
7.0
Alst
om T&
DCa
p Go
ods
371
94,
916
35,
171
43,
610
3,1
02
4,7
20
1,1
42
2,2
61
4.5
8.8
-9.0
98.0
83.1
42.0
7.6
6.7
31.8
20.9
9.1
15.9
10.9
15.1
Crom
pton
Gre
aves
Cap
Good
s18
8 1
17,7
03
134
,806
1
44,3
70
6,8
20
7,3
60
2,4
43
3,4
48
3.9
5.5
195.
741
.148
.234
.13.
23.
019
.316
.56.
78.
95.
36.
7
Engi
neer
s Ind
iaCa
p Go
ods
264
88,
783
18,
236
16,
234
3,7
66
2,2
46
4,7
89
3,6
86
14.2
10.9
-23.
8-2
3.0
18.5
24.1
3.6
3.4
18.9
31.3
19.5
14.2
20.4
14.6
KEC
Inte
rnat
iona
lCa
p Go
ods
111
28,
473
79,
018
83,
453
4,9
33
6,1
17
849
2
,069
3.
38.
030
.314
3.6
33.5
13.8
2.4
2.1
9.1
6.9
7.1
15.3
8.2
11.0
Lars
en &
Toub
roCa
p Go
ods
1636
1,5
18,2
17
565
,990
6
21,2
39
66,
671
70,
459
49,
047
48,
210
52.9
51.8
18.7
-2.2
30.9
31.6
4.5
4.1
23.6
22.1
14.6
12.9
12.6
11.0
Siem
ens
Cap
Good
s87
3 3
10,8
93
111
,452
1
12,3
00
4,8
31
6,7
18
4,3
13
4,4
78
12.1
12.6
-18.
83.
872
.169
.47.
77.
363
.145
.210
.710
.57.
88.
1
Cum
min
s Ind
iaCa
p Go
ods
729
202
,093
3
8,99
1 4
4,64
3 6
,192
7
,576
6
,000
7
,305
21
.626
.4-9
.521
.733
.727
.77.
97.
032
.526
.423
.425
.220
.222
.6
Ther
max
Cap
Good
s90
0 1
07,2
76
50,
999
56,
347
4,3
73
4,3
71
2,5
44
2,5
91
21.3
21.7
-20.
51.
942
.241
.45.
34.
825
.224
.912
.511
.710
.19.
2
VA Te
ch W
abag
Cap
Good
s16
05 4
3,00
4 2
2,30
1 2
6,97
1 1
,800
2
,556
1
,083
1
,490
40
.756
.019
.637
.639
.428
.75.
14.
522
.716
.112
.915
.611
.713
.7
Volta
sCa
p Go
ods
252
83,
499
52,
660
54,
852
2,6
56
3,6
56
2,2
43
2,7
21
6.8
8.2
15.0
21.3
37.2
30.7
4.6
4.2
31.4
22.8
12.3
13.6
11.9
13.5
ACC
Cem
ent
1503
282
,181
1
09,0
84
124
,747
1
3,69
0 1
9,90
1 1
0,94
7 1
1,87
6 58
.263
.2-2
1.5
8.5
25.8
23.8
3.6
3.4
18.8
13.9
14.0
14.3
11.7
11.4
Ambu
ja C
emen
tCe
men
t22
6 3
50,6
56
91,
180
231
,471
1
5,68
9 4
3,73
9 1
2,53
8 2
1,58
7 8.
110
.9-2
0.6
34.3
27.9
20.8
3.7
2.4
19.8
7.6
13.3
11.5
11.8
15.7
Indi
a Ce
men
tCe
men
t11
1 3
4,09
7 5
0,84
8 5
7,30
2 5
,914
7
,517
(6
46)
754
-2
.12.
5-1
31.0
-216
.7-5
2.8
45.2
0.9
0.9
11.0
8.2
-1.7
2.0
2.3
4.0
Man
gala
m C
emen
tCe
men
t27
6 7
,367
6
,997
1
0,68
9 5
82
1,4
96
418
6
51
15.7
24.4
-46.
055
.717
.611
.31.
51.
319
.47.
78.
211
.75.
08.
3
Shre
e Ce
men
tCe
men
t88
45 3
08,1
35
61,
817
73,
661
14,
288
19,
555
7,1
02
10,
178
203.
929
2.1
-29.
343
.343
.430
.36.
95.
721
.115
.315
.818
.714
.817
.8
Ultra
tech
Cem
ent
Cem
ent
2547
698
,891
2
14,4
37
268
,219
3
8,26
4 5
6,54
5 2
2,06
0 3
3,94
3 80
.412
3.8
-17.
653
.931
.720
.64.
13.
518
.912
.812
.816
.99.
013
.1
OCL I
ndia
Cem
ent
310
17,
642
19,
366
22,
057
2,9
92
3,5
36
1,0
75
1,3
59
18.9
23.9
-32.
626
.416
.413
.01.
51.
47.
46.
09.
410
.98.
89.
2
JK La
kshm
i Cem
ent
Cem
ent
377
44,
362
20,
566
22,
994
3,0
18
4,3
18
1,1
23
2,0
91
9.5
17.8
-41.
386
.239
.521
.23.
43.
118
.013
.28.
614
.46.
19.
6
Heid
elbe
rgCe
men
tCe
men
t89
20,
237
13,
648
17,
256
864
2
,598
(4
07)
591
-1
.82.
6-2
32.1
-245
.0-4
9.7
34.3
2.4
2.3
37.1
12.1
-4.9
6.6
1.3
5.4

49GROUND ZERO GROUND ZERO 15 - 30 Nov 2014 15 - 30 Nov 2014 48
CMP
Mkt
Cap
Ne
t Sal
es (R
s mn)
EB
IDTA
(Rs
mn)
PAT (
Rs m
n)EP
S (R
s)
EPS
Grow
th (%
) P
/E (x
) P
/B (x
) EV
/EBI
TDA
(x)
ROE
(%)
ROCE
(%)
Nam
e of
com
pany
Sect
orRs
Rs m
nFY
14E
FY15
EFY
14E
FY15
EFY
14E
FY15
EFY
14E
FY15
EFY
14E
FY15
EFY
14E
FY15
EFY
14E
FY15
EFY
14E
FY15
EFY
14E
FY15
EFY
14E
FY15
E
JK C
emen
tCe
men
t58
9 4
1,17
7 2
7,81
5 3
8,43
7 3
,384
6
,831
7
49
2,1
11
10.7
30.2
-67.
518
1.6
55.0
19.5
2.4
2.2
19.1
9.9
4.3
11.1
4.2
7.7
Dalm
ia B
hara
t Ltd
Cem
ent
423
34,
343
28,
670
35,
227
3,2
63
5,5
24
(84)
225
-1
.02.
8-1
04.3
-367
.1-4
07.9
152.
71.
11.
121
.314
.2-0
.30.
72.
44.
0
Andh
ra B
ank
Finan
cials
83 4
9,11
5 3
7,37
3 4
3,33
0 3
7,37
3 4
3,33
0 4
,356
8
,459
7.
414
.3-6
7.9
94.2
11.3
5.8
0.6
0.5
NMNM
5.1
9.4
0.3
0.5
Bank
of B
arod
a Fin
ancia
ls92
7 3
98,2
18
119
,653
1
42,3
28
119
,653
1
42,3
28
45,
411
55,
498
105.
412
8.9
-2.2
22.2
8.8
7.2
1.1
1.0
NMNM
13.8
15.0
0.8
0.8
Bank
of I
ndia
Fin
ancia
ls28
4 1
82,2
10
106
,289
1
28,6
52
106
,289
1
28,6
52
30,
691
37,
211
47.7
57.9
3.6
21.2
5.9
4.9
0.7
0.6
NMNM
12.6
13.6
0.6
0.6
Cana
ra B
ank
Finan
cials
402
185
,195
8
9,44
4 1
08,9
73
89,
444
108
,973
2
4,38
2 3
8,12
5 52
.982
.7-1
8.5
56.4
7.6
4.9
0.8
0.7
NMNM
10.0
14.4
0.5
0.7
Corp
orat
ion
bank
Finan
cials
339
56,
864
38,
502
43,
359
38,
502
43,
359
7,2
90
12,
466
43.5
74.4
-53.
671
.07.
84.
60.
60.
5NM
NM7.
411
.90.
40.
5
HDFC
Ban
kFin
ancia
ls91
0 2
,197
,395
1
84,2
34
222
,367
1
84,2
34
222
,367
8
5,36
4 1
01,9
08
35.9
42.8
26.9
19.4
25.4
21.3
5.1
4.3
NMNM
21.6
21.8
2.0
2.0
ICIC
I Ban
kFin
ancia
ls16
09 1
,861
,796
1
64,7
56
194
,794
1
64,7
56
194
,794
9
8,10
5 1
12,4
00
84.9
97.1
17.7
14.3
18.9
16.6
2.5
2.3
NMNM
14.0
14.6
1.7
1.8
IOB
Finan
cials
58 7
1,95
9 5
5,76
8 6
4,78
3 5
5,76
8 6
4,78
3 6
,017
6
,907
5.
14.
9-1
6.5
-4.1
11.4
11.8
0.5
0.5
NMNM
4.6
4.6
0.2
0.2
Orie
ntal
Ban
k Fin
ancia
ls28
4 8
5,08
2 5
1,27
1 5
7,66
9 5
1,27
1 5
7,66
9 1
1,39
4 1
6,43
5 38
.052
.3-1
6.5
37.7
7.5
5.4
0.7
0.6
NMNM
9.2
12.0
0.5
0.7
PNB
Finan
cials
931
337
,160
1
61,4
60
185
,043
1
61,4
60
185
,043
3
3,42
6 4
7,21
7 92
.313
0.4
-31.
341
.310
.17.
11.
00.
9NM
NM10
.212
.90.
60.
8
SBI
Finan
cials
2693
2,0
10,5
21
675
,834
7
58,2
27
675
,834
7
58,2
27
141
,738
1
71,5
48
189.
722
9.6
-27.
621
.014
.211
.71.
31.
2NM
NM10
.110
.80.
60.
7
Unio
n Ba
nk
Finan
cials
225
143
,336
7
8,79
3 9
3,26
5 7
8,79
3 9
3,26
5 1
6,96
2 2
3,97
4 26
.935
.0-2
5.6
29.9
8.4
6.4
0.8
0.8
NMNM
10.4
12.9
0.5
0.6
HDFC
Finan
cials
1099
1,7
25,4
03
70,
030
81,
419
75,
402
87,
013
54,
402
62,
753
34.9
40.2
11.2
15.4
31.5
27.3
6.3
5.6
NMNM
20.5
21.1
2.7
2.7
Indi
an B
ank
Finan
cials
169
78,
745
43,
604
51,
425
43,
604
51,
425
11,
589
13,
209
24.9
28.4
-32.
214
.06.
86.
00.
70.
6NM
NM10
.511
.00.
70.
7
Dev
Cred
it Ba
nkFin
ancia
ls91
25,
534
3,6
84
4,3
10
3,6
84
4,3
10
1,5
05
1,7
30
6.0
6.9
47.3
15.0
15.1
13.1
2.1
1.8
NMNM
14.7
14.6
1.2
1.2
AXIS
Ban
kFin
ancia
ls43
9 1
,036
,377
1
19,5
16
134
,633
1
19,5
16
134
,633
6
2,17
7 7
4,36
6 26
.531
.519
.619
.016
.613
.92.
72.
3NM
NM17
.417
.91.
71.
8
Indu
sind
Ban
kFin
ancia
ls71
5 3
77,5
66
28,
907
34,
150
28,
907
34,
150
14,
080
17,
580
26.8
33.4
32.0
24.9
26.7
21.4
4.3
3.7
NMNM
17.5
18.7
1.8
1.8
Shrir
am Tr
anS.
Fin
Finan
cials
942
213
,826
3
3,75
9 4
1,41
8 2
8,62
1 3
2,26
4 1
2,64
2 1
4,89
3 55
.765
.7-7
.117
.916
.914
.32.
62.
2NM
NM16
.316
.72.
72.
8
LIC
Hous
ing
Fina
nce
Finan
cials
360
181
,679
1
8,98
9 2
2,43
3 1
8,47
0 2
1,63
0 1
3,17
2 1
5,64
4 26
.131
.028
.718
.813
.811
.62.
42.
1NM
NM18
.819
.11.
51.
5
Hind
usta
n Un
ileve
rFM
CG73
1 1
,581
,803
2
74,0
83
301
,232
5
0,96
3 5
5,86
0 3
6,98
3 3
8,70
3 17
.117
.910
.54.
742
.740
.848
.233
.230
.627
.811
2.9
81.3
125.
196
.9
Mar
ico In
dust
ries
FMCG
320
206
,488
4
6,76
7 5
6,73
5 7
,467
8
,635
4
,866
5
,518
7.
58.
635
.013
.442
.437
.415
.211
.628
.023
.935
.830
.920
.124
.8
Jubi
lant
Food
wor
ksFM
CG12
73 8
3,44
4 1
7,23
5 2
1,97
1 2
,551
2
,781
1
,258
1
,289
19
.219
.7-7
.12.
566
.264
.614
.812
.032
.630
.122
.318
.623
.419
.1
Godr
ej C
onsu
mer
FMCG
965
328
,493
7
5,82
6 8
6,58
8 1
1,76
5 1
3,42
6 7
,815
8
,849
23
.026
.05.
113
.242
.037
.18.
77.
529
.325
.520
.720
.214
.916
.9
ITC
FMCG
357
2,8
47,9
12
328
,826
3
67,0
47
124
,548
1
39,1
93
87,
850
94,
407
11.1
11.9
17.4
7.5
32.2
29.9
10.8
9.3
22.6
20.0
33.5
31.1
27.7
26.2
Nest
leFM
CG61
80 5
95,8
49
90,
619
102
,688
1
9,80
4 2
1,70
1 1
1,17
1 1
2,20
1 11
5.9
126.
54.
69.
253
.348
.826
.322
.130
.227
.449
.445
.337
.035
.2
Colg
ate
FMCG
1703
231
,630
3
5,44
9 4
0,02
3 6
,640
7
,982
4
,920
5
,509
36
.240
.5-0
.912
.047
.142
.037
.835
.534
.528
.880
.484
.498
.084
.4
Glax
o Sm
ithkl
ine
FMCG
5475
230
,254
3
5,64
0 4
1,25
0 5
,271
6
,586
5
,165
6
,289
12
2.8
149.
518
.321
.844
.636
.614
.312
.440
.632
.332
.133
.934
.636
.2
Agro
Tech
Food
sFM
CG62
6 1
5,25
5 7
,622
8
,083
6
76
706
4
29
440
17
.618
.12.
82.
635
.634
.75.
44.
822
.721
.515
.213
.816
.114
.5
Dabu
rFM
CG22
1 3
88,6
83
70,
732
80,
697
12,
003
13,
703
9,2
33
10,
395
5.3
6.0
19.8
12.6
41.8
37.1
13.8
11.3
32.7
28.3
32.9
30.4
25.6
24.8
Emam
iFM
CG81
3 1
84,4
34
18,
208
22,
031
4,4
13
5,2
05
4,0
95
4,5
09
18.0
19.9
30.3
10.1
45.0
40.9
19.1
14.8
41.2
34.6
42.4
36.2
40.4
36.5
Brita
nnia
FMCG
1529
183
,367
6
8,29
3 7
9,36
3 5
,448
6
,698
3
,962
4
,669
33
.139
.052
.217
.846
.239
.222
.916
.033
.827
.249
.640
.741
.138
.0
Baja
j Cor
pFM
CG28
5 4
2,06
7 6
,707
7
,553
1
,834
1
,949
1
,770
1
,902
12
.012
.95.
87.
523
.822
.18.
08.
122
.221
.133
.836
.830
.127
.5
Zydu
s Wel
lnes
sFM
CG63
0 2
4,61
2 4
,246
4
,898
1
,057
1
,208
1
,101
1
,232
28
.231
.513
.411
.822
.420
.07.
45.
820
.817
.532
.929
.237
.232
.7
Asia
n Pa
ints
FMCG
656
629
,282
1
25,8
16
147
,204
1
9,97
9 2
4,58
7 1
2,26
7 1
4,97
7 12
.815
.610
.122
.151
.342
.015
.612
.631
.225
.430
.430
.130
.531
.4
Balra
mpu
r Chi
niFM
CG55
13,
532
31,
031
33,
081
2,6
77
3,2
61
374
7
73
1.5
3.2
-76.
810
6.7
36.1
17.5
1.0
1.0
9.3
7.8
2.9
5.7
4.4
6.1
Phill
ipC
apita
l Ind
ia C
over
age
Uni
vers
e: V
alua
tio
n Su
mm
ary
Note
: For
ban
ks, E
BITD
A is
pre-
prov
ision
pro
fit

49GROUND ZERO GROUND ZERO 15 - 30 Nov 2014 15 - 30 Nov 2014 48
Note
: For
ban
ks, E
BITD
A is
pre-
prov
ision
pro
fit
Phill
ipC
apita
l Ind
ia C
over
age
Uni
vers
e: V
alua
tio
n Su
mm
ary
CMP
Mkt
Cap
Ne
t Sal
es (R
s mn)
EB
IDTA
(Rs
mn)
PAT (
Rs m
n)EP
S (R
s)
EPS
Grow
th (%
) P
/E (x
) P
/B (x
) EV
/EBI
TDA
(x)
ROE
(%)
ROCE
(%)
Nam
e of
com
pany
Sect
orRs
Rs m
nFY
14E
FY15
EFY
14E
FY15
EFY
14E
FY15
EFY
14E
FY15
EFY
14E
FY15
EFY
14E
FY15
EFY
14E
FY15
EFY
14E
FY15
EFY
14E
FY15
EFY
14E
FY15
E
Tila
knag
arFM
CG36
4,4
34
8,2
42
8,5
97
1,6
99
1,7
88
588
5
82
4.8
4.7
-4.4
-1.1
7.5
7.6
0.7
0.7
6.6
6.9
9.8
9.1
10.5
9.5
Radi
co K
haita
nFM
CG90
12,
033
14,
188
16,
122
2,2
17
2,6
12
957
1
,204
7.
29.
123
.825
.812
.610
.01.
51.
38.
97.
711
.813
.111
.011
.9
Berg
er P
aint
sFM
CG39
8 1
37,9
63
38,
697
45,
885
4,3
41
5,4
82
2,5
82
3,1
70
7.5
9.1
18.2
22.7
53.4
43.5
12.4
10.3
32.7
25.8
23.3
23.7
20.3
20.0
GMR
Infra
stru
ctur
eIn
frastr
uctu
re22
94,
203
87,
095
97,
535
25,
654
37,
581
(11,
512)
(4,3
64)
-3.0
-1.1
152.
5-6
2.1
-7.3
-19.
31.
01.
119
.812
.0-1
3.1
-5.2
3.6
2.5
GVK
Pow
erIn
frastr
uctu
re12
18,
208
28,
209
23,
865
9,4
61
13,
157
(3,6
87)
(7,8
93)
-2.3
-5.0
9.7
114.
1-4
.9-2
.30.
70.
823
.817
.6-1
3.3
-36.
10.
70.
3
IRB
Infra
stru
ctur
eIn
frastr
uctu
re25
3 8
4,13
8 3
7,31
9 4
1,69
9 1
7,53
7 2
3,60
4 4
,591
5
,831
13
.817
.5-1
7.5
27.0
18.3
14.4
2.4
2.0
10.2
8.5
12.9
14.0
7.0
4.5
Adan
i Por
ts &
SEZ
Infra
struc
ture
283
585
,825
4
3,45
8 4
3,25
9 2
8,00
6 3
1,00
1 2
2,52
7 2
2,74
8 10
.911
.023
.31.
026
.025
.86.
35.
224
.020
.024
.120
.413
.812
.5
NCC
Infra
struc
ture
54 2
9,93
7 6
1,17
3 6
8,51
2 4
,049
5
,138
4
05
715
1.
62.
8-3
5.3
76.5
34.1
19.3
0.5
0.5
13.3
10.0
1.6
2.8
7.0
6.7
Asho
ka B
uild
con
Infra
struc
ture
139
22,
008
17,
949
21,
815
3,9
45
5,1
74
1,0
84
1,0
62
6.9
6.7
-62.
0-2
.020
.220
.71.
81.
613
.712
.88.
78.
03.
23.
6
HCL T
echn
olog
ies
IT Se
rvice
s16
10 1
,128
,936
3
29,1
80
363
,108
8
6,66
0 8
9,66
6 6
3,70
0 7
1,85
2 90
.110
1.8
58.4
12.9
17.9
15.8
5.7
4.7
13.2
12.7
31.7
29.6
32.8
29.7
Info
sys
IT Se
rvice
s40
27 2
,312
,363
5
35,4
68
602
,183
1
46,5
69
163
,389
1
18,7
89
131
,753
20
7.9
230.
611
.610
.919
.417
.54.
33.
713
.611
.922
.221
.523
.522
.9
TCS
IT Se
rvice
s25
89 5
,070
,167
9
55,3
87
1,1
24,9
87
276
,306
3
24,1
76
217
,671
2
62,8
57
111.
113
4.2
13.9
20.8
23.3
19.3
9.2
7.3
18.3
15.6
39.4
38.0
37.9
40.4
Tech
Mah
indr
aIT
Serv
ices
2509
590
,973
1
88,3
13
218
,077
4
1,83
6 4
8,25
5 2
6,82
1 3
2,30
3 11
2.9
135.
726
.420
.222
.218
.55.
74.
413
.311
.425
.823
.930
.726
.2
Wip
roIT
Serv
ices
564
1,3
91,9
86
434
,269
4
76,2
74
99,
942
110
,582
7
7,96
6 8
8,97
1 31
.736
.127
.014
.117
.815
.64.
03.
513
.412
.022
.722
.223
.722
.8
Pers
iste
nt S
yste
ms
IT Se
rvice
s13
00 5
1,99
4 1
6,69
2 1
8,82
5 4
,303
4
,677
2
,493
3
,114
62
.377
.932
.924
.920
.916
.74.
33.
611
.910
.920
.421
.419
.421
.1
KPIT
Tech
nolo
gies
IT Se
rvice
s16
5 3
2,21
6 2
6,94
0 2
9,21
9 4
,233
4
,248
2
,391
2
,738
12
.814
.718
.514
.812
.911
.22.
42.
08.
27.
718
.818
.017
.315
.6
NIIT
Tech
nolo
gies
IT Se
rvice
s38
8 2
3,59
5 2
3,05
0 2
3,74
5 3
,516
3
,503
2
,307
2
,159
38
.235
.67.
1-6
.910
.110
.91.
81.
66.
26.
217
.414
.617
.714
.5
Zee
Ente
rtain
men
tM
edia
345
330
,971
4
4,21
7 4
7,11
8 1
2,04
3 1
2,85
4 8
,938
7
,792
9.
38.
124
.2-1
2.8
37.0
42.5
8.5
7.0
27.0
25.3
22.9
16.4
23.1
19.8
HT M
edia
Med
ia11
3 2
6,28
9 2
2,00
7 2
3,97
9 3
,125
3
,444
1
,607
1
,962
6.
98.
4-3
.722
.716
.413
.41.
51.
39.
47.
98.
89.
714
.011
.3
Sun
TV N
etw
ork
Med
ia32
6 1
28,3
14
22,
236
24,
386
11,
244
12,
054
7,4
80
7,9
08
19.0
20.1
5.4
5.7
17.2
16.2
4.1
3.8
11.0
10.1
24.2
23.2
24.5
23.4
Jagr
an P
raka
shan
Med
ia12
7 4
1,66
5 1
7,02
7 1
8,64
1 3
,826
4
,507
2
,363
2
,638
7.
58.
3-8
.411
.717
.115
.34.
23.
112
.09.
424
.620
.217
.215
.8
Den
Netw
orks
Med
ia16
7 2
9,81
3 1
0,50
7 1
7,95
0 2
,685
5
,351
2
27
1,3
01
1.6
8.9
-68.
247
2.7
107.
918
.81.
41.
38.
55.
61.
36.
85.
48.
9
Dish
TVM
edia
57 6
0,80
9 2
5,09
0 2
8,76
2 6
,240
6
,904
(1
,576
) (2
66)
-1.5
-0.2
138.
8-8
3.1
-38.
6-2
28.8
-19.
5-1
7.9
11.8
10.4
50.4
7.8
-5.1
7.3
Hath
way
Cab
leM
edia
308
49,
630
15,
832
22,
938
3,0
15
5,2
43
(1,2
93)
799
-8
.85.
2-6
45.1
-159
.8-3
5.1
58.7
4.7
3.5
20.5
11.6
-13.
56.
0-2
.34.
9
Hind
alco
Inds
Met
als
163
336
,785
8
72,2
79
1,0
02,0
75
82,
863
111
,100
2
5,71
0 2
7,05
2 12
.513
.1-2
1.2
5.2
13.1
12.4
0.8
0.8
11.1
8.2
6.3
6.3
3.7
4.6
NALC
O M
etal
s59
152
,057
6
6,48
8 7
5,52
3 9
,342
1
3,65
6 6
,917
1
0,38
3 2.
74.
016
.750
.122
.014
.61.
31.
211
.97.
95.
78.
24.
87.
6
Hind
usta
n Zi
ncM
etal
s17
2 7
26,1
21
134
,590
1
40,4
42
69,
615
71,
828
69,
663
71,
227
16.5
16.9
0.7
2.2
10.4
10.2
1.9
1.7
6.8
6.0
18.6
16.8
18.6
16.7
Tata
Ste
elM
etal
s49
1 4
76,3
81
1,4
86,1
36
1,5
00,8
89
164
,110
1
71,5
20
36,
225
34,
796
37.3
35.8
990.
3-3
.913
.213
.71.
21.
17.
36.
88.
97.
86.
36.
8
JSW
Ste
elM
etal
s12
58 3
04,1
35
512
,196
5
29,9
25
91,
655
110
,157
2
1,64
7 3
0,91
5 89
.612
7.9
43.4
42.8
14.0
9.8
1.4
1.3
7.1
6.0
10.2
12.9
4.6
8.4
SAIL
Met
als
83 3
44,6
54
463
,345
5
11,9
13
43,
534
59,
861
19,
639
19,
884
4.8
4.8
-16.
71.
217
.617
.30.
80.
812
.910
.34.
64.
54.
63.
8
Sesa
Ste
rlite
Met
als
257
760
,735
6
61,5
24
824
,314
2
03,5
97
278
,912
7
2,62
4 7
8,75
3 24
.526
.6-7
.58.
410
.59.
71.
01.
07.
35.
19.
99.
914
.59.
4
Jind
al S
teel
& P
ower
Met
als
161
146
,979
2
00,0
40
283
,720
5
4,56
8 8
9,16
7 1
9,10
4 2
3,99
7 20
.926
.2-3
2.9
25.6
7.7
6.1
0.7
0.6
9.2
5.7
8.4
9.7
4.4
5.7
Jind
al S
awM
etal
s78
21,
545
65,
531
70,
919
6,4
74
7,7
51
1,5
72
2,2
22
5.7
8.0
-13.
441
.413
.79.
70.
60.
511
.39.
94.
15.
63.
64.
1
ONGC
Oil &
Gas
404
3,4
58,5
57
1,7
32,3
45
1,8
85,0
87
549
,854
6
34,5
77
265
,049
2
92,8
63
31.0
34.2
9.4
10.5
13.0
11.8
2.0
1.8
6.7
5.6
15.4
15.3
11.2
10.6
Petro
net L
NGOi
l & G
as19
9 1
49,3
25
377
,476
4
39,6
70
14,
984
16,
821
7,1
19
7,4
38
9.5
9.9
-38.
14.
521
.020
.13.
02.
711
.310
.314
.313
.510
.510
.3
Cairn
Indi
aOi
l & G
as28
4 5
33,0
10
188
,927
1
81,4
91
142
,095
1
30,6
05
118
,238
1
07,4
76
62.2
56.5
2.4
-9.1
4.6
5.0
0.9
0.8
3.6
3.6
20.6
16.5
21.8
16.1
GAIL
Oil &
Gas
515
652
,695
5
72,4
51
585
,034
6
7,01
2 7
2,35
8 4
3,75
3 4
2,59
9 32
.533
.67.
43.
515
.915
.32.
42.
210
.910
.115
.214
.211
.710
.6

51GROUND ZERO GROUND ZERO 15 - 30 Nov 2014 15 - 30 Nov 2014 50
Note
: For
ban
ks, E
BITD
A is
pre-
prov
ision
pro
fit
Phill
ipC
apita
l Ind
ia C
over
age
Uni
vers
e: V
alua
tio
n Su
mm
ary
CMP
Mkt
Cap
Ne
t Sal
es (R
s mn)
EB
IDTA
(Rs
mn)
PAT (
Rs m
n)EP
S (R
s)
EPS
Grow
th (%
) P
/E (x
) P
/B (x
) EV
/EBI
TDA
(x)
ROE
(%)
ROCE
(%)
Nam
e of
com
pany
Sect
orRs
Rs m
nFY
14E
FY15
EFY
14E
FY15
EFY
14E
FY15
EFY
14E
FY15
EFY
14E
FY15
EFY
14E
FY15
EFY
14E
FY15
EFY
14E
FY15
EFY
14E
FY15
EFY
14E
FY15
E
Indr
apra
stha
Gas
Oil &
Gas
397
55,
545
39,
174
46,
089
7,7
76
8,3
97
3,6
03
4,0
52
25.7
28.9
1.7
12.5
15.4
13.7
3.2
2.7
7.4
6.5
22.1
21.4
16.0
15.8
Guja
rat S
tate
Pet
Oil &
Gas
98 5
5,15
1 1
0,47
3 1
0,12
9 9
,255
8
,833
4
,187
4
,070
7.
47.
2-2
2.2
-2.8
13.2
13.5
1.7
1.5
6.9
6.9
12.7
11.2
10.0
9.3
Oil I
ndia
Oil &
Gas
631
379
,287
9
6,12
7 1
06,1
04
42,
638
49,
997
29,
813
31,
801
49.6
52.9
-16.
96.
712
.711
.91.
81.
78.
57.
214
.414
.010
.710
.1
HSIL
Ltd
Othe
r37
5 2
4,76
7 1
8,58
2 2
1,80
5 2
,533
3
,259
3
40
878
5.
113
.3-4
1.8
158.
572
.928
.22.
42.
313
.810
.43.
38.
11.
74.
0
Gree
nply
Indu
strie
sOt
her
1030
24,
860
21,
595
24,
308
2,7
73
3,2
57
1,1
45
1,3
52
47.4
56.0
0.3
18.1
21.7
18.4
4.3
3.5
11.4
9.6
19.6
19.0
12.3
12.7
Tran
sfor
mer
s & R
ecOt
her
161
2,3
16
6,6
59
7,2
16
330
4
32
132
1
92
10.2
14.9
178.
945
.315
.810
.90.
60.
610
.48.
03.
85.
34.
45.
6
Kaja
ria C
eram
icsOt
her
608
45,
932
18,
400
22,
051
2,8
07
3,4
62
1,2
43
1,5
88
16.4
21.0
15.7
27.8
37.0
28.9
8.7
7.3
17.0
14.0
23.5
25.3
26.5
28.2
Have
lls Lt
dOt
her
285
178
,166
4
7,19
7 5
5,17
9 6
,500
7
,421
4
,787
4
,978
38
.439
.928
.94.
07.
47.
21.
71.
526
.723
.122
.520
.722
.720
.5
Auro
bind
o Ph
arm
aPh
arm
a96
2 2
80,2
58
80,
998
118
,519
2
1,32
8 2
3,11
1 1
3,92
2 1
4,01
6 47
.848
.222
1.9
0.7
20.1
20.0
7.5
5.4
14.8
13.5
31.2
27.0
23.8
22.6
Bioc
onPh
arm
a44
9 8
9,79
0 2
8,51
3 3
1,90
7 7
,111
7
,648
4
,324
4
,899
21
.624
.524
.113
.320
.818
.33.
02.
712
.711
.713
.714
.611
.812
.6
Cadi
la H
ealth
care
Phar
ma
1408
288
,296
7
1,15
1 8
2,63
8 1
2,36
0 1
5,66
2 7
,897
1
0,07
2 38
.649
.214
.927
.536
.528
.68.
46.
825
.119
.724
.423
.714
.416
.2
Divi
's La
bora
torie
sPh
arm
a18
61 2
47,0
19
25,
321
30,
054
10,
145
12,
112
7,3
44
9,0
58
55.4
68.3
22.3
23.3
33.6
27.2
8.3
6.9
24.4
20.3
26.1
25.4
0.0
0.0
Dr R
eddy
's La
bs.
Phar
ma
3115
530
,482
1
32,1
70
153
,231
3
2,63
0 3
5,39
6 2
1,51
2 2
2,05
5 12
6.5
129.
727
.22.
524
.624
.05.
84.
617
.415
.623
.719
.214
.812
.9
Glen
mar
k Ph
arm
aPh
arm
a71
6 1
94,2
77
59,
839
70,
372
13,
101
15,
485
7,2
36
8,6
56
26.7
31.9
15.4
19.6
26.8
22.4
6.4
5.1
16.7
13.6
23.8
22.6
10.8
14.4
Ipca
Labo
rato
ries
Phar
ma
740
93,
366
31,
994
35,
196
8,1
06
8,5
44
5,2
74
5,3
36
42.1
42.6
34.1
1.2
17.6
17.4
4.7
3.8
12.1
11.6
26.9
21.7
19.7
18.9
Lupi
nPh
arm
a13
58 6
09,7
31
110
,866
1
28,9
78
30,
028
35,
880
18,
364
22,
054
41.0
49.2
38.1
20.1
33.2
27.6
8.8
6.9
20.3
16.7
26.5
25.0
36.4
34.2
Sun
Phar
ma
Phar
ma
837
1,7
33,8
25
160
,372
1
79,1
98
72,
285
76,
001
53,
526
52,
590
25.8
25.4
47.3
-1.7
32.4
33.0
9.2
7.4
23.3
22.0
30.6
22.6
27.7
20.1
Phoe
nix
Mill
s Re
al E
state
383
55,
499
14,
485
17,
219
6,7
83
8,3
06
1,2
00
2,0
87
8.3
14.4
41.5
73.9
46.2
26.6
2.6
2.6
13.1
10.4
7.0
11.0
8.6
8.1
DLF
Real
Esta
te12
4 2
20,8
70
82,
980
79,
399
24,
854
24,
413
9,9
80
5,2
81
5.8
3.1
30.3
-47.
121
.240
.10.
70.
714
.615
.83.
41.
85.
53.
8
Unite
ch Lt
dRe
al E
state
21 5
3,59
9 2
9,33
3 3
2,50
5 1
,662
3
,968
6
96
3,3
77
0.3
1.3
-66.
838
5.3
77.1
15.9
0.5
0.5
67.4
28.1
0.6
2.8
1.1
2.0
Ober
oi R
ealty
Real
Esta
te24
7 8
1,12
3 7
,985
1
2,71
0 4
,348
6
,710
3
,112
4
,195
9.
512
.8-3
8.4
34.8
26.1
19.3
1.8
1.8
17.7
13.1
7.1
9.1
7.1
10.2
Futu
re R
etai
lRe
tail
116
28,
508
116
,051
1
05,2
09
10,
674
9,9
95
(1)
380
0.
01.
5-1
00.2
77.4
0.8
0.8
7.6
8.2
0.0
1.1
4.6
4.3
Shop
pers
Sto
pRe
tail
545
45,
361
37,
709
44,
506
1,3
34
1,8
33
(75)
75
-0.9
0.9
-28.
5-2
00.0
-603
.960
4.2
9.2
9.1
38.6
28.4
-1.5
1.5
-0.7
2.1
Raym
ond
Ltd
Reta
il46
7 2
8,65
3 4
5,48
0 5
3,01
7 4
,800
5
,673
1
,430
1
,648
23
.326
.814
7.9
15.2
20.0
17.4
2.0
1.8
8.8
7.6
9.8
10.1
7.0
8.3
Bata
Indi
aRe
tail
1285
82,
579
20,
319
23,
395
2,8
87
3,6
73
1,6
77
2,2
17
26.1
34.5
-2.5
32.1
49.2
37.3
9.8
8.4
27.7
21.1
20.0
22.5
20.6
23.4
Tita
n Co
mpa
nyRe
tail
396
351
,208
1
09,2
74
125
,396
1
0,44
3 1
2,16
3 7
,346
8
,433
8.
39.
51.
414
.847
.841
.613
.911
.133
.528
.332
.729
.631
.026
.8
Tren
tRe
tail
1335
44,
352
23,
713
25,
129
94
1,2
38
243
7
18
7.3
21.6
5.9
195.
718
2.6
61.8
4.5
3.7
499.
534
.92.
55.
92.
05.
1
Bhar
ti Ai
rtel
Tele
com
402
1,6
05,7
56
858
,635
9
52,5
70
277
,770
3
19,5
57
27,
188
52,
004
6.8
13.0
101.
991
.359
.130
.92.
72.
48.
37.
54.
57.
65.
06.
1
Relia
nce
Com
mTe
leco
m10
4 2
49,2
40
218
,800
2
30,3
33
72,
850
81,
473
11,
370
13,
534
5.5
6.6
52.4
19.0
18.8
15.8
0.8
0.8
8.9
7.4
4.2
4.8
4.3
4.2
Bhar
ti In
frate
lTe
leco
m29
0 5
48,2
27
65,
790
73,
300
44,
046
49,
148
15,
224
17,
738
8.1
9.4
52.2
16.5
36.0
30.9
3.0
3.0
13.2
10.9
8.4
9.6
7.3
7.7
Idea
Cel
lula
rTe
leco
m16
4 5
88,6
27
265
,189
3
10,3
81
83,
336
101
,534
1
8,51
3 2
5,05
4 5.
67.
083
.124
.629
.323
.53.
32.
69.
48.
511
.211
.17.
16.
8
OnM
obile
Glo
bal
Tele
com
36 4
,056
8
,970
1
0,36
1 1
,569
2
,207
2
41
626
2.
05.
1-5
2.1
159.
917
.96.
90.
40.
41.
40.
62.
45.
82.
65.
8
Tata
Com
mun
icatio
nTe
leco
m39
7 1
13,2
31
196
,659
2
13,5
51
30,
880
32,
762
352
2
,491
1.
28.
7-1
04.8
607.
732
1.7
45.5
14.2
12.8
6.3
5.7
4.4
28.2
3.4
5.1
Conc
orLo
gisti
cs13
50 2
63,2
64
49,
846
58,
489
11,
019
13,
416
9,8
48
11,
569
50.5
59.3
4.8
17.5
26.7
22.8
3.8
3.3
21.6
17.6
14.1
14.7
13.8
14.6

51GROUND ZERO GROUND ZERO 15 - 30 Nov 2014 15 - 30 Nov 2014 50
Disclosures and Disclaimers
PhillipCapital (India) Pvt. Ltd. has three independent equity research groups: Institutional Equities, Institutional Equity Derivatives and Private Client Group. This report has been prepared by Institutional Equities Group. The views and opinions expressed in this document may or may not match or may be contrary at times with the views, estimates, rating, target price of the other equity research groups of PhillipCapital (India) Pvt. Ltd.
This report is issued by PhillipCapital (India) Pvt. Ltd. which is regulated by SEBI. PhillipCapital (India) Pvt. Ltd. is a subsidiary of Phillip (Mauritius) Pvt. Ltd. References to "PCIPL" in this report shall mean PhillipCapital (India) Pvt. Ltd unless otherwise stated. This report is prepared and distributed by PCIPL for information purposes only and neither the information contained herein nor any opinion expressed should be construed or deemed to be construed as solicitation or as offering advice for the purposes of the purchase or sale of any security, investment or derivatives. The information and opinions contained in the Report were considered by PCIPL to be valid when published. The report also contains information provided to PCIPL by third parties. The source of such information will usually be disclosed in the report. Whilst PCIPL has taken all reasonable steps to ensure that this information is correct, PCIPL does not offer any warranty as to the accuracy or complete-ness of such information. Any person placing reliance on the report to undertake trading does so entirely at his or her own risk and PCIPL does not accept any liability as a result. Securities and Derivatives markets may be subject to rapid and unexpected price movements and past performance is not necessarily an indication to future performance.
This report does not have regard to the specific investment objec-tives, financial situation and the particular needs of any specific person who may receive this report. Investors must undertake independent analysis with their own legal, tax and financial advisors and reach their own regarding the appropriateness of investing in any securities or investment strategies discussed or recommended in this report and should understand that statements regarding future prospects may not be realized. In no circumstances it be used or considered as an offer to sell or a solicitation of any offer to buy or sell the Securities mentioned in it. The information contained in the research reports may have been taken from trade and statistical services and other sources, which we believe are reliable. PhillipCapital (India) Pvt. Ltd. or any of its group/associate/affiliate companies do not guarantee that such information is accurate or complete and it should not be relied upon as such. Any opinions expressed reflect judgments at this date and are subject to change without notice
Important: These disclosures and disclaimers must be read in conjunction with the research report of which it forms part. Receipt and use of the research report is subject to all aspects of these disclosures and disclaimers. Additional information about the issuers and securities discussed in this research report is available on request.
Certifications: The research analyst(s) who prepared this research report hereby certifies that the views expressed in this research report accurately reflect the research analyst’s personal views about all of the subject issuers and/or securities, that the analyst have no known conflict of interest and no part of the research analyst’s compensation was, is or will be, directly or indirectly, related to the specific views or recommen-dations contained in this research report. The Research Analyst certifies that he /she or his / her family members does not own the stock(s) covered in this research report.
Independence: PhillipCapital (India) Pvt. Ltd. has not had an investment banking relationship with, and has not received any compensation for investment banking services from, the subject issuers in the past twelve (12) months, and PhillipCapital (India) Pvt. Ltd does not anticipate receiving or intend to seek compensation for investment banking services from the subject issuers in the next three (3) months.
PhillipCapital (India) Pvt. Ltd is not a market maker in the securities mentioned in this research report, although it or its affiliates may hold either long or short positions in such securities. PhillipCapital (India) Pvt. Ltd does not hold more than 1% of the shares of the company(ies) covered in this report.
Suitability and Risks: This research report is for informational purposes only and is not tailored to the specific investment objectives, financial situation or particular requirements of any individual recipient hereof. Certain securities may give rise to substantial risks and may not be suitable for certain investors. Each investor must make its own deter-mination as to the appropriateness of any securities referred to in this research report based upon the legal, tax and accounting considerations applicable to such investor and its own investment objectives or strate-gy, its financial situation and its investing experience. The value of any security may be positively or adversely affected by changes in foreign exchange or interest rates, as well as by other financial, economic or political factors. Past performance is not necessarily indicative of future performance or results.
Sources, Completeness and Accuracy: The material herein is based upon information obtained from sources that PCIPL and the research analyst believe to be reliable, but neither PCIPL nor the research analyst represents or guarantees that the information contained herein is accurate or complete and it should not be relied upon as such. Opinions expressed herein are current opinions as of the date appearing on this material and are subject to change without notice. Furthermore, PCIPL is under no obligation to update or keep the information current.
Copyright: The copyright in this research report belongs exclusively to PCIPL. All rights are reserved. Any unauthorized use or disclosure is prohibited. No reprinting or reproduction, in whole or in part, is permit-ted without the PCIPL’s prior consent, except that a recipient may reprint it for internal circulation only and only if it is reprinted in its entirety.
Caution: Risk of loss in trading in can be substantial. You should carefully consider whether trading is appropriate for you in light of your experience, objectives, financial resources and other relevant circumstances.
For U.S. persons only: This research report is a product of Phillip-Capital (India) Pvt Ltd. which is the employer of the research analyst(s) who has prepared the research report. The research analyst(s) preparing the research report is/are resident outside the United States (U.S.) and are not associated persons of any U.S. regulated broker-dealer and therefore the analyst(s) is/are not subject to supervision by a U.S. broker-dealer, and is/are not required to satisfy the regulatory licensing requirements of FINRA or required to otherwise comply with U.S. rules or regulations regarding, among other things, communications with a subject company, public appearances and trading securities held by a research analyst account.
This report is intended for distribution by PhillipCapital (India) Pvt Ltd. only to "Major Institutional Investors" as defined by Rule 15a-6(b)(4) of the U.S. Securities andExchange Act, 1934 (the Exchange Act) and interpretations thereof by U.S. Securities and Exchange Commission (SEC) in reliance on Rule 15a 6(a)(2). If the recipient of this report is not a Major Institutional Investor as specified above, then it should not act upon this report and return the same to the sender. Further, this report may not be copied, duplicated and/or transmitted onward to any U.S. person, which is not the Major Institutional Investor.
In reliance on the exemption from registration provided by Rule 15a-6 of the Exchange Act and interpretations thereof by the SEC in order to conduct certain business with Major Institutional Investors, PhillipCapi-tal (India) Pvt Ltd. has entered into an agreement with a U.S. registered broker-dealer, Marco Polo Securities Inc. ("Marco Polo").Transactions in securities discussed in this research report should be effected through Marco Polo or another U.S. registered broker dealer

PBGROUND ZERO GROUND ZERO 15 - 30 Nov 2014 15 - 30 Nov 2014 52