Petroleum Profits Tax, Company Income Tax and Economic ...
24
164 Petroleum Profits Tax, Company Income Tax and Economic Growth in Nigeria 1980–2018 Etim Osim Etim a Austine U. Nweze b Nsima J. Umoffong c a Corresponding Author, Department Of Accounting, Faculty Of Business Administration, University Of Uyo, Nigeria, [email protected] b Department of Accounting, Faculty of Management Science, Enugu State University of Science and Technology, Enugu, Nigeria c Department Of Accounting, Faculty Of Business Administration, University Of Uyo, Nigeria Keywords Petroleum Profit Tax, Company Income Tax, Economic Growth Investment, Entrepreneurship. Jel Classification O10, O40. Received 30.06.2020 Revised 26.07.2020 Accepted 10.08.2020 Abstract Purpose: The purpose of the study was to investigate the long run relationship existing between petroleum profit and companies’ income taxes and economic growth in Nigeria in the period of 1980 to 2018. This is premised on realizing the role of taxation as a critical aspect of an economy’s fiscal policy framework. Design/Methodology/Approach: The secondary data for 39 years period. The analytical tools were Augmented Dickey- Fuller (ADF) unit root-test, Engle Granger Procedure Co- integration test, Parsimonious Error Correction Mechanism (ECM), Durbin-Watson statistic and over parameterized model. Findings: The results of the analysis reveal a positively significant association of studied variables with (0.9844) and (0.9471) co-efficients for petroleum profit tax and companies income tax respectively in relation independent variables integrate with the dependent variable at first order. This indicates long run relationship. Also, the parsimonious results shows a positive co-efficients of (3.6344) and (2.7644) and (2.7629) for t-values of CIT and PPT on economic growth. Originality/Value: In view of the results, government’s tactful handling of issues that are tax related was recommended so as to stimulate additional investments, entrepreneurial activities and innovations. The study contributes to the taxation and fiscal policy research by increasing our knowledge and understanding on the relationship subsisting between taxation revenue and economic growth. DOI: 10.32602/jafas.2020.034
Transcript of Petroleum Profits Tax, Company Income Tax and Economic ...
164
Petroleum Profits Tax, Company Income Tax and Economic Growth in Nigeria 1980–2018
Etim Osim Etima Austine U. Nwezeb Nsima J. Umoffongc
a Corresponding Author, Department Of Accounting, Faculty Of Business Administration, University Of Uyo, Nigeria, [email protected] b Department of Accounting, Faculty of Management Science, Enugu State University of Science and Technology, Enugu, Nigeria c Department Of Accounting, Faculty Of Business Administration, University Of Uyo, Nigeria
Keywords Petroleum Profit Tax,
Company Income Tax,
Economic Growth
Investment,
Entrepreneurship.
Jel Classification O10, O40. Received 30.06.2020 Revised 26.07.2020 Accepted 10.08.2020
Abstract Purpose: The purpose of the study was to investigate the long run relationship existing between petroleum profit and companies’ income taxes and economic growth in Nigeria in the period of 1980 to 2018. This is premised on realizing the role of taxation as a critical aspect of an economy’s fiscal policy framework. Design/Methodology/Approach: The secondary data for 39 years period. The analytical tools were Augmented Dickey-Fuller (ADF) unit root-test, Engle Granger Procedure Co-integration test, Parsimonious Error Correction Mechanism (ECM), Durbin-Watson statistic and over parameterized model. Findings: The results of the analysis reveal a positively significant association of studied variables with (0.9844) and (0.9471) co-efficients for petroleum profit tax and companies income tax respectively in relation independent variables integrate with the dependent variable at first order. This indicates long run relationship. Also, the parsimonious results shows a positive co-efficients of (3.6344) and (2.7644) and (2.7629) for t-values of CIT and PPT on economic growth. Originality/Value: In view of the results, government’s tactful handling of issues that are tax related was recommended so as to stimulate additional investments, entrepreneurial activities and innovations. The study contributes to the taxation and fiscal policy research by increasing our knowledge and understanding on the relationship subsisting between taxation revenue and economic growth.
DOI: 10.32602/jafas.2020.034

Journal of Accounting, Finance and Auditing Studies 6/4 (2020): 164-187
165
1.0. Introduction
The world over, it is a known fact that tax contributes to national economic planning
and development significantly. Taxes constitute the primary source of government
revenue; thus national economic policies are anchored on projected revenue from
taxes. Consequently, the relationship between taxation and growth in an economy
has attracted increased research interest in advanced countries and there appears to
be an assumption in developing economies on what is applicable to these developed
countries also applies to them.
Relevant theories enable chronicling the divergent means of growing output with
taxes. Firstly, an economy with higher taxation rate would lower rate of investment
or capital stock net growth via increased rates on taxes in respect of individual as
well as corporate incomes. Higher rates on capital gains tax and low allowances in
respect of deprecation. Secondly, a country’s policies on taxation has the capacity to
support growth in productivity through a reduction in research and development. In
this case, development having a form of subsidy (implying a negative tax) would
encourage researches with the potential of promoting productivity in current capital
and labour from its spillover effect.
Being an element of a country’s fiscal policy framework known in economic theory,
taxation influences rate of economic growth alongside variables in the economy both
micro and macro.
In literature, it has been recognized that a country’s tax revenue and its economic
growth are related. In recent times, for example, the United Nations (UN) 2005
posited that for economic growth and development to be rapidly actualized by
developing countries, such economies would be expected to upcale their revenue
domestically by using taxes that are align with Millennium Development Goals
(MDGs). A number of researches made attempts at linking economic growth in a
country with its revenue from tax (UN, 2005; Popoola, 2009; Adegbie & Fakile, 2011;
Onefeiwu, 2012; Etim & Nweze, 2015). In literature, applicable models on economic
growth employs variables including level of education and labour, capital and level
of technology in determining the level of output in a given country as well as its
Journal of Accounting, Finance and Auditing Studies 6/4 (2020): 164-187
166
growth in the long run. Linking taxes and growth in an economy should accordingly
be explained in the light of sundry means by which taxes impact the input factors
(Konrad, 2014).
A country’s economic growth is assessed using per capital income (PCI) obtained by
dividing its Gross Domestic Product (GDP) by population of the country at any point
in time. Several related investigations whole interest was on issues accounting for
taxation level suggested per capital income as a common variable (Chen, 2007;
Fullerton & Heute, 2007; Keshab, 2010,). Tanzi (1987) hints that growth in economy
influences a rise in the demand for public sector spending while Tanzi & Lee (2008)
and Musgrave (2004) are of the view that it is as a result of increased taxation that
capacity is directed at meeting demand. Above reasoning supported empirically infer
that levels of tax and growth in economy are correlated. This became critical to note
because it is commonly held belief that higher tax levels trigger large economic
distortions and would be harmful to economic growth, established correlation
between the level of tax in an economy and its growth may prove otherwise (Ariyo,
1997; Aruwa, 2010; ITC, 2010).
The recognition of taxation as a critical mainstream priority for growing developing
counties has been stressed (International Monetary Fund (IMF), 2010). This position
highlights interest in mobilizing fund locally through taxation to serve as a basis for
financing critical public services continuously. Furthermore, it shows that
increasingly having in place an efficient, effective as well as equitable system of
taxation in an economy is the most important ingredient in governing and building of
countries (Organization for Economic Co-operation and Development (OECD), 2013).
Tax policies are employed in some developing economies as the primary tool in
correcting deficits (Rao, 2005; Ahmed & Stern, 2011;). This implies that the system of
taxation used in a certain country greatly determines other macroeconomic
variables. In particular, tax structure and extent of national economic growth and
development are linked with each other in both developed and developing countries.
Regrettably, however, compared to a number of developed economies whose key
taxation efforts are subsequently subjected to an in-depth analysis of its effect, to the

Journal of Accounting, Finance and Auditing Studies 6/4 (2020): 164-187
167
best of the researchers’ knowledge, similar researches are lacking in the context of
Nigeria; this makes a strong case for current research effort.
1.1. Statement of the Research Problem
In Nigeria, efforts at increasing governmental revenue using tax as a medium as
experimented by various administrations over the years are yet to realize
projections when revenue and the country’s GDP are subjected to a ratio analysis
compared to other developing and developed economies.
Abiola & Asiweh (2012) reason that this may account for why majority of Nigerians
have expressed their disappointment in not feeling effect of taxation in the areas of
economic growth and development. Indeed how national economic growth is linked
to tax revenue has been intensely argued by formulators of policies, researchers and
tax Practitioners. This argument is premised on whether formulators of tax policies
can utilize taxation in stimulating economic growth in the country or if the reverse
can be the case (Gravelle & Marples, 2014; Keho, 2013).
As strategic as the debate might be particularly as it concerns facilitation of relevant
effective policies, linking tax revenue to Nigeria’s economic growth is yet to receive
in-depth investigation. It becomes expedient to know where Nigeria stands.
1.2. Objectives of Study
Investigating Nigeria’s tax revenue and its economic growth from 1980-2018 is the
general goal objective of current study. Specifically, this study was conducted to:
i. Find out link between Nigeria’s Petroleum Profit Tax and its economic growth
within the specified period of study.
ii. Ascertain how Nigeria’s Company Income Tax and its economic growth are
related within the specified period of study.
iii. Ascertain causality direction between tax revenue and national economic
growth in the context of Nigeria within the specified period of study.
1.3. Research Questions
To achieve the stated objectives, the following research questions are raised.
i. Is there any link between Nigeria’s Petroleum Profit Tax Income and its
economic growth within the specified period of study?
Journal of Accounting, Finance and Auditing Studies 6/4 (2020): 164-187
168
ii. How do Nigeria’s companies Income Tax and the country’s economic growth
relate within the specified period of study?
iii. In what direction is the causality between Nigeria’s tax revenue and its
economic growth within the specified period of study?
1.4. Research Hypotheses
In this study, these hypotheses have been formulated:
H01: Petroleum Profit Tax and Economic growth are not significantly linked in the
context of Nigeria
H02: Companies Income Tax does not significantly relate with Nigeria’s economic
growth
H03: Nigeria’s Tax Revenue (PPT, CIT) and its economic growth (GDP) have no
causality direction.
Two tax revenue components (PPT and CIT) selected for thus study are
assured theoretically to be the highest sources of government tax income in Nigeria.
Upon completing this study, it is envisaged that its outcome will guide on policy
direction when considering tax reforms in the country.
2.0. Review of Related Literature
In reviewing literature related to this study, three sub-headings will be considered.
They will respectively take care of conceptual issues, theoretical foundation and
review of empirical studies. According to Nigeria’s National Tax Policy (NTP) (2020),
a tax may be seen as a levy or charge that has been imposed on individuals or legal
entities by a given state or authorized body in a state. It explains a monetary burden
that has been placed on property and individuals so as to support government
spending. Continued NTP (2000) does not consider tax as being a donation or
payment made voluntarily but a contribution to be compulsorily made with legal
backing. It is considered as contributions that have been imposed by government. It
comes in variants of custom, excise, levy and the like. Taxation is applied in the
assessment, imposition as well as collection of different taxes (Aguolu, 2010; Adegbie
& Fakile, 2011; Okafor, 2012; Etim & Nweze, 2015).
Journal of Accounting, Finance and Auditing Studies 6/4 (2020): 164-187
169
In a general sense, it is the expectation that taxes would generate adequate finance to
fund governmental spending and simultaneously attain macroeconomic goals such as
promotion of robust private and public sectors in an economy, full employment and
speeding up national economic growth and development. However, the level of
public sector deficit over some decades now queries dependence on taxes as a fiscal
tool in achieving aforementioned goals. Ariyo (1997) in his observation reasons that
compared to the past, there is currently a compelling need to optimize revenue from
different areas of taxation in the case of Nigeria. Also, the world over, taxation rather
than national resources has been employed as a primary tool of national economic
policy and the core of economic reforms. Thus, strengthening and reforming the tax
system of the country to enhance its productivity becomes a cardinal agenda for any
democratic government such as Nigeria.
The historical analysis of the nation’s economic revenue profile demonstrates two
lessons. First, that the nation depends mostly on oil revenues which account for over
85% of her annual income, and are highly volatile. Secondly, that the fluctuation in oil
revenue is usually as a result of factors completely external to the economy. From
this positioning, since crude oil prices have significant influence on the
macroeconomic indices and are highly volatile, almost unpredictable exogenous
variables, it becomes increasingly important diversifying the nation’s economy away
oil, hence the call for tax restructuring and reforms.
2.1. Economic Growth
For a very long time, a country’s economic growth has been taken to be a central goal
of its economic policy and reforms agenda with a considerable amount of studies
focusing on offering explanations to how the goal can be realized (Fadare, 2010).
Similarly, the concept has enjoyed significant interest from scholars. In classical
researches, a country’s economic growth has been linked largely to public sector
spending, which is dependent on amount of resources the government has (Khorravi
& Karimi, 2010). The emergence in the literature of the theory of endogenous growth
has strengthened the query on role played by factors of production as it relates to its
explanation of economic growth as a concept (Lucas, 1990).
Journal of Accounting, Finance and Auditing Studies 6/4 (2020): 164-187
170
A country’s economic growth portrays its expansion potential GDP or national
productivity. Using an illustration, given that social rate of return on investments is
in excess of private return, it is an indication that applicable policies on taxation
capable of stimulating investment can induce an increase in growth rate as well as
utility levels (Nenbee & Madume, 2011). Relevant models of growth which integrate
public sector services assert that an economy’s ideal policy on taxation lingers on
attributes of provided services. This has led Olapade & Olapade (2010) into
reasoning that if government spent substantially on infrastructures, this will trigger
growth. Thus, fiscal policy for which taxation is a potent variable has been assumed
generally to be related to economic growth; capturing precisely, when appropriate
fiscal measures are deployed, used to stimulate economic growth (Khorravi & Karimi,
2010).
2.2. Theoretical Review
A suggestion made by key economic growth theories is that a country’s tax revenue
and its economic growth are significantly related. Put differently, as an economy
witnesses’ funds’ investments, this will lead to its growth. The examples of Domar
(1946) and as well as Harrod (1939) models in Ogbonna & Ebimobowei (2012) posit
savings (income that is not spent) was in a direct relationship with growth in an
economy. Towing this line, Yakubu (2008) gives an indication to the effect that
income sourced from national resources (example being petroleum) would influence
a country’s economic growth and development positively. “A positive theory of tax
reform” propounded by IIzetzki (2014) explains that hindrances that are political in
nature which impede reforms and political variables which make for it success are
quite relevant in situations of differentiated statutory rate and tax base serving as tax
policy tools. This implies that, when tax reforms are meant to meet the large revenue
needs of government, less resistance is expected from both political class and tax
payers groups, resulting in huge tax revenue yield, but will none the less face stiff
resistance when political accountability is lacking. Thus, Bhartia (2009) socio-
political theory of taxation is relevant to the study. Also, divergent long run
predictions bothering on influence of fiscal policies on growth have been made by
Journal of Accounting, Finance and Auditing Studies 6/4 (2020): 164-187
171
models of Neo-classical and Endogenous growth. In respect of this, Swan (1956) and
Solow (1957) using model of Neoclassical growth showed an exogenous long run
growth rate brought about by both technological and demographic progress though
not impacted by fiscal policy. Contrasting this, the theory of endogenous growth
resulted in models of growth which suggest that governments investments
respectively on physical capital and human beings should be expected to engender
long term (or permanent) growth effect (Keho, 2013).
2.3. Empirical Review
Several researches linking an economy’s growth to the revenue it makes from tax
abound, but mostly the focus has always been a fiscal policy framework, which has
two principal components-taxation and expenditure of the public sector.
Madume & Nenbee (2011) conducted a study on government fiscal policy
management strategies and concluded that fiscal policy execution is basically done
through government budget. They recommended that taxation, being a principal
component of government budgetary system, should be reformed to generate more
revenue, in view of persistent government budget deficits. They argue that the
reform of the taxation system is imperative because it drives growth and
development.
In literature, researches on implications of direct taxation on economic growth in
economy are polarized. On one extreme are studies which established that economic
growth was positively related to direct taxation while in the opposite direction are
researchers who established a negative or an insignificant relationship. In their study
in India and Pakistan, Aamir, Qauyam, Hussin & Nasir (2011) employed panel data in
respect of direct and indirect taxes covering 2000 to 2009. They revealed direct taxes
significantly impacted sum total of revenue in the Indian economy but not in the case
of Pakistan. They recorded R2 value of (0.923) which was an indication that 92.3% of
the variation in total revenue of India was expanded by the explanatory variables,
while Pakistan has only R-square value of (0.231) about 23.1% in the results I the
model.
Journal of Accounting, Finance and Auditing Studies 6/4 (2020): 164-187
172
Mashkor, Yahaya & Ali (2010) using data from Pakistan from 1973 to 2008,
investigated the Pakistani tax revenue effect of economic growth. The result reveals
that coefficients of the variables were significant while that of error term slowed to a
low convergence rate in respect of long run. The research reveals an analysis of ratio
of a country’s direct taxation to its GDP as well as direct taxation to the total ratio
would influence real GDP to grow. In the same vein, a study by Mihaiioan, Octivia &
Dan-constant (2006) utilized pooled data which were sourced from European Union
(EU23) and which took into consideration the period of 1995 to 2005, discovers that
the policy encourages economic growth when using direct taxation.
Ilahoya & Mgbame (2013) were interested in association between direct tax
component and Nigeria’s economic growth when considered from global transition
from direct to indirect taxation. The investigation was for 32 years (1980 to 2011)
with data obtained from CBN, Federal Inland Revenue Service and African Statistical
Bulletin. Using the “Augmented Dickey Fuller” test, “Co-integration test and Engle-
Granger two step” procedure, it was discovered that components of direct tax and
growth in the economy were positively and significantly related with a co-efficient of
(4.1007) and t-value of (2.480169).
Another study in Nigeria, Ogbonna & Ebimobowei (2012) examined relationship
between the country’s petroleum profit tax (PPT) and its economic growth using data
from 2010 to 2009 fiscal years. The study employed simple regression analysis and
found positively significant relationship between the variables. Also, a related study
by Iyoha & Oriakhi (2000) suggested that PPT and Nigeria’s Growth economically
had a relationship that was positively significant.
Companies Income Tax (CIT) is a tax charged on corporate entities. Existing
researches on growth effect of CIT seem to be unidirectional, pointing primarily to a
negative relationship except for the few cases. McBride (2012) reported CIT had high
and significant negative impact on long term growth. An estimate of (0.234) for R2
implied about 24.3% long term variation in respect of growth by CIT. The slope of the
fitted line was 11.1% increase in cumulative real GDP growth rate. Adegbie & Fakile
Journal of Accounting, Finance and Auditing Studies 6/4 (2020): 164-187
173
(2011) using data from Nigeria for the period of 1981 to 2017 revealed that CIT
positively and significantly contributed to the country’s economic growth.
Vartia (2008) as well as Arnold & Schwellnus (2008) explored effect of companies’
income tax on investment and productivity. Both studies established that corporate
income tax and investment and productivity were negatively linked. Djankov, Ganser,
McLeish, Ramalho & Schifer (2006), using the 2004 effective tax rate of
manufacturing firm in 85 countries, investigated the relationship between higher
corporate taxes, investment and entrepreneurial activities. They reported that 10%
increase in companies income tax would reduce;
(a) The economy’s Gross Fixed Capital Formation by 2.2% of its GDP
(b) Foreign Direct Investment (FDI) by 2.3% of its GDP and
(c) Penetration rate of new firms by 1.4 percentage point.
In Sub-Sahara Africa, instability in tax revenue was explored by Bleaney, Gemmel &
Greenaway (1995). In the research, revenue instability sources and their results
were analysed with outcome indicating that poor, more open as well as inflationary
economies would experience more instability in their revenue. The study also
suggested that economies witnessing high instability in tax revenue equally tended to
record high total spending instability.
Ebeke & Ehrhart (2010) whose research examined the sources and outcome of tax
revenue instability as it concerned countries in Sub-Saharan Africa, utilized 39
nations within the group and considered time period of 1980-2008. Result giving
credence to the findings of Bleaney Gremel & Greenaway (1995); Thorthon (2008),
Diallo (2009) & Furceri (2007) who in their earlier researches inferred that
instability in sub-saharan Africa’s revenue was a major cause of ratios in public
investment and is therefore harmful to long term growth in the economy.
In the case of Adegie & Fakile (2011), their study centred on how company income
tax (CIT) was related to economic development in the context of Nigeria. Data in the
study came from primary and secondary sources. In analysing data, two methods,
Chi-square and multiple regression were used. It was established and concluded that
a significant relationship was in place between the country’s economic development
Journal of Accounting, Finance and Auditing Studies 6/4 (2020): 164-187
174
and its CIT. Furthermore, in a cross country study which was for the period 1970 to
1997, Lee & Gordon (2014) studied economic growth effect of tax structure exploring
influence of policies on tax in economies on its rate of growth. Results from analysis
suggested statutory corporation tax rates and differences observed in different
countries studied had significant and negative correlation in terms of average
economic growth rates.
From the above empirical reviews, majority of these researches employed data
treatment techniques which failed to consider properties of time series data as well
as contradictory outcomes in respect of the association that may exist between
growth and tax revenue in both developed and developing economies. This present
study is an attempt to improve on earlier studies with a more robust econometric
tool of the error correction model (ECM) which has a more predictive power than the
method of Ordinary Least Square (OLS) using two most important tax revenue
components in Nigeria – PPT and CIT as regressors against economic growth for the
period 1980-2018.
3.0. Methodology
The methodological procedures followed in this study are discussed in this segment
of the study. It covers the research design, model specification and description of
variables and data analytical procedure.
3.1. Research Design
The study uses descriptive as well as inferential methods. The former uses tables ad
percentage in explaining the trend of the variables studied. The inferential statistics
used in combination regression and correlation analyses. In order to guarantee that
regressions were not spurious, relevant tests were carried out. In this regard tests
such as ADF was employed on time series data; in order to identify possible presence
of long run link concerning the variables of study co-integration was conducted;
similarly, error correction mechanism was applied in correcting imbalance among
variables by attaching their short run behaviour to their respective long run values as
advised by Gujarati & Sangeetha (2007). The last test, Granger causality came in
Journal of Accounting, Finance and Auditing Studies 6/4 (2020): 164-187
175
handy in determining causality direction between the study’s dependent and the
independent variable.
3.2. Model Specification and Descriptive of variables
The general econometric form of the model is stated as:
Y = (α + X1 + X2 + X3 + ………. + Xn + e) ………….model 3.1
In the model,
Y = The dependent variable
α = The constant
X1 – Xn = The independent variables
e = error term
Specifically, the study model in it log-form is stated as follows:
Log GDP = Loga0 +, LogPPT + a2 LogCIT + U,
Where;
Log = Logarithm of the variables
a0 - a2 = Parameters to be applied in various estimations so as to measure
independent variables’ impact.
U1 = error term.
The a prior expectation is to have a positive sign for the model parameter (in this
case a0 + a2 > 0)
Log PPT = Logarithm values for petroleum profit tax
Log CIT = Logarithm values for companies tax
Log GDP = Logarithm values for Gross Domestic Product
In testing causality direction that may exist between dependent and independent
variables, the Granger – Causality test is used as shown in models 3.3 and 3.4,
involving a bivariate causality.
Yt = б0 + Ʃa3 Yt-4 + Ʃбj Xt-1 + Ut ………………………Model 3.3
ί =1 j =1
Xt = б0 + Ʃβ1 Xt-4 + Ʃwj Yt-1 + Ut ………………………Model 3.4
ί =1 j =1
Journal of Accounting, Finance and Auditing Studies 6/4 (2020): 164-187
176
In above, Yt and Xt are variables used in investigating for Granger Causality.
If any бj = 0, then Xt granger cause Yt
In the same vein, if any Wj = 0, then Yt granger cause Yt. Thus, there is causality that
is bidirectional. But, if any бj = 0 and Wj = 0, then Yt grager cause Xt. Thus, there is
causality which is unidirectional and running from Yt to Xt and vice versa.
3.3. Analytical Procedure
The analytical procedures covers various tests in respect of unit root, the Augmented
Duckey – Fuller (ADF), co-integration analysis, error correction mechanism and
Granger Causality .
4.0. Results and Discussion
In this section, the study’s data and results of analysis are discussed.
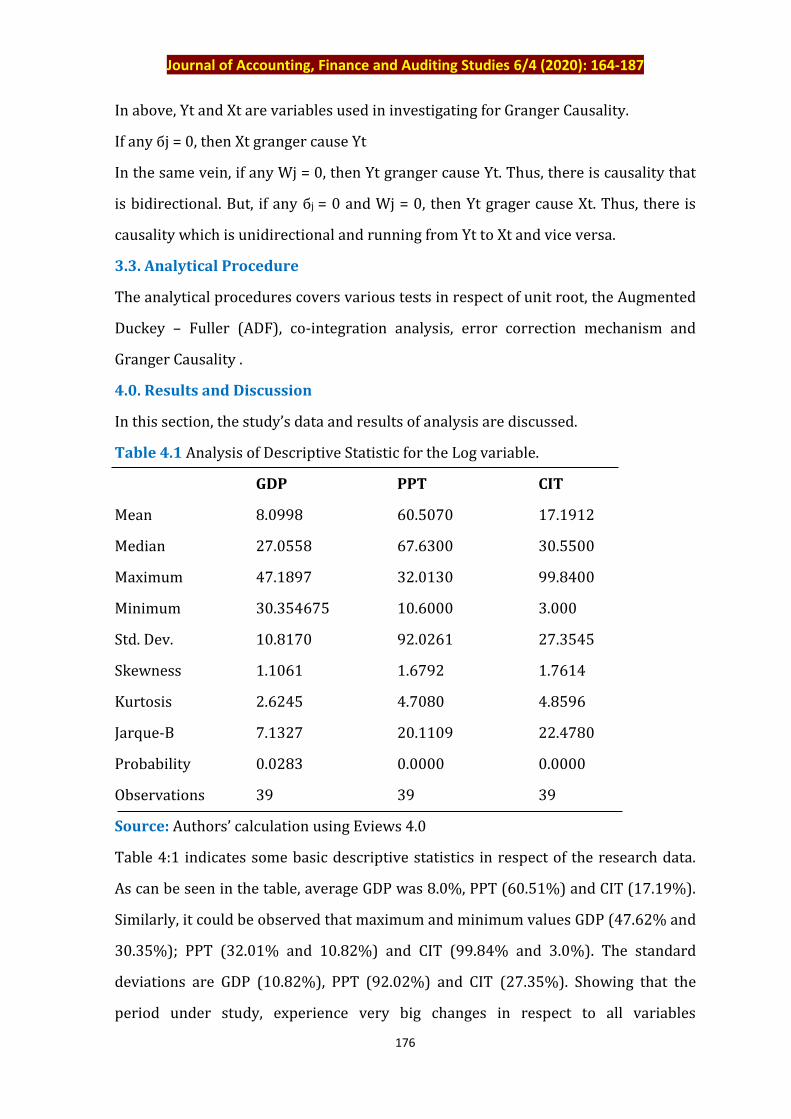
Table 4.1 Analysis of Descriptive Statistic for the Log variable.
GDP PPT CIT
Mean 8.0998 60.5070 17.1912
Median 27.0558 67.6300 30.5500
Maximum 47.1897 32.0130 99.8400
Minimum 30.354675 10.6000 3.000
Std. Dev. 10.8170 92.0261 27.3545
Skewness 1.1061 1.6792 1.7614
Kurtosis 2.6245 4.7080 4.8596
Jarque-B 7.1327 20.1109 22.4780
Probability 0.0283 0.0000 0.0000
Observations 39 39 39
Source: Authors’ calculation using Eviews 4.0
Table 4:1 indicates some basic descriptive statistics in respect of the research data.
As can be seen in the table, average GDP was 8.0%, PPT (60.51%) and CIT (17.19%).
Similarly, it could be observed that maximum and minimum values GDP (47.62% and
30.35%); PPT (32.01% and 10.82%) and CIT (99.84% and 3.0%). The standard
deviations are GDP (10.82%), PPT (92.02%) and CIT (27.35%). Showing that the
period under study, experience very big changes in respect to all variables
Journal of Accounting, Finance and Auditing Studies 6/4 (2020): 164-187
177
investigated. These changes observed in the variables are further evidenced by
positive skewness of values respectively for GDP variables (1.106), PPT (1.68) and
CIT (1.76). The effect of skewness is that the mode, mean and median in the set of
data studied all have different values. Also, the kurtosis value indicates a moderate or
not very peak or very flat topped (Mesokurtic) values, indicating normality of the
distribution of variables over period of study. The Jarque-B values, which is also a
test of normality of the data set, shows normal distribution in respect of all variables.
The probability values were all statistically significant.
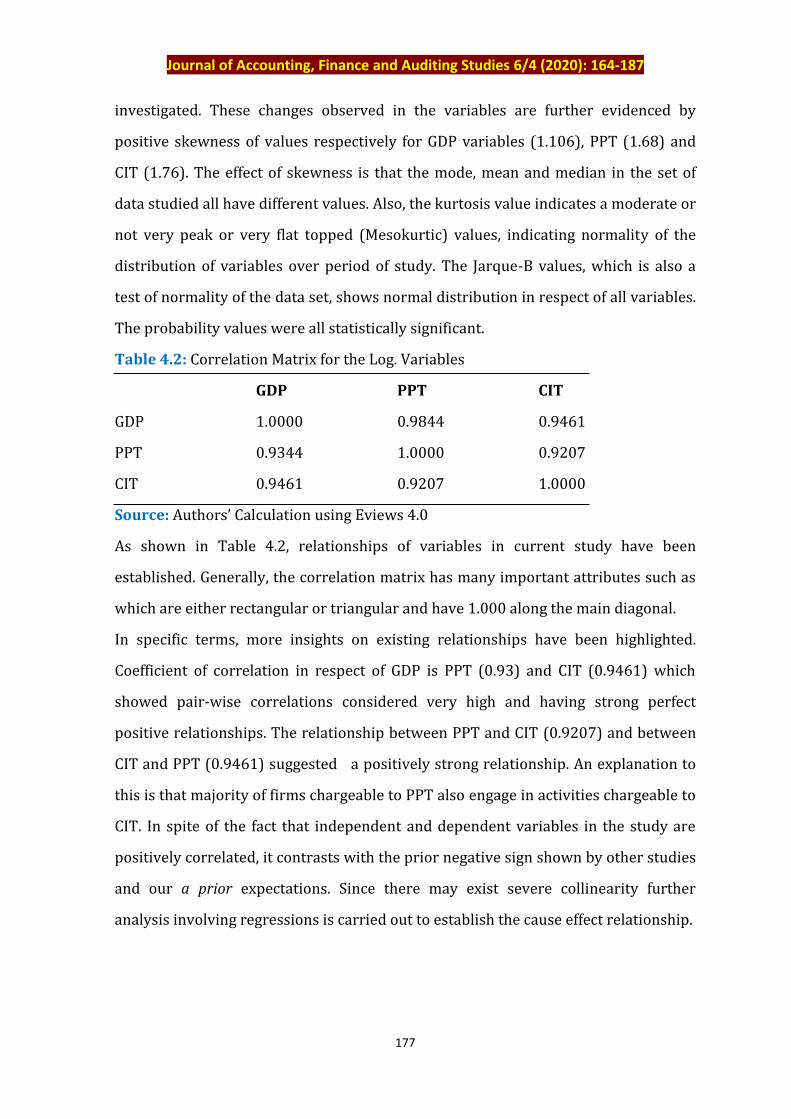
Table 4.2: Correlation Matrix for the Log. Variables
GDP PPT CIT
GDP 1.0000 0.9844 0.9461
PPT 0.9344 1.0000 0.9207
CIT 0.9461 0.9207 1.0000
Source: Authors’ Calculation using Eviews 4.0
As shown in Table 4.2, relationships of variables in current study have been
established. Generally, the correlation matrix has many important attributes such as
which are either rectangular or triangular and have 1.000 along the main diagonal.
In specific terms, more insights on existing relationships have been highlighted.
Coefficient of correlation in respect of GDP is PPT (0.93) and CIT (0.9461) which
showed pair-wise correlations considered very high and having strong perfect
positive relationships. The relationship between PPT and CIT (0.9207) and between
CIT and PPT (0.9461) suggested a positively strong relationship. An explanation to
this is that majority of firms chargeable to PPT also engage in activities chargeable to
CIT. In spite of the fact that independent and dependent variables in the study are
positively correlated, it contrasts with the prior negative sign shown by other studies
and our a prior expectations. Since there may exist severe collinearity further
analysis involving regressions is carried out to establish the cause effect relationship.
Journal of Accounting, Finance and Auditing Studies 6/4 (2020): 164-187
178
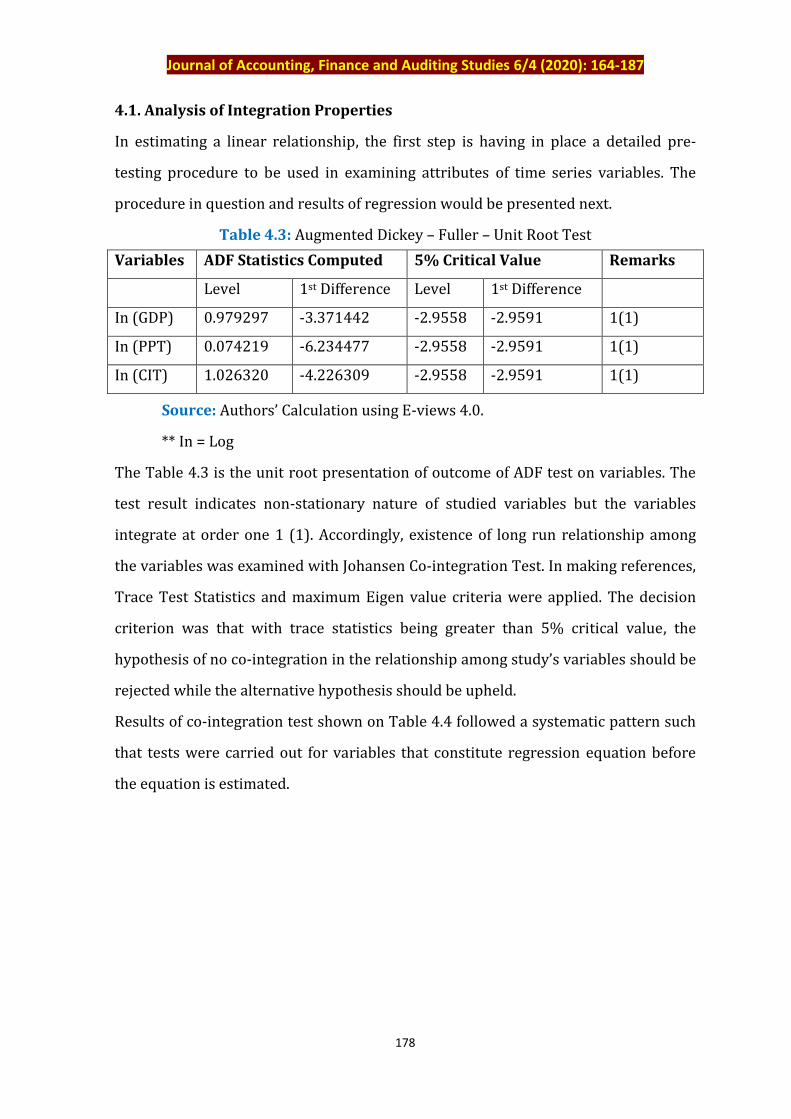
4.1. Analysis of Integration Properties
In estimating a linear relationship, the first step is having in place a detailed pre-
testing procedure to be used in examining attributes of time series variables. The
procedure in question and results of regression would be presented next.
Table 4.3: Augmented Dickey – Fuller – Unit Root Test
Variables ADF Statistics Computed 5% Critical Value Remarks
Level 1st Difference Level 1st Difference
In (GDP) 0.979297 -3.371442 -2.9558 -2.9591 1(1)
In (PPT) 0.074219 -6.234477 -2.9558 -2.9591 1(1)
In (CIT) 1.026320 -4.226309 -2.9558 -2.9591 1(1)
Source: Authors’ Calculation using E-views 4.0.
** In = Log
The Table 4.3 is the unit root presentation of outcome of ADF test on variables. The
test result indicates non-stationary nature of studied variables but the variables
integrate at order one 1 (1). Accordingly, existence of long run relationship among
the variables was examined with Johansen Co-integration Test. In making references,
Trace Test Statistics and maximum Eigen value criteria were applied. The decision
criterion was that with trace statistics being greater than 5% critical value, the
hypothesis of no co-integration in the relationship among study’s variables should be
rejected while the alternative hypothesis should be upheld.
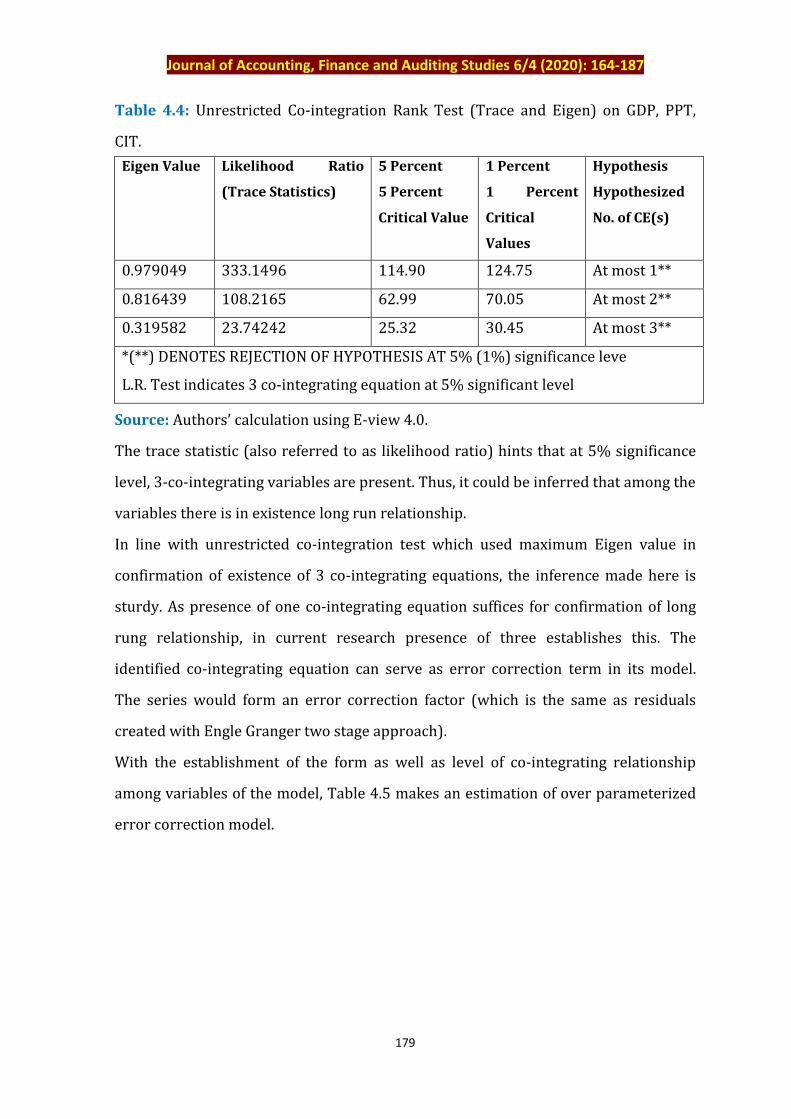
Results of co-integration test shown on Table 4.4 followed a systematic pattern such
that tests were carried out for variables that constitute regression equation before
the equation is estimated.
Journal of Accounting, Finance and Auditing Studies 6/4 (2020): 164-187
179
Table 4.4: Unrestricted Co-integration Rank Test (Trace and Eigen) on GDP, PPT,
CIT.
Eigen Value Likelihood Ratio
(Trace Statistics)
5 Percent
5 Percent
Critical Value
1 Percent
1 Percent
Critical
Values
Hypothesis
Hypothesized
No. of CE(s)
0.979049 333.1496 114.90 124.75 At most 1**
0.816439 108.2165 62.99 70.05 At most 2**
0.319582 23.74242 25.32 30.45 At most 3**
*(**) DENOTES REJECTION OF HYPOTHESIS AT 5% (1%) significance leve
L.R. Test indicates 3 co-integrating equation at 5% significant level
Source: Authors’ calculation using E-view 4.0.
The trace statistic (also referred to as likelihood ratio) hints that at 5% significance
level, 3-co-integrating variables are present. Thus, it could be inferred that among the
variables there is in existence long run relationship.
In line with unrestricted co-integration test which used maximum Eigen value in
confirmation of existence of 3 co-integrating equations, the inference made here is
sturdy. As presence of one co-integrating equation suffices for confirmation of long
rung relationship, in current research presence of three establishes this. The
identified co-integrating equation can serve as error correction term in its model.
The series would form an error correction factor (which is the same as residuals
created with Engle Granger two stage approach).
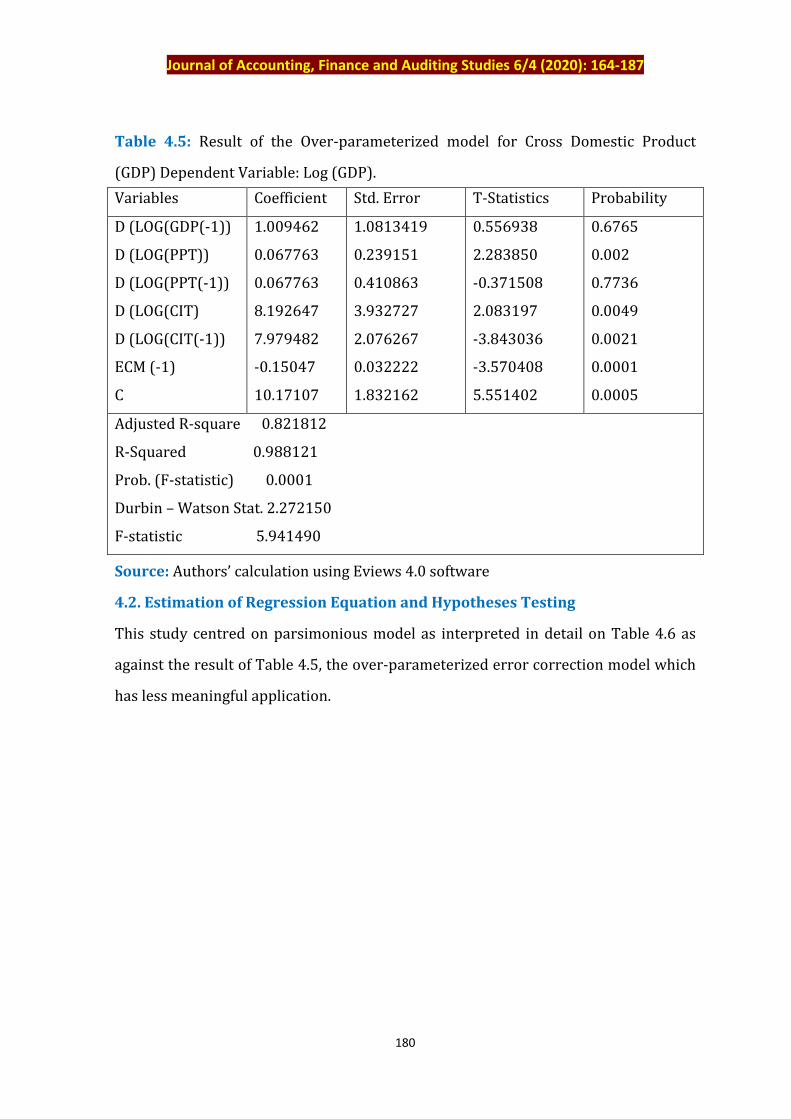
With the establishment of the form as well as level of co-integrating relationship
among variables of the model, Table 4.5 makes an estimation of over parameterized
error correction model.
Journal of Accounting, Finance and Auditing Studies 6/4 (2020): 164-187
180
Table 4.5: Result of the Over-parameterized model for Cross Domestic Product
(GDP) Dependent Variable: Log (GDP).
Variables Coefficient Std. Error T-Statistics Probability
D (LOG(GDP(-1))
D (LOG(PPT))
D (LOG(PPT(-1))
D (LOG(CIT)
D (LOG(CIT(-1))
ECM (-1)
C
1.009462
0.067763
0.067763
8.192647
7.979482
-0.15047
10.17107
1.0813419
0.239151
0.410863
3.932727
2.076267
0.032222
1.832162
0.556938
2.283850
-0.371508
2.083197
-3.843036
-3.570408
5.551402
0.6765
0.002
0.7736
0.0049
0.0021
0.0001
0.0005
Adjusted R-square 0.821812
R-Squared 0.988121
Prob. (F-statistic) 0.0001
Durbin – Watson Stat. 2.272150
F-statistic 5.941490
Source: Authors’ calculation using Eviews 4.0 software
4.2. Estimation of Regression Equation and Hypotheses Testing
This study centred on parsimonious model as interpreted in detail on Table 4.6 as
against the result of Table 4.5, the over-parameterized error correction model which
has less meaningful application.
Journal of Accounting, Finance and Auditing Studies 6/4 (2020): 164-187
181
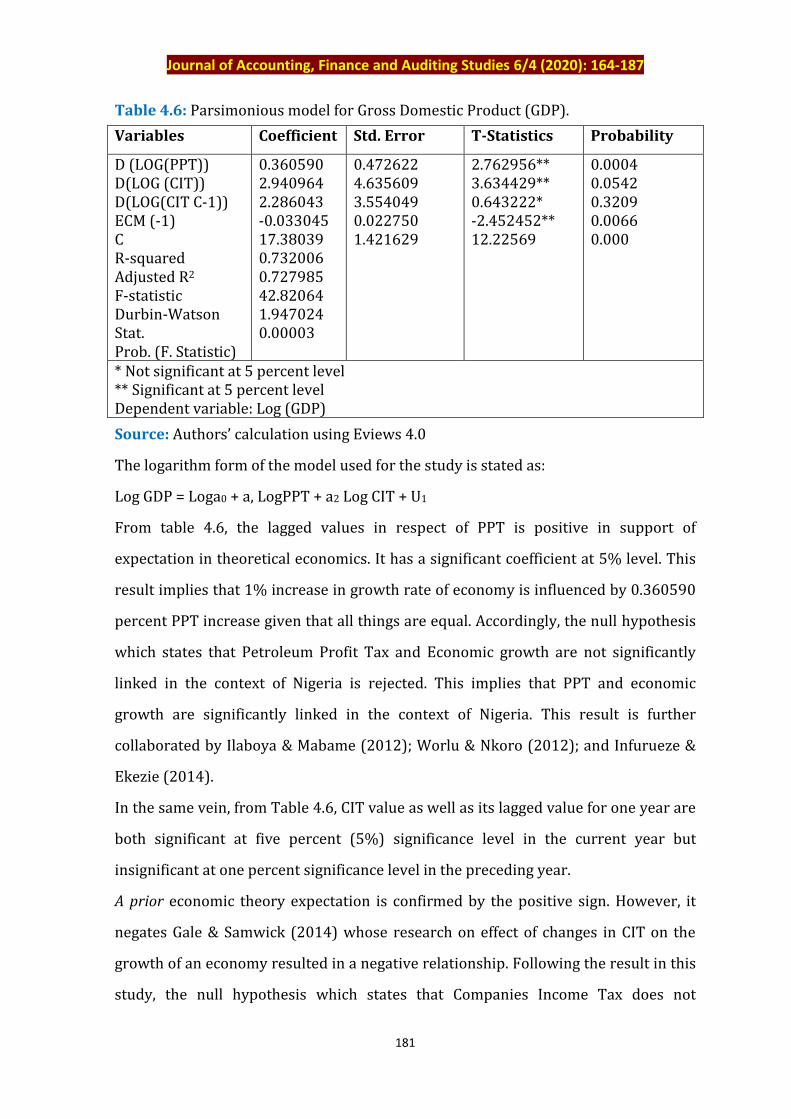
Table 4.6: Parsimonious model for Gross Domestic Product (GDP).
Variables Coefficient Std. Error T-Statistics Probability
D (LOG(PPT)) D(LOG (CIT)) D(LOG(CIT C-1)) ECM (-1) C R-squared Adjusted R2 F-statistic Durbin-Watson Stat. Prob. (F. Statistic)
0.360590 2.940964 2.286043 -0.033045 17.38039 0.732006 0.727985 42.82064 1.947024 0.00003
0.472622 4.635609 3.554049 0.022750 1.421629
2.762956** 3.634429** 0.643222* -2.452452** 12.22569
0.0004 0.0542 0.3209 0.0066 0.000
* Not significant at 5 percent level ** Significant at 5 percent level Dependent variable: Log (GDP)
Source: Authors’ calculation using Eviews 4.0
The logarithm form of the model used for the study is stated as:
Log GDP = Loga0 + a, LogPPT + a2 Log CIT + U1
From table 4.6, the lagged values in respect of PPT is positive in support of
expectation in theoretical economics. It has a significant coefficient at 5% level. This
result implies that 1% increase in growth rate of economy is influenced by 0.360590
percent PPT increase given that all things are equal. Accordingly, the null hypothesis
which states that Petroleum Profit Tax and Economic growth are not significantly
linked in the context of Nigeria is rejected. This implies that PPT and economic
growth are significantly linked in the context of Nigeria. This result is further
collaborated by Ilaboya & Mabame (2012); Worlu & Nkoro (2012); and Infurueze &
Ekezie (2014).
In the same vein, from Table 4.6, CIT value as well as its lagged value for one year are
both significant at five percent (5%) significance level in the current year but
insignificant at one percent significance level in the preceding year.
A prior economic theory expectation is confirmed by the positive sign. However, it
negates Gale & Samwick (2014) whose research on effect of changes in CIT on the
growth of an economy resulted in a negative relationship. Following the result in this
study, the null hypothesis which states that Companies Income Tax does not
Journal of Accounting, Finance and Auditing Studies 6/4 (2020): 164-187
182
significantly relate with Nigeria’s economic growth is rejected. This implies that CIT
and Nigeria’s economic growth are significantly related. Thus, one percent rise in
growth in economy is made possible by 2.94 percent increase in the preceding year’s
company income tax.
In view of the fact that our analysis is based on parsimonious result, it becomes
imperative to carry out a holistic review of the regression results. In this regard,
strong significance of ECM, strengthens earlier argument made to the effect that
variables in the study were co-integrated. Specifically, ECM indicates a relative how
speed adjustment (about 3%) existing between short run and long run balance
behaviour of economic growth and independent variables.
Furthermore, adjusted R2 suggested about 73 percent of sum total in GDP is induced
by variation in independent variable, hence has a good fit. Also, F- statistic (42.82)
gives an indication that when combined all the variables are significant at five
percent level. Similarly, Durbin-Watson statistic (1.9) means that it is effective for the
purpose of analyzing policy since it is within the acceptance band. With probability
(F-statistic by 0.0000), there is an indication that result of this study is significant
with a robust conclusion.
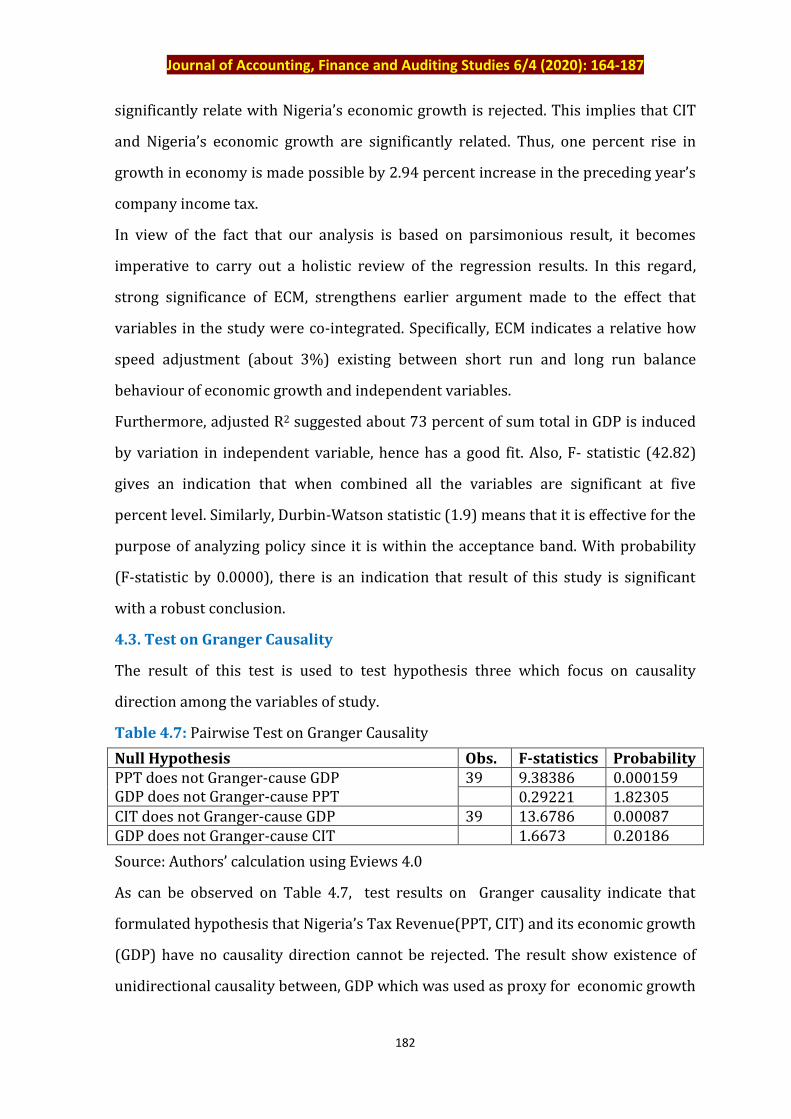
4.3. Test on Granger Causality
The result of this test is used to test hypothesis three which focus on causality
direction among the variables of study.
Table 4.7: Pairwise Test on Granger Causality
Null Hypothesis Obs. F-statistics Probability PPT does not Granger-cause GDP GDP does not Granger-cause PPT
39 9.38386 0.000159 0.29221 1.82305
CIT does not Granger-cause GDP 39 13.6786 0.00087 GDP does not Granger-cause CIT 1.6673 0.20186
Source: Authors’ calculation using Eviews 4.0
As can be observed on Table 4.7, test results on Granger causality indicate that
formulated hypothesis that Nigeria’s Tax Revenue(PPT, CIT) and its economic growth
(GDP) have no causality direction cannot be rejected. The result show existence of
unidirectional causality between, GDP which was used as proxy for economic growth
Journal of Accounting, Finance and Auditing Studies 6/4 (2020): 164-187
183
and PPT and CIT proxies for independent variables and that causality direction runs
from the independent variable to economic growth and conversely from GDP to PPT.
This is because the estimated coefficient of the lagged PPT and CIT components are
statistical different from zero. This result is at variance with the result of McBride
(2012), Arnold & Schwellnus (2008) and Vertia (2008) which found CIT and PPT as
negatively influencing economic growth in the study of OECD Countries.
5. Conclusion
The study result indicates that PPT, CIT and GDP were positively related in Nigeria.
Taxation is important to ensuring sustainable fiscal policy and economic growth. The
pressure from inability of government at all tiers to meet its mounting fiscal
responsibilities and the concern on preventing volatility in revenue combine to make
taxation revenue base expansion vital. Thus, the government should undertake
further investigation in respect of the causes of deteriorating tax revenue to the total
government revenue with a view to ensuring fiscal stability and a robust taxation
system in the country.
References
Aamir, M., Qayyum, A. Nasir, A. & Hussain, S. (2011). Determinants of Tax Revenue,
comparative study of direct and indirect taxes of Pakistan and India.
International Journal of Business and Social Science, 2(19):173-178.
Abiola, J. & Asiweh, M. (2012). Impact of Tax Administration on government revenue
in developing economic – case study of Nigeria. International Journal of
Business and Social Science 3(8): 311-328.
Adegbie, F. F. & Fakile, A. S. (2011). Company Income Tax and Nigeria Economic
Development. European Journal of Social Science, 22(2): 309-322.
Aguolu, O. (2012). Tax reform in Nigeria: unrealized expectations. Bulletin for
International Taxation, 64(1):61-67.
Ahmed, E. & Stern, N. (2011). Theory and practice of tax reform in developing
countries, Cambridge: Cambridge University Press.
Ariyo, A. (1997). Productivity of the Nigerian Tax System 1970-1990. AERC
Resources paper 67, Nairobi: African Economic Research Consortium.

Journal of Accounting, Finance and Auditing Studies 6/4 (2020): 164-187
184
Arnold, J. M. & Schwellnus, C. (2008). Tax policy for economic recovery and growth.
The Economic Journal, 12:59-80.
Aruwa, S. A. (2010). Public finances and economic growth in Nigeria. Fiscal Policy
Implication is Crises Era. Journal of Public Finance,19(1):9-22.
Bhartia, H. L. (2009). Public Finance, 14th Edition. Vikas Publishing House PVT Lyes.
New Delhi, India.
Bleaney, Y. M., Gemmel, N. & Greenaway, D. (1995). Tax revenue instability, with
particular reference to Sub-Saharan Africa: The Journal of Development Studies,
31:883-902.
Chen, S. (2007). Rethinking the informal economy. Journal of Development
Economics, 82:1-42.
Diallo, O. (2009). Tortuous Road toward counter cyclical fiscal policy: Lessons from
Democratized Sub-Saharan Africa: Journal of Policy Modeling, 31:36-50.
Djankov, S. Ganser, T., Mclish, C., Ramalho, R. & Schifer, A. (2009). The effect of
corporate taxes on investment and entrepreneurship. American Economics
Journal, 2 (4): 23-32.
Ebeke, C. & Ehrhart, H. (2010). Tax Revenue instability in sub-saharan Africa:
consequences and remedies. Mimeo, CERO, Avvergne University.
Etim, E. O. & Nweze, A. U. (2015). Tax Revenue and economic growth in Nigeria. 1st
ICAN Academic Conference of Accounting and Finance, 1135-1151.
Fadare, S. O. (2010). Recent Banking and Economic Growth in Nigeria. Middle East
Finance and Economics, 8:1450-1468.
Furceri, D. (2007). Is government expenditure volatility harmful for growth? A Cross-
country Analysis. Fiscal studies, 28(1):103-120.
Gravelle, J. G. & Marples, D. J. (2014). Tax rates and economic growth. Congressional
Research Service, 7(5):700-723.
Gale, W. G. & Samwick, A.A. (2014). Effects of Income Tax Changes on Economic
Growth. International Journal of Public Finance, 7(2):148-162.
Harrod, R. F. (1939). Theories of Dynamic Economics: some application to policy,
London Macmillan.
Journal of Accounting, Finance and Auditing Studies 6/4 (2020): 164-187
185
Ifurueze, M. S. & Ekezie, C. A. (2014). The Nigerian Tax System and Economic
Growth: A Time Series Analysis. International Journal of Economic and
Empirical Research, 2(4):163-169.
IIahoya, J. & Mghame, C. (2013). Direct Tax and Economic Growth in Nigeria. ICAN
Journal of Accounting and Finance, 2(1):65-81.
IIzetzki, E. (2014). A positive theory of tax reforms, CEPR, FER. CODES, D72, D78,
H20:1-41.
International Monetary Fund (2010). Tax Policy for emerging markets – Developing
countries, working paper series, WP/00/65.
International Tax Compact (ITC) (2010). Addressing tax evasion and tax avoidance in
developing countries. Economic Development issues: 14-42.
Lyoha, M. A. & Oriakhi, D. E. (2010). Revenue generation enhancement strategies
with emphasis on institutional development: The case of Nigeria. West Africa
Financial and Economic Review, 2(2):22-47.
Keho, Y. (2013). The structure of taxes and economic growth in Cote d’Ivoire: An
econometric investigation. Journal of Research in Economics and International
Finance, 2(3):39-48.
Keshab, B. (2010). Taxes, public spending and economic growth in OECD Countries.
Problems and perspectives in management, 8(1):14-30.
Khorravi, A. & Karimi, M. S. (2010). To investigate the relationship between monetary
policy, fiscal policy and economic growth in India: Autoregressive Distributed
Lag Approach to co-integration. American Journal of Applied Science, 7(3):420-
424.
Konrad, K. A. (2014). Taxes on rising returns. Canadian Journal of taxation,
14(3):718-741.
Lucas, R. E. (1990). Supply-side economics: An Analytical Review. Oxford Economics
Paper, 42(2):293-336.
Mashkor, M. Yahaya, S. & Ali, S. A. (2010). Tax reviewed and economic growth: An
Empirical Analysis. Pakistan Journal of Economic, 10(1):1283-1289.
Journal of Accounting, Finance and Auditing Studies 6/4 (2020): 164-187
186
McBridge, W. (2012). Global evidence on taxes and economic growth: payroll taxes
has no effect. Tax foundation fiscal fact No. 290. http://taxfoundation.org/tax-
topics
Mihaiioan, M. Octovia, C. & Dan-Constant, D. (2016), Tax impact. http://mpra.un.uni-
muechen-de/6143/I.
Musgrawe, R. A. & Musgrave, P. B. (2004). Public finance in theory and practice. Tafa,
McGraw Hill, New Delhi, India.
National Tax Policy (NTP) (2010) – finance policies, FIRS, Abuja, Nigeria.
Nenbee, S. G. & Madume, J. V. (2011). The impact of monetary Policy on Nigeria’s
Macroeconomics stability (1970-2009). International Journal of Economic
Development and Investment, 2(2):174-183.
Organization for economic cooperation and development (OECD) (2013). Taxing
profits in a global economy. Domestic and International issues, Paris, WPS 73.
Ogbonna, G. N. & Ebimobowei, A. (2012). Petroleum and Nigerian economy:
Empirical Evidence. Arabian Journal of Business and management review,
(OMAN Chapter), 1(9):33-59.
Okafor, R. G. (2012). Tax Revenue Generation and Nigeria Economic Development.
European Journal of Business and Management, 4(19):49-57.
Olapade, B. C. & Olapade, D. O. (2010). The impact of government spending on
economic growth and development in Nigeria. Journal of Economics and
Sustainable Development, 3(7):62-70.
Popoola, N. (2009), A good tax system enhance economic development. Available
from http://www.pionching.com/antideaspx? Accessed 22/2/2020.
Solow, R. M. (1957). Growth theory an Aflier. Prize lecture noble prize http://noble
prize.org/nobelprize/economic/larrestic/1987/solow. Accessed 22/2/2020.
Swan, T. W. (1956). Economic growth and capital accumulation. Economic Second,
32(2):234-361.
Tanzi, V. (1987). Quantitative characteristics of the tax system of the tax system of
development countries. Journal of public economics, 60(1):21-44.
Tanzi, V. & Lee, H. H. (2008). National Tax Journal. IMF, Washington, DC 20431.
Journal of Accounting, Finance and Auditing Studies 6/4 (2020): 164-187
187
Thorton, J. L. (2008). Taxes and output in African Economics. American Economic
Review, 98(2): 2418-2441.
Rao, C. H. (2005). Long-run policy analysis and long-run growth. Journal of political
economy, 99:500-521.
Vartia, L. (2008). Taxation and economic growth. Econ papers,
https://econpapers.repec.org> RePEC:oec.
Worlu, C. N. & Nkoro, E. (2012) Tax revenue and economic development in Nigeria: A
macroeconomic Approach. Academic Journal of Interdisciplinary Studies,
1(2):211-223.
Yakubu, A. (2008). Petroleum Income and Nigeria Economic Growth. Arabian Group
Journals of Business and Management, arabianjbmr.com>pdf>4.pdf.