PERU: Economy and the Financial...
55
September 2007
Transcript of PERU: Economy and the Financial...

September 2007

2
Agenda
Latest Financial Data
Main growth drivers
1. Economic Environment
2. Corporate Strategy
Potential Risks
Overview
II
IV
III
I
3
Latest Financial Data
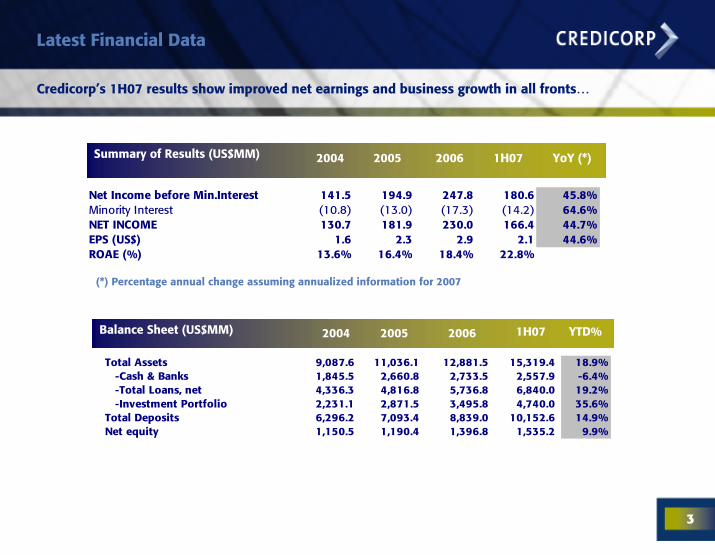
Credicorp’s 1H07 results show improved net earnings and business growth in all fronts…
Net Income before Min.Interest 141.5 194.9 247.8 180.6 45.8%Minority Interest (10.8) (13.0) (17.3) (14.2) 64.6%NET INCOME 130.7 181.9 230.0 166.4 44.7%EPS (US$) 1.6 2.3 2.9 2.1 44.6%ROAE (%) 13.6% 16.4% 18.4% 22.8%
Summary of Results (US$MM) 2004 2005 2006 1H07 YoY (*)
(*) Percentage annual change assuming annualized information for 2007
Balance Sheet (US$MM) 2004 20062005
Total Assets 9,087.6 11,036.1 12,881.5 15,319.4 18.9% -Cash & Banks 1,845.5 2,660.8 2,733.5 2,557.9 -6.4% -Total Loans, net 4,336.3 4,816.8 5,736.8 6,840.0 19.2% -Investment Portfolio 2,231.1 2,871.5 3,495.8 4,740.0 35.6% Total Deposits 6,296.2 7,093.4 8,839.0 10,152.6 14.9% Net equity 1,150.5 1,190.4 1,396.8 1,535.2 9.9%
YTD%1H07

4
Latest Financial Data
… revealing an impressive trend in profitability and asset growth…
Total Assets & Total Loans (US$ MM) Net Income (US$ MM) & ROE
8,3229,088
11,036
12,882
15,319
4,5904,5175,014
5,9277,032
-
2,000
4,000
6,000
8,000
10,000
12,000
14,000
16,000
18,000
2003 2004 2005 2006 1H07
Total Assets Total Loans
%
166230
182131
81
18.4 22.8
16.413.6
9.3
-
50.0
100.0
150.0
200.0
250.0
2003 2004 2005 2006 1H070
5
10
15
20
25
Net income ROE
5
Latest Financial Data
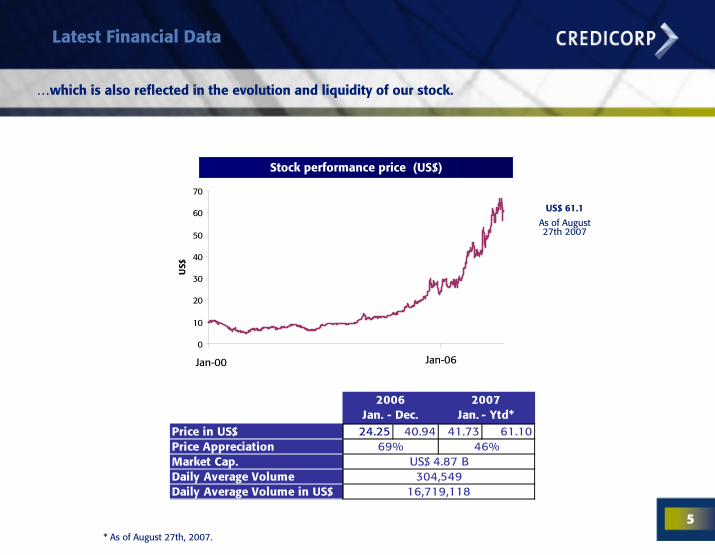
…which is also reflected in the evolution and liquidity of our stock.
Stock performance price (US$)
Jan-00 Jan-060
10
20
30
40
50
60
70U
S$
US$ 61.1
As of August 27th 2007
Price in US$ 24.25 40.94 41.73 61.10Price AppreciationMarket Cap.Daily Average VolumeDaily Average Volume in US$ 16,719,118
2006Jan. - Dec.
2007 Jan. - Ytd*
46%
304,549
69%US$ 4.87 B
* As of August 27th, 2007.

6
Agenda
Latest Financial Data
Main growth drivers
1. Economic Environment
2. Corporate Strategy
Potential Risks
Overview
II
IV
III
I

7
Main growth drivers
Credicorp’s excellent results are supported by two main pillars…
CREDICORP
CORPORATE STRATEGY
ECONOMIC ENVIRONMENT
8
Economic Environment
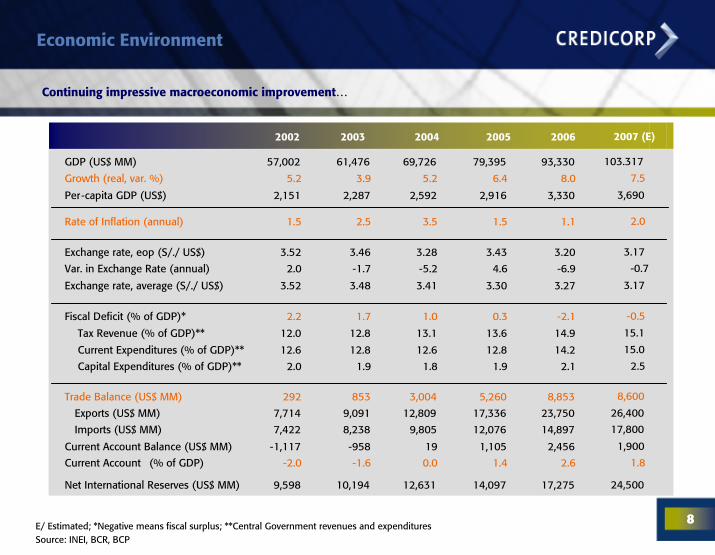
Continuing impressive macroeconomic improvement…
2003 2004 2005 20062002
GDP (US$ MM) 61,476 69,726
Growth (real, var. %) 3.9 5.2
Per-capita GDP (US$) 2,287 2,592
Rate of Inflation (annual) 2.5 3.5
Exchange rate, eop (S/./ US$) 3.46 3.28
Var. in Exchange Rate (annual) -1.7 -5.2
Exchange rate, average (S/./ US$) 3.48 3.41
Fiscal Deficit (% of GDP)* 1.7 1.0
Tax Revenue (% of GDP)** 12.8 13.1
Current Expenditures (% of GDP)** 12.8 12.6
Capital Expenditures (% of GDP)** 1.9 1.8
Trade Balance (US$ MM) 853 3,004
Exports (US$ MM) 9,091 12,809
Imports (US$ MM) 8,238 9,805
Current Account Balance (US$ MM) -958 19
Current Account (% of GDP) -1.6 0.0
Net International Reserves (US$ MM) 10,194 12,631
79,395
6.4
2,916
1.5
3.43
4.6
3.30
0.3
13.6
12.8
1.9
5,260
17,336
12,076
1,105
1.4
14,097
93,33057,002
8.05.2
3,3302,151
1.11.5
3.203.52
-6.92.0
3.273.52
-2.12.2
14.912.0
14.212.6
2.12.0
8,853292
23,7507,714
14,8977,422
2,456-1,117
2.6-2.0
17,2759,598
2007 (E)
103.317
7.5
3,690
2.0
3.17
-0.7
3.17
-0.5
15.1
15.0
2.5
8,600
26,400
17,800
1,900
1.8
24,500
E/ Estimated; *Negative means fiscal surplus; **Central Government revenues and expendituresSource: INEI, BCR, BCP

9
…offering important opportunities in the economic scenario
Macroeconomic Scenario
Opportunities
Gas Project – LNG (Camisea)Mining Projects – “Las Bambas”, “La Granja”, “Toromocho”, etc.Infrastructure projects – roads, ports, irrigation projectsConstruction SectorAgriculture
Challenges
Short - RunApproval of FTA with USAInvestment Grade
Long - RunContinue a high rate of investmentsDe-dollarizationSocial Inclusion
Supported by some key factors
• Decline in external debt ratios• Strengthened international reserve position• Robust export growth
Employment / Domestic Demand
Economic Environment

10
Economic Environment
And important growth potential of the retail segment…
…due to low banking penetration and increasing wealth creation …
Bank Penetration* Distribution of Homes by Socioeconomic Level *
21%24%
28%
36%
32%
2002 2003 2004 2005 2006
17 18 18.1
2833.6 35.1
3127.6 28.7
21.3 15.5 12.7
5.33.5 5.40%
20%
40%
60%
80%
100%
2002 2006 1H07
E
D
C
B
A
* Greater Lima. The study considers individuals between 18 and 70 years from all socioeconomic levels, that have at least one product in any financial institution
Source: APOYO
* Greater Lima.Source: APOYO.

11
Main growth drivers
Credicorp’s excellent results are supported by two main pillars…
CREDICORP
CORPORATE STRATEGY
ECONOMIC ENVIRONMENT

12
Corporate Strategy
Individual strategies that add up…
In each of the business segments and companies of the group, a corporate strategy designed to profit from the economic environment and from the interchange of capacities and business intelligence of the group is being implemented …
Banking Business
Insurance Business
Asset Management Business
13
Banking Business - Latest Financial Data
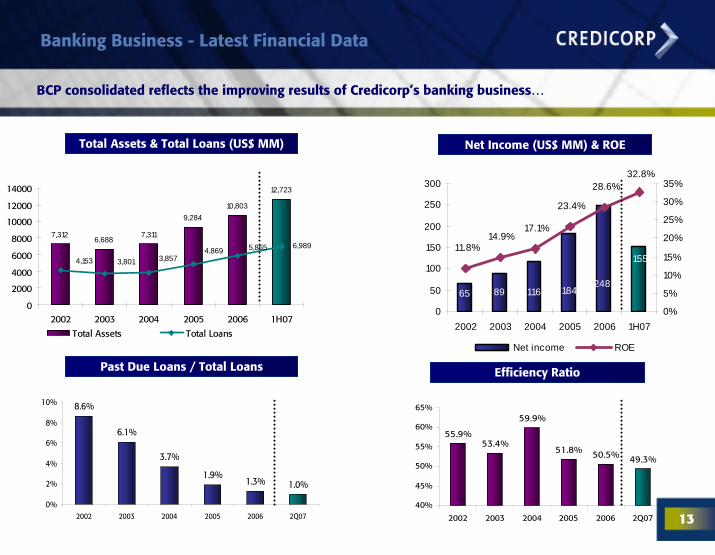
BCP consolidated reflects the improving results of Credicorp’s banking business…
Total Assets & Total Loans (US$ MM)
155
65 89 116 184248
32.8%
11.8%14.9%
17.1%
28.6%
23.4%
0
50
100
150
200
250
300
2002 2003 2004 2005 2006 1H070%
5%
10%
15%
20%
25%
30%
35%
Net income ROE
Net Income (US$ MM) & ROE
7,312 6,688 7,311
9,28410,803
12,723
6,989
3,8573,8014,1534,869 5,865
0
2000
4000
6000
8000
10000
12000
14000
2002 2003 2004 2005 2006 1H07
Total Assets Total Loans
Past Due Loans / Total Loans
8.6%
6.1%
3.7%
1.9%1.3% 1.0%
0%
2%
4%
6%
8%
10%
2002 2003 2004 2005 2006 2Q07
55.9%53.4%
59.9%
51.8% 50.5% 49.3%
40%
45%
50%
55%
60%
65%
2002 2003 2004 2005 2006 2Q07
Efficiency Ratio
14
Banking Business - Latest Financial Data
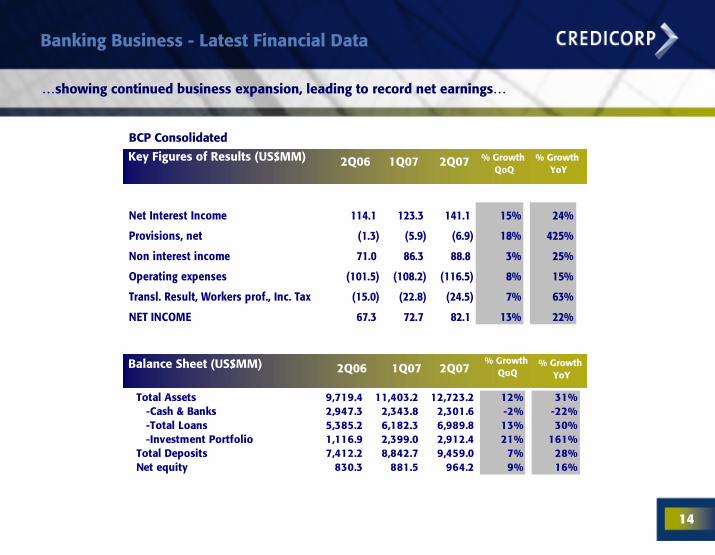
…showing continued business expansion, leading to record net earnings…
BCP Consolidated
Key Figures of Results (US$MM) 2Q06 1Q07 2Q07 % GrowthYoY
% GrowthQoQ
Net Interest Income 114.1 123.3 141.1 15% 24%
Provisions, net (1.3) (5.9) (6.9) 18% 425%
Non interest income 71.0 86.3 88.8 3% 25%
Operating expenses (101.5) (108.2) (116.5) 8% 15%
Transl. Result, Workers prof., Inc. Tax (15.0) (22.8) (24.5) 7% 63%
NET INCOME 67.3 72.7 82.1 13% 22%
Total Assets 9,719.4 11,403.2 12,723.2 12% 31% -Cash & Banks 2,947.3 2,343.8 2,301.6 -2% -22% -Total Loans 5,385.2 6,182.3 6,989.8 13% 30% -Investment Portfolio 1,116.9 2,399.0 2,912.4 21% 161% Total Deposits 7,412.2 8,842.7 9,459.0 7% 28% Net equity 830.3 881.5 964.2 9% 16%
Balance Sheet (US$MM) % GrowthYoY
% GrowthQoQ2Q06 1Q07 2Q07

15
Banking Business
Behind these results is a successful corporate strategy…
GROWTH
BANKINGBUSINESS
MARGINS
MARKET SHARE

16
Banking Business – Loan Growth
…where Retail & SME continue being the main growth drivers…
Loan volume growth ratio by segment
2005 2006 2007 (1Q*) 2007 (2Q*)
Retail and SME 26.6% 28.7% 8.2% 11.3%
Wholesale 6.9% 16.9% 4.5% 10.1%
Corporate 4.8% 14.0% 2.6% 11.7%
Middle Market 10.5% 21.6% 7.5% 7.8%
TOTAL 12.9% 20.9% 5.9% 10.6%
*Quarterly growth restated to eliminate effects of new segmentation
17
Banking Business – Loan Growth
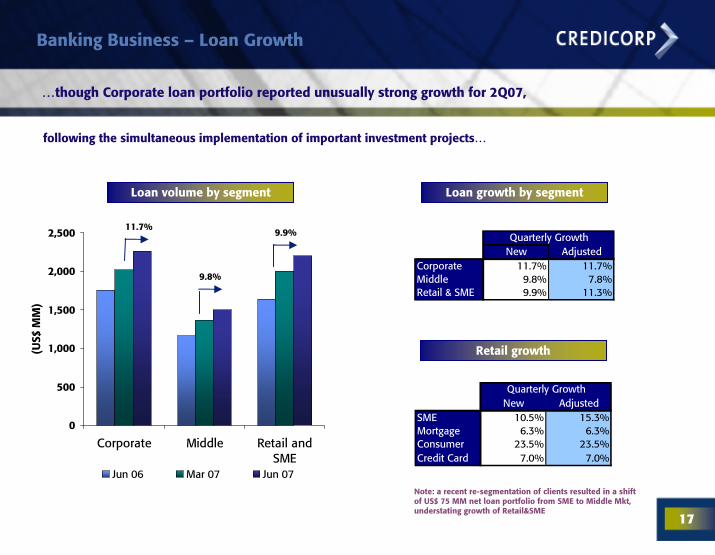
…though Corporate loan portfolio reported unusually strong growth for 2Q07,
following the simultaneous implementation of important investment projects…
Loan volume by segment Loan growth by segment
0
500
1,000
1,500
2,000
2,500
Corporate Middle Retail andSME
(US$
MM
)
Jun 06 Mar 07 Jun 07
11.7%
9.8%
9.9%
New AdjustedCorporate 11.7% 11.7%Middle 9.8% 7.8%Retail & SME 9.9% 11.3%
Quarterly Growth
Retail growth
New AdjustedSME 10.5% 15.3%Mortgage 6.3% 6.3%Consumer 23.5% 23.5%Credit Card 7.0% 7.0%
Quarterly Growth
Note: a recent re-segmentation of clients resulted in a shift of US$ 75 MM net loan portfolio from SME to Middle Mkt,understating growth of Retail&SME
18
Banking Business – Loan Growth
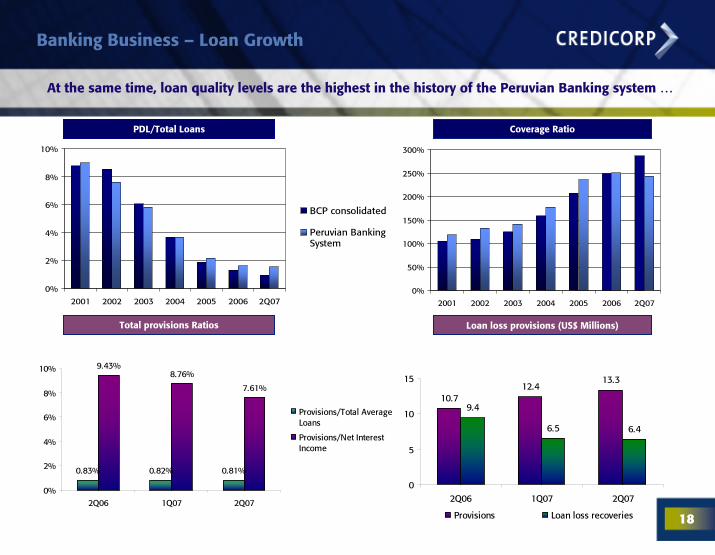
At the same time, loan quality levels are the highest in the history of the Peruvian Banking system …
Total provisions Ratios Loan loss provisions (US$ Millions)
PDL/Total Loans Coverage Ratio
0%
2%
4%
6%
8%
10%
2001 2002 2003 2004 2005 2006 2Q07
BCP consolidated
Peruvian BankingSystem
0%
50%
100%
150%
200%
250%
300%
2001 2002 2003 2004 2005 2006 2Q07
10.712.4
13.3
9.4
6.5 6.4
0
5
10
15
2Q06 1Q07 2Q07
Provisions Loan loss recoveries
0.83% 0.82% 0.81%
9.43%8.76%
7.61%
0%
2%
4%
6%
8%
10%
2Q06 1Q07 2Q07
Provisions/Total AverageLoans
Provisions/Net InterestIncome
19
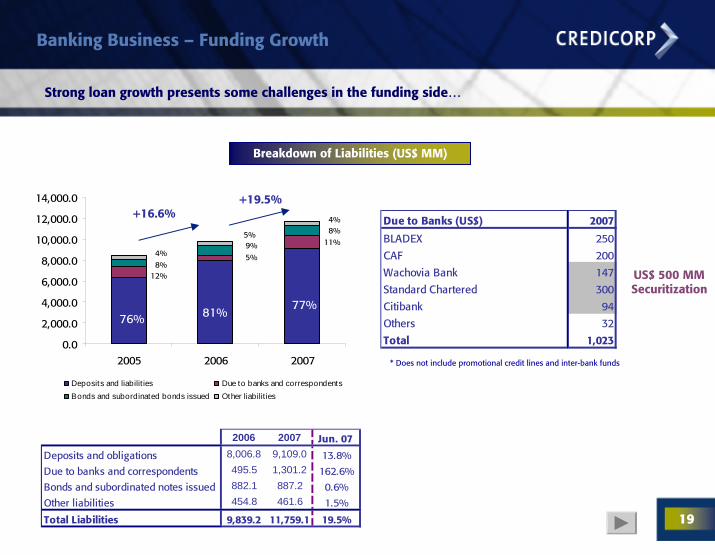
Banking Business – Funding Growth
Strong loan growth presents some challenges in the funding side…
Breakdown of Liabilities (US$ MM)
0.0
2,000.0
4,000.0
6,000.0
8,000.0
10,000.0
12,000.0
14,000.0
2005 2006 2007
Deposits and liabilit ies Due to banks and correspondentsBonds and subordinated bonds issued Other liabilit ies
+16.6%+19.5%
Due to Banks (US$) 2007
BLADEX 250
CAF 200
Wachovia Bank 147
Standard Chartered 300
Citibank 94
Others 32
Total 1,023
76%77%
81%
12%8%4% 5%
5%11%
4%8%
9%
US$ 500 MMSecuritization
* Does not include promotional credit lines and inter-bank funds
2006 2007 Jun. 07
Deposits and obligations 8,006.8 9,109.0 13.8%
Due to banks and correspondents 495.5 1,301.2 162.6%
Bonds and subordinated notes issued 882.1 887.2 0.6%
Other liabilities 454.8 461.6 1.5%
Total Liabilities 9,839.2 11,759.1 19.5%
20
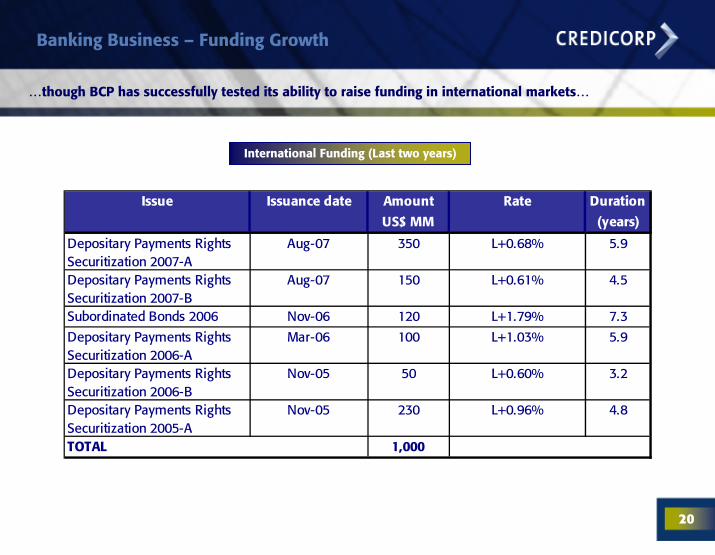
Banking Business – Funding Growth
…though BCP has successfully tested its ability to raise funding in international markets…
International Funding (Last two years)
Amount Duration
US$ MM (years)
Depositary Payments Rights Securitization 2007-A
Aug-07 350 L+0.68% 5.9
Depositary Payments Rights Securitization 2007-B
Aug-07 150 L+0.61% 4.5
Subordinated Bonds 2006 Nov-06 120 L+1.79% 7.3
Depositary Payments Rights Securitization 2006-A
Mar-06 100 L+1.03% 5.9
Depositary Payments Rights Securitization 2006-B
Nov-05 50 L+0.60% 3.2
Depositary Payments Rights Securitization 2005-A
Nov-05 230 L+0.96% 4.8
1,000
Issue Issuance date Rate
TOTAL
21
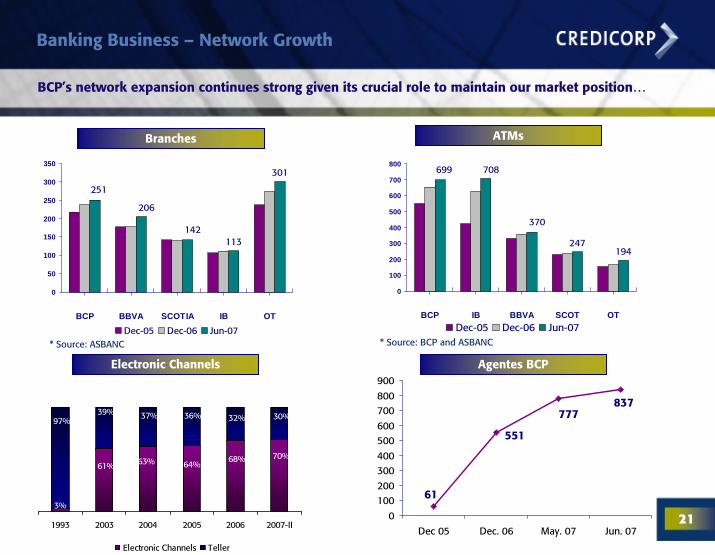
Banking Business – Network Growth
BCP’s network expansion continues strong given its crucial role to maintain our market position…
70%68%64%63%61%
3%
30%32%97%39% 37% 36%
1993 2003 2004 2005 2006 2007-II
Electronic Channels Teller
113
301
251
206
142
0
50
100
150
200
250
300
350
BCP BBVA SCOTIA IB OT
Dec-05 Dec-06 Jun-07
Branches
* Source: ASBANC
247194
370
708699
0
100
200
300
400
500
600
700
800
BCP IB BBVA SCOT OTDec-05 Dec-06 Jun-07
* Source: BCP and ASBANC
ATMs
Electronic Channels
61
837
551
777
0
100200
300400
500600
700800
900
Dec 05 Dec. 06 May. 07 Jun. 07
Agentes BCP
22
Banking Business
Behind these results is a successful corporate strategy…
GROWTH
BANKINGBUSINESS
MARGINS
MARKET SHARE
23
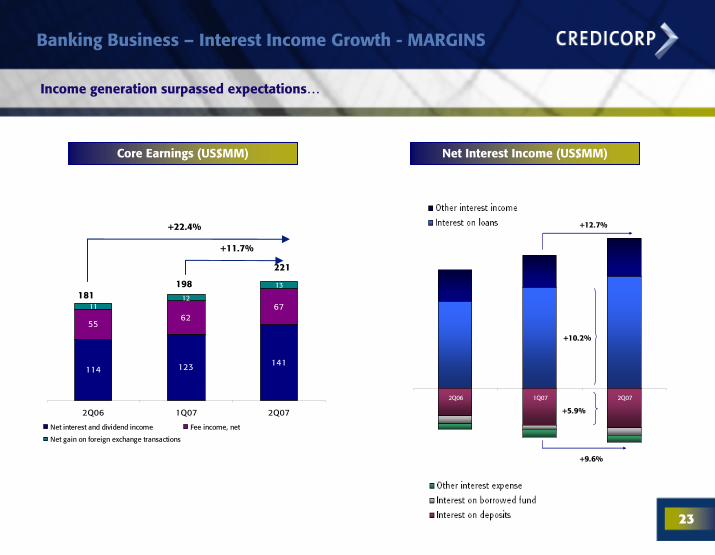
Banking Business – Interest Income Growth - MARGINS
Income generation surpassed expectations…
Core Earnings (US$MM) Net Interest Income (US$MM)
2Q06 1Q07 2Q07
+5.9%
+10.2%
+12.7%
+9.6%
114 123 141
5562
671112
13
2Q06 1Q07 2Q07
Net interest and dividend income Fee income, net
Net gain on foreign exchange transactions
221
198181
+22.4%
+11.7%

24
Banking Business – Interest Income Growth - MARGINS
Retail Banking and SME growth leads a re-composition of loans towards products with higher margins…
Loans by Segment (US$ MM) SME & Retail loans (US$ MM)
671 803 921
368509
628146
200
299
144
256
199
0
400
800
1,200
1,600
2,000
2,400
Dec. 05 Dec. 06 Jun. 07
Mortgages SME Consumer Credit Cards
1,584 1,805 2,140
9631,171
1,4341,329
1,711
2,104
0
1,000
2,000
3,000
4,000
5,000
6,000
Dec. 05 Dec. 06 Jun.07
Corporate Middle Retail & SME
50.5%
27.7%
11.0%10.8%
47.0%
29.7%
11.7%
11.6%
43.8%
29.9%
14.2%
12.2%
34.3%
24.9%
40.9%
36.5%
25.0%
38.5%
37.1%
25.3%
37.7%
Figures of BCP Consolidated, excluding BCB. Daily average balance.
25
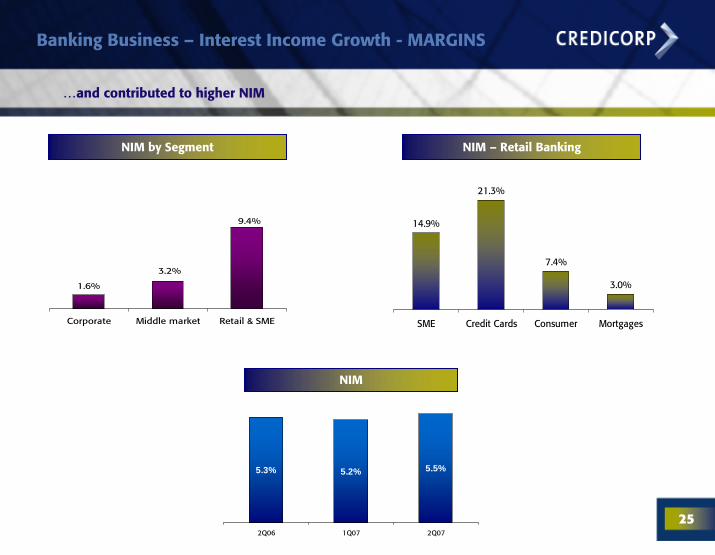
Banking Business – Interest Income Growth - MARGINS
…and contributed to higher NIM
NIM by Segment
14.9%
21.3%
7.4%
3.0%
SME Credit Cards Consumer Mortgages
NIM – Retail Banking
9.4%
1.6%
3.2%
Corporate Middle market Retail & SME
5.5%5.3% 5.2%
2Q06 1Q07 2Q07
NIM
26
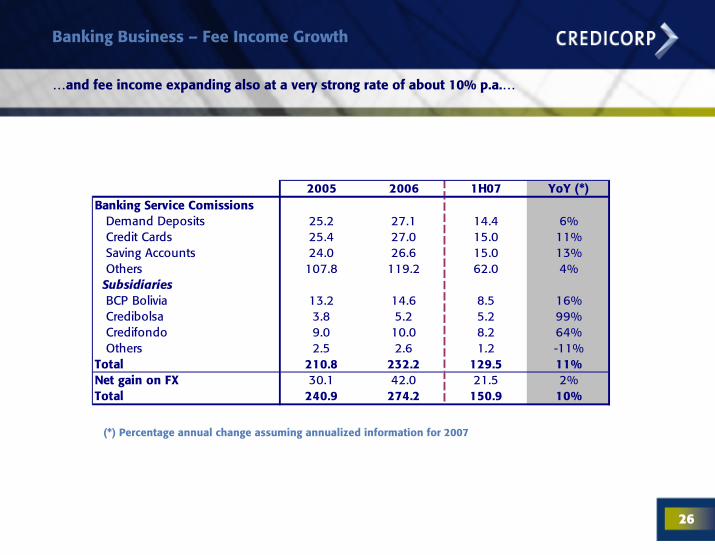
Banking Business – Fee Income Growth
…and fee income expanding also at a very strong rate of about 10% p.a.…
2005 2006 1H07 YoY (*)Banking Service Comissions Demand Deposits 25.2 27.1 14.4 6% Credit Cards 25.4 27.0 15.0 11% Saving Accounts 24.0 26.6 15.0 13% Others 107.8 119.2 62.0 4% Subsidiaries BCP Bolivia 13.2 14.6 8.5 16% Credibolsa 3.8 5.2 5.2 99% Credifondo 9.0 10.0 8.2 64% Others 2.5 2.6 1.2 -11%Total 210.8 232.2 129.5 11%Net gain on FX 30.1 42.0 21.5 2%Total 240.9 274.2 150.9 10%
(*) Percentage annual change assuming annualized information for 2007

27
Banking Business
Behind these results is a successful corporate strategy…
GROWTH
BANKING BUSINESS
MARGINS
MARKET SHARE

28
Banking Business – Market Share
Potential for growth in the retail segment is clear…
BCP’s market share in these segments allows for growth…
Loan Market Share by Segment
47%
37%
20%
38%
16%
Corporate * Middlemarket *
SME Mortgage Consumer
* As of May 2007
Source: BCP

29
Banking Business – Market Share
…though also a need for a very focused strategy…
…according to the competitive environment of each business segment:
Consumer 642 63.5% 16.6%BBVA / 17.2%Interbank / 14.5% Scotiabank / 13.0% Falabella / 16.0% Interbank / 15.9% Scotiabank / 13.1% BBVA / 28.7%Scotiabank / 12.0%Interbank / 7.3% Mi Banco / 14.3%Scotiabank / 8.4%Del Trabajo / 7.6%BBVA / 21.3%Interfondos / 15.7%Scotiabank / 11.1%
Market shareCompetitors /
Mkt. shareLoan Volume
US$ MM% Growth
Jun 07 / Jun 06
277
19.7%
1,776 66.6% 45.4%
355 53.9%
Product
Personal Loans 365 89.1% 15.5%
Credit Cards (Visa + Amex) *
Mutual Funds
Small Loans **
18.3%
Mortgages 971 24.6% 38.3%
38.8%
* Including Solución Credit Card market share would be 29.7%. **Includes lending through Solución Credit Card US$247Million.

30
Banking Business – Market Share
Despite the aggressive competition, BCP maintains its leadership in deposits and loans…
Deposits* Loans*
0%
10%
20%
30%
40%
Dec-04 Dec-05 Jun-06 Sep-06 Dec-06 Mar-07 Jun-07
BCPScotiaBBVAInterbankOthers
0%
10%
20%
30%
40%
Dec-04 Dec-05 Jun-06 Sep-06 Dec-06 Mar-07 Jun-07
Jun. 06 Sep. 06 Dec. 06 Mar. 07 Jun. 07BCP 31.4% 31.6% 31.0% 31.5% 32.0%
BBVA 21.5% 22.1% 22.5% 22.0% 22.3%
SCOTIABANK 14.9% 14.2% 13.8% 14.0% 13.8%
INTERBANK 7.9% 7.6% 7.5% 7.4% 7.6%
OTHERS 24.3% 24.5% 25.2% 25.1% 24.3%
Jun. 06 Sep. 06 Dec. 06 Mar. 07 Jun. 07BCP 36.9% 36.1% 36.9% 37.5% 37.5%
BBVA 20.7% 21.7% 21.6% 21.4% 21.5%
SCOTIABANK 17.0% 16.1% 15.5% 14.9% 15.2%
INTERBANK 8.0% 8.7% 8.8% 8.7% 8.2%
OTHERS 17.3% 17.4% 17.2% 17.5% 17.7%
* Daily average balance. Includes Credileasing and foreign branches. It does not include BCB.

31
Banking Business
Higher earnings generation led to improvement of all performance ratios …
Cost/Income
49.3%48.2% 49.8%
2Q06 1Q07 2Q07
ROAEROAA
33.8%31.5%
35.5%
2Q06 1Q07 2Q07
2.7%2.8% 2.6%
2Q06 1Q07 2Q07

32
Corporate Strategy
Performance results confirm our strategy…
Banking Business
Insurance Business
Asset Management Business

33
Insurance Business
A reorganization of Pacífico’s business model was implemented in 2006…
Previous business model
New business model
Independent business units by market segment
Sales based on market segment and distribution
channels
Risk management through profit centers by business
segments
De-centralized underwriting
Centralized operations and client serviceDe-centralized operations
Centralized claims’management and client
assistance
Claims’ management by individual
business units

34
Insurance Business
The application of the new business model translates into…
Focus on Results
* Grow profitable insurance segments - away from loss burdened businesses
* Better risk management
* Cost cutting measures * Better underwriting results / 8.1 pointsreduction in NEL ratio
* Introduction of new small business and retail costumers' products
* Recovery of market share to 34.8% from 26.3%
* Cost control of service providers * Turn around into positive results since 2006
* General cost cutting measures * Volume growth
* Preserve its leading market share of 54.1%
* Shift from the annuity business in favor of the dissability / survival insurance business - reduction of earnings volatility
* Continued good performance
* Improved financial returns based on performance of capital markets
* Improved market share to 26% from 24.3% a year ago
* Quality of service * Improved bottom line results:
- $ 5.6 in 2005 - $ 14.5 in 2006 - $ 11.8 in 1H07
* Business origination / increased selling and marketing efforts
P&C
Health
Life
Consolidated
35
Insurance Business
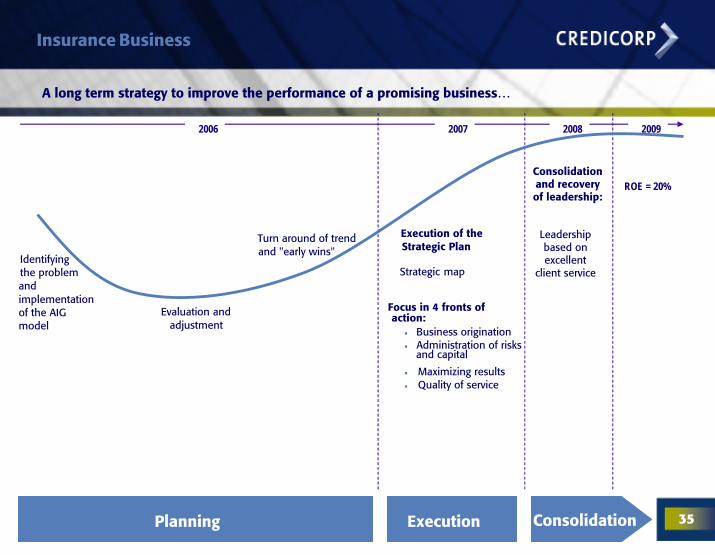
A long term strategy to improve the performance of a promising business…
Evaluation andadjustment
Turn around of trend and "early wins"
Execution of the Strategic Plan
Focus in 4 fronts of action:
Business originationAdministration of risksand capital
Maximizing resultsQuality of service
Consolidation and recoveryof leadership:
Leadershipbased onexcellent
client service
ROE = 20%
Identifying the problemand implementation of the AIG model
2007 2008 20092006
ExecutionPlanning Consolidation
Strategic map
36
Insurance Business
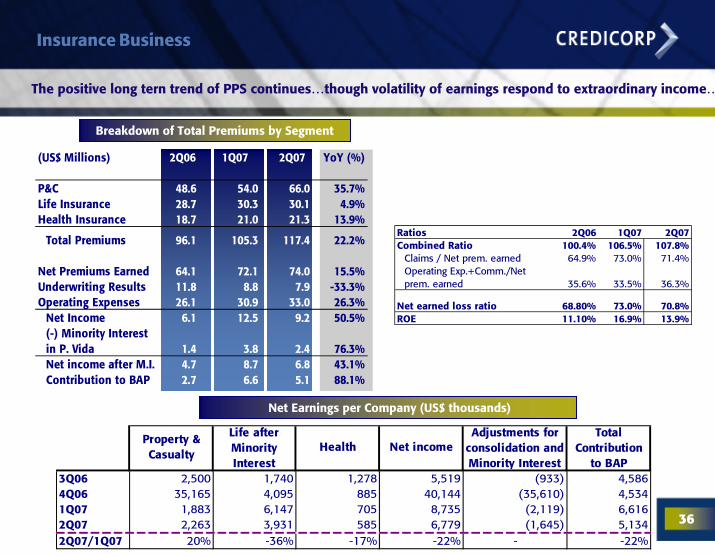
The positive long tern trend of PPS continues…though volatility of earnings respond to extraordinary income…
(US$ Millions) 2Q06 1Q07 2Q07 YoY (%)
P&C 48.6 54.0 66.0 35.7%Life Insurance 28.7 30.3 30.1 4.9%Health Insurance 18.7 21.0 21.3 13.9%
Total Premiums 96.1 105.3 117.4 22.2%
Net Premiums Earned 64.1 72.1 74.0 15.5%Underwriting Results 11.8 8.8 7.9 -33.3%Operating Expenses 26.1 30.9 33.0 26.3%
Net Income 6.1 12.5 9.2 50.5%(-) Minority Interest in P. Vida 1.4 3.8 2.4 76.3%Net income after M.I. 4.7 8.7 6.8 43.1%Contribution to BAP 2.7 6.6 5.1 88.1%
Breakdown of Total Premiums by Segment
Ratios 2Q06 1Q07 2Q07Combined Ratio 100.4% 106.5% 107.8%
Claims / Net prem. earned 64.9% 73.0% 71.4%Operating Exp.+Comm./Net prem. earned 35.6% 33.5% 36.3%
Net earned loss ratio 68.80% 73.0% 70.8%ROE 11.10% 16.9% 13.9%
Net Earnings per Company (US$ thousands)
3Q06 2,500 1,740 1,278 5,519 (933) 4,586 4Q06 35,165 4,095 885 40,144 (35,610) 4,534 1Q07 1,883 6,147 705 8,735 (2,119) 6,616 2Q07 2,263 3,931 585 6,779 (1,645) 5,134 2Q07/1Q07 20% -36% -17% -22% - -22%
Net income Adjustments for
consolidation and Minority Interest
Total Contribution
to BAP
Property & Casualty
Life after Minority Interest
Health

37
Corporate Strategy
Individual strategies that add up…
Banking Business
Insurance Business
Asset Management Business
38
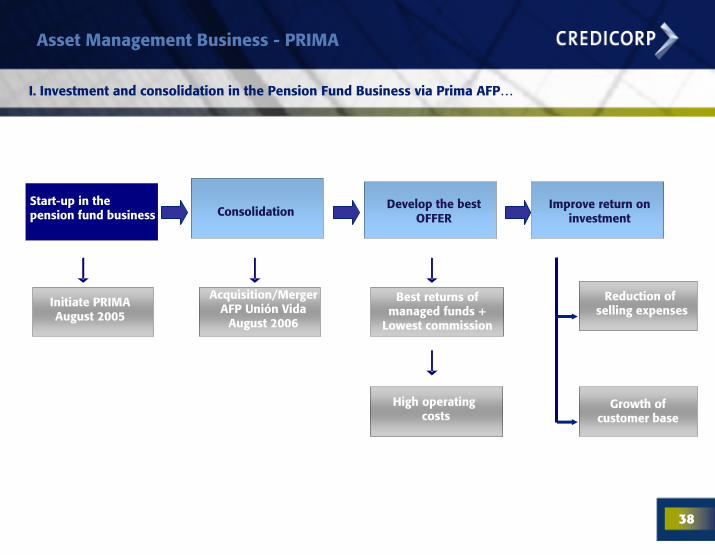
Asset Management Business - PRIMA
I. Investment and consolidation in the Pension Fund Business via Prima AFP…
ConsolidationDevelop the best
OFFERImprove return on
investmentStart-up in the pension fund business
Reduction of selling expenses
Initiate PRIMAAugust 2005
Best returns of managed funds +
Lowest commission
Acquisition/MergerAFP Unión Vida
August 2006
High operating costs
Growth of customer base
39
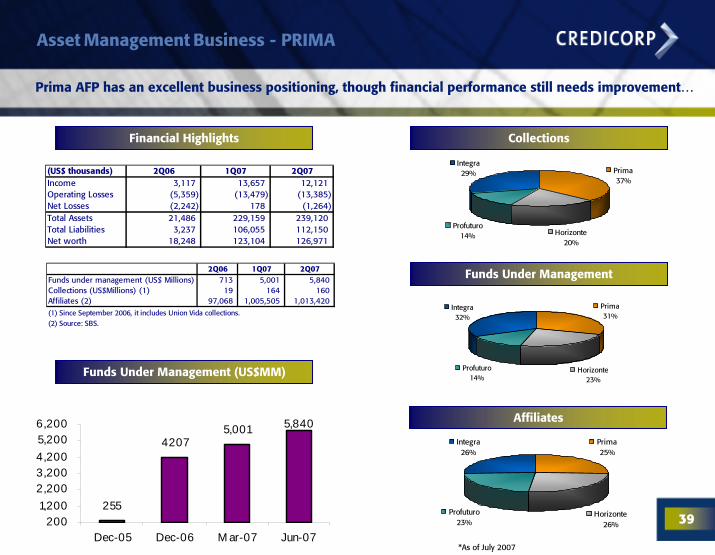
Asset Management Business - PRIMA
Prima AFP has an excellent business positioning, though financial performance still needs improvement…
Funds Under Management (US$MM)
Financial Highlights
Affiliates
Funds Under Management
(US$ thousands) 2Q06 1Q07 2Q07Income 3,117 13,657 12,121 Operating Losses (5,359) (13,479) (13,385) Net Losses (2,242) 178 (1,264) Total Assets 21,486 229,159 239,120 Total Liabilities 3,237 106,055 112,150 Net worth 18,248 123,104 126,971
2Q06 1Q07 2Q07Funds under management (US$ Millions) 713 5,001 5,840 Collections (US$Millions) (1) 19 164 160 Affiliates (2) 97,068 1,005,505 1,013,420 (1) Since September 2006, it includes Union Vida collections.(2) Source: SBS.
Prima31%
Horizonte23%
Profuturo14%
Integra32%
255
42075,001 5,840
2001,2002,2003,2004,2005,2006,200
Dec-05 Dec-06 M ar-07 Jun-07
Prima25%
Horizonte26%
Profuturo23%
Integra26%
*As of July 2007
Prima37%
Horizonte20%
Profuturo14%
Integra29%
Collections

40
Asset Management Business – Corporate Approach
II. Expansion of the Asset Management Business offers important income potential…
Asset management activities in several vehicles…
Fee income
Homogeneous risk control and investment policies
Best international practices
BCP Mutual Funds
ASHC PortfoliosMutual FundsPools
PRIMA Pension Funds
Third Party Funds (US$ MM)
255997 1,0702,322
4,206
1,2911,383
6,880
1,887 1,841
5,840
9,568
01,5003,0004,5006,0007,5009,000
ASHC CredifondoBCP and BCB
Prima AFP Total
2005 2006 2Q07

41
Agenda
Latest Financial Data
Main growth drivers
1. Economic Environment
2. Corporate Strategy
Potential Risks
Overview
II
IV
III
I

42
Potential Risks
Risks that might threaten future results…
Evolution of the World EconomySlowdown of economic activity Commodity pricesChina Greater importance as consumer and producer, third in the world exchangeFlight to quality in Treasuries Risk aversion
Peruvian economyLoss of political / social stability Dissatisfaction of certain segments of the population
that have not benefited from expansion
Earthquake: Estimates indicate a marginal economic impact, however it is still difficult to quantify the negative effects in some productive industries and tourism

43
Agenda
Latest Financial Data
Main growth drivers
1. Economic Environment
2. Corporate Strategy
Potential Risks
Overview
II
IV
III
I

44
Overview
Credicorp is the sum of its parts …
2T06 1Q07 2T07Banco de Crédito BCP(1) 64.8 70.6 79.8 13% 23%
BCB 3.3 4.8 5.5 14% 67%Atlantic 3.0 5.0 4.4 -12% 45%PPS 2.7 6.6 5.1 -22% 88%Grupo Crédito (2) (2.8) 1.2 (0.6) -149% -79%
Prima (2.2) 0.2 (1.3) -812% -44%Others (0.5) 1.0 0.7 -34% -225%
Credicorp and Others (3) (3.3) (4.4) (1.3) -70% -61%Credicorp Ltd. (3.4) (4.5) (1.5) -66% -54%Others 0.1 0.1 0.2 218% 338%
Net income attributable to Credicorp 64.4 79.0 87.4 11% 36%
(2) Includes Grupo Crédito, Servicorp(3) Includes taxes on BCP's and PPS's dividends and other expenses at Credicorp Ltd. level.
(1) Includes Banco de Crédito de Bolivia.
Earnings Contributions (US$MM) 2Q06 1Q07 2Q07% Growth
QoQ% Growth
YoY
45
Overview
…2Q07 results confirm a more vigorous business expansion with growth surpassing our expectations…
Economic and business activity has surpassed all official and private expectations.
Focus in Retail & SME and transactional business, continues as Credicorp’s main strategy,
however, the wholesale sector is also seeing strong expansion from renewed investment activity,
while delinquencies reach the lowest level ever…
Therefore, results for Credicorp reach again an all time high with US$ 87.4 million for 2Q07…
leading to a ROEA of 23.7% .
BCP leads Credicorp’s business growth reaching a ROAE of 35.5%...
ASHC continues growing its underlying core and fund management businesses…
PPS results are in line with their long term recovery …
Prima has commercial success, though the operational costs and financial burden remain high…
46
Overview
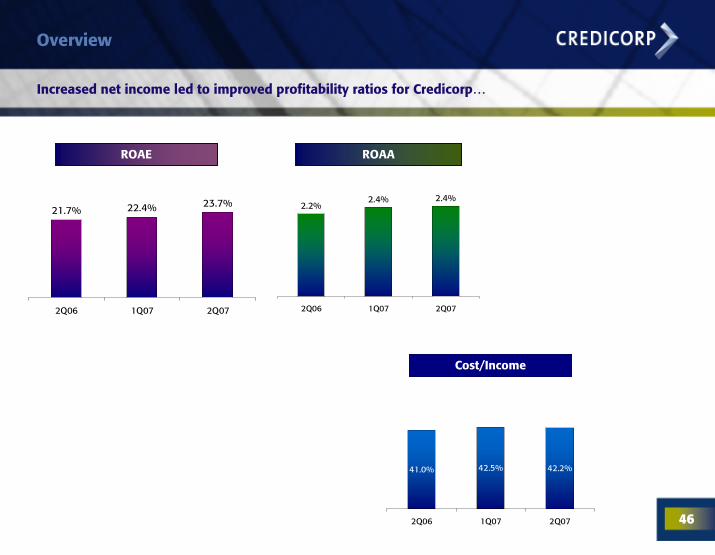
Increased net income led to improved profitability ratios for Credicorp…
ROAE ROAA
2.4%2.2%
2.4%
2Q06 1Q07 2Q07
21.7% 22.4% 23.7%
2Q06 1Q07 2Q07
Cost/Income
42.2%41.0% 42.5%
2Q06 1Q07 2Q07

47
Safe Harbor for Forward-Looking StatementsThis material includes “forward-looking statements” within the meaning of Section 21E of the Securities Exchange Act of 1934. All statement other than statements of historical information provided herein are forward-looking and may contain information about financial results, economic conditions, trends and known uncertainties.
The Company cautions readers that actual results could differ materially from those expected by the Company, depending on the outcome of certain factors, including, without limitation: (1) adverse changes in the Peruvian economy with respect to the rates of inflation, economic growth, currency devaluation, and other factors, (2) adverse changes in the Peruvian political situation, including, without limitation, the reversal of market-oriented reforms and economic recovery measures, or the failure of such measures and reforms to achieve their goals, and (3) adverse changes in the markets in which the Company operates, including increased competition, decreased demand for financial services, and other factors. Readers are cautioned not to place undue reliance on these forward-looking statements, which speak only as of the date hereof.
The Company undertakes no obligation to release publicly the result of any revisions to these forward-looking statements which may be made to reflect events or circumstances after the date hereof, including, without limitation, changes in the Company’s business strategy or planned capital expenditures, or to reflect the occurrence of unanticipated events.

September 2007

49
Background
Presence in the whole financial system through several leading financial institutions…
Change2006/2005
Change2005/20042004 2005 2006Credicorp
Banco de Crédito BCP AtlanticSecurityHolding Corporation Pacífico Peruano Suiza Grupo Crédito
Pacífico Vida
Pacífico Salud
97% 100% 100%76%
Credicorp
Banco de Crédito BCP
Banco de Crédito de Bolivia
Atlantic Security Holding Corporation Pacífico Peruano Suiza Grupo Crédito
Prima AFPPacífico Vida
Pacífico Salud

50
Background
Change2006/2005
Change2005/20042004 2005 2006
A diversified shareholder structure…
Romero Family16.0%
ASHC15.5%
AFP Profuturo4.0%
AFP Integra10.0%
AFP Prima9.3% AFP Horizonte
7.0%
Private & Inst. Investors
38.2%
Percentages estimated as of April 2007.

51
BCP Bolivia – Business Performance
BCP Bolivia reports as well excellent results and reaches ROAE of 30%...
Net Income & ROE PDL / Total Loans
11.0%
5.8%
3.6%2.7%
0.0%
2.0%
4.0%
6.0%
8.0%
10.0%
12.0%
2004 2005 2006 2007-II
4.8
10.2
14.1
10.38.4%
21.0%
29.9%21.7%
0.0
2.0
4.0
6.0
8.0
10.0
12.0
14.0
16.0
2004 2005 2006 1H070%
5%
10%
15%
20%
25%
30%
35%
Net Income ROE
Market Share
Mercantil, 20.1%
Nacional, 17.1%
Other, 47.8%
BCP, 15.0%
Mercantil, 24.5%
Nacional, 19.2%
Other, 41.8%
BCP 14.5%
Deposits Loans

52
Atlantic Security Holding Corporation
Atlantic’s results reveal good underlying business growth…
AuM & Deposits (US$ Millions)…but affected by volatile income from securities.
1,143
2,276
2,826
3,274
1,3871,198
1,133 1,6281,887
0
500
1,000
1,500
2,000
2,500
3,000
3,500
Jun. 06 Mar.07 Jun. 07
US$
Mill
ions
Deposits
Investments
Total
Net Income (US$ Millions)
2Q06 1Q07 2Q07 Ytd (%)
Net Interest Income 3.5 4.4 4.9 38%Provisions -0.2 -0.3 -0.8 424%Fee Income 1.7 2.0 2.3 36%Net gains from sale of sec. -0.2 0.6 -0.2 34%Net gains on FX transact. -0.01 0.01 0.03 -316%Other Income 0.002 0.3 0.23 9211%Oper. Expenses -1.9 -1.9 -2.1 10%
CONTRIB. TO BAP 3.0 5.0 4.4 45%
Financial Ratios
2Q06
162.717.8%15.5%
1Q07
217.617.1%14.1%
2Q07
201.815.9%13.4%
Net Equity (US$ MM)ROE*BIS Ratio*
*Figures of ASB, on an accumulated basis (1H07)

53
Regulatory Capital
BCP will issue Subordinated Bonds in order to maintain appropriate levels of regulatory capital…
• Even though the legal capital ratio limit in Peru is 9% (11x as measured in Peru); BCP has a more stringent internal capital ratio limit of 10.5% (9.5x) approved by the Board. • As of June 2007, BCP’s ratio reached 10.7% (9.3x) due to a higher growth of total and contingent loans. • On the other hand, subordinated debt represents 17.5% of the BCP’s regulatory capital.• BCP will issue US$160 Mn. of Subordinated Debt, in order to maintain adequate levels of leverage.
BCP’s CAR vs. System’s CAR
Risk Weighted Assets evolution
Figures are according to BCP unconsolidated basis
6,181.36,300.66,450.4
6,692.46,906.9
7,193.77,387.0
7,650.2
730.9 728.3 728.1
792.7 787.2 792.4 793.2
864.7
4,000.0
4,500.0
5,000.0
5,500.0
6,000.0
6,500.0
7,000.0
7,500.0
8,000.0
Dec. 06Jan. 07Feb. 07Mar. 07Apr. 07 May.07
Jun. 07 Jul. 07500.0
600.0
700.0
800.0
900.0
1,000.0
1,100.0
1,200.0
RWA Regulatory Capital
12.2% 12.2%
11.8% 11.7%
11.1%11.3% 11.2% 11.2%
11.5%
11.0% 11.0% 11.0%
10.6%10.3%
10.5% 10.4%10.1%
11.8% 11.8%11.6%
11.3%
11.8%
11.4%
11.0%10.7%
11.3%
9.0%
9.5%
10.0%
10.5%
11.0%
11.5%
12.0%
12.5%
Jul. 06 Aug. 06 Sep-06 Oct-06 Nov-06 Dec. 06 Jan. 07 Feb-07 Mar-07 Apr. 07 May-07 Jun-07 Jul-07
BCP's Cap. Adeq. Ratio System's Cap. Adeq. Ratio
Jul

54
Banking Business – Funding Growth
Breakdown of Deposits (US$ MM)
2,1552,885 3,318
2,186
2,7083,2591,656
655
775
820
2,027
1,952
0
2,000
4,000
6,000
8,000
10,000
Dec. 05 Dec. 06 Jun.07
Time Demand Savings CTS
+25.1%
+11.0%
9.8%
24.9%
32.9%
32.4%34.7%
32.5%
23.5%
9.3%
35.2%
34.6%
21.5%
8.7%

55
Banking Business – Interest Income Growth - MARGINS
34.4 28.4 36.5
136.4162.1
23.315.7
19.9
66.6
76.4
29.9
20.3
5.96.1
2.73
12.8
9.9
0
50
100
150
200
250
300
OthersFeesNII
13.7% 26.9%
18.0%
Corporate Middle Retail & SME
2006-I1 2007-II 2006-II 2007-II 2006-II 2007-II
Income by segment