Performance of the NE Multispecies Fishery (May 2013 … Final Report on the Performance of the...
111
Northeast Fisheries Science Center Reference Document 15-02 2013 Final Report on the Performance of the Northeast Multispecies (Groundfish) Fishery (May 2013 – April 2014) by Tammy Murphy, Andrew Kitts, Chad Demarest, and John Walden
-
Upload
duonghuong -
Category
Documents
-
view
215 -
download
0
Transcript of Performance of the NE Multispecies Fishery (May 2013 … Final Report on the Performance of the...
Northeast Fisheries Science Center Reference Document 15-02
2013 Final Report on thePerformance of the Northeast
Multispecies (Groundfish) Fishery(May 2013 – April 2014)
by Tammy Murphy, Andrew Kitts, Chad Demarest, and John Walden

Northeast Fisheries Science Center Reference Document 15-02
U.S. DEPARTMENT OF COMMERCENational Oceanic and Atmospheric Administration
National Marine Fisheries ServiceNortheast Fisheries Science Center
Woods Hole, MassachusettsJanuary 2015
2013 Final Report on thePerformance of the Northeast
Multispecies (Groundfish) Fishery(May 2013 – April 2014)
by Tammy Murphy, Andrew Kitts, Chad Demarest, and John Walden
NOAA Fisheries, Northeast Fisheries Science Center, 166 Water Street, Woods Hole, MA 02543

Northeast Fisheries Science Center Reference Documents
This series is a secondary scientific series designed to assure the long-term documentation and to enable the timely transmission of research results by Center and/or non-Center researchers, where such results bear upon the research mission of the Center (see the outside back cover for the mission statement). These documents receive internal scientific review, and most receive copy editing. The National Marine Fisheries Service does not endorse any proprietary material, process, or product mentioned in these documents. All documents issued in this series since April 2001, and several documents issued prior to that date, have been copublished in both paper and electronic versions. To access the electronic version of a document in this series, go to http://www.nefsc.noaa.gov/nefsc/publications/. The electronic version is available in PDF format to permit printing of a paper copy directly from the Internet. If you do not have Internet access, or if a desired document is one of the pre-April 2001 documents available only in the paper version, you can obtain a paper copy by contacting the senior Center author of the desired document. Refer to the title page of the document for the senior Center author’s name and mailing address. If there is no Center author, or if there is corporate (i.e., non-individualized) authorship, then contact the Center’s Woods Hole Labora-tory Library (166 Water St., Woods Hole, MA 02543-1026). Information Quality Act Compliance: In accordance with section 515 of Public Law 106-554, the Northeast Fisheries Science Center completed both technical and policy reviews for this report. These predissemination reviews are on file at the NEFSC Editorial Office. This document may be cited as:
Murphy T, Kitts A, Demarest C, Walden J. 2015. 2013 Final report on the performance of the northeast multispecies (groundfish) fishery (May 2013 – April 2014). US Dept Commer, Northeast Fish Sci Cent Ref Doc. 15-02; 106 p. Available from: National Marine Fisheries Service, 166 Water Street, Woods Hole, MA 02543-1026, or online at http://www.nefsc.noaa.gov/nefsc/publications/

TABLE OF CONTENTS
Table of Contents ........................................................................................................................1
List of Tables ..............................................................................................................................3
List of Figures .............................................................................................................................5
Executive Summary ....................................................................................................................6
1. Introduction ........................................................................................................................... 10
1.1. Data and Analytical Approach..................................................................................... 13
1.2. Performance of Sector and Common Pool Vessels ...................................................... 15
2. Landings and Gross Revenues ............................................................................................... 17
2.1. Landings ..................................................................................................................... 17
2.2. Gross Revenues .......................................................................................................... 18
2.2.1. Revenues by Landing Port and Home Port ........................................................... 18
2.2.2. Revenues by Species ............................................................................................ 20
2.3. Prices .......................................................................................................................... 22
3. Number of Vessels and Effort ............................................................................................... 23
3.1. Number of Vessels ...................................................................................................... 23
3.1.1. Number of Active Vessels by Home Port ............................................................. 24
3.1.2. Number of Active Vessels by Vessel Size ............................................................ 25
3.2. Number of Trips, Days Absent, and Trip Length ......................................................... 25
4. Economic Performance ......................................................................................................... 27
4.1. Revenue per Vessel ..................................................................................................... 28
4.2. Fleet Productivity ........................................................................................................ 28
5. ACE Leasing ......................................................................................................................... 29
5.1. Market Structure, Size, and Characteristics ................................................................. 30
5.2. Prices .......................................................................................................................... 31
5.3. Transfer Payments ...................................................................................................... 32
5.4. Transactions Costs ...................................................................................................... 32
6. Distributional Issues .............................................................................................................. 33
6.1. Number of Vessel Affiliations ..................................................................................... 34
6.2. Distribution of Revenue among Vessels ...................................................................... 34
1

6.3. Distribution of Revenue among Vessel Affiliations ..................................................... 35
6.4. Distribution of Revenue Using Lorenz Curves and Gini Coefficients .......................... 36
6.5. Consolidation and Concentration of Revenue among Vessel Affiliations ..................... 36
7. Employment .......................................................................................................................... 37
7.1. Number of Crew Positions .......................................................................................... 37
7.2. Number of Crew Trips ................................................................................................ 38
7.3. Number of Crew Days ................................................................................................ 38
8. Net Revenues ........................................................................................................................ 39
8.1. Average Owner and Crew Shares Per Day .................................................................. 41
8.2. Average Owner and Crew Shares per Vessel ............................................................... 42
8.3. Aggregate Owner and Crew Shares ............................................................................. 42
9. Concluding Remarks ............................................................................................................. 42
10. Acknowledgments ............................................................................................................... 43
11. References ........................................................................................................................... 44
2

LIST OF TABLES Table 1. Summary of major trends (May through April, includes all vessels with a valid limited access multispecies permit). ........................................................................................................8 Table 2. Total landings and revenue from all trips by fishing year in 2010 dollars (May through April). ....................................................................................................................................... 46 Table 3. Total landings and revenue from groundfish trips by fishing year in 2010 dollars (May through April. ........................................................................................................................... 46 Table 4. Value of landings of all species by state and port of landing in 2010 dollars (May through April, all trips). ............................................................................................................. 47 Table 5. Value of landings of all species by home port state and home port in 2010 dollars (May through April, all trips). ............................................................................................................. 48 Table 6. Value of landings of groundfish by state and port of landing in 2010 dollars (May through April, all trips). ............................................................................................................. 49 Table 7. Value of landings of groundfish by home port state and home port in 2010 dollars (May through April, all trips). ............................................................................................................. 50 Table 8. Value and landed pounds of nine allocated groundfish species* landed by limited access groundfish vessels in 2010 dollars (May through April). ........................................................... 51 Table 9. Value and landed pounds of top ten non-groundfish species* landed by limited access groundfish vessels in 2010 dollars (May through April). ........................................................... 52 Table 10. Number of vessels by fishing year (May through April). ............................................ 53 Table 11. Number of vessels with revenue from any species (all trips) by home port state. ........ 54 Table 12. Number of vessels with revenue from at least one groundfish trip by home port state.55 Table 13. Number of vessels with revenue from any species by vessel size category. ................ 56 Table 14. Number of vessels with revenue from at least one groundfish trip by vessel size category. ................................................................................................................................... 56 Table 15. Effort by active vessels (May through April). ............................................................ 57 Table 16. Average revenue per active vessel in 2010 dollars (May through April).* .................. 60 Table 17. Lowe Index (2007=1) of productivity change for the limited access groundfish fleet. 61 Table 18. Number of MRIs leasing ACE and/or PSC and amount of live pounds caught by home port state. .................................................................................................................................. 61 Table 19. Number of vessel affiliations leasing ACE and/or PSC by home port state and amount of live pounds caught. ............................................................................................................... 62 Table 20. Number of lessee MRIs by vessel size category. ........................................................ 63 Table 21. ACE and PSC lease markets by stock (live pounds). .................................................. 64 Table 22. Total allocated ACE and catch by vessel size category............................................... 65 Table 23. Volume of between-sector ACE leases by stock (live pounds). .................................. 66 Table 24. Number of between-sector ACE lease transactions, by month and fishing year. ......... 67 Table 25. ACE lease prices from hedonic model. ...................................................................... 69 Table 26. ACE lease prices from weighted mean values for single stock leases. ........................ 70
3

Table 27. Ex-vessel and ACE lease prices. ................................................................................ 71 Table 28. Transfer payments from ACE and PSC leasing by stock at the MRI level. ................. 72 Table 29. Transfer payments from ACE and PSC leasing by stock at the vessel affiliation level. ................................................................................................................................................. 74 Table 30. Transfer payments from ACE and PSC leasing by lessee home port state. ................. 76 Table 31. Stock level catch, ACE, and utilization. ..................................................................... 78 Table 32. Number of vessel affiliations by fishing year. ............................................................ 80 Table 33. Number and percentage of vessel affiliations by number of active vessels owned. ..... 81 Table 34. Distribution of revenue from all species (all trips) among vessels. ............................. 82 Table 35. Distribution of revenue from groundfish (all trips) among vessels. ............................. 83 Table 36. Distribution of revenue from all species (all trips) among vessel affiliations. ............. 84 Table 37. Distribution of groundfish revenue among vessel affiliations. .................................... 85 Table 38. Number of vessel affiliations with revenue from all species by cumulative (on all trips) quartiles (ordered high revenue to low). .................................................................................... 86 Table 39. Number of vessel affiliations with revenue from groundfish by cumulative (on all trips) quartiles (ordered high revenue to low). ........................................................................... 86 Table 40. Changes in employment indicators by vessel size category (May through April, all trips). ........................................................................................................................................ 87 Table 41. Changes in employment indicators by home port state (May through April, all trips). 88 Table 42. Per day trip cost averages (in 2010 dollars). ............................................................... 90 Table 43. Per day values for groundfish trips (in 2010 dollars). ................................................. 91 Table 44. Per day values for non-groundfish trips (in 2010 dollars). .......................................... 92 Table 45. Average owner and crew share per vessel (in 2010 dollars). ....................................... 93 Table 46. Aggregate owner and crew shares by vessel size category (in 2010 dollars). .............. 93 Table 47. Aggregate owner and crew shares by homeport state (in 2010 dollars). ...................... 94
4

LIST OF FIGURES Figure 1. Yearly average price (in 2010 dollars) of combined groundfish vs. other species. ....... 95 Figure 2. Yearly average price (in 2010 dollars) by allocated groundfish species. ...................... 96 Figure 3. Quantity adjusted groundfish price index (base period = May through July 2007). ..... 97 Figure 4. 2013 catch and allocated ACE by vessel size category for individual stocks. ............ 102 Figure 5. Number of vessel affiliations with revenue from any species by total revenue category. ............................................................................................................................................... 103 Figure 6. Lorenz curves and Gini values at the affiliated vessel level for all species revenues (from active vessels). .............................................................................................................. 104 Figure 7. Lorenz curves and Gini values at the affiliated vessel level for groundfish revenues (from active vessels). .............................................................................................................. 105 Figure 8. Components of annual financial profit (illustrative example). ................................... 106
5

EXECUTIVE SUMMARY
This report provides an evaluation of the economic and social performance of active limited access Northeast groundfish vessels for the 2013 fishing year (May 2013 through April 2014). Table 1 contains a summary of major trends for the fishery for the period 2010-2013. The report focuses on trends from 2010 onward and on changes that occurred between 2012 and 2013. An important difference in this year’s report from previous reports is that all monetary metrics are presented in constant dollars that have been adjusted for inflation, using 2010 as the base year, rather than in nominal terms. Revenue and price metrics for the 2013 fishing year in Table 1, Table 2, and Table 3 have been presented in nominal terms (in addition to real, or constant, terms).
Fishing Year 2013 saw a continuation of the mostly negative trends seen for the limited access groundfish fleet in Fishing Year 2012 compared with the landings and revenues seen in the fishery from 2010 to 2011. The total amount of Annual Catch Entitlement (ACE) for all the allocated groundfish species declined 13% from 2012 to 2013, which is a 27.5% reduction from 2010.
Annual Catch Limits (ACLs) for 12 of the 17 allocated stocks were cut from 2012 to 2013: all three cod stocks, all three haddock stocks, all three yellowtail flounder stocks, plaice, witch flounder, and GOM winter flounder. ACLs increased from their 2012 levels for five stocks: Georges Bank and Southern New England (allocated for the first time in 2013) winter flounder, redfish, white hake, and pollock.
Groundfish fishermen could not offset a substantial loss of $28 million in groundfish revenues (in real dollars) between 2010 and 2013 with increases in non-groundfish revenues. Revenue is determined by both landings and price, and groundfish landings in 2013 continued the decline that the limited access groundfish fleet experienced in 2012. Declining groundfish landings were coupled with little growth in non-groundfish landings for the fleet in 2013. Total landings of all species on all trips were 256.4 million pounds in 2013, a 1.6% decrease from 2012 (260.5 million pounds). Total groundfish landings on all trips decreased to a four-year low of 42.2 million pounds in 2013, compared with 58.7 million pounds in 2010.
Both average groundfish price and average non-groundfish prices received by the fleet fell in 2013 to four-year lows. In 2010 dollars, average groundfish price was $1.31 per pound in 2013 (from $1.42 in 2010) and average non-groundfish price was $1.00 per pound (from $1.21 in 2010). The fall in average groundfish price is especially notable given that groundfish landings also decreased to a four-year low of 42.2 million pounds in 2013. This does not mean that there were both price and quantity declines in all groundfish species; this only occurred with cod, plaice, and redfish. There was also a change in the mix of quantities of groundfish landed with decreases in shares of cod (and a concurrent drop in price) and pollock (small increase in price) and increases in the shares of winter flounder and haddock (with decreases in prices in both of these species).
The result of these landings and price changes is that total groundfish revenue was at a four-year low of $55.2 million in 2013. Total revenue from both groundfish and non-groundfish species declined from $293.3 million in 2010 to $269.9 million (8%) in 2013.
The active limited access groundfish fleet decreased by 120 vessels over 2010-2013, to a four-year low of 735 active vessels. The number of vessels with revenue earned from taking at least one groundfish trip also decreased to a four-year low of 327 vessels in 2013, with 119 fewer vessels taking groundfish trips in 2013 than in 2010. Effort on groundfish trips generally
6

decreased in 2013. The fleet is taking fewer groundfish trips, with fewer total days absent on these trips. However, when a groundfish trip is taken, most vessels are taking lengthier trips than in prior years.
Measured from a somewhat longer time frame of 2007-2013, productivity for the Northeast Multispecies Fishery peaked in 2009 and has since slowly declined. In 2013 productivity was 4% lower than it was in 2007.
Aggregate owner shares of net revenue (gross revenue adjusted by fishing trip costs) were at a four-year low in 2013 at $122.2 million. This is an 11% decline from $136.9 million in 2010. Aggregate crew shares of net revenues also declined by 11% from $80.5 million to $71.6 million.
Opportunities to crew on groundfish vessels (measured in positions, days, or trips) declined over the period 2010-2013. For example, total crew trips declined by 15% between 2010 and 2013.
Both all species and groundfish revenues were unequally distributed in 2010, and they remained so through 2013. The distributions of both all species and groundfish revenues are more concentrated at the vessel affiliation (ownership) level than at the vessel level. The concentration of revenues among top earning vessel affiliations was marked in 2010-2013, and this level of concentration persisted and slightly increased in the top 1% in 2013. Groundfish revenue is more concentrated than all species revenue among the top earning vessel affiliations, as was the case at the vessel level.
At the vessel level, the total value of ACE/PSC lease market transfers in 2013 is estimated at 4.4 million dollars, down 46% from 2012 and 62% from 2010 (Table 28). When ownership groups are considered, the total transfer payment due to leasing is estimated at just over three million dollars, down 25% from 2012 and 53% from 2010, and implying that roughly 30% of all leasing (by value) is occurring within ownership groups.
7

Table 1. Summary of major trends (May through April, includes all vessels with a valid limited access multispecies permit).
2010 2011
Total Sector vessels
Common pool Total Sector
vessels Common
pool
Groundfish gross revenue (in 2010 dollars)
$83,212,207
$81,165,969
$2,046,238
$88,821,349
$87,982,963
$838,386
Non-groundfish gross revenue (in 2010 dollars)
$210,068,225
$115,537,375
$94,530,850
$235,565,188
$141,895,314
$93,669,874
Total gross revenue (in 2010 dollars)
$293,280,432
$196,703,344
$96,577,088
$324,386,537
$229,878,277
$94,508,260
Groundfish average price (in 2010 dollars) $1.42 $1.41 $1.58 $1.43 $1.42 $1.58
Non-groundfish average price (in 2010 dollars) $1.21 $1.18 $1.24 $1.11 $1.11 $1.11
Number of active vessels* 855 437 418 777 443 334
Number of active vessels that took a GF trip** 446 304 142 418 302 116
Number of groundfish trips 13,859 11,575 2,284 16,138 13,858 2,280
Number of non-groundfish trips 38,507 16,547 21,960 33,727 16,814 16,913
Number of days absent on groundfish trips 18,737 17,131 1,605 21,895 20,393 1,503
Number of days absent on non-groundfish trips 31,354 16,023 15,331 28,032 15,485 12,547
Total crew positions 2,268 2,166
Total crew trips 125,033 122,785
Total crew days 171,278 171,342
Throughout this report "trips" refer to commercial trips in the northeast Exclusive Economic Zone (EEZ). Past reports included party/charter trips. *Note sector plus common pool vessel counts may exceed the total vessel count because vessels may switch between sector and common pool eligibilities during the fishing year. **This refers to vessels that have revenue from at least one groundfish trip.
8

Table 1 (continued). Summary of major trends (May through April, includes all vessels with a valid limited access multispecies permit).
2012 2013
Total Sector vessels
Common pool Total Sector
vessels Common
pool
Groundfish gross revenue (in 2010 dollars) $67,815,297
$67,209,195 $606,102
$55,220,469 ($58,662,972)***
$54,211,824 ($57,592,187)***
$1,008,645 ($1,070,784)***
Non-groundfish gross revenue (in 2010 dollars) $228,136,612
$135,359,399 $92,777,213 $214,665,116 ($227,826,279)***
$129,680,139 ($137,623,316)***
$84,984,976 ($90,202,963)***
Total gross revenue (in 2010 dollars) $295,951,909
$202,568,594
$93,383,315
$269,885,585 ($286,489,251)***
$183,891,963 ($195,215,504)***
$85,993,622 ($91,273,747)***
Groundfish average price (in 2010 dollars) $1.43 $1.43 $1.71 $1.31 ($1.39)****
$1.30 ($1.38)****
$1.59 ($1.68)****
Non-groundfish average price (in 2010 dollars) $1.07 $1.03 $1.13 $1.00 ($1.06)****
$0.95 ($1.00)****
$1.10 ($1.17)****
Number of active vessels* 763 445 318 735 419 316
Number of active vessels that took a GF trip** 400 303 97 327 245 82
Number of groundfish trips 14,328 12,990 1,338 10,056 9,125 911
Number of non-groundfish trips 33,024 17,172 15,852 33,317 17,900 15,417
Number of days absent on groundfish trips 19,839 18,998 842 17,013 16,356 657
Number of days absent on non-groundfish trips 29,151 16,341 12,811 29,439 16,916 12,523
Total crew positions 2,135 2,039
Total crew trips 117,118 106,700
Total crew days 169,129 157,600
Throughout this report "trips" refer to commercial trips in the northeast Exclusive Economic Zone (EEZ). Past reports included party/charter trips. *Note sector plus common pool vessel counts may exceed the total vessel count because vessels may switch between sector and common pool eligibilities during the fishing year. **This refers to vessels that have revenue from at least one groundfish trip. ***Nominal gross revenue observed during Fishing Year 2013. ****Nominal average price during Fishing Year 2013.
9

1. INTRODUCTION
The Northeast Multispecies Fishery, referred to as the groundfish fishery, is managed by the New England Fishery Management Council (NEFMC). The groundfish fishery is carried out using both fixed and trawl gears.1 The groundfish resource is distributed throughout waters of the Gulf of Maine (GOM) and Georges Bank (GB) and, to a lesser extent, Southern New England (SNE) and the Mid-Atlantic Bight. Prior to Fishing Year 2010, the groundfish fishery was managed using effort controls, including Days at Sea (DAS). Amendment 13 to the groundfish Fishery Management Plan (FMP) was implemented in May 2004; it redefined initial allocations of DAS and allowed vessels to engage in DAS leasing and DAS transfers under certain conditions. Amendment 13 also introduced the “Sector Allocation” program, which gave fishermen the opportunity to voluntarily form sectors that would be constrained by quotas rather than DAS. Sectors could request exemption from many of the traditional input controls such as trip limits. This set the stage for Amendment 16 to the Northeast Multispecies FMP, which implemented a catch share program on 1 May 2010.
The catch share program was designed to comply with catch limit requirements and stock rebuilding deadlines required under the Magnuson-Stevens Fishery Conservation and Management Reauthorization Act of 2006 (MSA). The new groundfish management program contained two significant changes. The first consisted of “hard quota” annual catch limits (ACLs) for all 20 stocks in the groundfish complex. The second expanded the use of “sectors,” which are groups of fishing vessels allotted a share (quota) of the total groundfish ACL. Sectors are allocated subdivisions of ACLs called Annual Catch Entitlements (ACE). All permit holders with a limited access groundfish permit that was valid as of 1 May 2008, were eligible to participate in a sector, including holders of inactive permits currently held in Confirmation of Permit History (CPH).
Sectors, including state permit banks, receive ACE for nine of 13 groundfish species in the FMP and are exempt from many of the traditional effort controls.2 Each limited access groundfish permit has a potential sector contribution (PSC) that, based on that permit’s fishing history, is a percentage of the total quota allocation for each allocated groundfish stock. When a fisherman becomes a sector member, his PSC is pooled with those of the other members of that sector. The pooled PSCs of the sector become the sector’s ACE. Fishermen may hold limited access eligibilities, which are linked to a Moratorium Rights Identifier (MRI), in CPH. CPH permits are limited access groundfish eligibilities that are not attached to an actual vessel. An important consequence of Amendment 16 is that it allowed fishermen with permits in CPH to join sectors or to remain in the common pool with the option of leasing DAS, which was granted by Amendment 13. When a fisherman holding a CPH joins a sector, the PSC associated with those permits becomes part of that sector’s ACE. This is significant, because it means that a fisherman can lease the PSC associated with his CPH permits to other sector members or his
1 Fixed gear includes gillnet and hook gears including bottom longline, tub trawls, and rod and reel. 2
The nine allocated species are American plaice (Hippoglossoides platessoides), cod (Gadus morhua), haddock (Melanogrammus aeglefinus), pollock (Pollachius virens), redfish (Sebastes fasciatus), white hake (Urophycis tenuis), winter flounder (Pseudopleuronectes americanus), witch flounder (Glyptocephalus cynoglossus), and yellowtail flounder (Limanda ferruginea). The four non-allocated groundfish species are halibut (Hippoglossus hippoglossus), ocean pout (Zoarces americanus), windowpane flounder (Scophthalmus aquosus), and wolfish (Anarhichas lupus). All references to groundfish species include these 13 species unless there is specific mention of the nine allocated species. Non-groundfish species are any species other than the 13 groundfish species listed here.
10

sector can lease the PSC to other sectors through ACE trading. However, sectors are not permitted to transfer ACE to or from common pool vessels.
Fishing vessels owners may also opt to fish the quota associated with their groundfish permits, including permits they have placed in CPH, on fewer vessels (including a single vessel) to reduce the costs associated with operating multiple vessels. In 2010, approximately half (46%) of the vessels with limited access groundfish permits opted to remain in the common pool, likely because of their small individual potential contribution to a sector’s total ACE. Common pool vessels act independently of one another; each vessel is constrained by the number of DAS it can fish, by trip limits, and by time and area closures designated in the FMP. These restrictions help ensure that the groundfish catch by common pool vessels does not exceed the common pool’s allocation of the total ACL before the end of the fishing year. In 2013, nearly 43% of the active vessels with limited access groundfish permits were common pool vessels.
Nineteen sectors operated in 2013 (see 78 FR 25591, May 2, 2013).3 Four of these are “lease only” sectors,4 which hold eligible permits with accumulated ACE or DAS that they can make available to fishermen that intend to actively fish for groundfish. Each sector establishes its own rules for using its allocations, but the allocated catch restrictions are applicable to the sector as a unit (i.e., not to individual vessels in the sector). Sector enrolled permits accounted for approximately 98% of the FY 2013 commercial groundfish sub-ACL.
The trends in this report must be evaluated in the context of the quota changes that have occurred for fishing year 2013, as well as over the four years since Amendment 16 has been in place. From 2012 to 2013, several commercial sub-ACLs were cut from their 2012 levels: eastern Georges Bank cod (-43.2%), western Georges Bank cod (-61.4%), Gulf of Maine cod (-77.6%), eastern Georges Bank haddock (-45.4%), Gulf of Maine haddock (-71.4%), Georges Bank yellowtail flounder (-58.1%), SNE/MA yellowtail flounder (-22.9%), CC/GOM yellowtail flounder (-54.2%), American plaice flounder (-56.7%), witch flounder (-57.9%), Gulf of Maine winter flounder (-0.1%), northern windowpane (-24.0%), and wolfish (-15.1%). Some stocks’ sub-ACLs increased from their 2012 levels: western Georges Bank haddock (+10.5%), Georges Bank winter flounder (+4.2%), southern New England winter flounder (+299.3%), redfish (+21.7%), white hake (+17.2%), pollock (+2.2%), southern windowpane flounder (+41.7%), and halibut (+44.4%).
Sub-ACLS for several allocated stocks in 2013 were at a four-year low for the 2010-2013 time period, with substantial cuts overall since the implementation of Amendment 16 in 2010: eastern Georges Bank cod (-72.8%), western Georges Bank cod (-44.5%), Gulf of Maine cod (-81.8%), eastern Georges Bank haddock (-68.7%), Gulf of Maine haddock (-77.3%), Georges Bank yellowtail flounder (-81.2%), CC/GOM yellowtail flounder (-38.5%), American plaice flounder (-50.1%), witch flounder (-28.4%). Sub-ACLs for three allocated stocks were at a four-
3 These sectors were the Fixed Gear Sector (FGS), the Maine Coast Community Sector (MCCS), the Maine Permit Bank Sector (MEPBS), the New Hampshire Permit Bank Sector (NHPBS), the Northeast Coastal Communities Sector (NCCS), Northeast Fishery Sectors 2 through 13, and Sustainable Harvest Sectors 1 and 3 (SHS1 and SHS3). The Georges Bank Cod Hook Sector (operating since 2004) and the Georges Bank Cod Fixed Gear Sector (implemented in 2006) operated as separate sectors prior to fishing year 2010, when all members of the Georges Bank Cod Hook Sector joined FGS. In fishing year 2013, the Port Clyde Community Sector became known as the Maine Coast Community Sector. 4 The Northeast Fishery Sector IV, Sustainable Harvest 3, Maine Permit Bank, and New Hampshire Permit Bank Sectors are lease only sectors. The Sustainable Harvest 3 Sector has not explicitly prohibited fishing activity, and may transfer permits to active vessels.
11

year high in 2013, with overall increases in quota since 2010: Georges Bank winter flounder (+90.5%), redfish (+48.0%), and white hake (+50.6%).5
This report provides an evaluation of the economic and social performance of the groundfish fishery for fishing year 2013 (1 May 2013 – 30 April 2014). In this report, all references to year are for the fishing year. The report presents year-to-year comparisons for the four-year period of 2010-2013 to evaluate performance, and compares performance in 2012 and 2013. Table 1 presents data on major trends in the groundfish fishery by total fleet, sector vessels, and common pool vessels. Differences in the performance of sector and common pool vessels are discussed in Section 1.2; thereafter, the report focuses on the performance of the total groundfish fleet.
This report falls under the fisheries performance measures program developed by the NEFSC Social Sciences Branch in 2009 with extensive consultation from stakeholders in the Northeast region (see Clay et al. 2010; Plante 2010). The broad performance measure categories identified are the following: financial viability, distributional outcomes, stewardship, governance, and well-being. There are multiple indicators within each category. The Northeast indicators are part of a NMFS-wide process of developing social and economic indicators for all U.S. fisheries.6 This report includes a subset of indicators that are sufficiently developed for reporting. These cover aspects of financial viability (landings, revenue, number of vessels and effort, and average vessel performance) and distributional outcomes (employment and fleet diversity). Gross revenues are based on landings and ex-vessel (first sale) prices and―together with fishing effort, operating costs, and quantities of fishing inputs―provide an indication of vessel performance. Employment opportunity is measured by the number of crew positions, crew trips, and crew days. Fleet diversity is measured by vessel size and vessel revenue categories, and by distributions of revenues among individual vessels and vessel affiliations. Over time, additional indicators will be available for reporting as the NEFSC Social Sciences Branch’s research and the National Performance Measures Program continue to develop.
Amendment 16 contains several broad goals and objectives, carried over from Amendment 13. This report does not provide a detailed analysis of progress toward achieving these goals and objectives. However, where possible, it addresses trends related to Goal 2, Goal 4, and Objective 7, particularly for economic efficiency and diversity of the groundfish fleet.7 For example, changes in economic efficiency may be reflected by changes in revenue per unit effort and revenue per vessel and by changes in the Lowe Index, which measures productivity of the fleet. The diversity of the groundfish fleet can be explored by examining trends in (1) the number of vessels and vessel affiliations; (2) the geographic distribution of landings and revenues across ports and states; (3) employment indicators across ports and states; and (4) the distribution of revenues among vessels and vessel affiliations.
5 See NMFS Northeast Regional Office’s website: http://www.greateratlantic.fisheries.noaa.gov/aps/monitoring/nemultispecies.html . These data do not include sector carryover. 6 Contact [email protected] for more information on this national effort. The National Catch Shares Report, released in August 2013, presents performance metrics for all catch share managed fisheries in the U.S and may be found at https://www.st.nmfs.noaa.gov/economics/fisheries/commercial/catch-share-program/index. 7 Goal 2 in Amendment 16 is “create a management system so that fleet capacity will be commensurate with resources status so as to achieve goals of economic efficiency and biological conservation and that encourages diversity within the fishery.” Goal 4 is “minimize to the extent practicable, adverse impacts on fishing communities and shoreside infrastructure.” Objective 7 states: “To the extent possible, maintain a diverse groundfish fishery, including different gear types, vessel sizes, geographic locations, and levels of participation.”
12

The NEFSC released the first performance report for the FY2010 groundfish fishery in 2011 (see Kitts et al. 2011) and released a second performance report for FY 2011 in 2012 (see Murphy et al. 2012). In 2013, the net revenue estimation previously presented in the FY2011 report was extended to include the impact of quota leasing activities on the distribution of net revenues in the fishery for FY2011 (see Kitts and Demarest 2013).8 The FY2012 report was released in January 2014 and expanded the analyses presented in earlier reports by including a section on the impacts of quota leasing on the distribution of net revenues for different segments of the groundfish fleet (see Murphy et al. 2014).
Other efforts have been, and are being, undertaken in the Northeast to further the understanding of social and economic issues in the fisheries. A study of social capital among groundfish permit holders (Holland et al. 2010) has recently been repeated and the data collected from the second round of this study have been analyzed. Results were submitted to a scholarly journal for publication. The NEFSC implemented a revised vessel fixed costs survey in August 2012 and May 2013 that surveyed commercial fishing vessel owners in the Northeast, by vessel size and gear type. This effort resulted in cost data from 741 commercial fishing vessels, which are being analyzed with the goal of developing profitability profiles for different segments of the Northeast fleet. Socioeconomic surveys of crew and vessel owners across the Northeast fisheries have been implemented to collect basic demographic data on the fishing community and to develop additional performance indicators. An emphasis is placed on indicators that measure how well fisheries are performing in the areas of stewardship, governance, and fishing community well-being. The NEFSC concluded the first year of its socioeconomic survey of vessel crew in autumn of 2013; about 400 crew, including hired captains, were interviewed in ports in New England and the Mid-Atlantic. Results will soon be published as a NEFSC Technical Memoranda.9 The first round of data collection for NEFSC’s socioeconomic survey of vessel owners has been completed, and those data are currently being analyzed. Dr. Eric Thunberg, an economist in NMFS’ Office of Science and Technology is engaged in work to measure fleet diversity for the Northeast Multispecies Groundfish fleet, which will be available in published form shortly.10 See http://www.nefsc.noaa.gov/read/socialsci.html for more information on these and other NEFSC projects.
1.1. Data and Analytical Approach The vessels whose activities are evaluated in this report are those with valid limited
access multispecies permits during fishing years 2010-2013. An active vessel is defined as having revenue from the landing of any species on any trip while fishing under a limited access groundfish permit within the given fishing year. In this report, trips are defined as commercial trips in the Northeast Exclusive Economic Zone (EEZ). The evaluation includes only fish landed and sold. Weights are given in landed pounds (after heading/gutting) rather than in live pounds (whole fish) as prices are commonly calculated on a per landed pound basis. Gross revenues are based on what is landed and sold. Landings data in this report should not be used to conduct
8 Available at http://www.nefsc.noaa.gov/read/socialsci/pdf/QuotaTradingImpacts.pdf. 9 See the NEFSC Technical Memoranda Series at http://www.nefsc.noaa.gov/publications/tm/. The technical memo containing results from the first round of the crew survey will be published as Henry, Anna, and Julia Olson. An Overview of the Survey on the Socio-economic Aspects of Commercial Fishing Crew in the Northeast. 10 Contact Dr. Eric Thunberg at [email protected] for additional information.
13

comparisons with sector sub-ACLs or the catch monitoring reports issued for sectors, because the ACLs are calculated and monitored in live pounds and include both landings and discards.
This year’s report differs from previous ones in that all monetary metrics (revenues, prices, costs) have been adjusted for inflation by converting nominal dollars for a given year into real, constant dollars. The GDP Implicit Price Deflator was used to adjust nominal amounts for inflation, with the second quarter of calendar year 2010 as the base time period. For 2013, nominal amounts observed were indicated for selected metrics.
A groundfish trip is defined as a trip where the vessel owner or operator declared, either through the vessel monitoring system (VMS) or through the interactive voice response system, that the vessel was making a groundfish trip. This includes trips on which groundfish DAS were used, including monkfish (Lophius americanus) trips that used groundfish DAS. Other trips were also counted as groundfish trips if the dealer or vessel reported that groundfish was landed (e.g., trips with monkfish declarations that were not also using groundfish DAS).
Some statistics are reported by both home port and port of landing. “Home port” does not necessarily identify the port where fish are landed, but rather it is the information on “city and state where vessel is moored” provided by vessel owners on the vessel permit applications. Most often, the home port is the port where supplies are purchased and crew is hired, although this does not apply in all cases.11 “Landed port” is the actual port where fish are landed. We report by home port and by landed port because the implications of each are different. For example, revenue by home port gives an indication of the benefits received by vessel owners and crew (and some fishing-related businesses such as gear suppliers) based in that port. Revenue by landed port gives an indication of the benefits that other fishing-related businesses (primarily businesses that handle fish, such as dealers and processors) derive from landings in their port. We identified the top six home ports and landed ports in the Northeast and also examined changes by home port and landed port at the state level.
Some indicators in the report use a measure of time called a “day absent.” A day absent is defined as the number of days (24 hours each) a vessel is “absent” from port and is calculated by subtracting the sail date/time from the land date/time as entered on vessel logbook records, called vessel trip reports (VTRs). For comparative purposes, many measures have been calculated for both groundfish landings and all species landings. “All species” refers to the total of all species of fish or shellfish landed, including groundfish. The home port and length of a vessel are provided by the vessel owner on the vessel’s yearly permit application. Data on vessel landings, nominal prices, and nominal revenues come from seafood dealer reports. Information about the number of fishing trips and crew size is from VTRs.12 In addition to mean values, standard
11 Alternative port affiliation data are available. Principal port declaration and the vessel owner’s mailing address are also entered on the permit application. However, actual landings by port may vary widely from what a vessel owner thinks his principal port of landing will be before the fishing year begins. Also, an owner’s mailing address can be different from a vessel’s base of operation. Therefore, home port is typically used in social and economic studies to establish port affiliation (as in this report). As the home port listed for a vessel can change over the year depending on what is declared on permits, this report assigns a vessel’s home port to be the first home port that is used during FY2013. 12 All data are from GARFO’s fishing year 2010 – 2013 Data Matching Imputation System, or DMIS, database (a combination of seafood dealer reports, vessel trips reports, and quota monitoring reports) as of July 21, 2014. Differences in results reported in each year’s annual performance report are due to updates and corrections to the DMIS database. In addition, in this year’s report, all monetary amounts are reported in constant 2010 dollars (nominal monetary amounts were adjusted for inflation).
14

deviations are provided to show the degree of variability in the data. Some standard deviations are large relative to the mean, indicating that the values are widely dispersed. Therefore, care should be used when comparing mean values that have large standard deviations.
Several performance metrics in this report, including effort and revenue, are examined by vessel size category using four vessel length classes: under 30ʹ in length, 30ʹ to less than 50ʹ in length, 50ʹ to less than 75ʹ in length, and 75ʹ and longer. Many of the vessels in the under 30ʹ vessel length class are considered to be “skiffs,” a colloquial term used by fishermen and fishery managers to refer to small vessels, generally unseaworthy, used only for the attaching of a permit. Although skiffs may appear as inactive vessels in the database, the quota or DAS associated with their permits is commonly transferred to other vessels.
Some of the metrics in this report are presented at both the individual and at the affiliated vessel level. To evaluate changes at the affiliated vessel level, vessels were grouped according to ownership patterns. Permit applicants are required to list all persons and entities that have an ownership interest in the vessel for which a permit is being registered. Using this database, it is possible to find affiliations among vessels. We define “vessel affiliations” as networks of vessels connected through common owners. Vessels connected to one another through ownership, for the purpose of data analyses, are deemed a single vessel affiliation. For example, two vessels owned by one person are considered to be in one vessel affiliation. Further, a vessel owned in partnership is considered to be in the same vessel affiliation with a second vessel if that second vessel is owned by one of the partners. A vessel affiliation could have multiple vessels and/or multiple owners or it could consist of a single vessel and a single owner. A vessel affiliation can include vessels in multiple sectors and/or the common pool. It is likely that vessels in the same vessel affiliation are subject to some degree of joint decision making among common owners.
1.2. Performance of Sector and Common Pool Vessels
There are fundamental differences in the characteristics of sector and common pool vessels and in the ACE and DAS allocations.13 A large number of common pool vessels have few or no DAS, while some common pool vessels have small vessel exemption permits (Category C) or hand gear permits (HA) excluding them from DAS constraints. Common pool vessels are regulated not only by DAS, but also by additional measures, some of which changed during the 2010 fishing year. Finally, vessels opting into the common pool landed significantly less groundfish during the landings qualification period of 1996 through 2006 than those electing to operate in sectors, which resulted in the common pool being allocated only 1-2% of the total ACL for all stocks. In 2013, sector vessels accounted for 98.2% of the total value of groundfish landed (Table 1).
This section discusses major trends in performance, broken down by sector and common pool vessels, as presented in Table 1. Differences in these performance measures should not serve alone as the basis for an evaluation of catch share versus DAS management regimes. In Sections 2 through 8 of this report, performance indicators are reported for the active groundfish fleet as a whole, with sector and common pool vessels combined.
13 These may include differences in physical characteristics of the vessel, different fishing histories, and different attitudes about sector management. Also, fishermen presumably opted to join a sector or remain in the common pool based on their analysis of the advantages and disadvantages to them of each regimen.
15

The total number of active groundfish vessels continues to decline; the fishery lost 120, or 14.0%, of its active vessels over the 2010-2013 period (Table 1). Possible reasons for the declining number of active groundfish vessels will be addressed in Section 6. In 2013, there were 735 active vessels in the limited access groundfish fleet, with 419 vessels (57%) enrolled in sectors and 316 vessels (43%) remaining in the common pool. From 2012 to 2013, the number of vessels enrolled in sectors decreased by 26 vessels and the number of vessels in the common pool decreased by two vessels (Table 1).
For both sector and common pool vessels, total gross revenues for all species (groundfish and non-groundfish) were at four-year lows in 2013. Total all species gross revenue for the entire fleet was $269.9 million, an 8.8% decrease from 2012. Total all species gross revenue fell by $18.7 million (-9.2%) from 2012 to 2013 for vessels enrolled in sectors. Common pool vessels saw total all species gross revenue fall by $7.4 million (-7.9%; Table 1).
For 2013, declines in total all species revenues for sector vessels were driven primarily by the declines in groundfish revenues, while declines in total all species revenues for common pool vessels were driven by declines in non-groundfish revenues. In 2013, sector vessels had $54.2 million dollars in gross groundfish revenues, the lowest groundfish revenues for sector vessels since the implementation of catch shares in 2010. Groundfish revenues were nearly $13.0 million (19.3%) lower in 2013 than in 2012 for sector vessels, and declining groundfish revenue accounted for 69.6% of the decline in total all species revenue for these vessels. Total non-groundfish revenues also decreased for sector vessels, but this decrease was more modest, with non-groundfish revenues declining by $5.7 million (-4.2%) from 2012 to 2013 (Table 1).
Common pool vessels also experienced a decline in non-groundfish revenue from 2012, but their groundfish revenue was higher in 2013 than it was in 2011 and 2012. Groundfish revenues for common pool vessels were just over $1.0 million in 2013, a 66.4% increase over 2012. Common pool vessels saw their non-groundfish revenue drop to a four-year low of just under $85 million in 2013, an 8.4% decline from 2012 (Table 1).
Average groundfish price decreased in 2013 for both sector and common pool vessels from 2012, by $0.13 per pound (-9.1%) for sector vessels and $0.12 per pound (-7.0%) for common pool vessels. Common pool vessels continued to receive a higher average price at the dock for groundfish than sector vessels in 2013, as they did in 2012. Sector vessels received an average groundfish price of $1.30 per pound in 2013, while common pool vessels earned an average price of $1.59 per pound for groundfish (Table 1).
Average non-groundfish price was at a four-year low, $1.00 per pound, in 2013 for the fleet as a whole. From 2012, average non-groundfish price decreased by $0.08 per pound (-7.8%) for sector vessels and by $0.03 per pound (-2.7%) for common pool vessels in 2013 (Table 1).
Effort in the groundfish fishery is represented in part by the number of active vessels, the number of trips taken, and by days absent on trips. For the fleet as a whole, 73 fewer vessels had revenue from at least one groundfish trip in 2013 than in 2012; 58 fewer sector vessels and 15 fewer common pool vessels targeted groundfish in 2013 than in 2012. The numbers of groundfish trips taken were at four-year lows in 2013 for both sector and common pool vessels. For sector vessels, the number of groundfish trips taken fell by 3,865 trips (-29.8%) from 2012 to 2013. Common pool vessels took 427 (-31.9%) fewer groundfish trips. The total numbers of days absent on groundfish trips also decreased to their lowest levels in 2013 for both sector and common pool vessels. Sector vessels had 2,642 fewer days absent (-13.9%) on groundfish trips in 2013 than in 2012, while total days absent on groundfish trips for common pool vessels fell by 185 (-22.0%; Table 1).
16

Non-groundfish effort increased for sector vessels in 2013. Sector vessels took 4.2% more non-groundfish trips (+728 trips) than in 2012, reaching a four-year high. Total days absent on non-groundfish trips also increased to a four-year high for sector vessels, with 575 more days absent in 2013 than in 2012, a 3.5% increase. In contrast, effort measures for non-groundfish decreased slightly for common pool vessels in 2013 compared with 2012; common pool vessels took 435 fewer non-groundfish trips (-2.7%), with 288 fewer days absent on non-groundfish trips (-2.2%; Table 1).
2. LANDINGS AND GROSS REVENUES
Gross revenues are one important indicator of financial performance. In commercial fishing, gross nominal revenues are a function of the amount of fish landed and the price paid at the time of sale. Prices paid by dealers vary by species and may fluctuate as a result of short- and long-term market changes. Annual changes in gross revenues can result from three different factors: changes in prices paid for fish at the dock, changes in quantity of landings, and changes in the species composition of the landings. Flexibility to target specific species and/or market categories at times when market values are high can be important in maximizing gross fishing revenues. Information is provided below on landings, overall gross revenues, and prices in 2013 compared with those in 2010 through 2012.
In this report, nominal revenues have been adjusted to account for the effects of inflation. Nominal revenues observed throughout the four-year time span were converted to real revenues using the GDP Implicit Price Deflator, with the second quarter (April-June) of calendar year 2010 as the base time period. Nearly all revenues contained in this report are in constant 2010 dollars. This approach differs from previous reports. In the 2010, 2011 and 2012 reports, nominal revenues were presented for most revenue metrics, with the exception of groundfish revenues, non-groundfish revenues, and all species revenues from all trips, which were presented in both nominal and real dollars.14 In this year’s report, we report monetary metrics in nominal amounts observed in 2013 for selected metrics only (see Tables 1-3). Unless otherwise indicated, the discussion in this report refers to monetary amounts in real or constant terms, i.e. amounts that have been adjusted for inflation. 2.1. Landings
Groundfish landings in 2013 continued the decline that the limited access groundfish fleet experienced in 2012. Declining groundfish landings were coupled with little growth in non-groundfish landings for the fleet in 2013. Total landings of all species on all trips were 256.4 million pounds in 2013, a 1.6% decrease from 2012 (260.5 million pounds). In 2013, total landings of all species were at their lowest point over the 2011-2013 time period, but higher than they were in 2010 (232.9 million pounds; Table 2). Total groundfish landings on all trips decreased to a four-year low of 42.2 million pounds in 2013, compared with 58.7 million pounds in 2010. Total groundfish landings on all trips declined 10.9% in 2013 compared with 2012 and 28.0% overall from 2010 to 2013. Total non-groundfish landings on all trips in 2013 were 214.2 million pounds, a four-year high, but less than 1% greater than in 2012. Groundfish landings
14 Table 2 (Total landings and revenue from all trips by fishing year) in the FY2010, FY2011, and FY2012 reports.
17

accounted for 16.5% of total landings in 2013, down slightly from 18.2% of total landings in 2012 (Table 2).
Total landings in 2013 of all species on groundfish trips decreased to a four-year low of 61.2 million pounds. Groundfish landings on groundfish trips also decreased to a four-year low of 42.1 million pounds.15 The overall decline in groundfish landings on groundfish trips from 2010 to 2013 is 28.1%, with an 11.1% decline occurring from 2012 to 2013. Non-groundfish landings on groundfish trips decreased to 19.1 million pounds, compared with 23.5 million pounds in 2010. Overall, non-groundfish landings on groundfish trips declined 18.6% from 2010 to 2013, with a 29.7% decrease in 2013 from 2012 (Table 3). The trends for landings data in 2013 follow the pattern seen in 2012: the groundfish fleet appears unable to adapt to the negative trends in groundfish landings by substituting non-groundfish landings.
2.2. Gross Revenues
Gross revenues for the groundfish fleet began declining in 2012 and continued to decline in 2013. Non-groundfish revenues earned by the fleet have fallen in the past two years and therefore cannot offset losses in groundfish revenues. Total gross revenue in 2013 from all species landed on all trips was $269.9 million, an 8.8% decrease from 2012 ($296.0 million). Gross revenue for all species landed on all trips taken by the limited access groundfish fleet was at a four-year low in 2013, declining 8.0% overall from 2010-2013 (Table 2).
Groundfish revenue in 2013 on all trips decreased to a four-year low of $55.2 million (18.6% lower than in 2012), with a 33.6% decline from 2010 to 2013. Non-groundfish revenue on all trips decreased to $214.7 million (-5.9%) compared with 2012 and was at a three-year low for the 2011-2013 period, but the revenue was still higher than it was in 2010 (Table 2).
Total gross revenue from all species landed on groundfish trips in 2013 was $75.5 million, a four-year low, with a 18.6% decline from 2012 and a 29.2% decline from 2010 (Table 3). Groundfish revenue on groundfish trips in 2013 was $55.0 million, a four-year low for the 2010-2013 time period, with an 18.7% decrease from 2012 and a 33.7% decrease from 2010. Non-groundfish revenues on groundfish trips decreased in 2013 to a four-year low of $20.5 million, from $25.1 million in 2012 (Table 3). 2.2.1. Revenues by Landing Port and Home Port
Trends for all species revenues in 2013 by landing state and home port state (Table 4 and
Table 5) were mixed. New England states that are home port states for vessels that have traditionally targeted groundfish experienced mostly negative trends. All species revenues for Massachusetts, New Hampshire, and New York were at four-year lows in 2013, from both a landed port and home port perspective. Massachusetts experienced the biggest declines in absolute terms and New Hampshire experienced the biggest declines in percentage terms. Massachusetts has seen all species revenues decline by $25.5 million (-14.6%) as a landed port state and $21.4 million (-14.3%) over 2010-2013. In New Hampshire, all species revenues have fallen over 2010-2013 by $2.2 million (-31.9%) for the state as a landed port state and $2.1 million (-27.0%) for the state as a home port state (Table 4 and Table 5).
15 Note that almost 100% of groundfish landings occurred on groundfish trips. For that reason, groundfish landing values for all trips and groundfish trips are nearly identical.
18

Rhode Island was the only state to see gains in all species revenue in 2013 from both a landed port and home port perspective. Overall, from 2010 to 2013, all species revenue has increased $6.7 million (+22.0%) for Rhode Island as a landed port and $2.1 million (+5.9%) for the state as a home port state (Table 4 and Table 5).
Maine has experienced more mixed trends for all species revenue, depending on whether all species revenues are viewed from a landed or home port state perspective. Overall, since 2010, all species revenues for Maine as a landed port state have increased 7.6%, while all species revenues earned by active limited access groundfish vessels that are homeported in Maine have fallen 13.1% over the same period. In the remaining Northeast states, trends for all species revenues varied (Table 4 and Table 5).
The value of groundfish landed on all trips was at a four-year low for Massachusetts and New Hampshire in 2013 from both a landed and home port state perspective. Massachusetts experienced the greatest losses in absolute terms; over the past four years, Massachusetts has lost $29.0 million (-39.4%) in groundfish revenues as a landed port state and $22.2 million (-37.4%) as a home port state. In percentage terms, New Hampshire has lost $1.3 million (-40.3%) as a landed port state and $1.3 million (-36.4%) as a homeport state in groundfish revenues over the same period. Groundfish revenues earned by vessels homeported in Maine were at a four-year low in 2013, declining 18.4% over 2010-2013. As a landed port state, groundfish revenues for Maine were lower in 2013 than in 2011 and 2012 but higher than they were in 2010.
Connecticut was the only state to see a four-year high for groundfish revenues as both a landed and home port state in 2013. Over 2010-2013, groundfish revenues have grown by $117,103 (1302.5%) for Connecticut as a landed port state and by $34,420 (62.6%) as a home port state. As landing port states, New Jersey, New York, and Rhode Island all saw four-year highs in 2013 for groundfish revenues. From a home port state perspective, these three states experienced increases in groundfish revenues from 2012, ranging from 2.0% (Rhode Island) to 186.4% (New Jersey).16 However, groundfish revenues from groundfish vessels homeported in New Jersey, New York, and Rhode Island have fallen overall since 2010, by 51.2%, 24.6%, and 23.8%, respectively (Table 6 and Table 7).
All species and groundfish revenues are also presented for the six major groundfish ports in the Northeast. Massachusetts ports Boston, Gloucester, and New Bedford have been especially hard hit in 2013; both all species and groundfish revenues were at a four-year low in 2013 for the three ports, both from the landed and home port perspective.
Gloucester has seen all species revenues decline 37.2% (-$14.8 million) as a landed port and 31.8% (-$8.0 million) as a home port over the past four years (Table 4 and Table 5). Declining all species revenues in Gloucester are being driven by the port’s losses in groundfish revenues. Groundfish revenues for Gloucester have fallen 47.4% as a landed port and 43.9% as a home port over the 2010-2013 time period (Table 6 and Table 7).
The value of all species landed in Boston has decreased 11.6% (-$1.7 million) from 2010 to 2013 (Table 4). All species revenues earned by groundfish boats homeported in Boston fell 9.8% (-$2.7 million) over the past four years (Table 5). Groundfish revenues also fell to four-year lows in 2013 for Boston as both a landed port and a home port. Over the past four years, groundfish revenues have declined 16.4% for Boston as a landed port and 25.9% as a home port (Table 6 and Table 7).
16 The growth seen in groundfish revenues from 2012 to 2013 for New Jersey, New York, and Rhode Island as home port states may be due to the influence of Superstorm Sandy, which occurred in late October 2012. For all three states as home port states, groundfish revenues were at a four-year low in 2012.
19

The limited access groundfish fleet in the port of New Bedford has also experienced declines, despite being less dependent on groundfish revenues than the groundfish fleet in Gloucester and Boston. New Bedford has lost 9.0% (-$8.7 million) in the value of all species landed in the port from 2010 to 2013 (Table 4). As a home port, all species revenues declined 11.2% (-$7.3 million) in the past four years (Table 5). Groundfish revenues for New Bedford are at a four-year low from both the landed port and home port perspective. As a landed port, New Bedford experienced a 37.3% (-$11.0 million) loss over 2010-2013 (Table 6). Groundfish revenues earned by groundfish vessels homeported in New Bedford have fallen 31.4% (-$5.8 million) from 2010 to 2013 (Table 7).
Massachusetts’ southernmost major port, Chatham, has seen more positive trends in all species revenues, for the portion of limited access groundfish fleet active there, than northern ports in the state. This is partially because, by 2013, many of the limited access groundfish vessels active in Chatham were targeting non-groundfish species rather than groundfish. Over the four-year time series, all species revenues peaked in 2011 for Chatham as a landed port and grew 9.0% overall (Table 4). Chatham saw a similar trend in all species revenues earned by groundfish vessels homeported there; all species revenues for Chatham as a home port peaked in 2011 and grew 23.6% over 2010-2013. However, groundfish revenues for Chatham as both a landed port and a home port were at a four-year low in 2013. As a landed port, groundfish revenues declined 66.6% (-$1.5 million) over 2010-2013 (Table 6). Groundfish revenues for Chatham as a home port declined 68% (-$1.6 million) over the same time period (Table 7).
Portland, Maine, experienced small increases in all species revenues in 2013, both as a landed port and a home port. All species revenues as a landed port increased 2.8% (+$0.2 million) from 2012 to 2013 to achieve a four-year high and grew 39.1% (+$2.5 million) over the four-year time span (Table 4). All species revenues from groundfish vessels homeported in Portland have stayed in the 12- to 13-million-dollar range over 2010-2013, growing 5.7% from 2012 to 2013 and declining very slightly by 0.1% over the four years (Table 5). While groundfish revenues fell in 2013 by 10.7% (-$0.6 million) compared with 2012 for Portland as a landed port, they have grown 54.1% (+$1.9 million) over 2010-2013 (Table 6). As a home port, Portland experienced a slight increase of 4.7% (+$0.4 million) in groundfish revenues in 2013 compared with 2012, but groundfish revenues have declined by 7.5% (-$0.8 million) over the four-year time span (Table 7).
The port of Point Judith, Rhode Island, saw mostly gains in 2013. All species revenues for the port as landed port were are four-year high in 2013, growing 30% (+$6.6 million) from 2010-2013 (Table 4). From a home port perspective, all species revenues grew 13.9% (+3.2 million) for the four-year time span (Table 5). In 2013, revenues for groundfish landed in the port achieved a four-year high, growing 39.9% (+$0.6 million) over the four-year period (Table 6). For vessels homeported in Point Judith, groundfish revenue increased 7.8% from 2012 but declined 19.5% (-$0.5 million) over the four-year time series (Table 7).
2.2.2. Revenues by Species
Most allocated groundfish species saw declines in revenues from 2012 to 2013. Groundfish revenues from cod, yellowtail flounder, American plaice flounder, witch flounder, redfish, white hake and pollock all decreased compared with 2012. These revenue decreases ranged from 9.5% for American plaice flounder to 45.2% for yellowtail flounder. The only two
20

allocated groundfish species to see increases in revenue in 2013 were haddock (+46.3%) and winter flounder (+0.9%; Table 8).
Revenue from cod declined to a four-year low of just under $9.0 million in 2013, declining $17.6 million and 66.2% over the four-year time span. In 2013, both decreased landings of cod and a decreased price for cod contributed to the drop in revenue. The price of cod in real terms decreased from $2.41/lb in 2012 to $2.11 in 2013. Revenues for American plaice flounder, yellowtail flounder, and witch flounder also fell to four-year lows in 2013. American plaice flounder revenues decreased 9.5% from 2012; this decline can be attributed to both lower landings and a lower price in 2013 compared with 2012. The decrease in yellowtail flounder revenues (-$2.1 million) is due to lower landings of the species in 2013; the price of yellowtail flounder increased from $1.43/lb in 2012 to $1.48/lb in 2013. Similarly, the declines in witch flounder in 2013 were due to decreased landings, with landings falling from 2.0 million pounds to 1.3 million pounds. The price of witch flounder increased from $1.88 in 2012 to $2.28 in 2013 (Table 8).
Haddock and winter flounder revenues both increased in 2013 compared with 2012. From 2012, haddock revenue increased 46.3% (+$2.3 million) in 2013. This increase occurred due to higher landings of haddock, which rose from 2.2 million pounds in 2012 to 5.5 million pounds in 2013. The price of haddock fell from $2.29 in 2012 to $1.34 in 2013. Over the four-year time span, haddock revenues have decreased 64.3% from 2010 to 2013 (Table 8). Winter flounder revenues slightly increased (+0.9%) in 2013 compared with 2012. This is due to an increase in landings from 4.8 million pounds to 5.9 million pounds; the price of winter flounder decreased to $1.56/lb (Table 8).
The top ten non-groundfish species landed by limited access groundfish vessels by value are presented in Table 9. Sea scallops were the mostly highly valued non-groundfish species landed by limited access groundfish vessel, bringing in $72.6 million in revenue in 2013. Revenue from sea scallops landed while fishing under a limited access groundfish permit accounted for 26.9% of total all species revenue and 33.8% of total non-groundfish revenue. While sea scallop revenue has grown 1.3% over the four-year time span, it decreased 15.5% (-$13.3 million) from 2012 to 2013. This was due to a 26.5% fall in sea scallop landings; the price of scallops rose from $9.63/lb in 2012 to $11.07 in 2013 (Table 9).
Lobster, loligo squid, herring, skate and Jonah crab all saw increases in revenue from 2012 to 2013. These increases ranged from 6.0% for loligo squid to 21.6% for herring. For lobster, loligo squid, herring and Jonah Crab, increases in revenues are due to increased landings; prices fell in 2013 for each of these species. In 2013, skates were the only non-groundfish species that had an increase in revenue, but a decrease in landings (-6%) from 2012. The increase in revenue from skates is due to a price increase from $0.28/lb in 2012 to $0.32/lb in 2013 (Table 9).
Revenues decreased in 2013 for monkfish, summer flounder (fluke), silver hake (whiting), and scup landed by the limited access groundfish fleet, with revenues for all but scup at four-year lows. From 2012 to 2013, monkfish revenues decreased by 14.6% to $13.0 million. This decline is due to both lower landings (-6.9%) and a decrease in the price of monkfish; the price of monkfish fell from $2.15/lb in 2012 to $1.97 in 2013. Summer flounder (fluke) revenues fell by 7.7% in 2013 from 2012 to a four-year low of $15.6 million. The decline was due to decreased landings, which more than offset the price increase of $0.16/lb from 2012 to 2013. Silver hake (whiting) revenues were at a four-year low of $8.4 million in 2013, a 9.5% decrease from 2012 and a 23.9% decrease since 2010. Both landings and the price of silver hake (whiting)
21

were at a four-year lows in 2013. Revenues for scup landed by the fleet were down 3.9% in 2013 but were higher than they were in 2010 or 2011; scup revenues have grown 26.5% from 2010-2013. The decline in scup revenues for 2013 is due to decreased landings; the real price of scup increased by $0.01/lb (Table 9).
Revenues from non-groundfish species landed by the limited access groundfish fleet fell 5.9% in 2013 from 2012. While non-groundfish revenues have grown slightly (+2.0%) from 2010-2013 (+$4.6 million), the 2013 decline in total non-groundfish revenues is especially notable because this means groundfish fishermen who tended to land non-groundfish species that experienced declining revenues in 2013 were unable to offset the significant drop in groundfish revenues with revenues from non-groundfish landings (Table 2).
2.3. Prices
Data on average groundfish and non-groundfish price trends are presented in Table 1 and Figure 1, and data for price trends for the nine allocated groundfish species are presented in Figure 2. Price data presented in Table 1, Figure 1 and Figure 2 reflect prices after adjusting for inflation; prices are in real terms (in constant 2010 dollars). Nominal average prices for groundfish and non-groundfish in 2013 are also presented in Table 1, along with real average prices for 2013.
In 2013, the average price of the nine allocated groundfish species (as a group) fell to four-year low, as did the average price of all non-groundfish species (as a group; Figure 1). From 2012 to 2013, average groundfish price fell from $1.43/lb to $1.31/lb, while average non-groundfish price declined from $1.07 to $1.00 (Table 1). The prices of yellowtail flounder, witch flounder, and pollock all increased in 2013 from 2012. These increases ranged from $0.05/lb for yellowtail flounder to $0.40/lb for witch flounder. The price of yellowtail flounder reached a four-year high in 2013 at $1.48/lb, as did the price of pollock, at $1.08/lb. All of the remaining allocated groundfish species experienced price decreases from 2012 to 2013. The largest price decreases occurred for haddock (-$0.95/lb), winter flounder (-$0.33/lb) and cod (-$0.30/lb), with winter flounder and cod at four-year lows of $1.56/lb and $2.11/lb, respectively. American plaice flounder, redfish, and white hake also saw price decreases ranging from $0.02/lb for white hake to $0.08/lb for redfish. The price of redfish was at a four-year low of $0.50/lb in 2013 (Figure 2).
Using the simple average real prices of all groundfish species combined that are presented in Table 1 to compare changes in prices over time may be misleading, because, although this average has been adjusted for inflation, it does not account for annual changes in the quantity and mix of groundfish species landed. A price index was therefore constructed to more accurately reflect price trends of groundfish species. The approach used the “Fisher Ideal” index (Balk 2008), which was constructed from price and quantity data recorded in dealer purchases of all groundfish species. Quarterly data were used in all fishing years from 2007 through 2013. May-July (quarter 1) of 2007 was set as the base period, with a value of 1. The Fisher Price Index is constructed using nominal prices.
The index values (Figure 3) show how combined nominal prices have changed in relation to quarter 1 2007 nominal prices. A value less than 1 means that prices are lower compared with the base time period, while a value greater than 1 indicates that prices have increased relative to quarter 1 in 2007. In 2013, the quarterly adjusted groundfish price index declined in quarters 1 and 2, from 2012 quarter 4 levels. The index then rose in quarter 3, before falling again in quarter 4. Compared with 2007, all values were greater than 1, indicating higher prices.
22

Generally, the price index was lower in 2013 than in 2012. However, the decline in 2013 is in relation to prices that reached a six-year high in the fourth quarter of 2012.
3. NUMBER OF VESSELS AND EFFORT
Effort indicators provide information about the amount of fishing that occurred to produce the landings. In this report, three indicators were used to measure fishing activity and effort: the number of active fishing vessels, the number of fishing trips, and the number of days absent from port.
3.1. Number of Vessels
The number of active vessels in the groundfish fleet continued to decline in 2013, and was at a four-year low for the 2010-2013 period. Both the number of vessels with revenue from any species and the number of vessels with revenue from at least one groundfish trip continued to fall. The total number of groundfish limited access eligibilities fell by 61 eligibilities in 2010-2013. The percentage of inactive vessels with a limited access groundfish permit has remained around 34-39% from 2010 to 2013, with 2013 having the lowest percentage of inactive vessels (34%) in the four-year span. Both the number and the percentage of groundfish limited access eligibilities placed in CPH have grown over the 2010-2013 period. In 2010, 94 eligibilities (6.5% of total eligibilities) were placed in CPH. In 2013, 45 additional eligibilities were placed in CPH, a 19.7% increase from the number of eligibilities in CPH in 2012 (228 eligibilities), for a total of 273 eligibilities in CPH, accounting for 19.7% of the total number of eligibilities (Table 10). The number of vessels with revenue from any species fell from 763 in 2012 to 735 in 2013 (-3.7%). Since 2010, the number of vessels with revenue from any species has fallen 14.0%, with the fishery losing 120 active vessels (Table 11). The number of vessels with revenue from a groundfish trip declined 18.3% from 2012 to 2013 (400 to 327 vessels). From 2010 to 2013, the number of vessels with revenue from a groundfish trip fell from 446 vessels in 2010 to 327 vessels (-26.7%) This suggests that the contraction of the limited access groundfish fleet is being driven partially by the declines in the number of vessels that take groundfish trips (Table 12).
The reduction in the number of active vessels in the groundfish fleet should be interpreted carefully. Amendment 16 implemented a number of measures that induced the fishery toward fewer vessels, without necessarily requiring owners of non-active vessels to leave the fishery entirely. For example, an owner with a groundfish permit on each of three vessels is now allowed to stack all three permits onto one active vessel to reduce costs. In addition, Amendment 16 allows owners of permits held in CPH, which are not associated with an actual fishing vessel, to participate in sectors (i.e., allows the owner of permits in CPH to contribute the landings history for permits in CPH as PSC toward a sector’s yearly allocation of ACE). Alternatively, if the eligibility in CPH is in the common pool, the holder of that eligibility can lease DAS to other vessels, with some restrictions. Clearly, fewer vessels now actively fish under a limited access groundfish permit, and fewer vessels within the total groundfish fleet are earning revenue on groundfish trips. However, we cannot conclude that all owners of inactive vessels are no longer participating in the fishery at all; some are gaining revenue as lessors of PSC/ACE or DAS.
23

Others have likely stopped actively groundfishing and are targeting other species. Some have left the commercial fishing industry entirely.17
3.1.1. Number of Active Vessels by Home Port
From 2012 to 2013, most home port states in the Northeast region experienced declines in the number of vessels with revenue from any species, with the numbers of active vessels at four-year lows for Maine, New Hampshire, Massachusetts, and New York. In absolute terms, Massachusetts lost the greatest number of active vessels, 16 vessels (4.3%: 371 to 355 vessels); in percentage terms, Maine experienced the greatest decline (8.5%: 95 to 97 vessels). New Jersey and Rhode Island each gained one active vessel from 2012 to 2013, while the number of active vessels homeported in Connecticut remained unchanged from 2012 at 10 vessels (Table 11).
Five of the six major home ports in the region lost active vessels from 2012 to 2013, with Gloucester, New Bedford, and Chatham at four-year lows. In absolute terms, Gloucester lost the greatest number of active vessels, falling from 88 vessels in 2012 to 83 vessels in 2013 (-5.7%). Over the four-year time period, the number of active vessels homeported in Gloucester has fallen 22.4% (-24 vessels). Chatham experienced the largest decline from 2012 to 2013 in percentage terms (7.9%: 38 to 25 vessels). Chatham’s active groundfish fleet fell by 18.6% (-8 vessels) from 2010 to 2013. The number of active vessels homeported in New Bedford remained constant at 69 vessels from 2010 to 2012 before falling to 66 vessels in 2013. Boston also lost one active vessel (47 to 46 vessels) in 2013 from 2012, with one more active vessel than in 2011 (45 vessels) and six fewer than in 2010 (52 vessels), for an overall decline of 11.5% from 2010 to 2013. Portland’s number of active vessels declined from 18 to 17 vessels in 2013 from 2012 but remained higher than the number of active vessels homeported in Portland in 2010 and 2011, 16 vessels. Point Judith’s number of active vessels increased by one vessel to reach 45 vessels in 2013, the same number of active vessels that were homeported in Point Judith in 2010 (Table 11).
From 2010 to 2013, the number of vessels with revenue from a groundfish trip fell 26.7% (446 vessels to 327 vessels), with an 18.3% decline occurring from 2012 to 2013 (400 vessels to 327 vessels; Table 12). The number of vessels that had revenue from a groundfish trip fell in Maine, Massachusetts, New York, and Rhode Island in 2013 from 2012. Massachusetts experienced the greatest decline in absolute terms, losing 34 vessels (-16.5%). In percentage terms, New York saw the greatest loss; there was a 31.0% decline (42 to 29 vessels) in 2013 from 2012. The number of vessels that took a groundfish trip that were homeported in Maine fell from 51 vessels in 2012 to 39 vessels in 2013 (-23.5%). Rhode Island saw an 18.5% decline (54 to 44 vessels) in the number of vessels that took a groundfish trip in 2013 from 2012. The homeport states of Connecticut, New Hampshire, and New Jersey saw no change in the number of vessels that took a groundfish trip from 2012 to 2013, but they experienced overall declines over the four-year time span of 28.6% (-2 vessels), 21.9% (-7 vessels), and 52.4% (-11 vessels), respectively (Table 12).
In 2013, all six major home ports in the Northeast region saw declines from 2012 in the number of vessels with revenue from a groundfish trip, with Boston, Chatham, Gloucester, and New Bedford at four-year lows. Gloucester lost the greatest number of vessels with revenue from
17 The Northeast Fisheries Science Center has been conducting ethnographic research over the past year on the different ways that New England groundfish fishermen have responded to the changes in the fishery. Contact economist Tammy Murphy at [email protected] for more information on this project.
24

a groundfish trip in absolute terms, eight vessels, a 13.1% decline from 2012. In percentage terms, New Bedford experienced the greatest decline between 2012 and 2013, a 13.9% drop in the number of vessels that had revenue from a groundfish trip (36 to 31 vessels). From 2012 to 2013, the number of vessels that had revenue from a groundfish trip also decreased in Portland, Maine (16 to 14 vessels), and Point Judith, Rhode Island (33 to 30 vessels; Table 12).
3.1.2. Number of Active Vessels by Vessel Size
Declines in the number of active vessels with revenue from any species on all trips occurred each year between 2010 and 2013 within all vessel length classes, except for the <30ʹ vessel length class. The largest percentage decline in the number of active vessels between 2010 and 2013 occurred in the <30ʹ vessel size category (21.5%: 65 to 51 vessels). However, from 2012 to 2013, this vessel length class gained two vessels, increasing to 51 vessels from the 2012 low of 49 vessels. The <30ʹ length class was the only vessel length class that grew from 2012 to 2013. The overall decline is likely influenced by the presence of skiffs in this vessel length category; permit holders may be transferring quota associated with these skiffs onto other vessels they own, or leasing their quota to other fishermen. The 30ʹ to <50ʹ vessel size category, which has the largest number of active vessels with revenue from any species on all trips, experienced a 16.3% decline (459 to 384 vessels) during the past four years. The 50ʹ to <75ʹ vessel size category, containing the second largest number of vessels, experienced an 11.5% reduction from 2010 to 2013 (218 to 193 vessels). Finally, the ≥75ʹ vessel category experienced a 5.3% reduction in the number of active vessels between 2010 and 2013 (113 to 107 vessels; Table 13). The number of vessels with revenue from any species on at least one groundfish trip also declined each year from 2010 to 2013 within all vessel length classes, except for the <30ʹ class. The largest percentage decline in the number of active groundfish vessels between 2010 and 2013 occurred in 30ʹ to <50ʹ vessel length class (34.3%: 242 to 159 vessels), the class that contains the most vessels that has revenue from at least one groundfish trip. The <30 vessel length class gained one vessel (16 to 17 vessels) from 2012 to 2013 but declined 29.2% over 2010-2013. The 50ʹ to <75ʹ vessel size category, containing the second largest number of active groundfish vessels, experienced a 15.7% reduction from 2010 to 2013 (121 to 102 vessels). Finally, the ≥75ʹ vessel category experienced a 16.9% reduction in the number of active groundfish vessels between 2010 and 2013 (59 to 49 vessels; Table 14).
3.2. Number of Trips, Days Absent, and Trip Length
Numbers of fishing trips, days absent from port, and average trip lengths by active vessels were analyzed, in the aggregate and by four vessel length classes, to evaluate vessel activity patterns during 2010-2013 (Table 15). Vessel trip report (VTR) data were used to determine the number and length of trips taken in each fishing year.18
Effort on groundfish trips generally decreased in 2013. The fleet is taking fewer groundfish trips, with fewer total days absent on these trips. However, when a groundfish trip is taken, most vessels are taking lengthier trips than in prior years. Both the number of groundfish trips taken and total days absent on groundfish trips were at four-year lows in 2013, across all
18 For some trips, there were missing values for days absent. This means that for some trips, trip length was not available.
25

vessel length classes. However, for the groundfish trips taken, average trip length for all vessels was slightly longer in 2013 than it was in 2012. The groundfish fleet took a total of 10,056 groundfish trips in 2013, declining 29.8% from 2012 (-4,272 trips). The fleet as a whole had 2,826 (-14.2%) fewer days absent on groundfish trips in 2013 than they did in 2012. From 2010 to 2013, average groundfish trip length for the fleet has increased steadily from its low of 1.35 days per trip in 2010 to its 2013 level of 1.68 days per trip, a 25.2% increase overall. Average trip length on groundfish trips increased in 2013, by 21.6% (+0.30 days absent) from what it was in 2012. By vessel length class, average groundfish trip length increased for all vessel length classes but for vessels ≥75ʹ in length, for which average trip length on groundfish trips fell very slightly by 0.3% (-0.02 days absent) (Table 15).
Effort measures for non-groundfish trips show that the groundfish fleet overall took slightly more non-groundfish trips, with a slight increase in total days absent on these trips, in 2013 than it did in 2012. The average trip length for non-groundfish trips taken by the fleet fell very slightly in 2013 from 2012 but was at its second highest point in the 2010-2013 time series (Table 15).
The total number of non-groundfish trips taken by the fleet in 2013 was 33,317 trips, a 0.9% (+293 trips) increased from 2012. Overall, the number of non-groundfish trips taken by the fleet has decreased 13.5% over the period from 2010 to 2013. The total number of days absent on non-groundfish trips in 2013 was higher than it was in 2012, with 288 (+1.0%) more days absent. However, the total number of days absent on non-groundfish trips taken by the fleet has decreased 6.1% over the 2010-2013 period. Average trip length on non-groundfish trips has increased overall from 2010-2013 by 4.7% (+0.04 days absent) but fell very slightly by 1.1% (-0.01 days absent) in 2013 from 2012 (Table 15).
For vessels <30ʹ, the number of non-groundfish trips taken and the total days absent on these trips both increased in 2013 from 2011-2012 but were not as high as they were in 2010. The number of non-groundfish trips taken by the smallest vessels increased in 2013 by 138 trips (+12.5%) from 2012. Over the four-year time period, the total number of non-groundfish trips taken by these vessels has decreased by 222 trips (-15.2%). The total number of days absent on non-groundfish trips followed a similar pattern, increasing by 74 days (+22.1%) in 2013 but remaining lower than it was in 2010 and declining 13.0% for the period overall. Average trip length for non-groundfish trips was at a four-year high of 0.34 days absent in 2013 for the smallest vessel length class but has had a narrow range of 0.32 to 0.34 days absent from 2010 to 2013 (Table 15).
Effort measures for vessels 30ʹ to <50ʹ in length were similar to those for vessels in the smallest vessel length class. Both the total number of non-groundfish trips taken and the total number of days absent on those trips increased in 2013 from 2012, by 656 trips (+3.2%) and 354 days absent (+4.2%), respectively. However, for this vessel class, the number of non-groundfish trips taken decreased 10.1% from 2010 to 2013, and the total number of days absent on non-groundfish trips decreased 5.3% over the same time period. Average trip length on non-groundfish trips remained unchanged in 2013 at 0.43 days absent, the same as it was in 2010 and 2012, after increasing very slightly to 0.42 days absent in 2011 (Table 15).
Vessels in the 50ʹ to <75ʹ length class took fewer non-groundfish trips in 2013 than at any other point in the four-year time span, with a 3.8% decline (-348 trips) from 2012 and a 20.9% decline (2,317 trips) from 2010. The total number of days absent on non-groundfish trips was higher in 2013 than it was in 2011 and 2012 but lower than it was in 2010. Total days on non-groundfish trips for these vessels declined 2.9% overall from 2010 but increased 1.8% (+218
26

days absent) from 2012. Average trip length on non-groundfish trips for these vessels has increased since 2010, increasing in 2013 by 0.26 days absent (+22.0%) from 2010 and by 0.08 days absent (+5.9%) from 2012 (Table 15). The largest class of vessels, ≥ 75ʹ in length, took fewer non-groundfish trips, with fewer days absent on these trips in 2013. However, when these vessels did take a non-groundfish trip, they were generally longer in length than they were in 2012. Both the number of non-groundfish trips taken and the total days absent on these trips were at four-year lows in 2013, decreasing 7.2% (-94 trips) and 4.5% (-613 days absent) from 2012, respectively. Overall, the number of non-groundfish trips taken decreased 11.7% from 2010. The total number of days absent decreased 11.4% over the same time period. Average trip length on non-groundfish trips taken by the largest vessels increased by 0.12 days absent to 3.91 days absent (+3.2%) in 2013 from 2012 (Table 15).
4. ECONOMIC PERFORMANCE
A complete assessment of fishery economic performance requires information from all vessels on all fishing-related costs and on all fishing-related revenues to determine profits. Actual annual financial profit is the sum of the owner’s share of net revenue for all trips made over a year less annual fixed costs.19 This information would include the cost of purchasing additional ACE or DAS and the revenues from the sales of fish and ACE. Although progress is being made to address critical data gaps, at this time the Social Sciences Branch (SSB) does not have sufficient information to estimate profitability for various segments of the groundfish fleet or at a finer level (e.g., at the vessel affiliation or the individual vessel level). The primary obstacles to this estimation are (1) a lack of data on fixed costs and crew payments20 and (2) incomplete data on ACE trading and DAS leasing.
This report uses three metrics to evaluate financial performance: (1) revenue per vessel and day; (2) total factor productivity, and (3) net revenue. None of these measures alone provides a complete assessment, but taken together they allow insights into important aspects of economic performance and provide some indication of trends in the economic efficiency of the active groundfish fleet.
19 Fixed costs are typically those that do not vary with the amount of fishing effort such as insurance. 20 Fixed cost and crew payment data were collected through a voluntary survey in 2006-2008. However, vessel owner response to that fixed cost survey was poor and the resulting data quality was insufficient. In 2012, SSB implemented a redesigned cost survey to collect information about fixed costs and crew payments incurred in 2011 from approximately 50% of the commercial fishing vessel owners in the Northeast, according to vessel size and primary gear type. The survey was repeated in 2013, surveying the remaining half of vessel owners in the Northeast for fixed costs and crew payments incurred in 2012. These more recent surveys have resulted in higher response rates than the 2006-2008 efforts, with response rates of 30% and 21%, respectively, and the SSB now has fixed cost and crew payment data for 741 commercial fishing vessels in the Northeast. These data are being analyzed now as the SSB strives towards a more complete understanding of profitability for various segments of the fleet. At this time, both the Northeast Fishery Observer Program (NEFOP) and the At-Sea Monitors (ASM) Program collect some of fishing-related costs, and these data can be used to evaluate financial performance. Information contained in VTR and dealer data can also be used to derive additional performance measures.
27

4.1. Revenue per Vessel
Landings revenue per unit of effort was used as a proxy measure for profitability. Profitability is often measured as the ratio of total revenue divided by total cost, with a ratio greater than one indicating positive profits. Because a complete accounting of costs is not available, effort is used as a proxy for cost. If the costs of inputs used to generate effort are constant, comparing the ratio of revenue per unit of effort in two time periods serves as a proxy for profitability change. With constant input prices and revenue, an increase in effort would increase costs, reducing the revenue per unit effort ratio, and imply reduced profitability between the two time periods. Conversely, increased revenue with constant (or lower) effort would imply increased profitability. However, even with constant effort, the costs of inputs used to generate effort could be increasing.
The gross revenue per effort metrics used in this report characterize the performance of an average vessel within each vessel size category. However, individual vessel performance can vary substantially, in either direction, from the average. As stated above, changes in gross revenue per unit effort can also be accompanied by changes in the use (and therefore the cost) of inputs.21 These caveats should be considered when evaluating the results that follow.
Average all species gross revenues per vessel on groundfish trips were at four-year lows in 2013 for all vessel size categories except for largest vessel length class, the ≥75ʹ group. Decreases from 2012 ranged from 1.3% for vessels 50ʹ to <75ʹ in length to 88.4% for vessels <30ʹ in length. The largest class of vessels saw a 7.6% increase from 2012 to 2013 in average all species revenue per vessel on groundfish trips. For all vessel length classes, average all species gross revenues on groundfish trips have declined over the four-year time span, with decreases ranging from 9.1% for the largest vessels to 80.2% for smallest vessels (Table 16).
Average all species revenue per vessel on non-groundfish trips increased to four-year highs in 2013 for all vessel length classes except the ≥75ʹ group. Increases from 2012 ranged from 4.7% for the 50ʹ to <75ʹ length to 17.2% for the 30ʹ to <50ʹ length class For the largest class of vessels, average all species revenue on non-groundfish trips fell 6.3% in 2013 from 2012. Over the four-year time period, increases in average all species revenue per vessel on non-groundfish trips have ranged from 10.6% for the largest vessel length class to 26.9% for the 50ʹ to <75ʹ class (Table 16).
4.2. Fleet Productivity
Productivity and productivity change are key economic indicators and critical factors in economic growth. With a single output and single input, productivity is typically measured as the ratio of output produced to the input used. With a more complicated production process, productivity is measured as aggregate output divided by aggregate input, and is called Total Factor Productivity (TFP). TFP is the most general measure of productivity, and changes in TFP can be measured at the firm level or at the aggregate industry level.
Fishing vessels typically catch multiple species on a trip using multiple inputs. For example, vessels use labor (crew), capital stock (vessel length and horsepower), and energy (fuel) on fishing trips to harvest a variety of fish and shellfish species. Because of this multiple
21 For example, the amount of fuel used could increase because of a change in fishing behavior that may generate an increase in revenue per day absent.
28

output, multiple-input fishing technology, index numbers that combine outputs and inputs into a single number, and compare those totals with a base year or time period total, are necessary to measure TFP change.
A recent national effort estimated productivity change for all catch share fisheries in the United States, including the Northeast Multispecies Fishery, using the Lowe Index.22 Productivity change was defined as the ratio of a Lowe output quantity index to a Lowe input quantity index. The Lowe output and input quantity indices are aggregate values of total outputs produced, and total inputs used to produce the outputs, with both indices constructed using fixed prices. The index is constructed at the fishery level, which differs from estimates of productivity in prior reports, which estimated productivity change with the Malmquist Index23 at the vessel level.
For the Northeast Multispecies Fishery, the Lowe output index was constructed using all species (outputs) landed on those trips identified as groundfish trips. The Lowe input index was constructed by aggregating the value of capital services, labor services, fuel, and materials used on all fishing trips identified as a groundfish trip. The base year for the indices was 2007. A value greater than 1 for the Lowe Index indicates an improvement in productivity, while a value less than 1 signifies a decline in productivity, compared with 2007. A final point is that these numbers have not been adjusted to account for any changes in biomass that may have occurred. Data for 2013 to make the biomass correction were not yet available.
Productivity for the Northeast Multispecies Fishery peaked in 2009 (1.23) and has since slowly declined. In 2013, the value was 0.96, which is a 4% reduction in productivity since 2007. Focusing on outputs, the output quantity index has declined steadily from 2007 and reached a low of 0.58 in 2013, meaning the fishery output was 42% less than in 2007. However, inputs used also declined during the same period, resulting in an input index value of 0.6 in 2013, a 40% reduction from 2007 levels (Table 17). The decline in inputs was chiefly caused by the exit of vessels. Input usage declining more than outputs produced was the reason the productivity index was greater than 1 until 2011. In terms of yearly change, only 2009 and 2013 saw positive gains in productivity from the prior year. For 2013, this occurred because total input usage declined further than total outputs produced, leading to a slight upturn in productivity.
5. ACE LEASING
Every limited access groundfish permit has a potential sector contribution (PSC) based on its fishing history. The PSC is a percentage share of the total allocation for each allocated groundfish stock. Every limited access groundfish permit also has a tracking identification number called a Moratorium Right Identifier (MRI). PSC is technically allocated to MRIs, which are subsequently linked to vessels through Northeast Multispecies limited access fishing permits. When fishermen join a sector, their PSC is pooled and becomes the sector’s annual catch entitlement (ACE). Each sector determines how to distribute its ACE among its members. All groundfish caught on sector fishing trips count toward that sector’s ACE. ACE is transferable
22 See O’Donnell 2012. The Lowe TFP index can be written as the ratio of two indexes attributed to Lowe (1823). 23 The Malmquist Index (MI), which was introduced by Caves, Christensen and Diewert (1982), is an index well suited for measuring TFP change. Because only outputs and inputs are needed to construct the MI, this index is particularly advantageous for estimating changes in productivity of fishing vessels. Other productivity metrics require data on output and input prices. Although price data for landed species are extensive, data on input prices are only available for a subset of vessels.
29

between sectors via approved annual leases, while PSC is transferable within sectors using lease arrangements. ACE and PSC are generally leased because one fisherman or sector wishes to catch more than their initial allocation for a particular stock. It is important to note that some sectors or fishermen may choose to lease most or all of their ACE/PSC rather than catch it.24 ACE and PSC leases result in transfer payments within the industry. If there are no transaction costs—that is, no costs associated with these transfers25—the payments are not a cost to the industry. Every pound of ACE or PSC leased represents a cost to the lessee and a reimbursement to the lessor, both of whom are industry members or, in some cases, permit banks. A frictionless lease market26 allows industry members to better align their allocated PSC portfolio with their actual catch. It is also particularly important to note that the ability to lease allows fisherman to use improved technology such as selective gears to target stocks for which they may not have been allocated sufficient PSC. But the benefits of leasing decrease as transaction costs increase: imperfect information on lease quantities and prices, for example, may cause fisherman to hold PSC when they should lease, or vice versa. Other structural aspects of the sector system such as operating rules that require multiple rights-of-refusal within sectors and between affiliated sectors may increase transaction costs, decreasing market liquidity and reducing efficiency in the leasing market. This section evaluates how ACE and PSC moved within and between sectors with an emphasis on market structure and size, prices, total transfers, and transaction costs.
5.1. Market Structure, Size, and Characteristics
There are two forms of leasing: ACE leases between sectors and PSC leases within sectors. Although by regulation ACE is pooled within sectors, most sectors seem to follow the practice of assigning catch allowances to member vessels based on PSC allocations. If this is standard practice for all sectors, catching more fish than an individual PSC allocation must require either a lease of ACE (between-sector) or PSC (within-sector).27
Between-sector leases are formally reported to NMFS, noting the stock, total weight, and, often but not always, compensation. Catch and individual allocation data at the MRI level can be combined with between-sector lease data to estimate the size of these two components of the leasing market. Within-sector PSC leases are not tracked by NMFS; ACE is assigned to a sector with no restrictions on how and by whom it may be fished. However, sectors are asked to voluntarily report their within sector trades in reports submitted to NMFS at the end of each fishing year. Sectors also voluntarily report which sector members transfer quota out of the sector and which sector members receive quota from another sector. Not all sectors report these within and between sector trades in the same fashion. Within-sector PSC leases data were reported voluntarily and comprehensively for the first time in 2012. However, these data are not uniformly traceable to the individual permit or MRI level. Many sector members own multiple
24 Presumably because the benefit from leasing the quota outweighs the expected benefits from catching it (revenues from landing ACE less the cost of catching the ACE). Often, ACE is transferred in order to achieve an optimal balance of species/stocks since many species/stocks are caught jointly. 25 Transaction costs include, for example, payments to a broker, the cost associated with finding buyers or sellers, or the opportunity costs associated with leases that didn’t happen due to poor market information or other factors. 26 A lease market with no transaction costs. 27 In FY2011 this became more difficult as FY2010 carryover was allocated to sectors and the method of re-allocation within a sector is not reported. For the purposes of this analysis, it was assumed that the total amount of sector-level carryover was re-allocated to individual sector members proportional to their unused PSC from the prior year.
30

vessels but the data do not distinguish which permits were responsible for leasing in, or out, quota. In addition, fishing permits can be associated with different MRIs, due to ownership changes and other reasons, and can move in and out of CPH status.28 This further complicates associating vessels with actual quota trades.
Two hundred and twenty four sector-affiliated MRIs had catch that exceeded individual PSC allocations for at least one stock in 2013, down from 242 in FY 2012. These MRIs leased in nearly 21 million live pounds of ACE and/or PSC in FY 2013 (Table 18). A similar comparison at the vessel affiliation level29 shows 156 affiliations leased in nearly 12 million live pounds in 2013 (Table 19). Of all the major home ports, Gloucester, Massachusetts, had the largest number of lessees with 41 at the vessel level (Table 18) and 32 at the affiliation level (Table 19). The largest percentage of the 224 lessees identified (45.5%) were attached to vessels in the 30ʹ to <50ʹ vessel length category (Table 20).
The difference between the 21 million live pounds at the MRI level and the 11.7 million live pounds at the vessel affiliation level, which is 9.3 million live pounds, is the transfer of ACE among MRIs within a vessel affiliation. A vessel affiliation could be a single owner with multiple MRIs and these “leases” could simply be transfers of ACE from one MRI to another.
While lessee fishermen and/or ownership groups can be determined by comparing catch with allocated PSC at the MRI level, the fishermen on the other side of those transactions (lessors) are more difficult to identify. Fishermen who failed to convert their allocated PSC into catch may be easily identified, but these permits create a pool of potential ACE/PSC that is much larger than aggregate lessee requirements (Table 21). Further, many active fishermen chose to lease ACE/PSC for particular stocks while targeting others, so those with zero catch are not the sole pool of potential lessors. Some broad conclusions may be reached. For example, Table 22 shows that, while the largest vessel size category (≥75ʹ) was allocated 37% of all ACE in 2013, this size category caught 53% of total catch, indicating a broad shift of ACE/PSC from smaller to larger vessels.
Figure 8 reveals that the distribution of catch and ACE among vessel size categories changes considerably across the 17 allocated stocks but confirms the conclusion that the smallest vessel length category, most likely inactive skiffs, was a primary source of leased ACE/PSC. Additionally, CPH permits are a significant source of leased ACE/PSC.
The intersector, or between sector, lease market declined in FY 2013, with volume down more than 28% from the previous year, to almost 16 million live pounds (Table 23).
5.2. Prices
Analyzing price and quantity data for the between-sector component of the market, a hedonic price model was used to estimate lease values for all 17 stocks of leased ACE (Table 24 and Table 25).30 Statistically significant prices were estimated in 2013 for 10 of the 17 stocks.
28 CPH provides a temporary holding place for inactive permits while allowing the fishing history (and ultimately the quota) to be used on another permit. 29 Vessel affiliations are groups of vessels connected by common ownership. Note that these data may not be comprehensive, as vessel affiliation data are not currently collected on CPH permits. 30 ACE leases between sectors take three forms: (1) single-stock leases with single-value cash compensation (single stock leases); (2) multi-stock leases with single-value cash compensation (bundled leases); and (3) single or multi-stock leases with single or multi-stock compensation (swap leases). This model decomposes the lease arrangements into constituent parts representing the 17 individual stocks, where a price (P) is a function of various quantities of
31

Seven stocks—Georges Bank East cod, East and West GB haddock, pollock, redfish, Gulf of Maine winter flounder, and Georges Bank yellowtail flounder—were traded at a price no different from zero.31 Gulf of Maine cod obtained the highest lease price at an annual average of $1.22 per pound, which is its highest average price in the four-year period (Table 25). For reference, Table 26 contains mean price estimates from single stock lease data only and Table 27 contains ex-vessel and estimated ACE lease prices.
Prices based only on one portion of the lease market (between sector ACE leases vs. within sector trades) may be biased due to structural issues affecting the lease markets. Most sectors maintain rights of first refusal when a sector member wishes to lease ACE out of the sector, and the Northeast Fishery Sectors maintain an additional second-refusal right for all members of their affiliated sectors. These structures place frictions in the market by concentrating liquidity into small pools before opening the market to all participants. The impact of this on lease prices is uncertain, but within-sector markets may clear at lower prices than between-sector markets and therefore estimates based on between-sector transactions may be biased upward. This is not certain, however, as the large pool of available ACE for most stocks should be sufficient to meet leasing demand and erode any between-sector price premium. Permit banks and similar privately funded ACE leasing organizations may choose to lease ACE at below market rates, which might create an additional upward bias on the price estimates. These leases typically take place within sectors, and therefore the proportion of total ACE leased out by such entities is unknown. Such lease arrangements are not factored into price estimates reported here since no data are available for them.
5.3. Transfer Payments
At the MRI level, the total value of ACE/PSC lease market transfers in 2013 is estimated at 4.4 million dollars, down 46% from 2012 and 62% from 2010 (Table 28). When collapsed to vessel affiliations, the total transfer payment due to leasing is estimated at just over three million dollars, down 25.4% from 2012 and 53.4% from 2010, and implying that approximately 30% of all leasing (by value) is occurring within vessel affiliations (Table 29). The proportion of leases within and between vessel affiliations varies considerably at the homeport and state level (Table 30). For example, in Boston and New Bedford a large portion of the trades (transfers) occur between vessels within vessel affiliations whereas this is not the case in other ports.
5.4. Transactions Costs
The transfers described thus far do not represent a cost to the industry as a whole. Any costs associated with ACE and PSC leasing result from two primary sources: the direct costs of
the sixteen stocks for which ACE is traded. The specification of the model is 𝑃 = β0 + β1χ1+. . . +βnχn + ε. The weights, β, are the portion of the total price (P) attributable to each quantity of ACE stock leased (x) and represent the marginal price of ACE lease. In this case n is the sixteenth ACE stock. Additional variables were added to estimate the contribution of bundled and swap leases, as well as the effects on prices for ACE leased by Northeast Fishery Sector IV and state permit banks. To include swap leases in the model, price was set at zero dollars and one side of the swap recorded negative lease quantities while the other recorded positive quantities. By using swap, bundle, and single-stock lease data, it is possible to provide a comprehensive estimate of ACE lease values. 31 This could be because the quota were truly valueless (likely the case for the GB haddock stocks) or because data were insufficient to allow the model to estimate a non-zero price.
32

getting buyers (lessees) and sellers (lessors) to negotiate lease prices and quantities and the indirect costs associated with leases that would have made both buyers and sellers better off but did not happen. Together, these are considered transaction costs.
It was not possible to estimate the value of transaction costs for three reasons. The first is a structural impediment. The fact that ACE is held at the sector level but leases almost universally occur at the individual permit (MRI) and/or vessel affiliation level means that lease market data are opaque, leaving only the lessee side of the transaction obviously discernible from official NOAA records. Second, while most sectors included some perspective on some forms of transaction costs in their annual reports, no comprehensive data are available on all of the costs associated with orchestrating leases between individuals, firms, or sectors. Such costs may include fees paid to sector managers or brokers, costs associated with advertising ACE availability, or the cost of time spent searching for and completing suitable leases. The third and final reason for being unable to estimate transaction costs is that no data are available on which to base estimates for the cost of lost leasing opportunities,32 the largest form of transaction cost in this market. Primarily these lost opportunities are due to search frictions and/or structural market impediments that prevent or impair lease negotiation. That is to say, it is not possible to estimate which fishermen or vessel affiliations wanted to lease quota but could not and what the impact of any inability to match buyers and sellers may have been on the potential for increasing the catch of non-binding stocks. The fact that only 33% of total allocated ACE/PSC was caught in 2013 and that less than half of these allocations were caught for eight of the 17 stocks implies at first glance that the potential for efficiency gains from improving lease markets may be large (Table 31). In fact, the inability of sectors to catch their allocated ACE is not likely attributable to any one factor. For example, it may be due to search frictions and/or structural impediments, but it may also be due to fish availability and/or imperfect quota setting, insufficient technology to target particular stocks, expectations about future market conditions, or other factors altogether.
6. DISTRIBUTIONAL ISSUES
Considerable attention has been given to consolidation in the groundfish fishery and whether the degree of consolidation has been heightened by Amendment 16. There is concern also that consolidation may generate a loss of diversity in the fishery. The term “consolidation” can be used to refer to many possible events including the following: a reduction in the number of vessel affiliations (i.e., ownership groups), a reduction in the number of active vessels, a narrower range of vessel sizes, or fewer landed or home ports. To avoid confusion, this report uses the term “consolidation” to mean fewer active vessels or fewer active vessel affiliations earning total revenues for all species and groundfish. In discussing how revenues for all species and groundfish are distributed among existing active vessels and active vessel owners in a given fishing year, we either use the term “concentration” or refer to revenue distributions as being relatively more or less equally distributed. It is important to note that this section addresses the consolidation and concentration of all species and groundfish revenues from landings by active vessels and vessel affiliations, which are earned through use of the fishery resource. It does not address concentration and
32 Leases that would have left both lessee and lessor better off had they occurred.
33

consolidation of quota or permits, which allows for access to the fishery resource. A fisherman may not be actively landing fish, which means that he would not earn a share of the landings revenues discussed in this section. However, he may still be earning revenues from leasing his quota to other fishermen, and those earnings are not reflected in the discussion in this section.
6.1. Number of Vessel Affiliations
Changes in the number of vessel affiliations, or networks of vessels connected by common owners, do not necessarily mean there are more or fewer individuals involved in the fishery. Changes in vessel ownership among existing individuals can also result in changes in the number of vessel affiliations; the results in Table 32 reflect the combination of these two possibilities. The number of vessel affiliations issued limited access groundfish permits declined 14.3% from 2010 to 2013 (910 to 780 affiliations). This is similar to the rate of decline in the number of active vessels (Table 10).
The number of vessel affiliations that had vessels with revenue from at least one groundfish trip is declining at a faster rate (28.1% between 2010 and 2013; Table 32) than the number of vessel affiliations that had revenue from any species. This, too, is similar to the rate of decline in vessels with revenue from at least one groundfish trip (Table 10). The percentage of vessel affiliations that are inactive (i.e., have no landings) has remained relatively stable over the four-year period, ranging from a low of 22% in 2012 and 2013, to a high of 25% in 2011 (Table 32). Consolidation of vessels and vessel affiliations is occurring among owners that actively target groundfish. Vessels and vessel affiliations that were active (i.e., have revenue from any species while holding a limited access groundfish permit) but did not earn any revenue from a groundfish trip may be viewed as vessels and affiliations that do not actively target groundfish. Over the period from 2010 to 2013, there does not appear to be ongoing consolidation in this group of vessels and owners. The number of active vessels with limited access groundfish permits that did not have revenue from a groundfish trip remained nearly constant between 2010 (408 vessels) and 2013 (409 vessels; Table 10). The number of active vessel affiliations that did not actively target groundfish increased slightly from 339 vessel affiliations to 347 affiliations during the four-year period (Table 32). Data presented in Table 32 and Table 33 together suggest that the decline in the number of active vessels in 2010-2013 is primarily due to attrition of active vessel affiliations (fewer ownership groups) rather than consolidation of operations within a vessel affiliation (i.e., ownership groups choosing to harvest fish on fewer vessels). In general, the percentages of vessel affiliations containing a single vessel versus those containing multiple numbers of vessels have remained stable during the four-year period. The percentage of vessel affiliations with a single active vessel in 2013 was 85.0% (531 affiliations), a small decline from 85.7% (598 affiliations) in 2010. The average number of active vessels per active vessel affiliation only changed from 1.22 in 2010 to 1.21 in 2013 (Table 33).
6.2. Distribution of Revenue among Vessels
All species and groundfish revenues were not evenly distributed among groundfish vessels during 2010-2013 (or probably at any time). Between 2010 and 2013, the amounts of all species and groundfish revenues concentrated in the top earning categories remained relatively
34

stable. Both all species and groundfish revenues were unequally distributed in 2010, and they remained so through 2013. Groundfish revenue remained more concentrated among the top earning vessels than did all species revenue. Distributions of revenues among active vessels during 2010-2013 were examined by ranking active vessels by revenue from highest to lowest and then categorizing the vessels into seven earnings brackets from highest to lowest: top 1%, 2-20%, 21-40%, 41-60%, 61-80%, 81-99%, and bottom 1%. This was done for both all species revenues on all trips and groundfish revenues on all trips (Table 34 and Table 35). During 2010-2013, the top 20% of vessels annually accounted for 56.7%-58.0% of the total revenue from all species. In this same time period, little change occurred in the proportional share of the bottom 20% of vessels for all species revenues (Table 34). Groundfish revenues continue to be less equally distributed among active vessels than all species revenues in 2013. Between 2010 and 2013, groundfish revenues became more concentrated in the highest-earning 20% of vessels, increasing from 66.2% to 71.9%. On the other end of the earnings spectrum, the bottom 20% of active vessels earned 0.3% of total groundfish revenues in 2010. This increased to 0.6% in 2013 (Table 35).
6.3. Distribution of Revenue among Vessel Affiliations
The distributions of both all species and groundfish revenues are more concentrated at the vessel affiliation (ownership) level than at the vessel level. The concentration of revenues among top earning vessel affiliations was marked in 2010-2013, and this level of concentration persisted and slightly increased in the top 1% in 2013. Groundfish revenue is more concentrated than all species revenue among the top earning vessel affiliations, as was the case at the vessel level. Distributions of revenues among vessel affiliations in 2010-2013 were examined by ranking active vessel affiliations by revenue from highest to lowest, and then categorizing the vessels into seven earnings brackets from highest to lowest: top 1%, 2-20%, 21-40%, 41-60%, 61-80%, 81-99%, and bottom 1%. This was done for both all species revenues on all trips and groundfish revenues on all trips (Table 36 and Table 37). In addition, vessel affiliations with at least one active vessel in each year were divided into eight revenue categories. The smallest revenue category included affiliations earning less than $50,000 for all trips and species landed. The highest revenue category included affiliations earning $1 million or more (Figure 9). As noted in Section 6.1, the total number of vessel affiliations with active vessels declined annually between 2009 and 2012 (Table 32). From 2010 to 2013, declines in the number of vessel affiliations occurred in five of the eight revenue categories. Figure 5 also shows not only are there fewer vessel affiliations in 2013 than in 2010 but the distribution of all species revenues among active vessel affiliations changed somewhat over the four-year period (Figure 9). During 2010-2013, the distribution of all species revenue among vessel affiliations remained unequal but relatively stable. The top 20% of vessel affiliations annually accounted for between 53.5% and 55% of the total revenue. The top 1% of vessel affiliations accounted for between 17.5% and 18.7% (Table 36). The percentage of total groundfish revenue earned by the top 20% of vessel affiliations had a similar range of values (57.2% to 60.8%) to the top 20% of all species revenue. However, the range of values for the top 1% was increased from a four-year low of 26.6% in 2011 to a four-year high of 28% in 2013 (Table 37).
35

6.4. Distribution of Revenue Using Lorenz Curves and Gini Coefficients
Lorenz curves provide a graphical interpretation of how revenue is dispersed among the income levels of a population.33 For any given point on the Lorenz curve, the vertical axis value is the share of total revenue accounted for by all vessels that earned revenue equal to or less than the proportion of the population indicated by the horizontal axis value. The Gini coefficient can be derived from the Lorenz curve and reflects the degree of deviation between the Lorenz curve and the 45 degree line that represents perfect equality.34 Gini coefficient values are bounded by 0 and 1, where 0 indicates perfect equality and 1 indicates maximum inequality.
It is important to recall that revenues have not been equally distributed for some time, as seen earlier in this section. During 2010-2013, the distribution of groundfish revenues was more unequal than the distribution of all species revenues among vessel affiliations, which can be seen by comparing the Gini coefficients for the period for all species revenues (0.694 to 0.701; Figure 10) with the Gini coefficients for the same time period for groundfish revenues (0.808 to 0.842; Figure 11). There has been little change between 2010 and 2013 at the all species revenue level (Figure 10). At the groundfish revenue level, there was an increase in the Gini coefficient, as shown by a change in the shape of the Lorenz curve, in 2013 (Figure 11).
6.5. Consolidation and Concentration of Revenue among Vessel Affiliations
Another way of analyzing the distribution of revenue is to evaluate the number of vessel affiliations that earn various shares of the overall revenue. When fewer affiliations earn all species and groundfish revenues, consolidation has occurred. To assess whether changes in the concentration of revenue have occurred, annual changes in the proportion of affiliations by revenue quartile were examined adjusting for yearly changes in the total number of affiliations. The number of affiliations accounting for 25%, 50%, 75%, and 100% of the revenue from all species on all trips and groundfish species on all trips was tabulated for each year from 2010 to 2013 (Table 38 and Table 39). Consolidation of all species revenues into fewer ownership groups has occurred, meaning some ownership groups are no longer actively fishing under their limited access groundfish permits. From 2010 to 2013, there has been decline in the number of vessel affiliations in each earnings quartile. Overall, there were 93 fewer affiliations earning total all species revenues in 2013 (605 affiliations) than in 2010 (698 affiliations). However, the percentage of each affiliations in each quartile did not change substantially over the four years indicating that, while the number of affiliations earning all species revenue has declined, the distribution of all species revenues among those vessel affiliations that remain active in the fishery has not changed significantly (Table 38). Groundfish revenues continue to be consolidated into fewer ownership groups. Between 2012 and 2013, the degree of concentration of groundfish revenues among those vessel
33 A Lorenz curve is constructed by ranking vessels in order of increasing revenue and then plotting the cumulative proportion of the population on the horizontal axis versus the cumulative share of revenue on the vertical axis. 34 The Gini coefficient is equal to twice the area between the diagonal and the Lorenz curve.
36

affiliations remaining in the fishery slightly increased. Overall, there were 69 fewer vessel affiliations earning total groundfish revenues in 2013 than there were in 2010. A slight increase in the concentration of groundfish revenues among vessel affiliations occurred in the percentages of vessel affiliations earning the top 25%, 50%, and 75% of groundfish revenues. For example, in 2012, the top 5.1% of vessel affiliations earned 50% of groundfish revenues. In 2013, this percentage of top vessel affiliations earning 50% of groundfish revenues decreased to 4.2% (Table 39). Taken together, Table 38 and Table 39 imply that there are fewer ownership groups remaining in the fishery and therefore, fewer groups to divide up all species and groundfish revenues earned from actively fishing under limited access groundfish permits. Groundfish revenues were distributed among vessel affiliations slightly less equally in 2013 than they were in 2012. The distributions of revenues among vessel affiliations indicate that groundfish revenues are more concentrated among vessel affiliations than all species revenues, as was also the case among individual vessels. 7. EMPLOYMENT
Changes in employment levels can result from changes in fishery regulations. If new management approaches, such as catch shares, foster vessel consolidation or reductions in fishing effort, working conditions (such as pay, time spent at sea, and number of jobs) may be affected. Although NMFS does not track employment in the fishing industry in the Northeast, Vessel Trip Reports contain information about crew size on fishing trips and on the duration of trips. While these reports do not identify the actual number of individuals employed (e.g., crew often work for more than one vessel owner), the VTR data can be used to determine the number of crew positions available and the length of time that crew spend at sea.
In general, trends in crew employment indicators were negative, suggesting that in 2013 there were fewer opportunities for crew work on most vessel sizes and in many of the region’s home port states. For the fleet as whole, total crew positions, total crew trips, and total crew days were at four-year lows in 2013. The ratio of crew days to crew trips—which is described in more detail in Section 7.2 and can be interpreted as an indicator of time spent per earning opportunity (a crew trip)—was also at a four-year high for the fleet in 2013.
7.1. Number of Crew Positions
The total number of crew positions, measured by summing the average crew size of all active vessels on all trips, declined annually between 2010 and 2013 from 2,268 to 2,039, a 10.1% decline and a four-year low in 2013. From 2012 to 2013, the number of crew positions fell across vessel sizes, with decreases ranging from 1.3% (-1 crew position) for the smallest vessel class to 5.7% (-38 crew positions) for the 50ʹ to <75ʹ length class (Table 40).
Most home port states saw declines in the number of crew positions in 2013. Crew positions were at a four-year low for the home port states of Massachusetts, New Hampshire, New York, and Rhode Island, with declines from 2012 to 2013 ranging from 2.6% for Rhode Island to 9.5% for New Hampshire. In Maine, the number of crew positions (228 crew positions) declined 5.8% (-14 crew positions) from 2012 to 2013, but it was higher than it was in 2011 (222 crew positions). Connecticut saw no change in the number of crew positions from 2012 to 2013
37

(39 crew positions). The numbers of crew positions were at four-year highs in 2013 for the home port state of New Jersey and for all the other northeast home port states combined (Table 41).
7.2. Number of Crew Trips
Although the number of crew positions is an indicator of the availability of jobs, this measure is uninformative about the number of trips available for crew to work.35 To account for this distinction, a crew trip indicator was derived. Because most crew members are paid on a per trip basis, this crew trip indicator provides a measure of the total opportunities for crew to earn a share of the landings revenues. Total crew trips were calculated by summing the crew size of all trips taken in each fishing year across both vessel size category (Table 40) and home port state (Table 41). Total crew trips taken by the fleet steadily declined from 125,032 in 2010 to 106,699 in 2013 (a 14.7% reduction overall). From 2012 to 2013, total crew trips declined by 8.9%. Crew trips declined annually between 2010 and 2013 for all vessel size categories as well. The largest drop from 2012 to 2013 in both absolute and percentage terms occurred in the 30ʹ to <50ʹ category, which saw a decrease of 7,045 crew trips (-10.7%). The other vessel size categories saw decreases ranging from 3.7% to 7.0% in the number of crew trips from 2012 to 2013 (Table 41). The numbers of crew trips were at four-year lows in 2013 for nearly all home port states: Connecticut, Massachusetts, Maine, New Hampshire, New Jersey, and New York. The exceptions were the home port state of Rhode Island and the remaining Northeast region home port states combined, which saw a four-year highs in 2013 in their numbers of crew trips (Table 41). For home port states that hit four-year lows in their numbers of crew trips, declines over the four-year time period ranged from 10.6% for New York to 35.0% for Connecticut. In absolute terms, Massachusetts saw the largest decrease in the number of crew trips over the four-year period (9,851 trips: 54,204 trips to 44,353 trips). From 2012 to 2013, declines in these home port states ranged from 5.5% for New Jersey to 26.4% for New Hampshire. The home port state of Rhode Island had an additional 1,989 crew trips in 2013, a four-year high and a 13.3% increase over 2012 (Table 41).
7.3. Number of Crew Days
Crew days, calculated by multiplying a trip’s crew size by the days absent from port, were summed across vessel size categories and home port states to provide additional information about the time crew spend at sea to earn a share of the revenues. Because the number of trips affects the crew days indicator, this indicator is also a measure of work opportunity. Conversely, crew days can be viewed as an indicator of time invested in the pursuit of “crew share” (the share of trip revenues received at the end of a trip). The time spent at sea has an opportunity cost. For example, if crew trips and crew earnings remain constant, a decline in crew days would reveal a benefit to crew in that less time was forgone for the same amount of earnings. The ratio of crew days to crew trips accounts for these factors. The absolute value of this ratio does not, in itself, provide information about opportunities for crew. However, annual
35 For example, a vessel with three crew members that makes 10 trips a year is considered equivalent (with respect to crew positions) to a vessel with three crew members that makes 60 trips per year.
38

changes in the ratio are informative. For example, a declining trend in the ratio would imply a reduction in time spent per “earning opportunity” (a crew trip).
Total crew days for all vessel sizes combined decreased 6.8% from 2012 to 2013 for all vessels. Since total crew trips declined during the same time period at a higher rate (8.9%), the ratio of crew days to crew trips has increased. This suggests that the time spent per earning opportunity has increased, while at the same time earning opportunities have decreased. Total crew days were at four-year lows in 2013 for all vessel size categories, with the exception of the <30ʹ vessel size category, which saw a 1.8% rise (+13.0 crew days) from 2012 to 2013 (Table 40).
Most home port states saw declines in 2013 in their total numbers of crew days. Massachusetts, New Jersey, and New York hit four-year lows in their numbers of crew days in 2013, with declines over 2010-2013 varying from 5.2% for New Jersey to 11.7% for Massachusetts. Massachusetts also saw the largest decline in absolute terms (-9,717 crew days from 2010 to 2013). In Connecticut, Maine, and New Hampshire, crew days declined in 2013 from 2012, but they were not as low as they had been for other years in the time series. Decreases in these states from 2012 to 2013 ranged from 7.8% for Maine to 20.7% for Connecticut, with Maine seeing the largest fall in crew days among these states in absolute terms (-1,287 crew days). In Rhode Island, the number of crew days was higher in 2013 than it was in 2011, but it did not reach a four-year high. Rhode Island saw a 5.8% increase in crew days from 2012 to 2013, but crew days have declined overall (-4.4%) for Rhode Island during the four years. In the remaining Northeast region home port states, the combined number of crew days was at a four-year low in 2013, decreasing 3.5% from 2012 and 5.0% overall from 2010-2013 (Table 41).
The ratio of crew days to crew trips, indicating time spent per earning opportunity for crew, was a four-year high in 2013 for the groundfish fleet as a whole, increasing 2.8% from 2012 and 8.0% from 2010. The home port states of Massachusetts, Maine, New Hampshire, and New York all saw four-year highs in their ratios in 2013. In Connecticut and New Jersey, the ratio fell in 2013 from 2012 but increased overall in the four-year time span by 35.6% and 23.8%, respectively. The home port state of Rhode Island and the remaining Northeast region home port states combined both saw four-year lows for their ratios of crew days to crew trips in 2013, with their ratios falling 14.7% and 4.0% over 2010-2013, respectively (Table 41).
Changes in crew-based employment indicators do not indicate, by themselves, whether crew incomes have changed. Crew income is influenced by many factors such as a vessel’s revenue/cost sharing formula (including whether or not the costs of leasing quota are passed onto crew), the amount of revenue a vessel receives from fish sales, the costs of fishing, the number of vessels actively fishing, and the intensity of fishing. In the following section, measures of crew share of net revenues will be discussed.
8. NET REVENUES
Net revenues were estimated using trip costs36 collected by Northeast Observers and At-Sea-Monitors, as well as other data sources. Net revenue is defined as gross revenue less trip costs. Typically, net revenue is then split between the vessel owner and the crew. Two types of net revenue analysis are provided: (1) yearly changes in average net revenue per day on
36 Trip costs are typically those that vary with the amount of fishing effort, such as fuel, bait, or fishing hooks.
39

groundfish and non-groundfish trips and (2) yearly changes in aggregate net revenues for various vessel categories (vessel size and home port state categories). Actual annual financial profit is the sum of the owner’s share of net revenue for all trips made over a year less annual fixed costs.37 While analysis of the owner’s share of net revenue is just one component of annual financial profit, it is indicative of economic performance (at least in the short run). See Figure 12 for a graphical depiction of the components of annual financial profit and the relationship between owner’s share and profit. Trip costs used in these analyses include fuel, oil, ice, supplies, bait, food, water, damage, lumper fees,38 and sector membership fees. There may be additional trip costs (e.g., communications costs or trucking fees) that must be covered. One important cost that has not been included in the estimation of net revenue is the cost incurred by sector vessels to purchase additional groundfish ACE in the period from 2010 to 2013 or to purchase DAS for common pool vessels.
Because not all trips are observed, and therefore actual trip cost information is not available for all trips, costs must be estimated for the universe of trips using information from the sampled trips. To do this, trip cost data were used to calculate average trip costs per day absent for 92 vessel types, based on gear used, vessel length, trip duration (single vs. multi-day trips), and fishing year (Table 42). For unobserved trips where actual trip costs were not available (or the data were insufficient to link a VTR record with an observed trip), the appropriate vessel type mean value was multiplied by the actual trip length (days absent) recorded in the VTR. The result is an estimate of the cost for each of the unobserved trips. From these data, an estimate of net revenue was obtained by subtracting the cost estimate from the actual revenue received for the trip (all species landed). For trips where there was a direct match between the observed data and VTR data, actual trip costs were used. An additional trip cost not collected by observers―but reported by most sectors in their 2010 through 2013 year-end reports―is the sector organizational cost charged to sector members. Based on the information in these reports (which are submitted to NMFS), a landings fee paid to the sector by sector members was calculated according to the formula provided in the year-end reports. For sectors that did not provide this information, a representative formula was used. A variety of crew and owner share arrangements are used in the groundfish fishery, with different percentage splits between owner and crew, different costs deducted from net revenue, and different points within the formula where the split occurs (e.g., some vessel owners divide gross revenue first and then deduct certain costs from the crew’s share of the gross revenue). Data from the SSB’s 2011 fixed cost survey were used to determine common lay systems according to vessel size and number of crew.39 Information is not available to determine whether a vessel was operated by the owner or a hired captain. For vessels less than 75ʹ with a crew size (including the captain) less than three, it was assumed that the operator was the owner. If the
37 Fixed costs are typically costs that do not vary with the amount of fishing effort, such as insurance. 38 Lumper fee information is not collected by observers. Based on personal communications with fishermen, a rate of $0.04 per pound of landed weight is assumed. 39 For vessels greater than 75ʹ, half of the trip expenses were subtracted from gross revenue and the owner’s share was 50% of the resulting amount. The crew paid the other half of the trip expenses from their share. Vessels 50ʹ to 75ʹ in length and with a crew of three or more used the same lay system as the large (75ʹ+) vessels. If the number if crew was less than three, the owner’s share was 75% of gross revenue less all trip expenses. For vessels less than 50ʹ, all trip expenses were deducted from gross revenues and the owner’s share was 70% of the resulting net revenue. If resulting owner and/or crew shares were negative, they were assumed to be zero.
40

crew size was three or more, it was assumed that the operator was a hired captain. For vessels 75ʹ and greater, it was assumed that the operator was a hired captain regardless of the crew size. Net revenue data presented are not adjusted for leasing activity, i.e. leasing revenues earned by vessel owners that lease out quota or leasing costs incurred by vessel owners (and, in some cases, passed along to crew) to lease in quota to fish. Fishery-wide impacts of quota trading on net revenues are neutral overall because aggregate quota costs equal aggregate quota revenues. However, quota trading has distributional effects, as the impact of quota trades on net revenues will vary from sector member to sector member, based on characteristics such as the number of vessels enrolled in the sector, the average length of those vessels, and whether the sector member has permits enrolled in CPH. Net sellers of quota include both sector members that fish and those that do not fish for allocated groundfish. For vessel owners that need quota in order to fish, obtaining quota is a true cost and the financial significance of that cost becomes greater with declining net revenues. In addition, in many cases, some portion of leasing costs may be passed along to crew.
8.1. Average Owner and Crew Shares Per Day
Average vessel owner and crew shares40 of net revenue per day, by trip type (groundfish vs. non-groundfish) and vessel size category, are reported in Table 43 and Table 44. In 2013, average owners’ shares per day on groundfish trips were the lowest in the time series. The decline was particularly sharp in the less than 30ʹ size category where average owner share per day declined by 88.6% from $1,372 in 2012 to $156 in 2013. By comparison, vessels in the largest size category (≥75ʹ) had a decline of 3.9% from 2012 to 2013. For vessels 30ʹ to <50ʹ in length, average owner share declined 17.9%. Vessels 50ʹ to <75ʹ in length saw average owner share decline 66.5% from 2012 to 2013. Average crew share per man per day on groundfish trips was at a four-year low in 2013 for all size classes with the greatest percentage decline in the less than 30ʹ size category (91.5%) and the smallest decline (3.9%) in the largest size category (≥75ʹ) (Table 43).
On non-groundfish trips, the average owner’s shares per day were at a four-year high in 2013 for the two smallest size categories. Vessels in the less than 30ʹ and 30ʹ to <50ʹ size categories saw 6.9% and 6.3% increases from 2012 to 2013 in average owner’s shares per day on non-groundfish trips. For the two largest size categories, average owner’s shares per day on non-groundfish trips were at a four year high in 2011. For vessels 50ʹ to <75ʹ in length, average owner shares per day decreased in 2013 by 7.5% from 2012 and by 9.9% from their 2011 high. Vessels in the largest size category saw average owner’s share per day on non-groundfish trips fall 23.2% in 2013 from their 2011 high. However, average owner’s share per day for these vessels did increase modestly in 2013 from 2012, by 3.7% (Table 44). To help explain some of the factors behind net revenue changes, both average revenue per day and average trip costs per day are also provided in Table 43 and Table 44. Since average trip costs per day on both groundfish and non-groundfish trips remained stable for all size categories over the time series, the changes in net revenue are mostly explained by changes in revenue per day. In 2013, average revenue per day on groundfish trips were the lowest in the
40 The average share of net revenue that individual crew members receive per day absent provides information about how they may be faring financially. This is a function of gross revenue, trip costs, the crew share system used, trip length, and the number of crew on the trip. All of this is captured in average crew’s share of net revenue per day per crew member.
41

time series for all size categories. The largest percentage declines were for vessels less than 30ʹ (75%) and for vessels 50ʹ to >75ʹ (49.6%; Table 43). For non-groundfish trips, revenue per day across all size categories was similar to 2012 levels (Table 44).
8.2. Average Owner and Crew Shares per Vessel
Average owner and crew shares of net revenues may also be expressed at the vessel level rather than per day (Table 45). For all vessel size categories, the average owner and crew shares declined from 2012 levels and were the lowest in the time series for all size categories except for vessels 50ʹ to >75ʹ. It should be noted that the average crew share values are independent of the number of crew; these are average amounts paid to the entire crew regardless of size. Also, crew shares are an expense for vessel owners and represent earnings for crew. It is possible that these declining crew earnings were shared by fewer crew.
8.3. Aggregate Owner and Crew Shares
Owner and crew shares of net revenues aggregated by fleet segments (vessel size and homeport state) are presented in Table 46 and Table 47, and reflect the combined result of shifts in average vessel performance and the shifts of activity among fleet segments. Total owner shares decreased from their 2011 four-year high of $149.4 million to $122.2 million in 2013. Total crew shares similarly declined from their 2011 four-year high of $88.6 million to $71.6 million in 2013. For all size categories, total aggregate owner and crew shares were the lowest in the time series (Table 46). Aggregate owner and crew shares in Massachusetts, the state with the most groundfish activity, declined to the lowest levels in the four-year time series. For owners in Massachusetts, aggregate share declined by $7.6 million (11.5%) from 2012 to 2013. Over the same time period, aggregate crew share in Massachusetts fell by $5.0 million (12.2%) (Table 47).
9. CONCLUDING REMARKS
Our analyses of fishery performance measures of the limited access Northeast Multispecies (Groundfish) Fishery showed mostly negative trends in the fishery during 2012-2013, with a continuation of many of the declines seen in our last annual economic performance report.
Landed pounds of groundfish are at their lowest point in 2010-2013 for all vessels. Non-groundfish landings are at a four-year high but grew less than 1% from their 2012 levels. Non-groundfish landings and revenues did not compensate for losses in groundfish landings and revenues. This is because non-groundfish landings have not increased significantly and because average non-groundfish price has fallen to its lowest level in the past four years. Overall, total landings have fallen by 1.6% and total gross all species revenue declined by 8.8% from 2012. Fishermen actively groundfishing in the Northeast are a shrinking group. The total number of active groundfish vessels continues to fall, with a reduction of 120 vessels over 2010-2013, with 119 fewer vessels taking groundfish trips in 2013 than in 2010. From 2012 to 2013, the fleet decreased by 28 vessels overall, with 73 fewer vessels having revenues from at least one groundfish trip. In addition, there are 130 fewer active vessel affiliations in 2013 than there were in 2010. Opportunities for vessel crew are decreasing except for a few limited instances. Overall, there is less effort targeting groundfish in the fishery: fewer boats taking groundfish trips and
42

fewer groundfish trips. However, when fishermen are able to fish, in many cases, their trips appear to be somewhat longer. Economic indicators of net revenue suggest that what was an increasing trend in average earnings per day for vessel owners on groundfish trips has declined substantially in 2013 to a four-year low, accompanied by continued declines in crew earnings. Values on non-groundfish trips are more stable. In aggregate, however, total owner and crew shares of net revenue have continued to decline. Consolidation in the fishery continues, as all species and groundfish revenues are earned by smaller numbers of vessels and vessel affiliations. The high level of concentration of revenues earned by fishermen for all species, and especially for groundfish, continues to persist. The NEFSC continues its work to provide more and better information on the impacts occurring in the groundfish fishery, as well as other Northeast fisheries. NEFSC staff economists are analyzing data recently collected from our survey of commercial fishing vessels for costs incurred in 2011 and 2012 and are making those data available to NEFMC staff for the analysis of proposed management actions. Those data are especially important because they contain information about the fixed, or non-trip, costs (including leasing costs) associated with running a commercial fishing business, which is necessary to understand profit. Fixed costs may vary considerably depending on vessel size and primary gear type, among other factors. The NEFSC has also recently collected socioeconomic data from vessel owners and vessel crew across fisheries to better understand how regulations across fisheries affect fishermen in their work and also in their daily lives as individuals and community members. These data will enable further development of governance, stewardship, and well-being performance indicators. In addition, the socioeconomic survey of vessel crew will provide needed demographic data on crew (which currently do not exist) and help to better understand how compensation to crew may be changing as fishing regulations change. NEFSC staff are also engaged in work to automate the production of basic performance measures for the Northeast’s catch share and non-catch share fisheries, which will enable us to provide basic performance indicators for the other fisheries in the region in a more widespread and timely manner. Finally, these findings apply to the active participants who have remained in the groundfish fishery. However, they tell us little about the participants who are no longer actively fishing. The NEFSC is currently finishing up a series of ethnographic interviews to be able to report on the social and economic experiences of fishermen who have transitioned out of the active groundfish fishery into other fishing and non-fishing related activities.
10. ACKNOWLEDGMENTS
The authors would like to acknowledge the work of the Analysis and Program Support Division at the Northeast Regional Office for their role in preparing the groundfish data using the Data Matching Imputation Tool (DMIS) tool. We also thank the following reviewers for their valuable suggestions: Paul Rago and Gregory Ardini. Finally, we thank the sector managers and members for their willingness to prepare the year end sector reports, and all the fishermen that have participated in the NEFSC’s recent data collection efforts. The cooperation of these groups allows the NEFSC to expand its ability to report on performance in the groundfish fishery.
43

11. REFERENCES CITED Balk B.M. 2008. Price and quantity index numbers. Cambridge University Press. New York,
N.Y., p. 300.
Caves, DW, Christensen LR, Diewert WE.1982. The economic theory of index numbers and the measurement of input, output, and productivity. Econometrica (Vol. 50): 1393–1414.
Clay PM, Pinto da Silva P, Kitts A. 2010. Defining social and economic performance measures for catch share systems in the Northeast U.S. 2010. In: Proceedings of the Fifteenth Biennial Conference of the International Institute of Fisheries Economics & Trade, July 13-16, 2010, Montepellier, France: Economics of Fish Resources and Aquatic Ecosystems: Balancing Uses, Balancing Costs. Compiled by Ann L. Shriver. International Institute of Fisheries Economics & Trade, Corvallis, Oregon, USA, 2008. CD ROM, paper no. 338, pp. 1-12, ISBN: 0-9763432-6-6.
Federal Register, 2013. Magnuson-Stevens Act Provisions; Fisheries of the Northeastern United States; Northeast Multispecies Fishery; 2013 Sector Operations Plans and Contracts and Allocation of Northeast Multispecies Annual Catch Entitlements 78 FR 25592, Vol. 78, No. 85 (May 2, 2013), pp. 25591-25619. Available online at https://www.federalregister.gov/articles/2013/05/02/2013-10281/magnuson-stevens-act-provisions-fisheries-of-the-northeastern-united-states-northeast-multispecies.
Holland DS, Pinto da Silva P, Wiersma J. 2010. A survey of social capital and attitudes toward management in the New England groundfish fishery. US Dept Commer, Northeast Fish Sci Cent Ref Doc. 10-12; 13 p. Available from: National Marine Fisheries Service, 166 Water Street, Woods Hole, MA 02543-1026, or online at http://www.nefsc.noaa.gov/nefsc/publications/
Kitts A, Bing-Sawyer E, Walden J, Demarest C, McPherson M, Christman P, Steinback S, Olson J, Clay P. 2011. 2010 Final Report on the Performance of the Northeast Multispecies (Groundfish) Fishery (May 2010–April 2011). US Dept Commer, Northeast Fish Sci Cent Ref Doc. 11- 19; 97 p. Available from: National Marine Fisheries Service, 166 Water Street, Woods Hole, MA 02543-1026, or online at http://www.nefsc.noaa.gov/nefsc/publications/
Kitts A, Demarest C. 2013. Impact of quota trading on net revenues in the Northeast U.S. groundfish fishery. US Dept Commer, Northeast Fish Sci Cent Ref Doc. 13-19; 24 p. Available from: National Marine Fisheries Service, 166 Water Street, Woods Hole, MA 02543-1026, or online at http://nefsc.noaa.gov/publications/
Murphy, T, Kitts A, Records D, Demarest C, Caless D, Walden J, Benjamin S. 2014. 2012 Final Report on the Performance on the Northeast Multipsecies (Groundfish) Fishery (May 2012-April 2013). US Dept Commer, Northeast Fish Sci Cent Ref Doc. 14-01; 111 p. Available from: National Marine Fisheries Service, 166 Water Street, Woods Hole, MA 02543-1026, or online at http://nefsc.noaa.gov/publications
44

Murphy T, Kitts A, Records D, Demarest C, McPherson M, Walden J, Caless D, Bing-Sawyer, E, Steinbeck S, Olson, J. 2012. 2011 Final Report on the Performance of the Northeast Multispecies (Groundfish) Fishery (May 2011-April 2012). US Dept Commer, Northeast Fish Sci Cent Ref Doc. 12-30; 111 p. Available from: National Marine Fisheries Service, 166 Water Street, Woods Hole, MA 02543-1026, or online at http://nefsc.noaa.gov/publications
O'Donnell, C. 2012. Nonparametric estimates of the components of productivity and profitability change in U.S. Agriculture. American Journal of Agricultural Economics. 94(4):873-890.
Plante J. 2010. Scientists study ‘human dimensions’ of sectors. IFQs, catch shares; industry participation needed. Commercial Fisheries News (Vol. 37(8), April 2010):13A-15A.
Walden JB and Kitts, N. 2014. Measuring fishery profitability: An index number approach. Mar. Policy (Vol. 43, 2014): 321-326.
45

Table 2. Total landings and revenue from all trips by fishing year in 2010 dollars (May through April).
2010 2011 2012 2013 Landed pounds Groundfish 58,712,494
62,284,826
47,424,690
42,247,934
Non-groundfish 174,196,562
212,298,102
213,059,587
214,153,861
Total pounds 232,909,055
274,582,928
260,484,276
256,401,794
Gross revenue
Groundfish $83,212,207
$88,821,349
$67,815,297
$55,220,469 ($58,662,972)*
Non-groundfish $210,068,225
$235,565,188
$228,136,612
$214,665,116 ($227,826,279)*
Total revenue $293,280,432
$324,386,537
$295,951,909
$269,885,585 ($286,489,251)*
*Nominal revenue observed during Fishing Year 2013.
Table 3. Total landings and revenue from groundfish trips by fishing year in 2010 dollars (May through April). 2010 2011 2012 2013 Landed pounds Groundfish 58,601,455
62,143,119
47,364,684
42,111,095
Non-groundfish 23,509,706
29,041,581
27,229,162
19,130,060
Total pounds 82,111,161
91,184,700
74,593,845
61,241,154
Gross revenue Groundfish $83,000,074
$88,607,816
$67,696,520
$55,019,495 ($58,450,407)*
Non-groundfish $23,642,678
$32,147,825
$25,079,842
$20,520,806 ($21,808,010)*
Total revenue $106,642,752
$120,755,641
$92,776,361
$75,540,301 ($80,258.417)*
*Nominal revenue observed during Fishing Year 2013.
46

Table 4. Value of landings of all species by state and port of landing in 2010 dollars (May through April, all trips).
Year
2010 2011 2012 2013
CT $4,246,144 $6,169,104 $8,091,481 $6,757,518 MA
$174,589,461 $189,381,399 $171,073,134 $149,104,959
Boston $14,256,167 $14,793,639 $13,284,054 $12,596,717
Chatham $7,517,554 $9,043,833 $7,201,796 $8,191,933
Gloucester $39,757,158 $41,828,764 $31,205,117 $24,984,618
New Bedford $95,961,563 $107,163,999 $100,959,970 $87,296,563
ME $18,587,107 $18,645,886 $19,573,998 $19,995,153 Portland $6,313,342 $7,453,147 $8,604,026 $8,778,867 NH $6,887,782 $7,097,046 $6,380,940 $4,689,026 NJ $24,229,437 $27,800,599 $24,280,675 $22,006,978 NY $21,282,602 $24,106,213 $19,810,732 $18,845,430 RI
$30,170,953 $36,227,518 $32,541,475 $36,822,343
Point Judith $21,991,734 $27,519,053 $23,896,728 $28,596,713 Other northeast $13,286,946 $14,958,772 $14,199,474 $11,664,178 Grand total $293,280,432 $324,386,537 $295,951,909 $269,885,585
47

Table 5. Value of landings of all species by home port state and home port in 2010 dollars (May through April, all trips). Year
2010 2011 2012 2013
CT $5,515,379 $5,085,112 $8,329,949 $6,817,046 MA
$149,946,395 $165,503,709 $145,917,354 $128,562,025
Boston $27,803,770 $30,929,740 $26,414,256 $25,076,521
Chatham $6,543,196 $8,778,586 $6,646,084 $8,084,896
Gloucester $25,015,205 $25,774,072 $21,607,974 $17,061,297
New Bedford $65,406,417 $76,494,750 $67,888,103 $58,106,043
ME $31,061,741 $29,040,848 $27,771,726 $26,995,809 Portland $12,938,363 $12,695,514 $12,227,725 $12,920,759 NH $7,634,093 $8,896,972 $7,737,096 $5,576,581 NJ $20,211,389 $23,851,230 $23,334,353 $22,942,830 NY $27,207,444 $31,533,165 $27,170,328 $24,643,605 RI
$35,061,646 $40,586,395 $35,815,458 $37,134,829
Point Judith $22,842,686 $27,762,773 $24,938,545 $26,020,480 Other northeast Grand total $293,280,432 $324,386,537 $295,951,909 $269,885,585
48

Table 6. Value of landings of groundfish by state and port of landing in 2010 dollars (May through April, all trips).
Year
2010 2011 2012 2013
CT $13,137 $44,560 $82,873 $184,240 MA
$73,671,591 $76,633,416 $55,506,053 $44,648,779
Boston $11,661,314 $12,064,159 $11,121,976 $9,753,199
Chatham $2,183,625 $2,345,928 $961,530 $728,407
Gloucester $27,596,823 $29,092,289 $20,550,322 $14,526,481
New Bedford $29,582,817 $29,997,596 $20,839,177 $18,536,412
ME $4,367,902 $5,890,905 $6,931,013 $5,710,957 Portland $3,460,410 $4,785,284 $5,969,853 $5,332,779 NH $3,253,516 $4,197,821 $3,270,138 $1,943,364 NJ $24,424 $20,896 $31,178 $109,804 NY $250,364 $79,792 $199,337 $406,247 RI
$1,628,724 $1,953,638 $1,790,615 $2,193,031
Point Judith $1,527,139 $1,885,458 $1,679,575 $2,136,796 Other northeast $2,549 $321 $4,090 $24,047 Grand total $83,212,207 $88,821,349 $67,815,297 $55,220,469
49

Table 7. Value of landings of groundfish by home port state and home port in 2010 dollars (May through April, all trips). Year
2010 2011 2012 2013
CT $54,954 $46,223 $14,323 $89,374 MA
$59,477,841 $64,685,602 $47,201,219 $37,261,666
Boston $14,390,501 $17,044,798 $12,618,292 $10,669,292
Chatham $2,383,667 $2,505,353 $908,143 $761,763
Gloucester $16,760,020 $16,577,609 $13,626,151 $9,405,690
New Bedford $18,560,255 $20,660,631 $14,904,361 $12,737,765
ME $14,824,210 $14,911,294 $13,919,198 $12,095,470 Portland $10,555,550 $10,072,947 $9,327,106 $9,769,036 NH $3,686,739 $4,523,269 $3,403,986 $2,343,622 NJ $308,814 $119,975 $52,638 $150,753 NY $1,087,002 $1,363,256 $689,824 $819,696 RI
$3,228,340 $2,813,325 $2,411,816 $2,458,914
Point Judith $2,392,304 $1,973,667 $1,785,119 $1,924,705 Other northeast $544,307 $358,405 $122,293 $974 Grand total $83,212,207 $88,821,349 $67,815,297 $55,220,469
50

Table 8. Value and landed pounds of nine allocated groundfish species* landed by limited access groundfish vessels in 2010 dollars (May through April).
2010 2011 2012 2013 Cod $26,573,066 $30,236,713 $16,172,681 $8,979,056 (Gadus morhua) 12,262,873 14,087,428 6,712,286 4,253,603 Haddock $20,748,828 $13,710,341 $5,056,493 $7,400,094 (Melanogrammus aeglefinus) 16,764,144 8,362,011 2,207,766 5,539,663 Pollack $10,016,879 $12,775,856 $12,208,201 $10,072,341 (Polloachius virens) 10,782,448 14,688,806 12,355,472 9,338,492 Flounder, winter/blackback $6,512,782 $7,987,891 $9,115,854 $9,196,020 (Pseudopleuronectes americanus) 3,250,682 4,575,168 4,810,480 5,903,133 Hake, white $4,922,117 $6,088,622 $6,671,044 $5,482,136 (Urophycis tenius) 3,756,444 4,995,746 4,007,645 3,339,517 Flounder, American plaice/dab $4,354,985 $4,434,255 $4,761,868 $4,311,210 (Hippoglossoides platessoides) 2,996,656 3,207,949 3,009,434 2,844,970 Flounder, yellowtail $3,920,015 $5,710,594 $4,623,207 $2,534,117 (Limanda ferruginea) 3,051,267 4,593,247 3,235,539 1,708,571 Red fish/ocean perch $2,503,400 $3,700,763 $5,218,199 $4,011,464 (Sebastes fascistus) 4,349,131 5,652,060 9,039,607 7,963,113 Flounder, witch/gray sole $3,568,962 $4,009,148 $3,807,197 $3,035,631 (Glyptocephalus cynoglossus) 1,480,937 2,091,554 2,021,189 1,329,922
*Sorted descending by average value over four years.
51

Table 9. Value and landed pounds of top ten non-groundfish species* landed by limited access groundfish vessels in 2010 dollars (May through April).
2010 2011 2012 2013 Scallop, sea $71,699,448 $87,072,183 $85,941,585 $72,628,109 (Patinopecten, Placopecten sp) 8,386,413 8,932,359 8,927,791 6,560,442 Lobster $33,699,437 $28,798,902 $30,391,319 $32,627,661 (Homarus americanus) 8,741,590 7,528,478 8,671,539 8,754,820 Squid (loligo) $17,854,326 $19,476,221 $22,410,888 $23,766,122 (Loligo pealei) 16,416,005 15,543,359 21,173,022 23,611,348 Monkfish $16,019,859 $21,972,900 $15,280,377 $13,049,187 (Lophius americanus) 6,640,699 8,526,702 7,123,044 6,630,836 Summer flounder (fluke) $16,227,158 $17,209,527 $16,891,923 $15,592,668 (Paralichthys dentatus) 8,551,465 7,908,250 7,173,530 6,215,170 Hake, silver $11,051,634 $10,609,876 $9,290,941 $8,410,610 (Merluccius bilinearis) 17,430,124 16,414,805 14,565,440 14,142,923 Herring, Atlantic $2,845,177 $6,324,508 $6,994,590 $8,505,272 (Clupea harengus) 23,380,018 55,793,882 55,587,214 69,240,518 Scup $4,674,801 $6,731,016 $6,154,152 $5,912,392 (Stenotomus chrysops) 7,882,750 10,485,086 11,460,313 10,685,904 Skates (rack) $5,426,448 $6,596,156 $5,063,579 $5,501,257 (Rajidae) 17,166,849 20,391,373 18,186,473 17,152,334 Crab, Jonah $2,573,064 $2,289,476 $4,129,199 $4,413,045 (Cancer borealis) 4,609,299 3,380,674 6,052,037 8,261,757
*Sorted descending by average value over four years.
52

Table 10. Number of vessels by fishing year (May through April). 2010 2011 2012 2013
As of May 1 Each Fishing Year:
Total groundfish limited access eligibilities
1,441 1,422 1,408 1,380
Eligibilities held as Confirmation of Permit History
94 168 228 273
During any part of the fishing year:*
Total eligible vessels 1,409 1,321 1,223 1,154
Eligible vessels that did not renew a limited access groundfish permit
26 42 46 35
Vessels with a limited access groundfish permit
1,383 1,279 1,177 1,119
While under a limited access groundfish permit:
... those with revenue from any species**
855 777 763 735
... those with revenue from at least one groundfish trip
446 418 400 327
... those with no landings 529 502 414 384 Percent of inactive (no landings) vessels
(38%) (39%) (35%) (34%)
*On May 1 of the fishing year the number of vessels will equal to the number of eligibilities not in Confirmation of Permit History (CPH). Over time the number of vessels will differ from the number of eligibilities because these eligibilities can be transferred from vessel to vessel during the fishing year. These numbers exclude groundfish limited access eligibilities held as CPH. Starting in 2010, Amendment 16 authorized CPH owners to join sectors and to lease DAS. For purposes of comparison, CPH vessels are not included in the data for either sector or common pool. **Active vessels in this report received revenue from any species while fishing under a limited access groundfish permit.
53

Table 11. Number of vessels with revenue from any species (all trips) by home port state.
Fishing Year
2010 2011 2012 2013
Home port state/city CT 11 11 10 10 MA
423 378 371 355
Boston 52 45 47 46
Chatham 43 38 38 35
Gloucester 107 92 88 83
New Bedford 69 69 69 66
ME 101 88 95 87 Portland 16 16 18 17 NH 50 45 41 38 NJ 56 48 46 47 NY 93 91 87 82 RI
86 82 77 78
Point Judith 45 44 44 45 Other northeast 34 34 36 38 Grand total* 855 777 763 735
* Note: State vessel counts may exceed the grand total vessel count because vessels may change home port during the fishing year.
54

Table 12. Number of vessels with revenue from at least one groundfish trip by home port state.
Fishing Year
2010 2011 2012 2013
Home port state/city CT 7 5 5 5 MA
238 222 206 172
Boston 35 30 28 25
Chatham 26 25 23 20
Gloucester 75 69 61 53
New Bedford 33 37 36 31
ME 42 48 51 39 Portland 14 15 16 14 NH 32 28 25 25 NJ 21 17 10 10 NY 40 42 42 29 RI
55 48 54 44
Point Judith 31 28 33 30 Other northeast 12 7 7 3 Grand total* 446 418 400 327
* Note state vessel counts may exceed the grand total vessel count because vessels may change home port during the fishing year.
55

Table 13. Number of vessels with revenue from any species by vessel size category. Fishing Year
2010 2011 2012 2013
Less than 30' 65 51 49 51 30' to <50' 459 403 398 384 50' to <75' 218 212 205 193 75' and above 113 111 111 107 Grand total 855 777 763 735
Table 14. Number of vessels with revenue from at least one groundfish trip by vessel size category. Fishing Year
2010 2011 2012 2013 Less than 30' 24 20 16 17 30' to <50' 242 218 207 159 50' to <75' 121 119 117 102 75' and above 59 61 60 49 Grand total 446 418 400 327
56

Table 15. Effort by active vessels (May through April).
2010 2011 2012 2013 Less than 30'
Number of groundfish trips 136 275 187 102
Number of non-groundfish trips 1,465 1,161 1,105 1,243
Number of days absent on groundfish trips 61 102 70 41
Number of days absent on non-groundfish trips 470 376 335 409
Average trip length on groundfish trips * 0.45 0.37 0.38 0.40
(standard deviation) (0.13) (0.12) (0.13) (0.19)
Average trip length on non-groundfish trips * 0.33 0.33 0.32 0.34
(standard deviation) (0.14) (0.11) (0.11) (0.37)
30' to <50'
Number of groundfish trips 9,593 11,343 9,888 6,262
Number of non-groundfish trips 23,726 20,476 20,681 21,337
Number of days absent on groundfish trips 5,484 6,724 6,046 4,773
Number of days absent on non-groundfish trips 9,361 8,187 8,511 8,865
Average trip length on groundfish trips* 0.57 0.59 0.61 0.76
(standard deviation) (0.66) (0.71) (0.75) (0.91)
Average trip length on non-groundfish trips* 0.43 0.42 0.43 0.43
(standard deviation) (0.36) (0.36) (0.32) (0.33)
57

Table 15 (continued). Effort by active vessels (May through April). 2010 2011 2012 2013 50' to <75'
Number of groundfish trips 2,909 3,328 3,179 2,712
Number of non-groundfish trips 11,074 9,938 9,105 8,757
Number of days absent on groundfish trips 6,456 7,581 6,858 5,946
Number of days absent on non-groundfish trips 12,888 11,807 12,293 12,511
Average trip length on groundfish trips* 2.23 2.28 2.16 2.19
(standard deviation) (2.55) (2.63) (2.52) (2.61)
Average trip length on non-groundfish trips* 1.18 1.20 1.36 1.44
(standard deviation) (1.68) (1.71) (1.89) (1.92)
75' and above
Number of groundfish trips 1,221 1,192 1,074 980
Number of non-groundfish trips 2,242 2,152 2,133 1,980
Number of days absent on groundfish trips 6,736 7,489 6,866 6,253
Number of days absent on non-groundfish trips 8,636 7,663 8,013 7,655
Average trip length on groundfish trips* 5.53 6.29 6.40 6.38
(standard deviation) (2.89) (2.91) (2.84) (2.57)
Average trip length on non-groundfish trips* 3.94 3.60 3.79 3.91
(standard deviation) (3.58) (3.26) (3.35) (3.14)
58

Table 15 (continued). Effort by active vessels (May through April).
2010 2011 2012 2013 All vessels
Number of groundfish trips 13,859 16,138 14,328 10,056
Number of non-groundfish trips 38,507 33,727 33,024 33,317
Number of days absent on groundfish trips 18,737 21,895 19,839 17,013
Number of days absent on non-groundfish trips 31,354 28,032 29,151 29,439
Average trip length on groundfish trips* 1.35 1.36 1.39 1.69
(standard deviation) (2.13) (2.19) (2.20) (2.40)
Average trip length on non-groundfish trips* 0.86 0.86 0.91 0.90
(standard deviation) (1.56) (1.52) (1.60) (1.56)
*This is the average trip length of all individual trips that have non-missing values for days absent. Since some trip records have missing values for days absent, average trip length reported here may be higher than what is obtained by dividing the overall number of days absent by the overall number of trips.
59

Table 16. Average revenue per active vessel in 2010 dollars (May through April).* 2010 2011 2012 2013 Less than 30'
Average all species revenue per vessel on groundfish trips $7,446 $9,507 $12,686 $1,475
(standard deviation) ($28,367) ($20,543) ($29,501) ($1,983)
Average all species revenue per vessel on non-groundfish trips $13,979 $13,903 $14,719 $17,192
(standard deviation) ($34,512) ($43,348) ($26,461) ($37,321)
30' to <50'
Average all species revenue per vessel on groundfish trips $112,320 $147,628 $117,424 $101,394
(standard deviation) ($121,668) ($154,093) ($132,725) ($125,646)
Average all species revenue per vessel on non-groundfish trips $95,142 $98,110 $99,009 $116,068
(standard deviation) ($108,197) ($111,409) ($114,915) ($166,839)
50' to <75'
Average all species revenue per vessel on groundfish trips $299,414 $348,966 $267,111 $263,545
(standard deviation) ($384,592) ($421,902) ($332,709) ($323,755)
Average all species revenue per vessel on non-groundfish trips $370,298 $436,892 $448,956 $469,878
(standard deviation) ($387,618) ($447,841) ($428,505) ($374,452)
75' and above
Average all species revenue per vessel on groundfish trips $729,720 $768,126 $616,910 $663,509
(standard deviation) ($606,834) ($614,198) ($505,568) ($483,992)
Average all species revenue per vessel on non-groundfish trips $949,105 $1,111,132 $1,120,652 $1,049,685
(standard deviation) ($644,555) ($725,591) ($748,854) ($627,187)
*Mean values should be taken in context with standard deviations, as some standard deviations are relatively high.
60

Table 17. Lowe Index (2007=1) of productivity change for the limited access groundfish fleet.
Year Output index Input index Lowe Index 2007 1.00 1.00 1.00 2008 1.05 0.91 1.15 2009 1.03 0.84 1.23 2010 0.75 0.63 1.19 2011 0.82 0.73 1.13 2012 0.64 0.68 0.94 2013 0.58 0.60 0.96
Table 18. Number of MRIs leasing ACE and/or PSC and amount of live pounds caught by home port state.
Home port state/city
2010 2011 2012 2013 N Live pounds n Live pounds n Live pounds n Live pounds
CT 2 15,322 1 8,310 1 1,052 2 5,252 MA
181 16,349,529 161 22,144,700 152 15,128,969 136 13,658,507
Boston 31 3,233,604 32 5,802,828 25 4,394,488 22 3,631,275
Chatham 28 726,842 19 871,421 17 291,007 18 245,335
Gloucester 55 3,595,418 50 4,642,813 47 2,780,006 41 2,750,273
New Bedford 29 7,016,315 32 8,573,384 32 6,265,619 28 5,834,956
ME 36 4,451,744 41 5,706,207 38 6,417,131 35 5,820,023
Portland 13 3,303,341 12 4,046,493 12 5,084,771 15 4,666,279
NH 22 821,597 19 1,759,428 15 864,024 14 696,135 NJ 1 3,703 . . 1 44,770 1 11,479 NY 6 90,570 5 171,066 5 183,985 7 218,271 RI
29 895,404 26 997,007 30 681,869 28 570,168
Point Judith 25 770,587 22 850,898 25 507,515 22 387,408
Other northeast 5 39,159 3 31,301 0 - 1 89 Grand total 282 22,663,326 256 30,818,018 242 23,277,030 224 20,968,444
61
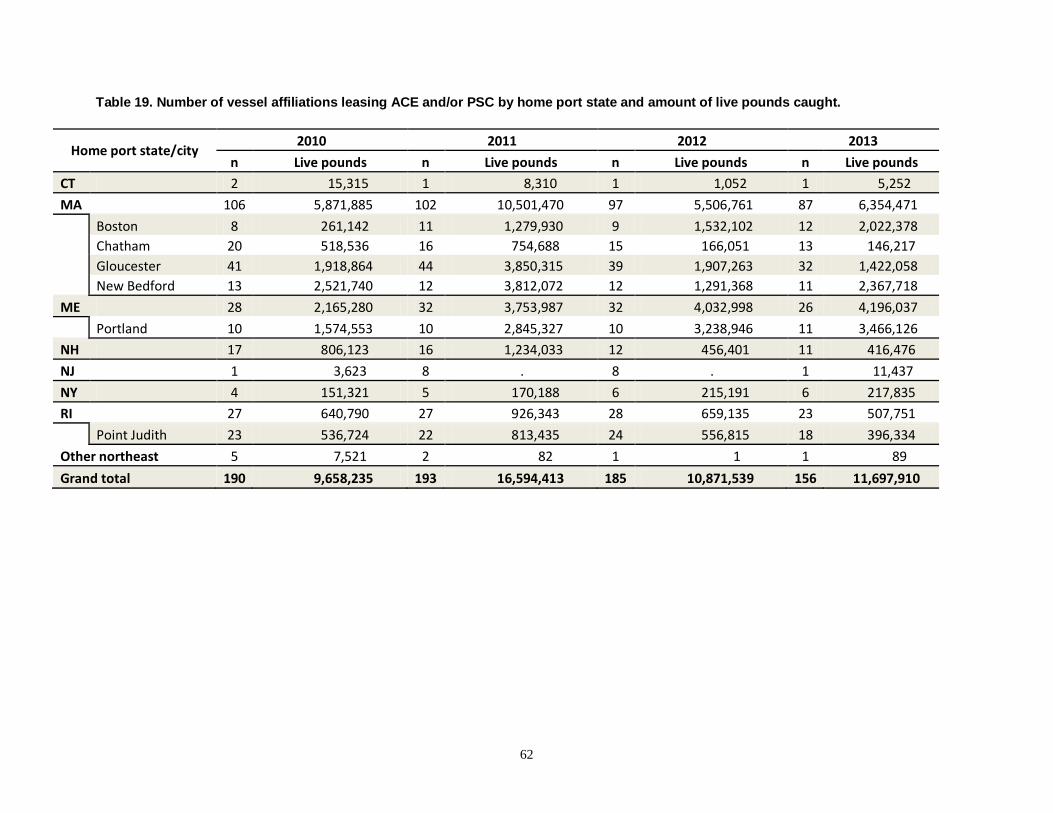
Table 19. Number of vessel affiliations leasing ACE and/or PSC by home port state and amount of live pounds caught.
Home port state/city 2010 2011 2012 2013
n Live pounds n Live pounds n Live pounds n Live pounds CT 2 15,315 1 8,310 1 1,052 1 5,252 MA
106 5,871,885 102 10,501,470 97 5,506,761 87 6,354,471
Boston 8 261,142 11 1,279,930 9 1,532,102 12 2,022,378
Chatham 20 518,536 16 754,688 15 166,051 13 146,217
Gloucester 41 1,918,864 44 3,850,315 39 1,907,263 32 1,422,058
New Bedford 13 2,521,740 12 3,812,072 12 1,291,368 11 2,367,718
ME 28 2,165,280 32 3,753,987 32 4,032,998 26 4,196,037
Portland 10 1,574,553 10 2,845,327 10 3,238,946 11 3,466,126
NH 17 806,123 16 1,234,033 12 456,401 11 416,476 NJ 1 3,623 8 . 8 . 1 11,437 NY 4 151,321 5 170,188 6 215,191 6 217,835 RI
27 640,790 27 926,343 28 659,135 23 507,751
Point Judith 23 536,724 22 813,435 24 556,815 18 396,334
Other northeast 5 7,521 2 82 1 1 1 89 Grand total 190 9,658,235 193 16,594,413 185 10,871,539 156 11,697,910
62

Table 20. Number of lessee MRIs by vessel size category.
Vessel size category 2010 2011 2012 2013 <30' 3 6 5 4 30'to <50' 138 114 107 102 50' to <75' 83 80 77 78 75' plus 58 56 53 40 Grand total 282 256 242 224
63

Table 21. ACE and PSC lease markets by stock (live pounds).
2010 2011 2012 2013
Lessor
availability1 Lessee
requirement2 Lessor
availability1 Lessee
requirement2 Lessor
availability1 Lessee
requirement2 Lessor
availability1 Lessee
requirement2 Cod, GB East 529,418 374,586 309,342 235,587 284,649 81,703 165,154 39,219
Cod, GB West 4,247,221 3,176,679 6,702,629 3,775,453 8,047,078 1,038,248 2,710,938 2,274,608 Cod, GOM 5,426,792 3,877,575 6,868,627 5,166,943 6,298,793 2,216,656 1,271,778 1,049,800
Haddock, GB East 22,586,599 446,814 18,795,585 9,984 14,317,198 20,319 7,084,327 111,079 Haddock, GB West 49,427,505 1,078,499 44,580,541 172,746 47,625,663 32,867 44,970,813 339,080
Haddock, GOM 1,335,849 393,712 1,337,940 584,208 1,473,974 200,919 279,630 235,771 Plaice 4,243,830 1,491,631 5,171,690 1,674,756 5,488,861 1,512,758 2,216,450 2,176,449
Pollock 26,886,808 3,063,035 21,973,748 5,920,571 20,848,885 5,189,019 21,793,914 3,881,805 Redfish 11,663,286 1,416,648 13,711,013 2,274,642 14,832,154 4,866,474 18,251,507 4,579,781
White hake 3,560,086 2,725,332 4,210,810 4,100,427 4,863,407 2,766,000 6,193,361 2,162,071 Winter flounder, GB 2,647,934 1,665,791 3,050,907 2,607,884 5,477,569 2,019,563 5,598,104 1,589,178
Winter flounder, GOM 211,445 95,892 545,772 138,177 1,227,349 227,694 1,287,291 123,914
Winter flounder, SNE not allocated not allocated not allocated 1,428,570 538,552
Witch flounder 1,081,383 785,473 1,774,673 1,113,744 2,217,827 1,047,772 892,859 958,190 Yellowtail flounder,
CC/GOM 1,155,906 816,783 1,543,747 1,101,034 1,754,209 1,388,444 764,148 551,884 Yellowtail flounder,
GB 1,053,098 908,610 1,674,587 1,330,464 620,971 289,240 285,132 71,511 Yellowtail flounder,
SNE 360,950 184,240 664,759 492,396 865,677 424,123 760,207 297,031 Grand total 136,418,109 22,501,300 132,916,369 30,699,015 136,244,264 23,321,801 115,954,183 20,979,923 1 Sum of uncaught ACE 2 Difference between summed catch and allocated ACE
64
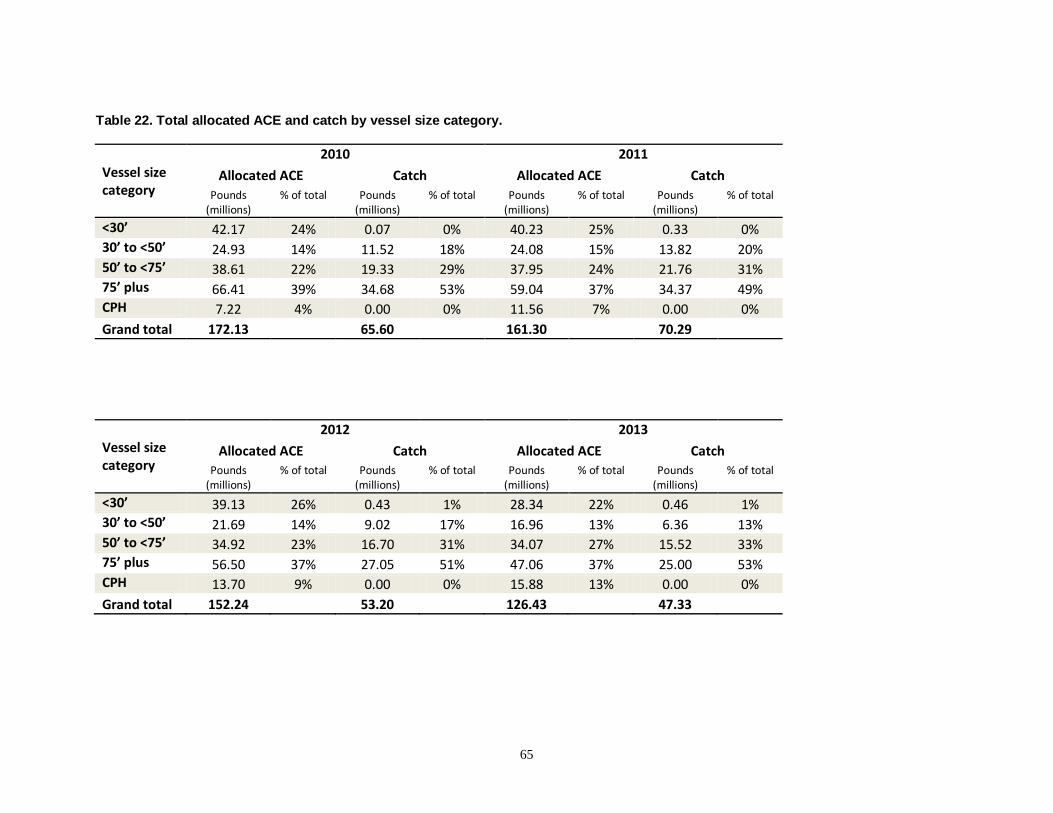
Table 22. Total allocated ACE and catch by vessel size category.
Vessel size category
2010 2011 Allocated ACE Catch Allocated ACE Catch
Pounds (millions)
% of total Pounds (millions)
% of total Pounds (millions)
% of total Pounds (millions)
% of total
<30’ 42.17 24% 0.07 0% 40.23 25% 0.33 0% 30’ to <50’ 24.93 14% 11.52 18% 24.08 15% 13.82 20% 50’ to <75’ 38.61 22% 19.33 29% 37.95 24% 21.76 31% 75’ plus 66.41 39% 34.68 53% 59.04 37% 34.37 49% CPH 7.22 4% 0.00 0% 11.56 7% 0.00 0% Grand total 172.13 65.60 161.30 70.29
Vessel size category
2012 2013 Allocated ACE Catch Allocated ACE Catch
Pounds (millions)
% of total Pounds (millions)
% of total Pounds (millions)
% of total Pounds (millions)
% of total
<30’ 39.13 26% 0.43 1% 28.34 22% 0.46 1% 30’ to <50’ 21.69 14% 9.02 17% 16.96 13% 6.36 13% 50’ to <75’ 34.92 23% 16.70 31% 34.07 27% 15.52 33% 75’ plus 56.50 37% 27.05 51% 47.06 37% 25.00 53% CPH 13.70 9% 0.00 0% 15.88 13% 0.00 0% Grand total 152.24 53.20 126.43 47.33
65

Table 23. Volume of between-sector ACE leases by stock (live pounds).
2010 2011 2012 2013 Cod, GB East 142,288 156,942 127,868 68,240 Cod, GB West 2,146,442 2,820,067 2,081,174 1,310,825
Cod, GOM 2,115,195 2,761,229 1,668,205 618,557 Haddock, GB East 945,811 379,447 1,424,883 355,071
Haddock, GB West 1,787,990 1,280,964 3,568,405 2,417,139 Haddock, GOM 510,807 652,228 334,813 145,986
Plaice 799,484 663,883 1,409,387 1,459,503 Pollock 3,240,773 3,394,683 3,416,419 2,708,020 Redfish 1,139,517 514,264 2,441,332 3,383,254
White hake 1,409,496 2,332,818 1,845,375 947,017 Winter flounder, GB 247,090 468,090 798,058 593,875
Winter flounder, GOM 78,819 107,651 259,306 63,203
Winter flounder, SNE Not
allocated Not
allocated Not
allocated 461,606 Witch flounder 392,939 710,804 871,991 445,218
Yellowtail flounder, CC/GOM 376,961 677,170 835,732 418,501 Yellowtail flounder, GB 249,780 596,918 295,780 53,361
Yellowtail flounder, SNE 104,581 330,248 503,397 327,285 Grand total 15,687,973 17,847,406 21,882,125 15,776,661
66

Table 24. Number of between-sector ACE lease transactions, by month and fishing year. 2010 2011
Month Number of
leases
Number of leases with
compensation reported
Number of leases
validated for model
Number of leases
Number of leases with
compensation reported
Number of leases
validated for model
May . . . 125 125 37 June 30 . . 107 107 74 July 138 17 2 72 72 32 August 59 . . 171 171 98 September 67 . . 70 70 47 October 127 25 7 140 140 109 November 65 65 12 75 75 62 December 101 101 23 118 118 73 January 70 70 37 140 140 105 February 115 115 63 111 111 78 March 93 93 64 151 151 105 April 82 82 56 84 84 76 Grand total 947 568 264 1,364 1,364 896
67

Table 24 (continued). Number of between-sector ACE lease transactions, by month and fishing year. 2012 2013
Month Number of
leases
Number of leases with
compensation reported
Number of leases
validated for model
Number of leases
Number of leases with
compensation reported
Number of leases
validated for model
May 81 80 52 100 100 35 June 124 124 72 237 237 204 July 179 179 64 171 171 97 August 147 147 108 157 157 80 September 64 64 47 47 47 24 October 109 109 88 96 96 60 November 62 62 45 49 49 39 December 110 110 93 85 85 55 January 53 53 36 142 142 105 February 63 63 25 47 47 36 March 51 51 33 41 41 36 April 17 17 12 52 52 47 Grand total 1,060 1,059 675 1,224 1,224 818
68

Table 25. ACE lease prices from hedonic model.
2010 2011 2012 2013 Lease value
change Value Standard
error Value Standard
error Value Standard
error Value Standard
error
Cod, GB East $1.03 0.15 *** $1.25 0.15 *** $2.48 0.38 *** $0.00 . Cod, GB West $0.85 0.03 *** $0.65 0.01 *** $0.44 0.03 *** $0.36 0.02 *** -17%
Cod, GOM $1.06 0.04 *** $1.10 0.02 *** $0.68 0.03 *** $1.22 0.06 *** 79% Haddock, GB East $0.00 .
$0.00 .
$0.00 .
$0.00 .
Haddock, GB West $0.00 . $0.00 . $0.00 . $0.00 . Haddock, GOM $0.87 0.04 *** $0.39 0.05 *** $0.36 0.13 *** $0.58 0.12 *** 63%
Plaice $0.37 0.07 *** $0.00 $0.00 $0.14 0.01 *** Pollock $0.00
$0.06 0.01 *** $0.05 0.02 ** $0.00 .
Redfish $0.00 $0.24 0.06 *** $0.03 0.01 *** $0.00 . White hake $0.38 0.03 *** $0.45 0.02 *** $0.69 0.03 *** $0.14 0.02 *** -79%
Winter flounder, GB $0.00 $0.76 0.07 *** $0.58 0.03 *** $0.26 0.02 *** -55% Winter flounder, GOM $0.00
$0.70 0.24 *** $0.36 0.10 *** $0.00 .
-100%
Winter flounder, SNE not
allocated
not allocated
not allocated $0.43 0.03 ***
Witch flounder $1.23 0.17 *** $0.63 0.07 *** $0.70 0.06 *** $0.63 0.06 *** -9% Yellowtail flounder,
CC/GOM $0.53 0.15 *** $0.41 0.06 *** $0.63 0.06 *** $0.71 0.06 *** 11% Yellowtail flounder, GB $0.93 0.32 *** $0.23 0.05 *** $0.97 0.11 *** $0.00 .
Yellowtail flounder, SNE $0.85 0.18 *** $0.36 0.11 *** $0.76 0.07 *** $0.39 0.06 *** -49%
Observations 171
502
306
408 R-squared 0.9
0.93
0.91
0.94
1Premium or discount per pound of fish traded ***p <0.01
69
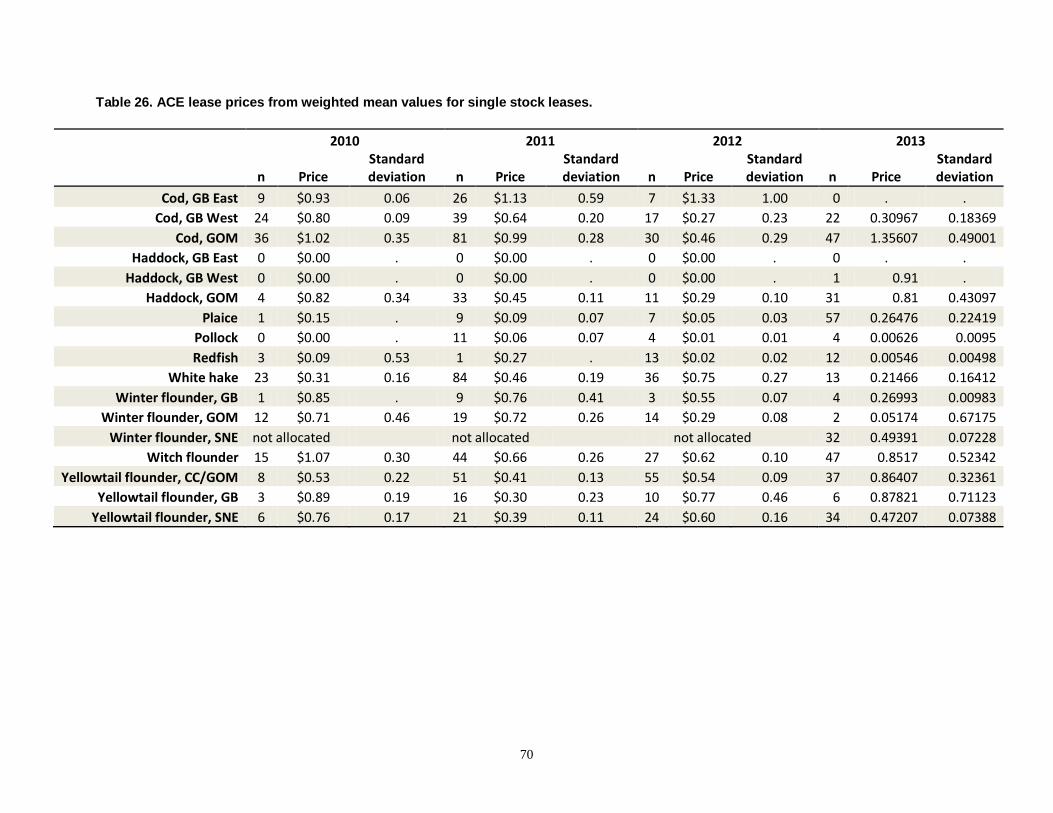
Table 26. ACE lease prices from weighted mean values for single stock leases.
2010 2011 2012 2013
n Price Standard deviation n Price
Standard deviation n Price
Standard deviation n Price
Standard deviation
Cod, GB East 9 $0.93 0.06 26 $1.13 0.59 7 $1.33 1.00 0 . . Cod, GB West 24 $0.80 0.09 39 $0.64 0.20 17 $0.27 0.23 22 0.30967 0.18369
Cod, GOM 36 $1.02 0.35 81 $0.99 0.28 30 $0.46 0.29 47 1.35607 0.49001 Haddock, GB East 0 $0.00 . 0 $0.00 . 0 $0.00 . 0 . .
Haddock, GB West 0 $0.00 . 0 $0.00 . 0 $0.00 . 1 0.91 . Haddock, GOM 4 $0.82 0.34 33 $0.45 0.11 11 $0.29 0.10 31 0.81 0.43097
Plaice 1 $0.15 . 9 $0.09 0.07 7 $0.05 0.03 57 0.26476 0.22419 Pollock 0 $0.00 . 11 $0.06 0.07 4 $0.01 0.01 4 0.00626 0.0095 Redfish 3 $0.09 0.53 1 $0.27 . 13 $0.02 0.02 12 0.00546 0.00498
White hake 23 $0.31 0.16 84 $0.46 0.19 36 $0.75 0.27 13 0.21466 0.16412 Winter flounder, GB 1 $0.85 . 9 $0.76 0.41 3 $0.55 0.07 4 0.26993 0.00983
Winter flounder, GOM 12 $0.71 0.46 19 $0.72 0.26 14 $0.29 0.08 2 0.05174 0.67175 Winter flounder, SNE not allocated not allocated not allocated 32 0.49391 0.07228
Witch flounder 15 $1.07 0.30 44 $0.66 0.26 27 $0.62 0.10 47 0.8517 0.52342 Yellowtail flounder, CC/GOM 8 $0.53 0.22 51 $0.41 0.13 55 $0.54 0.09 37 0.86407 0.32361
Yellowtail flounder, GB 3 $0.89 0.19 16 $0.30 0.23 10 $0.77 0.46 6 0.87821 0.71123 Yellowtail flounder, SNE 6 $0.76 0.17 21 $0.39 0.11 24 $0.60 0.16 34 0.47207 0.07388
70

Table 27. Ex-vessel and ACE lease prices.
2010 2011 2012 2013
Ex-vessel price
ACE lease price
ACE lease /
Ex-vessel
Ex-vessel price
ACE lease price
ACE
lease/ Ex-vessel
Ex-vessel price
ACE lease price
ACE lease/
Ex-vessel
Ex-vessel price
ACE lease price
ACE lease/
Ex-vessel
Cod, GB East $2.14 $1.03 48% $2.18 $1.25 57% $1.08 $2.48 228% $2.23 . Cod, GB West $2.14 $0.85 40% $2.18 $0.65 30% $1.93 $0.44 23% $2.23 $0.36 16%
Cod, GOM $1.89 $1.06 56% $2.26 $1.10 49% $1.95 $0.68 35% $3.14 $1.22 39% Haddock, GB East $1.23
$1.65
$1.47
$1.40 .
Haddock, GB West $1.23 $1.65 $1.54 $1.40 . Haddock, GOM $2.43 $0.87 36% $2.60 $0.39 15% $2.04 $0.36 18% $2.58 $0.58 23%
Plaice $1.45 $0.37 26% $1.42 $1.37 $1.56 $0.14 9% Pollock $0.93
$0.89 $0.06 6% $0.87 $0.05 5% $1.15 .
Redfish $0.57 $0.65 $0.24 37% $0.42 $0.03 8% $0.53 . White hake $1.32 $0.38 28% $1.25 $0.45 36% $1.25 $0.69 55% $1.75 $0.14 8%
Winter flounder, GB $1.98 $1.76 $0.76 43% $1.96 $0.58 29% $1.65 $0.26 16% Winter flounder, GOM $1.74
$1.52 $0.70 46% $1.90 $0.36 19% $1.79 .
Winter flounder, SNE not allocated not allocated not allocated $1.32 $0.43 33% Witch flounder $2.42 $1.23 51% $1.98 $0.63 32% $1.80 $0.70 39% $2.43 $0.63 26%
Yellowtail flounder, CC/GOM $1.18 $0.53 45% $0.90 $0.41 45% $1.23 $0.63 52% $1.16 $0.71 61%
Yellowtail flounder, GB $1.28 $0.93 73% $1.25 $0.23 19% $1.40 $0.97 69% $1.12 . Yellowtail flounder, SNE $1.35 $0.85 63% $1.52 $0.36 24% $1.37 $0.76 56% $1.66 $0.39 23%
71

Table 28. Transfer payments from ACE and PSC leasing by stock at the MRI level.
2010 2011
Lessee
requirement Lease price
Estimated payment transfers
Lessee requirement
Lease price
Estimated payment transfers
Cod, GB East 374,586 $1.03 $386,293 235,587 $1.25 $294,329 Cod, GB West 3,176,679 $0.85 $2,694,905 3,775,453 $0.65 $2,445,403
Cod, GOM 3,877,575 $1.06 $4,119,463 5,166,943 $1.10 $5,678,979 Haddock, GB East 446,814 . . 9,984 . .
Haddock, GB West 1,078,497 . . 172,746 . . Haddock, GOM 393,712 $0.87 $343,693 584,208 $0.39 $225,881
Plaice 1,491,631 $0.37 $556,466 1,674,756 . . Pollock 3,063,035 . . 5,920,571 $0.06 $339,205 Redfish 1,416,646 . . 2,274,642 $0.24 $538,450
White hake 2,725,313 $0.38 $1,022,999 4,100,427 $0.45 $1,858,194 Winter flounder, GB 1,665,791 . . 2,607,884 $0.76 $1,975,129
Winter flounder, GOM 95,892 . . 138,177 $0.70 $96,158 Winter flounder, SNE not allocated not allocated
Witch flounder 785,473 $1.23 $967,481 1,113,744 $0.63 $705,849 Yellowtail flounder,
CC/GOM 816,783 $0.53 $434,532 1,101,034 $0.41 $448,837 Yellowtail flounder, GB 908,610 $0.93 $847,946 1,330,464 $0.23 $311,509
Yellowtail flounder, SNE 184,240 $0.85 $155,962 492,396 $0.36 $176,472 Grand Total 22,501,277 $11,529,740 30,699,015 $15,094,395
72

Table 28 (continued). Transfer payments from ACE and PSC leasing by stock at the MRI level.
2012 2013
Lessee
requirement Lease price
Estimated payment transfers
Lessee requirement
Lease price
Estimated payment transfers
Cod, GB East 81,703 $2.48 $202,327 39,219 . . Cod, GB West 1,038,248 $0.44 $452,956 2,274,608 $0.36 $824,104
Cod, GOM 2,216,656 $0.68 $1,516,437 1,049,800 $1.22 $1,285,907 Haddock, GB East 20,319 . . 111,079 . .
Haddock, GB West 32,867 . . 339,080 . . Haddock, GOM 200,919 $0.36 $72,071 235,771 $0.58 $137,791
Plaice 1,512,758 $0.11 $166,509 2,176,449 $0.14 $312,289 Pollock 5,189,019 $0.05 $243,881 3,881,805 . . Redfish 4,866,474 $0.03 $162,561 4,579,781 . .
White hake 2,766,000 $0.69 $1,898,863 2,162,071 $0.14 $309,849 Winter flounder, GB 2,019,563 $0.58 $1,167,701 1,589,178 $0.26 $415,529
Winter flounder, GOM 227,694 $0.36 $82,214 123,914 . . Winter flounder, SNE not allocated 538,552
Witch flounder 1,047,772 $0.70 $728,561 958,190 $0.63 $606,841 Yellowtail flounder,
CC/GOM 1,388,444 $0.63 $880,343 551,884 $0.71 $389,735 Yellowtail flounder, GB 289,240 $0.97 $279,130 71,511 . .
Yellowtail flounder, SNE 424,123 $0.76 $323,964 297,031 $0.39 $114,693 Grand total 23,321,801 $8,177,518 20,979,923 $4,396,736
73

Table 29. Transfer payments from ACE and PSC leasing by stock at the vessel affiliation level.
2010 2011
Lessee
requirement Lease price
Estimated payment transfers
Lessee requirement
Lease price
Estimated payment transfers
Cod, GB East 247,751 $1.03 $255,494 179,297 $1.25 $224,004 Cod, GB West 2,059,679 $0.85 $1,747,309 2,320,750 $0.65 $1,503,175
Cod, GOM 2,198,629 $1.06 $2,335,783 3,109,781 $1.10 $3,417,955 Haddock, GB East 16,365 . . . . .
Haddock, GB West 24,693 . . 14,785 . . Haddock, GOM 256,583 $0.87 $223,985 458,289 $0.39 $177,195
Plaice 596,783 $0.37 $222,635 728,683 . . Pollock 576,861 . . 2,140,382 $0.06 $122,628 Redfish 267,541 . . 690,876 $0.24 $163,543
White hake 1,229,415 $0.38 $461,485 2,772,252 $0.45 $1,256,304 Winter flounder, GB 558,233 . . 1,540,367 $0.76 $1,166,626
Winter flounder, GOM 61,795 . . 73,180 $0.70 $50,926 Winter flounder, SNE not allocated not allocated
Witch flounder 381,044 $1.23 $469,339 602,150 $0.63 $381,620 Yellowtail flounder,
CC/GOM 483,633 $0.53 $257,295 665,797 $0.41 $271,412 Yellowtail flounder, GB 551,879 $0.93 $515,032 938,140 $0.23 $219,652
Yellowtail flounder, SNE 141,430 $0.85 $119,724 386,551 $0.36 $138,538 Grand total 9,652,315 $6,608,080 16,621,279 $9,093,579
74

Table 29 (continued). Transfer payments from ACE and PSC leasing by stock at the vessel affiliation level.
2012 2013
Lessee
requirement Lease price
Estimated payment transfers
Lessee requirement
Lease price
Estimated payment transfers
Cod, GB East 44,543 $2.48 $110,303 16,615 . . Cod, GB West 259,930 $0.44 $113,400 1,647,186 $0.36 $596,785
Cod, GOM 1,174,006 $0.68 $803,149 825,222 $1.22 $1,010,820 Haddock, GB East . . . . . .
Haddock, GB West 6,293 . . 249,241 . . Haddock, GOM 91,366 $0.36 $32,774 170,567 $0.58 $99,684
Plaice 594,347 $0.11 $65,420 1,531,349 $0.14 $219,727 Pollock 2,185,281 $0.05 $102,707 2,074,732 . . Redfish 2,287,924 $0.03 $76,427 1,820,428 . .
White hake 1,458,158 $0.69 $1,001,028 954,411 $0.14 $136,778 Winter flounder, GB 587,844 $0.58 $339,888 640,108 $0.26 $167,372
Winter flounder, GOM 142,262 $0.36 $51,367 83,772 . . Winter flounder, SNE not allocated $0.43
Witch flounder 563,449 $0.70 $391,790 700,061 $0.63 $443,363 Yellowtail flounder,
CC/GOM 945,691 $0.63 $599,616 441,001 $0.71 $311,430 Yellowtail flounder, GB 171,736 $0.97 $165,733 47,317 . .
Yellowtail flounder, SNE 358,707 $0.76 $273,996 239,076 $0.39 $92,315 Grand total 10,871,539 $4,127,598 11,441,088 $3,078,273
75

Table 30. Transfer payments from ACE and PSC leasing by lessee home port state.
2010 2011
Home port state/city
Estimated transfer payments Estimated transfer payments
Between MRIs Between vessel affiliations Between MRIs Between vessel
affiliations
n Value n Value n Value n Value CT 2 $14,155 2 15,315 1 $3,063 1 $3,063 MA
181 $8,849,396 106 4,427,692 152 $11,806,051 97 $6,450,755
Boston 31 $1,621,326 8 198,973 25 $3,009,774 9 $675,762
Chatham 28 $550,640 20 469,406 17 $606,448 15 $580,379
Gloucester 55 $2,663,733 41 1,540,227 47 $2,599,491 39 $2,447,400
New Bedford 29 $2,666,692 13 1,666,161 32 $3,855,779 12 $2,094,084
ME 36 $1,688,192 28 1,007,729 38 $1,912,330 32 $1,388,393
Portland 13 $979,966 10 599,310 12 $1,115,736 10 $928,620
NH 22 $465,015 17 686,293 15 $814,790 12 $734,056 NJ 1 $3,178 1 3,178 1 $0 8 $0 NY 6 $28,575 4 63,985 5 $104,524 6 $104,339 RI
29 $420,251 27 398,387 30 $449,691 28 $412,935
Point Judith 25 $389,529 23 353,724 25 $387,553 24 $367,553
Other northeast 5 $30,722 5 6,661 0 $3,945 1 $37 Grand total 282 $11,496,307 190 6,590,747 242 $15,091,332 185 $9,093,579
* Vessel affiliation assigned to the state in which the majority of permits held are homeported
76

Table 30 (continued). Transfer payments from ACE and PSC leasing by lessee home port state.
2012 2013
Home port state/city
Estimated transfer payments Estimated transfer payments
Between MRIs Between vessel affiliations Between MRIs Between vessel
affiliations n Value n Value n Value n Value
CT 1 $804 1 $804 2 $0 1 $0 MA
152 $5,799,581 97 $2,366,746 136 $3,236,758 87 $2,035,064
Boston 25 $1,523,339 9 $399,074 22 $807,684 12 $438,736
Chatham 17 $131,842 15 $94,224 18 $68,126 13 $68,317
Gloucester 47 $1,130,673 39 $873,479 41 $857,478 32 $651,878
New Bedford 32 $2,241,648 12 $619,073 28 $916,238 11 $531,908
ME 38 $1,460,503 32 $1,000,172 35 $732,325 26 $678,710
Portland 12 $884,764 10 $596,745 15 $486,124 11 $460,288
NH 15 $326,637 12 $189,200 14 $218,204 11 $166,471 NJ 1 $0 8 $0 1 $3,567 1 $3,555 NY 5 $115,072 6 $132,109 7 $52,065 6 $51,956 RI
30 $450,672 28 $438,419 28 $153,789 23 $142,489
Point Judith 25 $331,519 24 $368,732 22 $104,039 18 $111,407
Other northeast 0 $0 1 $0 1 $28 1 $28 Grand total 242 $8,152,465 185 $4,127,451 224 $4,396,736 156 $3,078,273
* Vessel affiliation assigned to the state in which the majority of permits held are homeported
77

Table 31. Stock level catch, ACE, and utilization.
2010 2011
Allocated
ACE Catch % caught
Allocated ACE* Catch %
caught
Cod, GB East 717,441 562,610 78% 431,334 357,578 83% Cod, GB West 6,563,099 5,492,557 84% 9,604,207 6,727,837 70%
Cod, GOM 9,540,389 7,991,172 84% 1,242,220 9,561,153 85% Haddock, GB East 26,262,695 4,122,910 16% 21,122,565 2,336,964 11%
Haddock, GB West 62,331,182 13,982,173 22% 50,507,974 6,101,400 12% Haddock, GOM 1,761,206 819,069 47% 1,796,740 1,061,841 59%
Plaice 6,058,149 3,305,950 55% 7,084,289 3,587,356 51% Pollock 35,666,741 11,842,969 33% 32,350,451 16,297,273 50% Redfish 14,894,618 4,647,978 31% 17,369,940 5,951,045 34%
White hake 5,522,677 4,687,905 85% 6,708,641 6,598,273 98% Winter flounder, GB 4,018,496 3,036,352 76% 4,679,039 4,241,177 91%
Winter flounder, GOM 293,736 178,183 61% 750,606 343,152 46% Winter flounder, SNE Not
allocated Not
allocated Witch flounder 1,824,125 1,528,215 84% 2,839,697 2,178,941 77%
Yellowtail flounder, CC/GOM 1,608,084 1,268,961 79% 2,185,802 1,743,168 80%
Yellowtail flounder, GB 1,770,451 1,625,963 92% 2,474,662 2,176,921 88% Yellowtail flounder, SNE 517,372 340,662 66% 963,033 795,267 83%
Grand total 179,350,461 65,433,630 36% 172,111,201 70,059,346 41% *includes sector carryover
78
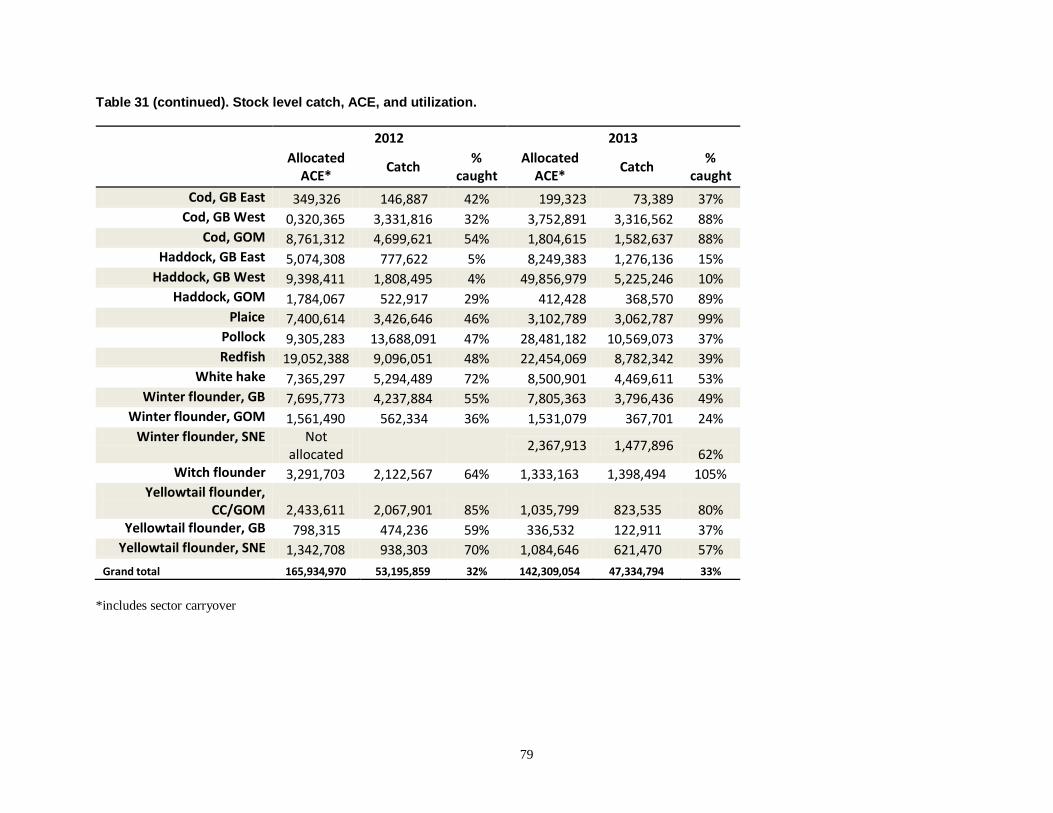
Table 31 (continued). Stock level catch, ACE, and utilization.
2012 2013
Allocated
ACE* Catch % caught
Allocated ACE* Catch %
caught Cod, GB East 349,326 146,887 42% 199,323 73,389 37%
Cod, GB West 0,320,365 3,331,816 32% 3,752,891 3,316,562 88% Cod, GOM 8,761,312 4,699,621 54% 1,804,615 1,582,637 88%
Haddock, GB East 5,074,308 777,622 5% 8,249,383 1,276,136 15% Haddock, GB West 9,398,411 1,808,495 4% 49,856,979 5,225,246 10%
Haddock, GOM 1,784,067 522,917 29% 412,428 368,570 89% Plaice 7,400,614 3,426,646 46% 3,102,789 3,062,787 99%
Pollock 9,305,283 13,688,091 47% 28,481,182 10,569,073 37% Redfish 19,052,388 9,096,051 48% 22,454,069 8,782,342 39%
White hake 7,365,297 5,294,489 72% 8,500,901 4,469,611 53% Winter flounder, GB 7,695,773 4,237,884 55% 7,805,363 3,796,436 49%
Winter flounder, GOM 1,561,490 562,334 36% 1,531,079 367,701 24% Winter flounder, SNE Not
allocated
2,367,913 1,477,896 62% Witch flounder 3,291,703 2,122,567 64% 1,333,163 1,398,494 105%
Yellowtail flounder, CC/GOM 2,433,611 2,067,901 85% 1,035,799 823,535 80%
Yellowtail flounder, GB 798,315 474,236 59% 336,532 122,911 37% Yellowtail flounder, SNE 1,342,708 938,303 70% 1,084,646 621,470 57%
Grand total 165,934,970 53,195,859 32% 142,309,054 47,334,794 33% *includes sector carryover
79

Table 32. Number of vessel affiliations by fishing year.
Affiliations 2010 2011 2012 2013 With limited access groundfish permits
910 846 787 780
With limited access groundfish permit and revenue from any species
698 633 617 605
With limited access groundfish permit and revenue from at least one groundfish trip
359 337 309 258
Number and percentage inactive (no landings) affiliations
212 213 170 175 23% 25% 22% 22%
80

Table 33. Number and percentage of vessel affiliations by number of active vessels owned. Number of active vessels per vessel affiliation
2010 2011 2012 2013
1 598 547 529 531
85.7% 85.5% 84.0% 85.0%
2 75 58 64 52 10.7% 9.1% 10.2% 8.3% 3 15 20 15 15
2.1% 3.1% 2.4% 2.4%
4 to 6 7 13 20 25 1.0% 2.0% 3.2% 4.0%
7 to 9 2 1 1 1
0.3% 0.2% 0.2% 0.2%
10 + 1 1 1 1 0.1% 0.2% 0.2% 0.2%
Average number of active vessels per active vessel affiliation
1.22 1.23 1.24 1.21
81

Table 34. Distribution of revenue from all species (all trips) among vessels41.
Year
2010 2011 2012 2013
Percentage bracket
Top 1% $19,147,876 $18,546,802 $18,461,575 $15,925,893 6.5% 5.7% 6.2% 5.9%
20% $169,997,709 $185,821,955 $168,333,300 $152,982,770
58.0% 57.3% 56.9% 56.7%
40% $60,051,863 $70,351,697 $64,069,344 $62,564,814 20.5% 21.7% 21.6% 23.2%
60% $29,529,034 $32,561,588 $29,257,034 $26,352,940
10.1% 10.0% 9.9% 9.8%
80% $13,206,580 $14,664,872 $13,583,758 $10,395,734 4.5% 4.5% 4.6% 3.9%
99% $1,346,373 $2,438,575 $2,246,081 $1,662,585 0.5% 0.8% 0.8% 0.6%
Bottom $996 $1,047 $817 $848 1% 0.0% 0.0% 0.0% 0.0%
Grand total $293,280,432 $324,386,537 $295,951,909 $269,885,585
Number of
vessels* 855 777 763 735
41 In Table 34, each category presents the incremental difference in cumulative all species revenue from the previous category. For example, in Table 34, by adding the all species revenues presented for the “Top 1%” and “Top 20%” categories in 2009, one can obtain the total all species revenues earned by the top 20% of vessels ($189,145,585), $19,147,876 of which was earned by the top 1% of vessels.
82

Table 35. Distribution of revenue from groundfish (all trips) among vessels42.
Year
2010 2011 2012 2013
Percentage bracket
Top 1% $8,390,924 $7,629,038 $5,653,112 $4,391,033 10.1% 8.6% 8.3% 8.0%
20% $55,057,841 $60,218,586 $45,932,072 $39,718,456
66.2% 67.8% 67.7% 71.9%
40% $14,557,426 $15,374,243 $12,378,069 $8,691,649 17.5% 17.3% 18.3% 15.7%
60% $4,591,978 $4,852,718 $3,373,650 $2,191,454
5.5% 5.5% 5.0% 4.0%
80% $592,409 $728,548 $459,659 $220,340 0.7% 0.8% 0.7% 0.4%
99% $21,621 $18,208 $18,727 $7,533
0.0% 0.0% 0.0% 0.0%
Bottom $8 $8 $9 $5 1% 0.0% 0.0% 0.0% 0.0%
Grand total $83,212,207 $88,821,349 $67,815,297 $55,220,469
Number of vessels 435 416 404 357
42 In Table 35, each category presents the incremental difference in cumulative groundfish revenue from the previous category. For example, in Table 35, by adding the groundfish revenues presented for the “Top 1%” and “Top 20%” categories in 2010, one can obtain the total groundfish revenues earned by the top 20% of vessels ($63,448,765) in 2010, $8,390,924 of which was earned by the top 1% of vessels.
83

Table 36. Distribution of revenue from all species (all trips) among vessel affiliations43. Percentage bracket 2010 2011 2012 2013 Top 1% $51,666,519 $60,511,413 $51,923,681 $49,430,444 17.6% 18.7% 17.5% 18.3% 20% $160,599,080 $173,445,766 $162,812,400 $146,884,896 54.8% 53.5% 55.0% 54.4% 40% $46,207,909 $52,273,933 $47,243,778 $45,484,851 15.8% 16.1% 16.0% 16.9% 60% $23,077,545 $24,725,073 $22,338,606 $19,197,748 7.9% 7.6% 7.5% 7.1% 80% $10,645,376 $11,579,521 $10,126,317 $7,697,410 3.6% 3.6% 3.4% 2.9% 99% $1,083,227 $1,849,726 $1,506,433 $1,189,554 0.4% 0.6% 0.5% 0.4% Bottom 1% $776 $1,105 $694 $683 0.0% 0.0% 0.0% 0.0% Grand total $293,280,432 $324,386,537 $295,951,909 $269,885,585 Number of vessel affiliations 698 633 617 605
43 In Table 36, each category presents the incremental difference in cumulative all species revenue from the previous category. For example, in Table 36, by adding the all species revenues presented for the “Top 1%” and “Top 20%” categories in 2010, one can obtain the total all species revenues earned by the top 20% of vessel affiliations ($212,265,599) in 2010, $51,666,519 of which was earned by the top 1% of vessel affiliations.
84

Table 37. Distribution of groundfish revenue among vessel affiliations44.
Percentage bracket 2010 2011 2012 2013
Top 1% $22,303,337 $23,592,387 $18,349,342 $15,477,134 26.8% 26.6% 27.1% 28.0% 20% $47,561,930 $51,065,613 $39,423,684 $33,550,305 57.2% 57.5% 58.1% 60.8% 40% $9,795,802 $10,304,615 $7,715,589 $4,724,599 11.8% 11.6% 11.4% 8.6% 60% $3,102,402 $3,404,356 $2,019,964 $1,323,779 3.7% 3.8% 3.0% 2.4% 80% $430,596 $441,350 $291,376 $138,543 0.5% 0.5% 0.4% 0.3% 99% $18,135 $13,021 $15,333 $6,105 0.0% 0.0% 0.0% 0.0% Bottom 1% $5 $5 $10 $3 0.0% 0.0% 0.0% 0.0% Grand total $83,212,207 $88,821,349 $67,815,297 $55,220,469 Number of vessel affiliations 353 337 311 284
44 In Table 37, each category presents the incremental difference in cumulative groundfish revenue from the previous category. For example, in Table 37, by adding the groundfish revenues presented for the “Top 1%” and “Top 20%” categories in 2010, one can obtain the total groundfish revenues earned by the top 20% of vessel affiliations ($69,865,267) in 2010, $22,303,337 of which was earned by the top 1% of vessel affiliations.
85

Table 38. Number of vessel affiliations with revenue from all species by cumulative (on all trips) quartiles (ordered high revenue to low).
Percent of all species revenue 2010 2011 2012 2013 Top 25% 12 12 12 11
1.7% 1.9% 1.9% 1.8%
Top 50% 54 53 53 50
7.7% 8.4% 8.6% 8.3%
Top 75% 155 141 135 131
22.2% 22.3% 21.9% 21.7%
100% 698 633 617 605
100.0% 100.0% 100.0% 100.0%
Table 39. Number of vessel affiliations with revenue from groundfish by cumulative (on all trips) quartiles (ordered high revenue to low).
Percent of all species revenue 2010 2011 2012 2013 Top 25% 2 2 2 1
0.6% 0.6% 0.6% 0.4%
Top 50% 14 16 14 11
4.0% 4.7% 4.5% 3.9%
Top 75% 44 42 36 29
12.5% 12.5% 11.6% 10.2%
100% 353 337 311 284
100.0% 100.0% 100.0% 100.0%
86

Table 40. Changes in employment indicators by vessel size category (May through April, all trips). Year Vessel Size 2010 2011 2012 2013 Less than 30'
Total crew positions 101 79 76 75
Total crew-trips 2,695 2,491 2,230 2,148
Total crew-days 909 843 732 745
Crew-days/Crew-trips 0.34 0.34 0.33 0.35
30' to <50'
Total crew positions 957 875 865 833
Total crew-trips 69,729 68,913 66,120 59,075
Total crew-days 33,536 35,138 34,321 32,033
Crew-days/Crew-trips 0.48 0.51 0.52 0.54
50' to <75'
Total crew positions 676 675 662 624
Total crew-trips 38,201 37,385 35,309 32,823
Total crew-days 65,792 65,722 65,955 62,747
Crew-days/Crew-trips 1.72 1.76 1.87 1.91
75' and above
Total crew positions 534 537 532 507
Total crew-trips 14,408 13,996 13,459 12,654
Total crew-days 71,041 69,639 68,121 62,075
Crew-days/Crew-trips 4.93 4.98 5.06 4.91
All sizes
Total crew positions 2,268 2,166 2,135 2,039
Total crew-trips 125,033 122,785 117,118 106,700
Total crew-days 171,278 171,342 169,129 157,600
Crew-days/Crew-trips 1.37 1.40 1.44 1.48
87

Table 41. Changes in employment indicators by home port state (May through April, all trips).
Home port state
Year
2010 2011 2012 2013
CT
Total crew positions 37 42 39 39
Total crew-trips 1,991 1,470 1,550 1,294
Total crew-days 4,020 3,002 4,478 3,551
Crew-days/Crew-trips 2.02 2.04 2.89 2.74
MA
Total crew positions 1,140 1,071 1,050 987
Total crew-trips 54,204 54,516 51,690 44,353
Total crew-days 83,235 85,747 81,696 73,518
Crew-days/Crew-trips 1.54 1.57 1.58 1.66
ME
Total crew positions 244 222 242 228
Total crew-trips 16,592 14,073 14,374 13,088
Total crew-days 15,596 14,910 16,524 15,237
Crew-days/Crew-trips 0.94 1.06 1.15 1.16
NH
Total crew positions 108 106 95 86
Total crew-trips 8,159 8,507 8,067 5,937
Total crew-days 3,929 4,987 5,166 4,487
Crew-days/Crew-trips 0.48 0.59 0.64 0.76
88

Table 41 (continued). Changes in employment indicators by home port state (May through April, all trips). Home port
state Year 2010 2011 2012 2013
NJ
Total crew positions 150 144 149 153
Total crew-trips 9,956 9,556 8,133 7,682
Total crew-days 10,093 9,893 10,349 9,564
Crew-days/Crew-trips 1.01 1.04 1.27 1.25
NY
Total crew positions 208 217 208 191
Total crew-trips 14,663 14,932 14,150 13,107
Total crew-days 15,763 16,046 15,028 14,372
Crew-days/Crew-trips 1.08 1.07 1.06 1.10
RI
Total crew positions 256 247 232 226
Total crew-trips 15,152 15,417 14,988 16,977
Total crew-days 26,822 25,147 24,247 25,645
Crew-days/Crew-trips 1.77 1.63 1.62 1.51
Other Northeast
Total crew positions 131 129 131 136
Total crew-trips 4,316 4,314 4,166 4,263
Total crew-days 11,818 11,610 11,640 11,227
Crew-days/Crew-trips 2.74 2.69 2.79 2.63
Total*
Total crew positions 2,275 2,179 2,145 2,046
Total crew-trips 125,032 122,785 117,118 106,699
Total crew-days 171,277 171,343 169,128 157,601
Crew-days/Crew-trips 1.37 1.40 1.44 1.48
*Note: Vessels may change home ports during the year resulting in associated crew positions for more than one state. This means the total positions shown here are higher than the total positions as calculated at the permit level. The total work opportunity associated with these positions, crew trips and crew-days totals, is the same as reported at the permit level.
89

Table 42. Per day trip cost averages (in 2010 dollars). Trip type 2010 2011 2012 2013 Gillnet <40' day trip $521 $631 $556 $577 Gillnet <40' multiday trip $416 $500 $439 $349 Gillnet ≥40' day trip $625 $725 $615 $562 Gillnet ≥40' multiday trip $621 $680 $642 $553 Longline <40' day trip $889 $644 $746 $740 Longline <40' multiday trip $1,616 $1,616 $1,616 $1,616 Longline ≥40' day trip $724 $1,067 $875 $629 Longline ≥40' multiday trip $1,031 $1,141 $1,379 $1,379 Scallop dredge <50' $606 $794 $702 $664 Scallop dredge 50' to 75' $1,376 $1,651 $1,767 $1,522 Scallop dredge ≥75' $1,946 $2,423 $2,509 $2,652 Trawl <50' day trip $701 $812 $793 $794 Trawl <50' multiday trip $806 $885 $768 $835 Trawl 50' to 75' day trip $845 $1,041 $970 $1,031 Trawl 50' to 75' multiday trip $1,384 $1,584 $1,509 $1,467 Trawl ≥75' day trip $1,624 $1,874 $1,612 $1,636 Trawl ≥75' multiday trip $2,008 $2,386 $2,353 $2,141 Pots and traps $1,139 $1,139 $1,139 $1,139 Purse seine $1,385 $1,914 $1,656 $1,480 Hand gear $656 $656 $656 $656 Other gear <50' $430 $545 $933 $815 Other gear 50' to 75' $1,034 $1,034 $1,034 $1,034 Other gear ≥75' $4,055 $4,705 $4,771 $4,057
90

Table 43. Per day values for groundfish trips (in 2010 dollars).
Vessel size category
2010 2011 2012 2013
Less than 30’ Average revenue per day $2,569 $1,884 $2,586 $647 Average trip cost per day $631 $647 $601 $654 Average owner share per day $1,471 $934 $1,372 $156 Average crew share per man per day $635 $435 $568 $48 30’ to <50’ Average revenue per day $6,192 $5,924 $7,441 $5,798 Average trip cost per day $622 $724 $664 $623 Average owner share per day $3,799 $3,519 $4,204 $3,450 Average crew share per man per day $1,192 $1,071 $1,473 $894 50’ to <75’ Average revenue per day $7,252 $6,512 $9,878 $4,982 Average trip cost per day $1,036 $1,206 $1,147 $1,146 Average owner share per day $3,717 $3,147 $6,677 $2,237 Average crew share per man per day $1,030 $850 $939 $549 75’ and above Average revenue per day $6,648 $6,436 $5,403 $5,167 Average trip cost per day $2,096 $2,441 $2,317 $2,134 Average owner share per day $2,724 $2,547 $2,063 $1,982 Average crew share per man per day $411 $330 $228 $219
91

Table 44. Per day values for non-groundfish trips (in 2010 dollars).
Vessel size category
2010 2011 2012 2013
Less than 30’ Average revenue per day $1,848 $1,793 $1,743 $1,838 Average trip cost per day $787 $743 $774 $824 Average owner share per day $902 $900 $851 $910 Average crew share per man per day $535 $454 $352 $428 30’ to <50’ Average revenue per day $3,965 $4,023 $4,273 $4,470 Average trip cost per day $914 $968 $991 $971 Average owner share per day $2,199 $2,196 $2,356 $2,505 Average crew share per man per day $873 $844 $880 $964 50’ to <75’ Average revenue per day $5,461 $6,698 $6,506 $6,230 Average trip cost per day $1,030 $1,223 $1,210 $1,198 Average owner share per day $2,720 $3,203 $3,122 $2,887 Average crew share per man per day $694 $798 $737 $690 75’ and above Average revenue per day $9,275 $16,097 $12,541 $12,730 Average trip cost per day $1,950 $2,309 $2,231 $2,169 Average owner share per day $3,838 $6,909 $5,117 $5,305 Average crew share per man per day $547 $947 $613 $639
92

Table 45. Average owner and crew share per vessel (in 2010 dollars). Vessel size category
2010 2011 2012 2013
Less than 30’ Owner share $7,724 $8,110 $8,074 $7,092 Crew share $2,456 $2,377 $2,421 $1,787 30’ to <50’ Owner share $80,139 $91,959 $80,022 $77,746 Crew share $30,725 $35,724 $31,001 $29,831 50’ to <75’ Owner share $220,175 $251,697 $232,305 $224,351 Crew share $141,066 $162,077 $146,134 $143,620 75’ and above Owner share $456,500 $527,866 $490,680 $455,449 Crew share $314,003 $357,917 $328,186 $302,382 Table 46. Aggregate owner and crew shares by vessel size category (in 2010 dollars). Vessel size category
2010 2011 2012 2013
Less than 30’ Owner share $502,061 $413,588 $395,604 $361,709 Crew share $159,608 $121,227 $118,626 $91,123 30’ to <50’ Owner share $36,783,955 $37,059,393 $31,848,820 $29,854,380 Crew share $14,102,591 $14,396,667 $12,338,443 $11,455,183 50’ to <75’ Owner share $47,998,229 $53,359,863 $47,622,532 $43,299,716 Crew share $30,752,401 $34,360,417 $29,957,504 $27,718,653 75’ and above Owner share $51,584,465 $58,593,160 $54,465,516 $48,733,065 Crew share $35,482,312 $39,728,785 $36,428,681 $32,354,887 Grand total Owner share $136,868,709 $149,426,003 $134,332,473 $122,248,870 Crew share $80,496,912 $88,607,096 $78,843,253 $71,619,846
93

Table 47. Aggregate owner and crew shares by homeport state (in 2010 dollars). Home port state
2010 2011 2012 2013
CT Owner share $2,419,075 $2,263,941 $3,719,586 $3,067,246 Crew share $1,391,331 $1,303,738 $2,492,569 $2,116,008 MA Owner share $70,442,724 $76,611,784 $66,380,217 $58,753,238 Crew share $43,423,992 $47,022,463 $40,733,077 $35,759,141 ME Owner share $15,188,474 $13,459,430 $12,588,800 $12,392,165 Crew share $7,938,406 $7,047,858 $6,346,057 $6,347,657 NH Owner share $4,144,998 $4,457,530 $3,859,427 $2,667,760 Crew share $1,643,769 $1,805,042 $1,461,865 $994,788 NJ Owner share $9,609,587 $11,169,953 $10,783,312 $10,583,550 Crew share $5,487,847 $6,921,955 $6,580,997 $6,821,206 NY Owner share $12,698,746 $14,815,631 $12,892,717 $11,547,642 Crew share $6,901,418 $7,947,124 $6,511,075 $5,722,676 RI Owner share $15,167,337 $17,929,076 $15,363,818 $15,800,671 Crew share $8,549,038 $10,307,659 $8,729,171 $8,919,618 All other states
Owner share $7,197,769 $8,718,657 $8,744,597 $7,436,597 Crew share $5,161,111 $6,251,259 $5,988,442 $4,938,753
Grand total
Owner share $136,868,709 $149,426,003 $134,332,473 $122,248,870 Crew share $80,496,912 $88,607,096 $78,843,253 $71,619,846
94

$0.00
$0.20
$0.40
$0.60
$0.80
$1.00
$1.20
$1.40
$1.60
2010 2011 2012 2013
Aver
age
Pric
e ($
) Per
Lan
ded
Poun
d
Fishing Year
Groundfish
Non-Groundfish
Figure 1. Yearly average price (in 2010 dollars) of combined groundfish vs. other species.
95

Figure 2. Yearly average price (in 2010 dollars) by allocated groundfish species.
96

Figure 3. Quantity adjusted groundfish price index (base period = May through July 2007).
97

Figure 4. 2013 catch and allocated ACE by vessel size category for individual stocks.
98

Figure 4, continued. 2013 catch and allocated ACE by vessel size category for individual stocks.
99

Figure 4, continued. 2013 catch and allocated ACE by vessel size category for individual stocks.
100

Figure 4, continued. 2013 catch and allocated ACE by vessel size category for individual stocks.
101

Figure 4, continued. 2013 catch and allocated ACE by vessel size category for individual stocks.
102

0
20
40
60
80
100
120
140
160
180
<$50K $50K to $100K
$100K to $200K
$200K to $300K
$300K to $500K
$500K to $700K
$700K to $1.0M
$1.0M+
Num
ber o
f Ves
sel A
ffilia
tions
2010 2011 2012 2013
Figure 5. Number of vessel affiliations with revenue from any species by total revenue category.
103
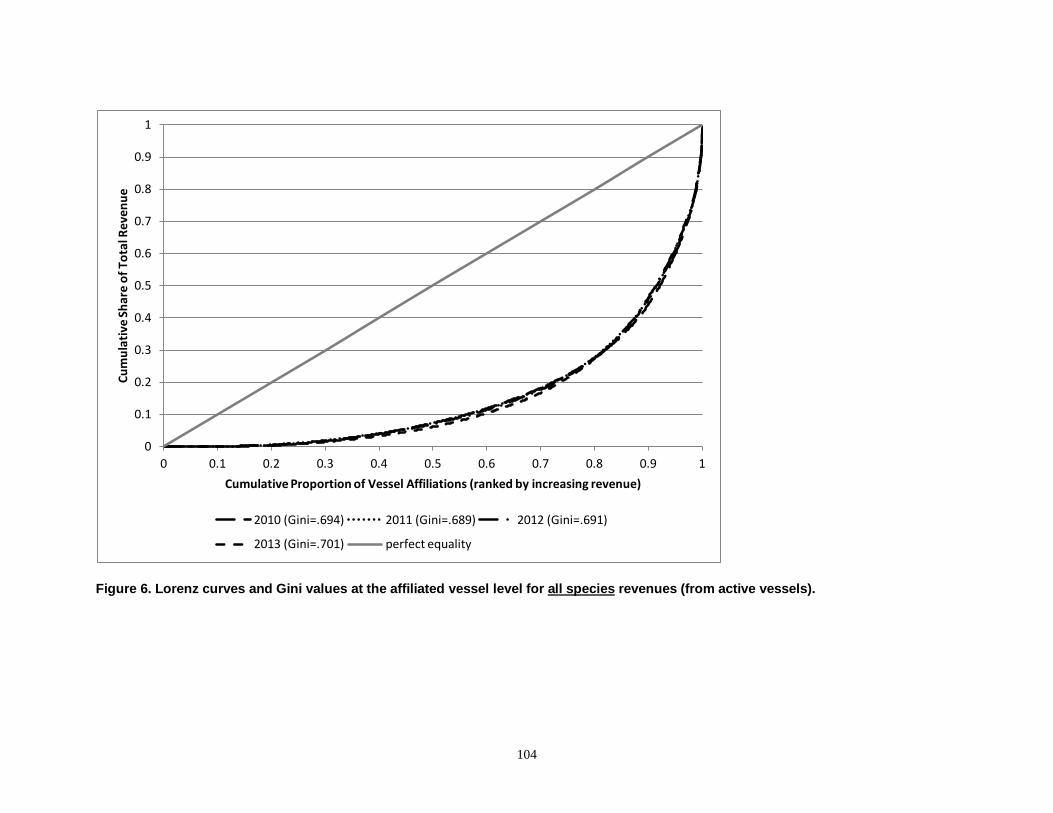
0
0.1
0.2
0.3
0.4
0.5
0.6
0.7
0.8
0.9
1
0 0.1 0.2 0.3 0.4 0.5 0.6 0.7 0.8 0.9 1
Cum
ulat
ive
Shar
e of
Tot
al R
even
ue
Cumulative Proportion of Vessel Affiliations (ranked by increasing revenue)
2010 (Gini=.694) 2011 (Gini=.689) 2012 (Gini=.691)
2013 (Gini=.701) perfect equality
Figure 6. Lorenz curves and Gini values at the affiliated vessel level for all species revenues (from active vessels).
104

0
0.1
0.2
0.3
0.4
0.5
0.6
0.7
0.8
0.9
1
0 0.1 0.2 0.3 0.4 0.5 0.6 0.7 0.8 0.9 1
Cum
ulat
ive
Shar
e of
Gro
undf
ish
Reve
nue
Cumulative Proportion of Vessel Affiliations (ranked by increasing revenue)
2010 (Gini=.812) 2011 (Gini=.808) 2012 (Gini=.818)
2013 (Gini=.842) perfect equality
Figure 7. Lorenz curves and Gini values at the affiliated vessel level for groundfish revenues (from active vessels).
105
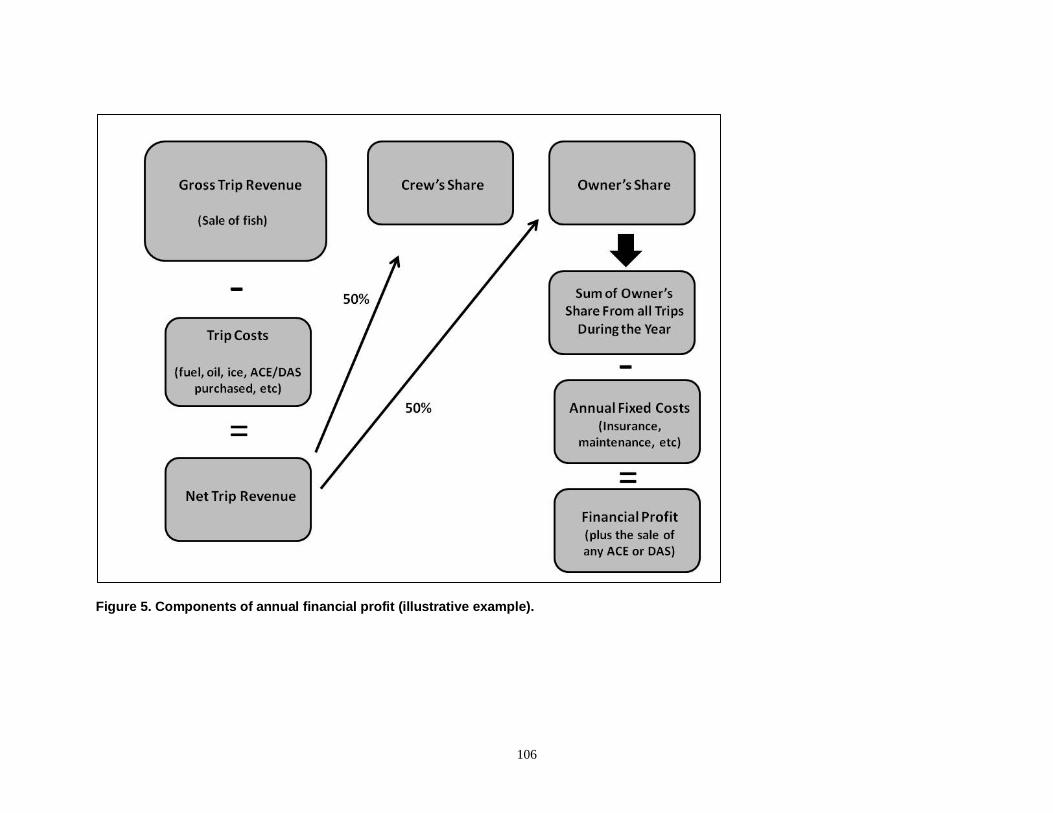
Figure 5. Components of annual financial profit (illustrative example).
106

Procedures for Issuing Manuscriptsin the
Northeast Fisheries Science Center Reference Document (CRD) Series
Clearance All manuscripts submitted for issuance as CRDs must have cleared the NEFSC’s manuscript/abstract/webpage review process. If any author is not a federal employee, he/she will be required to sign an “NEFSC Release-of-Copyright Form.” If your manuscript includes material from another work which has been copyrighted, then you will need to work with the NEFSC’s Editorial Office to arrange for permission to use that material by securing release signatures on the “NEFSC Use-of-Copyrighted-Work Permission Form.” For more information, NEFSC authors should see the NEFSC’s online publication policy manual, “Manu-script/abstract/webpage preparation, review, and dis-semination: NEFSC author’s guide to policy, process, and procedure,” located in the Publications/Manuscript Review section of the NEFSC intranet page.
Organization Manuscripts must have an abstract and table of contents, and (if applicable) lists of figures and tables. As much as possible, use traditional scientific manu-script organization for sections: “Introduction,” “Study Area” and/or ”Experimental Apparatus,” “Methods,” “Results,” “Discussion,” “Conclusions,” “Acknowl-edgments,” and “Literature/References Cited.”
Style The CRD series is obligated to conform with the style contained in the current edition of the United States Government Printing Office Style Manual. That style manual is silent on many aspects of scientific manuscripts. The CRD series relies more on the CSE Style Manual. Manuscripts should be prepared to conform with these style manuals. The CRD series uses the American Fisheries Soci-ety’s guides to names of fishes, mollusks, and decapod
crustaceans, the Society for Marine Mammalogy’s guide to names of marine mammals, the Biosciences Information Service’s guide to serial title abbreviations, and the ISO’s (International Standardization Organiza-tion) guide to statistical terms. For in-text citation, use the name-date system. A special effort should be made to ensure that all neces-sary bibliographic information is included in the list of cited works. Personal communications must include date, full name, and full mailing address of the con-tact.
Preparation Once your document has cleared the review pro-cess, the Editorial Office will contact you with publica-tion needs – for example, revised text (if necessary) and separate digital figures and tables if they are embedded in the document. Materials may be submitted to the Editorial Office as files on zip disks or CDs, email attachments, or intranet downloads. Text files should be in Microsoft Word, tables may be in Word or Excel, and graphics files may be in a variety of formats (JPG, GIF, Excel, PowerPoint, etc.).
Production and Distribution The Editorial Office will perform a copy-edit of the document and may request further revisions. The Editorial Office will develop the inside and outside front covers, the inside and outside back covers, and the title and bibliographic control pages of the docu-ment. Once both the PDF (print) and Web versions of the CRD are ready, the Editorial Office will contact you to review both versions and submit corrections or changes before the document is posted online. A number of organizations and individuals in the Northeast Region will be notified by e-mail of the availability of the document online.

Research Communications BranchNortheast Fisheries Science Center
National Marine Fisheries Service, NOAA166 Water St.
Woods Hole, MA 02543-1026
Publications and Reportsof the
Northeast Fisheries Science CenterThe mission of NOAA’s National Marine Fisheries Service (NMFS) is “stewardship of living marine resources for the benefit of the nation through their science-based conservation and management and promotion of the health of their environment.” As the research arm of the NMFS’s Northeast Region, the Northeast Fisheries Science Center (NEFSC) supports the NMFS mission by “conducting ecosystem-based research and assess-ments of living marine resources, with a focus on the Northeast Shelf, to promote the recovery and long-term sustainability of these resources and to generate social and economic opportunities and benefits from their use.” Results of NEFSC research are largely reported in primary scientific media (e.g., anonymously-peer-reviewed scientific journals). However, to assist itself in providing data, information, and advice to its constituents, the NEFSC occasionally releases its results in its own media. Currently, there are three such media:
NOAA Technical Memorandum NMFS-NE -- This series is issued irregularly. The series typically includes: data reports of long-term field or lab studies of important species or habitats; synthesis reports for important species or habitats; annual reports of overall assessment or monitoring programs; manuals describing program-wide surveying or experimental techniques; literature surveys of important species or habitat topics; proceedings and collected papers of scientific meetings; and indexed and/or annotated bibliographies. All issues receive internal scientific review and most issues receive technical and copy editing.
Northeast Fisheries Science Center Reference Document -- This series is issued irregularly. The series typically includes: data reports on field and lab studies; progress reports on experiments, monitoring, and assessments; background papers for, collected abstracts of, and/or summary reports of scientific meetings; and simple bibliographies. Issues receive internal scientific review and most issues receive copy editing.
Resource Survey Report (formerly Fishermen’s Report) -- This information report is a regularly-issued, quick-turnaround report on the distribution and relative abundance of selected living marine resources as derived from each of the NEFSC’s periodic research ves-sel surveys of the Northeast’s continental shelf. This report undergoes internal review, but receives no technical or copy editing.
TO OBTAIN A COPY of a NOAA Technical Memorandum NMFS-NE or a Northeast Fisheries Science Center Reference Document, either contact the NEFSC Editorial Office (166 Water St., Woods Hole, MA 02543-1026; 508-495-2350) or consult the NEFSC webpage on “Reports and Publications” (http://www.nefsc.noaa.gov/nefsc/publications/). To access Resource Survey Report, consult the Ecosystem Surveys Branch webpage (http://www.nefsc.noaa.gov/femad/ecosurvey/mainpage/).
ANY USE OF TRADE OR BRAND NAMES IN ANY NEFSC PUBLICATION OR REPORT DOES NOT IMPLY ENDORSE-MENT.
MEDIA MAIL