Performance of Local Light Microscopy and the … · questionnaire and a finger-prick blood sample...
12
Performance of Local Light Microscopy and the ParaScreen Pan/Pf Rapid Diagnostic Test to Detect Malaria in Health Centers in Northwest Ethiopia Tekola Endeshaw 1 , Patricia M. Graves 2 , Berhan Ayele 1 , Aryc W. Mosher 2 , Teshome Gebre 1 , Firew Ayalew 1 , Asrat Genet 3 , Alemayehu Mesfin 3 , Estifanos Biru Shargie 1,4 , Zerihun Tadesse 1 , Tesfaye Teferi 1 , Berhanu Melak 1 , Frank O. Richards 2 , Paul M. Emerson 2 * 1 The Carter Center, Addis Ababa, Ethiopia, 2 The Carter Center, Atlanta, Georgia, United States of America, 3 Amhara Regional Health Bureau, Bahir Dar, Ethiopia, 4 Strategic Information Team, The Global Fund to Fight AIDS, Tuberculosis and Malaria, Geneva, Vernier, Switzerland Abstract Background: Diagnostic tests are recommended for suspected malaria cases before treatment, but comparative performance of microscopy and rapid diagnostic tests (RDTs) at rural health centers has rarely been studied compared to independent expert microscopy. Methods: Participants (N = 1997) with presumptive malaria were recruited from ten health centers with a range of transmission intensities in Amhara Regional State, Northwest Ethiopia during October to December 2007. Microscopy and ParaScreen Pan/PfH RDT were done immediately by health center technicians. Blood slides were re-examined later at a central laboratory by independent expert microscopists. Results: Of 1,997 febrile patients, 475 (23.8%) were positive by expert microscopists, with 57.7% P.falciparum, 24.6% P.vivax and 17.7% mixed infections. Sensitivity of health center microscopists for any malaria species was .90% in five health centers (four of which had the highest prevalence), .70% in nine centers and 44% in one site with lowest prevalence. Specificity for health center microscopy was very good (.95%) in all centers. For ParaScreen RDT, sensitivity was $90% in three centers, $70% in six and ,60% in four centers. Specificity was $90% in all centers except one where it was 85%. Conclusions: Health center microscopists performed well in nine of the ten health centers; while for ParaScreen RDT they performed well in only six centers. Overall the accuracy of local microscopy exceeded that of RDT for all outcomes. This study supports the introduction of RDTs only if accompanied by appropriate training, frequent supervision and quality control at all levels. Deficiencies in RDT use at some health centers must be rectified before universal replacement of good routine microscopy with RDTs. Maintenance and strengthening of good quality microscopy remains a priority at health center level. Citation: Endeshaw T, Graves PM, Ayele B, Mosher AW, Gebre T, et al. (2012) Performance of Local Light Microscopy and the ParaScreen Pan/Pf Rapid Diagnostic Test to Detect Malaria in Health Centers in Northwest Ethiopia. PLoS ONE 7(4): e33014. doi:10.1371/journal.pone.0033014 Editor: Ana Paula Arez, Instituto de Higiene e Medicina Tropical, Portugal Received October 13, 2011; Accepted February 3, 2012; Published April 20, 2012 Copyright: ß 2012 Endeshaw et al. This is an open-access article distributed under the terms of the Creative Commons Attribution License, which permits unrestricted use, distribution, and reproduction in any medium, provided the original author and source are credited. Funding: The study was funded by The Carter Center Malaria Control Program with health center staff time provided by the Amhara Regional Health Bureau. The funders had no role in study design, data collection and analysis, decision to publish, or preparation of the manuscript. Competing Interests: The authors have declared that no competing interests exist. * E-mail: [email protected] Introduction Accurate early case detection and prompt treatment with appropriate antimalarial drugs is the major strategy for effective case management in malaria patients [1]. Correct diagnosis is also vital for the malaria prevalence and incidence indicators used to evaluate the impact of malaria control interventions [2]. A parasite based diagnostic test (microscopy or rapid diagnostic test [RDT]) is now recommended, if available, instead of presumptive treatment for all persons with suspected malaria [3]. While this recommendation has been adopted in the latest version of the Ethiopia treatment guidelines [4], diagnostic test facilities are not always available and their quality has not been comprehensively assessed or compared under routine conditions. We previously reported two studies on ParaScreen Pf/PAN RDT in Ethiopia, one from a large household survey in mainly asymptomatic persons [5] and one from ten health centers in Amhara region [6]. ParaScreen can distinguish between a P.falicparum (or mixed) infection, and a non P.falciparum infection. The sensitivity of ParaScreen compared to expert microscopy was relatively low in the household survey [5], but it performed better for persons with suspected malaria in the health facilities in Amhara region [6]. The health facility study directly compared two RDTs, ParaScreen and ParaCheck (detects P.falciparum only), done by the health center technicians with the results on the same individuals by expert microscopy. The ratio of P.falciparum to P.vivax was 64% to 46%. The findings indicated that overall, ParaScreen had adequate performance of PLoS ONE | www.plosone.org 1 April 2012 | Volume 7 | Issue 4 | e33014
Transcript of Performance of Local Light Microscopy and the … · questionnaire and a finger-prick blood sample...
Performance of Local Light Microscopy and theParaScreen Pan/Pf Rapid Diagnostic Test to DetectMalaria in Health Centers in Northwest EthiopiaTekola Endeshaw1, Patricia M. Graves2, Berhan Ayele1, Aryc W. Mosher2, Teshome Gebre1,
Firew Ayalew1, Asrat Genet3, Alemayehu Mesfin3, Estifanos Biru Shargie1,4, Zerihun Tadesse1,
Tesfaye Teferi1, Berhanu Melak1, Frank O. Richards2, Paul M. Emerson2*
1 The Carter Center, Addis Ababa, Ethiopia, 2 The Carter Center, Atlanta, Georgia, United States of America, 3 Amhara Regional Health Bureau, Bahir Dar, Ethiopia,
4 Strategic Information Team, The Global Fund to Fight AIDS, Tuberculosis and Malaria, Geneva, Vernier, Switzerland
Abstract
Background: Diagnostic tests are recommended for suspected malaria cases before treatment, but comparativeperformance of microscopy and rapid diagnostic tests (RDTs) at rural health centers has rarely been studied compared toindependent expert microscopy.
Methods: Participants (N = 1997) with presumptive malaria were recruited from ten health centers with a range oftransmission intensities in Amhara Regional State, Northwest Ethiopia during October to December 2007. Microscopy andParaScreen Pan/PfH RDT were done immediately by health center technicians. Blood slides were re-examined later at acentral laboratory by independent expert microscopists.
Results: Of 1,997 febrile patients, 475 (23.8%) were positive by expert microscopists, with 57.7% P.falciparum, 24.6% P.vivaxand 17.7% mixed infections. Sensitivity of health center microscopists for any malaria species was .90% in five healthcenters (four of which had the highest prevalence), .70% in nine centers and 44% in one site with lowest prevalence.Specificity for health center microscopy was very good (.95%) in all centers. For ParaScreen RDT, sensitivity was $90% inthree centers, $70% in six and ,60% in four centers. Specificity was $90% in all centers except one where it was 85%.
Conclusions: Health center microscopists performed well in nine of the ten health centers; while for ParaScreen RDT theyperformed well in only six centers. Overall the accuracy of local microscopy exceeded that of RDT for all outcomes. Thisstudy supports the introduction of RDTs only if accompanied by appropriate training, frequent supervision and qualitycontrol at all levels. Deficiencies in RDT use at some health centers must be rectified before universal replacement of goodroutine microscopy with RDTs. Maintenance and strengthening of good quality microscopy remains a priority at healthcenter level.
Citation: Endeshaw T, Graves PM, Ayele B, Mosher AW, Gebre T, et al. (2012) Performance of Local Light Microscopy and the ParaScreen Pan/Pf Rapid DiagnosticTest to Detect Malaria in Health Centers in Northwest Ethiopia. PLoS ONE 7(4): e33014. doi:10.1371/journal.pone.0033014
Editor: Ana Paula Arez, Instituto de Higiene e Medicina Tropical, Portugal
Received October 13, 2011; Accepted February 3, 2012; Published April 20, 2012
Copyright: � 2012 Endeshaw et al. This is an open-access article distributed under the terms of the Creative Commons Attribution License, which permitsunrestricted use, distribution, and reproduction in any medium, provided the original author and source are credited.
Funding: The study was funded by The Carter Center Malaria Control Program with health center staff time provided by the Amhara Regional Health Bureau. Thefunders had no role in study design, data collection and analysis, decision to publish, or preparation of the manuscript.
Competing Interests: The authors have declared that no competing interests exist.
* E-mail: [email protected]
Introduction
Accurate early case detection and prompt treatment with
appropriate antimalarial drugs is the major strategy for effective
case management in malaria patients [1]. Correct diagnosis is also
vital for the malaria prevalence and incidence indicators used to
evaluate the impact of malaria control interventions [2]. A parasite
based diagnostic test (microscopy or rapid diagnostic test [RDT])
is now recommended, if available, instead of presumptive
treatment for all persons with suspected malaria [3]. While this
recommendation has been adopted in the latest version of the
Ethiopia treatment guidelines [4], diagnostic test facilities are not
always available and their quality has not been comprehensively
assessed or compared under routine conditions.
We previously reported two studies on ParaScreen Pf/PAN
RDT in Ethiopia, one from a large household survey in mainly
asymptomatic persons [5] and one from ten health centers
in Amhara region [6]. ParaScreen can distinguish between a
P.falicparum (or mixed) infection, and a non P.falciparum infection.
The sensitivity of ParaScreen compared to expert microscopy
was relatively low in the household survey [5], but it performed
better for persons with suspected malaria in the health facilities
in Amhara region [6]. The health facility study directly
compared two RDTs, ParaScreen and ParaCheck (detects
P.falciparum only), done by the health center technicians with
the results on the same individuals by expert microscopy. The
ratio of P.falciparum to P.vivax was 64% to 46%. The findings
indicated that overall, ParaScreen had adequate performance of
PLoS ONE | www.plosone.org 1 April 2012 | Volume 7 | Issue 4 | e33014
80% sensitivity for P.falciparum and 74% for P.vivax, with 97%
and 99% specificity respectively. ParaCheck also performed well
for P.falciparum but it is not designed to detect P.vivax, and has
been replaced with multi-species RDTs supplied to all health
posts (which do not have microscopy) in Ethiopia. The higher
level Health Centers and Hospitals retain the use of microscopy
for malaria diagnosis.
A recent study at three health centers in Oromia region
observed slightly higher sensitivity but lower specificity for
P.falciparum by ParaScreen (85.6% and 92.4% respectively)
compared to expert microscopy than we previously observed in
Amhara [7]. For P.vivax they observed 82.5% sensitivity and
96.2% specificity with ParaScreen. Overall regardless of other
parameters used for comparing the performance of three RDTs,
ParaScreen performed similarly to two other tests (CareStart and
ICT Combo) for P.falciparum but CareStart had better specificity
for P.vivax. The slide positivity rates among patients with
suspected malaria by expert microscopy were very similar in
the two studies (23.8% in Amhara [6] and 23.2% in Oromia
regions [7).
Although in our previous study ParaScreen performance was
acceptable overall in the Amhara health centers [6], variation
was noted between health centers in the accuracy of both
microscopy and RDT compared to the expert microscopists.
This variation in performance at health center level is important
because in Ethiopia, RDTs are routinely done at health posts
(where microscopy is not available) by health extension workers,
and immediate supportive supervision for these workers is
expected to be provided by the cluster heath center staff at
their respective catchment health posts. In addition during times
of emergency, failure of microscopes and/or shortage of reagents,
multispecies RDTs have to be used in the health centers, so
detailed know-how on the performance of multispecies RDTs by
the health center technicians is crucial. Therefore, we build on
the previously reported results and conduct additional analysis
with three aims:
1) To investigate the variation between health centers in the
performance of the microscopists working in the health
centers compared to expert microscopists;
2) To investigate further the variation between health centers in
the accuracy of ParaScreen RDT performed on site, in
comparison with results of expert microscopists.
3) To compare indirectly the performance of local microscopy
and ParaScreen RDT for diagnosing malaria in NorthWest
Ethiopia.
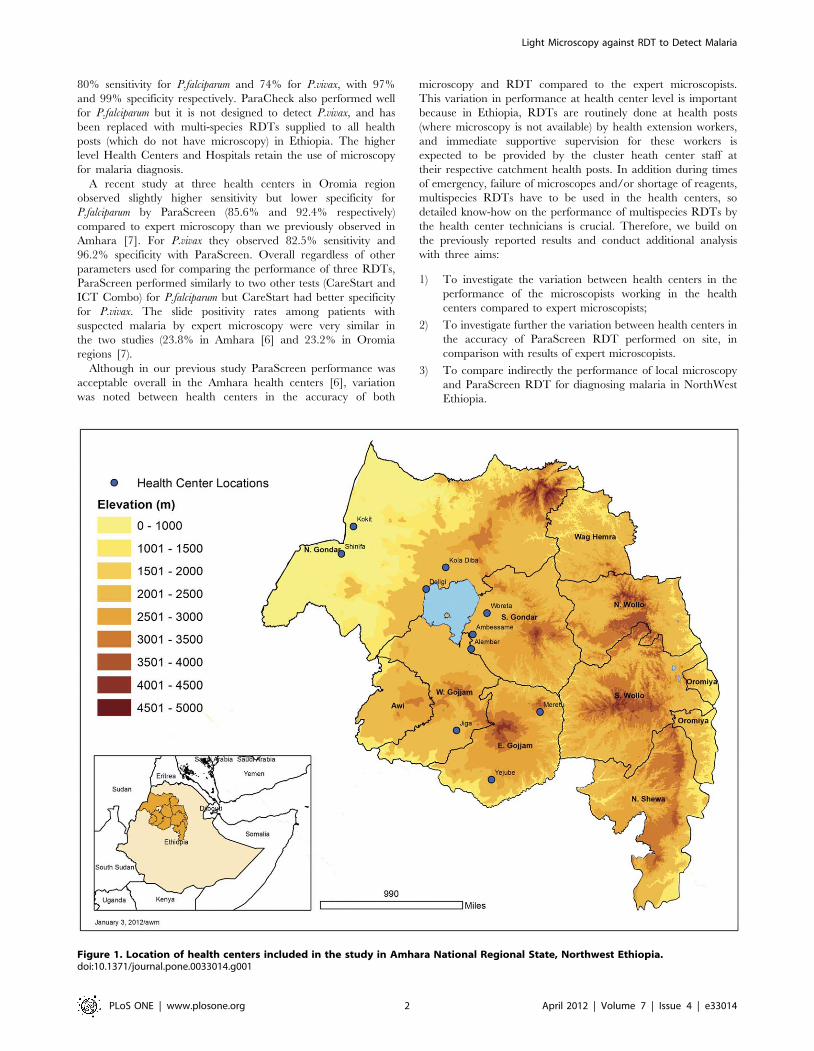
Figure 1. Location of health centers included in the study in Amhara National Regional State, Northwest Ethiopia.doi:10.1371/journal.pone.0033014.g001
Light Microscopy against RDT to Detect Malaria
PLoS ONE | www.plosone.org 2 April 2012 | Volume 7 | Issue 4 | e33014

Methods
Ethical ConsiderationsThe study protocol received ethical approval from the Emory
University Institutional Review Board (IRB 00006389) and the
Amhara Regional Health Bureau (Reference No. R3H5.05/1/
2760). Verbal informed consent was sought from each individual
and from parents of children aged under 18 years; assent was
sought from children 6 to 18 years in accordance with the tenets of
the Declaration of Helsinki. All positive cases were treated at their
respective health centers according to the treatment guidelines for
malaria infection in Ethiopia. Personal identifiers were removed
from the data set before the analyses were undertaken.
Study Settings and Population SelectionAs previously described [6], the study was conducted in ten
health centers (selected to cover a range of transmission intensities)
in Northwest Ethiopia (Fig. 1) during the peak transmission period
of malaria infection between 16th Oct and 30 Dec 2007. The
Figure 2. Flowchart of health center technician microscopy and ParaScreen RDT results compared to expert microscopy.doi:10.1371/journal.pone.0033014.g002
Light Microscopy against RDT to Detect Malaria
PLoS ONE | www.plosone.org 3 April 2012 | Volume 7 | Issue 4 | e33014
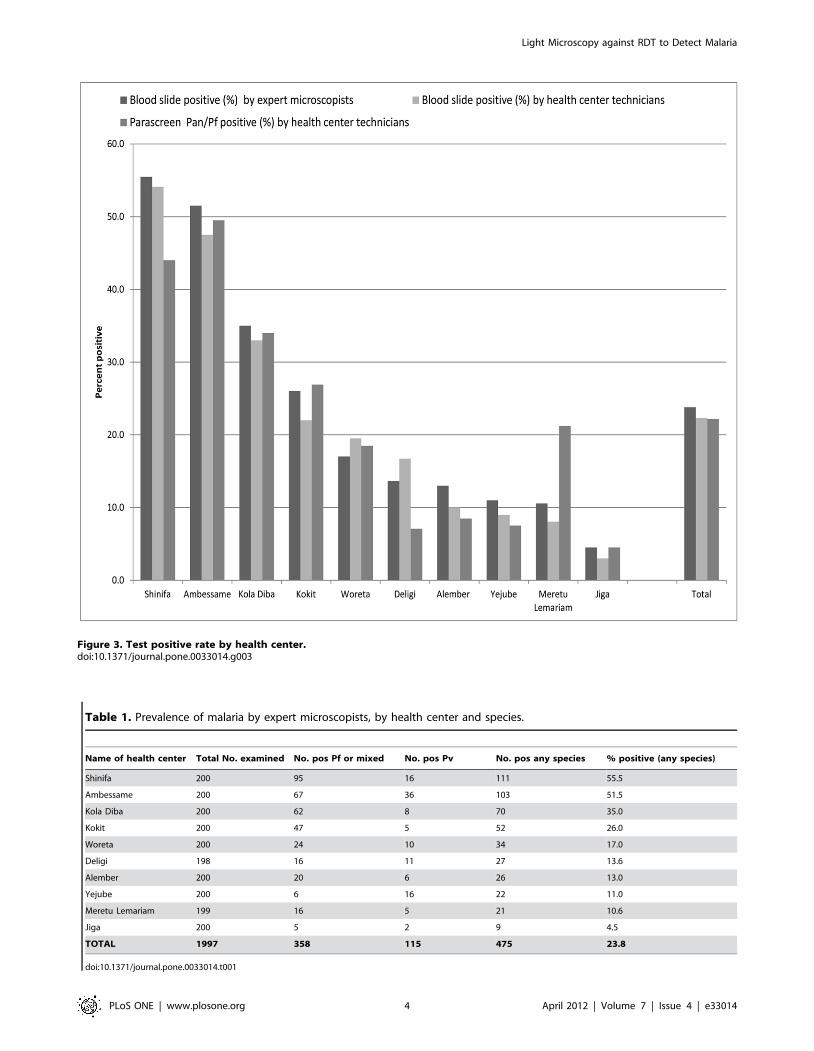
Figure 3. Test positive rate by health center.doi:10.1371/journal.pone.0033014.g003
Table 1. Prevalence of malaria by expert microscopists, by health center and species.
Name of health center Total No. examined No. pos Pf or mixed No. pos Pv No. pos any species % positive (any species)
Shinifa 200 95 16 111 55.5
Ambessame 200 67 36 103 51.5
Kola Diba 200 62 8 70 35.0
Kokit 200 47 5 52 26.0
Woreta 200 24 10 34 17.0
Deligi 198 16 11 27 13.6
Alember 200 20 6 26 13.0
Yejube 200 6 16 22 11.0
Meretu Lemariam 199 16 5 21 10.6
Jiga 200 5 2 9 4.5
TOTAL 1997 358 115 475 23.8
doi:10.1371/journal.pone.0033014.t001
Light Microscopy against RDT to Detect Malaria
PLoS ONE | www.plosone.org 4 April 2012 | Volume 7 | Issue 4 | e33014
coordinates of each health center were recorded using a Garmin
ETrex GPS unit.
In each health center the first 200 self-presenting patients of any
age and either sex who qualified as clinically presumptive malaria
(i.e. an axillary temperature greater than or equal to 37.5uC or
history of fever in the previous 48 hours) were recruited to the
study after excluding individuals with other known causes of non
malarial febrile illnesses or serious illness. After obtaining informed
consent demographic data were recorded on a structured
questionnaire and a finger-prick blood sample taken for blood
film preparation and ParaScreen RDT processing.
TrainingAmong the ten technicians involved in this study, two held a
university degree (BSc in medical laboratory technology) and the
other eight held a diploma (or advanced diploma) in medical
laboratory technology. Nine technicians had a minimum of five
years’ experience in malarious areas and the other had two and a
half years’ experience. All the technicians who participated during
the training were from government health centers and had
previous exposure and experience working with a monospecies
malaria RDT (Paracheck Pf) that detects Pf only in their respective
health centers.
The training, conducted for half a day at each health center,
focused on technical operation of multispecies RDT (ParaScreen)
based on the manufacturer’s instruction, and procedure for
standard blood smear preparation. This included how to handle
RDTs, how to collect blood from finger prick for both RDT and
smear preparation, how to use buffer for RDT, and RDT reading
and interpretation. The procedures for blood films (thin and thick)
preparation, staining and species identification were briefly
addressed. During training before sample collection was started,
simplified and detailed standard operating procedures (SOP) on
both RDT and blood slide preparation and staining were prepared
and distributed to all health centers that have participated in this
study. Similarly, agreement was reached with registered health
officers and clinical nurses about the selection criteria of febrile
patients with suspected malaria that fulfill the requirement of the
study. It was also agreed with the health officers and nurses that all
patients involved in the study would be treated according to the
malaria treatment algorithm and national guideline of the country.
The centers were visited four times during sample collection and
processing, and there was frequent telephone communication
whenever there was a need to clarify study related issues or during
shortage of materials to be replaced.
Malaria Parasites DetectionBlood slide preparation. The finger-prick blood samples
were collected by medical laboratory technicians and processed for
thin and thick films according to standard WHO protocol [8], as
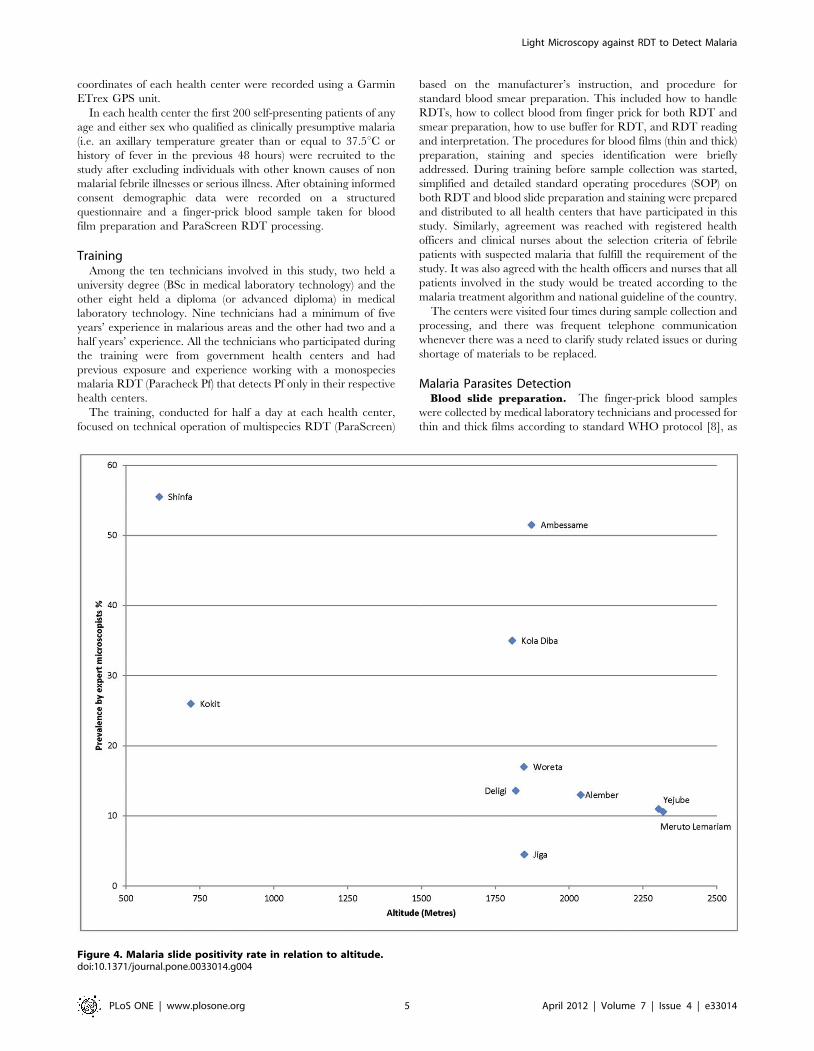
Figure 4. Malaria slide positivity rate in relation to altitude.doi:10.1371/journal.pone.0033014.g004
Light Microscopy against RDT to Detect Malaria
PLoS ONE | www.plosone.org 5 April 2012 | Volume 7 | Issue 4 | e33014

previously described [6]. Slides were also sent for expert
microscopy at The Carter Center in Addis Ababa where they
were examined in blinded fashion.
Rapid Diagnostic Tests. Patients were tested with
ParaScreen Pan/PfH (Zephyr Biomedical systems, Verna, Goa,
India) device according to the manufacture’s instruction.
ParaScreen RDT had long expiry dates (6 months or more) and
were stored according to the manufacturer’s recommendations (4–
30uC). Tests with no band at the control line were considered
invalid. Band formation on the Pan-line only was considered to be
evidence of non-falciparum malaria (presumably P. vivax infection)
whilst bands at both Pan and Pf were considered P.falciparum or
mixed infections.
Statistical analysis. Statistical analysis was conducted using
SPSS version 15.0 (IBM http://www-01.ibm.com/software/
analytics/spss/) and RevMAN 5.1 (Review Manager (RevMan)
[Computer program]. Version 5.1. Copenhagen: The Nordic
Cochrane Centre, The Cochrane Collaboration, 2011). The
performance of health center microscopy and of ParaScreen
RDT was determined by calculating the sensitivity, specificity,
positive predictive value and negative predictive value against
reference laboratory microscopy as the gold standard. Sensitivity
was calculated as the proportion of positive test results against true
positives; specificity was calculated as a proportion of negative test
results against true negatives. The positive predictive value was
calculated as a proportion of true positive results among all
positively reacting samples and the negative predictive was
calculated as the proportion of true negative results among all
negatively reacting samples. Proportions were compared using the
chi-squared test. Summary receiver operator characteristic curves
(SROC) were prepared in RevMAN for the two comparisons
(local microscopy vs expert microscopy; RDT vs expert micros-
copy) and presented side by side for each of three outcomes (any
malaria positive, P.falciparum or mixed, P.vivax or PAN only) by
health center.
Results
Locations of the health centers are shown in Figure 1. Out of
2000 recruited patients, 1997 febrile cases were examined for
malaria parasites by blood slide microscopy (198 to 200 per health
Figure 5. Sensitivity and specificity of local health centre microscopy and RDT compared to expert microscopy for the outcome‘positive for any malaria species’, by health center. TP = true positive; FP = false positive; FN = false negative; TN = true negative.doi:10.1371/journal.pone.0033014.g005
Figure 6. Summary receiver operator characteristic curve(SROC) for local health centre microscopy and RDT comparedto expert microscopy for the outcome ‘positive for any malariaspecies’.doi:10.1371/journal.pone.0033014.g006
Light Microscopy against RDT to Detect Malaria
PLoS ONE | www.plosone.org 6 April 2012 | Volume 7 | Issue 4 | e33014

center). Out of these, 56.2% were males and the remaining were
females. The age range was 8 months to 85 years with a mean of
20.7 years. Of the 1997 persons tested by slide, 1993 samples were
also examined by ParaScreen RDT at the health centers. During
supervisory visits to the health centers, it was observed in some
health centers that the technicians were overloaded with different
laboratory work due to high flow of outpatients seeking treatment
and laboratory tests.
The results for all the health centers combined are shown in the
flow chart in Figure 2. By expert microscopy (the gold standard),
23.8% of the 1997 patients tested were positive for malaria
parasites, with a range from 4.5% to 55.5% by health center
(Table 1 and Figure 3). Results for health center microscopy were
overall 22.3% positive (N = 1997) with a range of 3.0 to 54.1%;
and for ParaScreen RDT 22.2% positive (N = 1993) with a range
of 4.5 to 49.5%. These differences between expert microscopists,
Table 2. Health center microscopy compared to expert microscopy: any malaria species.
Health center Sensitivity % (95% CI) Specificity % (95% CI)Positive predictive value %(95% CI)
Negative predictive value %(95% CI)
Shinfa 94.6 (88.1–97.9) 96.6 (90.5–99.3) 97.2 (92.1–99.4) 93.5 (86.3–97.6)
Ambessame 92.2 (85.3–96.6) 100.0 (96.3–100) 100.0 (96.2–100) 92.4 (85.5–96.7)
Kola Diba 91.4 (82.3–96.8) 98.5 (94.6–99.8) 96.9 (89.5–99.6) 95.5 (90.5–98.3)
Kokit 82.7 (69.7–91.8) 99.3 (96.3–99.9) 97.7 (87.9–99.9) 94.2 (89.3–97.3)
Woreta 91.2 (76.3–98.1) 95.2 (90.7–97.9) 79.5 (63.5–90.7) 98.1 (94.7–99.6)
Deligi 96.3 (81.0–99.9) 95.9 (91.8–98.3) 78.8 (61.1–91.0) 99.4 (96.7–99.9)
Alember 73.1 (52.2–88.4) 99.4 (96.9–99.9) 95.0 (75.1–99.9) 96.1 (92.2–98.4)
Yejube 77.3 (54.6–92.2) 99.4 (96.9–99.9) 94.4 (72.7–99.9) 93.7 (93.7–99.1)
Meruto Lemariam 76.2 (52.8–91.8) 100.0 (97.9–100) 100.0 (79.4–100) 97.3 (93.4–99.1)
Jiga 44.4 (13.7–78.8) 98.9 (96.3–99.9) 66.7 (22.3–95.7) 97.4 (94.1–99.2)
TOTAL 88.4 (85.2–91.2) 98.4 (97.6–98.9) 94.4 (91.8–96.3) 96.5 (95.4–97.3)
doi:10.1371/journal.pone.0033014.t002
Figure 7. Sensitivity and specificity of local health centre microscopy and RDT compared to expert microscopy for the outcome‘positive for P.falciparum or mixed infection’, by health center. TP = true positive; FP = false positive; FN = false negative; TN = true negative.doi:10.1371/journal.pone.0033014.g007
Light Microscopy against RDT to Detect Malaria
PLoS ONE | www.plosone.org 7 April 2012 | Volume 7 | Issue 4 | e33014

health center microscopists and RDTs in overall percent positive
are not statistically significant. However, they mask significant
variation at the health center level.
Altitudinal variation in relation to malaria slide positivity is
shown in Figure 4. In general there was a declining trend of
positivity rate with altitude, with the lowest rates being observed at
altitudes higher than 2000 meters above sea level, but there were
two health centers between 1750 and 2000 meters above sea level
with high slide positivity rates (Ambessame with 51.5% and Kola
Diba with 35% slide positivity rate). The possible explanation for
high malaria positive rate in these two health centers at high
altitude could be that the majority of the patients were from the
catchment villages of lower altitude of known malarious areas.
Health Center Microscopy Compared to ExpertMicroscopy
The majority of infections (57.7%) detected by expert
microscopists were P.falciparum only, with 24.6% P.vivax and
17.7% mixed infections (Table 1 and Figure 2). The overall ratio
of P.falciparum to P.vivax (1.78:1 for the experts) was comparable for
the health center microscopists (1.69:1).
By individual health center, overall percent positive was not
significantly different between health center and expert microsco-
pists in any health center. However the general concordance in
slide positive rate mentioned above and shown for the total sample
in Figure 3 does not represent the complete picture, since there
was not complete overlap in the positives or the species identified
by the two sets of microscopists (Figure 2).
Figure 5 expresses the sensitivity and specificity for the outcome
of malaria positive (any species) at each health center against
expert microscopy, and Figure 6 shows the results in Summary
Receiver Operator characteristic (SROC) format. The positive
and negative predictive values are given in Table 2.
The overall sensitivity of microscopy for any malaria species by
the health center microscopists was 88.4% (95% CI 85.2–91.2)
and the specificity was 98.4% (95% CI 97.6–98.9). In the six
health centers with highest prevalence (Shinifa, Ambessame, Kola
Diba, Woreta, Deligi and Alember), sensitivity was greater than
90% in five of them and above 80% in Kokit (Figure 5). In three of
the medium transmission areas (Meruto-Lemariam, Yejube and
Alember), sensitivity of 70 to 80% was observed. Notably, Figure 5
shows very poor sensitivity by the health centre microscopist of
44.4% (95% CI 13.7–78.8) at Jiga health center, which had the
lowest positivity rate of all the centers. Specificity was above 95%
at all the centers.
Figures 7 and 8 show the equivalent results for the comparison
of health center microscopy versus expert microscopy for
P.falciparum or mixed infections. Positive and negative predictive
values are given in Table 3. Sensitivity for P.falciparum was above
80% in 7 of the 10 centers, and specificity was 98% or higher in all
(Figure 7). Two sites (Yejube and Jiga) had relatively low sensitivity
for P.falciparum (,60%).
For P.vivax results are shown in Figs. 9 and 10. Sensitivity and
specificity are shown graphically in Figure 9 while positive and
negative predictive values are in Table 4. For P.vivax (Figure 9), the
majority of the sites had sensitivity above 80% and specificity was
Figure 8. Summary receiver operator characteristic curve(SROC) for local health centre microscopy and RDT comparedto expert microscopy for the outcome ‘positive for P.falciparumor mixed infection’.doi:10.1371/journal.pone.0033014.g008
Table 3. Health center microscopy compared to expert microscopy: P.falciparum infection only.
Health center Sensitivity % (95%CI) Specificity % (95%CI)Positive predictive value %(95%CI)
Negative predictive value %(95%CI)
Shinfa 93.3 (85.1–97.8) 98.4 (94.3–99.8) 97.2 (90.3–99.7) 96.1 (91.1–98.7)
Ambessame 93.6 (82.5–98.7) 100.0 (97.6–100.0) 100.0 (91.9–100) 98.1 (94.5–99.6)
Kola Diba 89.5 (78.5–96.0) 98.6 (95.0–99.8) 96.2 (87.0–99.5) 95.9 (99.3–98.5)
Kokit 89.5 (75.2–97.1) 100.0 (97.6–100) 100.0 (89.7–100) 97.6 (93.9–99.3)
Woreta 85.7 (57.2–98.2) 98.4 (95.4–99.7) 80.0 (51.9–95.7) 98.9 (96.1–99.9)
Deligi 100.0 (66.4–100) 98.9 (96.2–99.8) 81.8 (48.2–99.7) 100.0 (98.5–100.0)
Alember 30.0 (6.7–65.3) 100.0 (98.1–100) 100.0 (29.2–100) 96.5 (92.8–98.6)
Yejube 20.0 (0.5–71.6) 99.5 (97.2–99.9) 50.0 (1.3–98.7) 97.9 (94.9–99.5)
Meruto Lemariam 100.0 (79.4–100) 100.0 (98.0–100) 100.0 (79.4–100) 100.0 (98.0–100)
Jiga 0.0 100.0 (98.1–100) 0.0 98.5 (95.7–99.7)
TOTAL 87.6 (83.1–91.3) 99.4 (98.9–99.7) 96.0 (92.8–98.1) 98.1 (97.3–98.7)
doi:10.1371/journal.pone.0033014.t003
Light Microscopy against RDT to Detect Malaria
PLoS ONE | www.plosone.org 8 April 2012 | Volume 7 | Issue 4 | e33014

very good; only one site (Meruto Lemariam) showed very poor
sensitivity for P.vivax.
ParaScreen Rapid Diagnostic Test Compared to ExpertMicroscopy
For any malaria species (Figure 6), the overall sensitivity of
RDTs was 79.4%. Only 3 of the health centers (Ambessame, Kola
Diba and Woreta) had sensitivity over 90%), two (Kokit and
Meruto Lemariam) were between 80 and 90%, one (Shinfa) was
79% and the other four were below 60% sensitivity. Specificity
was very good overall with the exception of Meruto Lemarian with
86% specificity. The SROC curves for the outcomes of malaria
positive (any species) are shown in Figure 7 while positive and
negative predictive values are in Table 5.
The proportion of positives (any species) detected by RDT was
significantly lower than the expert microscopists at two health
Figure 9. Sensitivity and specificity of local health centre microscopy and RDT compared to expert microscopy for the outcome‘P.vivax or PAN only’, by health center. TP = true positive; FP = false positive; FN = false negative; TN = true negative.doi:10.1371/journal.pone.0033014.g009
Table 4. Health center microscopy compared to expert microscopy: P.vivax only.
Health center Sensitivity % (95%CI) Specificity % (95%CI)Positive predictive value %(95%CI)
Negative predictive value %(95%CI)
Shinfa 93.8 (69.8–99.8) 99.5 (97.0–99.9) 93.8 (69.8–99.8) 99.5 (97.0–99.9)
Ambessame 86.1 (70.5–95.3 100.0 (97.8–100) 100.0 (88.8–100) 97.0 (93.2–99.0)
Kola Diba 100.0 (63.1–100 100.0 (98.1–100) 100.0 (63.1–100) 100.0 (98.1–100)
Kokit 80.0 (28.4–99.5) 99.5 (97.2–99.9) 80.0 (28.4–99.5) 99.5 (97.2–99.9)
Woreta 100.0 (69.2–100) 97.9 (94.7–99.4) 71.4 (41.9–91.6) 100.0 (98.0–100)
Deligi 100.0 (75.1–100) 97.3 (93.9–99.1) 68.8 (41.3–88.9) 100.0 (97.9–100)
Alember 100.0 (54.1–100.0) 100.0 (98.1–100.0) 100.0 (54.1–100.0) 100.0 (98.1–100.0)
Yejube 93.8 (69.8–99.8) 100.0 (97.0–99.9) 100.0 (78.2–100) 99.5 (97.0–99.9)
Mertu-Lemariam 0.0 100.0 (98.1–100) 0.0 97.5 (94.2–99.2)
Jiga 50.0 (6.8–93.2) 98.9 (96.4–99.9) 50.0 (6.8–93.2) 98.9 (96.4–99.9)
TOTAL 82.2 (79.7–92.6) 99.3 (98.8–99.6) 88.7 (81.5–93.8) 99.2 (98.7–99.6)
doi:10.1371/journal.pone.0033014.t004
Light Microscopy against RDT to Detect Malaria
PLoS ONE | www.plosone.org 9 April 2012 | Volume 7 | Issue 4 | e33014

centers: Shinifa (44% RDT vs 55.5% expert microscopy, Chi-
sq = 5.29, p = 0.021) and Deligi (7.1% RDT vs 13.6% expert
microscopy, Chi-sq = 4.60, p = 0.032), while percent positive was
higher by RDT at Meruto Lemariam (21.1% RDT vs. 13.2%
expert microscopy, Chi-sq = 4.49, p = 0.034). The others were not
significantly different.
For P.falciparum or mixed infection sensitivity and specificity are
shown in Figure 7, SROC in Figure 8 and PPV and NPV given in
Table 6. Four of the health centers (Deligi, Alember, Yejube and
Jiga) with lower prevalence (see Table 1) performed poorly with
RDTs (Figure 7). Meruto Lemariam was the exception among the
health centers with low prevalence in achieving very good
sensitivity for P.falciparum, although at the expense of specificity.
For P.vivax (PAN only by RDT), Figures 9 and 10 and Table 7
present the results. The same four low prevalence centers
mentioned above (Deligi, Alember, Yejube and Jiga) performed
very poorly (,60%) on RDT sensitivity, and Meruto Lemarian
had only 60% sensitivity. The two centers with highest overall
prevalence (Shinfa and Ambessame) had 88–89% sensitivity while
the other 3 were over 90%.
ParaScreen Rapid Diagnostic Test Compared to HealthCenter Microscopy
Only indirect comparison is possible because the same
technicians conducted both tests in each health center, which
compromised the blinding. The relative accuracies of health centre
microcopy and RDT for each of three outcomes (any species, Pf or
mixed, Pv) are shown in the Summary ROC curves in Figures 6, 8
and 10 respectively. In each case the RDT predicted curve lies to
the right and below (less accurate) that for HC microscopy.
The five sites with highest prevalence were relatively consistent
in giving good or very good performance for both microscopy and
RDT compared to expert microscopy. However overall, the
performance of RDT was not as good as health center microscopy,
and it was particularly poor in the five sites with lower prevalence.
As expected, the RDTS performed in general less well for P.vivax
than P.falciparum.
Discussion
Rapid diagnostic tests are being strongly promoted for wider use
to ensure that all suspected malaria cases receive a diagnosis before
treatment. Most RDT studies have tested whether RDTs are as
Table 5. Rapid Diagnostic Test (Pf/PAN or PAN) compared to expert microscopy: any malaria species.
Health center Sensitivity % (95%CI) Specificity % (95%CI)Positive predictive value %(95%CI)
Negative predictive value %(95%CI)
Shinfa 79.3 (71.7–86.8) 100.0 (95.9–100.0) 100.0 (95.9–100.0) 79.5 (72.0–86.9)
Ambessame 90.3 (84.6–96.0) 93.8 (89.0–98.6) 93.9 (89.2–98.6) 90.1 (84.3–95.9)
Kola Diba 90.0 (83.0–97.0) 96.2 (98.2–99.5) 92.6 (86.4–98.6) 94.7 (90.9–98.5)
Kokit 84.6 (74.8–94.4) 93.9 (90.1–97.8) 83.0 (72.9–93.1) 94.6 (90.9–98.2)
Woreta 100.0 (89.7–100.0) 98.2 (94.8–99.6) 91.9 (78.1–98.3) 97.6 (93.9–99.3)
Deligi 48.1 (29.3–67.0) 99.4 (96.8–99.9) 92.9 (66.1–100.0) 92.4 (88.6–96.2)
Alember 53.8 (34.7–73.0) 98.3 (95.0–99.6) 82.4 (56.6–96.2) 93.4 (89.9–97.0)
Yejube 27.3 (8.7–45.9) 94.9 (91.7–98.2) 40.8 (15.2–64.8) 94.9 (91.7–98.2)
Meruto Lemariam 85.7 (70.7–100.7) 86.5 (81.5–91.5) 42.9 (27.9–57.8) 98.1 (95.9–100)
Jiga 55.6 (23.1–88.0) 97.9 (95.9–99.9) 55.6 (23.1–88.0) 97.9 (95.9–99.9)
TOTAL 79.4 (75.5–82.9) 95.7 (94.6–96.7) 85.3 (81.6–88.5) 93.7 (92.4–94.9)
doi:10.1371/journal.pone.0033014.t005
Table 6. Rapid Diagnostic Test (Pf/PAN) compared to expert microscopy: P.falciparum and mixed infections.
Health center Sensitivity % (95%CI) Specificity % (95%CI)Positive predictive value %(95%CI)
Negative predictive value% (95%CI)
Shinfa 77.9 (69.9–86.2) 100.0 (96.5–100) 100.0 (95.1–100) 83.3 (76.8–89.8)
Ambessame 91.0 (84.2–97.9) 98.5 (94.7–99.8) 96.8 (89.0–99.6) 95.6 (92.2–99.0)
Kola Diba 88.7 (80.8–96.6) 96.4 (93.3–99.5) 91.7 (84.7–98.7) 95.0 (91.4–98.6)
Kokit 83.0 (72.2–93.7) 98.7 (95.4–99.8) 95.1 (83.5–99.4) 95.0 (91.6–98.4)
Woreta 91.7 (73.0–98.9 99.4 (96.9–99.8) 95.7 (78.1–99.9) 98.9 (95.9–99.8)
Deligi 31.3 (8.5–54.0) 100.0 (97.9–100) 100.0 (47.8–100) 94.3 (91.0–97.6)
Alember 45.0 (23.2–66.8) 99.4 (96.9–99.9) 90.0 (55.5–99.7) 94.2 (90.9–97.5)
Yejube 33.3 (4.4–71.1) 96.9 (94.5–99.3) 25.0 (5.0–55.0) 97.9 (95.9–99.9)
Meruto Lemariam 93.8 (69.8–99.8) 87.4 (82.6–92.2) 39.5 (23.9–55.0) 99.4 (96.6–99.9)
Jiga 60.0 (14.7–94.7) 98.5 (95.6–99.7) 50.0 (10.0–90.0) 98.9 (96.3–99.9)
TOTAL 79.6 (75.1–83.7) 97.4 (96.5–98.1) 86.7 (82.8–90.4) 95.6 (94.5–96.6)
doi:10.1371/journal.pone.0033014.t006
Light Microscopy against RDT to Detect Malaria
PLoS ONE | www.plosone.org 10 April 2012 | Volume 7 | Issue 4 | e33014

accurate as expert microscopy, and these previous studies were
mostly designed to assess the performance of the tests per se, rather
than their accuracy in routine use. There have been few
evaluations of the accuracy of RDTs compared to the status quo
of routine health center microscopy, or of variation in perfor-
mance of both routine microscopy and RDT between sites. The
results of such studies point to differences in strict application of
knowhow gained during training and previous work experience in
malarious areas (for both methods) as well as storage or other
possible factors that affect the correct use of RDTs. Even if RDTS
are not as good as expert microscopy, in some cases they may be
better than routine microscopy. In this study we address this issue
indirectly by examining the performance of both routine
microscopy and RDTs as performed in ten rural health centers,
compared to the gold standard of expert microscopy.
Overall, microscopists in ten rural health centers in Amhara
region, Northwest Ethiopia showed fair to very good performance
compared to expert microscopy, with the exception of the health
center with the lowest prevalence of 4.5% among suspected
malaria cases. One other health center did badly with P.vivax slides
only. Microscopists in health centers in these study sites of
Northwest Ethiopia are performing to a standard higher than has
been observed in some other malaria endemic areas [9]. However
there are still some gaps and inconsistencies in microscope
capacity, and lack of a standardized quality control system for
diagnostics, as has been observed by others [10].
For RDTs, there was large variation between sites in the
performance, with generally lower performance than for local
microscopy, when each is compared to expert microscopy. Four of
the ten sites (of the five with less malaria) performed very poorly on
RDT sensitivity in general, and the other was very poor for P.vivax.
Even one of the sites with high prevalence demonstrated only a fair
level of sensitivity with RDTs. Sensitivity of the test (unlike positive
predictive value) should not be affected by prevalence. A decrease
in positive predictive value for RDT in one site with lower
prevalence was also observed in Uganda [11].
During supervisory visits it was noted that although the
technicians were observed to be proficient in performing the tests
according to standard operating procedures, they were overloaded
with the many other lab tests they are expected to perform in
addition to malaria diagnosis. Under real world conditions, when
pressed with large numbers of patients, they may use rapid staining
methods and skimp on slide examination time or number of fields
to be examined (especially if densities are low) just to satisfy the
clients. Low prevalence in an area with few requests for malaria
diagnosis gives the technician limited ability to maintain his or her
skills in parasite identification by microscopy, or to practice
reading and interpreting faint positive RDT tests. More quality
control checks and frequent refresher trainings are needed in low
incidence areas, or as malaria incidence declines due to extensive
control efforts.
Overall our results demonstrate slightly lower sensitivity with
RDTs than has been observed in Ethiopia and elsewhere [7,10].
The low sensitivity with ParaScreen in some sites means that cases
are being missed while high false positive rates means that persons
without malaria (and possibly with other infections) are getting
Figure 10. Summary receiver operator characteristic curve(SROC) for local health centre microscopy and RDT comparedto expert microscopy for the outcome ‘P.vivax or PAN only’.doi:10.1371/journal.pone.0033014.g010
Table 7. Rapid Diagnostic Test (PAN only) compared to expert microscopy: P.vivax only.
Health center Sensitivity % (95%CI) Specificity % (95%CI)Positive predictive value %(95%CI)
Negative predictive value %(95%CI)
Shinfa 87.5 (61.7–98.5) 100.0 (98.0–100.0) 100.0 (76.8–100) 98.9 (96.2–99.8)
Ambessame 88.9 (78.6–99.2) 97.6 (95.2–99.9) 88.9 (78.6–99.2) 97.6 (95.2–99.9)
Kola Diba 100.0 (63.1–100) 100.0 (98.1–100.0) 100.0 (63.1–100) 100.0 (98.1–100.0)
Kokit 100.0 (47.8–100) 96.4 (93.8–99.0) 41.7 (13.8–69.6) 100.0 (98.1–100)
Woreta 100.0 (69.2–100) 97.9 (95.9–99.9) 71.4 (47.8–95.1) 100.0 (98.0–100)
Deligi 54.5 (25.1–84.0) 98.4 (95.4–99.7) 66.7 (35.9–97.5) 97.4 (95.1–99.6)
Alember 50.0 (10.0–90.0) 97.9 (95.9–99.9 42.9 (6.2–79.5) 98.5 (95.5–99.7)
Yejube 25.0 (3.8–46.2) 98.4 (95.3–99.7) 57.1 (20.5–93.8) 93.8 (90.4–97.2)
Meruto Lemariam 60.0 (14.7–94.7) 99.5 (97.2–99.9) 75.0 (19.4–99.4) 99.0 (96.3–99.8)
Jiga 50.0 (10.0–90.0) 99.5 (97.2–99.9) 66.7 (9.4–99.2) 98.9 (96.4–99.8)
TOTAL 74.4 (65.5–81.9) 98.6 (97.9–99.1) 76.3 (67.4–83.8) 98.4 (97.7–98.9)
doi:10.1371/journal.pone.0033014.t007
Light Microscopy against RDT to Detect Malaria
PLoS ONE | www.plosone.org 11 April 2012 | Volume 7 | Issue 4 | e33014

treated for malaria in some sites. These findings suggest that there
are deficiencies in strict application of training materials, lack of
previous skill in performing multispecies RDTs, and/or possible
problems in RDT handling conditions in some sites, in addition to
large demands on technicians’ time for other lab tests. Where no
adequate and standard malaria microscopy exists (for example in
health posts staffed by Health Extension Workers in moderate to
high malarious areas), this study supports the introduction of
multispecies RDTs for improvement of diagnosis of malaria,
provided that they are accompanied by adequate training on
procedure and limitations of the tests, as well as continual
supervision and overall quality control mechanisms. However,
microscopy in rural health centers remains the local ‘gold
standard’ and should not be neglected for refresher training and
supervision especially where problems are identified in particular
centers as in this study.
Acknowledgments
We are grateful to the Amhara Regional Health Bureau for supporting the
successful accomplishment of the study. We thank all the health staff
(health officers, nurses and laboratory technicians) of the Amhara Regional
Health Bureau who participated in the data and sample collection in
selected health centers. We thank Stephanie Palmer for assistance with the
manuscript.
Author Contributions
Conceived and designed the experiments: TE PMG TG EBS FOR PME.
Performed the experiments: TE TT BM AG ZT BA AWM AM. Analyzed
the data: TE FA PMG AWM. Wrote the paper: TE PMG PME.
References
1. Federal Ministry of Health (2006) National five-year strategic plan for malaria
prevention and control in Ethiopia, 2006–2010. Addis Ababa, Ethiopia: FederalDemocratic Republic of Ethiopia, Ministry of Health.
2. Long GE (2009) Requirements for diagnosis of malaria at different levels of the
laboratory network in Africa. Am J Clin Pathol 131: 858–860.3. World Health Organization (2010) : Guidelines for the Treatment of Malaria.
Second edition. Geneva: World Health Organization.4. Federal Ministry of Health (2011) Malaria: Diagnosis and Treatment Guidelines
for Health Workers in Ethiopia. Third edition. Addis Ababa, Ethiopia: Federal
Democratic Republic of Ethiopia, Ministry of Health.5. Endeshaw T, Gebre T, Ngondi J, Graves PM, Shargie EB, et al. (2008)
Evaluation of light microscopy and rapid diagnostic test for the detection ofmalaria under operational field conditions: a household survey in Ethiopia.
Malaria J 7: 118. doi:10.1186/1475-2875-7-118.
6. Endeshaw T, Graves PM, Shargie EB, Gebre T, Ayele B, et al. (2010)Comparison of ParaScreen Pan/Pf, Paracheck Pf and light microscopy for
detection of malaria among febrile patients, Northwest Ethiopia. Trans Roy SocTrop Med Hyg 104: 467–474.
7. Ashton RA, Kefyalew T, Tesfaye G, Counihan H, Yadeta D, et al. (2010)
Performance of three multi-species rapid diagnostic tests for diagnosis of
Plasmodium falciparum and Plasmodium vivax malaria in Oromia Regional State,
Ethiopia. Malaria J 9: 297. doi 10.1186/1475-2875-9-297.
8. World Health Organization (1991) Basic Malaria Microscopy. Part I: Learner’s
guide. Geneva, Switzerland: World Health Organization.
9. Durrheim DN, Becker PJ, Billinghurst K, Brink A (1997) Diagnostic
disagreement – the lessons learned from malaria diagnosis in Mpumalanga.
SAMJ 87: 609–611.
10. Hailegiorgis B, Girma S, Melaku Z, Demeke L, Gebresellasie S, et al. (2010)
Laboratory malaria diagnostic capacity in health facilities in five administrative
zones of Oromia Regional State, Ethiopia. Trop Med Int Health 15:
1449–1457.
11. Hopkins H, Bebell L, Kambale W, Dokomajilar C, Rosenthal PJ, et al. (2008)
Rapid diagnostic tests for malaria at sites of varying transmission intensity in
Uganda. J Inf Dis 197: 510–518.
Light Microscopy against RDT to Detect Malaria
PLoS ONE | www.plosone.org 12 April 2012 | Volume 7 | Issue 4 | e33014