Performance Measurement and Improvement at FINCA Uganda
41
SIT Graduate Institute/SIT Study Abroad SIT Digital Collections Independent Study Project (ISP) Collection SIT Study Abroad Fall 2011 Performance Measurement and Improvement at FINCA Uganda Aaron Cowans SIT Study Abroad Follow this and additional works at: hps://digitalcollections.sit.edu/isp_collection Part of the Business Administration, Management, and Operations Commons , Finance and Financial Management Commons , and the International Business Commons is Unpublished Paper is brought to you for free and open access by the SIT Study Abroad at SIT Digital Collections. It has been accepted for inclusion in Independent Study Project (ISP) Collection by an authorized administrator of SIT Digital Collections. For more information, please contact [email protected]. Recommended Citation Cowans, Aaron, "Performance Measurement and Improvement at FINCA Uganda" (2011). Independent Study Project (ISP) Collection. 1226. hps://digitalcollections.sit.edu/isp_collection/1226
Transcript of Performance Measurement and Improvement at FINCA Uganda

SIT Graduate Institute/SIT Study AbroadSIT Digital Collections
Independent Study Project (ISP) Collection SIT Study Abroad
Fall 2011
Performance Measurement and Improvement atFINCA UgandaAaron CowansSIT Study Abroad
Follow this and additional works at: https://digitalcollections.sit.edu/isp_collection
Part of the Business Administration, Management, and Operations Commons, Finance andFinancial Management Commons, and the International Business Commons
This Unpublished Paper is brought to you for free and open access by the SIT Study Abroad at SIT Digital Collections. It has been accepted forinclusion in Independent Study Project (ISP) Collection by an authorized administrator of SIT Digital Collections. For more information, pleasecontact [email protected].
Recommended CitationCowans, Aaron, "Performance Measurement and Improvement at FINCA Uganda" (2011). Independent Study Project (ISP) Collection.1226.https://digitalcollections.sit.edu/isp_collection/1226

Performance Measurement and Improvement at FINCA Uganda
Aaron Cowans SIT Uganda: Microfinance and Entrepreneurship Academic Advisor: Godfrey Byekwaso Academic Director: Martha Wandera Fall 2011

2
Dedication This work is dedicated to my family in America and the amazing people I have met here in
Uganda, who have all helped me throughout my journey.

3
Acknowledgements
While so many people helped me along my way, I want to acknowledge the following people
in particular who were instrumental to my experience here.
Martha Wandera, Helen Lwemamu and the rest of the SIT staff for putting together such a
fantastic program. I have learned so much here and made memories which will last a lifetime. This
was all possible because of your constant hard work and dedication.
All of the staff at FINCA Uganda and FINCA International who so graciously hosted me as
an intern and supported me through the duration of my internship. In particular, Godfrey
Byekwaso, Julius Omoding, Joseph Ssekajja, and the Operations and Finance departments and
FINCA Uganda provided me with all of the help I needed to complete my internship.
My family in America who allowed me to come on this program and always have been there
for me. To my mom, Deborah, thank you for providing me with continual emotional support. To
my dad, Bruce, thank you for providing me with advice and help in refining my internship projects
and career prospects.
To my family in Uganda, thank you so much for hosting me through the duration of this
entire program. Barbra Ddungu, along with Peace, Helen, and Paula – you warmly welcomed me
into your home, and I had a great time living with you for these three and a half months.
4
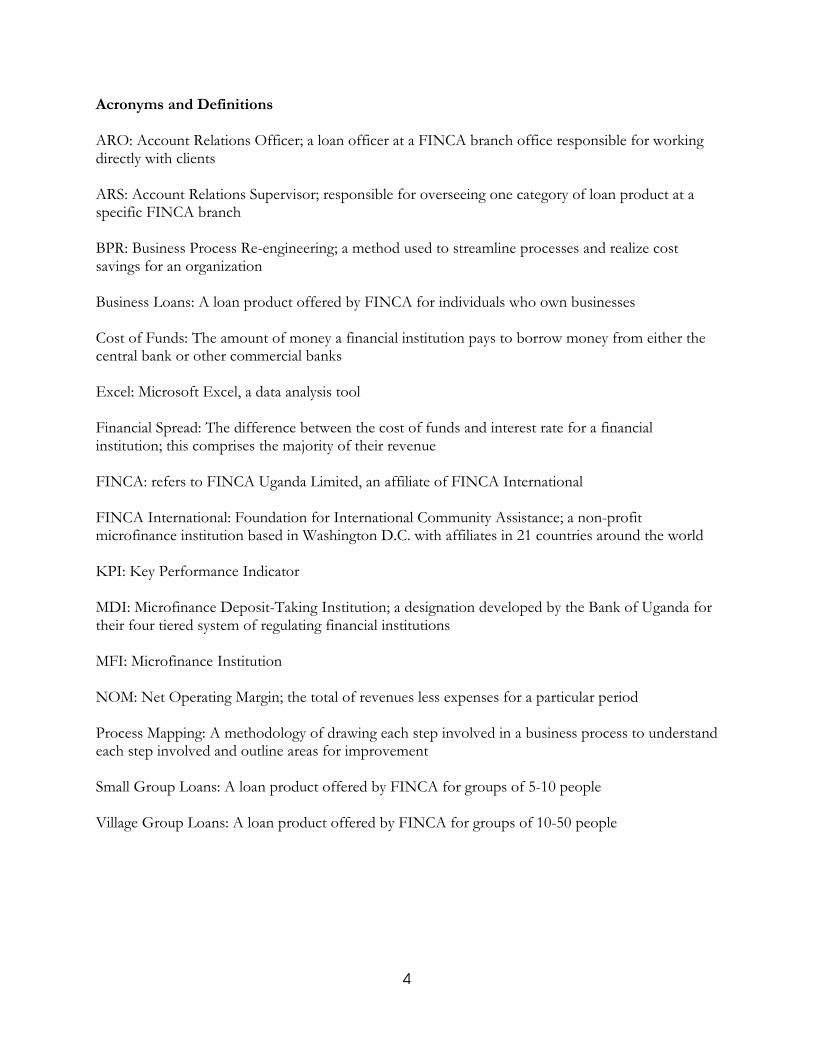
Acronyms and Definitions ARO: Account Relations Officer; a loan officer at a FINCA branch office responsible for working directly with clients ARS: Account Relations Supervisor; responsible for overseeing one category of loan product at a specific FINCA branch BPR: Business Process Re-engineering; a method used to streamline processes and realize cost savings for an organization Business Loans: A loan product offered by FINCA for individuals who own businesses Cost of Funds: The amount of money a financial institution pays to borrow money from either the central bank or other commercial banks Excel: Microsoft Excel, a data analysis tool Financial Spread: The difference between the cost of funds and interest rate for a financial institution; this comprises the majority of their revenue FINCA: refers to FINCA Uganda Limited, an affiliate of FINCA International FINCA International: Foundation for International Community Assistance; a non-profit microfinance institution based in Washington D.C. with affiliates in 21 countries around the world KPI: Key Performance Indicator MDI: Microfinance Deposit-Taking Institution; a designation developed by the Bank of Uganda for their four tiered system of regulating financial institutions MFI: Microfinance Institution NOM: Net Operating Margin; the total of revenues less expenses for a particular period Process Mapping: A methodology of drawing each step involved in a business process to understand each step involved and outline areas for improvement Small Group Loans: A loan product offered by FINCA for groups of 5-10 people Village Group Loans: A loan product offered by FINCA for groups of 10-50 people

5
Abstract This report summarizes a six week internship undertaken by the researcher with FINCA
Uganda Limited, an affiliate of FINCA International (Foundation for International Community
Assistance). The broad objective of this internship was to assess FINCA Uganda’s operations from
a financial standpoint and engineer methods to sustainably reduce operating costs. FINCA was
chosen because they are a prominent MDI (Microfinance Deposit-Taking Institution) in Uganda and
expressed interest in the proposed project.
Working from the broad internship objective, the Chief Executive Officer of FINCA
Uganda and Africa Regional Finance Manager of FINCA International helped refine specific
projects to assess performance and improve operational efficiency. Due to the focus of the
internship, the researcher worked closely with the Operations and Finance departments of FINCA.
Additionally, the Africa Regional Finance Manager of FINCA International and individuals from the
Ben Kiwanuka branch of FINCA Uganda were very helpful in providing information and insight to
help with projects. Microsoft Excel was used to analyze data collected and help reach meaningful
conclusions.
The projects were structured chronologically to first measure performance, and then proceed
to devise ways to improve it. Therefore, the first two projects undertaken were the benchmarking
studies comparing all branches of FINCA Uganda, and then comparing all worldwide affiliates of
FINCA International. After seeing the results from the benchmarking study for FINCA Uganda,
projects were undertaken to improve loan processing speed and decrease transportation costs for
loan officers. The results from these projects and subsequent recommendations stand to greatly
benefit FINCA Uganda.

6
Table of Contents DEDICATION……………………………………………………………………………………….2
ACKNOWLEDGEMENTS……………………………………………………………………………..3
LIST OF ACRONYMS………………………………………………………………………………...4
ABSTRACT…………………………………………………………………………………………..5
INTRODUCTION…………………………………………………………………………………….7
BACKGROUND…………………………………………………………………………….................8
OBJECTIVES……………………………………………………………………………………….10
JUSTIFICATION…………………………………………………………………………………….11
METHODOLOGY
DATA ANALYSIS…………………………………………………………………………...12
INTERVIEWS………………………………………………………………………………13
PROCESS MAPPING & RE-ENGINEERING………………………………………………….13
FINDINGS & ANALYSIS
BENCHMARKING STUDY FOR FINCA UGANDA…………………………………………...15
BENCHMARKING STUDY FOR FINCA INTERNATIONAL…………………………………...20
BUSINESS PROCESS MAPPING & RE-ENGINEERING FOR LOAN PROCESSING………………24
TRANSPORTATION COST ANALYSIS………………………………………………………..26
CONCLUSIONS…………………………………………………………………………………….29
RECOMMENDATIONS……………………………………………………………………………...31
APPENDICES………………………………………………………………………………………33
BIBLIOGRAPHY……………………………………………………………………………………40

7
Introduction
The information contained in this report is the result of four research projects undertaken
during a six week internship with FINCA Uganda Ltd. Because of the high and increasing cost of
doing business, projects were carried out to assist FINCA with understanding its costs and
subsequently help reduce those costs.
Due to the nature of the internship, the researcher worked closely with the Operations and
Finance departments of FINCA Uganda, located in the organization’s headquarters in Kampala.
Information was also collected by doing interviews with all key members of a branch office:
Account Relations Officers and Account Relations Supervisors for all three loan products (Business
Loans, Small Group Loans, and Village Group Loans), along with the Branch Accountant and
Branch Manager. Because some of the data collected is confidential proprietary information of
FINCA International and FINCA Uganda Ltd., some specific figures have been left out of this
report.
The projects undertaken were organized chronologically as seen in the Objectives section of
this report. Both of the benchmarking studies were completed first because the goal was to
understand what cost drivers make certain branches and affiliates more successful. After gaining
this knowledge, work continued on Business Process Re-engineering (BPR) for loan processing and
analyzing transportation costs for loan officers. The recommendations reached from these projects
were passed on to FINCA executives, and are contained in this report.

8
Background The Foundation for International Community Assistance (FINCA International) began
operating in 1984 as a Microfinance Institution (MFI), opening branches in Latin America with its
headquarters in Washington D.C. Currently, FINCA International has affiliates in 21 countries
worldwide, serving over 800,000 clients located in the following regions: Africa, Eurasia, Greater
Middle East, and Latin America. FINCA Uganda Ltd. was the first affiliate to open in Africa,
beginning operations in 1992. In 2004, FINCA Uganda registered with the Bank of Uganda as a
Microfinance Deposit-Taking Institution (MDI), becoming the first organization to do so. FINCA
Uganda’s mission is “To provide financial services to the country’s lowest-income entrepreneurs so
they can create jobs, build assets, and improve their standard of living” [1]
Because both FINCA Uganda (26 branches in the country) and FINCA International (21
affiliates around the world) have wide ranging operations, benchmarking studies were useful to
understand which branches and affiliates were strong performers or weak performers.
Benchmarking studies are a commonly used feature in cost consulting; within any large organization
there is bound to be a significant difference in performance among different business units. These
studies examined key operating metrics such as operating revenues, operating expenses, net
operating margins, and subsequently ranked the branches and affiliates according to their
performance. Carrying out these benchmarking studies was an essential step to help identify cost
drivers, which differentiated between branches and affiliates who exhibited good or bad cost
control.
As an MDI, FINCA Uganda’s main focus is on giving loans to low income entrepreneurs.
Loan products fall into three main categories: Business Loans, Small Group Loans, and Village
Group Loans. Business Loans are for individuals who own businesses, and can vary from a
minimum of 500,000 UGX to a maximum of 60,000,000 UGX. Small Group Loans are for groups
of 5 to 10 people, with each individual taking a loan from 300,000 UGX to 6,000,000 UGX. Village
Group Loans are for groups of 10 to 50 people, with each individual taking a loan from 50,000
UGX to 6,000,000 UGX. Due to this loan focus, the best way to achieve sustainable cost reduction
was to focus on reducing the cost of loan operations. Process mapping was conducted for all three
categories of loan products, dividing the entire process of loan approval into individual steps. From
there, each step in the process was examined to find how recommendations would effectively
1 The New Vision. “FINCA Uganda”. 12 November 2004.
http://www.enteruganda.com/brochures/20yrsofeconrecaspac.htm

9
streamline the process. The most effective solutions to streamline the process were formulated into
recommendations which will improve loan processing speed and thereby cut costs.
Transportation is also a leading cost driver – accounting for 7% of operating expenses at
FINCA Uganda – so research was carried out to analyze transportation costs and find ways to
decrease those costs. The most arduous, time consuming, and expensive part of the loan approval
process is doing site visits to a client’s business and home. Currently, FINCA has no standard policy
for transportation; Account Relations Officers (AROs) either take public transportation (taxis or
boda bodas) or use FINCA vehicles (cars or motorcycles) and then expense the cost of their travel
to FINCA on a weekly basis. FINCA requested that the researcher analyze transportation records
and speak to AROs to find more cost effective ways of transportation. This will eventually be
incorporated into a single transportation policy.

10
Objectives
The broad objective of this internship was to assess FINCA Uganda’s operations from a
financial standpoint and engineer methods to sustainably reduce operating costs. Specifically,
objectives for each of the four projects undertaken during the duration of the internship were as
follows:
1. Conduct a benchmarking study assessing the operational success of all 26 FINCA Uganda
branches throughout the country.
2. Conduct a benchmarking study comparing the operational and financial success of all 21
FINCA International country affiliates worldwide.
3. Analyze loan processing for Business Loans, Small Group Loans, and Village Group Loans
at FINCA Uganda. Compare the costs and benefits of centralized versus decentralized loan
processing. Make recommendations about how to streamline loan processing.
4. Analyze transportation costs for loan officers at FINCA Uganda. Recommend which
methods of transportation are most cost efficient.

11
Justification
The ongoing economic turbulence in Uganda is increasing the cost of doing businesses for
all enterprises. Inflation has increased rapidly over the past year, currently standing at 29% [2]. The
Central Bank Rate – the rate at which the Bank of Uganda loans money to banks – has also risen,
and is now at 23% [3]. These rising rates mean that operating costs are increasing, especially for
financial institutions.
In addition to unfavorable macroeconomic trends, FINCA faces the unique challenge of a
microfinance institution: it must provide quality services to its customers while dealing with smaller
amounts of money than a commercial bank. For this reason, controlling operating costs is key to
the success of any microfinance institution.
However, in order to achieve lasting cost savings (as opposed to temporary budget cuts), one
must find a way to reengineer operations in a way which continually saves money. Business Process
Re-engineering (BPR) is one of the most effective ways to reach this goal, which is why projects
were undertaken to this effect. Loan processing and transportation were examined using BPR to
help achieve the goal of cost reduction.
2 Bank of Uganda. “Inflation”. http://www.bou.or.ug/bou/rates_statistics/statistics/inflation.html
3 Bank of Uganda. “Financial News Report”.
http://www.bou.or.ug/bou/media/Financial_News_Report/2011/Nov/Financial_News_Report_Iss
ue_No_1086.pdf

12
Methodology Data Analysis Because this internship focused on performance measurement and cost reduction, a good
deal of data analysis was conducted using Microsoft Excel. For the benchmarking study at FINCA
Uganda, the researcher used monthly profit and loss data from all 26 branches countrywide. The
data covered operations from March 2011 through September 2011. To help focus on key
performance indicators, results were compiled for the following five categories: operating revenue,
financial expenses, operating expenses, total expenses, and net operating margin before indirect
expenses. Additionally, results were compiled on the basis of actual monthly figures as compared to
budgeted targets – the percentage of variance between results and expectations. This was done
because simply evaluating total figures would have unfairly skewed results in favor of larger
branches. Also, evaluating the variance helped assess (a) how branches compared to their targets
and (b) how accurate budgeted expectations were.
The benchmarking study for FINCA International was different than the one for FINCA
Uganda because more data was available. In addition to examining the key operating metrics,
balance sheets and income statements for the four regions and 21 affiliates were also analyzed. The
end results for the study were organized into six distinct Key Performance Indicator (KPI)
categories: profitability, growth, asset quality, loan performance, balance sheet structure, and
efficiency. This style of organization resulted in a deep analysis of both operating and financial
metrics from January through April of 2011. Affiliates were compared to both their regional
averages and the overall international averages. Similar to the FINCA Uganda benchmarking study,
affiliates were ranked in all KPI categories to differentiate between the strongest and weakest
performers.
When looking at loan processing, not as much data analysis was conducted. Data on loan
processing was examined to look at how many disbursements were in each of the three loan product
categories. This was useful to see how much time was spent on each category, and provided a good
background to the process mapping. Some of the data from the monthly profit and losses was used
to also provide context for the process maps.
Analyzing transportation expenditures involved a two-fold method of data analysis and
interviews. The monthly profit and loss data also included transportation information, under two
general categories: transportation and vehicles. Transportation includes public transportation, and

13
vehicles includes vehicles and motorcycles. The vehicles section further breaks down to include
vehicle fuel, vehicle maintenance and repairs, motorcycle fuel, and motorcycle maintenance and
repairs. Using this data, a comprehensive analysis was carried out to find salient conclusions from
the data, including the difference between transportation in Kampala and rural areas, the
comparative costs of fuel and maintenance and repairs to the whole of vehicles, and more.
Interviews
While most of the information used in the internship came from data files that FINCA
already had, additional interviews were carried out to supplement the findings. Interviews were
especially useful for process mapping of the three types of loan processing. They also helped refine
how AROs conducted transportation and how their superiors viewed transportation expenses and
policy.
To understand loan processing, interviews were conducted with an ARO and Account
Relations Supervisor (ARS) from Business Loans, Small Group Loans, and Village Group Loans at
the Ben Kiwanuka branch office. Interviews were also conducted with the Branch Accountant and
Branch Manager. Using the information from the interviews about each individual’s role in the
different loan processes, process maps were built and then double checked with all interviewees to
ensure accuracy.
The interviews also helped to understand transportation expenses from a variety of
perspectives. From talking to AROs, it was readily apparent that there was no consistency in how
they traveled. Some loan officers were conscious about the cost of their travels, but most favored
ease of travel over the cost. At the higher levels – Branch Accountant and Branch Manager – there
was more concern over the cost, but this did not appear to be an important item on their agenda.
Most of the concern over transportation costs came from the senior Finance and Operations staff in
the Headquarters.
Process Mapping & Re-engineering
According to the Iowa State University Facility for Planning and Management, “Process
mapping is a workflow diagram to bring forth a clearer understanding of a process or series of
parallel processes” [4]. Process mapping is a useful tool when seeking to understand a complex
process in any organization, one with multiple steps where numerous people are involved. Loan
4 Iowa State University, Facility for Planning and Management. “Process Mapping”.
http://www.fpm.iastate.edu/worldclass/process_mapping.asp

14
processing in FINCA is a perfect example of such a process. Documents are transferred between
many people – the client, AROs, ARSs, Loan Committees, Branch Managers/Accountants, and the
Centralized Accounts in the Headquarters.
The process maps were created by doing interviews with all of the people involved in loan
processing. Each individual’s role was examined in thorough detail to ensure that every step of the
process was captured. After the initial maps were created, they were reviewed with all of the people
involved to ensure accuracy.
Once the process maps were created, the researcher proceeded to examine the steps in the
process which were most costly or unnecessary for FINCA. From there, recommendations were
formulated to address these issues and help streamline the process. The recommendations were
passed on to senior management at FINCA Uganda and FINCA International, who are
contemplating how to best implement recommendations.

15
Findings & Analysis This section contains the findings and analysis of research conducted during the internship.
Because of the complexity of this section, findings are split into four categories, according to each of
the four projects undertaken.
1. Benchmarking study for FINCA Uganda
The first project undertaken during the six week internship was a benchmarking study for
FINCA Uganda. Because FINCA Uganda has 26 operational branches across the country, there is a
considerable variance between the strong performers and weak performers. Using Microsoft Excel
to analyze profit and loss data from all affiliates, branches were compared to each other on five main
metrics: operating revenue, financial expenses, operating expenses, total expenses, and net operating
margin before indirect expenses. When compiling the statistics, it was noticed that Net Operating
Margins, After Indirect Expenses were generally very poor. When ranked, only one branch
(Nakulabye) had a positive Net Operating Margin after Indirect Expenses – meaning that the other
21 branches ranked all failed to meet operating margin targets. Judging from revenues and expenses
– the figures that comprise operating margins – this simply did not seem accurate. The reason
behind these poor statistics was that Indirect/Head Office expenses were recorded in actual terms,
but no budgeted figures were given. Therefore, the total actual figure was much lower than it
should be because total Net Operating Margin budget estimates were too high. This is why only
Net Operating Margin before Indirect Expenses was considered in the compiled figures.
Additionally, this figure is a more accurate representation of a branch’s operating performance
because Indirect/Head Office expenses are paid out by the head office and not incurred by the
branch in the course of their operations.
A table was compiled to compare how each branch ranked in the five categories considered.
The figures are the variance between budgeted targets and the actual results. This shows if a branch
is underperforming, meeting expectations, or exceeding expectations. The tables below contain this
information. Yellow highlighting represents the top five branches in each category – the ideal
benchmark. Red highlighting represents the bottom five branches in each category. The figures are
averages for all data from March through September of 2011. Figure 1 below: Compiled operating
statistics for Operating Revenue, Financial Expenses, and Operating Expenses.

16
Figure 2 below: Compiled operating statistics for total expenses and net operating margin before indirect expenses.
Operating Revenue Financial Expenses Operating Expenses
Hoima 43.5% Mityana -76.4% Kireka -4.6%
Nakulabye 28.3% Iganga -50.7% Koboko -1.7% Kamuli 24.3% Kabale -38.3% Jinja 3.9%
Katwe 23.6% Lira -18.8% Nakulabye 4.0% Mityana 20.5% Mbarara -13.8% Ben K 4.9%
Kyotera 19.6% Jinja -13.0% Mityana 8.1% Kireka 19.0% Kyotera -7.1% Kawempe 8.7%
Kabale 18.7% Masaka -6.9% Gulu 11.3% Mukono 16.2% Koboko 37.2% Mbale 12.8%
Mbarara 8.5% Mbale 39.2% Masaka 13.6% Fort Portal 6.9% Gulu 40.5% Katwe 13.9%
Arua 5.8% Nakulabye 50.8% Lira 14.9% Mbale 4.6% Kawempe 66.0% Iganga 15.1%
Gulu 3.0% Arua 66.4% Masindi 15.9% Lira 1.9% Hoima 88.5% Mukono 16.6%
Koboko 1.1% Katwe 104.2% Arua 17.9%
Ben K -2.6% Ben K 108.1% Mbarara 21.1% Jinja -5.2% Fort Portal 116.5% Kyotera 21.5%
Masindi -6.0% Mukono 134.1% Kamuli 21.5% Kawempe -8.7% Masindi 134.6% Fort Portal 22.7%
Iganga -10.4% Kamuli 191.2% Hoima 24.7%
Masaka -14.4% Kireka 957.5% Kabale 27.4%
Total Expenses NOM before
Indirect Expenses
Koboko -0.2% Mityana 323.5%
Mityana 1.4% Hoima 180.7% Jinja 2.9% Kireka 151.1%
Iganga 5.1% Nakulabye 55.7% Kireka 6.0% Katwe 29.7%
Nakulabye 7.6% Koboko 26.2% Kawempe 11.7% Kamuli 20.5%
Masaka 12.3% Kyotera 19.9% Gulu 12.8% Mukono 1.3%
Lira 12.8% Kabale -3.5% Mbale 14.0% Mbarara -5.2%
Katwe 17.9% Lira -12.2% Ben K 18.6% Jinja -13.8%
Mbarara 18.8% Mbale -15.7% Kyotera 19.6% Ben K -18.8%
Masindi 19.6% Fort Portal -26.1%
Arua 19.9% Iganga -28.5% Mukono 20.5% Masindi -31.5%
Kabale 24.9% Gulu -32.2%

17
In addition to comparing all of the statistics, the benchmarking report contained branch-by-
branch analyses of the overall statistics and trends. When reviewing trends, it is important to
understand how business changes seasonally. This helps to differentiate between growth or decline
due to a branch’s operations or seasonal trends. When reviewing individual branch figures, it was
noticed that nearly every branch had worse than expected figures in March, April and May. This
was reflected in year-to-date variances, which nearly always showed that branches had
underperformed expectations. However, branches began to do better in the coming months, with
most branches greatly exceeding budgeted figures in August and September (revenues as well as
expenses). August specifically proved to be a month where revenues were extremely strong across
all branches. Branches which saw revenues increase from August to September are more likely to
show that their growth comes from operational successes rather than seasonal trends. Additionally,
branches whose operating revenue growth rates exceeded their operating expense growth rates have
achieved genuine success due to operational efficiency, rather than seasonal growth. These cases
have been noted in the branch by branch notes, along with above trends.
Below is a sample of the branch by branch reports:
Fort Portal
Operating
Revenue
Financial
Expenses
Operating
Expenses
Total
Expenses
NOM before
Indirect Expenses
Variance Rank Variance Rank Variance Rank Variance Rank Variance Rank
6.9% 11/22 116.5% 18/22 22.7% 20/22 25.6% 21/22 -26.1% 16/22
Overview:
Revenue at Fort Portal is healthy, averaging 7% over budget. Financial expenses are high, but
only slightly below the middle in rank. In general, financial expenses are difficult to accurately
budget for and rarely affect the bottom line because they are very small compared to operating
expenses. However, operating expenses at Fort Portal are very high, which is the major reason
Fort Portal has been missing operating margin targets.
Trends:
While revenues have been mostly close to target, strong growth has been seen in July through
September, with Fort Portal clearing targets by around 20% each month. Although financial
expenses average a high 116.5%, they have swung both ways, illustrating the difficulty of
budgeting for these. It is important to note that in August and September financial expenses
were very high, at 238% and 351% over budget, respectively. In these situations, the high
financial expenses actually do have a measurable negative impact on the bottom line. Operating
expenses have proved difficult to control. Although they stayed near budget for most of the
Kamuli 25.1% Kawempe -33.5%
Fort Portal 25.6% Arua -42.8%
Hoima 27.2% Masaka -42.9%

18
time, they have grown out of control recently, at 17% over budget in June, 38% in July, 59% in
August, and 63% in September. While revenue growth was strong in this period, it was eclipsed
by rapid expense growth, which is responsible for hurting the operating margin.
Gulu
Operating
Revenue
Financial
Expenses
Operating
Expenses
Total
Expenses
NOM before
Indirect Expenses
Variance Rank Variance Rank Variance Rank Variance Rank Variance Rank
3.0% 14/22 40.5% 11/22 11.3% 8/22 12.8% 9/22 -32.2% 19/22
Overview:
Revenues in Gulu are a small amount over budget, but still below the average variance. Besides
for good growth in August and September, revenues are very stable. Financial expenses are
largely controlled, with some fluctuation. Operating revenues have been very consistent,
excluding August and September. Except for one month, the branch has remained profitable
despite most missing operating margin targets. Indirect expenses are high for a branch of this
size.
Trends:
Overall, Gulu is one of the most consistent branches. Operating revenues and expenses have
been steady from March through July, but both have been growing in August and September.
Financial expenses are rarely close to budget and swing both ways, but overall they are at a
decent level. In September, Gulu beat their NOM before Indirect Expense for the first time, but
the overall NOM was killed by enormously high indirect expenses.
Hoima
Operating
Revenue
Financial
Expenses
Operating
Expenses
Total
Expenses
NOM before
Indirect Expenses
Variance Rank Variance Rank Variance Rank Variance Rank Variance Rank
43.5% 1/22 88.5% 15/22 24.7% 21/22 27.2% 22/22 180.7% 2/22
Overview:
By looking at the statistics in the table above, it is clear that Hoima is an exceptional branch in
all respects. Revenues are very high, but so are expenses. Nonetheless, Hoima defies the
general trend that controlling expenses is more important to a good operating margin than
growing revenues. Clearly, budget estimates for Hoima need to be revised as variances are
extremely high. The branch is struggling to maintain profitability, but still is growing very
quickly.
Trends:
As indicated in the tables above, Hoima is growing very quickly. Fortunately, revenue growth
has proved to be sustainable, and revenues in September were 30% higher than March. Expense
growth has matched revenue growth, meaning that operating margins have not grown. If
operating expenses can be kept down, the branch will be very successful as revenue growth is so
strong.

19
Iganga
Operating
Revenue
Financial
Expenses
Operating
Expenses
Total
Expenses
NOM before
Indirect Expenses
Variance Rank Variance Rank Variance Rank Variance Rank Variance Rank
-10.4% 20/22 -50.7% 2/22 15.1% 13/22 5.1% 4/22 -28.5% 17/22
Overview:
Iganga has been missing revenue targets for most of the year, almost every month by the same
amount. However, the branch has managed to contain financial expenses very well, ranking 2
out of 22 branches in this respect. Operating expenses remained at a decent level for most
months. Due to low financial expenses, total expenses are good, only 5% above budgeted.
Nonetheless, net operating margin has been low, and the branch did not meet operating margin
targets every month.
Trends
Unfortunately, revenues have remained consistently below budget all year. While they have
been closer to budget in August and September, Iganga still has not met operating revenue
targets yet. Financial expenses have remained under control. Operating expenses, however,
have been growing very quickly in the past 2 months, greatly eclipsing the small revenue growth.
This has hurt the bottom line very much, and is the principal reason Iganga has not yet met
operating margin targets.
Jinja
Operating
Revenue
Financial
Expenses
Operating
Expenses
Total
Expenses
NOM before
Indirect Expenses
Variance Rank Variance Rank Variance Rank Variance Rank Variance Rank
-5.2% 18/22 -13.0% 6/22 3.9% 3/22 2.9% 3/22 -13.8% 13/22
Overview:
Jinja is one of the few branches that are consistently close to budget targets, as can be seen by the
low variance levels in the table above. Revenues have been slightly under expectations, but
consistent. Both financial expenses and operating expenses have been kept down. This is
reflected in the total expense category, where Jinja’s expenses are among the lowest of any
branch at only 3% above budget targets. Total net operating margin is fair and could be easily
raised with if revenues were increased.
Trends:
As is common of more established branches, trends in Jinja are generally consistent. Revenues
have hovered close to budget targets, and slightly exceeded expectations in August and
September after failing to meet targets in all previous months. Although Jinja is adept at
controlling expenses, operating expenses have nonetheless risen quickly from July to September
(8% in July, 19% in August, and 30% in September). These high costs have pushed Jinja farther
from meeting operating margin targets, but overall margins are still relatively stable and the
outlook is fair.
When reviewing the data, it was readily apparent that financial expenses were difficult to
accurately budget for. Variance levels were frequently far off estimates, often in the multiple
20
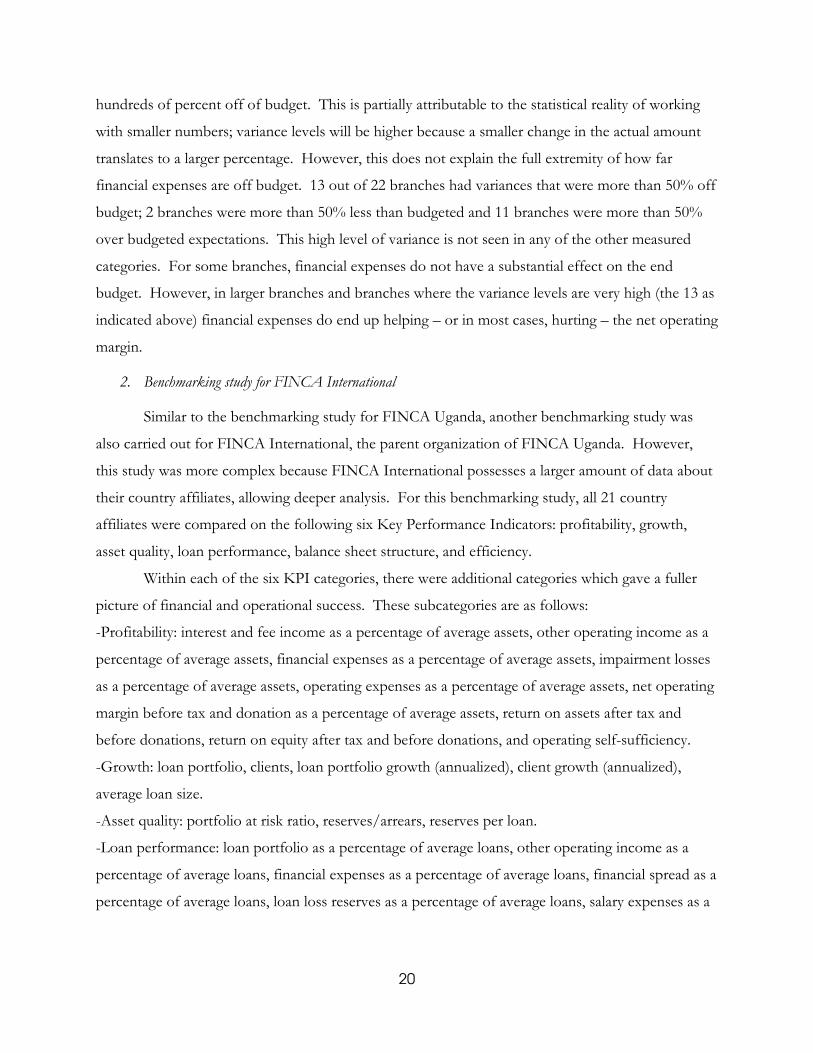
hundreds of percent off of budget. This is partially attributable to the statistical reality of working
with smaller numbers; variance levels will be higher because a smaller change in the actual amount
translates to a larger percentage. However, this does not explain the full extremity of how far
financial expenses are off budget. 13 out of 22 branches had variances that were more than 50% off
budget; 2 branches were more than 50% less than budgeted and 11 branches were more than 50%
over budgeted expectations. This high level of variance is not seen in any of the other measured
categories. For some branches, financial expenses do not have a substantial effect on the end
budget. However, in larger branches and branches where the variance levels are very high (the 13 as
indicated above) financial expenses do end up helping – or in most cases, hurting – the net operating
margin.
2. Benchmarking study for FINCA International
Similar to the benchmarking study for FINCA Uganda, another benchmarking study was
also carried out for FINCA International, the parent organization of FINCA Uganda. However,
this study was more complex because FINCA International possesses a larger amount of data about
their country affiliates, allowing deeper analysis. For this benchmarking study, all 21 country
affiliates were compared on the following six Key Performance Indicators: profitability, growth,
asset quality, loan performance, balance sheet structure, and efficiency.
Within each of the six KPI categories, there were additional categories which gave a fuller
picture of financial and operational success. These subcategories are as follows:
-Profitability: interest and fee income as a percentage of average assets, other operating income as a
percentage of average assets, financial expenses as a percentage of average assets, impairment losses
as a percentage of average assets, operating expenses as a percentage of average assets, net operating
margin before tax and donation as a percentage of average assets, return on assets after tax and
before donations, return on equity after tax and before donations, and operating self-sufficiency.
-Growth: loan portfolio, clients, loan portfolio growth (annualized), client growth (annualized),
average loan size.
-Asset quality: portfolio at risk ratio, reserves/arrears, reserves per loan.
-Loan performance: loan portfolio as a percentage of average loans, other operating income as a
percentage of average loans, financial expenses as a percentage of average loans, financial spread as a
percentage of average loans, loan loss reserves as a percentage of average loans, salary expenses as a
21
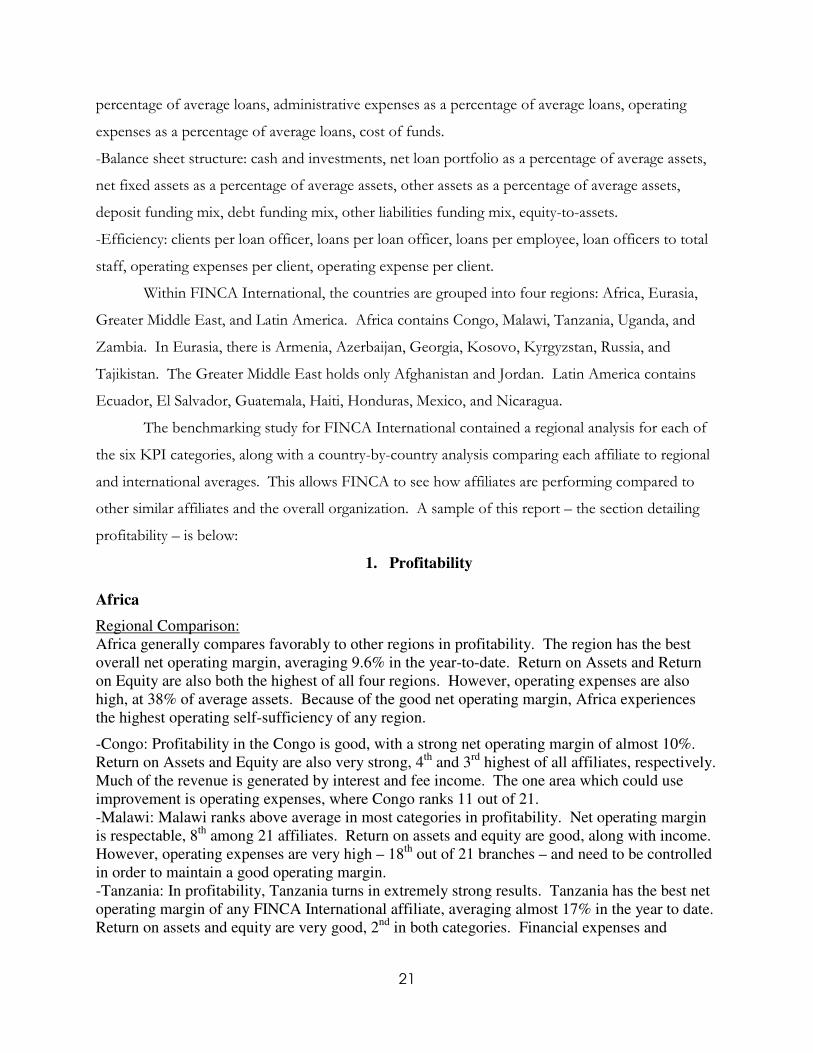
percentage of average loans, administrative expenses as a percentage of average loans, operating
expenses as a percentage of average loans, cost of funds.
-Balance sheet structure: cash and investments, net loan portfolio as a percentage of average assets,
net fixed assets as a percentage of average assets, other assets as a percentage of average assets,
deposit funding mix, debt funding mix, other liabilities funding mix, equity-to-assets.
-Efficiency: clients per loan officer, loans per loan officer, loans per employee, loan officers to total
staff, operating expenses per client, operating expense per client.
Within FINCA International, the countries are grouped into four regions: Africa, Eurasia,
Greater Middle East, and Latin America. Africa contains Congo, Malawi, Tanzania, Uganda, and
Zambia. In Eurasia, there is Armenia, Azerbaijan, Georgia, Kosovo, Kyrgyzstan, Russia, and
Tajikistan. The Greater Middle East holds only Afghanistan and Jordan. Latin America contains
Ecuador, El Salvador, Guatemala, Haiti, Honduras, Mexico, and Nicaragua.
The benchmarking study for FINCA International contained a regional analysis for each of
the six KPI categories, along with a country-by-country analysis comparing each affiliate to regional
and international averages. This allows FINCA to see how affiliates are performing compared to
other similar affiliates and the overall organization. A sample of this report – the section detailing
profitability – is below:
1. Profitability
Africa
Regional Comparison:
Africa generally compares favorably to other regions in profitability. The region has the best
overall net operating margin, averaging 9.6% in the year-to-date. Return on Assets and Return
on Equity are also both the highest of all four regions. However, operating expenses are also
high, at 38% of average assets. Because of the good net operating margin, Africa experiences
the highest operating self-sufficiency of any region.
-Congo: Profitability in the Congo is good, with a strong net operating margin of almost 10%.
Return on Assets and Equity are also very strong, 4th
and 3rd
highest of all affiliates, respectively.
Much of the revenue is generated by interest and fee income. The one area which could use
improvement is operating expenses, where Congo ranks 11 out of 21.
-Malawi: Malawi ranks above average in most categories in profitability. Net operating margin
is respectable, 8th
among 21 affiliates. Return on assets and equity are good, along with income.
However, operating expenses are very high – 18th
out of 21 branches – and need to be controlled
in order to maintain a good operating margin.
-Tanzania: In profitability, Tanzania turns in extremely strong results. Tanzania has the best net
operating margin of any FINCA International affiliate, averaging almost 17% in the year to date.
Return on assets and equity are very good, 2nd
in both categories. Financial expenses and

22
operating expenses are a bit high – 10th
and 12th
out of 21, respectively – but seem to not really
affect the bottom line very much.
-Uganda: In most categories, Uganda is about in the middle compared to all FINCA International
affiliates. However, compared to the other Africa affiliates, profitability statistics in Uganda are
lacking. Net operating margin is the last in Africa, likely due to high operating costs.
-Zambia: In Zambia, income is strong and net operating margin is good – 6th
among all branches.
Return on assets and equity are decent, slightly above average at 6% for assets and 18% for
equity. Operating costs are very high, 19th
of all affiliates.
Eurasia
Regional Comparison
Eurasia compares favorably to other regions, with the second highest net operating margin at 6%.
Return on Assets and Return on Equity are also the second highest of all regions, at 5% and 23%,
respectively. Income does not come very much from fees and interest, which is interesting for a
successful region. Eurasia owes its success mainly to good operating expense control. At under
20% of assets, operating expenses are the lowest of any region.
-Armenia: Armenia performs reasonably well overall, with net operating margin ranking 9th
out
of 21 affiliates. Return on assets and equity are also both 9th
out of 21. Income is comparatively
low – interest and fee income make up only 33.6% of average assets. However, by keeping
operating expenses low (3rd
best of all affiliates at 19.4% of average assets) Armenia has been
able to achieve an above average net operating margin.
-Azerbaijan: Azerbaijan performs very well in profitability measurements, with the 4th
highest
net operating margin at 10.4%. Return on assets and equity are the 5th
and 4th
highest of all
affiliates, at 8.2% and 40.4%, respectively. Operating expenses are the 4th
lowest of any affiliate,
giving Azerbaijan the 3rd
highest operating self-sufficiency level of all branches.
-Georgia: Georgia has also experienced good profitability performance, largely in line with the
rest of Eurasia. Interest and fee income as a percentage of average assets are a low 17th
of 21, at
28.5%. However, due to Georgia’s low operating expenses – 2nd
best of all branches at 16.3% of
average assets – the affiliate manages to turn in a good net operating margin of 8.9%, 7th
best of
all affiliates.
-Kosovo: In general, Kosovo underperforms compared to both other affiliates both in the region
and around the world. Interest and fee income remains very low at 25.8% of average assets, the
lowest in Eurasia and 3rd
lowest of all international affiliates. This is why net operating margin
is the lowest of all Eurasia affiliates at -0.5% despite the fact that Kosovo has the lowest
operating expenses of all FINCA International affiliates.
-Kyrgyzstan: Kyrgyzstan performs at around an average level compared to international
affiliates, and is close to the middle in nearly every category under profitability. The one area
where Kyrgyzstan does well is operating expenses, with a year-to-date figure of 20.8%. Despite
this, high financial expenses and low interest and fee income mean that Kyrgyzstan finishes at
about an average level.
-Russia: Similar to Kyrgyzstan, Russia also turns in results which are about average compared to
international affiliates. Net operating margin is 10th
out of 21 at 3.4% and return on assets and
equity are both 11th
. Like other Eurasia affiliates, Russia manages to keep operating expenses at
a good level, 6th
of 21 affiliates.
-Tajikistan: In profitability statistics, Tajikistan is unique compared to other Eurasia affiliates.
Interest and fee income are comparatively high at 40.5% of average assets. Also, operating

23
expenses are higher than most Eurasia affiliates at 31.3%, meaning that net operating margin is
still slightly under profitability at -0.4%.
Greater Middle East
-Afghanistan: As is true in nearly every category, Afghanistan underperforms in profitability
statistics. Interest and fee income are the lowest of any international affiliate, at only 7.6% of
average assets. Operating expenses are also high at 39.2% of average assets. Net operating
margin is 19th
of 21 affiliates at -25.4%. Return on assets and return on equity are also 19th
of all
21 affiliates. Operating self-sufficiency at Afghanistan is below 27% - the lowest of all affiliates
-Jordan: Jordan’s performance across the profitability category varies, but is usually around
average as compared to other international affiliates. The country turns in lower than average
financial and operating expenses (9th
and 8th
, respectively). However, in most other categories
performance at Jordan is slightly below average. Overall net operating margin is 1.7%, 14th
out
of 21 branches.
Latin America
Regional Comparison
Latin America manages to turn in good income figures as a result of interest and fees, measuring
2nd
in this. However, operating expenses are the highest of any region, averaging 38.1% of
average assets. In every other category, Latin America ranks 3rd
out of 4 regions (ahead of the
Greater Middle East). Net operating margins and returns on assets and equity are decent. The
region also experiences much more variance between its best and worst performers, which is not
seen as much in Africa or Eurasia.
-Ecuador: Interest and fee income is the second lowest of all affiliates, making it difficult for
Ecuador to achieve good operating margins and returns on assets and equity. Net operating
margin ranks at 15th
, just under 1% of average assets. Ecuador just achieves operating self-
sufficiency at 103.8%.
-El Salvador: El Salvador earns a decent amount of revenue from interest and fee income,
ranking 11th
of all affiliates. However, high operating expenses – the second worst of all
branches at 68.2% of average assets – hurt margins and returns at El Salvador. Because of these
high expenses, net operating margin at El Salvador is -33.5% of average assets – the second
worst of all international affiliates. Return on equity is the lowest of all affiliates at -153%.
-Guatemala: Despite high operating expenses (39.5% of average assets, 16th
of 21) Guatemala
manages to achieve very good profitability figures. Interest and fee income are the 3rd
best, at
54.9% of average assets. This strong income gives Guatemala the 3rd
best net operating margin,
at 12% of average assets.
-Haiti: Similar to Afghanistan, Haiti displays consistent underperformance across nearly every
category. Income from interest and fees is low – 15th
of 21 – and operating expenses as a
percentage of average assets are the highest of any international affiliate. Due to low revenues
and high expenses, Haiti has the worst net operating margin of any international affiliate, -65.7%
of average assets.
-Honduras: In most profitability categories, Honduras displays below average performance.
Interest and fee income is good, but operating expenses are higher than average. Because of this,
Honduras’ net operating margin is 13th
out of 21 at 2.3% of average assets.
24
-México: Mexico is consistently one of the best performers in Latin America, and is often
responsible for balancing underperformers in Latin America. Interest and fee income are the 2nd
highest of all affiliates, comprising 64.4% of average assets. Despite high operating expenses –
17th
out of 21 affiliates at 43.2% - Mexico is still able to turn in the 2nd
best overall net operating
margin. Returns on assets and equity are likewise very good, ranking 3rd
and 5th
, respectively.
-Nicaragua: Nicaragua also generally underperforms compared to other Latin America affiliates.
Interest and fee income are 18th
out of all 21 affiliates, and operating expenses are the 13th
highest. Because of this, net operating margin is 18th
of all affiliates at -10% of average assets.
Nicaragua is still struggling to meet operating self-sufficiency, and is currently at 75.6%.
Due to the fact that the Greater Middle East only contains 2 countries, the overall figures for
the region are not statistically reliable. Because of this, there is no regional comparison included
with the data analysis for each of the six KPI categories. Additionally, Afghanistan has seemed to
have a problem with the majority of categories included in the study, and generally underperforms
the benchmark for FINCA International affiliates. However, Jordan generally performs reasonably
well, and does not have the same issues that Afghanistan does. For this reason both countries are
analyzed individually but not combined under the Greater Middle East region to be analyzed
together.
While analyzing operating metrics and financial data, it is important to weigh current
operating statistics against growth trends. Among the underperformers in operating measurements,
some affiliates display strong growth while others are stagnant or even shrinking. This is important
when deciding how to act on the findings contained in this study. Affiliates which are
underperforming but growing quickly are not as much of a concern because growth will improve
operating success. However, affiliates which are underperforming and not growing do require
attention, and action should be taken to improve their performance or curb their potential to hurt
FINCA International.
3. Business Process Mapping & Re-engineering for Loan Processing
The third project undertaken involved examining loan processing for all three main types of
loan products (Business Loans, Small Group Loans, and Village Group Loans). The goals of this
project were twofold: examine the costs and benefits of centralized versus decentralized loan
processing, and make recommendations for how to streamline the process. Because the project
required a thorough understanding of all types of loan processes, individuals from the Ben
Kiwanuka branch office were consulted as to their roles in the process. The researcher spoke to

25
AROs and ARSs from all three loan products, along with the Branch Manager and Branch
Accountant. The questionnaires used in these interviews are attached in the appendices.
Once all stakeholders in loan processing had explained their roles, process maps were
created to portray each individual step of the process. The process maps were then re-checked with
all of the interviewees to ensure that their roles had been accurately captured. A sample of the Small
Group Loan process is displayed below.
SGL Officer (ARO) SGL Supervisor (ARS) Loan Committee
START
Prepare
financials
Loan
committe
e
approval
Check if
file is
complet
e Collect
necessary
N
Prepare credit
application,
Ye
s

26
After the maps were checked, the process was examined to find areas for improvement. As
shown in the process map above, one of the steps involves possible revisions where the ARS has to
pass the file back to the ARO to collect missing information. From speaking with the ARSs, it was
found that these kinds of revisions are actually very common. To remedy this, it is suggested that
FINCA uses computerized forms that will only be able to be forwarded on to the next level when all
fields are filled out. This will eliminate the possibility of human error, negating the need to go back
and recollect information.
Also, it was evaluated whether centralized or decentralized loan processing will benefit
FINCA more. Currently, Business Loans are processed all in branch offices. Small Group Loans
and Village Group Loans are processed mostly in a decentralized fashion, but some of the work is
done through the centralized accounts in the Headquarters. However, as it stands, most of the
process cannot be changed because the longest and most expensive part of the process is between
the ARO and ARS. This part simply cannot be centralized, for it would be far too difficult to send
loan officers from Kampala all over the country to collect client information. The process is
sufficient as it is, and changing the process would not produce any benefits for FINCA – in fact, the
cost of switching would be higher than any benefits gained.
4. Transportation Cost Analysis
One of the issues that FINCA has wanted to look at for a long time is transportation costs
for AROs. Currently, there is no policy for how AROs should conduct their transportation on client
visits and field appraisals. Transportation is indeed a significant expenditure for FINCA – from
research it was found that transportation comprises on average 7% of operating expenses. AROs
simply take whatever means of transportation they please and then expense the cost to FINCA.
Transportation is broadly divided into two categories: public transportation and FINCA owned
vehicles. FINCA owns both cars and motorcycles, which loan officers may use.
When conducting interviews for loan processing, AROs and ARSs were also asked about
transportation. It seemed that there was not much emphasis placed on the cost of the travel, but
rather on the ease of going about it. At the Branch Manager level, there was some concern about
the cost, but the focus was also more on the ease of getting loan officers to wherever they needed to
be.
Transportation was analyzed from a few different perspectives. The table below represents a
comparison between different types of vehicle expenditures in urban (Kampala) and rural areas.
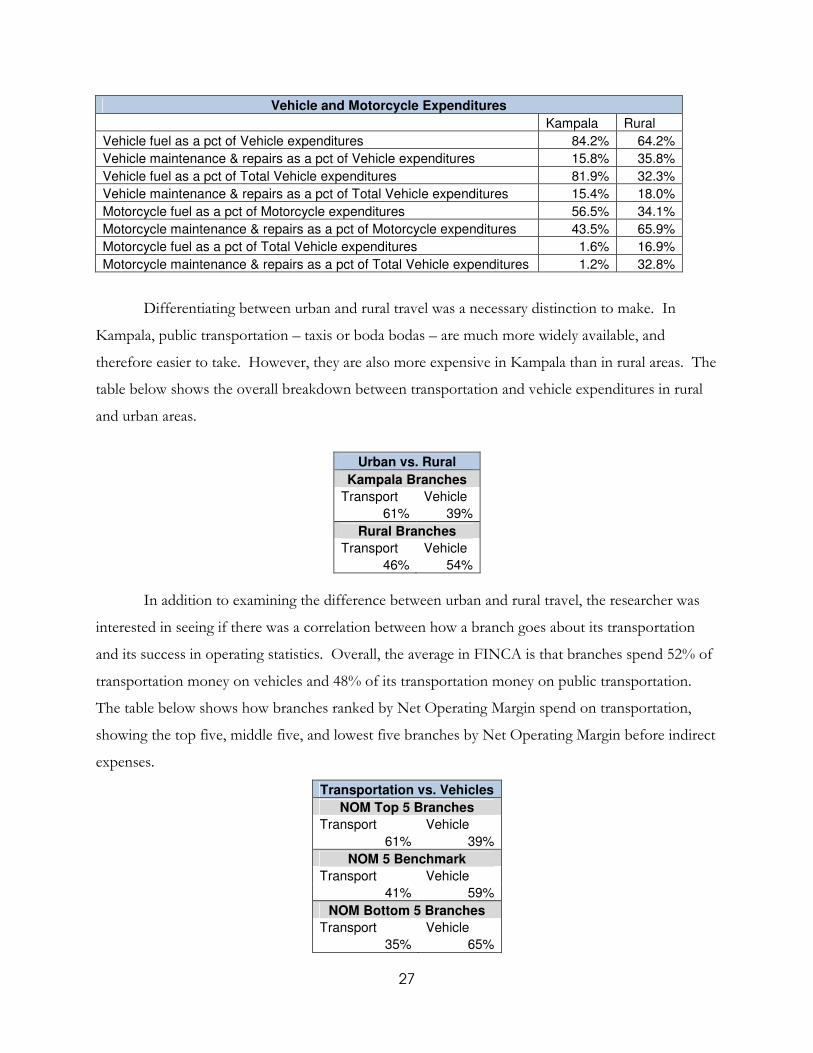
27
Vehicle and Motorcycle Expenditures
Kampala Rural
Vehicle fuel as a pct of Vehicle expenditures 84.2% 64.2%
Vehicle maintenance & repairs as a pct of Vehicle expenditures 15.8% 35.8%
Vehicle fuel as a pct of Total Vehicle expenditures 81.9% 32.3%
Vehicle maintenance & repairs as a pct of Total Vehicle expenditures 15.4% 18.0%
Motorcycle fuel as a pct of Motorcycle expenditures 56.5% 34.1%
Motorcycle maintenance & repairs as a pct of Motorcycle expenditures 43.5% 65.9%
Motorcycle fuel as a pct of Total Vehicle expenditures 1.6% 16.9%
Motorcycle maintenance & repairs as a pct of Total Vehicle expenditures 1.2% 32.8%
Differentiating between urban and rural travel was a necessary distinction to make. In
Kampala, public transportation – taxis or boda bodas – are much more widely available, and
therefore easier to take. However, they are also more expensive in Kampala than in rural areas. The
table below shows the overall breakdown between transportation and vehicle expenditures in rural
and urban areas.
Urban vs. Rural
Kampala Branches
Transport Vehicle
61% 39%
Rural Branches
Transport Vehicle
46% 54%
In addition to examining the difference between urban and rural travel, the researcher was
interested in seeing if there was a correlation between how a branch goes about its transportation
and its success in operating statistics. Overall, the average in FINCA is that branches spend 52% of
transportation money on vehicles and 48% of its transportation money on public transportation.
The table below shows how branches ranked by Net Operating Margin spend on transportation,
showing the top five, middle five, and lowest five branches by Net Operating Margin before indirect
expenses.
Transportation vs. Vehicles
NOM Top 5 Branches
Transport Vehicle
61% 39%
NOM 5 Benchmark
Transport Vehicle
41% 59%
NOM Bottom 5 Branches
Transport Vehicle
35% 65%

28
This table shows a strong correlation between transportation and operating success. Clearly,
branches which use more public transportation are more likely to have a good Net Operating
Margin. This correlation was present no matter how the data was looked at.

29
Conclusions Due to the nature of the projects, conclusions presented in this section will represent
takeaways from the two benchmarking studies, while the Recommendations section will contain the
takeaways from the loan processing and transportation cost analysis projects.
Benchmarking Study for FINCA Uganda
The end results of this study contained useful information about key operating metrics for all
FINCA Uganda branches. The study also brought to light a few salient conclusions. Business at
FINCA Uganda seems to be very much seasonal. Revenues (and also expenses) were much lower
during the first few months studied, from March through June. Beginning in July, nearly every
branch began to see an increase in business, with revenues – and oftentimes expenses – rising
quickly and beating targets. It is uncertain why this happens, but this should help FINCA to budget
seasonally and adjust expectations based on trends.
Indirect/Head Office expenses also play an important role in a branch’s performance
evaluation. Because these figures are not expenses paid out by the branches, they were not included
in the final results of the study. However, when they were, they greatly affected branch performance
and skewed the statistics. It is important to keep these separate from branch Net Operating
Margins.
Possibly the most important conclusion reached from this study was how revenues and
expenses affect Net Operating Margins. After analyzing the branches with good and bad operating
margins, it was clear that branches that controlled expenses fared better overall. This further
justifies the loan processing and transportation cost analysis projects, seeing as good cost control will
make a branch more successful than good revenue earnings.
Benchmarking Study for FINCA International
This study was interesting because it showed how all FINCA International affiliates perform
across a number of different boundaries, in different macroeconomic and microeconomic climates.
Because the data used for the study was more complex, a deeper analysis was carried out and more
conclusions can be taken away.
As became clear soon in the study, the macroeconomic climate of a country plays a very
important role in how successful branches are. For this, the cost of funds and financial spread as a
percentage of average loans categories under loan performance was very telling. The financial
spread an affiliate manages to turn is indicative of how well they perform total. Because the

30
financial spread is a calculation based off cost of funds, the rate at which affiliates plays a large role
in deciding their fate. In Africa, the cost of funds was very low, allowing for a good financial spread.
In Eurasia and the Greater Middle East, cost of funds was much higher and proved a significant
problem for these affiliates.
Besides looking at current performance, it was important to look at growth and future
potential for each region and affiliate. As it is, growth breaks down into two distinct categories: loan
portfolio growth and client growth. This is an important distinction to make, as the results showed.
Africa has the fastest client growth rate of all regions, but the slowest loan portfolio growth rate.
This means that the average loan size in Africa will remain small, hampering the ability to become
more profitable. In Latin America, the situation is exactly the opposite. The loan portfolio growth
rate is the fastest of all regions, while the client growth rate is the slowest. Due to this Latin
America will see average loan size increasing, likely helping overall profitability.
Overall, the data did not show any one region as a clear winner. Within each region, there
are strong performers – Azerbaijan, Congo, Mexico – and weak performers – Afghanistan, Haiti,
Kosovo. However, the results of the study give good detail as to where performance should be
improved, helping FINCA International to focus its efforts.

31
Recommendations This section contains the recommendations formulated from analysis on loan processing and
transportation costs for loan officers. The recommendations have been refined in scope to make
for the greatest possible ease in implementation.
Business Process Re-engineering for Loan Processing
In looking at loan processing, there were two main objectives: (1) analyze centralized versus
decentralized loan processing, recommending which would most benefit FINCA; and (2) make
general recommendations for how to streamline loan processing. Great care was taken to create
process maps of all three types of loan products (Business Loans, Small Group Loans, and Village
Group Loans) and use those to analyze the process.
When looking at centralization versus decentralization, it was decided that not many changes
can be made to this. Currently, Business Loans are processed only in branches, while Small Group
Loans and Village Group Loans are processed mainly in branches but go through the Head Office
for disbursement. For all three types of loan products, the most significant part of the work – both
in time and cost – is completed by the ARO. This involves bringing in new clients, visiting their
businesses and residences, and preparing all of the paperwork for their loan file. This part of the
process simply cannot be centralized; the cost and logistical difficulty of sending loan officers from
Kampala all over the country would be unfeasible. The only parts of the process which could be
centralized – those involving the ARS and Branch Manager – do not involve lots of work or room
for error, so moving this to the central Head Office would not help streamline the process. The
current balance between centralization and decentralization is fitting for how loans are processed,
and it is recommended that no changes are made to this.
From looking at the entire loan approval process, it is clear that there is room for
improvement. For each type of loan product, there is a step in the process where the ARS reviews
loan files to ensure that all necessary information is present before passing the file along to the next
step. When ARSs were interviewed, they said that files are frequently turned back to collect more
information. Additionally, they said that these types of mistakes are more common with newer
AROs. Seeing as FINCA has been opening many new branches recently, these types of mistakes are
likely being made more frequently around the country than at the Ben Kiwanuka branch (where
interviews were conducted), which is the oldest branch in the country. Mistakes can vary from a
simple missing calculation (which takes a few minutes to fix) or missing pictures of a business and
32
residence (which would take half a day to fix). These kinds of revisions are unnecessary – they are
the result of human error and have the potential to significantly slow down the loan process. It is
recommended that FINCA implement computerized loan files, which would not be able to be
passed along to the next step of approval until all necessary information is present. This would
ensure that there are no costly revisions taking place, and would remove the decentralized errors
present in the process.
Transportation Cost Analysis
FINCA has wanted to examine transportation for a long time, as there is no policy in place
for how AROs should go about transportation. Currently, AROs take either public transportation
or FINCA-owned vehicles, and then expense the cost to FINCA on a weekly basis. Analysis was
conducted from a few different angles – how transportation works in Kampala and rural areas,
whether fuel expenses or maintenance & repairs are more costly, and seeing what the correlation
was between a branch’s success (judged by operating margins) and how it conducts transportation.
It was clearly seen that public transportation is more cost effective than FINCA-owned vehicles. In
addition to the operating costs, using vehicles also means that FINCA will have to spend a
considerable amount of initial capital to buy a vehicle. Then they have to go to the trouble of
maintaining it and giving it repairs when needed. It is therefore recommended that FINCA AROs
employ public transportation as much as possible when going about their duties.

33
Appendices
Business Loan Officer Questionnaire
Title: Account Relations Officer – Business Loans Branch: Ben Kiwanuka Walk me through your role in Business Loan processing. Do you go out in the field to meet clients? If so, how often? How do you do transportation? Which steps of your role take the most time? Where do you think there is room for improvement in BL processing speed? When things go wrong, where does this happen? How can it be fixed?

34
Business Loans Supervisor Questionnaire
Title: Account Relations Supervisor – Business Loans Branch: Ben Kiwanuka How many BL officers are there at Ben Kiwanuka? Which steps of the process take the most time? Business Loan process: Which steps of your role take the most time? How often does the loan committee meet? Were there difficulties in implementing school fees loans as a part of BL? Do you think the current loan periods (min 3 mo., max 3 yrs) are appropriate? Where do you think there is room for improvement in BL processing speed? Do you utilize technology/how can technology be implemented to help BL processing? When things go wrong, where does this happen? How can it be fixed?

35
Small Group Loans Officer Questionnaire Title: Account Relations Officer – Small Group Loans Branch: Ben Kiwanuka Walk me through your role in SGL processing from beginning to end. How are SGL officers assigned to clients? – supervisor question How often do you go out in the field to meet clients? How do you do transportation? Which steps of your role take the most time? Is the payment period adequate? Have groups complained about this? Is the total loan period adequate? Have groups complained about this? Is the loan size adequate (for groups and individuals)? Have groups complained about this? Where do you think there is room for improvement in SGL processing speed? Do you utilize technology/how can technology be implemented to help BL processing? When things go wrong, where does this happen? How can it be fixed?

36
Small Group Loans Supervisor Questionnaire Title: Account Relations Supervisor – Small Group Loans Branch: Ben Kiwanuka Walk me through SGL processing from beginning to end. How are SGL officers assigned to clients? Which steps of your role take the most time? Is the payment period adequate? Have groups complained about this? Is the total loan period adequate? Have groups complained about this? Is the loan size adequate (for groups and individuals)? Have groups complained about this? Do you think securities are necessary? Why or why not? Where do you think there is room for improvement in SGL processing speed? Do you utilize technology/how can technology be implemented to help BL processing? When things go wrong, where does this happen? How can it be fixed?

37
Village Group Loan Officer Questionnaire
Title: Account Relations Officer – Village Group Loans Branch: Ben Kiwanuka Walk me through your role in Village Loan processing. Do you market loans to clients? How often do you go out in the field to meet clients? How do you do transportation? Which steps of your role take the most time? Where do you think there is room for improvement in VGL processing speed? Do you utilize technology/how can technology be implemented to help VGL processing? When things go wrong, where does this happen? How can it be fixed?

38
Village Group Loan Supervisor Questionnaire Title: Account Relations Supervisor – Village Group Loans Branch: Ben Kiwanuka Walk me through VGL processing from beginning to end. Which steps of your role take the most time? Is the payment period adequate? Have groups complained about this? Is the total loan period adequate? Have groups complained about this? Is the loan size adequate (for groups and individuals)? Have groups complained about this? How has the rise of SGL affected VGL? Where do you think there is room for improvement in VGL processing speed? Do you utilize technology/how can technology be implemented to help VGL processing? When things go wrong, where does this happen? How can it be fixed?

39
Branch Manager Questionnaire
Title: Branch Manager
Branch: Ben Kiwanuka
What are the issues you see with BL Processing? Where is there room for improvement?
What are the issues you see with SGL Processing? Where is there room for improvement?
What are the issues you see with VGL Processing? Where is there room for improvement?
How much flexibility is there to change the amount of paperwork required in the initial
stages? Can the paperwork possibly be merged?
How many errors do you see in forms you get from supervisors? How often do they need to
be turned back for further revision?
Is computerizing loan forms a viable option? Do you think employees could adjust to this
fairly easily?
Where have employees said there is room for improvement?
How do you handle transportation expenses for loan officers? Have you tried to enforce
any policy to cut these expenses?
Are there any other areas where you think technology can be incorporated to reduce
processing speed?

40
Bibliography Bank of Uganda. “Inflation”. Accessed 2 December 2011.
<http://www.bou.or.ug/bou/rates_statistics/statistics/inflation.html> Bank of Uganda. “Financial News Report”. 2 December 2011. Accessed 2 December 2011. <http://www.bou.or.ug/bou/media/Financial_News_Report/2011/Nov/Financial_News _Report_Issue_No_1086.pdf> Iowa State University, Facility for Planning and Management. “Process Mapping”. Accessed 2 December 2011. <http://www.enteruganda.com/brochures/20yrsofeconrecaspac.htm> The New Vision. “FINCA Uganda”. 12 November 2004. Accessed 2 December 2011. <http://www.enteruganda.com/brochures/20yrsofeconrecaspac.htm>