Performance Gap Between Korean and U.S. Hospitality … · hospitality industry by examining some...
28
Journal of Hospitality Financial Management e Professional Refereed Journal of the Association of Hospitality Financial Management Educators Volume 16 | Issue 2 Article 7 March 2010 Performance Gap Between Korean and U.S. Hospitality Firms: A Preliminary Examination Based on 2006 Data Hyewon Youn Zheng Gu Follow this and additional works at: hp://scholarworks.umass.edu/jhfm is Refereed Article is brought to you for free and open access by ScholarWorks@UMass Amherst. It has been accepted for inclusion in Journal of Hospitality Financial Management by an authorized editor of ScholarWorks@UMass Amherst. For more information, please contact [email protected]. Recommended Citation Youn, Hyewon and Gu, Zheng (2010) "Performance Gap Between Korean and U.S. Hospitality Firms: A Preliminary Examination Based on 2006 Data," Journal of Hospitality Financial Management: Vol. 16 : Iss. 2 , Article 7. Available at: hp://scholarworks.umass.edu/jhfm/vol16/iss2/7
Transcript of Performance Gap Between Korean and U.S. Hospitality … · hospitality industry by examining some...

Journal of Hospitality Financial ManagementThe Professional Refereed Journal of the Association of Hospitality FinancialManagement Educators
Volume 16 | Issue 2 Article 7
March 2010
Performance Gap Between Korean and U.S.Hospitality Firms: A Preliminary ExaminationBased on 2006 DataHyewon Youn
Zheng Gu
Follow this and additional works at: http://scholarworks.umass.edu/jhfm
This Refereed Article is brought to you for free and open access by ScholarWorks@UMass Amherst. It has been accepted for inclusion in Journal ofHospitality Financial Management by an authorized editor of ScholarWorks@UMass Amherst. For more information, please [email protected].
Recommended CitationYoun, Hyewon and Gu, Zheng (2010) "Performance Gap Between Korean and U.S. Hospitality Firms: A Preliminary ExaminationBased on 2006 Data," Journal of Hospitality Financial Management: Vol. 16 : Iss. 2 , Article 7.Available at: http://scholarworks.umass.edu/jhfm/vol16/iss2/7

PERFORMANCE GAP BETWEEN KOREAN AND U.S. HOSPITALITY
FIRMS: A PRELIMINARY EXAMINATION BASED ON 2006 DATA
Hyewon Youn, Ph.D.* Assistant Professor
School of Merchandising and Hospitality Management University of North Texas
1155 Union Circle #311100 Denton, TX 76203-5017
Tel: (940) 565 4551 Fax: (940) 565 4348
Email: [email protected]
Zheng Gu, Ph.D.
Professor College of Hotel Administration University of Nevada, Las Vegas
4505 Maryland Parkway Las Vegas, NV 89154-6023
Tel: (702) 895-4463 Fax: (702) 895-4870
Email: [email protected] * Corresponding author
Two tables belong to this manuscript.

1
ABSTRACT
The purpose of this study was to identify problems and weaknesses existing in the Korean
hospitality industry by examining some key financial ratios in comparison with those of its U.S.
peer. Using the 2006 financial data of 194 Korean hospitality firms and 80 U.S. hospitality firms,
13 financial ratios representing liquidity, leverage, solvency, efficiency, and profitability were
computed for each firm. Independent sample t-test was performed to determine if there were
significant cross-country differences in the ratios. The results show that there was a huge
performance gap between the hospitality industries of the two countries, and the U.S. hospitality
firms outperformed their Korean counterparts in all five dimensions. The findings suggest that
over reliance on debt financing, overcapacity, and lack of economies of scale are the likely
causes of the underperformance of the Korean hospitality industry. To catch up with its U.S. peer,
the Korean hospitality industry must change its pro-debt financing policy, adopt a conservative
growth strategy to minimize overcapacity, and enlarge the operation scale via some structural
reorganization within the industry.
Keywords: Korean hospitality firms; U.S. hospitality firms; financial ratios; cross-country
comparison; performance gaps; financial benchmarking

2
Introduction
As in the U.S., the hospitality industry in Korea bears significant implications to the nation’s
well being, although the industry is much smaller than its U.S. counterpart in size and scope.
According to the Korean Statistical Information Service (KOSIS, 2008), in 2006, there were
43,739 lodging firms and 574,562 restaurant operations in Korea. Combined, the lodging and
restaurant sectors generated approximately 1.7 million jobs in 2006, which represented about
11% of all available jobs in Korea. Revenue-wise, the hospitality industry, including both
lodging and restaurant sectors, generated a revenue totaling $15.15 billion in 2006, representing
about 2% of the nation’s gross domestic product (GDP). However, Korea’s hospitality industry
has been facing great challenges in recent years. Due to the nuclear threat from North Korea and
the appreciation of the Korean currency, the number of international tourists has been declining
since 2005, and the hospitality market saturation has led to the dreadful operating performance of
the overall hospitality industry (Park, Choi, & Ahn, 2008). Facing a shrinking international
market, the competition among lodging firms has heated up in recent years. The introduction of
serviced apartments targeting foreigners for both short-term and long-term stays has further
intensified the competition. The units of serviced apartments increased from 1,000 in 2002 to
7,000 in 2007 (Park, 2007). As lodging firms began to realize that there was a limited demand
for rooms, they started to develop their own strategies for survival. Larger lodging firms started
to aggressively market and rely heavily on their non-room products, such as conference facilities,
food and beverage outlets, and health clubs, in order to stay in business (Park et al., 2008). On
the other hand, smaller and rooms-only operations aimed at day time users, marketing
themselves as a place to “take a break” for a few hours during the day and attempted to

3
maximize daytime turnover. Despite these efforts, however, Korean lodging firms failed to break
free of their downward trend (The Bank of Korea, 2006). Korean restaurant firms were not faring
any better, and numerous firms went out of business within the early stages of their operations
(The Bank of Korea, 2008). A recent study initiated by Korean government also reports that out
of all the lodging and restaurant firms opened in 2001, only 28.7% remained in the business as of
2005 (Choi, 2008). In other words, more than 70% of these firms failed within the first five years
of operation.
How is the Korean hospitality industry doing financially under such challenging market
conditions? What are the problems and weaknesses of the industry? Analyzing financial ratios of
the industry with some benchmark may provide answers to these questions. According to
Schmidgall and DeFranco (2004), benchmarking is essentially a firm’s comparison against itself,
to the competition, or to the industry as a whole, in the forms of financial ratios. To be more
specific, financial benchmarking is a tool used for comparing financial performance of different
firms using quantitative financial ratios (Ozgulbas & Koyuncugil, 2006). Through benchmarking,
a firm may identify its weaknesses and opportunities for future improvement. The same
benchmarking approach can be applied to a nation’s hospitality industry of a country. For the
hospitality industry of a particular country, benchmarking may be provided by comparing it with
the hospitality industry in another country. This study attempts to conduct such a benchmarking
analysis for the Korean hospitality industry. Here the benchmark selected for comparison is the
U.S. hospitality industry, the leading player in the world’s hospitality business.

4
Cross-Country Studies Using Financial Ratios
Cross-country studies using financial ratios have been used in the hospitality and non
hospitality industries for benchmarking purpose. Lee and Blevins (1990) examined the financial
performance of large American, Japanese, South Korean, and Taiwanese companies for the
1980-1987 period. The study employed four profitability ratios, return on equity (ROE), return
on assets (ROA), return on investment (ROI), and return on sales (ROS), to measure the average
profitability of firms in each country. The findings indicated that large U.S. companies
consistently outperformed their foreign rivals in all the four ratios during the observed period.
Blaine (1994) also examined and compared the profitability of large industrial firms in
Germany, Japan, and the United Sates using ROA, ROE, and operating margin (OM) ratios. He
randomly selected 100 companies from each country and computed annual averages for each
profitability indicator over the 1984-1990 period. He also calculated a five-year national average
for each ratio over the 1985-1989 period in order to reduce the impact of short-term market
volatility. The ratio analysis found significant differences in the average annual OM and ROA
across countries. For OM, American firms showed the highest value (6.67%) followed by
Japanese (5.96%) and German (2.91%) companies. For ROA, American firms’ value (6.03%)
was almost twice that of German (3.91%) and Japanese (3.69%) companies, again indicating
their superior profitability. The analysis did not find any significant differences in ROE across
nations.
5
Brown, Soybel, and Stickney (1994) made comparisons between U.S. and Japanese business
firms using ratio analysis. By examining financial statement data of sample firms, the authors
tried to gauge the operating performance using three primary profitability ratios: total asset (TA)
turnover, profit margin (PM), and ROA. The initial investigation found that on average, U.S.
firms generated significantly higher TA turnover and ROA than Japanese entities. For PM ratio,
however, there was no significant difference between the two groups. The authors examined the
TA turnover and ROA ratios relative to accounts receivable (AR) turnover, inventory turnover,
and fixed assets (FA) turnover ratios in order to obtain more information. It was found that
various factors, such as credit-granting practices, inventory carrying costs, depreciation methods,
and operating efficiencies affect these turnover ratios. In summary, higher AR and FA turnovers
were the major driving sources of the higher TA turnover and ROA for U.S. firms.
In a study of the business failure for manufacturing firms, Lee (1998) compared the financial
structure of Korean firms to that of American firms. Employing key financial ratios, the author
attempted to find an answer to high rate of firm failures prevalent in Korean manufacturing
industry that was not present in the U.S. The findings indicated that Korean firms were heavily
leveraged, with debt-to-equity ratio two times higher than that of the American firms. Although
Korean and American firms had comparable operating profits, Korean firms showed surprisingly
poorer net profits due to the extremely high financing charges. The findings indicated that the
two main reasons for high failure rate of Korean manufacturing firms were: (1) the lack of
corporate governance mechanisms that should prevent firms from making wrong investment
decisions; and (2) the ill effects of government-led credit allocation policy that encouraged
business firms to make more investments using borrowed funds. The financial ratio comparison

6
clearly showed that Korean firms were, compared to U.S. firms, burdened by heavy financial
charges. Because these firms relied excessively on borrowed funds, they became more
vulnerable to unfavorable shocks and prone to failures.
In the hospitality field, cross-country financial ratio analysis has been employed to compare
the strengths and weaknesses of hospitality operations across destinations. Gu (2002) examined
the performance of U.S. casinos in contrast with Dutch and French casinos in 1998 using
financial ratios. It was found that Dutch and French casinos outperformed U.S. casinos in both
revenue efficiency and profitability, most likely due to the noncompetitive European gaming
markets. The study concludes that oversupply, which often results in cutthroat competition
among casinos, is detrimental to the healthy growth of the gaming industry in the U.S. To
improve their performance, U.S. casino operators should take measures to curb the overcapacity
and alleviate market saturation.
Also using ratio analysis, Gu and Gao (2006) identified the financial strengths of Macau
casinos as compared with the casino industries in other gaming destinations. Using ratios, the
study analyzed financial competitiveness of the Macau gaming industry against its peers in North
America and Europe. The analysis involved product structure, revenue composition, assets
efficiency and profitability of Macau versus those of gaming destinations in North America and
Europe. The findings revealed that while Macau was better positioned in terms of assets
efficiency and financial returns, its casino product and revenue structures were at odds with the
gaming trend. To maintain a stable gaming revenue growth and retain its competitiveness,
Macau must modify its casino product structure and revenue composition.

7
As can be seen from the reviewed literature, cross-country or cross-destination comparisons
of financial ratios can be a useful tool for identifying strengths and weaknesses, successes and
problems of business operations at a macro level. The findings may provide guidance for
improving industry performance in a country or a destination.
Purpose of the Study and Research Hypothesis
The U.S. hospitality industry has been a leading player in the world. According to Hotel
Online (2007), eight of the 10 largest hotel groups in the world are U.S. based and about 60% of
the world’s hotel capacity or 3.2 million hotel rooms are located in the U.S. Using the U.S.
hospitality industry as a benchmark, this study attempts to identify problems and weaknesses, if
any, existing in the Korean hospitality industry by examining some key financial ratios in
comparison with those of its U.S. peer in 2006, the most recent year with available data when
this study was conducted. Here, our null research hypothesis is that there is no difference in key
financial ratios between the hospitality industries of the two countries whereas the alternative
hypothesis is that those ratios differ across the countries. Suggestions regarding how the Korean
hospitality industry may improve will be provided based on the comparison.
To the best of our knowledge, no cross-country benchmarking studies have been conducted
for the Korean hospitality industry so far. The current study will enable Korean lodging and
restaurant operators to better understand their standing vis-à-vis the leading player in the world’s
hospitality industry, thus helping them formulate policies and strategies to overcome problems

8
and weaknesses, if any. Meanwhile, the findings of the study should help enrich the hospitality
finance research from an international perspective.
Sample Firms and Ratios Examined
The sample of Korean hospitality firms in this study was drawn from the Korean financial
supervisory service database. First, all lodging and restaurant firms with available financial
statements in 2006, the most recent year with accessible data when the study was conducted,
were searched. This study identified a usable sample of 194 firms with 165 firms from the
lodging sector and 29 firms under restaurant category. The data source for U.S. hospitality firms
was Standard & Poor’s COMPUSTAT contained in the WRDS (Wharton Research Data
Services) database for the same year. First, all available companies in 2006 with a Standardized
Industrial Classification (SIC) code of 7011, which refers to “Hotels and Motels,” were searched.
This search resulted in 14 companies. Next, all companies in 2006 with SIC code of 5812, which
represents “Eating Places” were explored. The search ended up with 66 listed companies.
Combined together, the U.S. sample was composed of 80 hospitality firms. For some financial
ratios, the numbers of observations are fewer than 194 for Korean firms and 80 for U.S. firms
due to missing data.
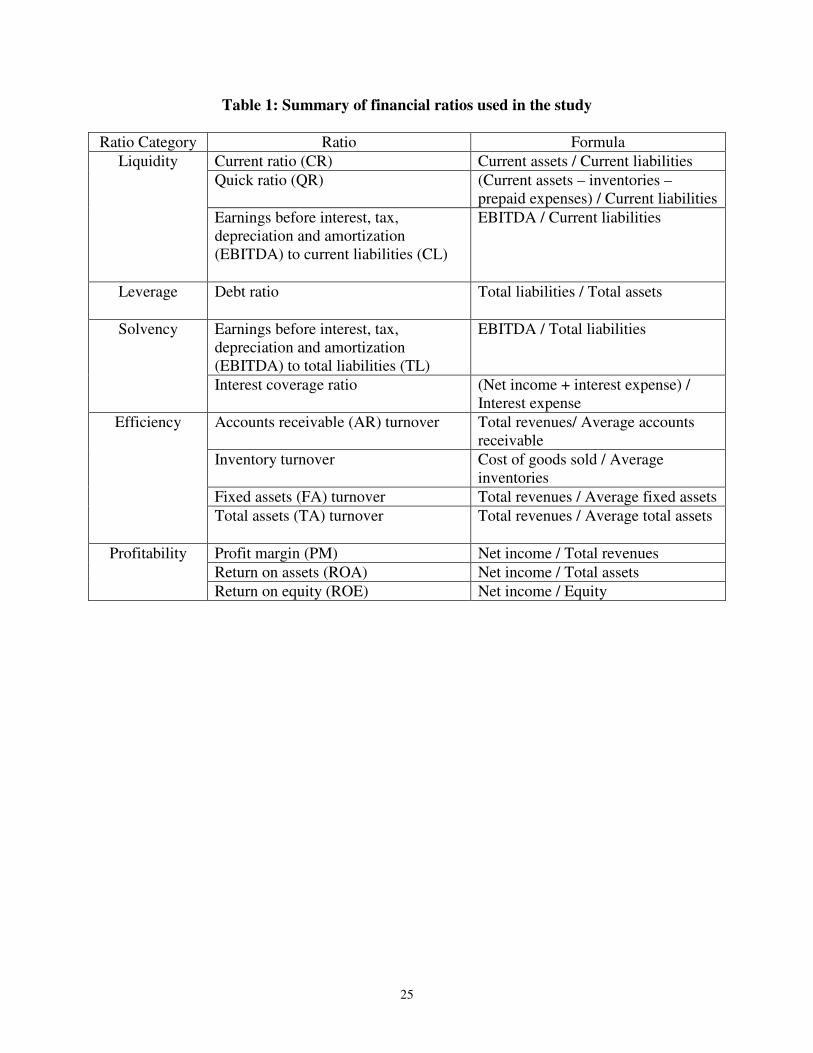
According to Singh and Schmidgall (2001), financial ratios can be grouped into five general
categories based on their purposes. Liquidity ratios indicate a firm’s ability to pay its short-term
obligations on time while leverage ratios measure the extent to which a company is relying upon
debt financing. Solvency ratios evaluate a firm’s capability to cover all of its financial charges.

9
Efficiency ratios measure the productivity of an operation for a given level of inputs. They assess
the productivity of a firm’s assets in generating revenues. Profitability ratios determine the
management’s effectiveness in generating returns on sales and investment. These five groups of
ratios reflect the overall financial condition and performance of a firm. Based on the ratio
categorization provided by Singh and Schmidgall (2001) and the availability of financial
information for deriving ratios of the sample hospitality firms, 13 financial ratios encompassing
the five categories, namely liquidity, leverage, solvency, efficiency, and profitability, were
selected for the comparative analysis in this study. Those ratios and their derivation formulas are
presented in Table 1.
(Table 1 here)
Based on the financial statements of the sample firms in 2006, the 13 financial ratios were
computed for each firm. The cross-sample mean value of each of the 13 ratios was calculated for
the Korean hospitality firms and the U.S. hospitality firms respectively. Independent sample t-
tests were then employed to test the difference between the group means of the Korean and U.S.
hospitality firms for each ratio.
Findings
Table 2 presents the group means of each country for the 13 financial ratios calculated based
on the 2006 data. The t-test statistics and related significance levels are also presented.

10
(Table 2 here)
The results of the independent sample t-tests show that at the 0.01 significance level, the two
groups are significantly different in four ratios – earnings before interest, tax, depreciation and
amortization (EBITDA) to current liabilities (CL), debt ratio, FA turnover, and TA turnover. At
the 0.05 level, inventory turnover ratios of the two groups are also significantly different. At the
0.10 level, two more ratios are significantly different between the two countries, namely
EBITDA to total liabilities (TL) and ROA ratios. Hence, the null hypothesis that the two group
means are equal can be rejected at least at the 0.1 significance level for the following seven ratios
– EBITDA to CL, EBITDA to TL, debt ratio, inventory turnover, FA turnover, TA turnover, and
ROA.
Based on Table 2, it is obvious that there was a huge performance gap between the
hospitality industries of the two countries in 2006. Although the differences in the two
conventional liquidity ratios – current ratio and quick ratio – are not statistically significant
between the two countries, the EBITDA to CL ratio, which indicates the liquidity provided from
the operation, shows statistically significant difference between the two groups. The U.S.
hospitality firms generated more than three times higher EBITDA or operating earnings to cover
current liabilities than their Korean counterparts. This ratio essentially indicates a firm’s ability
to cover its short-term liabilities using EBITDA – an approximation of operation generated cash
flows. A higher EBITDA to current liabilities ratio indicates better liquidity from the operation

11
perspective (Ryu & Jang, 2004). Our result demonstrates that U.S. hospitality firms were in a
much stronger position to cover their current obligations using operation generated earnings.
Debt ratio was used as a means to examine a firm’s leverage status. The debt ratio basically
measures a firm’s indebtedness by expressing the proportion of the company’s assets that are
supported by debt (Kim & Ayoun, 2005). Higher total liabilities to total assets or a higher debt
ratio indicates that a firm relies heavily on debt financing. The comparison of the two groups’
mean debt ratios shows that Korean firms were on average twice more indebted compared to
their U.S. counterparts. The mean debt ratio of the Korean firms shows that these firms were, on
average, financed by 80 percent of debts and 20 percent of equity. This is significantly different
from the financial structure of the U.S. firms with 35 percent debt-financing and 65 percent
equity-financing as indicated by the U.S. mean debt ratio of 0.35. It has been previously reported
that in general, Korean firms were heavily leveraged and their over reliance on debt financing
was a major cause of the business failure (Cho et al., 1983). It seems that the debt-inclined
financing pattern remains unchanged in the Korean hospitality industry after two decades.
In terms of solvency, the EBITDA to TL ratio, which indicates the extent to which operating
earnings can be used to cover the total debt (Kim & Gu, 2006; Schmidgall & DeFranco, 2004),
shows that U.S. hospitality firms were better positioned at the 0.10 level. The EBITDA to TL
ratio of 0.21 for U.S. firms, in comparison to the same ratio of 0.09 for the Korean firms, shows
that the U.S. hospitality firms’ ability to cover debts with operation generated profits was about
twice that of their Korean counterparts. In other words, an average U.S. hospitality firm was
twice more solvent than a Korean hospitality firm in terms of operation provided cash coverage.

12
Interest coverage ratio measures the ability of a firm to cover its interest expenses (Schmidgall &
DeFranco, 2004). This ratio is particularly useful to creditors as it measures the solvency of a
business from an income perspective by indicating the company’s ability to take on new debt
(Kim & Ayoun, 2005; Schmidgall & DeFranco, 2004). While this ratio was not significantly
different between the two groups, the much higher interest coverage of the U.S. firms
demonstrates that U.S. firms had better ability to pay debt interests using earnings before
interests and taxes.
For the efficiency ratios, three out of four ratios, namely inventory turnover, fixed asset
turnover, and total asset turnover, turned out to be significantly different between the two groups
at least at the 0.05 level. Accounts receivable turnover ratio assesses the speed of conversion of
accounts receivable into cash (Schmidgall & DeFranco, 2004). As Table 2 shows, U.S.
hospitality firms had higher average accounts receivable turnover, although not at a statistically
significant level. Inventory turnover is an important ratio that evaluates the efficiency of a firm in
using the invested resources (Schwei, 1996). Higher inventory turnover means more efficient
inventory management (Kim & Ayoun, 2005). Korean hospitality firms had significantly lower
inventory turnover ratio compared to U.S. hospitality firms, suggesting that they were selling
inventories much slower than their U.S. peers. While there are no guidelines that specify an
optimal level of inventory turnover for each industry, it is generally recommended to strive for as
high rate as possible (Schwei, 1996). This is because instead of spending cash on a large amount
of inventory, a company may do other things with the cash such as pay off bank loans or invest
in new capital equipment (Schwei, 1996). Fixed asset turnover determines the effectiveness of
management in using the fixed assets (i.e., rooms, restaurant spaces, cooking equipments) to

13
generate sales revenue (Schmidgall & DeFranco, 2004). A higher fixed assets turnover implies
that the fixed assets are generating more revenues for the company. Hospitality industry is
typically fixed asset intensive and in order to be successful, a firm needs to efficiently use its
existing fixed assets to attract customers and generate revenue. As Table 2 indicates, on average,
U.S. firms were very efficient and generated $2.17 in sales for every $1 of fixed assets. In
contrast, an average Korean firm managed to produce just $0.82 in revenue for every $1 invested
in the fixed assets. The total assets turnover ratio was also significantly different between the two
groups. Similar to the fixed assets turnover ratio, this ratio evaluates the efficiency of a firm in
using its total assets to generate sales. The findings indicate that on average, U.S. hospitality
firms were three times more efficient than Korean hospitality firms in using the total assets to
generate sales revenue.
The profit margin ratio expresses the firm’s profitability of sales as net income per dollar of
sales (Kim & Ayoun, 2005). In Table 2, the negative mean profit margin ratios of the two groups
indicate poor profitability for both in 2006. However, Korean firms were about 10 times worse
than their U.S. peers. The ROA ratio measures the relationship between net income and total
assets (Schmidgall & DeFranco, 2004). This ratio indicates the amount of net profit generated
from each dollar invested in the firm’s assets. In 2006, U.S. hospitality firms were able to
generate an average of $0.03 for every dollar invested in assets, while Korean hospitality firms
on average had a negative return on the assets. The difference between two groups’ ROA ratios
was significant at the 0.1 level. Among the three profitability indicators used in this study, ROA
is the most reliable one as it incorporates information of both profitability and efficiency into its
computation (Rothschild, 2006). While all three profitability ratios have frequently been

14
employed in previous studies to evaluate a firm’s profitability, ROA is the most widely used and
preferred ratio (Fraser & Kolari, 1985). The ROE ratio computes the return to the investment
made by the owners. Higher ROE means greater net return on every dollar the shareholder
invested in the firm. Although the difference in the ratio between the two groups is not
statistically significant, U.S. firms were able to produce a positive ROE on average whereas
Korean hospitality firms brought a loss to their owners. Here it must be pointed out that the ROA
ratio is a more reliable indicator of U.S. firms’ better profitability because the t-test shows that
the difference between two groups’ ROA ratios is significant at the 0.1 level.
In summary, the results of the ratio comparison suggest that U.S. hospitality firms were
better positioned than their Korean counterparts in all five dimensions, namely liquidity, leverage,
solvency, efficiency, and profitability. In 2006, the mean values of the liquidity, solvency,
efficiency, and profitability ratios were noticeably lower for the Korean hospitality industry in
comparison to the U.S. hospitality industry. On the other hand, the mean value of the leverage
ratio is much higher for the Korean group than for the U.S. group. Evidently, the debt-burdened
Korean hospitality industry was outperformed by its U.S. peer.
What’s Behind the Gap?
The above findings indicate that in 2006 there existed a significant performance gap between
the Korean and U.S. hospitality industries. At least at the 0.1 significance level, an average U.S.
hospitality firm outperformed its Korean counterpart in ratios representing liquidity, leverage,
solvency, efficiency, and profitability. What has caused this gap? This study has identified the

15
following plausible reasons that may explain the underperformance of the Korean hospitality
firms.
First, the significantly higher debt ratio (0.80) of Korean hospitality firms is likely to be
responsible for, at least partially, their poorer profitability. In the study comparing the financial
performance of U.S. and Korean manufacturing firms, Lee (1998) found that Korean firms’ poor
performance was due to the extremely high financing charges that these firms had to pay as a
result of heavy borrowing. According to Kim (2003), if a primary source of financing for a hotel
firm is debt, the firm is likely to suffer for a considerable period of time as it is burdened by high
interest expenses. For the restaurant industry, Yoon and Jang (2005) pointed out that, due to the
high-cost nature of the restaurant operation, profitability may vary based on the level of interest
expenses. Traditionally, Korean firms have relied heavily on debt financing. This is mainly
because the government-led credit allocation policy has excessively promoted the business firms
to grow by making more investments using debts (Lee, 1998). In a saturated market with high
competition like the Korean hospitality industry, heavy debt financing charges further strain the
already tight profit margins, leading to poor or negative profits.
Second, overcapacity in both the lodging and the restaurant sectors should have negatively
affected the performance of the Korean hospitality industry. Korean hospitality industry’s
overcapacity is reflected in its less efficient use of assets. As revealed in our analysis of
efficiency ratios, Korean hospitality firms’ operating efficiency falls far behind their U.S.
counterparts, especially in terms of fixed assets turnover and total assets turnover ratios. Another
indicator of Korean lodging industry’s overcapacity is its low room occupancy. From 1998 to
16
2004, Korean hotels’ average occupancy rate was 58.91%, a sign of oversupply of rooms in the
market (KOSIS, 2008). In 2001, the U.S. lodging industry was experiencing its lowest
occupancy in 10 years at 63.7% (“U.S. Hotel Occupancy”, 2001) due to the 9/11 terrorist attacks
and an economy recession. This occupancy rate, however, was still much higher than Korea’s
average occupancy during the 1998-2004 period. Facing low demand for hotel rooms, many
Korean lodging firms had to switch their business focus from rooms operation to non-room
operations. As revealed by KOSIS (2008), between 1998 and 2004, on average, only 42.33% of
lodging firms’ total revenue was generated from rooms department while the remaining 57.77%
came from non-room operations. The under-utilization of room assets was severe in the industry
due to overcapacity. Inefficient use of rooms implies waste of the largest hotel asset and will
eventually lead to low profitability.
Oversupply in Korea’s restaurant sector is also a serious problem. According to Korea Rural
Economic Institute (KREI) (2005), during the economic slump starting from the late 1990’s, the
country’s unemployment rates soared and many unemployed persons used their retirement grants
to open restaurants, primarily because they perceived the industry to have low barriers to entry.
As a result, the total number of restaurant firms soared despite poor market conditions, leading to
severe oversupply in the restaurant industry. In Korea, there is one restaurant for every 64 people
in comparison to one restaurant for every 334 people in the U.S. (KREI, 2005). In addition, a
survey of independent restaurants in Korea found that only 8.4% of them were making profits,
while 26.4% of them could not even pay rent or cover operating expenses (KREI, 2005).
Oversupply and hyper competition prevalent in the Korean hospitality industry appears to have
diluted the limited amount of hospitality revenues across numerous hospitality firms. The sample
17
Korean firms in this study had average annual sales of $29.86 million whereas the annual sales
of our sample U.S. firms averaged at $1.03 billion.
Lastly, a lack of economies of scale in the Korean hospitality industry may be another reason
for its poorer performance. The Korean hospitality firms are much smaller than their U.S. peers.
The Korean companies in this study had average assets of $116.39 million, while the assets of
the sample U.S. firms averaged at $1.28 billion, 10 times larger than the Korean firms. Cullen
(1997) suggests that large hotels can achieve better efficiency and profitability due to economies
of scale in purchasing, production, management, personnel, marketing, and finance. Lin and Liu
(2000) examined the relationship between costs and operating scale of international tourist hotels
in Taiwan and their results supported the existence of economies of scale in hotel operations.
Investigating the performance of China’s hotel industry in the 1990’s, Gu (2003) found declining
operation size as a major contributor to the industry’s declining profitability. The Korean
hospitality industry is featured with numerous small hotels and restaurants. The much smaller
size of Korean lodging and restaurant operations implies higher operating costs per unit output
and is a likely reason for its lower efficiency, especially in its use of inventory and fixed assets,
and poor profitability.
Suggestions for Korean Hospitality Firms
Over reliance on debt financing, overcapacity, and a lack of economies of scale are the likely
contributors to the underperformance of the Korean hospitality industry. To catch up with their

18
U.S. counterparts, Korean hospitality firms need to reevaluate their strategies regarding financing,
investments, and operations.
First of all, it is recommended that Korean firms change their debt-inclined financing habit
and increase the proportion of equity in financing. Traditionally, Korean firms have been heavily
leveraged compared to firms in other countries (Bongini, Ferri, & Hahm, 2000). This study has
found that debt-oriented financing tradition still prevails in the Korean hospitality industry. Debt-
financing has the tax shield as its advantage and financial distress risk as its disadvantage. The
trade-off financing theory suggests that there exists an optimal leverage ratio at which the present
value of tax shield of additional debt is just offset by the decrease in the present value caused by
financial distress cost (Myers, 2001). In the early 2000’s, tough economic and market conditions
put numerous Korean lodging firms on the brink of insolvency (Shin & Lee, 2002). With an
average debt ratio of 0.8, the Korean hospitality industry may have far exceeded the optimal
leverage ratio. Korean hospitality firms should cut back from their excessive debt financing as
the risk of business failure is always high to firms with heavy borrowings (Altman, Eom, & Kim,
1995). Furthermore, heavy borrowing is associated with heavy interest burdens. Excessive use of
debt will greatly increase the financial risk of Korean hospitality firms that are already exposed
to high business risk due to overcapacity. Changing its pro-debt financing habit and increasing
equity financing is critical for the Korean hospitality industry to improve its performance.
To reduce overcapacity, the Korean hospitality industry should work on both supply and
demand sides. On the supply side, the industry should place some control over growth so as to
alleviate overcapacity. During the 6 years from 1998 to 2004, the Korean lodging sector’s
19
capacity in terms of rooms available for sale increased at an average annual rate of 3.23% while
the number of rooms sold, on average, increased only by 2.32% (KOSIS, 2008). Evidently, room
capacity has increased faster than the demand. In a saturated lodging market with intense
competition, such as the one in Korea, it is important for firms to make full use of their existing
capacity before expanding. For Korean hospitality firms, restricting new lodging developments
may be necessary for raising the efficiency of its existing properties. On the demand side, the
lodging sector needs to reexamine its pricing strategy. According to Yoon (2004), Korean
lodging firms, on average, have higher average daily room rates but lower profit margin,
compared to lodging firms in other countries. Offering lower room rates would be especially
important to attract foreign tourists as they are highly sensitive to changes in the room rates. It
has been found that a 10% increase in room rates will result in a decrease of 100,000 in foreign
tourists and a $130 million loss in revenue for Korea (Yoon, 2004).
Finally, Korean hospitality firms should increase their operation scale to achieve economies
of scale. As Cullen (1997) points out, lodging firms can benefit from economies of scale in terms
of purchasing, production, management, personnel, marketing, and finance. This study has found
that on average, the hospitality firm in Korea is about one-tenth the size of its U.S. counterpart.
The Korean hospitality industry is dominated by small operations. As of 2006, 41,932 or 96% of
all Korean lodging firms had less than 50 rooms (KOSIS, 2006). According to American Hotel
& Lodging Association (AHLA), a lodging firm in the U.S. has 93 guest rooms on average
(AHLA, 2007). On the other hand, KREI (2005) reported that the vast majority or 85.1% of
restaurant firms in Korea generate less than $0.1 million per unit in annual sales. In contrast, in

20
the U.S., average unit sale is $0.83 million for a full service restaurant and $0.69 million for a
limited-service restaurant (National Restaurant Association, 2006).”
With very small operations prevailing, it would be hard for the Korean hospitality industry to
achieve cost efficiency. To realize economies of scale, Korean hospitality developers should
consider building fewer but larger properties if new facilities are needed. For existing hospitality
operations, there are two ways to increase the operation scale. One is to consolidate numerous
small operations into large hotel and restaurant chains via mergers and acquisitions.
Consolidation within the industry will not only increase hospitality operation sizes but also help
reduce competition among numerous small firms. If consolidation via mergers and acquisitions
is not desirable or feasible for small Korean hospitality firms, then operating consortiums may be
organized as an alternative way to realize some economies of scale (Gu, 2003). The operating
consortium allows participating firms to operate as chain-properties and realize the benefits of
larger scale economies while still maintaining each property’s identity.
In summary, there are many reasons for the performance gap between the Korean and U.S.
hospitality industries. However, the major causes of the underperformance of the Korean
hospitality firms are likely to be their debt-oriented financial structure, overcapacity in a
saturated market and a lack of economies of scale. Therefore, to catch up with its U.S. peer and
eliminate the performance gap, the Korean hospitality industry must change its pro-debt
financing policy, adopt a conservative growth policy to minimize overcapacity, and enlarge the
operation scale via some structural reorganization within the industry.
21
Limitations and Suggestions for Future Research
This study is only a preliminary cross-country benchmarking analysis for hospitality firms
using financial ratios. A major limitation of this study is that it only utilized the company data for
2006, the most recent year with available data when the study was conducted. It was not until
recently that data of public Korean hospitality firms became widely available. Extending the time
frame of our investigation to earlier years would result in a much smaller sample, making the
findings less representative of the Korean hospitality industry reality. The limitation of this one-
year data analysis is obvious because our findings are valid only for 2006 and cannot be
generalized to other time periods. As more Korean hospitality firms started to release data after
2006, future studies on Korean firm performance definitely need to extend the time frame to
include more years of observations, thus increasing the cross-time validity of performance
analysis.
Our preliminary study of Korean hospitality firms’ performance used a combined sample of
lodging and restaurant firms without separating hotels from restaurants, and this is another
limitation of our analysis. According to Brigham and Gapenski (1994), use of industry-specific
sample is always preferable to the use of combined sample because characteristics pertaining to
restaurant firms are likely to differ from those representing lodging firms. As such, future
benchmarking research for the Korean hospitality industry should investigate individual sectors
of restaurants and hotels separately, thus identifying weaknesses and problems more accurately
for each sector of the Korean hospitality industry.
References

22
Altman, E. I., Eom, Y. H. & Kim, D. W. (1995). Failure prediction: Evidence from Korea. Journal of International Financial Management & Accounting, 6 (3), 230-249. American Hotel & Lodging Association (2007). 2007 lodging industry profile. Retrieved January 6, 2009, from www.ahla.com/content.aspx?id=4488 Bank of Korea. (2006). Korean economy. Retrieved January 27, 2008, from www.bok.or.kr/ index.jsp. Bank of Korea. (2008). Economic outlook for 2008. Retrieved January 27, 2008, from www.bok.or.kr/index.jsp. Blaine, M. (1994). Comparing the profitability of firms in Germany, Japan, and the United States. Management International Review, 34 (2), 125-148. Bongini, P., Ferri, G., & Hahm, H. (2000). Corporate bankruptcy in Korea: Only the strong survive? The Financial Review, 35 (4), 31-50. Brigham, E. F., & Gapenski, L. C. (1994). Financial management: Theory and practice (7th ed.). Orlando, FL: The Dryden Press. Brown, P. R., Soybel, V. E., & Stickney, C. P. (1994). Comparing U.S. and Japanese corporate-level operating performance using financial statement data. Strategic Management Journal, 15 (1), 75-83. Choi, D. S., Hino, H., Min, S. K., & Oh, N. S. (1983). Analyzing foreign financial statements: The use and misuse of international ratio analysis. Journal of International Business Studies, 14 (1), 113-125. Choi, H. (2008, May 22). More than 70% of lodging and restaurants firms fail within the first 5 years. Seoul Economy. Retrieved May 23, 2008, from http://economy.hankooki.com/lpage/economy/200805/e2008052218234270060.htm Cullen, P. (1997). Economies for hospitality management. Oxford, U.K.: International Thomson Business Press. Fraser, D. R., & Kolari, J. W. (1985). How are the small banks doing? American Journal of
Small Business, 9 (3), 1-9. Gu, Z. (2002). Performance gaps between U.S. and European casino operations: A comparative study. Gaming Research & Review Journal, 6 (2), 53-62. Gu, Z. (2003). The Chinese lodging industry: Problems and solutions. International Journal of
Contemporary Hospitality Management, 15 (7), 386-392. Gu, Z. & Gao. J. (2006). Financial competitiveness of Macau in comparison with other gaming destinations. UNLV Gaming Research & Review Journal, 10 (2), 1-12.

23
Hotel Online (2007). The 2006 World Ranking; 10 largest hotel groups and 20 largest brands. Retrieved January 6, 2009, from http://www.hotel-online.com/News/PR2007_2nd/Jun07_HotelRanking. html. Kim, D. (2003). Special features of hotel industry from the perspective of credit valuation. Retrieved January 31, 2008, from www.kisrating.com. Kim, H., & Gu, Z. (2006). A logistic regression analysis for predicting bankruptcy in the hospitality industry. The Journal of Hospitality Financial Management, 14 (1), 17-34. Kim, W. G., & Ayoun, B. (2005). Ratio analysis for the hospitality industry: A cross sector comparison of financial trends in the lodging, restaurant, airline, and amusement sectors. The
Journal of Hospitality Financial Management, 13 (1), 59-78. Korea Rural Economic Institute (KREI). (2005). A study on evaluating and improving food away from home statistics (GOVP 1200617030). Retrieved May 10, 2008, from http://agre.krei.re.kr/file/pdfsource/91409p.pdf. Korean Statistical Information Service (KOSIS). (2008). Korean Statistical Information Service. Retrieved February 5, 2008, from www.kosis.kr. Lee, J. (1998). Causes for business failures: Understanding the 1997 Korean crisis. Journal of
Asian Economics, 9 (4), 637-651. Lee, J., & Blevins, D. E. (1990). Profitability and sales growth in industrialized versus newly industrializing countries. Management International Review, 30 (1), 87-100. Lin, B., & Liu, H. (2000). A study of economies of scale and economies of scope in Taiwan international tourist hotels. Asia Pacific Journal of Tourism Research, 5 (2), 21-28. Myers, S. C. (2001). Capital structure. Journal of Economic Perspectives, 15 (2), 81-102. National Restaurant Association (2006). Restaurant industry – Facts at a glance. Retrieved January 8, 2009, from www.restaurant.org/research/ind_glance.cfm. Ozgulbas, N., & Koyuncugil, A. S. (2006). Benchmarking of general hospitals to improve financial performance. The Business Review, 5 (2), 284-289. Park, D., Choi, H., & Ahn, K. (2008). KIS industry outlook: Hotels. Retrieved January 31, 2008, from www.kisrating.com/report/industry_outlook/IO20080131-08.pdf. Park, H. (2007, August 10). Home-like serviced residence: Huge success. Money Today. Retrieved May 13, 2008, from www.moneytoday.co.kr/view/mtview.php?type=1&no=2007 080818025352687&outlink=1.
24
Rothschild, M. (2006). Shareholders pay for ROA. Strategic Finance, 88 (5), 26-31. Ryu, K., & Jang, S. (2004). Performance measurement through cash flow ratios and traditional ratios: A comparison of commercial and casino hotel companies. The Journal of Hospitality
Financial Management, 12 (1), 15-25. Schmidgall, R. S. & DeFranco, A. L. (2004). Ratio analysis: Financial benchmarks for the club industry. The Journal of Hospitality Financial Management, 12 (1), 1-14. Schwei, T. (1996). Key financial statement ratios. Small Business Forum, 14 (2), 54-55. Shin, K., & Lee, Y. (2002). A genetic algorithm application in bankruptcy prediction modeling. Expert Systems with Applications, 23 (3), 321-328. Singh, A. J., & Schmidgall, R. S. (2001). Use of ratios by financial executives in the U.S. lodging industry. The Journal of Hospitality Financial Management, 9 (1), 27-44. U.S. hotel occupancy hits 10-year low - Ernst & Young revises 2001 national lodging forecast after September 11 attack (2001, October 8). Hospitality Net. Retrieved May 5, 2008, from http://www.hospitalitynet.org/news/4009416.search?query=us+hotel+occupancy. Yoon, E., & Jang, S. (2005). The effect of financial leverage on profitability and risk of restaurant firms. The Journal of Hospitality Financial Management, 13 (1), 35-47. Yoon, J. (2004, December 14). Analyzing current and future business strategies in the Korean lodging industry. Paper presented at the Korea Culture & Tourism Institute forum. Retrieved May 11, 2008, from http://cafe.naver.com/gaury.cafe?iframe_url=/ArticleRead. nhn%3Farticleid=18638.
25
Table 1: Summary of financial ratios used in the study
Ratio Category Ratio Formula
Liquidity Current ratio (CR) Current assets / Current liabilities
Quick ratio (QR) (Current assets – inventories – prepaid expenses) / Current liabilities
Earnings before interest, tax, depreciation and amortization (EBITDA) to current liabilities (CL)
EBITDA / Current liabilities
Leverage Debt ratio
Total liabilities / Total assets
Solvency Earnings before interest, tax, depreciation and amortization (EBITDA) to total liabilities (TL)
EBITDA / Total liabilities
Interest coverage ratio (Net income + interest expense) / Interest expense
Efficiency Accounts receivable (AR) turnover Total revenues/ Average accounts receivable
Inventory turnover Cost of goods sold / Average inventories
Fixed assets (FA) turnover Total revenues / Average fixed assets
Total assets (TA) turnover
Total revenues / Average total assets
Profitability Profit margin (PM) Net income / Total revenues
Return on assets (ROA) Net income / Total assets
Return on equity (ROE) Net income / Equity

26
Table 2: Summary of ratio statistics of U.S. and Korean firms in 2006
Ratios Average of U.S. Firms
Average of Korean Firms t-value Sig.
Liquidity
CR 1.3551 (n = 79) 0.9386 (n = 194) 1.3370 0.1820
QR 1.0394 (n = 79) 0.8645 (n = 194) 0.5780 0.5640
EBITDA to CL 0.6741 (n = 79) 0.1982 (n = 194) 4.5470 0.0000***
Leverage
Debt Ratio 0.3546 (n = 80) 0.7998 (n = 194) -7.6560 0.0000***
Solvency
EBITDA to TL 0.2125 (n = 80) 0.0899 (n = 194) 1.7260 0.0880*
Interest Coverage 6.5800 (n = 69) 1.5417 (n = 174) 1.0080 0.3140
Efficiency
AR turnover 83.9073 (n = 78) 52.7813 (n = 189) 1.3290 0.1850
Inventory turnover 90.7164 (n = 76) 62.1766 (n = 162) 2.3360 0.0200**
FA turnover 2.1721 (n = 79) 0.8160 (n = 193) 3.6590 0.0000***
TA turnover 1.4579 (n = 80) 0.4849 (n = 194) 10.0490 0.0000***
Profitability
Profit Margin -0.0958 (n = 80) -0.9624 (n = 194) 1.5820 0.1150
Return on Assets 0.0283 (n = 80) -0.0043 (n = 194) 1.8550 0.0650*
Return on Equity 0.0552 (n = 80) -0.0319 (n = 194) 0.4410 0.6590 Note. * indicates p < 0.1, ** indicates p < 0.05, *** indicates p < 0.01