Performance Evaluation of Stand-alone and On Grid ... · 2Assistant Professor, C.G.P.I.T, Uka...
6
International Research Journal of Engineering and Technology (IRJET) e-ISSN: 2395-0056 Volume: 05 Issue: 12 | Dec 2018 www.irjet.net p-ISSN: 2395-0072 © 2018, IRJET | Impact Factor value: 7.211 | ISO 9001:2008 Certified Journal | Page 542 Performance Evaluation of Stand-alone and On Grid Photovoltaic System using PVSYST Software. Asia’u Talatu Belgore 1 , Prof. Ranjit Rajak 2 , Prof. Priyanka Patel 3 1 Student, C.G.P.I.T, Uka Tarsadia University, Bardoli, Surat, India 2 Assistant Professor, C.G.P.I.T, Uka Tarsadia University, Bardoli, Surat, India 3 Assistant Professor, C.G.P.I.T, Uka Tarsadia University, Bardoli, Surat, India ---------------------------------------------------------------------***---------------------------------------------------------------------- Abstract - There are a number of factors behind the development of a nation, electricity is one of them. Nowadays, the main challenge for both developed and developing countries is to generate electricity continuously to meet the demand which is increasing tremendously day by day. This paper simulates the feasibility of installing a stand-alone and Grid connected system in the Nursing college building and Feeder 2 connected loads of Uka Tarsadia University respectively. The technical performance of a 21.12 kW stand- alone system of performance ratio 56.99% based on load analysis is evaluated. Feeder 2 with total load demand of 1074 kW, a technical performance of a 1121 kW grid connected system of performance ratio 78.53% is evaluated. The overall performance of PV systems are always characterized by various parameters such as geographical location, panel orientation, mounting structure, climatic conditions, PV module, system characteristics etc. Performance ratio and Solar fraction are index which represents the level of utilization of the system. The simulations are carried out using PVsyst, a software package for the analysis and simulation of a complete PV systems. Key Words: Electricity, Stand-alone System, Grid- connected System, Photovoltaic (PV), Meteor data, PVsyst Software. 1. INTRODUCTION The sun provides the energy to sustain life in our solar system. In one hour, the earth receives enough energy from the sun to meet its energy needs for nearly a year. Photovoltaic is the direct conversion of sunlight to electricity. It is an attractive alternative to conventional sources of electricity for many reasons; it is safe, silent, and non-polluting, renewable, highly modular in that their capacity can be increased incrementally to match with gradual load growth, and reliable with minimal failure rates and projected service lifetimes of 20 to 30 years [1]. It requires no special training to operate, it contains no moving parts, it is extremely reliable and virtually maintenance free, and it can be installed almost anywhere. Electricity production using renewable energy resources (RES) reduces environmental impacts and produces least amount of secondary wastes. A photovoltaic (PV) system consists of a PV array, battery and elements for power conditioning. The PV system converts solar energy into dc power. If ac loads are used, the system requires inverter to convert dc into ac. There are two types of PV system; the grid connected and standalone [5]. Grid connected photovoltaic systems feed electricity directly to the electrical network, operating parallel to the conventional energy source. Grid- connected systems generate clean electricity near the point of use, without the transmission and distribution losses or the need for the batteries. A stand-alone system involves no interaction with a utility grid, hence the generated power supplies only the designed load. In case the PV array does not directly supply a load, a storage device is needed [2,5], mostly which is a battery. The battery bank stores energy when the power supplied by the PV modules exceeds load demand and releases it backs when the PV supply is insufficient. This stand-alone PV power generation will be used in the home or building for the electrification purpose [2, 4]. Wide variety of tools exist for the analysis and dimensioning of both Grid connected and stand-alone photovoltaic systems. PVsyst is a dedicated PC software package for PV systems. The software was developed by the University of Geneva. It integrates pre-feasibility, sizing and simulation support for PV systems. After defining the location and loads, the user selects the different components from a product database and the software automatically calculates the size of the system. The solar data at 0.5° latitude and longitude resolution are available in PVsyst Software [4,7]. For this study, the simulations are performed by using PVsyst 6.7.5. The graphs and tables that will depict in the later portion of the paper had been generated while doing the simulation. 1.1 Geographical Location The geographical location of the site is Tarsadia, latitude of 21.07 o N, and longitude of 73.13 o E. The meteorological data is acquired from Meteor 7.2, a comprehensive climatological database for solar energy applications, with annual solar radiation of 5.5 – 6.6 kWh/m 2 /day at altitude of 32m above sea level. The tilt angle for PV array is kept as equal to the latitude of the corresponding location to get maximum solar irradiation [3, 6]. So that the optimum tilt angle is kept as 21 o
Transcript of Performance Evaluation of Stand-alone and On Grid ... · 2Assistant Professor, C.G.P.I.T, Uka...
International Research Journal of Engineering and Technology (IRJET) e-ISSN: 2395-0056
Volume: 05 Issue: 12 | Dec 2018 www.irjet.net p-ISSN: 2395-0072
© 2018, IRJET | Impact Factor value: 7.211 | ISO 9001:2008 Certified Journal | Page 542
Performance Evaluation of Stand-alone and On Grid Photovoltaic
System using PVSYST Software.
Asia’u Talatu Belgore 1, Prof. Ranjit Rajak 2, Prof. Priyanka Patel 3
1Student, C.G.P.I.T, Uka Tarsadia University, Bardoli, Surat, India 2Assistant Professor, C.G.P.I.T, Uka Tarsadia University, Bardoli, Surat, India 3Assistant Professor, C.G.P.I.T, Uka Tarsadia University, Bardoli, Surat, India
---------------------------------------------------------------------***----------------------------------------------------------------------Abstract - There are a number of factors behind the development of a nation, electricity is one of them. Nowadays, the main challenge for both developed and developing countries is to generate electricity continuously to meet the demand which is increasing tremendously day by day. This paper simulates the feasibility of installing a stand-alone and Grid connected system in the Nursing college building and Feeder 2 connected loads of Uka Tarsadia University respectively. The technical performance of a 21.12 kW stand-alone system of performance ratio 56.99% based on load analysis is evaluated. Feeder 2 with total load demand of 1074 kW, a technical performance of a 1121 kW grid connected system of performance ratio 78.53% is evaluated. The overall performance of PV systems are always characterized by various parameters such as geographical location, panel orientation, mounting structure, climatic conditions, PV module, system characteristics etc. Performance ratio and Solar fraction are index which represents the level of utilization of the system. The simulations are carried out using PVsyst, a software package for the analysis and simulation of a complete PV systems.
Key Words: Electricity, Stand-alone System, Grid-connected System, Photovoltaic (PV), Meteor data, PVsyst Software.
1. INTRODUCTION The sun provides the energy to sustain life in our solar system. In one hour, the earth receives enough energy from the sun to meet its energy needs for nearly a year. Photovoltaic is the direct conversion of sunlight to electricity. It is an attractive alternative to conventional sources of electricity for many reasons; it is safe, silent, and non-polluting, renewable, highly modular in that their capacity can be increased incrementally to match with gradual load growth, and reliable with minimal failure rates and projected service lifetimes of 20 to 30 years [1]. It requires no special training to operate, it contains no moving parts, it is extremely reliable and virtually maintenance free, and it can be installed almost anywhere.
Electricity production using renewable energy resources (RES) reduces environmental impacts and produces least amount of secondary wastes. A photovoltaic (PV) system consists of a PV array, battery and elements for power
conditioning. The PV system converts solar energy into dc power. If ac loads are used, the system requires inverter to convert dc into ac. There are two types of PV system; the grid connected and standalone [5]. Grid connected photovoltaic systems feed electricity directly to the electrical network, operating parallel to the conventional energy source. Grid-connected systems generate clean electricity near the point of use, without the transmission and distribution losses or the need for the batteries. A stand-alone system involves no interaction with a utility grid, hence the generated power supplies only the designed load. In case the PV array does not directly supply a load, a storage device is needed [2,5], mostly which is a battery. The battery bank stores energy when the power supplied by the PV modules exceeds load demand and releases it backs when the PV supply is insufficient. This stand-alone PV power generation will be used in the home or building for the electrification purpose [2, 4]. Wide variety of tools exist for the analysis and dimensioning of both Grid connected and stand-alone photovoltaic systems. PVsyst is a dedicated PC software package for PV systems. The software was developed by the University of Geneva. It integrates pre-feasibility, sizing and simulation support for PV systems. After defining the location and loads, the user selects the different components from a product database and the software automatically calculates the size of the system. The solar data at 0.5° latitude and longitude resolution are available in PVsyst Software [4,7]. For this study, the simulations are performed by using PVsyst 6.7.5. The graphs and tables that will depict in the later portion of the paper had been generated while doing the simulation.
1.1 Geographical Location The geographical location of the site is Tarsadia, latitude of 21.07oN, and longitude of 73.13oE. The meteorological data is acquired from Meteor 7.2, a comprehensive climatological database for solar energy applications, with annual solar radiation of 5.5 – 6.6 kWh/m2/day at altitude of 32m above sea level. The tilt angle for PV array is kept as equal to the latitude of the corresponding location to get maximum solar irradiation [3, 6]. So that the optimum tilt angle is kept as 21o
International Research Journal of Engineering and Technology (IRJET) e-ISSN: 2395-0056
Volume: 05 Issue: 12 | Dec 2018 www.irjet.net p-ISSN: 2395-0072
© 2018, IRJET | Impact Factor value: 7.211 | ISO 9001:2008 Certified Journal | Page 543
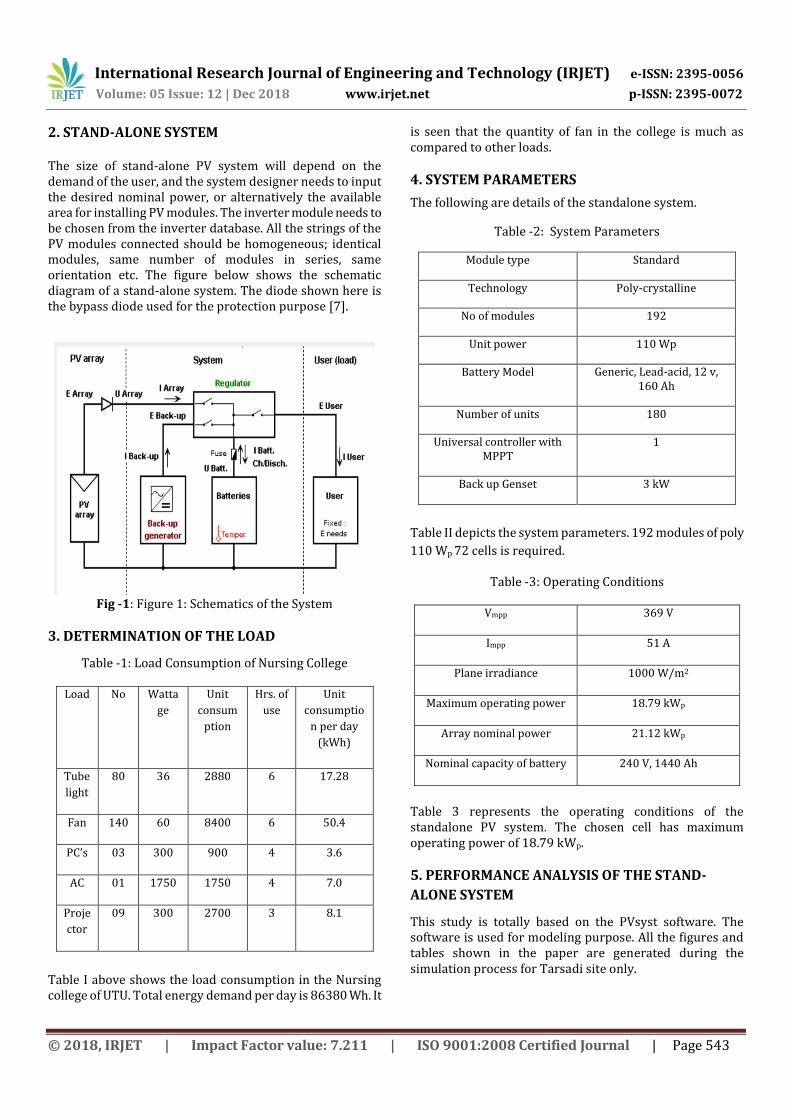
2. STAND-ALONE SYSTEM The size of stand-alone PV system will depend on the demand of the user, and the system designer needs to input the desired nominal power, or alternatively the available area for installing PV modules. The inverter module needs to be chosen from the inverter database. All the strings of the PV modules connected should be homogeneous; identical modules, same number of modules in series, same orientation etc. The figure below shows the schematic diagram of a stand-alone system. The diode shown here is the bypass diode used for the protection purpose [7].
Fig -1: Figure 1: Schematics of the System
3. DETERMINATION OF THE LOAD
Table -1: Load Consumption of Nursing College
Load No Watta
ge
Unit
consum
ption
Hrs. of
use
Unit
consumptio
n per day
(kWh)
Tube
light
80 36 2880 6 17.28
Fan 140 60 8400 6 50.4
PC’s 03 300 900 4 3.6
AC 01 1750 1750 4 7.0
Proje
ctor
09 300 2700 3 8.1
Table I above shows the load consumption in the Nursing college of UTU. Total energy demand per day is 86380 Wh. It
is seen that the quantity of fan in the college is much as compared to other loads.
4. SYSTEM PARAMETERS The following are details of the standalone system.
Table -2: System Parameters
Module type Standard
Technology Poly-crystalline
No of modules 192
Unit power 110 Wp
Battery Model Generic, Lead-acid, 12 v, 160 Ah
Number of units 180
Universal controller with MPPT
1
Back up Genset 3 kW
Table II depicts the system parameters. 192 modules of poly
110 Wp 72 cells is required.
Table -3: Operating Conditions
Vmpp 369 V
Impp 51 A
Plane irradiance 1000 W/m2
Maximum operating power 18.79 kWp
Array nominal power 21.12 kWp
Nominal capacity of battery 240 V, 1440 Ah
Table 3 represents the operating conditions of the standalone PV system. The chosen cell has maximum operating power of 18.79 kWp.
5. PERFORMANCE ANALYSIS OF THE STAND-
ALONE SYSTEM
This study is totally based on the PVsyst software. The software is used for modeling purpose. All the figures and tables shown in the paper are generated during the simulation process for Tarsadi site only.
International Research Journal of Engineering and Technology (IRJET) e-ISSN: 2395-0056
Volume: 05 Issue: 12 | Dec 2018 www.irjet.net p-ISSN: 2395-0072
© 2018, IRJET | Impact Factor value: 7.211 | ISO 9001:2008 Certified Journal | Page 544
Table -4: Meteor and Incident Energy
Table 4 represents the meteorological and incident energy of the PV system. The global horizontal irradiation (GlobHor) is 2004.7 kWh/m2/year. The horizontal diffuse irradiation (DiffHor) is 743.90 kWh/m2. The overall global incident
energy on the collector plane is 2181.4 kWh/m2.
Table -5: Normalized Performance Coefficients
Performance ratio (PR) is the ratio of the final PV system
yield (Yf) and the reference yield (Yr) [4]. Table V shows the
yearly average performance ratio of the site is 0.57.
Table -6: Losses in the System
Table 6 represents the detailed monthly average system losses in kWh. Module quality loss (Mod Qual) is 570.80 kWh/year. Module mismatch loss (Mis Loss) is 412.31 kWh/year. Ohmic wiring loss (Ohm Loss) is 528.08 kWh/ year. Array virtual energy at maximum power point (EArrMPP) is 36542 kWh/Year. Array virtual energy at fixed voltage (EArUfix) is 36543 kWh/year, unused energy is 6824 kWh/year and the effective energy at the output of the array (EArray) is 29718 kWh/year.
Table -7: Balances and Main Result
Table 7 represents the balances and main results of the system. Yearly global horizontal irradiation is 2004.7 kWh/m2. The yearly global incident energy on the collector plane is 2121.2 kWh/m2. Energy available at the output of the PV array is 34451 kWh. The yearly unused energy is 6824 kWh. Yearly energy supplied to the user is 27044 kWh, yearly energy need of the user (load) is 27044 kWh. The
solar fraction of the system (EUsed/ELoad) is 0.971.
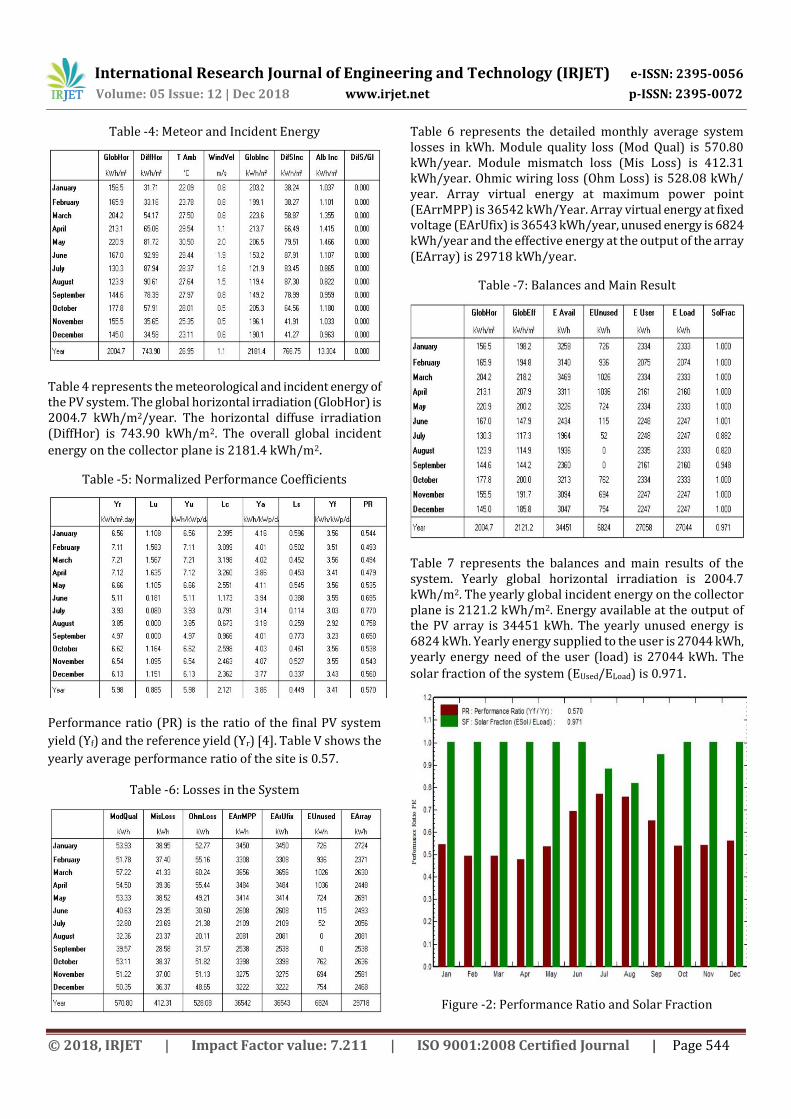
Figure -2: Performance Ratio and Solar Fraction
International Research Journal of Engineering and Technology (IRJET) e-ISSN: 2395-0056
Volume: 05 Issue: 12 | Dec 2018 www.irjet.net p-ISSN: 2395-0072
© 2018, IRJET | Impact Factor value: 7.211 | ISO 9001:2008 Certified Journal | Page 545
The performance ratio, which indicates the ratio between actual yield (output of inverter) and target yield (output of PV array), in the simulation was found to be 56.99%. the solar fraction which is the ratio of energy supplied to energy required is 97%. These index represent the level of utilization of the system.
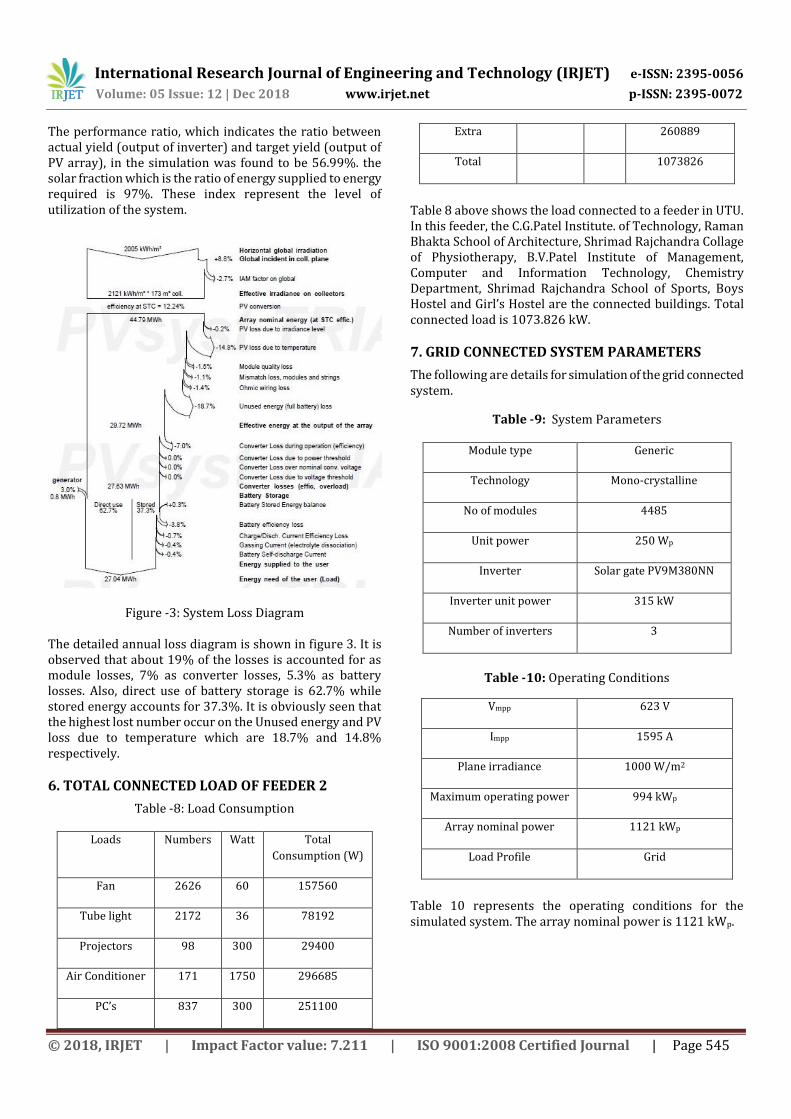
Figure -3: System Loss Diagram
The detailed annual loss diagram is shown in figure 3. It is observed that about 19% of the losses is accounted for as module losses, 7% as converter losses, 5.3% as battery losses. Also, direct use of battery storage is 62.7% while stored energy accounts for 37.3%. It is obviously seen that the highest lost number occur on the Unused energy and PV loss due to temperature which are 18.7% and 14.8% respectively.
6. TOTAL CONNECTED LOAD OF FEEDER 2
Table -8: Load Consumption
Loads Numbers Watt Total
Consumption (W)
Fan 2626 60 157560
Tube light 2172 36 78192
Projectors 98 300 29400
Air Conditioner 171 1750 296685
PC’s 837 300 251100
Extra 260889
Total 1073826
Table 8 above shows the load connected to a feeder in UTU. In this feeder, the C.G.Patel Institute. of Technology, Raman Bhakta School of Architecture, Shrimad Rajchandra Collage of Physiotherapy, B.V.Patel Institute of Management, Computer and Information Technology, Chemistry Department, Shrimad Rajchandra School of Sports, Boys Hostel and Girl’s Hostel are the connected buildings. Total connected load is 1073.826 kW.
7. GRID CONNECTED SYSTEM PARAMETERS
The following are details for simulation of the grid connected system.
Table -9: System Parameters
Module type Generic
Technology Mono-crystalline
No of modules 4485
Unit power 250 Wp
Inverter Solar gate PV9M380NN
Inverter unit power 315 kW
Number of inverters 3
Table -10: Operating Conditions
Vmpp 623 V
Impp 1595 A
Plane irradiance 1000 W/m2
Maximum operating power 994 kWp
Array nominal power 1121 kWp
Load Profile Grid
Table 10 represents the operating conditions for the simulated system. The array nominal power is 1121 kWp.
International Research Journal of Engineering and Technology (IRJET) e-ISSN: 2395-0056
Volume: 05 Issue: 12 | Dec 2018 www.irjet.net p-ISSN: 2395-0072
© 2018, IRJET | Impact Factor value: 7.211 | ISO 9001:2008 Certified Journal | Page 546
8. PERFORMANCE ANALYSIS
Table -11: Normalized Performance Coefficients
Performance ratio (PR) is the ratio of the final PV system yield (Yf) and the reference yield (Yr) [4]. Table XI shows the yearly average performance ratio of the site is 0.785.
Table -12: Losses in the System
Table 12 represents the detailed monthly average system losses in kWh. Module mismatch loss (Mis Loss) is 22344 kWh/year. Ohmic wiring loss (Ohm Loss) is 24820 kWh/ year. Array virtual energy at maximum power point (EArrMPP) is 19841.39 kWh/Year. Total Inverter loss is 63339 kWh/year.
Table -13: Balances and Main Result
Table 13 depicts the balances and main results of grid connected PV system. Yearly global horizontal irradiation is 2004.7 kWh/m2. The yearly global incident energy on the collector plane is 2181.4 kWh/m2. Energy available at the output of the PV array is 1984137 kWh. The energy injected into the grid is 1920800 kWh. The average ambient temperature is 26.95oC. Performance ratio of the system is 78.5%.
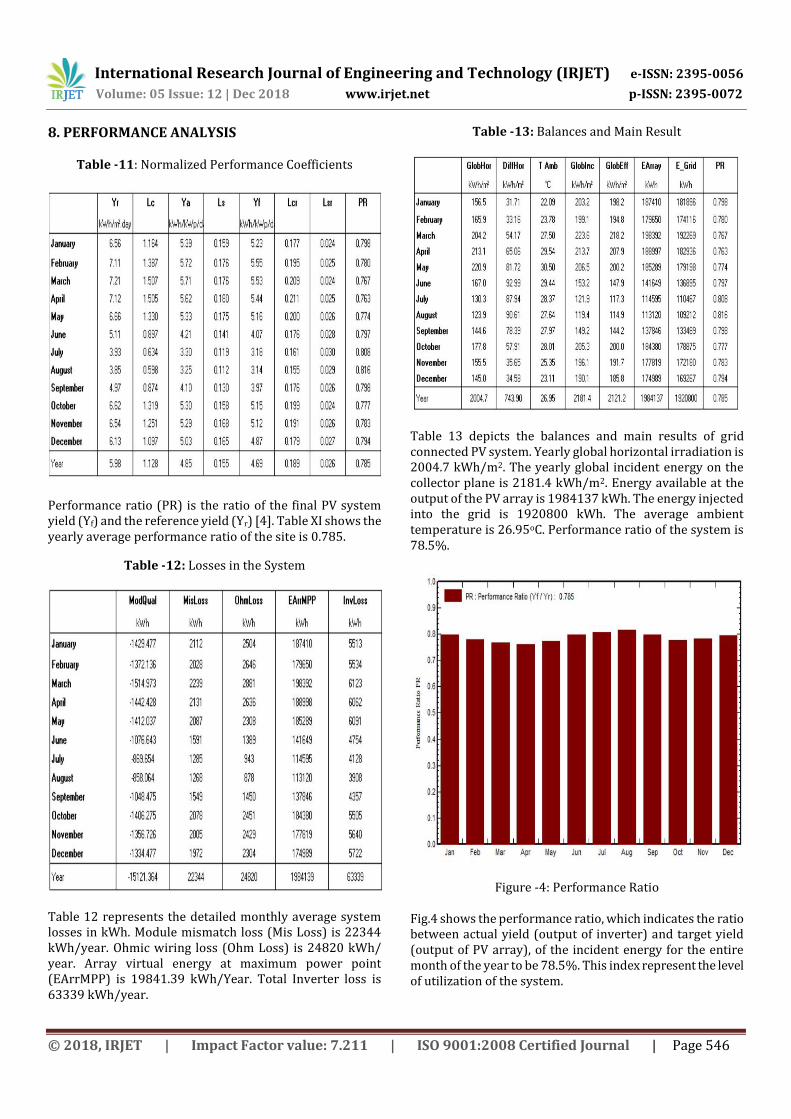
Figure -4: Performance Ratio
Fig.4 shows the performance ratio, which indicates the ratio between actual yield (output of inverter) and target yield (output of PV array), of the incident energy for the entire month of the year to be 78.5%. This index represent the level of utilization of the system.
International Research Journal of Engineering and Technology (IRJET) e-ISSN: 2395-0056
Volume: 05 Issue: 12 | Dec 2018 www.irjet.net p-ISSN: 2395-0072
© 2018, IRJET | Impact Factor value: 7.211 | ISO 9001:2008 Certified Journal | Page 547
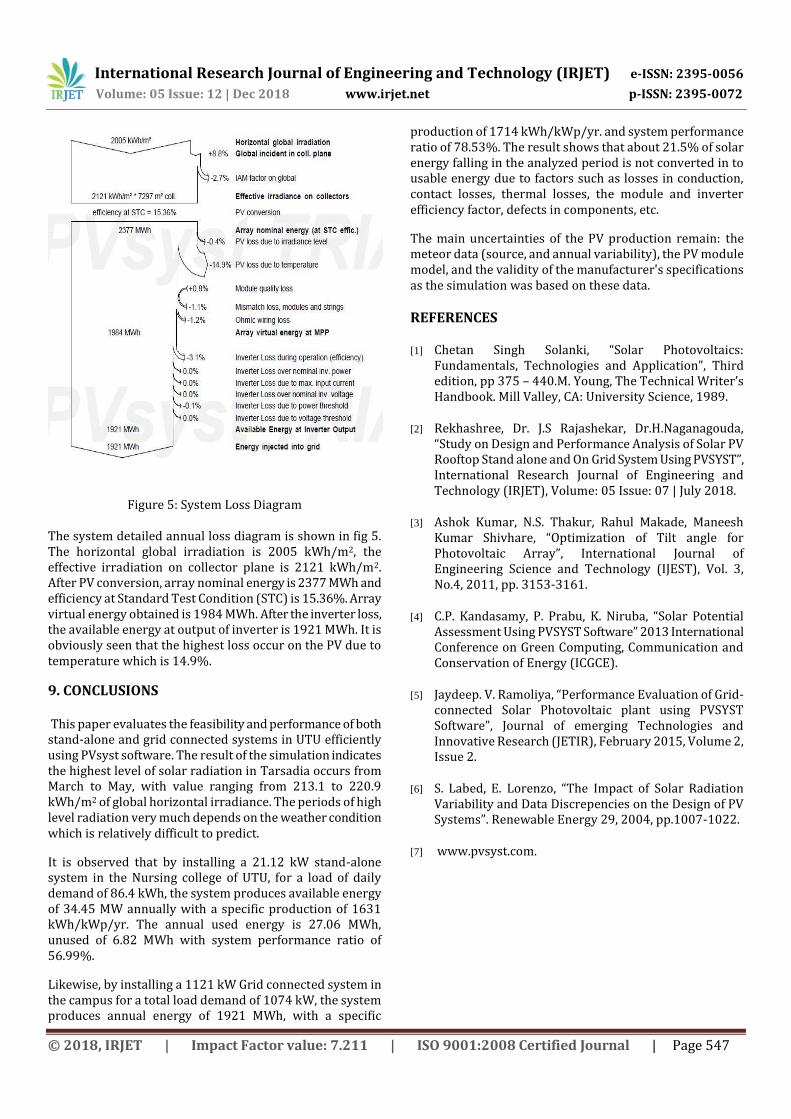
Figure 5: System Loss Diagram
The system detailed annual loss diagram is shown in fig 5. The horizontal global irradiation is 2005 kWh/m2, the effective irradiation on collector plane is 2121 kWh/m2. After PV conversion, array nominal energy is 2377 MWh and efficiency at Standard Test Condition (STC) is 15.36%. Array virtual energy obtained is 1984 MWh. After the inverter loss, the available energy at output of inverter is 1921 MWh. It is obviously seen that the highest loss occur on the PV due to temperature which is 14.9%.
9. CONCLUSIONS This paper evaluates the feasibility and performance of both stand-alone and grid connected systems in UTU efficiently using PVsyst software. The result of the simulation indicates the highest level of solar radiation in Tarsadia occurs from March to May, with value ranging from 213.1 to 220.9 kWh/m2 of global horizontal irradiance. The periods of high level radiation very much depends on the weather condition which is relatively difficult to predict.
It is observed that by installing a 21.12 kW stand-alone system in the Nursing college of UTU, for a load of daily demand of 86.4 kWh, the system produces available energy of 34.45 MW annually with a specific production of 1631 kWh/kWp/yr. The annual used energy is 27.06 MWh, unused of 6.82 MWh with system performance ratio of 56.99%.
Likewise, by installing a 1121 kW Grid connected system in the campus for a total load demand of 1074 kW, the system produces annual energy of 1921 MWh, with a specific
production of 1714 kWh/kWp/yr. and system performance ratio of 78.53%. The result shows that about 21.5% of solar energy falling in the analyzed period is not converted in to usable energy due to factors such as losses in conduction, contact losses, thermal losses, the module and inverter efficiency factor, defects in components, etc.
The main uncertainties of the PV production remain: the meteor data (source, and annual variability), the PV module model, and the validity of the manufacturer's specifications as the simulation was based on these data.
REFERENCES
[1] Chetan Singh Solanki, “Solar Photovoltaics: Fundamentals, Technologies and Application”, Third edition, pp 375 – 440.M. Young, The Technical Writer’s Handbook. Mill Valley, CA: University Science, 1989.
[2] Rekhashree, Dr. J.S Rajashekar, Dr.H.Naganagouda, “Study on Design and Performance Analysis of Solar PV Rooftop Stand alone and On Grid System Using PVSYST”, International Research Journal of Engineering and Technology (IRJET), Volume: 05 Issue: 07 | July 2018.
[3] Ashok Kumar, N.S. Thakur, Rahul Makade, Maneesh Kumar Shivhare, “Optimization of Tilt angle for Photovoltaic Array”, International Journal of Engineering Science and Technology (IJEST), Vol. 3, No.4, 2011, pp. 3153-3161.
[4] C.P. Kandasamy, P. Prabu, K. Niruba, “Solar Potential Assessment Using PVSYST Software” 2013 International Conference on Green Computing, Communication and Conservation of Energy (ICGCE).
[5] Jaydeep. V. Ramoliya, “Performance Evaluation of Grid-connected Solar Photovoltaic plant using PVSYST Software”, Journal of emerging Technologies and Innovative Research (JETIR), February 2015, Volume 2, Issue 2.
[6] S. Labed, E. Lorenzo, “The Impact of Solar Radiation Variability and Data Discrepencies on the Design of PV Systems”. Renewable Energy 29, 2004, pp.1007-1022.
[7] www.pvsyst.com.