Performance Evaluation of Humidity-Controlled Ventilation Strategies in Residential ... B10... ·...
7
© 2007 ASHRAE. ABSTRACT A high-performance, low-energy ventilation system must combine two opposite demands: an adequate airflow rate for satis- factory indoor air quality (IAQ) and a minimal airflow rate to reduce ventilation heat loss. This research highlights IAQ and energy use in residential buildings where humidity controlled ventilation is applied. How does moisture buffering affect performance, and how much energy can be saved by using this control strategy? The savings in heating energy associated with humidity- controlled ventilation and the exposure to pollutants are benchmarked with the multizone airflow network model CONTAM. These simulations are carried out on a detached residential building with extraction ventilation and self-regulating air inlets. This study determines the potential energy savings due to humidity controlled ventilation, while the IAQ is compared to the mandatory standards concerning CO 2 and relative humidity. INTRODUCTION Nowadays the natural habitat of humans is the indoor environment at home, at work, or in the car. The perception of the indoor air quality (IAQ) in these spaces as “fresh and pleas- ant” depends mainly on temperature, humidity ratio, CO 2 , and the level of thousands of other chemicals in the air (Fanger et al. 1998). Unfortunately, most chemicals, although above an odor threshold, are difficult to measure and therefore imprac- ticable as control parameters. The energy savings possible with CO 2 demand-controlled ventilation (DCV) systems have been well established (10%–80%) (Persily et al. 2003; Emmerich and Persily 1997) but, on the other hand, questions have risen concerning IAQ if only CO 2 is taken into account (Afshari and Bergsøe 2003). Unlike CO 2 , the humidity in a building is not solely dependent on the presence of occupants, but also on ventilation with outdoor air, cooking, showering, and washing and drying laundry. Furthermore, high indoor humidity levels often lead to health-related concerns and building damage. Possibly, humidity DCV can overcome some of the flaws of CO 2 -based DCV. Furthermore, economic viability is at stake: carbon diox- ide sensors are a lot more expensive than humidity sensors and tend to have a bigger drift. A cheaper control mechanism may possibly result in a rather moderate energy-saving potential but, on the other hand, it will have a larger consumer market. The performance evaluation of ventilation systems has to consider CO 2 as well as humidity. According to EN 13779, Ventilation for Non-Residential Buildings—Performance Criteria, (EN 2004) the relative humidity has to lie between 30% and 70% (see also Harriman et al. [2001]), and the IAQ concerning CO 2 is commonly expressed by IDA classes (see the “Indoor Air Quality” section of this paper). MODEL To assess the performance of humidity DCV, simulations were carried out with the multizone airflow network model, CONTAM (2004), on a designed detached residential building. The design was based on a statistical analysis of the newly built dwellings in Belgium. Figure 1 shows the floor plans: the surface area is 162 m and the compactness (the internal volume divided by the surface area) is 1.33. The indoor air temperature Performance Evaluation of Humidity-Controlled Ventilation Strategies in Residential Buildings N. Van Den Bossche A. Janssens, PhD N. Heijmans P. Wouters, PhD Member ASHRAE N. Van Den Bossche is a PhD student and A. Janssens is an associate professor in the Department of Architecture and Urban Planning, University of Ghent, Belgium. N. Heijmans is project leader and P. Wouters is director of development and valorisation at Belgian Building Research Institute, Limelette, Belgium.
Transcript of Performance Evaluation of Humidity-Controlled Ventilation Strategies in Residential ... B10... ·...

Performance Evaluation of Humidity-Controlled Ventilation Strategies in Residential Buildings
N. Van Den Bossche A. Janssens, PhD N. Heijmans P. Wouters, PhDMember ASHRAE
ABSTRACT
A high-performance, low-energy ventilation system must combine two opposite demands: an adequate airflow rate for satis-factory indoor air quality (IAQ) and a minimal airflow rate to reduce ventilation heat loss. This research highlights IAQ and energyuse in residential buildings where humidity controlled ventilation is applied. How does moisture buffering affect performance,and how much energy can be saved by using this control strategy? The savings in heating energy associated with humidity-controlled ventilation and the exposure to pollutants are benchmarked with the multizone airflow network model CONTAM. Thesesimulations are carried out on a detached residential building with extraction ventilation and self-regulating air inlets.
This study determines the potential energy savings due to humidity controlled ventilation, while the IAQ is compared to themandatory standards concerning CO2 and relative humidity.
INTRODUCTION
Nowadays the natural habitat of humans is the indoorenvironment at home, at work, or in the car. The perception ofthe indoor air quality (IAQ) in these spaces as “fresh and pleas-ant” depends mainly on temperature, humidity ratio, CO2, andthe level of thousands of other chemicals in the air (Fanger etal. 1998). Unfortunately, most chemicals, although above anodor threshold, are difficult to measure and therefore imprac-ticable as control parameters. The energy savings possiblewith CO2 demand-controlled ventilation (DCV) systems havebeen well established (10%–80%) (Persily et al. 2003;Emmerich and Persily 1997) but, on the other hand, questionshave risen concerning IAQ if only CO2 is taken into account(Afshari and Bergsøe 2003). Unlike CO2, the humidity in abuilding is not solely dependent on the presence of occupants,but also on ventilation with outdoor air, cooking, showering,and washing and drying laundry. Furthermore, high indoorhumidity levels often lead to health-related concerns andbuilding damage. Possibly, humidity DCV can overcomesome of the flaws of CO2-based DCV.
Furthermore, economic viability is at stake: carbon diox-ide sensors are a lot more expensive than humidity sensors andtend to have a bigger drift. A cheaper control mechanism maypossibly result in a rather moderate energy-saving potentialbut, on the other hand, it will have a larger consumer market.The performance evaluation of ventilation systems has toconsider CO2 as well as humidity. According to EN 13779,Ventilation for Non-Residential Buildings—PerformanceCriteria, (EN 2004) the relative humidity has to lie between30% and 70% (see also Harriman et al. [2001]), and the IAQconcerning CO2 is commonly expressed by IDA classes (seethe “Indoor Air Quality” section of this paper).
MODEL
To assess the performance of humidity DCV, simulationswere carried out with the multizone airflow network model,CONTAM (2004), on a designed detached residential building.The design was based on a statistical analysis of the newly builtdwellings in Belgium. Figure 1 shows the floor plans: thesurface area is 162 m and the compactness (the internal volumedivided by the surface area) is 1.33. The indoor air temperature
© 2007 ASHRAE.
N. Van Den Bossche is a PhD student and A. Janssens is an associate professor in the Department of Architecture and Urban Planning,University of Ghent, Belgium. N. Heijmans is project leader and P. Wouters is director of development and valorisation at Belgian BuildingResearch Institute, Limelette, Belgium.

is 18°C throughout the whole year because CONTAM (2004)cannot calculate the indoor air temperature based on theweather file. The temperature also has an important influenceon the extraction rate because the ventilation system uses therelative humidity as a control parameter. The constant indoortemperature may cause some uncertainty in the stack effectand, hence, in the total airflow rate in the building. On the otherhand, pressure differences are primarily dependent on the fanof the ventilation system. Next to that, the influence of the over-all temperature is of very little importance if the objective is tocompare different ventilation systems. Simulations point outthat the effect of local temperature differences (for example, inthe bathroom when it’s used) is more important. Because thebuilding is detached, the terrain roughness (which considersthe influence of the wide surrounding area on the wind speed)is set to 0.20 (country with scattered wind breaks), and the AirInfiltration and Ventilation Center (AIVC) wind pressure coef-ficient (which considers the influence of the narrow surround-ing area on the wind speed) data for low-rise buildingssurrounded by obstructions equivalent to half the height of thebuilding were used.
Airtightness
The airtightness is expressed by the n50 value: the numberof air changes per hour (ach) while there is an indoor-outdoorpressure difference of 50 Pa. In the simulations, we use fourdifferent values: n50 = 0.6 h–1 – 1 h–1 – 3 h–1, and 11.2 h–1. Thepassive house airtightness standard is n50 = 0.6. The Belgianventilation standard NBN D50-001 demands an n50 value ofmaximum 3 h–1 for balanced ventilation and 1 h–1 for balancedventilation with heat recovery. The average airtightness of theexisting Belgian building stock is n50 = 11.2 m/h⋅m. In order toproperly model leakage due to stack effect, the facades aresubdivided into horizontal strips for each room with two cracksper story. The airtightness of the inner walls is simulated by
cracks in the walls and apertures along the doors, while theconcrete floors are presumed to be absolutely airtight.
Self-Regulating Air Inlets
The living room, study, and bedrooms have self-regulatingair inlets above the windows. A pressure difference of 2 Paresults in an airflow rate of 3.6 m/h (for length inlet 1 m), andonly increases a little if the pressure difference is higher. Thefresh air flows through transit openings from the living areas tothe kitchen, toilet, bathroom, and service room. In CONTAM(2004) it is not possible to model the inlet according to measureddata: the bicubic spline forces us to use a simplified model witha constant airflow rate when pressure differences exceed 6.5 Pa(see Figure 2). The influence of this change is not to be neglected:5% of the time the difference in airflow rate lies between 4% and20% (pressure difference > 6.3 Pa); 1% of the time the differencecan rise up to 50% (pressure differences up to 20 Pa). The totalaverage airflow rate through the self-regulating air inlets is about
Figure 1 Floor plans of simulation model.
Figure 2 Self-regulating air inlet.
2 Buildings X
1% higher because of this. On the other hand, the effect will beof little importance when comparing two ventilation systems.
Contaminant Generation
In the simulations, two parents and two children produceH2O and CO2 according to their level of activity (the metab-olism is assigned in relation to the type of room the occupantis in). The level of CO2 in the outdoor environment is fixed, butthe relative humidity varies according to the data from the testreference year in Uccle, Belgium (EC 1985).
Moisture Buffering
In CONTAM (2004), a boundary layer diffusion modelwas used to simulate the effect of moisture buffering. Thewalls and ceiling have gypsum plaster; other materials, such aswood and textile are not present in the standard model, but theinfluence of additional buffering is analyzed further on.
VENTILATION
The house is equipped with an extraction ventilationsystem that extracts 50 m/h in the kitchen, service room, andbathroom, and 25 m/h in the bathroom (nominal flow rateaccording to the Belgian ventilation standard NBN D50-001[BIN 1991]). We distinguish two types of control strategies:System C is not demand controlled and maintains a constantextraction flow rate as described above; System C+ varies theextraction flow rate according to the measured relative humid-ity and presence detection.
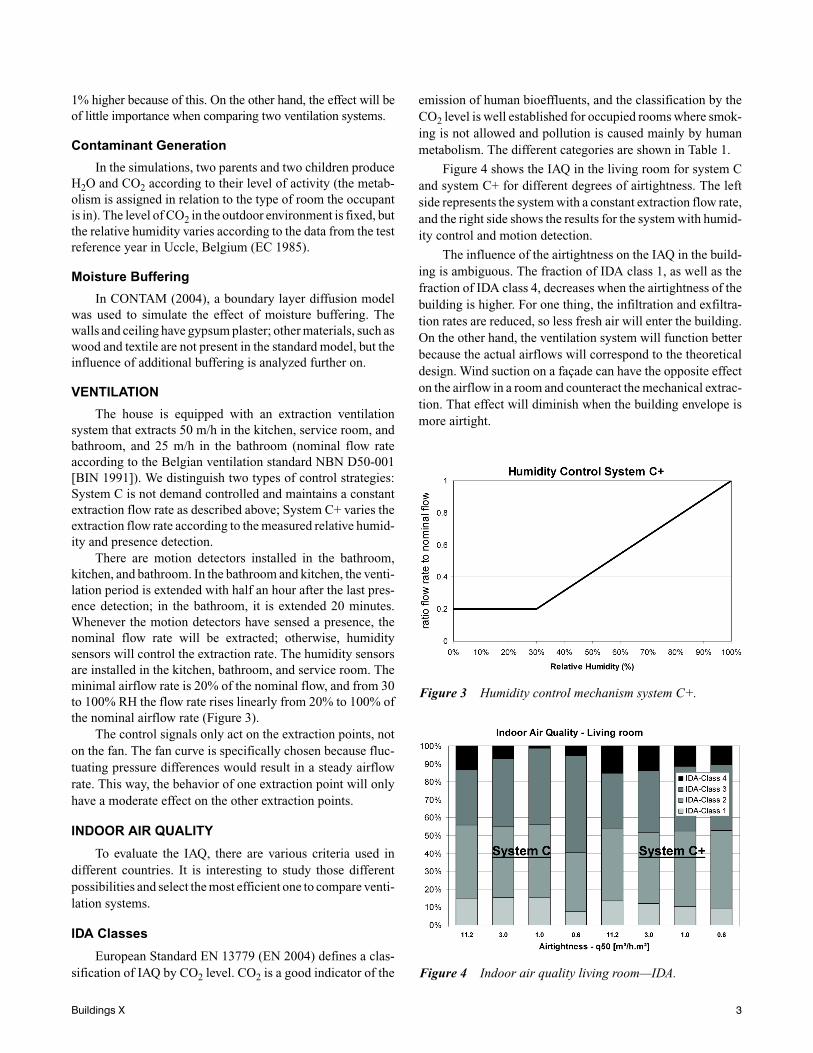
There are motion detectors installed in the bathroom,kitchen, and bathroom. In the bathroom and kitchen, the venti-lation period is extended with half an hour after the last pres-ence detection; in the bathroom, it is extended 20 minutes.Whenever the motion detectors have sensed a presence, thenominal flow rate will be extracted; otherwise, humiditysensors will control the extraction rate. The humidity sensorsare installed in the kitchen, bathroom, and service room. Theminimal airflow rate is 20% of the nominal flow, and from 30to 100% RH the flow rate rises linearly from 20% to 100% ofthe nominal airflow rate (Figure 3).
The control signals only act on the extraction points, noton the fan. The fan curve is specifically chosen because fluc-tuating pressure differences would result in a steady airflowrate. This way, the behavior of one extraction point will onlyhave a moderate effect on the other extraction points.
INDOOR AIR QUALITY
To evaluate the IAQ, there are various criteria used indifferent countries. It is interesting to study those differentpossibilities and select the most efficient one to compare venti-lation systems.
IDA Classes
European Standard EN 13779 (EN 2004) defines a clas-sification of IAQ by CO2 level. CO2 is a good indicator of the
emission of human bioeffluents, and the classification by theCO2 level is well established for occupied rooms where smok-ing is not allowed and pollution is caused mainly by humanmetabolism. The different categories are shown in Table 1.
Figure 4 shows the IAQ in the living room for system Cand system C+ for different degrees of airtightness. The leftside represents the system with a constant extraction flow rate,and the right side shows the results for the system with humid-ity control and motion detection.
The influence of the airtightness on the IAQ in the build-ing is ambiguous. The fraction of IDA class 1, as well as thefraction of IDA class 4, decreases when the airtightness of thebuilding is higher. For one thing, the infiltration and exfiltra-tion rates are reduced, so less fresh air will enter the building.On the other hand, the ventilation system will function betterbecause the actual airflows will correspond to the theoreticaldesign. Wind suction on a façade can have the opposite effecton the airflow in a room and counteract the mechanical extrac-tion. That effect will diminish when the building envelope ismore airtight.
Figure 3 Humidity control mechanism system C+.
Figure 4 Indoor air quality living room—IDA.
Buildings X 3

Based on Figure 4, one could conclude that the IAQ mightbe similar for the two systems, but the mere subdivision in IDAclasses can be misleading. In fact, two systems with identicalpercentages of IDA classes can differ remarkably in IAQ.
French Standard
According to the French standard, Modalités d’instruc-tion des Avis Techniques sur les systèmes de ventilationasservis (Instructions for Technical Regulations on SubjectedVentilation Systems), one only has to look at the CO2 levelsabove 2000 ppm to evaluate the IAQ. For every hour the CO2level exceeds 2000 ppm, that concentration is cast throughoutan entire year. The standard states that the total amount needsto be less than 500,000 ppmh. Although this method takes thedose-effect-relation into account, it is not clear whether thereare very high concentrations over a small period of time, orrather moderate concentrations during the whole year. Thephysical meaning of this criterion may be less explicit, but onthe other hand, it is very practical to compare different venti-lation systems to each other.
Belgian Standard
The Belgian ventilation standard NBN D50-001 (BIN1991) is very prescriptive—there are a lot of regulations for theventilation system but no criteria for IAQ at all. It is moredesirable to define clear performance criteria for indoor airinstead of defining the ventilation systems by prescription.
Contrary to a prescriptive regulation, a performance-orientedregulation will also stimulate the development of innovativesystems.
Dutch Standard
NEN 5128 (NEN 2004), the Dutch standard for energyuse in buildings, defines a low ventilation index (LVI), whichgives expression to both the extent and the duration of theventilation deficiency (dose-effect-relation). The LVI can bederived from the histogram of the standardized effective venti-lation (Qen). The Qen is defined as the proportion of theconcentration limit (for instance, 800 ppm above outdoorconcentration) to the actual concentration.
The LVI is the total percentage of the time that the indoorconcentration exceeds the concentration limit (the area belowthe curves in Figure 5 for Qen < 1).
This one curve gives the opportunity to limit the maxi-mum indoor concentration, limit the LVI, and allow an objec-tive analysis of two systems, without any arbitraryconstraints. In this case, the IAQ of the two systems is clearlynot equivalent. Currently we use monte-carlo analyses todevelop correct values and concentration limits to benchmarknew ventilation systems.
Humidity
The indoor air humidity level depends on a number ofdifferent factors, including the level of humidity in the outdoorair that is brought indoors by ventilation, human respiration,and activities such as showering, cooking, and washing and
Table 1. Indoor Air Quality Categories According to EN 13779
CategoryCO2 Level above Level of Outdoor Air, ppm
Typical Range Default Value
IDA 1 400 350
IDA 2 400–600 500
IDA 3 600–1000 800
IDA 4 >1000 1200
Figure 5 Low ventilation index.
Qen
CLimit
Ct
---------------=
Figure 6 Relative humidity in Bedroom 1 (leaky building).
Figure 7 Relative humidity in Bedroom 1 (airtight building).
4 Buildings X

drying laundry. For a good IAQ, the RH should fall in the rangeof 30%–70%.
As can be seen in Figures 6 and 7, the difference betweensystems C and C+ concerning relative humidity is clearlymore distinct for airtight buildings. However, the effect is lessexplicit for the living room and the kitchen. System C resultsin an IAQ that, for 86% to 88% of the time (in the living room,bathroom, and bedroom), gives a daily average relative humid-ity in the range of 30% to 70%. System C+ will perform worsefor the bathroom and the bedroom, particularly if the buildingis airtight.
Energy Use
The ventilation heat losses of system C and system C+show a similar correlation with the airtightness of the building(Figure 8). System C+ allows to increase the energy savings upto 27% for very airtight buildings and 14% for buildings withan average airtightness. However, the absolute energy-savingpotential of 1100 to 1200 kWh is independent of the airtight-ness: the curves in Figure 7 are only translated vertically.Although the ventilation system is primarily controlled by therelative humidity, the effect of airtightness is marginal.
One should bear in mind that these two models havedifferent performances concerning IAQ. Furthermore, simu-lations point out that while the IAQ is maintained at the samelevel, more energy can be saved if the peak extraction rate ishigher than the nominal airflow rate.
MOISTURE BUFFERING
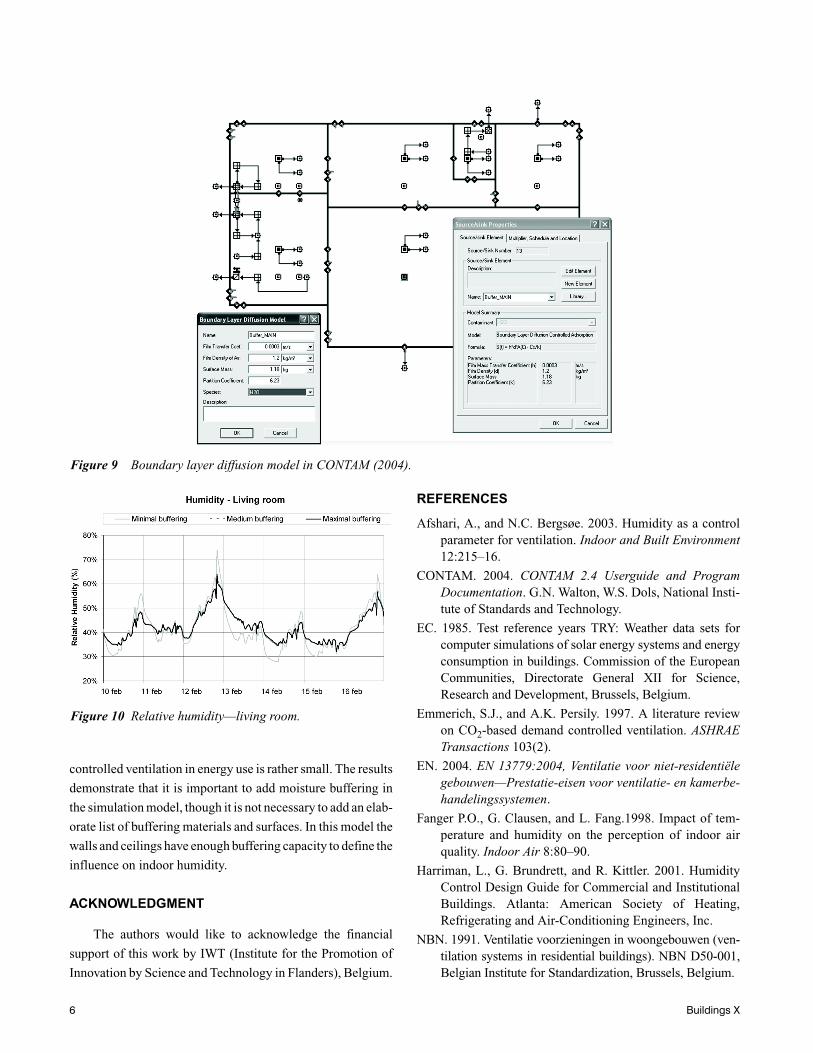
In CONTAM, a boundary layer diffusion sink/sourcemodel (Figure 9) is used to model moisture buffering in differ-ent materials. This model has been compared to other buffer-ing models (TRNSYS, Annex 41 simulations). The source/sink model in CONTAM corresponds well to the other models,but it apparently buffers a little bit more than the other models.
In the basic model, only the gypsum plaster of walls andceilings was entered in the boundary layer diffusion model. Toevaluate the significance of moisture buffering for humiditycontrolled ventilation, two other simulation models weredeveloped. In addition, the comparison of these three degreesof buffering will tell us more about how thoroughly the buff-ering capacity has to be modeled.
The first model (minimal buffering) has no bufferingcapacity at all. The second model (medium buffering) takesthe gypsum plaster of walls and ceilings into account, and thethird model (maximal buffering) has the biggest bufferingcapacity because next to the gypsum plaster, textile andwooden surfaces were also added to the model.
The difference between the minimal and medium buffer-ing is clearly visible: the gypsum plaster dampens out peaks inrelative humidity for both high and low values (Figure 10).The effect of additional buffering (textile and wood) is prac-tically none, even in the bathroom. In terms of energy use forsystem C+, the influence is rather small because the averagehumidity is about the same for the different models, and thehumidity controlled airflow rate is linear to the RH. The simu-lations point out that system C+ will have an energy demandthat is 0.75% higher if moisture buffering is modeled. Theinfluence of the airtightness on the effect of buffering is verysmall: in terms of energy consumption for system C+, it makesno difference.
CONCLUSIONS
The analysis of simulations of IAQ should be made withgreat care. A simplified evaluation method can lead to a misin-terpretation of the results.
There is a big difference in IAQ between the two systemsif one looks at the relative humidity. These differences areperhaps more pronounced than those in CO2 levels. However,more research has to be carried out on this matter.
System C+ increases the energy savings up to 27% forvery airtight buildings and 14% for buildings with an aver-age airtightness. Analysis of the simulations show that therelative humidity is barely different for different degrees ofairtightness; furthermore, the average relative humidityindoors differs just about 6%–7% from the average relativehumidity of the outside air (when that air is heated up toroom temperature).
There is a clear influence of moisture buffering in themodel on the relative humidity, but the effect on humidity-
Table 2. Percentage of Time Indoor Air Falls in RH Range
Airtightness n50-value 11.2 3 1 0.6
LivingC 0.88 0.88 0.87 0.87
C+ 0.87 0.87 0.88 0.88
BathroomC 0.88 0.88 0.87 0.90
C+ 0.84 0.75 0.68 0.67
BedroomC 0.86 0.87 0.88 0.89
C+ 0.87 0.77 0.71 0.67
Figure 8 Energy loss—airtightness.
Buildings X 5
controlled ventilation in energy use is rather small. The results
demonstrate that it is important to add moisture buffering in
the simulation model, though it is not necessary to add an elab-
orate list of buffering materials and surfaces. In this model the
walls and ceilings have enough buffering capacity to define the
influence on indoor humidity.
ACKNOWLEDGMENT
The authors would like to acknowledge the financial
support of this work by IWT (Institute for the Promotion of
Innovation by Science and Technology in Flanders), Belgium.
REFERENCES
Afshari, A., and N.C. Bergsøe. 2003. Humidity as a controlparameter for ventilation. Indoor and Built Environment12:215–16.
CONTAM. 2004. CONTAM 2.4 Userguide and ProgramDocumentation. G.N. Walton, W.S. Dols, National Insti-tute of Standards and Technology.
EC. 1985. Test reference years TRY: Weather data sets forcomputer simulations of solar energy systems and energyconsumption in buildings. Commission of the EuropeanCommunities, Directorate General XII for Science,Research and Development, Brussels, Belgium.
Emmerich, S.J., and A.K. Persily. 1997. A literature reviewon CO2-based demand controlled ventilation. ASHRAETransactions 103(2).
EN. 2004. EN 13779:2004, Ventilatie voor niet-residentiëlegebouwen—Prestatie-eisen voor ventilatie- en kamerbe-handelingssystemen.
Fanger P.O., G. Clausen, and L. Fang.1998. Impact of tem-perature and humidity on the perception of indoor airquality. Indoor Air 8:80–90.
Harriman, L., G. Brundrett, and R. Kittler. 2001. HumidityControl Design Guide for Commercial and InstitutionalBuildings. Atlanta: American Society of Heating,Refrigerating and Air-Conditioning Engineers, Inc.
NBN. 1991. Ventilatie voorzieningen in woongebouwen (ven-tilation systems in residential buildings). NBN D50-001,Belgian Institute for Standardization, Brussels, Belgium.
Figure 9 Boundary layer diffusion model in CONTAM (2004).
Figure 10 Relative humidity—living room.
6 Buildings X

NEN. 2004. Energieprestatie van woonfuncties en woonge-bouwen—bepalingsmethode (energy performance ofdwellings and residential buildings—determinationmethod). NEN 5128, Netherlands Standardization Insti-tute, Delft, Netherlands.
Persily A., A. Musser, S. Emmerich, and M. Taylor. 2003.Simulations of indoor air quality and ventilation impactsof demand controlled ventilation in commercial andinstitutional buildings. NISTIR 7042, National Instituteof Standards and Technology, Gaithersburg, MD.
BIBILIOGRAPHY
ASHRAE. 2001. 2001 ASHRAE Handbook—FundamentalsAtlanta: American Society of Heating, Refrigeratingand Air-Conditioning Engineers, Inc.
Axley, J.W. 1991. Absorption modeling for building contam-inant dispersal analysis. Indoor Air 1:147–71.
Breesch, H. 2006. Natural night ventilation in office build-ings—Performance evaluation based on simulation,uncertainty and sensitivity analysis, PhD thesis.
CEN. 2003. Standard prCEN/TR 14788, Ventilation forBuildings—Design and Dimensioning of ResidentialVentilation Systems. Brussels, Belgium: European Com-mittee for Standardization.
IEA. 1995. Demand controlled ventilation systems. Sum-mary of International Energy Agency, Annex 18.
Emmerich, S., A. Persily, and S. Nabinger. 2002. Modelingmoisture in residential buildings with a multizone IAQprogram. Proceedings of the Indoor Air 2002, 9th Inter-national. Conference on Indoor Air Quality and Cli-mate, Monterey, California, June 30–July 5.
EN. 2005. prEN 15251, Criteria for the Indoor EnvironmentIncluding Thermal, Indoor Air Quality, Light and Noise.
Hens, H. 2006. Impact of water vapor buffering on theindoor partial water vapor pressure and relative humid-ity: A simple evaluation test. International Energy
Agency-EXCO. Energy Conservation in Building andCommunity Systems, Annex 41, Moist-Eng.
Brandemuehl, M.J. 2000. Humidity control options. Interimreport for ASHRAE RP-1121. Atlanta: American Soci-ety of Heating, Refrigerating and Air-ConditioningEngineers, Inc.
IEA. 1996. A guide to energy efficient ventilation. Annex V,Air Infiltration and Ventilation Centre, InternationalEnergy Agency, Paris.
Leephakpreeda, T., R. Thitipatanapong, T. Grittiyachot, andV. Yungchareon. 2001. Occupancy-based control ofindoor air ventilation: A theoretical and experimentalstudy. ScienceAsia 27(2001):279–84.
Maeyens J., and A. Janssens. 2004. Air exchange rates,energy losses and indoor air quality due to the applica-tion of the Belgian ventilation standard. Proceedings ofthe 2nd International Conference on Building Physics,2003, Leuven, Belgium.
Orme, M., M. Liddament, and A. Wilson.1994. An analysisand data summary of the AIVC’s numerical database.IEA, AIVC, Oscar Faber Partnership, UK.
Persily, A.K. 1997. Evaluating building IAQ and ventilationwith indoor carbon dioxide. ASHRAE Transactions103(2).
BBRI. 1994. Technische Voorlichting 192—Ventilatie vanwoningen. Deel 1 Algemene Principes, Wetenschap-pelijk en Technisch Centrum voor het Bouwbedrijf, Bel-gian Building Research Institute, Brussels, Belgium.
BBRI. 1997. Technische Voorlichting 203—Ventilatie vanwoningen. Deel 2 Uitvoering en prestaties van venti-latiesystemen, Wetenschappelijk en Technisch Centrumvoor het Bouwbedrijf, Belgian Building Research Insti-tute, Brussels, Belgium.
Walton, G.N., and W.S. Dols. CONTAM user manual. http://www.bfrl.nist.gov/.
Buildings X 7