
Performance Based Design and Evaluation of Concrete Dams
30
Performance‐Based Design and Evaluation of Concrete Dams Yusof Ghanaat Quest Structures, Inc. Orinda, California, USA
Transcript of Performance Based Design and Evaluation of Concrete Dams

Performance‐Based Design and Evaluation of Concrete Dams
Yusof GhanaatQuest Structures, Inc.Orinda, California, USA
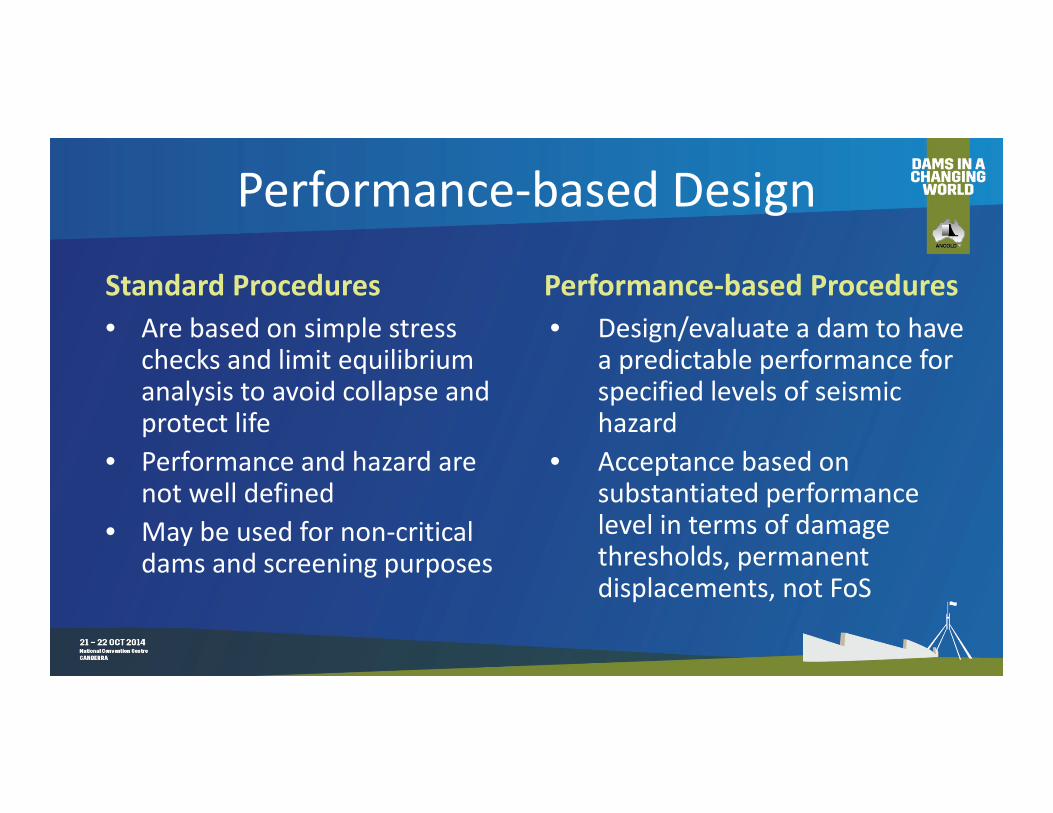
Performance‐based Design
Standard Procedures• Are based on simple stress
checks and limit equilibrium analysis to avoid collapse and protect life
• Performance and hazard are not well defined
• May be used for non‐critical dams and screening purposes
Performance‐based Procedures• Design/evaluate a dam to have
a predictable performance for specified levels of seismic hazard
• Acceptance based on substantiated performance level in terms of damage thresholds, permanent displacements, not FoS

Presentation Outline
• Design/Evaluation Criteria– Ground motions– Performance levels– Performance goals– Design requirements– Analysis and evaluation procedures
• Performance evaluation of a gravity dam – Damage thresholds with linear/nonlinear analysis
• Performance evaluation of an arch dam– Damage thresholds with linear/nonlinear analysis
• Summary

Design/Evaluation Earthquakes• OBE – Operating Basis Earthquake
– 50% probability of exceedance in service life of structure– Serviceability performance
• MDE – Maximum Design Earthquake– 1/3,000 to 1/10,000 AEP recommended by USSD– For dams it is taken equal to MCE – Damage control performance
• MCE – Maximum Credible Earthquake– Largest EQ on a specific fault or seismic source zone– Background seismicity, “random EQ”, or “floating EQ”– Collapse prevention

Design/Evaluation Earthquakes84th % Cascadia Interface has a 3000‐yr RP50th % Cascadia Interface has a 900‐yr RP

Design/Evaluation Earthquakes
• Local fault 84th % ground motion exceeds 10,000‐year UHS
• 84th % Cascadia has a RP ≈ 3,200 years

Design/Evaluation Earthquakes84th% New Madrid ground motion at the site has a RP of just less than 2,475 years

Design/Evaluation EarthquakesMedian “Random EQ” MCE in EUS exceeds 10,000‐year UHS

Performance Levels
• Serviceability Performance– Operable immediately after
OBE level earthquakes• Damage Control Performance
– Damaged but not lose load resistance capability
• Collapse Prevention Performance– Damage and movements
could be severe but not lead to collapse
Damage Control Performance(Non-linear Strain Hardening Range)
Collapse Prevention(Non-Linear Strain Softening Range)
Displacement
Serviceability Performance(Linear Elastic Range)
Load

Performance Requirements
Displacement
Serviceability Performance(Linear Elastic Range)
Load
Ground Motion
Elastic Deformation

Performance Requirements
Damage Control Performance(Non-linear Strain Hardening Range)
Displacement
Serviceability Performance(Linear Elastic Range)
Load
Ground Motion
High Tension Regions
Tensile Overstressing & Cracking
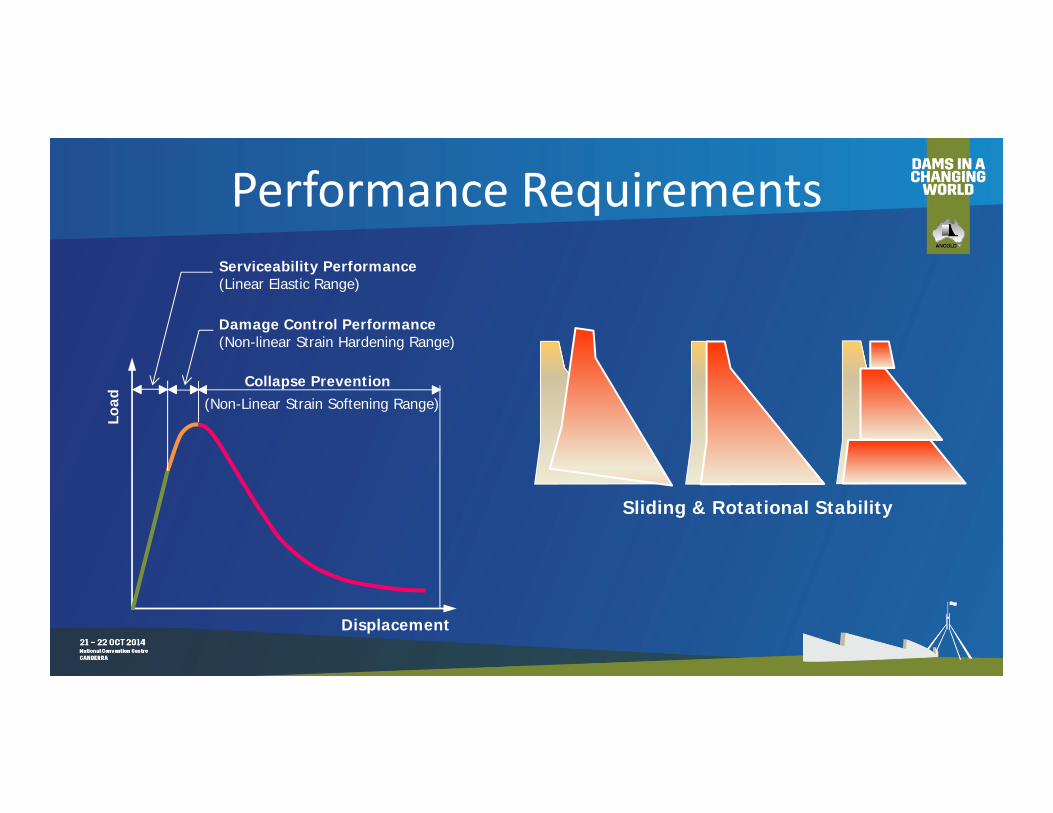
Performance Requirements
Damage Control Performance(Non-linear Strain Hardening Range)
Collapse Prevention(Non-Linear Strain Softening Range)
Displacement
Serviceability Performance(Linear Elastic Range)
Load
Sliding & Rotational Stability

Performance Goals• Both strength and
serviceability should be considered– Strength requirement ensures
that failure in shear, flexure, tension, or compression will not occur
– Serviceability requirement is to ensure the project will function without interruption, with little or no damage.
• Limited ductile behavior– Characterized by an elastic
range and limited inelastic range followed by a complete or significant loss of strength
– Dams exhibit limited‐ductile behavior in flexure and brittle behavior in shear
– But some residual capacity may still exist due to dead load effects that contribute to shear‐friction resistance and to overturning resistance
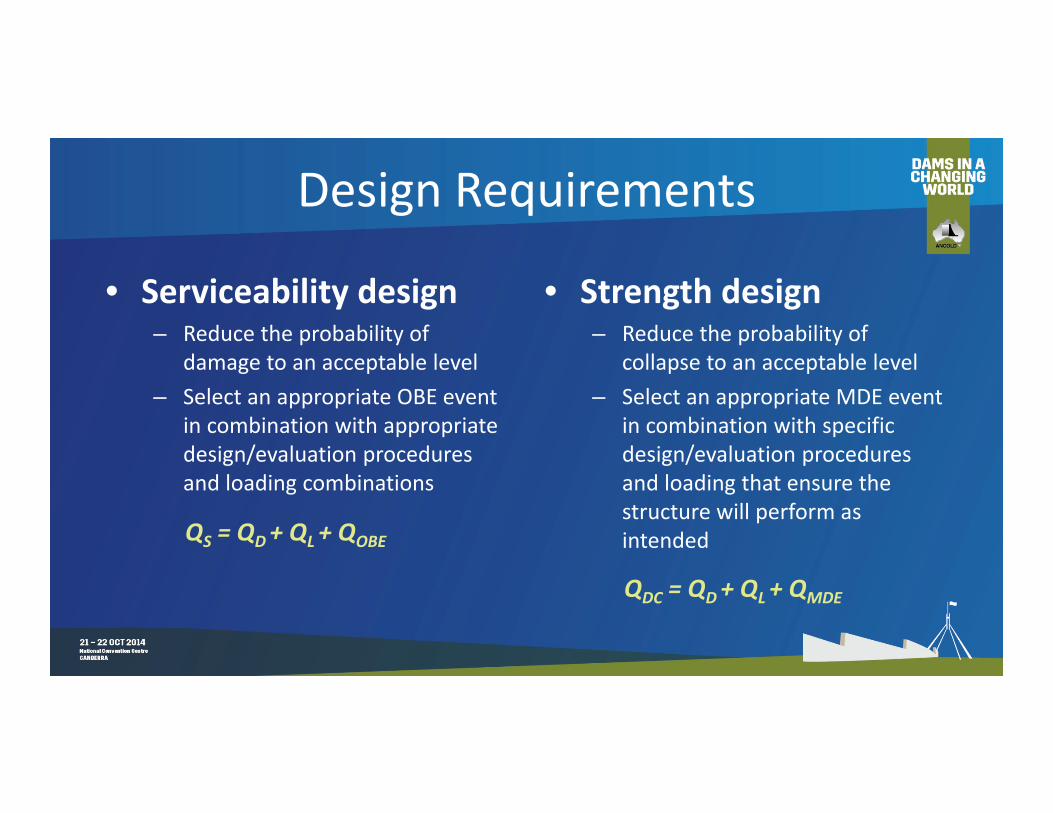
Design Requirements
• Serviceability design– Reduce the probability of
damage to an acceptable level– Select an appropriate OBE event
in combination with appropriate design/evaluation procedures and loading combinations
• Strength design– Reduce the probability of
collapse to an acceptable level– Select an appropriate MDE event
in combination with specific design/evaluation procedures and loading that ensure the structure will perform as intended QS = QD + QL + QOBE
QDC = QD + QL + QMDE

Tiered Analysis and Evaluation
• Estimate peak responses• Evaluate using DCR’s
Response Spectrum Analysis
• Identify potential failure modes• Evaluate using damage control Thresholds
Linear Time‐History Analysis
• Model/analyze major nonlinear mechanisms• Estimate permanent offsets/compressive stresses• Perform post‐earthquake stability
Nonlinear Time‐History Analysis

Allowable DCR Values for RS
ActionIn terms of Stresses
Performance ObjectivesServiceability
(OBE)Damage Control
(MDE)Tension due to flexure 1.0 1.5Diagonal tension due to shear 0.8 0.9Shear due to sliding 0.8 1.0
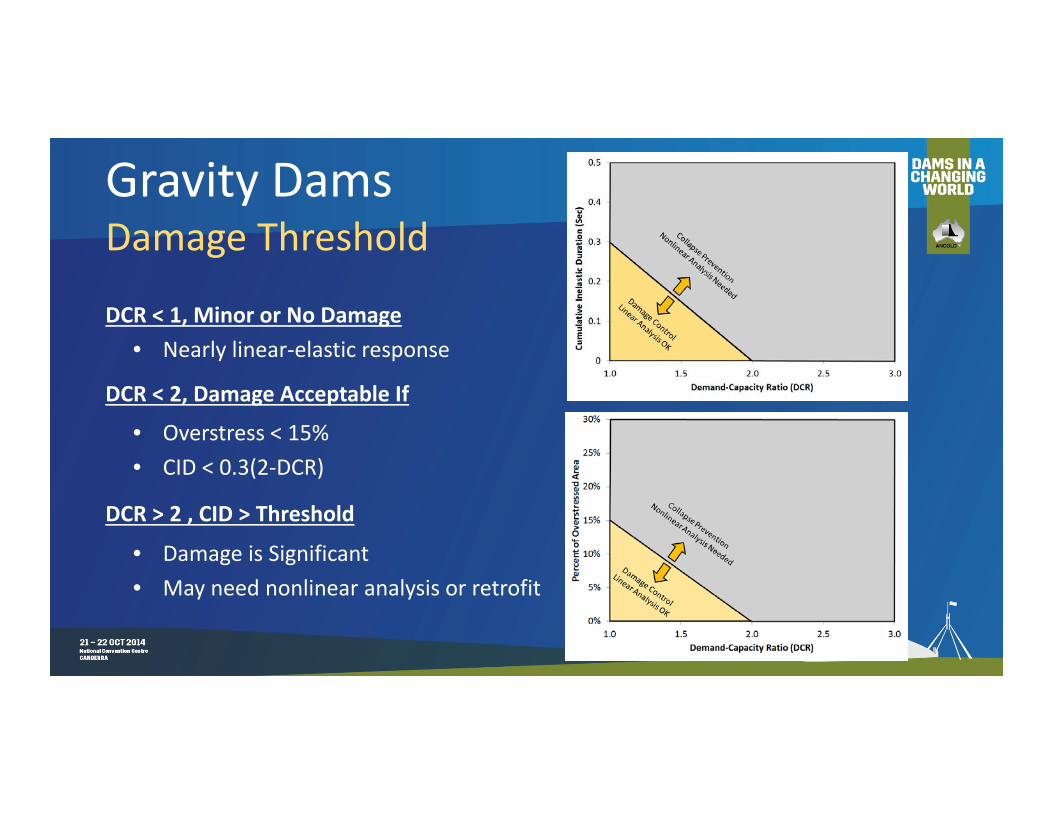
Gravity DamsDamage Threshold
DCR < 1, Minor or No Damage• Nearly linear‐elastic response
DCR < 2, Damage Acceptable If
• Overstress < 15% • CID < 0.3(2‐DCR)
DCR > 2 , CID > Threshold
• Damage is Significant• May need nonlinear analysis or retrofit

Example Gravity DamHeight = 74 mCrest Thickness = 9.75 mBase Thickness = 53.83 m

Earthquake Ground MotionsResponse Spectra and Acceleration TH’s

Linear Time‐History StressesMax. = 855 psi (5.9 MPa)
Max. = 1,800 psi (12.4 MPa)

Comparison with Thresholds

Nonlinear Analysis Stress Contours
200 psi = 1.4MPa
Gap‐friction Elements

Nonlinear Response Histories
0.0
0.1
0.2
0.3
0.4
0.5
0.6
0.7
0.8
0 5 10 15 20Time (sec)
Displ
acem
ent (
in)
20 mm
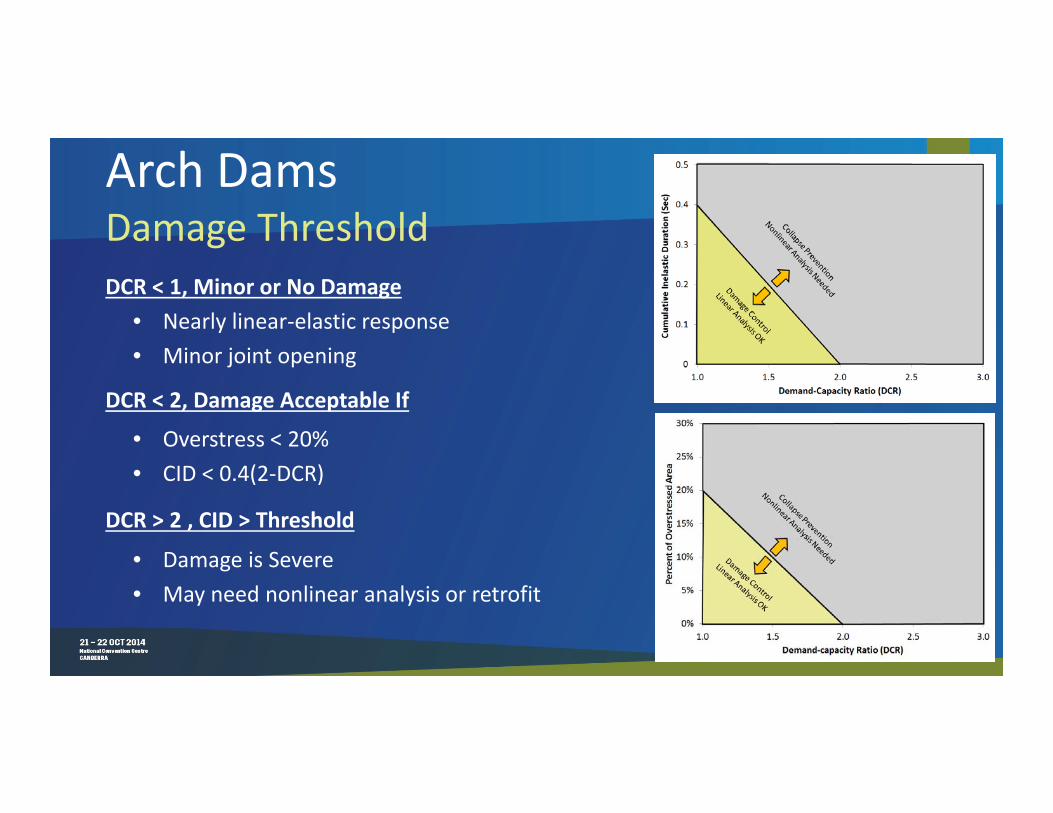
Arch DamsDamage ThresholdDCR < 1, Minor or No Damage
• Nearly linear‐elastic response• Minor joint opening
DCR < 2, Damage Acceptable If
• Overstress < 20% • CID < 0.4(2‐DCR)
DCR > 2 , CID > Threshold
• Damage is Severe• May need nonlinear analysis or retrofit

Arch DamsNonlinear Time History EvaluationOverstressing
• Contraction joint opening• Increased cantilever stresses • Unstable cantilever blocks
Sliding Stability• Along dam‐foundation interface• Foundation/abutment rock wedges
Acceptance Criteria• Compressive stresses• Amount of joint opening• Non‐recoverable block movements

Example Arch dam
Height = 468 ft (142.6 m)Crest Length = 724 ft (220.7 m)Crest Thickness = 12 ft (3.7 m)Base Thickness = 52 ft (15.8 m)

Arch Dam Linear ResponseExceeds Damage Threshold

Arch Dam Nonlinear ResponseContraction and lift joints repeatedly open and close

Summary• A performance‐based approach
was introduced for seismic design and evaluation of concrete dams
• How to design/evaluate dams to have a predictable performance for specified levels of seismic hazard was outlined
• Three seismic performance levels: serviceability, damage control, and collapse prevention were defined
• Analysis and evaluation procedures for each performance level with corresponding acceptance criteria were discussed with examples
• These guidelines and provisions were developed for the USACE and are being used by Federal, States, and dam engineering community in the United States and abroad

Linear Time HistoryDamage Control Threshold