Performance Assessment Task Snail Pace Grade 6 … … · · 2012-07-19Performance Assessment...
18
© 2012 Noyce Foundation Performance Assessment Task Snail Pace Grade 6 The task challenges a student to demonstrate understanding of concepts involved in rates. A student must make sense of proportional relationships of speed in minutes and inches. A student must understand unit rates and be able to solve for a unit rate in order to make comparisons. A student must determine which common unit to use to make a comparison‐ distance or time. Common Core State Standards Math ‐ Content Standards Ratios and Proportional Relationships Understand ratio concepts and use ratio reasoning to solve problems. 6.RP.3 Use ratio and rate reasoning to solve real‐world and mathematical problems, e.g., by reasoning about tables of equivalent ratios, tape diagrams, double number line diagrams, or equations. a. Make tables of equivalent ratios relating quantities with whole‐ number measurements, find missing values in the tables, and plot the pairs of values on the coordinate plane. Use tables to compare ratios. d. Use ratio reasoning to convert measurement units; manipulate and transform units appropriately when multiplying or dividing quantities. Common Core State Standards Math – Standards of Mathematical Practice MP.1 Make sense of problems and persevere in solving them. Mathematically proficient students start by explaining to themselves the meaning of a problem and looking for entry points to its solution. They analyze givens, constraints, relationships, and goals. They make conjectures about the form and meaning of the solution and plan a solution pathway rather than simply jumping into a solution attempt. They consider analogous problems, and try special cases and simpler forms of the original problem in order to gain insight into its solution. They monitor and evaluate their progress and change course if necessary. Older students might, depending on the context of the problem, transform algebraic expressions or change the viewing window on their graphing calculator to get the information they need. Mathematically proficient students can explain correspondences between equations, verbal descriptions, tables, and graphs or draw diagrams of important features and relationships, graph data, and search for regularity or trends. Younger students might rely on using concrete objects or pictures to help conceptualize and solve a problem. Mathematically proficient students check their answers to problems using a different method, and they continually ask themselves, “Does this make sense?” They can understand the approaches of others to solving complex problems and identify correspondences between different approaches. MP.4 Model with mathematics. Mathematically proficient students can apply the mathematics they know to solve problems arising in everyday life, society, and the workplace. In early grades, this might be as simple as writing an addition equation to describe a situation. In middle grades, a student might apply proportional reasoning to plan a school event or analyze a problem in the community. By high school, a student might use geometry to solve a design problem or use a function to describe how one quantity of interest depends on another. Mathematically proficient students who can apply what they know are comfortable making assumptions and approximations to simplify a complicated situation, realizing that these may need revision later. They are able to identify important quantities in a practical situation and map their relationships using such tools as diagrams, two‐way tables, graphs, flowcharts and formulas. They can analyze those relationships mathematically to draw conclusions. They routinely interpret their mathematical results in the context of the situation and reflect on whether the results make sense, possibly improving the model if it has not served its purpose. Assessment Results This task was developed by the Mathematics Assessment Resource Service and administered as part of a national, normed math assessment. For comparison purposes, teachers may be interested in the
Transcript of Performance Assessment Task Snail Pace Grade 6 … … · · 2012-07-19Performance Assessment...

© 2012 Noyce Foundation
Performance Assessment Task Snail Pace Grade 6
The task challenges a student to demonstrate understanding of concepts involved in rates. A student must make sense of proportional relationships of speed in minutes and inches. A student must understand unit rates and be able to solve for a unit rate in order to make comparisons. A student must determine which common unit to use to make a comparison‐ distance or time.
Common Core State Standards Math ‐ Content Standards Ratios and Proportional Relationships Understand ratio concepts and use ratio reasoning to solve problems. 6.RP.3 Use ratio and rate reasoning to solve real‐world and mathematical problems, e.g., by reasoning about tables of equivalent ratios, tape diagrams, double number line diagrams, or equations.
a. Make tables of equivalent ratios relating quantities with whole‐ number measurements, find missing values in the tables, and plot the pairs of values on the coordinate plane. Use tables to compare ratios.
d. Use ratio reasoning to convert measurement units; manipulate and transform units appropriately when multiplying or dividing quantities.
Common Core State Standards Math – Standards of Mathematical Practice
MP.1 Make sense of problems and persevere in solving them.Mathematically proficient students start by explaining to themselves the meaning of a problem and looking for entry points to its solution. They analyze givens, constraints, relationships, and goals. They make conjectures about the form and meaning of the solution and plan a solution pathway rather than simply jumping into a solution attempt. They consider analogous problems, and try special cases and simpler forms of the original problem in order to gain insight into its solution. They monitor and evaluate their progress and change course if necessary. Older students might, depending on the context of the problem, transform algebraic expressions or change the viewing window on their graphing calculator to get the information they need. Mathematically proficient students can explain correspondences between equations, verbal descriptions, tables, and graphs or draw diagrams of important features and relationships, graph data, and search for regularity or trends. Younger students might rely on using concrete objects or pictures to help conceptualize and solve a problem. Mathematically proficient students check their answers to problems using a different method, and they continually ask themselves, “Does this make sense?” They can understand the approaches of others to solving complex problems and identify correspondences between different approaches. MP.4 Model with mathematics. Mathematically proficient students can apply the mathematics they know to solve problems arising in everyday life, society, and the workplace. In early grades, this might be as simple as writing an addition equation to describe a situation. In middle grades, a student might apply proportional reasoning to plan a school event or analyze a problem in the community. By high school, a student might use geometry to solve a design problem or use a function to describe how one quantity of interest depends on another. Mathematically proficient students who can apply what they know are comfortable making assumptions and approximations to simplify a complicated situation, realizing that these may need revision later. They are able to identify important quantities in a practical situation and map their relationships using such tools as diagrams, two‐way tables, graphs, flowcharts and formulas. They can analyze those relationships mathematically to draw conclusions. They routinely interpret their mathematical results in the context of the situation and reflect on whether the results make sense, possibly improving the model if it has not served its purpose.
Assessment Results This task was developed by the Mathematics Assessment Resource Service and administered as part of a national, normed math assessment. For comparison purposes, teachers may be interested in the

© 2012 Noyce Foundation
results of the national assessment, including the total points possible for the task, the number of core points, and the percent of students that scored at standard on the task. Related materials, including the scoring rubric, student work, and discussions of student understandings and misconceptions on the task, are included in the task packet. Grade Level Year Total Points Core Points % At Standard
6 2008 8 5 54 %

Grade 6 – 2008 Copyright © 2008 by Mathematics Assessment Resource Service All rights reserved.
4
Snail Pace This problem gives you the chance to: • work with distances, time and speeds in inches and minutes These snails move very slowly. Here are their speeds. Snail A 5 inches in 10 minutes
Snail B 3 inches in 20 minutes
Snail C 1 inch in 15 minutes
Snail D 6 inches in 30 minutes 1. How far can snail D travel in 1 hour? ____________ inches 2. How far can snail C travel in half an hour? ____________ inches 3. How far can snail B travel in 2 hours? ____________ inches Show how you figured this out. 4. Which snail moves more quickly than the others? ____________ Explain how you figured this out. ________________________________________________________________________ ________________________________________________________________________ ________________________________________________________________________
8

Grade 6 – 2008 Copyright © 2008 by Mathematics Assessment Resource Service All rights reserved.
5
Snail Pace Rubric • • The core elements of performance required by this task are: • • work with distances, time and speeds in inches and minutes • Based on these, credit for specific aspects of performance should be assigned as follows
points
section points
1. Gives correct answer: 12 inches or 1 foot 1 1
2. Gives correct answer: 2 inches
1 1
3. Gives correct answer: 18 inches or 1 foot 6 inches or 1 1/2 feet Shows correct work such as: 60 divided by 20 = 3 3 x 3 = 9 inches in 1 hour
9 x 2 = 18 inches
1
2
3
4. Gives correct answer: Snail A Accept 5 Gives correct explanation such as: In 1 hour Snail A travels 30 inches. In 1 hour Snail B travels 9 inches. In 1 hour Snail C travels 4 inches. In 1 hour Snail D travels 12 inches. Partial credit For 1 error
1 2
(1)
3
Total Points 8

Grade 6 – 2008 Copyright © 2008 by Noyce Foundation All rights reserved.
6
Snail Pace Work the task and look at the rubric. What are the big mathematical ideas in this task? What do we want students to understand about rates and making a mathematical comparison? Look at student work for part 3. How many of your students put:
18 9 24 40 6 24 Other What kinds of errors or misconceptions did you see in their thinking or strategies? Now look at the work for part 4. how many of your students:
• Could make a comparison in the same unit for all 4 snails?________ • Made a correct comparison between 3 of the 4 snails?____________ • Compared all the snails but used different units?________________ • Only discussed A or a rate for A?_________________ • Tried to make a logical comparison between D and A?___________ • Chose Snail B?________Chose Snail C?_______Chose Snail D?_________ • Made an additive comparison?___________ • Did not mention rates?______________
What were some of the different rates that successful students used? Were there some interesting strategies used by successful students? What are the implications for instruction?

Grade 6 – 2008 Copyright © 2008 by Noyce Foundation All rights reserved.
7
Looking at Student Work on Snail Pace Student A is able to change the rates to different times in parts 1, 2, and 3. Notice that the student uses a ratio table strategy for part 3. In part 4 the student changes all the rates to the same unit by comparing them in inches per hour. Student A

Grade 6 – 2008 Copyright © 2008 by Noyce Foundation All rights reserved.
8
Student B also attempts to change everything to the same unit. Interestingly the student fixes the inches instead of the time for the first 3 comparisons, which is a great strategy. How might you share this strategy with students to help them learn a new approach to rates? However for snail D the students makes a comparison with C in minutes instead of keeping the fixed inches. How could the student change the rate for D to make it comparable to the others? Student B

Grade 6 – 2008 Copyright © 2008 by Noyce Foundation All rights reserved.
9
Student C uses a ratio table to solve for part 3. This is a correct strategy. What is the error or misunderstanding of Student C in using the table? In part 4 the student has used a fraction strategy to solve the task. This strategy does make it possible to compare the rates. Can you explain why? What further work would you have wanted to complete the explanation for part 4? Student C

Grade 6 – 2008 Copyright © 2008 by Noyce Foundation All rights reserved.
10
Student D uses a scale factor to solve for part 3. In part 4 the student attempts a comparison to eliminate Snail B and C, but doesn’t use comparable units. The student does use the same rates to compare Snail A and D. Snail D
Snail E makes an assertion about the rates of Snail A and D, but doesn’t change them to the same units. Notice that there is no mention of why B and C weren’t even considered. What do we want as the norms for making a mathematical comparison? Student E

Grade 6 – 2008 Copyright © 2008 by Noyce Foundation All rights reserved.
11
Student F only mentions a rate in inches per hour for Snail A, as if that would be a complete explanation. However on this paper there are rates for 2 other snails in hours. Can you find them? Would better use of labels have helped this student to think a little deeper about the final answer? Student F
Grade 6 – 2008 Copyright © 2008 by Noyce Foundation All rights reserved.
12
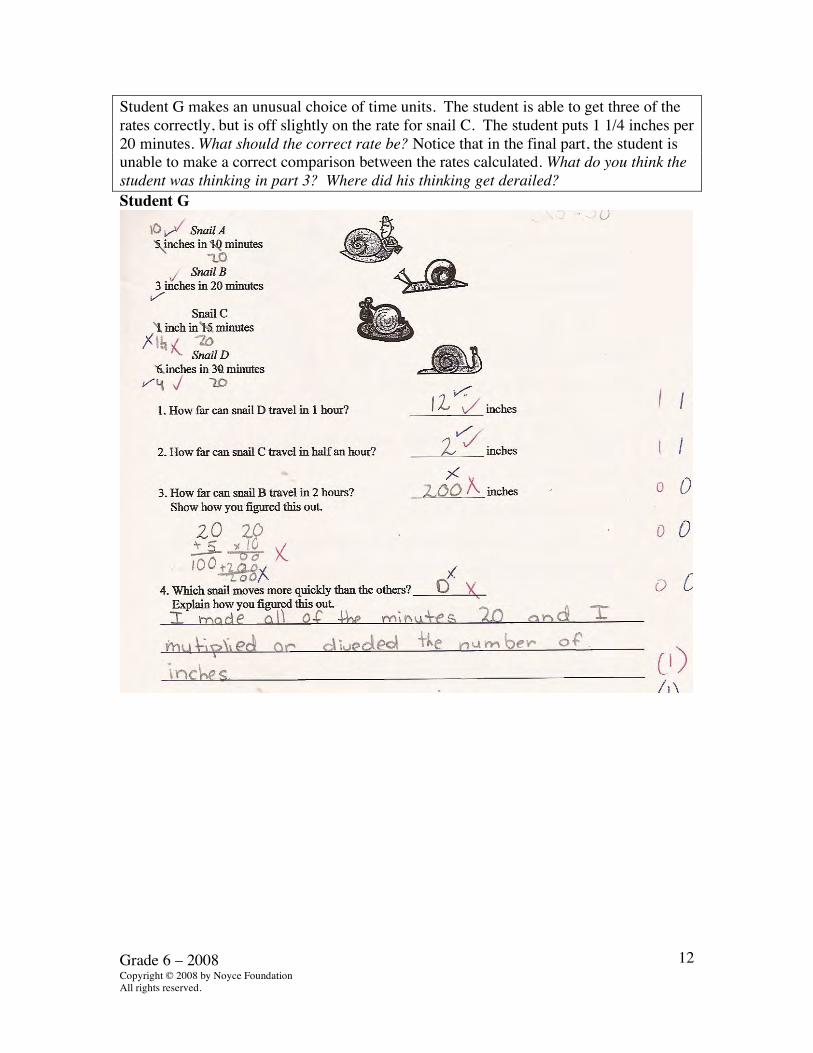
Student G makes an unusual choice of time units. The student is able to get three of the rates correctly, but is off slightly on the rate for snail C. The student puts 1 1/4 inches per 20 minutes. What should the correct rate be? Notice that in the final part, the student is unable to make a correct comparison between the rates calculated. What do you think the student was thinking in part 3? Where did his thinking get derailed? Student G

Grade 6 – 2008 Copyright © 2008 by Noyce Foundation All rights reserved.
13
Some students have not realized that proportions are multiplicative. They are instead trying to apply additive strategies. Look at the work of Student H, who uses additive thinking in both part 3 and part 4. Student I is also using additive thinking in part 4. What experiences help students to see why this strategy doesn’t make sense? What kind of problem can we construct to make this more apparent? Student H
Student I

Grade 6 – 2008 Copyright © 2008 by Noyce Foundation All rights reserved.
14
6th Grade Task 1 Snail Pace Student Task Work with distances, time and speeds in inches and minutes. Compare
rates after first converting to either an equivalent distance or equivalent time period.
Core Idea 1 Number and Operation
Understand number systems, the meanings of operations, and ways of representing numbers, relationships and number systems.
• Understand and use proportional reasoning to represent quantitative relationships.
Core Idea 4 Geometry and Measurement
Apply appropriate techniques, tools, and formulas to determine measurements.
• Solve simple problems involving rates and derived measurements for such attributes as velocity.
The mathematics of this task:
• Converting rates to different times • Making a comparison between rates by changing to the same units by either
fixing the distance or by fixing the time • Making a convincing mathematical justification
Based on teacher observations, this is what sixth graders know and were able to do:
• Students know the more inches traveled the faster the snail • Students could change rates to equivalent rates, e.g. 6 in. in 30 min. = 12 in. in 1
hour Areas of difficulty for sixth graders:
• Understanding the logic of a mathematical comparison, using an equal distance with different times or using an equal time for different distances
• Understanding that all items in the list need to be compared • Making a justification with numerical quantities or rates

Grade 6 – 2008 Copyright © 2008 by Noyce Foundation All rights reserved.
15
The maximum score available for this task is 8 points. The minimum score for a level 3 response, meeting standards, is 5 points. Most students, 90%, could find equivalent rates in parts 1 and 2. Many students, 79%, could also find the snail with the fastest rate. More than half the students could also find equivalent rates in part 3 and explain their thinking. 21% of the students could meet all the demands of the task including comparing all the snails using equivalent units of either time or distance. Almost 6% of the students scored no points on this task. All the students in the sample with this score attempted the task.

Grade 6 – 2008 Copyright © 2008 by Noyce Foundation All rights reserved.
16
Snail Pace Points Understandings Misunderstandings
0 All the students in the sample with this score attempted the task.
Students had difficulty changing the rates in parts 1 and 2.
2 Students could change rates to different amounts of time in parts 1 and 2.
Students didn’t recognize which Snail was the fastest. 10% of the students thought Snail D was fastest. 9% picked Snail B. 3% picked Snail c.
3 Students could change rates in part 1 and 2 and identify the fastest snail.
Students had difficulty changing to a rate of 2 hours for Snail B in part 3. 4% gave the rate for 1 hour. Other common answers were 24, 6, 21, 8, 40.
5 Students could change the rates in parts 1, 2, and 3.
6 Students could change the rates in parts 1, 2, and 3 and identify the fastest snail.
Students did not know how to write a justification. 17% just mentioned the rate for Snail A. 8% just gave a verbal reason for choosing A over D with no quantification. 6% gave explanations with no rates. 6% made comparisons in different units.
8 Students could change rates to find equivalent rates. Students could make a mathematical comparison by either fixing the time or the distance and considering all units in the list.
Grade 6 – 2008 Copyright © 2008 by Noyce Foundation All rights reserved.
17
Implications for Instruction Students at this grade level should be able to make conversions between rates for different units of time. Students should have a variety of strategies for making conversions, such as: using division to find a unit rate, finding equivalent fractions, and using a ratio table. Students should draw upon their developing understandings around fractions to look for common multiples or common denominators and working in number theory to find common multiples and common factors to solve new problems. Many students should look at the given times and think, “What might be a convenient unit to make all the times the same.” Students with more experience with rates might think, “Is it more convenient to change all the rates to a common time or a common distance?” Students need to frequently be asked questions like, “How does this solution relate to other topics I have learned? When is one strategy better or more convenient than another?” Students should think about the idea of comparison as a type of problem, rather than strictly thinking about what calculations should I use with these numbers. Students should learn to recognize that when making a choice or comparison the best choice needs to be compared to all of the other available options. Students need opportunities to justify their thinking and compare it with the thinking of others in order to develop the skills at making a complete argument. At this grade level students need to think about applying a solution strategy to a type of problem, rather than solving each problem fresh. Ideas for Action Research – Comparing and Contrasting Strategies Students at this grade level need to start thinking about why different strategies work. What do these strategies have in common? How are they different? In order to better manage classroom discussion, teachers need to think about how to present the strategies to the class and facilitate the mathematics of the solutions rather than just presenting variety for varieties sake. One helpful tool is to meet with colleagues and try to anticipate student strategies and discuss these ideas as a learner first. Consider the following solutions.
• Can you describe which solutions are related? • How are the strategies different? • If you were presenting them to the class, what might be the best order to have
students share out in order to bring all the students along? Why would you pick that particular order?
Some teachers use seating charts during a lesson to record strategies to help them get ideas out in an order to help everyone follow the discussion. Work below is presented without labels or in a partial condition, to make thinking about more interesting or re-engaging. The idea is for the viewer to really have to think about the mathematics from a new perspective each time.

Grade 6 – 2008 Copyright © 2008 by Noyce Foundation All rights reserved.
18

Grade 6 – 2008 Copyright © 2008 by Noyce Foundation All rights reserved.
19
After having students examine and compare the strategies, you might want to give students back their papers to see if they want to revise their work with a red pen or you might want to give them a similar problem; such as, 2001 Cans of Kola or 2002 Grandpa’s Knitting, to see how the discussion effected their thinking.