
•Peoples/TLC 2/10/05 2 · PDF file... a decrease in non-interest income, an increase in...
48
PEOPLES FINANCIAL CORPORATION AND SUBSIDIARIES 2014 ANNUAL REPORT
Transcript of •Peoples/TLC 2/10/05 2 · PDF file... a decrease in non-interest income, an increase in...
P E O P L E S F I N A N C I A L C O R P O R A T I O N A N D S U B S I D I A R I E S
2 0 1 4 A N N U A L R E P O R T


1
Peoples Financial Corporation (the “ Company” ) is a one-bank holding company headquartered in Biloxi, Mississippi. The following presents
Management’s discussion and analysis of the consolidated financial condition and results of operations of the Company and its consolidated subsidiaries
for the years ended December 31, 2014, 2013 and 2012. These comments highlight the significant events for these years and should be considered in
combination with the Consolidated Financial Statements and Notes to Consolidated Financial Statements included in this annual report.
F O R W A R D - L O O K I N G I N F O R M A T I O NCongress passed the Private Securities Litigation Act of 1995 in an effort to encourage corporations to provide information about a company’s
anticipated future financial performance. This act provides a safe harbor for such disclosure which protects the companies from unwarranted litigation
if actual results are different from management expectations. This report contains forward-looking statements and reflects industry conditions,
company performance and financial results. These forward-looking statements are subject to a number of factors and uncertainties which could cause
the Company’s actual results and experience to differ from the anticipated results and expectations expressed in such forward-looking statements. Such
factors and uncertainties include, but are not limited to: changes in interest rates and market prices, changes in local economic and business conditions,
increased competition for deposits and loans, a deviation in actual experience from the underlying assumptions used to determine and establish the
allowance for loan losses, changes in the availability of funds resulting from reduced liquidity, changes in government regulations and acts of terrorism,
weather or other events beyond the Company's control.
N E W A C C O U N T I N G P R O N O U N C E M E N T SThe Financial Accounting Standards Board (“ FASB” ) has issued new accounting standards updates, which have been disclosed in Note A to the
Consolidated Financial Statements. The Company does not expect that these updates will have a material impact on its financial position, or results
of operations.
C R I T I C A L A C C O U N T I N G P O L I C I E SThe preparation of financial statements in conformity with accounting principles generally accepted in the United States of America (“ GAAP” ) requires
Management to make estimates and assumptions that affect the reported amounts of assets and liabilities and disclosure of contingent assets and
liabilities at the date of the financial statements and the reported amounts of revenues and expenses during the reporting period. The Company
evaluates these estimates and assumptions on an on-going basis using historical experience and other factors, including the current economic
environment. We adjust such estimates and assumptions when facts and circumstances dictate. Certain critical accounting policies affect the more
significant estimates and assumptions used in the preparation of the consolidated financial statements.
Allowance for Loan Losses
The Company's most critical accounting policy relates to its allowance for loan losses (“ ALL” ), which reflects the estimated losses resulting from the
inability of its borrowers to make loan payments. The ALL is established and maintained at an amount sufficient to cover the estimated loss associated
with the loan portfolio of the Company as of the date of the financial statements. Credit losses arise not only from credit risk, but also from other risks
inherent in the lending process including, but not limited to, collateral risk, operation risk, concentration risk and economic risk. As such, all related risks
of lending are considered when assessing the adequacy of the ALL. On a quarterly basis, Management estimates the probable level of losses to determine
whether the allowance is adequate to absorb reasonably foreseeable, anticipated losses in the existing portfolio based on our past loan loss experience,
known and inherent risk in the portfolio, adverse situations that may affect borrowers’ ability to repay and the estimated value of any underlying
collateral and current economic conditions. Management believes that the ALL is adequate and appropriate for all periods presented in these financial
statements. If there was a deterioration of any of the factors considered by Management in evaluating the ALL, the estimate of loss would be updated,
and additional provisions for loan losses may be required. The analysis divides the portfolio into two segments: a pool analysis of loans based upon a
five year average loss history which is updated on a quarterly basis and which may be adjusted by qualitative factors by loan type and a specific reserve
analysis for those loans considered impaired under GAAP. All credit relationships with an outstanding balance of $100,000 or greater that are included in
Management's loan watch list are individually reviewed for impairment. All losses are charged to the ALL when the loss actually occurs or when a
determination is made that a loss is likely to occur; recoveries are credited to the ALL at the time of receipt.
MANAGEMENT’ S DISCUSSION AND ANALYSIS OF F INANCIAL CONDITION
AND RESULTS OF OPERATIONS

2
Other Real Estate
Other real estate (“ ORE” ) includes real estate acquired through foreclosure. Each other real estate property is carried at fair value, less estimated costs to
sell. Fair value is principally based on appraisals performed by third-party valuation specialists. If Management determines that the fair value of a
property has decreased subsequent to foreclosure, the Company records a write down which is included in non-interest expense.
Employee Benefit Plans
Employee benefit plan liabilities and pension costs are determined utilizing actuarially determined present value calculations. The valuation of the
benefit obligation and net periodic expense is considered critical, as it requires Management and its actuaries to make estimates regarding the amount
and timing of expected cash outflows including assumptions about mortality, expected service periods and the rate of compensation increases.
Income Taxes
GAAP requires the asset and liability approach for financial accounting and reporting for deferred income taxes. We use the asset and liability method
of accounting for deferred income taxes and provide deferred income taxes for all significant income tax temporary differences. See Note I to the
Consolidated Financial Statements for additional details. As part of the process of preparing our Consolidated Financial Statements, the Company is
required to estimate our income taxes in each of the jurisdictions in which we operate. This process involves estimating our actual current tax exposure
together with assessing temporary differences resulting from differing treatment of items, such as the provision for the allowance for loan losses, for tax
and financial reporting purposes. These differences result in deferred tax assets and liabilities that are included in our consolidated statement of
condition. We must also assess the likelihood that our deferred tax assets will be recovered from future taxable income, and to the extent we believe that
recovery is not likely, we must establish a valuation allowance. Significant management judgment is required in determining our provision for income
taxes, our deferred tax assets and liabilities and any valuation allowance recorded against our net deferred tax assets. To the extent the Company
establishes a valuation allowance or adjusts this allowance in a period, we must include an expense within the tax provision in the consolidated
statement of operations.
O V E R V I E WThe Company is a community bank serving the financial and trust needs of its customers in our trade area, which is defined as those portions of
Mississippi, Louisiana and Alabama which are within a fifty mile radius of the Waveland, Wiggins and Gautier branches, the bank subsidiary’s three most
outlying locations. Maintaining a strong core deposit base and providing commercial and real estate lending in our trade area are the traditional
focuses of the Company. Growth has largely been achieved through de novo branching activity, and it is expected that these strategies will continue to
be emphasized in the future.
The Company incurred a net loss of $10,004,000 for 2014 compared with a net loss of $538,000 for 2013. Results in 2014 included a decrease in net inter-
est income, a decrease in non-interest income, an increase in non-interest expense and an increase in income tax expense. These increases were
partially offset by a decrease in the provision for the allowance for loan losses.
Managing the net interest margin in the Company's highly competitive market and in context of larger economic conditions has been very challenging
and will continue to be so, for the foreseeable future. Net interest income was impacted primarily by the decrease in interest income on loans of
$2,872,000. This decrease was primarily the result of the decrease in average loans as principal payments, maturities, charge-offs and foreclosures on
existing loans exceeded new loans.
Monitoring asset quality, estimating potential losses in our loan portfolio, and addressing non-performing loans continue to be emphasized during these
difficult economic times, as the local economy continues to negatively impact collateral values and borrowers’ ability to repay their loans. A provision
for the allowance for loan losses of $7,404,000 was recorded in 2014 as compared with $9,661,000 in 2013. The Company is working diligently to address
and reduce its non-performing assets. The Company's nonaccrual loans totaled $33,298,000 and $26,171,000 at December 31, 2014 and December 31, 2013,
respectively. Most of these loans are collateral-dependent, and the Company has rigorously evaluated the value of its collateral to determine
potential losses.
Non-interest income decreased $448,000 for 2014 as compared with 2013 results. Service charges on deposit accounts decreased $336,000 for 2014 as
compared with 2013 results primarily as a result of decreased ATM fee income. Results for 2014 included gains on sales of securities of $99,000 as
compared with $258,000 in 2013.
Non-interest expense increased $1,554,000 for 2014 as compared with 2013 results. This increase for 2014 was the result of the increase in salaries and
employee benefits of $457,000 and the increase in other real estate expense of $647,000 as compared with 2013.
The Company recorded income tax expense of $4,726,000 for 2014 as compared with an income tax benefit of $2,201,000 for 2013. In 2014, a valuation
allowance of $8,140,000 was established based on an evaluation of the Company's deferred tax assets.
Total assets for December 31, 2014 decreased $93,369,000 as compared with December 31, 2013. Available for sale securities decreased $60,318,000 as a
result of sales and maturities of these investments during 2014. Loans decreased $12,942,000 for 2014 as compared with December 31, 2013, as principal
payments, maturities, charge-offs and foreclosures on existing loans exceeded new loans. Other assets decreased $8,840,000 as of December 31, 2014 as
compared with 2013 as a result of a valuation allowance of $8,140,000 on deferred tax assets.
3
R E S U L T S O F O P E R A T I O N SNet Interest Income
Net interest income, the amount by which interest income on loans, investments and other interest- earning assets exceeds interest expense on deposits
and other borrowed funds, is the single largest component of the Company's income. Management's objective is to provide the largest possible amount
of income while balancing interest rate, credit, liquidity and capital risk. Changes in the volume and mix of interest-earning assets and interest-bearing
liabilities combined with changes in market rates of interest directly affect net interest income.
2014 as compared with 2013
The Company's average interest-earning assets decreased approximately $79,906,000, or 11%, from approximately $727,723,000 for 2013 to
approximately $647,817,000 for 2014. The Company's average balance sheet decreased primarily as decreased pledging requirements on public funds
allowed for reduced investment in securities and principal payments, maturities, charge-offs and foreclosures relating to existing loans outpaced new
loans. Average federal funds sold also decreased based on the liquidity position of the bank subsidiary. The average yield on interest-earning assets was
at 3.54% for 2014 and 2013. The yield on average loans decreased in 2014 as compared with 2013 as the prior year included $1,523,000 in interest and fees
from the sale of a gaming loan which had been on nonaccrual. The yield on taxable available for sale securities increased to 1.99% for 2014 from 1.78% for
2013 due to the Company's strategy of extending the duration of new investments.
Average interest-bearing liabilities decreased approximately $74,402,000, or 13%, from approximately $578,921,000 for 2013 to approximately $504,519,000
for 2014. Average time deposits decreased primarily as brokered deposits matured during 2013. Average federal funds purchased and securities sold under
agreements to repurchase, which only included non-deposit accounts, decreased as these customers reallocate their balances periodically. Average
borrowings from the FHLB increased due to the liquidity needs of the bank subsidiary. The average rate paid on interest-bearing liabilities increased
4 basis points, from .25% for 2013 to .29% for 2014. This increase was due to an immaterial interest expense adjustment on time deposits.
The Company's net interest margin on a tax-equivalent basis, which is net interest income as a percentage of average earning assets, was 3.32% for 2014
as compared with 3.34% for 2013.
2013 as compared with 2012
The Company's average interest-earning assets decreased approximately $21,292,000, or 3%, from approximately $749,015,000 for 2012 to approximately
$727,723,000 for 2013. The Company's average balance sheet decreased primarily as decreased pledging requirements on public funds allowed for reduced
investment in securities, the fair value of available for sale securities decreased and principal payments, maturities, charge-offs and foreclosures relating
to existing loans outpaced new loans. The average yield on interest-earning assets increased 15 basis points, from 3.39% for 2012 to 3.54% for 2013, with
the biggest impact being to the yield on loans. During 2013, the Company sold a gaming loan which had been on nonaccrual and recognized
approximately $1,523,000 in interest and fees which increased the yield on loans to 4.67%. Without this transaction, the yield on loans would have been
4.29%. Recent investment strategy included extending durations to improve yield on these assets, while planning for rising rates in the future.
Average interest-bearing liabilities decreased approximately $25,008,000, or 4%, from approximately $603,929,000 for 2012 to approximately $578,921,000
for 2013. During 2013, brokered deposits, which are reported as time deposits, of $23,612,000 matured. Borrowings from the FHLB fluctuated based on the
liquidity needs of the bank subsidiary. The average rate paid on interest-bearing liabilities decreased 9 basis points, from .34% for 2012 to .25% for 2013.
Rates paid on deposit accounts and non-deposit accounts, which are reported as federal funds purchased and securities sold under agreements to
repurchase, decreased in 2013. The unprecedented low rate environment which existed on a national and local level caused customers to
tolerate lower interest rates in return for less risk.
The Company's net interest margin on a tax-equivalent basis, which is net interest income as a percentage of average earning assets, was 3.34% at
December 31, 2013, up 23 basis points from 3.11% at December 31, 2012. Without the additional interest income and fees from the sale of the gaming loan,
the net interest margin for 2013 would have been 3.13%.

The tables below analyze the changes in tax-equivalent net interest income for the years ended December 31, 2014 and 2013 and the years ended December 31, 2013 and 2012.
A N A L Y S I S O F A V E R A G E B A L A N C E S , I N T E R E S T E A R N E D / P A I D A N D Y I E L D ( I N T H O U S A N D S )
2014 2013Average Balance Interest Earned/Paid Rate Average Balance Interest Earned/Paid Rate
Loans (1) (2) (3) $ 362,649 $ 16,055 4.43% $ \\\\\ 405,463 $ \\\\ 18,927 4.67%Federal funds sold 7,305 21 0.29 26,306 69 0.26Held to maturity:
Non taxable (4) 13,696 474 3.46 9,936 363 3.65Available for sale:
Taxable 225,742 4,502 1.99 247,097 4,407 1.78Non taxable (4) 34,360 1,889 5.50 36,605 1,946 5.32Other 4,065 18 0.44 2,316 29 1.25
Total $ \\ 647,817 $ \22,959 3.54% $ 727,723 $ \\\\ 25,741 3.54%Savings and interest-bearing DDA $ 230,399 $ \\\\\ 174 0.08% $ \246,728 $ \\\ 179 0.07%
Time deposits 89,564 937 1.05 123,198 919 0.75Federal funds purchased and securities sold under agreementsto repurchase 127,707 100 0.08 181,702 158 0.09
Borrowings from FHLB 56,849 230 0.40 27,293 191 0.70Total $ \\\504,519 $ \\\ 1,441 0.29% $ \\\\ \\ 578,921 $ \\\ 1,447 0.25%Net tax-equivalent spread 3.25% 3.29%Net tax-equivalent margin
on earning assets 3.32% 3.34%
2013 2012Average Balance Interest Earned/Paid Rate Average Balance Interest Earned/Paid Rate
Loans (1) (2) (3) $ \\\\405,463 $ 18,927 4.67% $ \\\\ \\ 430,205 $ \\\\ 18,576 4.32%Federal funds sold 26,306 69 0.26 6,601 16 0.24Held to maturity:
Non taxable (4) 9,936 363 3.65 4,698 189 4.02Available for sale:
Taxable 247,097 4,407 1.78 264,248 4,527 1.71Non taxable (4) 36,605 1,946 5.32 39,407 2,073 5.26Other 2,316 29 1.25 3,856 15 0.39
Total $ \\\\\\727,723 $ 25,741 3.54% $ \\\\ 749,015 $ \\\ 25,396 3.39%Savings and interest-bearing DDA $ \\\\246,728 $ 179 0.07% $ \ 230,829 $ \\\\ 410 0.18%
Time deposits 123,198 919 0.75 149,560 1,090 0.73Federal funds purchased and securities sold under agreementsto repurchase 181,702 158 0.09 169,352 335 0.20
Borrowings from FHLB 27,293 191 0.70 54,188 233 0.43Total $ \\\\\578,921 $ 1,447 0.25% $ \\ \\603,929 $ \\ \\\\\ 2,068 0.34%Net tax-equivalent spread 3.29% 3.05%Net tax-equivalent margin
on earning assets 3.34% 3.11%
(1) 2013 includes interest and fees of $1,523 recognized from sale of a nonaccrual loan during the fourth quarter.(2) Loan fees of $557, $911 and $797 for 2014, 2013 and 2012, respectively, are included in these figures.(3) Includes nonaccrual loans.(4) All interest earned is reported on a taxable equivalent basis using a tax rate of 34% in 2014, 2013 and 2012.
4

A N A L Y S I S O F C H A N G E S I N I N T E R E S T I N C O M E A N D E X P E N S E ( I N T H O U S A N D S )
For the year ended December 31, 2014 compared with December 31, 2013Volume Rate Rate/Volume Total
Interest earned on:Loans $ \\\\(1,998) $ (977) $ 103 $ \\\(2,872)Federal funds sold (50) 7 (5) (48)Held to maturity securities:
Non taxable 137 (19) (7) 111Available for sale securities:
Taxable (380) 520 (45) 95Non taxable (119) 66 (4) (57)Other 22 (19) (14) (11)
Total $ (2,388) $ \\\\\\\\\\\\ (422) $ \\\\\\ 28 $ (2,782)
Interest paid on:Savings and interest-bearing DDA $ \\\\ (12) $ \\ 7 $ \\\\ G $ \(5)Time deposits (251) 370 (101) 18Federal funds purchased (47) (16) 5 (58)Borrowings from FHLB 207 (81) (87) 39Total $ (103) $\\\\\\\\\\\\\\\\\\ 280 $ (183) $ \(6)
For the year ended December 31, 2013 compared with December 31, 2012Volume Rate Rate/Volume Total
Interest earned on:Loans $\\\\\\\\\(1,068) $ 1,505 $ \\\\(86) $ \\\\ 351Federal funds sold 48 1 4 53Held to maturity securities:
Non taxable 211 (17) (20) 174Available for sale securities:
Taxable (294) 186 (12) (120)Non taxable (147) 22 (2) (127)Other (6) 33 (13) 14
Total $\\\\\\\\\\(1,256) $ \\\\\ 1,730 $ (129) $ \\\\\ 345
Interest paid on:Savings and interest-bearing DDA $ \ 28 $ (242) $ \\\\ (17) $ \\(231)Time deposits (192) 26 (5) (171)Federal funds purchased 24 (188) (13) (177)Borrowings from FHLB (115) 147 (74) (42)Total $ \\\\\\\\\\\\ (255) $ \\ (257) $ \\\\(109) $ \\\(621)
5
6
Provision for Allowance for Loan LossesIn the normal course of business, the Company assumes risk in extending credit to its customers. This credit risk is managed through compliance with theloan policy, which is approved by the Board of Directors. The policy establishes guidelines relating to underwriting standards, including but not limitedto financial analysis, collateral valuation, lending limits, pricing considerations and loan grading. The Company's Loan Review and Special AssetsDepartments play key roles in monitoring the loan portfolio and managing problem loans. New loans and, on a periodic basis, existing loans are reviewedto evaluate compliance with the loan policy. Loan customers in concentrated industries such as gaming and hotel/motel, as well as the exposure for outof area; residential and land development; construction and commercial real estate loans, and their direct and indirect impact on the Company's operations are evaluated on a monthly basis. Loan delinquencies and deposit overdrafts are closely monitored in order to identify developing problemsas early as possible. Lenders experienced in workout scenarios consult with loan officers and customers to address non-performing loans. A monthlywatch list of credits which pose a potential loss to the Company is prepared based on the loan grading system. This list forms the foundation of theCompany's allowance for loan loss computation.
Management relies on its guidelines and existing methodology to monitor the performance of its loan portfolio and to identify and estimate potentiallosses based on the best available information. The potential effect of the continuing decline in real estate values and actual losses incurred by theCompany were key factors in our analysis. Much of the Company's loan portfolio is collateral-dependent, requiring careful consideration of changes inthe value of the collateral. Note A to the Consolidated Financial Statements discloses a summary of the accounting principles applicable to impaired andnonaccrual loans as well as the allowance for loan losses. Note C to the Consolidated Financial Statements presents additional analyses of the composition, aging and performance of the loan portfolio as well as the transactions in the allowance for loan losses.
The Company's analysis includes evaluating the current value of collateral securing all nonaccrual loans. Nonaccrual loans totaled $33,298,000 and$26,171,000 with specific reserves on these loans of $2,207,000 and $1,280,000 as of December 31, 2014 and 2013, respectively. The specific reserves allocated to nonaccrual loans are relatively low as collateral values appear sufficient to cover loan losses or the loan balances have been charged downto their realizable value.
The Company's on-going, systematic evaluation resulted in the Company recording a total provision for the allowance for loan losses of $7,404,000,$9,661,000 and $4,264,000 in 2014, 2013 and 2012, respectively. The increases for 2014 and 2013 were the result of receiving new appraisals on several collateral-dependent loans. The new appraisals caused Management to update the evaluation of these loans and increase the loan loss provision significantly for two impaired loans during these years. Additional loan loss provisions of $1,600,000 and $7,600,000 were recorded for one out-of-arearesidential development loan in 2014 and 2013, respectively. An additional loan loss provision of $3,300,000 was recorded for one commercial real estateloan secured by a hotel in our trade area in 2014. The allowance for loan losses as a percentage of loans was 2.54%, 2.38% and 2.05% at December 31, 2014,2013 and 2012, respectively. The Company believes that its allowance for loan losses is appropriate as of December 31, 2014.
The allowance for loan losses is an estimate, and as such, events may occur in the future which may affect its accuracy. The Company anticipates that itis possible that additional information will be gathered in the future which may require an adjustment to the allowance for loan losses. Management willcontinue to closely monitor its portfolio and take such action as it deems appropriate to accurately report its financial condition and results of operations.
Non-interest income2014 as compared with 2013Total non-interest income decreased $448,000 in 2014 as compared with 2013. Service charges on deposit accounts decreased $336,000 in 2014 as com-pared with 2013 as a result of decreased ATM fees. ATM fees decreased $333,000 as the Company's off-site ATMs at a casino transferred to another ven-dor during 2014 which reduced ATM transactions. Gains from liquidation, sales and calls of securities decreased $159,000 as sales were executed when pro-ceeds would be maximized. The Company realized a loss from operations of its investments in a low income housing partnership in 2014 as comparedwith income from operations in 2013 as a result of decreased occupancy.
2013 as compared with 2012Total non-interest income decreased $462,000 in 2013 as compared with 2012. Service charges on deposit accounts increased $325,000 in 2013 as com-pared with 2012 as a result of increased service charges and ATM fees and a decrease in NSF fees. Fees from service charges increased $51,000 as a resultof the Company increasing per account and per transactions fees in 2013 and an increase in ATM fees of $409,000 as a result of the improvement in thelocal casinos at which the Company has off-site ATMs. NSF fees decreased $153,000 as customers changed their overdraft activity based on economic con-ditions. Gains from sales and calls of securities decreased $1,106,000 as sales were executed when proceeds would be maximized. The increase in cashsurrender value of life insurance decreased $72,000 in 2013 as compared with 2012 as a result of the decline in the stock market. The Company had a lossfrom impairment of other investments of $360,000 in 2012 and income on other investments of $42,000 in 2013 as compared with a loss of $84,000 in 2012.Other income decreased as prior year results included gains of $31,000 from the sale of bank vehicles.

Non-interest expense2014 as compared with 2013Total non-interest expense increased $1,554,000 in 2014 as compared with 2013. Salaries and employee benefits increased $457,000 in 2014 as comparedwith 2013. Salaries increased $293,000 in 2014 as compared with 2013 due to merit raises. Expenses relating to the retiree health plan increased $123,000as 2013's results included the effect of an amendment to the plan which lowered the expense. Equipment rentals, depreciation and maintenance increased$176,000 in 2014 as compared with 2013 primarily as a result of an increase of $63,000 in depreciation and servicing costs on new computer hardware and software placed into service during 2014. Other expense increased $856,000 for 2014 as compared with 2013. This increase was the result ofincreases in FDIC and state assessments and other real estate expenses. FDIC and state assessments increased $163,000 in 2014 as 2013 results included anadjustment in the estimate of prepaid assessments. Increased write downs of other real estate to fair value caused these expenses to increase $647,000 in2014 as compared with 2013.
2013 as compared with 2012Total non-interest expense increased $377,000 in 2013 as compared with 2012. Salaries and employee benefits decreased $424,000 in 2013 as comparedwith 2012. Salaries increased $101,000 in 2013 as compared with 2012 due to merit raises. Expenses relating to deferred compensation plans decreased$136,000 in 2013 as a result of the impact of recent and future retirements and changes in the discount rate utilized to compute related liabilities. TheCompany's board of directors reduced contributions to its defined contribution plans $110,000 in 2013 as a result of the net loss. Health insurance costsdecreased $270,000 as a result of a reduction in claims in 2013 as compared with 2012 and amendments made to the retiree health plan which require planparticipants to utilize drug benefits and health insurance coverage available under Medicare. Equipment rentals, depreciation and maintenancedecreased $228,000 in 2013 as compared with 2012 primarily as a result of a decrease of $299,000 in depreciation on furniture and equipment replacedduring the years after Hurricane Katrina became fully depreciated. Maintenance costs increased $33,000 as a result of the timing of work performed. Otherexpense increased $1,048,000 for 2013 as compared with 2012. This increase was the result of increases in advertising, FDIC and state assessments, otherreal estate and ATM expenses, which were partially offset by a decrease in data processing costs. Advertising expenses increased $107,000, which was primarily attributable to the production of a new advertising campaign. FDIC and state assessments increased $367,000 in 2013 as 2012 results included an adjustment in the estimate of prepaid assessments. Increased write downs of other real estate to fair value caused these expenses to increase$315,000 in 2013 as compared with 2012. ATM expense increased $334,000 in 2013 as a result of increased ATM activity. Data processing expense decreased$180,000 as 2012 costs included several additional services and projects.
Income TaxesIncome taxes have been impacted by non-taxable income and federal tax credits during 2014, 2013 and 2012, respectively. Income taxes increased in 2014as the Company established a valuation allowance for its deferred tax assets. Note I to the Consolidated Financial Statements presents a reconciliation ofincome taxes for these three years.
F I N A N C I A L C O N D I T I O NCash and due from banks decreased $12,708,000 at December 31, 2014, compared with December 31, 2013 in the management of the bank subsidiary’s
liquidity position.
Available for sale securities decreased $60,318,000 at December 31, 2014 compared with December 31, 2013 as a result of sales and maturities of these
investments during 2014.
Held to maturity securities increased $6,642,000 at December 31, 2014 compared with December 31, 2013 as the Company opted to classify some of its
investment purchases during the current year as held to maturity.
Loans decreased $12,942,000 at December 31, 2014 compared with December 31, 2013, as principal payments, maturities, charge-offs and foreclosures on
existing loans exceeded new loans.
Other real estate (“ ORE” ) decreased $1,984,000 at December 31, 2014 as compared with December 31, 2013. Loans totaling $1,345,000 were transferred
into ORE while $2,068,000 was sold for a gain of $47,000 and write-downs of ORE to fair value were $1,261,000 during 2014.
Other assets decreased $8,840,000 at December 31, 2014 as compared with December 31, 2013 primarily as a result of a valuation allowance of $8,140,000
on deferred tax assets.
Total deposits decreased $35,844,000 at December 31, 2014, as compared with December 31, 2013. Typically, significant increases or decreases in total
deposits and/or significant fluctuations among the different types of deposits from year to year are anticipated by Management as customers in the
casino industry and county and municipal entities reallocate their resources periodically.
Federal funds purchased and securities sold under agreements to repurchase decreased $15,433,000 at December 31, 2014 as compared with
December 31, 2013 as several county and municipal entities reallocated their balances from a non-deposit account during 2014.
Borrowings from the Federal Home Loan Bank decreased $38,976,000 at December 31, 2014 as compared with December 31, 2013 based on the liquidity
needs of the bank subsidiary.
Employee and director benefit plans liabilities increased $1,120,000 at December 31, 2014 as compared with December 31, 2013 due to deferred
compensation benefits earned by employees and directors during 2014.
7

8
S H A R E H O L D E R S ’ E Q U I T Y A N D C A P I T A L A D E Q U A C YStrength, security and stability have been the hallmark of the Company since its founding in 1985 and of its bank subsidiary since its founding in 1896. Astrong capital foundation is fundamental to the continuing prosperity of the Company and the security of its customers and shareholders. The primaryand risk-based capital ratios are important indicators of the strength of a Company's capital. These figures are presented in the Five-Year ComparativeSummary of Selected Financial Information.
The measure of capital adequacy which is currently used by Management to evaluate the strength of the Company's capital is the primary capital ratiowhich was 14.38% at December 31, 2014, which is well above the regulatory minimum of 6.00%. Management continues to emphasize the importance ofmaintaining the appropriate capital levels of the Company and has established the goal of maintaining its primary capital ratio at 8.00%, which is theminimum requirement for classification as being “ well-capitalized” by the banking regulatory authorities.
Significant transactions affecting shareholders’ equity during 2014 are described in Note J to the Consolidated Financial Statements. The Statement ofChanges in Shareholders’ Equity also presents all activity in the Company's equity accounts.
L I Q U I D I T YLiquidity represents the Company's ability to adequately provide funds to satisfy demands from depositors, borrowers and other commitments by eitherconverting assets to cash or accessing new or existing sources of funds. Note L to the Consolidated Financial Statements discloses information relating tofinancial instruments with off-balance-sheet risk, including letters of credit and outstanding unused loan commitments. The Company closely monitorsthe potential effects of funding these commitments on its liquidity position. Management monitors these funding requirements in such a manner as tosatisfy these demands and to provide the maximum return on its earning assets.
The Company monitors and manages its liquidity position diligently through a number of methods, including through the computation of liquidity risktargets and the preparation of various analyses of its funding sources and utilization of those sources on a monthly basis. The Company also usesproforma liquidity projections which are updated on a continuous basis in the management of its liquidity needs and also conducts contingency testingon its liquidity plan. The Company has also been approved to participate in the Federal Reserve's Discount Window Primary Credit Program, which itintends to use only as a contingency. Management carefully monitors its liquidity needs, particularly relating to potentially volatile deposits, and theCompany has encountered no problems with meeting its liquidity needs.
Deposits, payments of principal and interest on loans, proceeds from maturities of investment securities and earnings on investment securities are theprincipal sources of funds for the Company.
The Company also uses other sources of funds, including borrowings from the FHLB. The Company generally anticipates relying on deposits, purchasesof federal funds and borrowings from the FHLB for its liquidity needs in 2015.
R E G U L A T O R Y M A T T E R SDuring 2009, Management identified opportunities for improving risk management, addressing asset quality concerns, managing concentrations of credit risk and ensuring sufficient liquidity at the Bank as a result of its own investigation as well as examinations performed by certain bank regulatoryagencies. In concert with the regulators, the Company has identified specific corrective steps and actions to enhance its risk management, asset qualityand liquidity policies, controls and procedures. The Company and the Bank may not declare or pay any cash dividends without the prior written approvalof their regulators.
O F F - B A L A N C E S H E E T A R R A N G E M E N T SThe Company is a party to off-balance-sheet arrangements in the normal course of business to meet the financing needs of its customers. The Companyuses the same credit policies in making commitments and conditional obligations as it does for on-balance-sheet arrangements. Since some of thecommitments and irrevocable letters of credit may expire without being drawn upon, the total amount does not necessarily represent future cash requirements. As discussed previously, the Company carefully monitors its liquidity needs and considers its cash requirements, especially for loan commitments, in making decisions on investments and obtaining funds from its other sources. Further information relating to off-balance-sheet instruments can be found in Note L to the Consolidated Financial Statements.

9
Q U A N T I T A T I V E A N D Q U A L I T A T I V E D I S C L O S U R E A B O U T M A R K E T R I S KMarket risk is the risk of loss arising from adverse changes in market prices and rates. Interest rate risk is the most significant market risk affecting theCompany. Other types of market risk, such as foreign currency exchange rate risk and commodity price risk, do not arise in the normal course of theCompany's business activities. Also, the Company does not currently, and has no plans to, engage in trading activities or use derivative or off-balancesheet instruments to manage interest rate risk.
The Company has risk management policies in place to monitor and limit exposure to market risk. The Asset/Liability Committee (“ ALCO Committee” ),whose members include the chief executive officer, the executive vice president, the chief credit officer, the chief financial officer and the investment officers of the bank subsidiary, is responsible for the day-to-day operating guidelines, approval of strategies affecting net interest income and coordination of activities within policy limits established by the Board of Directors based on the Company's tolerance for risk. Specifically, the key objectives of the Company's asset/liability management program are to manage the exposure of planned net interest margins to unexpected changesdue to interest rate fluctuations. These efforts will also affect loan pricing policies, deposit interest rate policies, asset mix and volume guidelines andliquidity. The ALCO Committee utilizes a number of tools in its activities, including software to assist with interest rate risk management and balance sheetmanagement. The ALCO Committee reports to the Board of Directors on a quarterly basis.
The Company has implemented a conservative approach to its asset/liability management. The net interest margin is managed on a daily basis largelyas a result of the management of the liquidity needs of the bank subsidiary. The Company generally follows a policy of investing in short term U.S. Agencysecurities with maturities of two years or more. Due to the low interest rate environment, the duration of investments has been extended to fifteen yearswith call provisions. The loan portfolio consists of a 40% /60% blend of fixed and floating rate loans. It is the general loan policy to offer loans with maturities of seven years or less; however the market is now dictating floating rate terms to be extended up to twenty years. On the liability side, morethan 75% of the deposits are demand and savings transaction accounts. Additionally, 85% of the certificates of deposit mature within eighteen months.Since the Company’ s deposits are generally not rate-sensitive, they are considered to be core deposits. The short term nature of the financial assets andliabilities allows the Company to meet the dual requirements of liquidity and interest rate risk management.
The interest rate sensitivity tables on the next page provide additional information about the Company's financial instruments that are sensitive tochanges in interest rates. The negative gap in 2015 is mitigated by the nature of the Company's deposits, whose characteristics have been previouslydescribed. The tabular disclosure reflects contractual interest rate repricing dates and contractual maturity dates. Loan maturities have been adjustedfor the allowance for loan losses. There have been no adjustments for such factors as prepayment risk, early calls of investments, the effect of the maturity of balloon notes or the early withdrawal of deposits. The Company does not believe that the aforementioned factors have a significant impacton expected maturity.
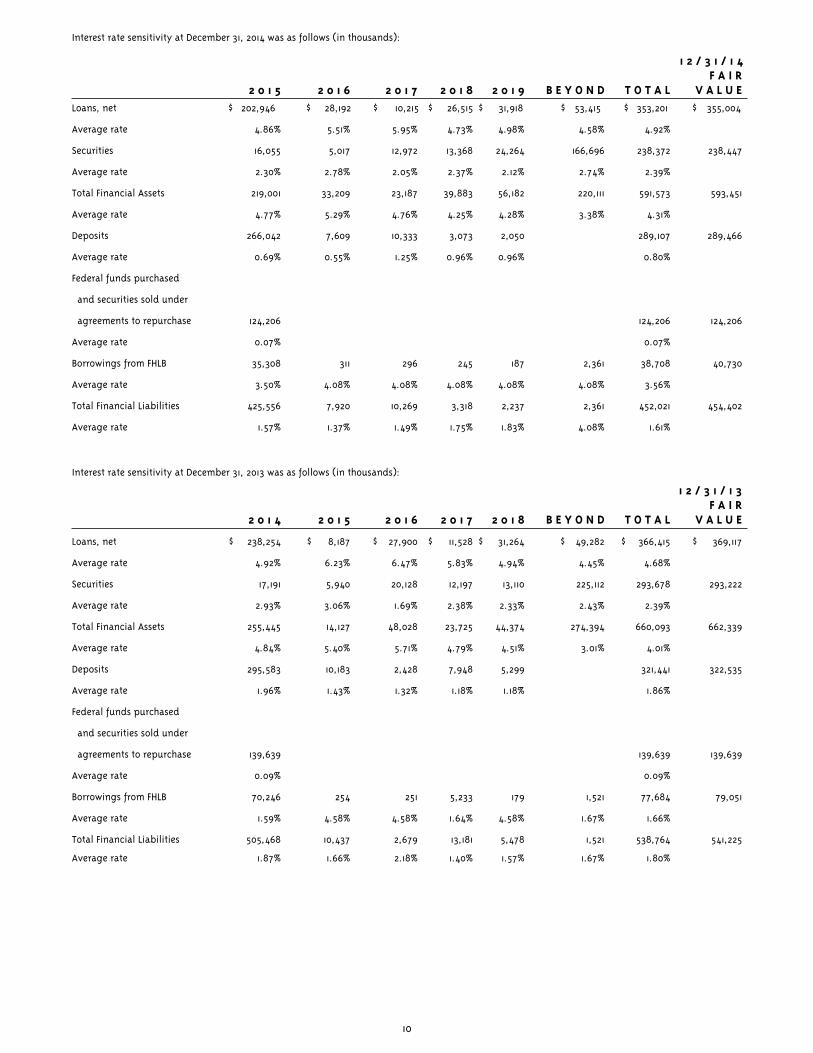
10
Interest rate sensitivity at December 31, 2014 was as follows (in thousands):
1 2 / 3 1 / 1 4F A I R
2 0 1 5 2 0 1 6 2 0 1 7 2 0 1 8 2 0 1 9 B E Y O N D T O T A L V A L U E Loans, net $ 202,946 $ 28,192 $ \ 10,215 $ \ 26,515 $ \\\31,918 $ \\ 53,415 $ 353,201 $ \\\355,004
Average rate 4.86% 5.51% 5.95% 4.73% 4.98% 4.58% 4.92%
Securities 16,055 5,017 12,972 13,368 24,264 166,696 238,372 238,447
Average rate 2.30% 2.78% 2.05% 2.37% 2.12% 2.74% 2.39%
Total Financial Assets 219,001 33,209 23,187 39,883 56,182 220,111 591,573 593,451
Average rate 4.77% 5.29% 4.76% 4.25% 4.28% 3.38% 4.31%
Deposits 266,042 7,609 10,333 3,073 2,050 289,107 289,466
Average rate 0.69% 0.55% 1.25% 0.96% 0.96% 0.80%
Federal funds purchased
and securities sold under
agreements to repurchase 124,206 124,206 124,206
Average rate 0.07% 0.07%
Borrowings from FHLB 35,308 311 296 245 187 2,361 38,708 40,730
Average rate 3.50% 4.08% 4.08% 4.08% 4.08% 4.08% 3.56%
Total Financial Liabilities 425,556 7,920 10,269 3,318 2,237 2,361 452,021 454,402
Average rate 1.57% 1.37% 1.49% 1.75% 1.83% 4.08% 1.61%
Interest rate sensitivity at December 31, 2013 was as follows (in thousands):
1 2 / 3 1 / 1 3 F A I R
2 0 1 4 2 0 1 5 2 0 1 6 2 0 1 7 2 0 1 8 B E Y O N D T O T A L V A L U E
Loans, net $ 238,254 $ 8,187 $ \\\\\ 27,900 $ \\\\ 11,528 $ \\ 31,264 $ \\\\ 49,282 $ \\\ 366,415 $ \\\ 369,117
Average rate 4.92% 6.23% 6.47% 5.83% 4.94% 4.45% 4.68%
Securities 17,191 5,940 20,128 12,197 13,110 225,112 293,678 293,222
Average rate 2.93% 3.06% 1.69% 2.38% 2.33% 2.43% 2.39%
Total Financial Assets 255,445 14,127 48,028 23,725 44,374 274,394 660,093 662,339
Average rate 4.84% 5.40% 5.71% 4.79% 4.51% 3.01% 4.01%
Deposits 295,583 10,183 2,428 7,948 5,299 321,441 322,535
Average rate 1.96% 1.43% 1.32% 1.18% 1.18% 1.86%
Federal funds purchased
and securities sold under
agreements to repurchase 139,639 139,639 139,639
Average rate 0.09% 0.09%
Borrowings from FHLB 70,246 254 251 5,233 179 1,521 77,684 79,051
Average rate 1.59% 4.58% 4.58% 1.64% 4.58% 1.67% 1.66%
Total Financial Liabilities 505,468 10,437 2,679 13,181 5,478 1,521 538,764 541,225
Average rate 1.87% 1.66% 2.18% 1.40% 1.57% 1.67% 1.80%

11
(In thousands except share data)
D E C E M B E R 3 1 , 2 0 1 4 2 0 1 3 2 0 1 2
Assets
Cash and due from banks $ \\\ 23,556 $ \\\\ 36,264 $ \\\\ 54,020
Available for sale securities 215,122 275,440 258,876
Held to maturity securities, fair value of
$17,859 - 2014; $10,686 - 2013;
$7,225 - 2012 17,784 11,142 7,125
Other investments 2,962 3,262 3,450
Federal Home Loan Bank Stock, at cost 2,504 3,834 2,380
Loans 362,407 375,349 431,083
Less: Allowance for loan losses 9,206 8,934 8,857
Loans, net 353,201 366,415 422,226
Bank premises and equipment, net of accumulated depreciation 23,784 25,308 26,222
Other real estate 7,646 9,630 7,008
Accrued interest receivable 2,125 2,607 2,895
Cash surrender value of life insurance 18,145 17,456 16,861
Other assets 2,066 10,906 3,849
Total assets $ \\\\ 668,895 $ \ 762,264 $ \\ 804,912
Liabilities and Shareholders’ Equity
Liabilities:
Deposits:
Demand, non-interest bearing $ \\\\ 103,607 $ \\ 107,117 $ \\\ 102,609
Savings and demand, interest bearing 212,534 217,005 232,401
Time, $100,000 or more 35,925 60,519 94,606
Other time deposits 40,648 43,917 46,103
Total deposits 392,714 428,558 475,719
Federal funds purchased and securities sold under
agreements to repurchase 124,206 139,639 194,234
Borrowings from Federal Home Loan Bank 38,708 77,684 7,912
Employee and director benefit plans liabilities 16,957 15,837 14,291
Other liabilities 1,359 1,399 2,002
Total liabilities 573,944 663,117 694,158
Shareholders’ Equity:
Common Stock, $1 par value, 15,000,000 shares
authorized, 5,123,186 shares issued and outstanding at
December 31, 2014 and 2013 and 5,136,918 at December 31, 2012 5,123 5,123 5,137
Surplus 65,780 65,780 65,780
Undivided profits 23,743 34,259 34,964
Accumulated other comprehensive income (loss), net of tax 305 (6,015) 4,873
Total shareholders’ equity 94,951 99,147 110,754
Total liabilities and shareholders’ equity $ \\\ 668,895 $ \ 762,264 $ \\ 804,912
See Notes to Consolidated Financial Statements.
C O N S O L I D A T E D S T A T E M E N T S O F C O N D I T I O N
P E O P L E S F I N A N C I A L C O R P O R A T I O N A N D S U B S I D I A R I E S

12
(in thousands except per share data)
Y E A R S E N D E D D E C E M B E R 3 1 , 2 0 1 4 2 0 1 3 2 0 1 2
Interest income:
Interest and fees on loans $ 16,055 $ |||\\\ 18,927 $ \ 18,577
Interest and dividends on securities:
U.S. Treasuries 587 590 463
U.S. Government agencies 3,027 3,114 3,777
Mortgage-backed securities 888 703 287
States and political subdivisions 1,560 1,524 1,493
Other investments 18 29 15
Interest on federal funds sold 21 69 16
Total interest income 22,156 24,956 24,628
Interest expense:
Deposits 1,111 1,098 1,500
Borrowings from Federal Home Loan Bank 230 191 232
Federal funds purchased and securities sold under agreements to repurchase 100 158 335
Total interest expense 1,441 1,447 2,067
Net interest income 20,715 23,509 22,561
Provision for allowance for loan losses 7,404 9,661 4,264
Net interest income after provision for allowance for loan losses 13,311 13,848 18,297
Non-interest income:
Trust department income and fees 1,463 1,423 1,458
Service charges on deposit accounts 5,900 6,236 5,911
Gain on liquidation, sales and calls of securities 99 258 1,364
Loss on impairment of other investments (360)
Income (loss) on other investments (64) 42 (84)
Increase in cash surrender value of life insurance 589 501 573
Other income 632 607 667
Total non-interest income 8,619 9,067 9,529
Non-interest expense:
Salaries and employee benefits 12,025 11,568 11,992
Net occupancy 2,480 2,415 2,434
Equipment rentals, depreciation and maintenance 3,054 2,878 3,106
Other expense 9,649 8,793 7,745
Total non-interest expense 27,208 25,654 25,277
Income (loss) before income taxes (5,278) (2,739) 2,549
Income tax (benefit) expense 4,726 (2,201) (92)
Net income (loss) $ \\\\ \\ (10,004) $ \ (538) $ \\\\ 2,641
Basic and diluted earnings (loss) per share $ \ \ (1.95) $ \\ (.10) $ \\\\\\\\ .51
Dividends declared per share $ \ \\ .10 $ \\\ \ \ $ \\\\ .20
See Notes to Consolidated Financial Statements.
C O N S O L I D A T E D S T A T E M E N T S O F O P E R A T I O N S
P E O P L E S F I N A N C I A L C O R P O R A T I O N A N D S U B S I D I A R I E S

13
(in thousands)
Y E A R S E N D E D D E C E M B E R 3 1 , 2 0 1 4 2 0 1 3 2 0 1 2
Net income (loss) $ \\\\ (10,004) $ \\\\ (538) $ \\\\ \\\ 2,641
Other comprehensive income
(loss), net of tax:
Net unrealized gain (loss) on
available for sale securities, net
of tax of $3,506, $5,153 and $440
for the years ended
December 31, 2014, 2013 and
2012, respectively 6,806 (10,002) 855
Reclassification adjustment for realized
gains on available for sale securities
called or sold in current year, net
of tax of $34, $88 and $464
for the years ended
December 31, 2014, 2013 and
2012, respectively (65) (170) (900)
Loss from unfunded post-
retirement benefit obligation, net
of tax of $217, $369 and
$137 for the years ended
December 31, 2014, 2013 and
2012, respectively (421) (716) (266)
Total other comprehensive income (loss) 6,320 (10,888) (311)
Total comprehensive income (loss) $ \\\ \\ (3,684) $ \\\\\\\\ (11,426) $ \ \\ 2,330
See Notes to Consolidated Financial Statements.
C O N S O L I D A T E D S T A T E M E N T S O F C O M P R E H E N S I V E I N C O M E ( L O S S )
P E O P L E S F I N A N C I A L C O R P O R A T I O N A N D S U B S I D I A R I E S

14
(in thousands except share and per share data)
N u m b e r o f
C o m m o n C o m m o n
S h a r e s S t o c k S u r p l u s
Balance, January 1, 2012 5,136,918 $ \\\\ 5,137 $ \ 65,780 \ \\\\ \\\
Net income
Other comprehensive loss, net of tax
Cash dividend ($.20 per share)
Balance, December 31, 2012 5,136,918 5,137 65,780
Net loss
Other comprehensive loss, net of tax
Retirement of stock (13,732) (14)
Balance, December 31, 2013 5,123,186 5,123 65,780
Net loss
Other comprehensive income, net of tax
Cash dividend ($.10 per share)
Balance, December 31, 2014 5,123,186 $ 5,123 $ \ 65,780 \\\ \\\
See Notes to Consolidated Financial Statements.
C O N S O L I D A T E D S T A T E M E N T S O F S H A R E H O L D E R S ’ E Q U I T Y
P E O P L E S F I N A N C I A L C O R P O R A T I O N A N D S U B S I D I A R I E S

15
A c c u m u l a t e d
O t h e r
U n d i v i d e d C o m p r e h e n s i v e
P r o f i t s I n c o m e ( L o s s ) T o t a l
\\\\ \ $ \ 33,351 $ \\\\ 5,184 $ \\\ 109,452
2,641 2,641
(311) (311)
(1,028) (1,028)
34,964 4,873 110,754
(538) (538)
(10,888) (10,888)
(167) (181)
34,259 (6,015) 99,147
(10,004) (10,004)
6,320 6,320
(512) (512)
\ $ 23,743 $ \\\ 305 $ \\\ 94,951
16
C O N S O L I D A T E D S T A T E M E N T S O F C A S H F L O W S
P E O P L E S F I N A N C I A L C O R P O R A T I O N A N D S U B S I D I A R I E S
(in thousands)
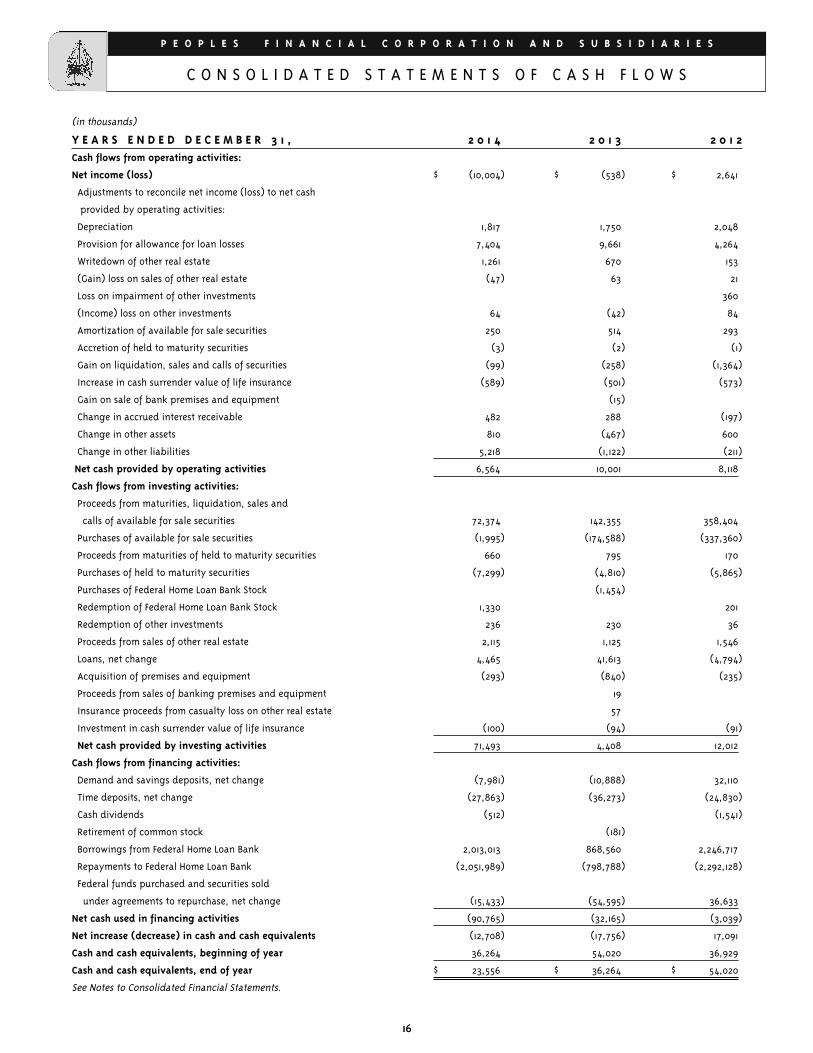
Y E A R S E N D E D D E C E M B E R 3 1 , 2 0 1 4 2 0 1 3 2 0 1 2Cash flows from operating activities:
Net income (loss) $ \\\ (10,004) $ \\ (538) $ \\\ 2,641
Adjustments to reconcile net income (loss) to net cash
provided by operating activities:
Depreciation 1,817 1,750 2,048
Provision for allowance for loan losses 7,404 9,661 4,264
Writedown of other real estate 1,261 670 153
(Gain) loss on sales of other real estate (47) 63 21
Loss on impairment of other investments 360
(Income) loss on other investments 64 (42) 84
Amortization of available for sale securities 250 514 293
Accretion of held to maturity securities (3) (2) (1)
Gain on liquidation, sales and calls of securities (99) (258) (1,364)
Increase in cash surrender value of life insurance (589) (501) (573)
Gain on sale of bank premises and equipment (15)
Change in accrued interest receivable 482 288 (197)
Change in other assets 810 (467) 600
Change in other liabilities 5,218 (1,122) (211)
Net cash provided by operating activities 6,564 10,001 8,118
Cash flows from investing activities:
Proceeds from maturities, liquidation, sales and
calls of available for sale securities 72,374 142,355 358,404
Purchases of available for sale securities (1,995) (174,588) (337,360)
Proceeds from maturities of held to maturity securities 660 795 170
Purchases of held to maturity securities (7,299) (4,810) (5,865)
Purchases of Federal Home Loan Bank Stock (1,454)
Redemption of Federal Home Loan Bank Stock 1,330 201
Redemption of other investments 236 230 36
Proceeds from sales of other real estate 2,115 1,125 1,546
Loans, net change 4,465 41,613 (4,794)
Acquisition of premises and equipment (293) (840) (235)
Proceeds from sales of banking premises and equipment 19
Insurance proceeds from casualty loss on other real estate 57
Investment in cash surrender value of life insurance (100) (94) (91)
Net cash provided by investing activities 71,493 4,408 12,012
Cash flows from financing activities:
Demand and savings deposits, net change (7,981) (10,888) 32,110
Time deposits, net change (27,863) (36,273) (24,830)
Cash dividends (512) (1,541)
Retirement of common stock (181)
Borrowings from Federal Home Loan Bank 2,013,013 868,560 2,246,717
Repayments to Federal Home Loan Bank (2,051,989) (798,788) (2,292,128)
Federal funds purchased and securities sold
under agreements to repurchase, net change (15,433) (54,595) 36,633
Net cash used in financing activities (90,765) (32,165) (3,039)
Net increase (decrease) in cash and cash equivalents (12,708) (17,756) 17,091
Cash and cash equivalents, beginning of year 36,264 54,020 36,929
Cash and cash equivalents, end of year $ \ 23,556 $ 36,264 $ 54,020
See Notes to Consolidated Financial Statements.
16

17
N O T E A - B U S I N E S S A N D S U M M A R Y O F S I G N I F I C A N T A C C O U N T I N G P O L I C I E S :
Business of The CompanyPeoples Financial Corporation (the “ Company” ) is a one-bank holding company headquartered in Biloxi, Mississippi. Its two operating subsidiaries areThe Peoples Bank, Biloxi, Mississippi (the “ Bank” ), and PFC Service Corp. Its principal subsidiary is the Bank, which provides a full range of banking,financial and trust services to state, county and local government entities and individuals and small and commercial businesses operating in those portions of Mississippi, Louisiana and Alabama which are within a fifty mile radius of the Waveland, Wiggins and Gautier branches, the Bank's three mostoutlying locations (the “ trade area” ).
Principles of ConsolidationThe consolidated financial statements include the accounts of the Company and its wholly-owned subsidiaries. All significant intercompany transactionsand balances have been eliminated in consolidation.
Basis of AccountingThe Company and its subsidiaries recognize assets and liabilities, and income and expense, on the accrual basis of accounting. The preparation of financial statements in conformity with accounting principles generally accepted in the United States of America (“ GAAP” ) requires Management to makeestimates and assumptions that affect the reported amounts of assets and liabilities and disclosure of contingent assets and liabilities at the date of thefinancial statements and the reported amounts of revenues and expenses during the reporting period. Actual results could differ from these estimates.Material estimates common to the banking industry that are particularly susceptible to significant change in the near term include, but are not limitedto, the determination of the allowance for loan losses, the valuation of other real estate acquired in connection with foreclosure or in satisfaction of loans,assumptions relating to employee and director benefit plan liabilities and valuation allowances associated with the realization of deferred tax assets,which are based on future taxable income.
New Accounting PronouncementsIn April 2014, the Financial Accounting Standards Board issued Accounting Standards Update (“ ASU” ) No. 2014-06, Technical Corrections andImprovements Related to Glossary Terms. This ASU added, deleted, corrected and modified terms in the Master Glossary of the Codification and was effective upon issuance. The adoption of this ASU did not have a material effect on the Company's financial position, results of operations or cash flows.
In August 2014, the FASB issued ASU No. 2014-14, Receivables – Troubled Debt Restructurings by Creditors (Subtopic 310-40): Classification of CertainGovernment-Guaranteed Mortgage Loans upon Foreclosure. This ASU requires that a mortgage loan be derecognized and a separate other receivable berecognized upon foreclosure if certain conditions are met. ASU No. 2014-14 is effective for annual periods and interim periods within those annual periods beginning after December 31, 2014. The adoption of this ASU is not expected to have a material effect on the Company's financial position, resultsof operations or cash flows.
In August 2014, the FASB issued ASU No. 2014-15, Presentation of Financial Statements – Going Concern (Subtopic 205-40): Disclosure of Uncertainties aboutan Entity's Ability to Continue as a Going Concern. This ASU defines management’s responsibility to evaluate whether there is substantial doubt about anorganization’s ability to continue as a going concern and to provide related footnote disclosures. ASU 2014-15 is effective for annual periods ending afterDecember 31, 2016, and interim periods within annual periods beginning after December 14, 2016. The adoption of this ASU is not expected to have a material effect on the Company's financial position, results of operations or cash flows.
Cash and Due from BanksThe Company is required to maintain average reserve balances in its vault or on deposit with the Federal Reserve Bank. The average amount of thesereserve requirements was approximately $417,000, $407,000 and $566,000 for the years ending December 31, 2014, 2013 and 2012, respectively.
SecuritiesThe classification of securities is determined by Management at the time of purchase. Securities are classified as held to maturity when the Company hasthe positive intent and ability to hold the security until maturity. Securities held to maturity are stated at amortized cost. Securities not classified as heldto maturity are classified as available for sale and are stated at fair value. Unrealized gains and losses, net of tax, on these securities are recorded inshareholders’ equity as accumulated other comprehensive income. The amortized cost of available for sale securities and held to maturity securities isadjusted for amortization of premiums and accretion of discounts to maturity, determined using the interest method. Such amortization and accretionis included in interest income on securities. A decline in the market value of any investment below cost that is deemed to be other-than-temporary ischarged to earnings for the decline in value deemed to be credit related and a new cost basis in the security is established. The decline in value attributed to non-credit related factors is recognized in other comprehensive income. In estimating other-than-temporary losses, management considers the length of time and the extent to which the fair value has been less than cost, the financial condition and nature of the issuer, the cause ofthe decline, especially if related to a change in interest rates, and the intent and ability of the Company to retain the investment in the issuer for a period of time sufficient to allow for any anticipated recovery in fair value. The specific identification method is used to determine realized gains andlosses on sales of securities, which are reported as gain (loss) on sales and calls of securities in non-interest income.
Other InvestmentsOther investments include a low income housing partnership in which the Company is a 99% limited partner. The partnership has qualified to receiveannual low income housing federal tax credits that are recognized as a reduction of the current tax expense. The investment is accounted for using theequity method.
Federal Home Loan Bank StockThe Company is a member of the Federal Home Loan Bank of Dallas (“ FHLB” ) and as such is required to maintain a minimum investment in its stock thatvaries with the level of FHLB advances outstanding. The stock is bought from and sold to the FHLB based on its $100 par value. The stock does not have areadily determinable fair value and as such is classified as restricted stock, carried at cost and evaluated for impairment in accordance with GAAP.
LoansThe loan portfolio consists of commercial and industrial and real estate loans within the Company's trade area that we have the intent and ability to holdfor the foreseeable future or until maturity. The loan policy establishes guidelines relating to pricing; repayment terms; collateral standards includingloan to value limits, appraisal and environmental standards; lending authority; lending limits and documentation requirements.
Loans are stated at the amount of unpaid principal, reduced by unearned income and the allowance for loan losses. Interest on loans is recognized on adaily basis over the terms of each loan based on the unpaid principal balance. Loan origination fees are recognized as income when received. Revenuefrom these fees is not material to the financial statements.
P E O P L E S F I N A N C I A L C O R P O R A T I O N A N D S U B S I D I A R I E S
N O T E S T O C O N S O L I D A T E D F I N A N C I A L S T A T E M E N T S

18
The Company continuously monitors its relationships with its loan customers in concentrated industries such as gaming and hotel/motel, as well as theexposure for out of area, land development, construction and commercial real estate loans, and their direct and indirect impact on its operations. Loandelinquencies and deposit overdrafts are monitored on a weekly basis in order to identify developing problems as early as possible. On a monthly basis,a watch list of credits based on our loan grading system is prepared. Grades of A – F are applied to individual loans based on factors including repayment ability, financial condition of the borrower and payment performance. Loans with a grade of D – F, as well as some loans with a grade of C,are placed on the watch list of credits. The watch list is the primary tool for monitoring the credit quality of the loan portfolio. Once loans are determinedto be past due, the loan officer and the special assets department work vigorously to return the loans to a current status.
The Company places loans on a nonaccrual status when, in the opinion of Management, they possess sufficient uncertainty as to timely collection of interest or principal so as to preclude the recognition in reported earnings of some or all of the contractual interest. Accrued interest on loans classifiedas nonaccrual is reversed at the time the loans are placed on nonaccrual. Interest received on nonaccrual loans is applied against principal. Loans arerestored to accrual status when the obligation is brought current or has performed in accordance with the contractual terms for a reasonable period oftime and the ultimate collectibility of the total contractual principal and interest is no longer in doubt. The placement of loans on and removal of loansfrom nonaccrual status must be approved by Management.
Loans which become 90 days delinquent are reviewed relative to collectibility. Unless such loans are in the process of terms revision to bring them to acurrent status or foreclosure or in the process of collection, these loans are placed on nonaccrual and, if deemed uncollectible, are charged off againstthe allowance for loan losses. That portion of a loan which is deemed uncollectible will be charged off against the allowance as a partial charge off. Allcharge offs must be approved by Management and are reported to the Board of Directors.
Allowance for Loan LossesThe allowance for loan losses (“ ALL” ) is a valuation account available to absorb losses on loans. The ALL is established through provisions for loan lossescharged against earnings. Loans deemed to be uncollectible are charged against the ALL, and subsequent recoveries, if any, are credited to the allowance.
The ALL is based on Management's evaluation of the loan portfolio under current economic conditions and is an amount that Management believes willbe adequate to absorb probable losses on loans existing at the reporting date. On a quarterly basis, the Company's problem asset committee meets toreview the watch list of credits, which is formulated from the loan grading system. Members of this committee include loan officers, collection officers,the special assets director, the chief lending officer, the chief credit officer, the chief financial officer and the chief executive officer. The evaluationincludes Management's assessment of several factors: review and evaluation of specific loans, changes in the nature and volume of the loan portfolio,current and anticipated economic conditions and the related impact on specific borrowers and industry groups, a study of loss experience, a review ofclassified, nonperforming and delinquent loans, the estimated value of any underlying collateral, an estimate of the possibility of loss based on the riskcharacteristics of the portfolio, adverse situations that may affect the borrower's ability to repay and the results of regulatory examinations. This evaluation is inherently subjective as it requires material estimates that may be susceptible to significant change.
The ALL consists of specific and general components. The specific component relates to loans that are classified as impaired. The general component ofthe allowance relates to loans that are not impaired. Changes to the components of the ALL are recorded as a component of the provision for the allowancefor loan losses. Management must approve changes to the ALL and must report its actions to the Board of Directors. The Company believes that itsallowance for loan losses is appropriate at December 31, 2014.
The Company considers a loan to be impaired when, based upon current information and events, it believes it is probable that the Company will be unableto collect all amounts due according to the contractual terms of the loan agreement. The Company's impaired loans include troubled debt restructurings and performing and non-performing major loans for which full payment of principal or interest is not expected. Payments received forimpaired loans not on nonaccrual status are applied to principal and interest.
All impaired loans are reviewed, at a minimum, on a quarterly basis. The Company calculates the specific allowance required for impaired loans basedon the present value of expected future cash flows discounted at the loan's effective interest rate, the loan's observable market price or the fair value ofits collateral. Most of the Company's impaired loans are collateral-dependent.
The fair value of the collateral for collateral-dependent loans is based on appraisals performed by third-party valuation specialists, comparable sales andother estimates of fair value obtained principally from independent sources such as the Multiple Listing Service or county tax assessment valuations,adjusted for estimated selling costs. The Company has a Real Estate Appraisal Policy (the “ Policy” ) which is in compliance with the guidelines set forthin the “ Interagency Appraisal and Evaluation Guidelines” which implement Title XI of the Financial Institutions Reform, Recovery and Enforcement Act of1989 (“ FIRREA” ) and the revised “ Interagency Appraisal and Evaluation Guidelines” issued in 2010. The Policy further requires that appraisals be in writing and conform to the Uniform Standards of Professional Appraisal Practice (“ USPAP” ). An appraisal prepared by a state-licensed or state-certifiedappraiser is required on all new loans secured by real estate in excess of $250,000. Loans secured by real estate in an amount of $250,000 or less, or thatqualify for an exemption under FIRREA, must have a summary appraisal report or in-house evaluation, depending on the facts and circumstances. Factorsincluding the assumptions and techniques utilized by the appraiser, which could result in a downward adjustment to the collateral value estimates indicated in the appraisal, are considered by the Company.
When Management determines that a loan is impaired and the loan is collateral-dependent, an evaluation of the fair value of the collateral is performed.The Company maintains established criteria for assessing whether an existing appraisal continues to reflect the fair value of the property for collateral-dependent loans. Appraisals are generally considered to be valid for a period of at least twelve months. However, appraisals that are less than12 months old may need to be adjusted. Management considers such factors as the property type, property condition, current use of the property, current market conditions and the passage of time when determining the relevance and validity of the most recent appraisal of the property. IfManagement determines that the most recent appraisal is no longer valid, a new appraisal is ordered from an independent and qualified appraiser.
During the interim period between ordering and receipt of the new appraisal, Management considers if the existing appraisal should be discounted todetermine the estimated fair value of collateral. Discounts are applied to the existing appraisal and take into consideration the property type, conditionof the property, external market data, internal data, reviews of recently obtained appraisals and evaluations of similar properties, comparable sales ofsimilar properties and tax assessment valuations. When the new appraisal is received and approved by Management, the valuation stated in the appraisal is used as the fair value of the collateral in determining impairment, if any. If the recorded investment in the impaired loan exceeds the measure of fair value, a valuation allowance is required as a specific component of the allowance for loan losses. Any specific reserves recorded in theinterim are adjusted accordingly.
The general component of the ALL is the loss estimated by applying historical loss percentages to non-classified loans which have been divided into segments. These segments include gaming; residential and land development, real estate, construction; real estate, mortgage; commercial and industrial and all other. The loss percentages are based on each segment's historical five year average loss experience which may be adjusted by qualitative factors such as changes in the general economy, or economy or real estate market in a particular geographic area or industry.

19
Bank Premises and EquipmentBank premises and equipment are stated at cost, less accumulated depreciation. Depreciation is computed by the straight-line method based on the estimated useful lives of the related assets.
Other Real EstateOther real estate (“ ORE” ) includes real estate acquired through foreclosure. Each other real estate property is carried at fair value, less estimated costs tosell. Fair value is principally based on appraisals performed by third-party valuation specialists. Any excess of the carrying value of the related loan overthe fair value of the real estate at the date of foreclosure is charged against the ALL. Any expense incurred in connection with holding such real estate orresulting from any writedowns in value subsequent to foreclosure is included in non-interest expense. When the other real estate property is sold, a gainor loss is recognized on the sale for the difference, if any, between the sales proceeds and the carrying amount of the property. If the fair value of theORE, less estimated costs to sell at the time of foreclosure, decreases during the holding period, the ORE is written down with a charge to non-interestexpense. Generally, ORE properties are actively marketed for sale and Management is continuously monitoring these properties in order to minimize any losses.
Trust Department Income and FeesCorporate trust fees are accounted for on an accrual basis and personal trust fees are recorded when received.
Income TaxesDeferred tax assets and liabilities are recognized for the future tax consequences attributable to differences between the financial statement carryingamounts of existing assets and liabilities and their respective tax bases. Additionally, the recognition of future tax benefits, such as net operating losscarry forwards, is required to the extent that realization of such benefits is more likely than not. Deferred tax assets and liabilities are measured usingenacted tax rates expected to apply to taxable income in the years in which the assets and liabilities are expected to be recovered or settled. The effecton deferred tax assets and liabilities of a change in tax rates is recognized in income tax expense in the period that includes the enactment date.
In the event the future tax consequences of differences between the financial reporting bases and the tax bases of the Company's assets and liabilitiesresults in deferred tax assets, an evaluation of the probability of being able to realize the future benefits indicated by such asset is required. A valuationallowance is provided for the portion of the deferred tax asset when it is more likely than not that some portion or all of the deferred tax asset will not berealized. In assessing the realizability of the deferred tax assets, management considers the scheduled reversals of deferred tax liabilities, projected futuretaxable income and tax planning strategies. The Company currently evaluates income tax positions judged to be uncertain. A loss contingency reserveis accrued if it is probable that the tax position will be challenged, it is probable that the future resolution of the challenge will confirm that a loss hasbeen incurred and the amount of such loss can be reasonably estimated.
Post-Retirement Benefit PlanThe Company accounts for its post-retirement benefit plan under Accounting Standards Codification (“ Codification” or “ ASC” ) Topic 715, RetirementBenefits (“ ASC 715” ). The under or over funded status of the Company's post-retirement benefit plan is recognized as a liability or asset in the statementof condition. Changes in the plan's funded status are reflected in other comprehensive income. Net actuarial gains and losses and adjustments to priorservice costs that are not recorded as components of the net periodic benefit cost are charged to other comprehensive income.
Earnings Per ShareBasic and diluted earnings per share are computed on the basis of the weighted average number of common shares outstanding, 5,123,186 in 2014,5,128,889 in 2013 and 5,136,918, in 2012.
Accumulated Other Comprehensive Income (Loss)At December 31, 2014, 2013 and 2012, accumulated other comprehensive income (loss) consisted of net unrealized gains (losses) on available for sale securities and over (under) funded liabilities related to the Company's post-retirement benefit plan.
Statements of Cash FlowsThe Company has defined cash and cash equivalents to include cash and due from banks and federal funds sold. The Company paid $1,447,133, $1,470,945 and$2,082,914 in 2014, 2013 and 2012, respectively, for interest on deposits and borrowings. Income tax payments totaled $320,000, $810,000 and $835,000 in 2014, 2013and 2012, respectively. Loans transferred to other real estate amounted to $1,345,170, $4,536,710 and $2,575,520 in 2014, 2013 and 2012, respectively. Dividendspayable of $513,692 as of December 31, 2011 were paid during the year ended December 31, 2012.
Fair Value MeasurementThe Company reports certain assets and liabilities at their estimated fair value. These assets and liabilities are classified and disclosed in one of three cat-egories based on the inputs used to develop the measurements. The categories establish a hierarchy for ranking the quality and reliability of the infor-mation used to determine fair value.
ReclassificationCertain reclassifications have been made to the prior year statements to conform to current year presentation. The reclassifications had no effect on prioryear net income.
20
N O T E B - S E C U R I T I E S :
The amortized cost and fair value of securities at December 31, 2014, 2013 and 2012, respectively, are as follows (in thousands):
Gross Gross
December 31, 2014 Amortized Cost Unrealized Gains Unrealized Losses Fair Value
Available for sale securities:
Debt securities:
U.S. Treasuries $ 29,787 $ \\\ 27 $ (160) $ \ 29,654
U.S. Government agencies 119,805 115 (1,931) 117,989
Mortgage-backed securities 35,671 282 (136) 35,817
States and political subdivisions 29,832 1,180 31,012
Total debt securities 215,095 1,604 (2,227) 214,472
Equity securities 650 650
Total available for sale securities $ 215,745 $ \\\ 1,604 $\\\ \\\\\(2,227) $ \ 215,122
Held to maturity securities:
States and political subdivisions $ 17,784 $ 132 $ \\\ (57) $ 17,859
Total held to maturity securities $ 17,784 $ 132 $ \ (57) $ \\ 17,859
Gross Gross
December 31, 2013 Amortized Cost Unrealized Gains Unrealized Losses Fair Value
Available for sale securities:
Debt securities:
U.S. Treasuries $ \\\\\ 44,636 $\\\\ 54 $\\ (1,042) $\\\ 43,648
U.S. Government agencies 155,772 734 (10,701) 145,805
Mortgage-backed securities 51,454 141 (1,269) 50,326
States and political subdivisions 33,764 1,248 (1) 35,011
Total debt securities 285,626 2,177 (13,013) 274,790
Equity securities 650 650
Total available for sale securities $ 286,276 $ \\ 2,177 $\\ (13,013) $ 275,440
Held to maturity securities:
States and political subdivisions $ 11,142 $ \\\ 13 $ (469) $ \\ 10,686
Total held to maturity securities $ 11,142 $ \\\ 13 $ (469) $ 10,686
Gross Gross
December 31, 2012 Amortized Cost Unrealized Gains Unrealized Losses Fair Value
Available for sale securities:
Debt securities:
U.S. Treasuries $ 53,661 $ 490 $ (55)– $ 54,096
U.S. Government agencies 147,652 1,810 (364) 149,098
Mortgage-backed securities 16,903 538 17,441
States and political subdivisions 35,433 2,158 37,591
Total debt securities 253,649 4,996 (419) 258,226
Equity securities 650 650
Total available for sale securities $ 254,299 $\\\\ 4,996 $ (419) $ 258,876
Held to maturity securities:
States and political subdivisions $ 7,125 $ 112 $ (12) $ 7,225
Total held to maturity securities $ 7,125 $ 112 $ (12) $ 7,225

21
The amortized cost and fair value of debt securities at December 31, 2014, (in thousands) by contractual maturity, are shown below. Expected maturitieswill differ from contractual maturities because borrowers may have the right to call or prepay obligations with or without call or prepayment penalties.
Amortized Cost Fair Value
Available for sale securities:
Due in one year or less $ \\\\ 5,715 $\\\\ 5,762
Due after one year through five years 61,539 61,738
Due after five years through ten years 52,867 52,627
Due after ten years 59,303 58,528
Mortgage-backed securities 35,671 35,817
Totals $ \\\\\ 215,095 $ \\\214,472
Held to maturity securities:
Due in one year or less $ \\\ 211 $ \\\\ 211
Due after one year through five years 3,964 3,976
Due after five years through ten years 8,118 8,179
Due after ten years 5,491 5,493
Totals $ \\ 17,784 $ \\\\17,859
Available for sale and held to maturity securities with gross unrealized losses at December 31, 2014, 2013 and 2012, aggregated by investment category andlength of time that individual securities have been in a continuous loss position, are as follows (in thousands):
Less Than Twelve Months Over Twelve Months Total
December 31, 2014: Fair Value Gross Unrealized Losses Fair Value Gross Unrealized Losses Fair Value Gross Unrealized Losses
U.S. Treasuries $ \\ 4,968 $ \\\ 15 $\\\\\ 14,795 $ 145 $ \ 19,763 $ 160
U.S. Government agencies 9,954 22 92,923 1,909 102,877 1,931
Mortgage-backed securities 19,436 136 19,436 136
States and political subdivisions 5,485 32 1,444 25 6,929 57
Total $ 20,407 $ \ 69 $ \\128,598 $ \\2,215 $ 149,005 $ 2,284
Less Than Twelve Months Over Twelve Months Total
December 31, 2013: Fair Value Gross Unrealized Losses Fair Value Gross Unrealized Losses Fair Value Gross Unrealized Losses
U.S. Treasuries $ 29,708 $ 1,042 $ 2,826 $ 826 $ 29,708 $ 1,042
U.S. Government agencies 113,446 10,322 4,621 379 118,067 10,701
Mortgage-backed securities 44,269 1,269 44,269 1,269
States and political subdivisions 7,690 470 7,690 470
Total $ 195,113 $ 13,103 $ 4,621 $ 379 $ 199,734 $ 13,482
Less Than Twelve Months Over Twelve Months Total
December 31, 2012: Fair Value Gross Unrealized Losses Fair Value Gross Unrealized Losses Fair Value Gross Unrealized Losses
U.S. Treasuries $ 9,887 $ 55 $ 2,826 $ 254 $ 9,887 $ 55
U.S. Government agencies 30,335 364 30,335 364
States and political subdivisions 1,451 12 1,451 12
Total $ 41,673 $ 431 $ 41,67 $ 41, $ 41,673 $ 431
At December 31, 2014, 4 of the 8 securities issued by the U.S. Treasury, 19 of the 24 securities issued by U.S. Government agencies, 5 of the 10 mortgage-backed securities and 20 of the 152 securities issued by states and political subdivisions contained unrealized losses.
Management evaluates securities for other-than-temporary impairment on a monthly basis. In performing this evaluation, the length of time and theextent to which the fair value has been less than cost, the fact that the Company's securities are primarily issued by U.S. Treasury and U.S. GovernmentAgencies and the cause of the decline in value are considered. In addition, the Company does not intend to sell and it is not more likely than not that wewill be required to sell these securities before maturity. While some available for sale securities have been sold for liquidity purposes or for gains, theCompany has traditionally held its securities, including those classified as available for sale, until maturity. As a result of this evaluation, the Companyhas determined that the declines summarized in the tables above are not deemed to be other-than-temporary.
Proceeds from sales of available for sale debt securities were $44,279,605, $26,075,225 and $77,605,104 during 2014, 2013 and 2012, respectively. Availablefor sale debt securities were sold and called for realized gains of $98,859, $257,997 and $1,363,802 during 2014, 2013 and 2012, respectively. The Company recorded a loss from the impairment of its other investments of $360,000 in 2012.
Securities with a fair value of $200,474,637, $262,830,011 and $241,879,775 at December 31, 2014, 2013 and 2012, respectively, were pledged to securepublic deposits, federal funds purchased and other balances required by law.

22
N O T E C - L O A N S :
The composition of the loan portfolio at December 31, 2014, 2013 and 2012 is as follows (in thousands):
December 31, 2014 2013 2012
Gaming $ \\\\\\\\\\\\\ 31,353 $ 29,570 $ \\\\ 60,187
Residential and land development 10,119 19,403 27,338
Real estate, construction 34,010 44,987 52,586
Real estate, mortgage 240,341 237,158 246,420
Commercial and industrial 31,906 35,007 35,004
Other 14,678 9,224 9,548
Total $ \\\ 362,407 $ 375,349 $ \\\\ 431,083
In the ordinary course of business, the Company's bank subsidiary extends loans to certain officers and directors and their personal business interests at,in the opinion of Management, the same terms, including interest rates and collateral, as those prevailing at the time for comparable loans of similar credit risk with persons not related to the Company or its subsidiaries. These loans do not involve more than normal risk of collectibility and do not includeother unfavorable features. An analysis of the activity with respect to such loans to related parties is as follows (in thousands):
Years Ended December 31, 2014 2013 2012Balance, January 1 $ 6,761 $ \ 6,310 $ 5,681New loans and advances 2,516 1,647 3,755Repayments (1,517) (1,196) (3,126)Balance, December 31 $ \\ 7,760 $\\\ 6,761 $ 6,310
As part of its evaluation of the quality of the loan portfolio, Management monitors the Company's credit concentrations on a monthly basis. Total outstanding concentrations were as follows (in thousands):
December 31, 2014 2013 2012
Gaming $ 31,353 $ \\ 29,570 $ \\\\\\\\ 60,187
Hotel/motel 47,144 49,842 52,776
Out of area 19,179 24,945 25,413
The age analysis of the loan portfolio, segregated by class of loans, as of December 31, 2014, 2013 and 2012 is as follows (in thousands):
Loans Past DueGreater Than
Number of Days Past Due 90 Days And Still 30-59 60-89 Greater Than 90 Total Past Due Current Total Loans Accruing
December 31, 2014:Gaming $ 2222 $9,205 $5 7,219 $5 7,219 $ 31,353 $ \\\\\\ 31,353 $ 205Residential and land development 5,262 5,262 4,857 10,119Real estate, construction 1,665 85 1,944 3,694 30,316 34,010 30Real estate, mortgage 3,502 3,101 12,007 18,610 221,731 240,341 733Commercial and industrial 909 7 205 1,121 30,785 31,906Other 168 10 178 14,500 14,678Total $6,244 $3,203 $19,418 $28,865 $333,542 $ \\362,407 $ 763
December 31, 2013:Gaming $ 2222 $9,205 $ $ $ 29,570 $ 29,570 $ ,205Residential and land development 51 13,572 13,623 5,780 19,403Real estate, construction 3,846 9,452 13,298 31,689 44,987 146Real estate, mortgage 6,910 2,684 5,134 14,728 222,430 237,158 505Commercial and industrial 1,192 1,192 33,815 35,007Other 227 5 232 8,992 9,224Total $ 12,226 $2,689 $ 28,158 $43,073 $332,276 $ \\\375,349 $ 651
December 31, 2012:Gaming $9 ,̃ \205 $ 1,721 $\\ 9,205 $ 1,721 $ 58,466 $ \\\\\\\\\ 60,187 $ ,205Residential and land development 5,765 5,765 21,573 27,338Real estate, construction 3,989 878 6,151 11,018 41,568 52,586 572Real estate, mortgage 12,012 2,702 7,605 22,319 224,101 246,420 872Commercial and industrial 1,804 79 107 1,990 33,014 35,004Other 127 26 1 154 9,394 9,548 1Total $ 17,932 $5,406 $ \\\19,629 $42,967 $ 388,116 $ \\\\\\431,083 $1,445

23
The Company monitors the credit quality of its loan portfolio through the use of a loan grading system. A score of 1 – 5 is assigned to the loan based on factorsincluding repayment ability, trends in net worth and/or financial condition of the borrower and guarantors, employment stability, management ability, loan tovalue fluctuations, the type and structure of the loan, conformity of the loan to bank policy and payment performance. Based on the total score, a loan grade ofA - F is applied. A grade of A will generally be applied to loans for customers that are well known to the Company and that have excellent sources of repayment. Agrade of B will generally be applied to loans for customers that have excellent sources of repayment which have no identifiable risk of collection. A grade of C willgenerally be applied to loans for customers that have adequate sources of repayment which have little identifiable risk of collection. Loans with a grade of C maybe placed on the watch list if weaknesses are not resolved which could result in potential loss or for other circumstances that require monitoring. A grade of D willgenerally be applied to loans for customers that are inadequately protected by current sound net worth, paying capacity of the borrower, or pledged collateral.Loans with a grade of D have unsatisfactory characteristics such as cash flow deficiencies, bankruptcy filing by the borrower or dependence on the sale of collateral for the primary source of repayment, causing more than acceptable levels of risk. Loans 60 to 89 days past due receive a grade of D. A grade of E willgenerally be applied to loans for customers with weaknesses inherent in the D classification and in which collection or liquidation in full is questionable. In addition, on a monthly basis the Company determines which loans are 90 days or more past due and assigns a grade of E to them. A grade of F is applied to loanswhich are considered uncollectible and of such little value that their continuance in an active bank is not warranted. Loans with this grade are charged off, eventhough partial or full recovery may be possible in the future.
An analysis of the loan portfolio by loan grade, segregated by class of loans, as of December 31, 2014, 2013 and 2012 is as follows (in thousands):Loans With A Grade Of:
December 31, 2014: A or B C D E F TotalGaming $\\\\\ \ 8,400 $\9 \\\ 22,953 $ 33,077 $ \\\\\ x,xxx $ \56 56 $ 31,353Residential and land development 3,520 1,319 17 5,263 10,119Real estate, construction 27,474 723 2,496 3,317 34,010Real estate, mortgage 197,086 4,051 16,591 22,613 240,341Commercial and industrial 26,877 25 1,579 3,425 31,906Other 14,583 6 89 x,xxx 14,678Total $ \\\ 277,940 $ \\\\ 29,077 $ 20,772 $ 34,618 $ $ \\ 362,407
December 31, 2013:Gaming $ 23,975 $ \\ 2,500 $ 9, 5 $ 3,095 $9\, 5 $\\\ 29,570Residential and land development 4,236 1,544 51 13,572 19,403Real estate, construction 38,808 781 2,220 3,178 44,987Real estate, mortgage 204,569 4,495 17,852 10,242 237,158Commercial and industrial 31,902 682 2,402 21 35,007Other 9,131 24 50 19 9,224Total $ \\\\ 312,621 $ \ 10,026 $ \\\\ 22,575 $\\\ 30,127 $ \\\\\\\bn $ 375,349
December 31, 2012:Gaming $\\\\ 27,530 $ \ 12,300 $ 4,108 $ \ 16,249 $ \ 756 $\\\\\ 60,187Residential and land development 4,630 1,544 81 21,083 27,338Real estate, construction 43,318 1,001 2,701 5,566 52,586Real estate, mortgage 209,479 3,093 21,167 12,681 246,420Commercial and industrial 32,036 442 2,312 214 35,004Other 9,449 27 72 9,548Total $ \\\\\ 326,442 $ \ 18,407 $ 30,441 $\\\ 55,793 $ \ 756 $ 431,083
A loan may be impaired but not on nonaccrual status when the loan is well secured and in the process of collection. Total loans on nonaccrual as ofDecember 31, 2014, 2013 and 2012 are as follows (in thousands):
December 31, 2014 2013 2012Gaming $ \\ x,xxx $ 1,223 $ \\ 16,249Residential and land development 8,233 13,572 21,083Real estate, construction 3,287 2,588 5,171Real estate, mortgage 21,398 8,788 11,174Commercial and industrial 380 2013 214Total $ 33,298 $ \26,171 $ \\\ 53,891
The Company has modified certain loans by granting interest rate concessions to these customers. These loans are in compliance with their modified terms,are currently accruing and the Company has classified them as troubled debt restructurings. Troubled debt restructurings as of December 31, 2014, 2013and 2012, were as follows (in thousands except for number of contracts):
Pre-Modification Post-ModificationNumber of Outstanding OutstandingNumber of Recorded Recorded Related
Contracts Investment Investment AllowanceDecember 31, 2014:Real estate, mortgage 2 $ \\\837 $ \\ 837 $ \50Total 2 $ \\\837 $ \\ 837 $ \\\\ \\\ 50
December 31, 2013:Real estate, construction 2 $ \ 891 $ \ 891 $\\\ 270 Real estate, mortgage 6 10,012 10,012 994 Commercial and industrial 1 678 678Total 9 $ \\11,581 $ \\\\\\\\\\\11,581 $ \1,264
December 31, 2012:Real estate, construction 3 $ \\\\\\ 1,095 $ \1,095 $ \ 340 Real estate, mortgage 3 9,054 9,054 957Commercial and industrial 1 702 702Total 7 $ \\\\\\10,851 $ \\\\ \10,851 $ \\\\\\1,297
During 2013, the Company classified four additional loans as troubled debt restructurings. The loans are included in the real estate, mortgage segmentand had a total balance of $1,652,903 when they were modified. During 2013, two loans which had been classified as troubled debt restructurings at

December 31, 2012 became in default of their modified terms and were placed on nonaccrual. These loans included one loan that was included in the realestate, construction segment with a balance of $182,164 and one loan that was included in the real estate, mortgage segment with a balance of $527,677as of December 31, 2012. During 2014, seven loans which had been classified as troubled debt restructurings at December 31, 2013 became in default oftheir modified terms and were placed on nonaccrual. These loans included two loans that were included in the real estate, construction segment with atotal balance of $891,782, four loans that were included in the real estate, mortgage segment with a total balance of $9,136,954 and one loan that was included in the commercial and industrial segment with a balance of $677,901 as of December 31, 2013.
Impaired loans, which include loans classified as nonaccrual and troubled debt restructurings, segregated by class of loans, as of December 31, 2014, 2013and 2012 were as follows (in thousands):
Unpaid Recorded Related Average Recorded Interest IncomePrincipal Balance Investment Allowance Investment Recognized
December 31, 2014:With no related allowance recorded:
Residential and land development $ \\\ \\9,513 $ 8,233 $ \\\\ l $\\\\\\\\\\8,380 $ gReal estate, construction 2,198 2,178 2,222Real estate, mortgage 19,517 16,243 18,258 26Commercial and industrial 380 380 384
Total 31,608 27,034 29,244 26
With a related allowance recorded:Real estate, construction 1,109 1,109 422 1,115Real estate, mortgage 6,591 5,992 2,135 5,996 9
Total 7,700 7,101 2,557 7,111 9
Total by class of loans:Residential and land development 9,513 8,233 8,380Real estate, construction 3,307 3,287 422 3,337Real estate, mortgage 26,108 22,235 2,135 24,254 35Commercial and industrial 380 380 384
Total $ \\\39,308 $\\\\\\34,135 $2,557 $\\\36,355 $ 35
December 31, 2013:With no related allowance recorded:
Residential and land development $ \\ 4,425 $ 4,425 $0000 $\\\\\\\\\\\4,465 $\\\\\\\000Real estate, construction 2,294 2,294 2,054 26Real estate, mortgage 9,722 9,123 9,097 26Commercial and industrial 678 678 689 24
Total 17,119 16,520 16,305 76With a related allowance recorded:
Gaming 1,698 1,223 626 1,316Residential and land development 17,576 9,147 471 15,909Real estate, construction 1,185 1,185 337 1,239 23Real estate, mortgage 9,677 9,677 1,110 8,801 306
Total 30,136 21,232 2,544 27,265 329
Total by class of loans:Gaming 1,698 1,223 626 1,316Residential and land development 22,001 13,572 471 20,374Real estate, construction 3,479 3,479 337 3,293 49Real estate, mortgage 19,399 18,800 1,110 17,898 332Commercial and industrial 678 678 689 24
Total $ \\\47,255 $\\\37,752 $2,544 $\\\43,570 $ \\\\405
December 31, 2012:With no related allowance recorded:
Gaming $ 14,528 $ 14,528 $3,028 $ 14,869 $\\\\\\\000Residential and land development 21,837 20,733 21,288Real estate, construction 4,635 4,580 3,833Real estate, mortgage 9,971 9,935 9,821Commercial and industrial 892 892 791 23
Total 51,863 50,668 g 50,602 23
With a related allowance recorded:Gaming 1,721 1,721 1,100Residential and land development 350 350 70 350Real estate, construction 1,694 1,686 663 1,314 8Real estate, mortgage 10,893 10,293 1,229 10,199 319Commercial and industrial 24 24 12
Total 14,682 14,074 3,074 11,863 327
Total by class of loans:Gaming 16,249 16,249 1,100 14,869Residential and land development 22,187 21,083 70 21,638Real estate, construction 6,329 6,266 663 5,147 8Real estate, mortgage 20,864 20,228 1,229 20,020 319Commercial and industrial 916 916 12 791 23
Total $ \\\\\66,545 $64,742 $3,074 $ 62,465 $ \\\\350
24

25
Transactions in the allowance for loan losses for the years ended December 31, 2014, 2013 and 2012, and the balances of loans, individually and collectively evaluated for impairment, as of December 31, 2014, 2013 and 2012 are as follows (in thousands):
Residential Commercialand Land Real Estate, Real Estate, and
Gaming Development Construction Mortgage Industrial Other TotalDecember 31, 2014:Allowance for Loan Losses:
Beginning Balance $ 977 $ \\\\ 776 $ \\ \\\\ 695 $ \\ 5,553 $ \\ 632 $ \\\\\ 301 $ \\ 8,934Charge-offs (992) (2,060) (127) (368) (3,948) (235) (7,730)Recoveries 260 35 193 20 90 598Provision 328 1,535 257 1,231 3,883 170 7,404
Ending Balance $ \\\ 573 $ \\ 251 $ \\\ 860 $ \6,609 $ \\\\ 587 $ \\ 326 $ \\9,206
Allowance for Loan Losses:Ending balance: individually\
evaluated for impairment $ \\ $ \ \\\ $ \\\\\\ 742 $ \\\\ 2,706 $ \\\\ 289 $ \ \\\ 6 $\\\ 3,743
Ending balance: collectivelyevaluated for impairment $ \ \\ 573 $ \\\ 251 $ \\\\\\ 118 $ \\\\3,903 $ \\ 298 $ \\\\ 320 $ \\\\ \5,463
Total Loans:Ending balance: individually
evaluated for impairment $ \\\\ \\\ $ 7,232 $\\\\\\ 6,830 $ \39,204 $ \ 2,035 $ \\\\ 89 $ 55,390
Ending balance: collectivelyevaluated for impairment $\ 31,353 $\\\2,887 $\\\\\\\27,180 $ 201,137 $\\\\29,871 $ 14,589 $307,017
December 31, 2013:Allowance for Loan Losses:
Beginning Balance $ 1,541 $\\\\\\\\\ 200 $ \\\\\\\ 967 $ \\\\\\\ 5,273 $ 593 $ \ 283 $ \\\\8,857Charge-offs (474) (7,325) (1,013) (1,048) (24) (238) (10,122)Recoveries 110 67 97 150 26 88 538Provision (200) 7,834 644 1,178 37 168 9,661
Ending Balance $ \ 977 $ \\\\776 $ \\\\\\\ 695 $ \\\\\\\ 5,553 $ \ \\\\632 $ \ \\\\301 $ \ \\\8,934
Allowance for Loan Losses:Ending balance: individually
evaluated for impairment $ 626 $ \\\ 471 $ \\ 615 $ \ 1,698 $ 342 $ 33 $\\ 3,785
Ending balance: collectivelyevaluated for impairment $ 351 $ 305 $ \\ 80 $ \ 3,855 $ 290 $ 268 $\\\\ 5,149
Total Loans:Ending balance: individually
evaluated for impairment $ 3,095 $13,624 $ \\\\\\\5,399 $ \ 28,094 $ 2,423 $ 69 $ \52,704
Ending balance: collectivelyevaluated for impairment $ \26,475 $ 5,779 $\\\39,588 $\209,064 $32,584 $ 9,155 $322,645
December 31, 2012:Allowance for Loan Losses:
Beginning Balance $ 457 $\ 1,081 $ \\ 937 $ \\\\\\4,800 $ 557 $ 304 $ \ 8,136Charge-offs (275) (1,103) (474) (1,348) (203) (273) (3,676)Recoveries 7 41 85 133Provision 1,359 222 504 1,814 198 167 4,264
Ending Balance $ 1,541 $ \\\\ 200 $ \\ 967 $ \ \\\\\\5,273 $ 593 $ \ 283 $ \\\ 8,857
Allowance for Loan Losses:Ending balance: individually
evaluated for impairment $ 1,100 $ \\\200 $ \\ 922 $ \\\\\\\ 1,758 $ 300 $ \ 35 $ \\ 4,115
Ending balance: collectivelyevaluated for impairment $ 441 $\\\\\\\\ 200 $ \\ 45 $ \\\\\\\ 3,515 $ 293 $ \ 248 $ \\ 4,742
Total Loans:Ending balance: individually
evaluated for impairment $ 20,357 $\\\\21,165 $ \\8,267 $\\\\\ 33,848 $ \\ 2,525 $ \\\\\\ 72 $ \\\\\86,234
Ending balance: collectivelyevaluated for impairment $39,830 $\\\ 6,173 $ \\44,319 $\\\\\\\212,572 $32,479 $ \\\\\9,476 $344,849

26
N O T E D - B A N K P R E M I S E S A N D E Q U I P M E N T :
Bank premises and equipment are shown as follows (in thousands):
December 31, Estimated Useful Lives 2014 2013 2012Land $ 5,982 $ 5,982 $ 5,985Building 5 – 40 years\\\\\\\ 30,593 30,540 30,504Furniture, fixtures and equipment 3 – 10 years\\\\\\\\\\\ 15,511 15,272 14,487Totals, at cost 52,086 51,794 50,976Less: Accumulated depreciation 28,302 26,486 24,754Totals $ 23,784 $ 25,308 $ 26,222
N O T E E – O T H E R R E A L E S T A T E :
The Company’s other real estate consisted of the following as of December 31, 2014, 2013 and 2012, respectively (in thousands except number of properties):
December 31, 2014 2013 2012Number of Number of Number ofProperties Balance Properties Balance Properties Balance
Construction, land development and other land 15 $5,034 18 $4,887 11 $ 2,8341-4 family residential properties 10 431 6 180 6 576Non farm non residential 14 2,030 17 4,563 14 3,573Other 1 151 1 25Total 40 $7,646 41 $9,630 32 $ 7,008
N O T E F – D E P O S I T S :
At December 31, 2014, the scheduled maturities of time deposits are as follows (in thousands):
2015 $ \\\53,5082016 7,6092017 10,3332018 3,0732019 2,050Total $ \\\\ 76,573
Time deposits of $100,000 or more at December 31, 2014 included brokered deposits of $5,000,000, which mature in 2017.
Time deposits of $250,000 or more totaled approximately $25,321,000, $49,773,000 and $79,423,000 at December 31, 2014, 2013 and 2012, respectively.
Deposits held for related parties amounted to $6,607,646, $7,511,446 and $8,720,550 at December 31, 2014, 2013 and 2012, respectively.
Overdrafts totaling $822,730, $764,262 and $1,435,922 were reclassified as loans at December 31, 2014, 2013 and 2012, respectively.
NOT E G – F E D E RA L F UND S PU RCHA S ED AND S E CUR I T I E S S O L D UND E R AGR E EMEN T S T O R E PURCHA S E :At December 31, 2014, the Company had facilities in place to purchase federal funds up to $40,000,000 under established credit arrangements. At December31, 2014, 2013 and 2012, federal funds purchased and securities sold under agreements to repurchase included only funds invested by customers in a non-deposit product of the bank subsidiary. These accounts are non-insured, non-deposit accounts which allow customers to earn interest on theiraccount with no restrictions as to the number of transactions. They are set up as sweep accounts with no check-writing capabilities and require the customer to have at least one operating deposit account.
N O T E H – B O R R O W I N G S :At December 31, 2014, the Company was able to borrow up to $38,845,590 from the Federal Reserve Bank Discount Window Primary Credit Program. Theborrowing limit is based on the amount of collateral pledged, with certain loans from the Bank’s portfolio serving as collateral. Borrowings bear interestat 25 basis points over the current fed funds rate and have a maturity of one day. There was no outstanding balance at December 31, 2014.
At December 31, 2014, the Company had $38,707,935 outstanding in advances under a $97,649,565 line of credit with the FHLB. One advance in the amountof $5,000,000 bears interest at a variable rate of 43.2 basis points above the 1 month LIBOR rate, which was .593% at December 31, 2014, and matures in 2017.An additional advance in the amount of $30,000,000 bears interest at .08% and matured in January of 2015. New advances may subsequently be obtainedbased on the liquidity needs of the bank subsidiary. The remaining balance consists of smaller advances bearing interest from 2.604% to 7.00% with matu-rity dates from 2015 – 2042. The advances are collateralized by a blanket floating lien on a substantial portion of the Company’s real estate loans.

27
N O T E I - I N C O M E T A X E S :
Deferred taxes (or deferred charges) as of December 31, 2014, 2013 and 2012, included in other assets, were as follows (in thousands):
December 31, 2014 2013 2012
Deferred tax assets:
Allowance for loan losses $ \\\\3,130 $ 3,037 $ \\ 3,011
Employee benefit plans’ liabilities 4,490 4,326 4,135
Unrealized loss on available for sale securities, charged from equity 210 3,684
Earned retiree health benefits plan liability 1,638 1,638 1,673
General business and AMT credits 1,735
Tax net operating loss carry forward 651
Other 1,637 1,218 1,170
Valuation allowance (8,140)
Deferred tax assets 5,351 13,903 9,989
Deferred tax liabilities:
Unrealized gain on available for sale securities, charged to equity 1,556
Unearned retiree health benefits plan asset 362 579 948
Bank premises and equipment 4,760 5,075 5,366
Other 229 129 92
Deferred tax liabilities 5,351 5,783 7,962
Net deferred taxes $ \\\ 0 $ \ 8,120 $ \\ 2,027
Income taxes consist of the following components (in thousands):
Years Ended December 31, 2014 2013 2012
Current $ \\\\\ (137) $ \\\ (1,717) $ \\\ 1,425
Deferred:
Federal (3,277) (484) (1,517)
Change in valuation allowance 8,140
Total deferred 4,863 (484) (1,517)
Totals $ \ 4,726 $ (2,201) $ \\\ (92)
Income taxes amounted to less than the amounts computed by applying the U.S. Federal income tax rate of 34.0% for 2014, 2013 and 2012 to income (loss)before income taxes. The reasons for these differences are shown below (in thousands):
2014 2013 2012Tax Rate Tax Rate Tax Rate
Taxes computed at statutory rate $ \ (1,794) (34) $ \ (931) (34) $ 867 34
Increase (decrease) resulting from:
Tax-exempt interest income (532) (10) (539) (20) (532) (21)
Income from BOLI (200) (4) (170) (6) (195) (8)
Federal tax credits (298) (6) (298) (11) (372) (15)
Other (590) (10) (263) (9) 140 6
Change in valuation allowance 8,140 154
Total income tax expence (benefit) $ \\\ 4,726 90 $ \\\ (2,201) (80) $ (92) (4)
A valuation allowance is recognized against deferred tax assets when, based on the consideration of all available positive and negative evidence using amore likely than not criteria, it is determined that all or a portion of these tax benefits may not be realized. This assessment requires consideration of allsources of taxable income available to realize the deferred tax asset including taxable income in prior carry-back years, future reversals of existing temporary differences, tax planning strategies and future taxable income exclusive of reversing temporary differences and carryforwards. The Companyincurred losses on a cumulative basis for the three-year period ended December 31, 2014, which is considered to be significant negative evidence. Thepositive evidence considered in support was insufficient to overcome this negative evidence. As a result, the Company has established a full valuationallowance for its net deferred tax asset in the amount of $8,140,000 as of December 31, 2014.
If not utilized, the Company's federal net operating loss of $1,900,000 will expire in 2034.
The Company has reviewed its income tax positions and specifically considered the recognition and measurement requirements of the benefits recordedin its financial statements for tax positions taken or expected to be taken in its tax returns. The Company currently has no unrecognized tax benefits that,if recognized, would favorably affect the income tax rate in future periods.

28
N O T E J - S H A R E H O L D E R S ’ E Q U I T Y :Shareholders’ equity of the Company includes the undistributed earnings of the bank subsidiary. Dividends to the Company’s shareholders can generally be paid only from dividends paid to the Company by its bank subsidiary. Consequently, dividends are dependent upon the earnings, capitalneeds, regulatory policies and statutory limitations affecting the bank subsidiary. Dividends paid by the bank subsidiary are subject to the writtenapproval of the Commissioner of Banking and Consumer Finance of the State of Mississippi and the Federal Deposit Insurance Corporation (the “ FDIC” ).At December 31, 2014, $15,403,607 of undistributed earnings of the bank subsidiary included in consolidated surplus and retained earnings was availablefor future distribution to the Company as dividends. Dividends paid by the Company are subject to the written approval of the Federal Reserve Bank (“ FRB” ).
On February 25, 2009, the Board approved the repurchase of up to 3% of the outstanding shares of the Company’s common stock. As a result of thisrepurchase plan, 47,756 shares have been repurchased and retired through December 31, 2014.
The Company and the bank subsidiary are subject to various regulatory capital requirements administered by the federal banking agencies. Failure tomeet minimum capital requirements can initiate certain mandatory and possibly additional discretionary actions by the regulators that, if undertaken,could have a direct material effect on the financial statements. Under capital adequacy guidelines and the regulatory framework for prompt correctiveaction, specific capital guidelines must be met that involve quantitative measures of the assets, liabilities and certain off-balance sheet items as calculated under regulatory accounting practices. The capital amounts and classification of the bank subsidiary and Company are also subject to qualitative judgments by the regulators about components, risk weightings and other factors.
Quantitative measures established by regulation to ensure capital adequacy require the bank subsidiary to maintain minimum amounts and ratios of Totaland Tier 1 capital to risk-weighted assets, and Tier 1 capital to average assets.
As of December 31, 2014, the most recent notification from the FDIC categorized the bank subsidiary as well capitalized under the regulatory framework forprompt corrective action. To be categorized as well capitalized, the bank subsidiary must have a Total risk-based capital ratio of 10.00% or greater, a Tier1 risk-based capital ratio of 6.00% or greater and a Leverage capital ratio of 5.00% or greater. There are no conditions or events since that notificationthat Management believes have changed the bank subsidiary’s category.
The Company’s actual capital amounts and ratios and required minimum capital amounts and ratios for 2014, 2013 and 2012, are as follows (in thousands):
Actual For Capital Adequacy PurposesAmount Ratio Amount Ratio
December 31, 2014:Total Capital (to Risk Weighted Assets) $ \\\100,243 21.95% $ \\36,528 8.00%Tier 1 Capital (to Risk Weighted Assets) 94,493 20.70% 18,264 4.00%Tier 1 Capital (to Average Assets) 94,493 13.29% 28,437 4.00%
December 31, 2013:Total Capital (to Risk Weighted Assets) $ \\\\ 111,141 22.79% $\\\\\\39,022 8.00%Tier 1 Capital (to Risk Weighted Assets) 105,009 21.54% 19,511 4.00%Tier 1 Capital (to Average Assets) 105,009 13.48% 31,170 4.00%
December 31, 2012:Total Capital (to Risk Weighted Assets) $\\\\\\\ 112,342 21.29% $ \\\\\\42,216 8.00%Tier 1 Capital (to Risk Weighted Assets) 105,728 20.04% 21,108 4.00%Tier 1 Capital (to Average Assets) 105,728 13.07% 32,361 4.00%
The bank subsidiary’s actual capital amounts and ratios and required minimum capital amounts and ratios and capital amounts and ratios to be wellcapitalized for 2014, 2013 and 2012, are as follows (in thousands):
Actual For Capital Adequacy Purposes To Be Well CapitalizedAmount Ratio Amount Ratio Amount Ratio
December 31, 2014:Total Capital (to Risk Weighted Assets) $ \\\\ 96,427 21.28% $ \\36,247 8.00% $ \45,309 10.00%Tier 1 Capital (to Risk Weighted Assets) 90,720 20.02% 18,124 4.00% 27,186 6.00%Tier 1 Capital (to Average Assets) 90,720 13.15% 27,599 4.00% 34,499 5.00%
December 31, 2013: \Total Capital (to Risk Weighted Assets) $ \\106,870 21.94% $\\\\\38,968 8.00% $\\\\\\\ 48,711 10.00%Tier 1 Capital (to Risk Weighted Assets) 100,746 20.69% 19,484 4.00% 29,227 6.00%Tier 1 Capital (to Average Assets) 100,746 13.02% 30,958 4.00% 38,697 5.00%
December 31, 2012:Total Capital (to Risk Weighted Assets) $ \\\\ 107,885 20.47% $ \\\\\\42,148 8.00% $\\\\\\52,685 10.00%Tier 1 Capital (to Risk Weighted Assets) 101,241 19.22% 21,074 4.00% 31,611 6.00%Tier 1 Capital (to Average Assets) 101,241 12.62% 32,086 4.00% 40,108 5.00%
In July 2013, the Federal bank regulatory agencies issued a final rule that will revise their risk-based capital requirements and the method for calculatingcomponents of capital and of computing risk-weighted assets to make them consistent with agreements that were reached by the Basel Committee onBanking Supervision and certain provisions of the Dodd-Frank Act. The final rule applies to all depository institutions, top-tier bank holding companieswith total consolidated assets of $500 million or more and top-tier savings and loan holding companies. The rule establishes a new common equity Tier 1minimum capital requirement, increases the minimum capital ratios and assigns a higher risk weight to certain assets based on the risk associated withthese assets. The final rule includes transition periods that generally implement the new regulations over a five year period. These changes will be phasedin beginning in January 2015, and while management continues to evaluate this final rule and its potential impact, preliminary assessments indicate thatthe Bank and the Company will continue to exceed all regulatory capital requirements under the new rule.

29
N O T E K - O T H E R I N C O M E A N D E X P E N S E S :\Other income consisted of the following (in thousands):
Years Ended December 31, 2014 2013 2012
Other service charges, commissions and fees $ \\\\\\ 84 $ 74 $ 83
Rentals 435 433 442
Other 113 100 142\\
Totals $ \\\\\\ 632 $ 607 $ 667
Other expenses consisted of the following (in thousands):
Years Ended December 31, 2014 2013 2012
Advertising $ \\\ 552 $ 596 $ 489
Data processing 1,339 1,254 1,434
FDIC and state banking assessments 1,033 870 503
Legal and accounting 493 535 511
Other real estate 1,610 963 648
ATM expense 2,409 2,367 2,033
Trust expense 323 332 314
Other 1,890 1,876 1,813
Totals $ \\\\9,649 $8,793 $7,745
N O T E L - F I N A N C I A L I N S T R U M E N T S W I T H O F F - B A L A N C E - S H E E T R I S K :The Company is a party to financial instruments with off-balance-sheet risk in the normal course of business to meet the financing needs of its customers.These financial instruments include commitments to extend credit and irrevocable letters of credit. These instruments involve, to varying degrees, elements of credit and interest rate risk in excess of the amount recognized in the balance sheet. The contract amounts of those instruments reflect theextent of involvement the bank subsidiary has in particular classes of financial instruments. The Company's exposure to credit loss in the event of nonperformance by the other party to the financial instrument for commitments to extend credit and irrevocable letters of credit is represented by thecontractual amount of those instruments. The Company uses the same credit policies in making commitments and conditional obligations as it does foron-balance-sheet instruments.
Commitments to extend credit are agreements to lend to a customer as long as there is no violation of any conditions established in the agreement.Irrevocable letters of credit are conditional commitments issued by the Company to guarantee the performance of a customer to a third party.Commitments and irrevocable letters of credit generally have fixed expiration dates or other termination clauses and may require payment of a fee. Sincesome of the commitments and irrevocable letters of credit may expire without being drawn upon, the total amounts do not necessarily represent futurecash requirements. The Company evaluated each customer's creditworthiness on a case-by-case basis. The amount of collateral obtained upon extensionof credit is based on Management's credit evaluation of the customer. Collateral obtained varies but may include equipment, real property and inventory.
The Company generally grants loans to customers in its trade area.
At December 31, 2014, 2013 and 2012, the Company had outstanding irrevocable letters of credit aggregating $1,879,678, $3,059,011 and $3,599,011, respectively. At December 31, 2014, 2013 and 2012, the Company had outstanding unused loan commitments aggregating $66,663,320, $68,171,024 and$80,741,699, respectively. Approximately $35,753,000, $38,324,000 and $46,956,000 of outstanding commitments were at fixed rates and the remainderwas at variable rates at December 31, 2014, 2013 and 2012, respectively.
N O T E M - C O N T I N G E N C I E S :The Bank is involved in various legal matters and claims which are being defended and handled in the ordinary course of business. None of these matters is expected, in the opinion of Management, to have a material adverse effect upon the financial position or results of operations of the Company.
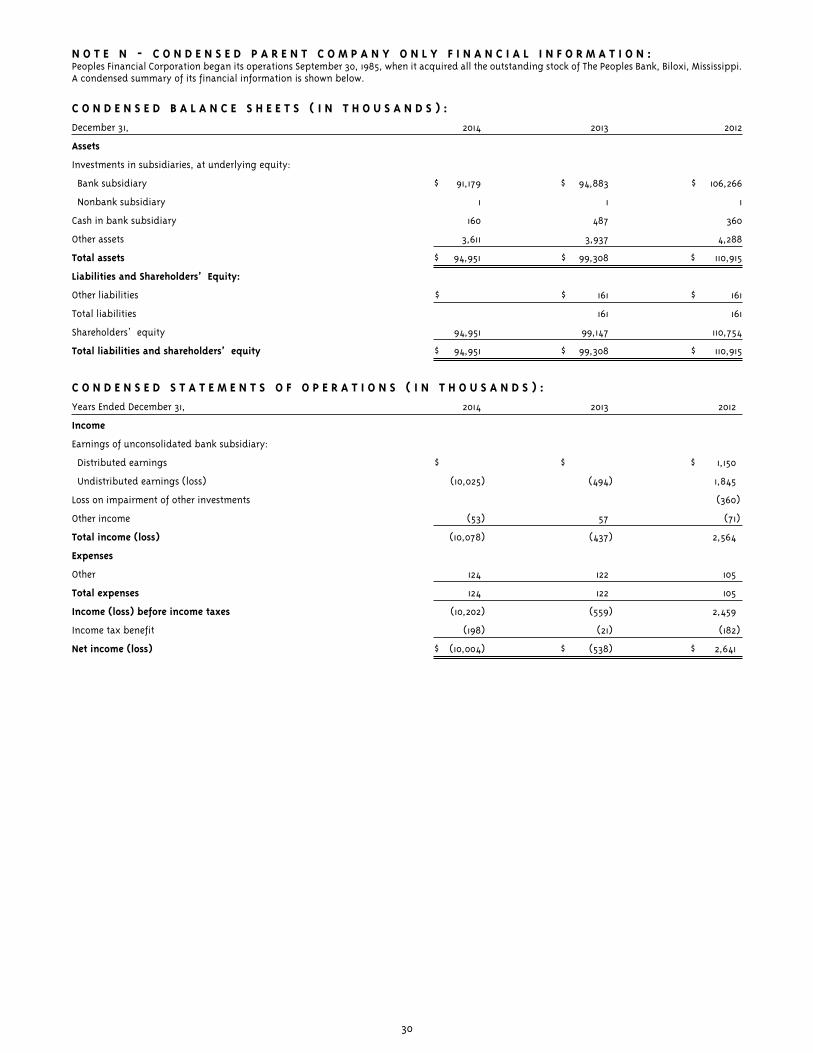
30
N O T E N - C O N D E N S E D P A R E N T C O M P A N Y O N L Y F I N A N C I A L I N F O R M A T I O N :Peoples Financial Corporation began its operations September 30, 1985, when it acquired all the outstanding stock of The Peoples Bank, Biloxi, Mississippi.A condensed summary of its financial information is shown below.
C O N D E N S E D B A L A N C E S H E E T S ( I N T H O U S A N D S ) :
December 31, 2014 2013 2012
Assets
Investments in subsidiaries, at underlying equity:
Bank subsidiary $\\ 91,179 $ \\\ 94,883 $ \\\\ 106,266
Nonbank subsidiary 1 1 1
Cash in bank subsidiary 160 487 360
Other assets 3,611 3,937 4,288
Total assets $ \\ 94,951 $ \\\\ 99,308 $ \\\\\\\ 110,915
Liabilities and Shareholders’ Equity:
Other liabilities $ \\ \ $ \\\\ 161 $ \\\\\\ 161
Total liabilities 161 161
Shareholders’ equity 94,951 99,147 110,754
Total liabilities and shareholders’ equity $ \\ 94,951 $ \\\\\ 99,308 $ \\\\\\ 110,915
C O N D E N S E D S T A T E M E N T S O F O P E R A T I O N S ( I N T H O U S A N D S ) :
Years Ended December 31, 2014 2013 2012
Income
Earnings of unconsolidated bank subsidiary:
Distributed earnings $ \\\ j $ h $ \ 1,150
Undistributed earnings (loss) (10,025) (494) 1,845
Loss on impairment of other investments (360)
Other income (53) 57 (71)
Total income (loss) (10,078) (437) 2,564
Expenses
Other 124 122 105
Total expenses 124 122 105
Income (loss) before income taxes (10,202) (559) 2,459
Income tax benefit (198) (21) (182)
Net income (loss) $\\ (10,004) $ \\\ (538) $ 2,641

31
C O N D E N S E D S T A T E M E N T S O F C A S H F L O W S ( I N T H O U S A N D S ) :
Years Ended December 31, 2014 2013 2012
Cash flows from operating activities:
Net income (loss) $ \ (10,004) $ (538) $ 2,641
Adjustments to reconcile net income (loss) to
net cash provided by (used in) operating activities:
(Income) loss on other investments 64 (42) 84
Loss on impairment of other investments 360
Undistributed (income) loss of unconsolidated subsidiaries 10,025 494 (1,845)
Other assets 25 164 (182)
Other liabilities (161) (1)
Net cash provided by (used in) operating activities (51) 78 1,057
Cash flows from investing activities:
Redemption of equity securities 236 230 36
Net cash provided by investing activities 236 230 36
Cash flows from financing activities:
Retirement of stock (181)
Dividends paid (512) (1,541)
Net cash used in financing activities (512) (181) (1,541)
Net increase (decrease) in cash (327) 127 (448)
Cash, beginning of year 487 360 808
Cash, end of year $ \\\ 160 $ \\ 487 $ 360
The Company paid income taxes of $320,000, $810,000 and $835,000 in 2014, 2013 and 2012, respectively. No interest was paid during the three years endedDecember 31, 2014.
N O T E O - E M P L O Y E E A N D D I R E C T O R B E N E F I T P L A N S :The Company sponsors the Peoples Financial Corporation Employee Stock Ownership Plan (“ ESOP” ). Employees who are in a position requiring at least1,000 hours of service during a plan year and who are 21 years of age are eligible to participate in the ESOP. The Plan included 401(k) provisions and theformer Gulf National Bank Profit Sharing Plan. Effective January 1, 2001, the ESOP was amended to separate the 401(k) funds into the Peoples FinancialCorporation 401(k) Profit Sharing Plan. The separation had no impact on the eligibility or benefits provided to participants of either plan. The 401(k) provides for a matching contribution of 75% of the amounts contributed by the employee (up to 6% of compensation). Contributions are determined bythe Board of Directors and may be paid either in cash or Peoples Financial Corporation capital stock. Total contributions to the plans charged to operating expense were $280,000, $220,000 and $330,000 in 2014, 2013 and 2012, respectively.
Compensation expense of $7,678,640, $7,594,790 and $7,691,059 was the basis for determining the ESOP contribution allocation to participants for 2014,2013 and 2012, respectively. The ESOP held 315,269, 359,030 and 383,141 allocated shares at December 31, 2014, 2013 and 2012, respectively.
The Company established an Executive Supplemental Income Plan and a Directors' Deferred Income Plan, which provide for pre-retirement and post-retirement benefits to certain key executives and directors. Benefits under the Executive Supplemental Income Plan are based upon the position andsalary of the officer at retirement or death. Normal retirement benefits under the plan are equal to 67% of salary for the president and chief executiveofficer, 58% of salary for the executive vice president and 50% of salary for all other executive officers and are payable monthly over a period of fifteenyears. Under the Directors’ Deferred Income Plan, the directors are given an opportunity to defer receipt of their annual directors’ fees until age sixty-five. For those who choose to participate, benefits are payable monthly for ten years beginning the first day of the month following the director’snormal retirement date. The normal retirement date is the later of the normal retirement age (65) or separation of service. Interest on deferred feesaccrues at an annual rate of ten percent, compounded annually. The Company has acquired insurance policies, with the bank subsidiary as owner andbeneficiary, which it may use as a source to pay potential benefits to the plan participants. These contracts are carried at their cash surrender value, whichamounted to $16,370,384, $15,824,497 and $15,363,241 at December 31, 2014, 2013 and 2012, respectively. The present value of accumulated benefits underthese plans, using an interest rate of 4.50% in 2014 and 2013 and 5.25% in 2012, and the interest ramp-up method in 2014, 2013 and 2012, has been accrued.The accrual amounted to $11,465,119, $11,004,738 and $10,572,681 at December 31, 2014, 2013 and 2012, respectively, and is included in Employee and director benefit plans liabilities.
The Company also has additional plans for non-vested post-retirement benefits for certain key executives. The Company has acquired insurance policies,with the bank subsidiary as owner and beneficiary, which it may use as a source to pay potential benefits to the plan participants. These contracts arecarried at their cash surrender value, which amounted to $1,346,910, $1,218,175 and $1,105,741 at December 31, 2014, 2013 and 2012, respectively. The present value of accumulated benefits under these plans using an interest rate of 4.50% in 2014 and 2013 and 5.25% in 2012, and the projected unit costmethod has been accrued. The accrual amounted to $1,450,280, $1,435,554, and $1,328,657 at December 31, 2014, 2013 and 2012, respectively, and is included in Employee and director benefit plans liabilities.

32
Additionally, there are two endorsement split dollar policies, with the bank subsidiary as owner and beneficiary, which provide a guaranteed death benefit to the participants’ beneficiaries. These contracts are carried at their cash surrender value, which amounted to $277,278, $269,271 and $262,466at December 31, 2014, 2013 and 2012, respectively. The present value of accumulated benefits under these plans using an interest rate of 4.50% in 2014 and2013, and 5.25% in 2012, and the projected unit cost method has been accrued. The accrual amounted to $80,997, $78,759 and $68,253 at December 31,2014, 2013 and 2012, respectively, and is included in Employee and director benefit plans liabilities.
The Company has additional plans for non-vested post-retirement benefits for directors. The Company has acquired insurance policies, with the banksubsidiary as owner and beneficiary, which it may use as a source to pay potential benefits to the plan participants. These contracts are carried at theircash surrender value, which amounted to $150,687, $138,001 and $129,367 at December 31, 2014, 2013 and 2012, respectively. The present value of accumulated benefits under these plans using an interest rate of 4.50% in 2014 and 2013 and 5.25% in 2012, and the projected unit cost method has beenaccrued. The accrual amounted to $210,207, $206,650 and $192,528 at December 31, 2014, 2013 and 2012, respectively, and is included in Employee anddirector benefit plans liabilities.
The Company provides post-retirement health insurance to certain of its retired employees. Employees are eligible to participate in the retiree health planif they retire from active service no earlier than their Social Security normal retirement age, which varies from 65 to 67 based on the year of birth. In addition, the employee must have at least 25 continuous years of service with the Company immediately preceding retirement. However, any activeemployee who was at least age 65 as of January 1, 1995, does not have to meet the 25 years of service requirement. The accumulated post-retirement benefit obligation at January 1, 1995, was $517,599, which the Company elected to amortize over 20 years. The Company reserves the right to modify,reduce or eliminate these health benefits. The Company has chosen to not offer this post-retirement benefit to individuals entering the employ of theCompany after December 31, 2006. Effective January 1, 2012, the Company amended the retiree health plan. This amendment requires that employeeswho are eligible and enroll in the bank subsidiary’s group medical and dental health care plans upon their retirement must enroll in Medicare Parts A, Band D when first eligible upon their retirement from the bank subsidiary. This results in the bank subsidiary’s programs being secondary insurance coverage for retired employees and any dependent(s), if applicable, while Medicare Parts A and B will be their primary coverage, and Medicare Part Dwill be the sole and exclusive prescription drug benefit plan for retired employees. This amendment reduced the accumulated post-retirement benefitobligation by $3,799,308 as of December 31, 2011. Effective January 1, 2014, the Company amended the retiree health plan. This amendment reduces theage for eligibility to 60 for those employees meeting all other eligibility requirements. This amendment increased the accumulated post-retirement benefit obligation by $1,150,229 as of December 31, 2013.
The following is a summary of the components of the net periodic post-retirement benefit cost (credit)(in thousands):
Years Ended December 31, 2014 2013 2012
Service cost $ \ 105 $ 55 $ 45
Interest cost 132 82 72
Amortization of net gain (14) (2) (16)
Amortization of prior service credit (81) (183) (203)
Net periodic post-retirement benefit cost (credit) $ \\ 142 $ (48) $ (102)
The discount rate used in determining the accumulated post-retirement benefit obligation was 4.00% in 2014, 4.80% in 2013 and 4.00% in 2012. Theassumed health care cost trend rate used in measuring the accumulated post-retirement benefit obligation was 7.00% in 2014. The rate was assumed todecrease gradually to 5.00% for 2022 and remain at that level thereafter. If the health care cost trend rate assumptions were increased 1.00%, the accumulated post-retirement benefit obligation as of December 31, 2014, would be increased by 16.45%, and the aggregate of the service and interest costcomponents of the net periodic post-retirement benefit cost for the year then ended would have increased by 16.78%. If the health care cost trend rateassumptions were decreased 1.00%, the accumulated post-retirement benefit obligation as of December 31, 2014, would be decreased by 13.02%, and theaggregate of the service and interest cost components of the net periodic post-retirement benefit cost for the year then ended would havedecreased by 13.54%.
The following table presents the estimated benefit payments for each of the next five years and in the aggregate for the next five years (in thousands):
2015 $222
2016 191
2017 171
2018 147
2019 87
2020 – 2024 828
The following is a reconciliation of the accumulated post-retirement benefit obligation, which is included in Employee and director benefit plans liabilities (in thousands):
Accumulated post-retirement benefit obligation as of December 31, 2013 $ 2,853
Service cost 105
Interest cost 132
Actuarial loss 544
Benefits paid (64)
Accumulated post-retirement benefit obligation as of December 31, 2014 $ 3,570

33
The following is a summary of the change in plan assets (in thousands):
2014 2013 2012
Fair value of plan assets at beginning of year $ $ $ \\j
Actual return on assets
Employer contribution 64 90 67
Benefits paid, net (64) (90) (67)
Fair value of plan assets at end of year $ $\\\ $ l
Amounts recognized in the Accumulated Other Comprehensive Income (Loss), net of tax, were (in thousands):
For the year ended December 31, 2014 2013 2012
Net gain (loss) $ (80) $ 288 $ 123Prior service charge 783 837 1,718Total accumulated other comprehensive income $ \\\\\\ 703 $ 1,125 $ \\\ 1,841
Amounts recognized in the accumulated post-retirement benefit obligation and other comprehensive income (loss) were (in thousands):
For the year ended December 31, 2014
Unrecognized actuarial loss $ \ 557
Amortization of prior service cost 81
Total accumulated other comprehensive loss $ \ 638
The prior service credit that will be recognized in accumulated other comprehensive income during 2015 is $81,381.
N O T E P - F A I R V A L U E M E A S U R E M E N T S A N D D I S C L O S U R E S :The Company utilizes fair value measurements to record fair value adjustments to certain assets and liabilities and to determine fair value disclosures.Available for sale securities are recorded at fair value on a recurring basis. Additionally, from time to time, the Company may be required to record otherassets at fair value on a non-recurring basis, such as impaired loans and ORE. These non-recurring fair value adjustments typically involve the application of lower of cost or market accounting or write-downs of individual assets. Additionally, the Company is required to disclose, but not record,the fair value of other financial instruments.
Fair Value HierarchyThe Company groups assets and liabilities at fair value in three levels, based on the markets in which the assets and liabilities are traded and the reliability of the assumptions used to determine fair value. These levels are:
Level 1 – Valuation is based upon quoted prices for identical instruments traded in active markets.Level 2 – Valuation is based upon quoted market prices for similar instruments in active markets, quoted prices for identical or similar instruments in markets that are not active and model-based valuation techniques for which all significant assumptions are observable in the market.Level 3 – Valuation is generated from model-based techniques that use at least one significant assumption not observable in the market. These unobservable assumptions reflect estimates of assumptions that market participants would use in pricing the asset or liability. Valuation techniquesinclude the use of option pricing models, discounted cash flow models and similar techniques.
Following is a description of valuation methodologies used to determine the fair value of financial assets and liabilities.
Cash and Due from BanksThe carrying amount shown as cash and due from banks approximates fair value.
Available for Sale SecuritiesThe fair value of available for sale securities is based on quoted market prices. The Company’s available for sale securities are reported at their estimat-ed fair value, which is determined utilizing several sources. The primary source is Interactive Data Corporation, which utilizes pricing models that varybased by asset class and include available trade, bid and other market information and whose methodology includes broker quotes, proprietary modelsand vast descriptive databases. The other source for determining fair value is matrix pricing, which is a mathematical technique used widely in the indus-try to value debt securities without relying exclusively on quoted prices for the specific securities but rather by relying on the securities’ relationship toother benchmark securities. All of the Company’s available for sale securities are Level 2 assets.
Held to Maturity SecuritiesThe fair value of held to maturity securities is based on quoted market prices.
Other InvestmentsThe carrying amount shown as other investments approximates fair value.
Federal Home Loan Bank StockThe carrying amount shown as Federal Home Loan Bank Stock approximates fair value.
LoansThe fair value of fixed rate loans is estimated by discounting the future cash flows using the current rates at which similar loans would be made to borrowers with similar credit ratings for the remaining maturities. The cash flows considered in computing the fair value of such loans are segmented intocategories relating to the nature of the contract and collateral based on contractual principal maturities. Appropriate adjustments are made to reflectprobable credit losses. Cash flows have not been adjusted for such factors as prepayment risk or the effect of the maturity of balloon notes. The fair valueof floating rate loans is estimated to be its carrying value. At each reporting period, the Company determines which loans are impaired. Accordingly, theCompany’s impaired loans are reported at their estimated fair value on a non-recurring basis. An allowance for each impaired loan, which are generally collateral-dependent, is calculated based on the fair value of its collateral. The fair value of the collateral is based on appraisals performed bythird-party valuation specialists. Factors including the assumptions and techniques utilized by the appraiser are considered by Management. If therecorded investment in the impaired loan exceeds the measure of fair value of the collateral, a valuation allowance is recorded as a component of theallowance for loan losses. Impaired loans are non-recurring Level 3 assets.

34
Other Real EstateIn the course of lending operations, Management may determine that it is necessary to foreclose on the related collateral. Other real estate acquiredthrough foreclosure is carried at fair value, less estimated costs to sell. The fair value of the collateral is based on appraisals performed by third-partyvaluation specialists. Factors including the assumptions and techniques utilized by the appraiser are considered by Management. If the current appraisal is more than one year old and/or the loan balance is more than $200,000, a new appraisal is obtained. Otherwise, the Bank’s in-house property evaluator and Management will determine the fair value of the collateral, based on comparable sales, market conditions, Management's plansfor disposition and other estimates of fair value obtained from principally independent sources, adjusted for estimated selling costs. Other real estate isa non-recurring Level 3 asset.
Cash Surrender Value of Life InsuranceThe carrying amount of cash surrender value of bank-owned life insurance approximates fair value.
DepositsThe fair value of non-interest bearing demand and interest bearing savings and demand deposits is the amount reported in the financial statements. Thefair value of time deposits is estimated by discounting the cash flows using current rates for time deposits with similar remaining maturities. The cashflows considered in computing the fair value of such deposits are based on contractual maturities, since approximately 98% of time deposits provide forautomatic renewal at current interest rates.
Federal Funds Purchased and Securities Sold under Agreements to RepurchaseThe carrying amount shown as federal funds purchased and securities sold under agreements to repurchase approximates fair value.
Borrowings from Federal Home Loan BankThe fair value of FHLB fixed rate borrowings is estimated using discounted cash flows based on current incremental borrowing rates for similar types ofborrowing arrangements. The fair value of FHLB variable rate borrowings is estimated to be its carrying value.
The balances of available for sale securities, which are the only assets measured at fair value on a recurring basis, by level within the fair value hierarchyand by investment type, as of December 31, 2014, 2013 and 2012, were as follows (in thousands):
Fair Value Measurements Using
December 31, 2014: Total Level 1 Level 2 Level 3
U.S. Treasuries $ 29,654 $287,078 $ \\\\\\\29,654 $287 ,078
U.S. Government agencies 117,989 117,989
Mortgage-backed securities 35,817 35,817
States and political subdivisions 31,012 31,012
Equity securities 650 650
Total $ \\\\\ 215,122 $287,078 $ \\\\\\\\ 215,122 $28 7,078
Fair Value Measurements Using
December 31, 2013: Total Level 1 Level 2 Level 3
U.S. Treasuries $ \\\ 43,648 $287,078 $ 43,648 $28 7,078
U.S. Government agencies 145,805 145,805
Mortgage-backed securities 50,326 50,326
States and political subdivisions 35,011 35,011
Equity securities 650 650
Total $ 275,440 $287,078 $ \\\ 275,440 $28 7,078
Fair Value Measurements Using
December 31, 2012: Total Level 1 Level 2 Level 3
U.S. Treasuries $ \\\ 54,096 $287,078 $ \ 54,096 $28 7,078
U.S. Government agencies 149,098 149,098
Mortgage-backed securities 17,441 17,441
States and political subdivisions 37,591 37,591
Equity securities 650 650
Total $ 258,876 $287,078 $ 258,876 $28 7,078

35
Impaired loans, which are measured at fair value on a non-recurring basis, by level within the fair value hierarchy as of December 31, 2014, 2013 and 2012were as follows (in thousands):
Fair Value Measurements Using
December 31: Total Level 1 Level 2 Level 3
2014 $ \\\\ 10,610 $87,\\\78 $ \\\7,078 $\\\ 10,610
2013 18,831 287,07820 18,831
2012 16,030 7,078 87,078 16,030
Other real estate, which is measured at fair value on a non-recurring basis, by level within the fair value hierarchy as of December 31, 2014, 2013 and 2012are as follows (in thousands):
Fair Value Measurements Using
December 31: Total Level 1 Level 2 Level 3
2014 $ \ 7,646 287,078$$$$ \\ \k $ \ j $ 7,646
2013 9,630 9,630
2012 7,008 7,008
The following table presents a summary of changes in the fair value of other real estate which is measured using Level 3 inputs (in thousands):
For the year ended December 31, 2014 2013 2012
Balance, beginning of year $ \\\\ 9,630 $ 7,008 $ \ 6,153
Loans transferred to ORE 1,345 4,537 2,576
Sales (2,068) (1,188) (1,568)
Writedowns (1,261) (670) (153)
Insurance proceeds from casualty loss (57)
Balance, end of year $ \ 7,646 $ \9,630 $ 7,008

36
The carrying value and estimated fair value of assets and liabilities, by level within the fair value hierarchy, at December 31, 2014, 2013 and 2012, are asfollows (in thousands):
Fair Value Measurements Using
Carrying Amount Level 1 Level 2 Level 3 TotalDecember 31,2014:Financial Assets:
Cash and due from banks $ 23,556 $ 23,556 $287,078 $287,078 $ 23,556Available for sale securities 215,122 215,122 215,122Held to maturity securities 17,784 17,859 17,859Other Investments 2,962 2,962 2,962Federal Home Loan Bank stock 2,504 2,504 2,504Loans, net 353,201 355,004 355,004Other real estate 7,646 7,646 7,646Cash surrender value of life insurance 18,145 18,145 18,145
Financial Liabilities: Deposits:Non-interest bearing 103,607 103,607 103,607Interest bearing 289,107 289,466 289,466Federal funds purchased and
securities sold under agreements to repurchase 124,206 124,206
Borrowings from Federal Home Loan Bank 38,708 40,720 40,720
December 31,2013:Financial Assets:
Cash and due from banks $ 36,264 $ 36,264 $287,078 $287,078 $ 36,264Available for sale securities 275,440 275,440 275,440Held to maturity securities 11,142 10,686 10,686Other Investments 3,262 3,262 3,262Federal Home Loan Bank stock 3,834 3,834 3,834Loans, net 366,415 369,117 369,117Other real estate 9,630 9,630 9,630Cash surrender value of life insurance 17,456 17,456 17,456
Financial Liabilities: Deposits:Non-interest bearing 107,117 107,117 107,117Interest bearing 321,441 322,535 322,535Federal funds purchased and
securities sold under agreements to repurchase 139,639 139,639 139,639
Borrowings from Federal Home Loan Bank 77,684 79,051 79,051
December 31,2012:Financial Assets:
Cash and due from banks $ 54,020 $ 54,020 $287,078 $287,078 $ 54,020Available for sale securities 258,876 258,876 258,876Held to maturity securities 7,125 7,225 7,225Other Investments 3,450 3,450 3,450Federal Home Loan Bank stock 2,380 2,380 2,380Loans, net 422,226 425,627 425,627Other real estate 7,008 7,008 7,008Cash surrender value of life insurance 16,861 16,861 16,861
Financial Liabilities: Deposits:Non-interest bearing 102,609 102,609 102,609Interest bearing 373,110 376,209 376,209Federal funds purchased and
securities sold under agreements to repurchase 194,234 194,234 194,234
Borrowings from Federal Home Loan Bank 7,912 10,271 10,271

37
To the Board of Directors and Shareholders
Peoples Financial Corporation
Biloxi, Mississippi
We have audited the accompanying consolidated statements of condition of Peoples Financial Corporation and subsidiaries (the “ Company” ) as of
December 31, 2014, 2013 and 2012, and the related consolidated statements of operations, comprehensive income (loss), shareholders’ equity, and cash
flows for the years then ended. These financial statements are the responsibility of the Company's management. Our responsibility is to express an
opinion on these financial statements based on our audits.
We conducted our audits in accordance with the standards of the Public Company Accounting Oversight Board (United States). Those standards require
that we plan and perform the audit to obtain reasonable assurance about whether the financial statements are free of material misstatement. The
Company is not required to have, nor were we engaged to perform, an audit of its internal control over financial reporting. Our audits included
consideration of internal control over financial reporting as a basis for designing audit procedures that are appropriate in the circumstances, but not
for the purpose of expressing an opinion of the effectiveness of the Company's internal control over financial reporting. Accordingly, we express no
such opinion. An audit includes examining, on a test basis, evidence supporting the amounts and disclosures in the financial statements, assessing the
accounting principles used and significant estimates made by management, as well as evaluating the overall financial statement presentation.
We believe that our audits provide a reasonable basis for our opinion.
In our opinion, the consolidated financial statements referred to above present fairly, in all material respects, the financial position of Peoples Financial
Corporation and subsidiaries as of December 31, 2014, 2013 and 2012, and the results of their operations and their cash flows for the years then ended in
conformity with accounting principles generally accepted in the United States of America.
Atlanta, Georgia
March 18, 2015
R E P O R T O F I N D E P E N D E N T R E G I S T E R E D P U B L I C A C C O U N T I N G F I R M
P E O P L E S F I N A N C I A L C O R P O R A T I O N A N D S U B S I D I A R I E S

38
F I V E - Y E A R C O M P A R A T I V E S U M M A R Y O F S E L E C T E D F I N A N C I A L I N F O R M A T I O N ( I N T H O U S A N D S E X C E P T P E R S H A R E D A T A ) :
Peoples Financial Corporation and Subsidiaries
2014 2013 2012 2011 2010
Balance Sheet Summary
Total assets $ 668,895 $ 762,264 $ 804,912 $ 804,152 $ 786,545
Available for sale securities 215,122 275,440 258,875 278,918 287,078
Held to maturity securities 17,784 11,142 7,125 1,428 1,915
Loans, net of unearned discount 362,407 375,349 431,083 432,407 409,899
Deposits 392,714 428,558 475,719 468,439 484,140
Borrowings from FHLB 38,708 77,684 7,912 53,324 42,957
Shareholders' equity 94,951 99,147 110,754 109,452 101,357
Summary of Operations
Interest income $ 22,156 $ 24,956 $ 24,628 $ 25,033 $ 29,675
Interest expense 1,441 1,447 2,067 3,178 4,601
Net interest income 20,715 23,509 22,561 21,855 25,074
Provision for loan losses 7,404 9,661 4,264 2,935 6,845
Net interest income after
provision for loan losses 13,311 13,848 18,297 18,920 18,229
Non-interest income 8,619 9,067 9,529 9,860 10,114
Non-interest expense 27,208 25,654 25,277 28,781 27,581
Income (loss) before taxes (5,278) (2,739) 2,549 (1) 762
Income tax expense (benefit) 4,726 (2,201) (92) (1,204) (723)
Net income (loss) $ \\\ (10,004) $ (538) $ 2,641 $ 1,203 $ 1,485
Per Share Data
Basic and diluted earnings per share $ \\ (1.95) $ (.10) $ .51 $ .23 $ .29
Dividends per share .10 .20 .19 .20
Book value 18.53 19.35 21.56 21.31 19.68
Weighted average number of shares 5,123,186 5,128,889 5,136,918 5,136,918 5,151,661
Selected Ratios
Return on average assets .32% .15% .18%
Return on average equity 2.40% 1.14% 1.45%
Primary capital to average assets 14.64% 13.64% 14.71% 14.59% 12.96%
Risk-based capital ratios:
Tier 1 20.70% 21.54% 20.04% 19.61% 21.01%
Total 21.95% 22.79% 21.29% 20.86% 22.26%
(10.31)%
(1.38)% (.07)%
(.51)%

39
P E O P L E S F I N A N C I A L C O R P O R A T I O N A N D S U B S I D I A R I E S
Summary of Quarterly Results of Operations (In Thousands Except per Share Data):
Quarter Ended, 2014 March 31 June 30 September 30 December 31
Interest income $ 5,847 $ 5,750 $\\\\\\\\\ 5,467 $ \\\\ 5,092
Net interest income 5,561 5,389 4,896 4,869
Provision for loan losses 537 537 3,541 2,789
Income (loss) before income taxes 490 100 (3,053) (2,815)
Net income (loss) 579 335 (1,799) (9,119)
Basic and diluted earnings (loss) per share .11 .07 (.35) (1.78)
Quarter Ended, 2013 March 31 June 30 September 30 December 31
Interest income $ 5,854 $ 5,750 $ \\\\\\ 5,805 $ \\ 7,547
Net interest income 5,447 5,352 5,431 7,279
Provision for loan losses 539 3,538 542 5,042
Income (loss) before income taxes 617 (1,989) 781 (2,148)
Net income (loss) 606 (1,147) 886 (883)
Basic and diluted earnings (loss) per share .12 (.23) .18 (.17)
Market Information The Company's stock is traded under the symbol PFBX and is quoted in publications under "PplFnMS". The following table sets forth the high and low saleprices of the Company's common stock as reported on the NASDAQ Stock Market.
Year Quarter High Low Dividend per share
2014 1st $ 13.75 $ 12.91 $ \\ -
2nd 13.75 12.12 .10
3rd 13.66 12.86 -
4th 13.59 12.35 -
2013 1st $ 12.75 $ 9.27 $ .
2nd 13.44 12.02
3rd 13.14 11.17
4th 13.24 11.53
Performance GraphThe graph below compares the Company's annual percentage change in cumulative total shareholder return on common shares over the last five yearswith the cumulative total return of a broad equity market index of companies, the NASDAQ Market Index, and a peer group consisting of the MorningstarIndustry Group, Regional - Southeast Banks (“ Morningstar” ). This presentation assumes $100 was invested in shares of the relevant issuers on January 1,2010, and that dividends received were immediately invested in additional shares. The graph plots the value of the initial $100 investment at one year intervals. For purposes of constructing this data, the returns of each component issuer have been weighted according to that issuer'smarket capitalization.
40
Corporate Office
Mailing Address
P. O. Box 529
Biloxi, MS 39533-0529
Physical Address
152 Lameuse Street
Biloxi, MS 39530
(228) 435-8205
Website
www.thepeoples.com
Corporate Stock
The common stock of Peoples Financial Corporation is traded
on the NASDAQ Capital Market under the symbol: PFBX.
The current market makers are:
FIG Partners LLC
Hovde Capital Advisors
Knight Equity Markets, L.P.
RAYMOND JAMES Morgan Keegan
Stifel Nicolaus & Co.
Sterne, Agee & Leach, Inc.
Shareholder Information
For complete information concerning the common stock of
Peoples Financial Corporation, including dividend reinvestment,
or general information about the Company, direct inquiries to
transfer agent/investor relations:
Asset Management & Trust Services Department
The Peoples Bank, Biloxi, Mississippi
P. O. Box 1416, Biloxi, Mississippi 39533-1416
(228) 435-8208, e-mail: [email protected]
Independent Registered Public Accounting Firm
Porter Keadle Moore, LLC
Atlanta, Georgia
S.E.C. Form 10-K Requests
A copy of the Annual Report on Form 10-K, as filed with the
Securities and Exchange Commission, may be obtained without
charge by directing a written request to:
Lauri A. Wood, Chief Financial Officer and Controller
Peoples Financial Corporation
P. O. Drawer 529, Biloxi, Mississippi 39533-0529
(228) 435-8412, e-mail: [email protected]
C O R P O R A T E I N F O R M A T I O N
P E O P L E S F I N A N C I A L C O R P O R A T I O N A N D S U B S I D I A R I E S

41
The Peoples Bank, Biloxi, Mississippi
Biloxi Branches
Main Office
152 Lameuse Street, Biloxi, Mississippi 39530
(228) 435-5511
Asset Management and Trust Services Department
Personal and Corporate Trust Services
758 Vieux Marche, Biloxi, Mississippi 39530
(228) 435-8208
Cedar Lake Office
1740 Popps Ferry Road, Biloxi, Mississippi 39532
(228) 435-8688
Keesler AFB Office
1507 Meadows Drive
Keesler AFB, MS 39534
(228) 435-8690
West Biloxi Office
2560 Pass Road, Biloxi, Mississippi 39531
(228) 435-8203
Gulfport Branches
Armed Forces Retirement Home Office
1800 Beach Drive, Gulfport, Mississippi 39507
(228) 897-8724
Downtown Gulfport Office
1105 30th Avenue, Gulfport, Mississippi 39507
(228) 897-8715
Handsboro Office
0412 E. Pass Road, Gulfport, Mississippi 39507
(228) 897-8717
Orange Grove Office
12020 Highway 49 North, Gulfport, Mississippi 39503
(228) 897-8718
Other Branches
Bay St. Louis Office
408 Highway 90 East, Bay St. Louis, Mississippi 39520
(228) 897-8710
Diamondhead Office
5429 West Aloha Drive, Diamondhead, Mississippi 39525
(228) 897-8714
D’ Iberville-St. Martin Office
10491 Lemoyne Boulevard, D’ Iberville, Mississippi 39532
(228) 435-8202
Gautier Office
2609 Highway 90, Gautier, Mississippi 39553
(228) 497-1766
Long Beach Office
298 Jeff Davis Avenue, Long Beach, Mississippi 39560
(228) 897-8712
Ocean Springs Office
2015 Bienville Boulevard, Ocean Springs, Mississippi 39564
(228) 435-8204
Pass Christian Office
301 East Second Street, Pass Christian, Mississippi 39571
(228) 897-8719
Saucier Office
17689 Second Street, Saucier, Mississippi 39574
(228) 897-8716
Waveland Office
470 Highway 90, Waveland, Mississippi 39576
(228) 467-7257
Wiggins Office
1312 S. Magnolia Drive, Wiggins, Mississippi 39577
(228) 897-8722
B R A N C H L O C A T I O N S
P E O P L E S F I N A N C I A L C O R P O R A T I O N A N D S U B S I D I A R I E S

42
BOARD O F D I R E C TOR S
Peoples Financial Corporation
Chevis C. Swetman, Chairman of the Board
Dan Magruder, Vice Chairman; President, Rex Distributing Co., Inc.
Drew Allen, President, Allen Beverages, Inc.
Rex E. Kelly, Principal, Strategic Communications
Jeffrey H. O’Keefe, President, Bradford-O’Keefe Funeral Homes, Inc.
O F F I C E R S
Peoples Financial Corporation
Chevis C. Swetman, President and CEO
A. Wes Fulmer, Executive Vice-President
Ann F. Guice, First Vice-President
J. Patrick Wild, Second Vice-President
Evelyn R. Herrington, Vice-President and Secretary
John J. Theiler, Vice-President
Lauri A. Wood, Chief Financial Officer and Controller
BOARD O F D I R E C TOR S
The Peoples Bank, Biloxi, Mississippi
Chevis C. Swetman, Chairman
Tyrone J. Gollott, Vice-Chairman; President, G & W Enterprises, Inc.
Drew Allen, President, Allen Beverages, Inc.
A. Wes Fulmer, Executive Vice-President
Liz Corso Joachim, President, Frank P. Corso, Inc.
Rex E. Kelly, Principal, Strategic Communications
Dan Magruder, President, Rex Distributing Co., Inc.
Jeffrey H. O’Keefe, President, Bradford-O’Keefe Funeral Homes, Inc.
S EN I O R MANAG EMENT
The Peoples Bank, Biloxi, Mississippi
Chevis C. Swetman, President and CEO
A. Wes Fulmer, Executive Vice-President
Lauri A. Wood, Senior Vice-President and Cashier
Ann F. Guice, Senior Vice-President
J. Patrick Wild, Senior Vice-President
Evelyn R. Herrington, Senior Vice-President
John J. Theiler, Senior Vice-President
B O A R D O F D I R E C T O R S
P E O P L E S F I N A N C I A L C O R P O R A T I O N A N D S U B S I D I A R I E S

43
[THIS PAGE LEFT INTENTIONALLY BLANK]

[THIS PAGE LEFT INTENTIONALLY BLANK]
PB-186100-Rpt_•Peoples/TLC 2/10/05 2.qxd 3/6/13 11:15 AM Page 41
44

PB-186100-Rpt_•Peoples/TLC 2/10/05 2.qxd 3/6/13 11:15 AM Page 41

AsgardMC-162833-Blank.indd 1 8/9/10 7:50:40 AM


![GPT Interim Result presentation [website] · Net interest expense (50.1) (59.0) Corporate overheads (13.8) (16.4) Tax expense (5.9) (5.7) Non-core income 5.0 6.1 Funds From Operations](https://static.fdocuments.us/doc/165x107/5f7cf15a9105576a5e550678/gpt-interim-result-presentation-website-net-interest-expense-501-590-corporate.jpg)


