
GFNorte Reports Net Income of Ps 1.6 billion in 1Q09 · PDF fileNon Interest Income 1,942 ......
66
According to the new criteria, effective as of January 2008, inflationary accounting no longer applies for re-expressing financial statements. Nonetheless, the figures for 2007 and previous years will continue to be expressed in pesos of December 2007. First Quarter 2009. 1 GFNorte Reports Net Income of Ps 1.6 billion in 1Q09 OPERATING RESULTS (Million Pesos) 1Q08 4Q08 1Q09 QoQ YoY Net Interest Income 5,161 6,451 6,199 (4%) 20% Non Interest Income 1,942 2,360 1,845 (22%) (5%) Total Income 7,103 8,811 8,044 (9%) 13% Non Interest Expense 3,799 4,369 4,142 (5%) 9% Operating Income 2,299 1,458 1,739 19% (24%) Net Income 1,928 1,272 1,611 27% (16%) • Net Interest Income During 1Q09, Net Interest Income before Repomo was Ps 6.2 billion, a 20% YoY growth, driven by higher interest revenues as a result of growth in the loan portfolio and higher average market interest rates compared to 1Q08, as well as higher spreads on new loans. NII also benefited from growth in demand deposits. NII suffered a 4% QoQ decline, affected by a 2% reduction in the performing loan portfolio and a reduction in market interest rates as a result of Banxico’s monetary policy. • Non Interest Income Non Interest Income was Ps 1.8 billion during 1Q09, a 5% YoY decline and a 22% QoQ drop, given less recoveries of real estate portfolios, as well as lower service fees. • Non Interest Expense Non Interest Expense was Ps 4.1 billion for 1Q09, a 9% YoY increase mainly due to higher personnel, branch remodellling and other sales channels related expenses. The 5% QoQ decline vs. 4Q08 is mainly explained by a non-recurring fiscal adjustment registered in 4Q08 which had a total positive impact of $33 million, but a negative one time fiscal cost at the end of last year. The efficiency ratio was 51.5% during 1Q09 vs. 49.6% in 4Q08 and 53.5% in 1Q08. • Net Income During 1Q09, GFNorte reported Net Income of Ps 1.6 billion, 27% higher than 4Q08 and 16% lower than 1Q08. The YoY decline is mainly explained by the non-recurring Ps 275 million gain from the sale of shares of VISA obtained during 1Q08 as part of it’s IPO. Exluding this non-recurring line item, net income fell by 3% YoY, affected mainly by higher loan loss provisions as a result of deterioration in the consumer portfolio. The QoQ growth was mainly due to lower loan loss provisions and an increase in non operating income due to changes in the C-2 accounting criteria, which modified the valuation of benefits to be received from securitizations of Mortgage, State and Municipal loans. Contacts: David Ricardo Suárez (México, D.F.) +52 (55) 5268 16 80 email: [email protected] Gabriela Renovato (Monterrey, N.L.) +52 (81) 8318 50 65 web page: www.banorte.com/ri I. EXECUTIVE SUMMARY NET INTEREST INCOME (Million Pesos) 5,161 5,225 5,748 6,451 6,199 1Q08 2Q08 3Q08 4Q08 1Q09 NON INTEREST EXPENSE ( Million Pesos) 3,799 3,903 3,736 4,369 4,142 1Q08 2Q08 3Q08 4Q08 1Q09 NON INTEREST INCOME (Million Pesos) 1,845 2,360 2,011 1,971 1,942 1Q08 2Q08 3Q08 4Q08 1Q09 NET INCOME (Million Pesos) 1,928 1,806 2,007 1,272 1,611 1Q08 2Q08 3Q08 4Q08 1Q09
Transcript of GFNorte Reports Net Income of Ps 1.6 billion in 1Q09 · PDF fileNon Interest Income 1,942 ......

According to the new criteria, effective as of January 2008, inflationary accounting no longer applies for re-expressing financial statements. Nonetheless, the figures for 2007 and previous years will continue to be expressed in pesos of December 2007.
First Quarter 2009.
1
GGFFNNoorrttee RReeppoorrttss NNeett IInnccoommee ooff PPss 11..66 bbiilllliioonn iinn 11QQ0099
OPERATING RESULTS (Million Pesos) 1Q08 4Q08 1Q09 QoQ YoY
Net Interest Income 5,161 6,451 6,199 (4%) 20%
Non Interest Income 1,942 2,360 1,845 (22%) (5%)
Total Income 7,103 8,811 8,044 (9%) 13%
Non Interest Expense 3,799 4,369 4,142 (5%) 9%
Operating Income 2,299 1,458 1,739 19% (24%)
Net Income 1,928 1,272 1,611 27% (16%)
• Net Interest Income During 1Q09, Net Interest Income before Repomo was Ps 6.2 billion, a 20% YoY growth, driven by higher interest revenues as a result of growth in the loan portfolio and higher average market interest rates compared to 1Q08, as well as higher spreads on new loans. NII also benefited from growth in demand deposits. NII suffered a 4% QoQ decline, affected by a 2% reduction in the performing loan portfolio and a reduction in market interest rates as a result of Banxico’s monetary policy. • Non Interest Income Non Interest Income was Ps 1.8 billion during 1Q09, a 5% YoY decline and a 22% QoQ drop, given less recoveries of real estate portfolios, as well as lower service fees.
• Non Interest Expense Non Interest Expense was Ps 4.1 billion for 1Q09, a 9% YoY increase mainly due to higher personnel, branch remodellling and other sales channels related expenses. The 5% QoQ decline vs. 4Q08 is mainly explained by a non-recurring fiscal adjustment registered in 4Q08 which had a total positive impact of $33 million, but a negative one time fiscal cost at the end of last year. The efficiency ratio was 51.5% during 1Q09 vs. 49.6% in 4Q08 and 53.5% in 1Q08. • Net Income During 1Q09, GFNorte reported Net Income of Ps 1.6 billion, 27% higher than 4Q08 and 16% lower than 1Q08. The YoY decline is mainly explained by the non-recurring Ps 275 million gain from the sale of shares of VISA obtained during 1Q08 as part of it’s IPO. Exluding this non-recurring line item, net income fell by 3% YoY, affected mainly by higher loan loss provisions as a result of deterioration in the consumer portfolio. The QoQ growth was mainly due to lower loan loss provisions and an increase in non operating income due to changes in the C-2 accounting criteria, which modified the valuation of benefits to be received from securitizations of Mortgage, State and Municipal loans.
Contacts: David Ricardo Suárez (México, D.F.) +52 (55) 5268 16 80 email: [email protected] Gabriela Renovato (Monterrey, N.L.) +52 (81) 8318 50 65 web page: www.banorte.com/ri
I. EXECUTIVE SUMMARY
NET INTEREST INCOME (Million Pesos)
5,161 5,225 5,748 6,451 6,199
1Q08 2Q08 3Q08 4Q08 1Q09
NON INTEREST EXPENSE ( Million Pesos)
3,799 3,9033,736
4,3694,142
1Q08 2Q08 3Q08 4Q08 1Q09
NON INTEREST INCOME (Million Pesos)
1,8452,360
2,0111,9711,942
1Q08 2Q08 3Q08 4Q08 1Q09
NET INCOME (Million Pesos)
1,928 1,806 2,0071,272 1,611
1Q08 2Q08 3Q08 4Q08 1Q09
According to the new criteria, effective as of January 2008, inflationary accounting no longer applies for re-expressing financial statements. Nonetheless, the figures for 2007 and previous years will continue to be expressed in pesos of December 2007.
First Quarter 2009.
2
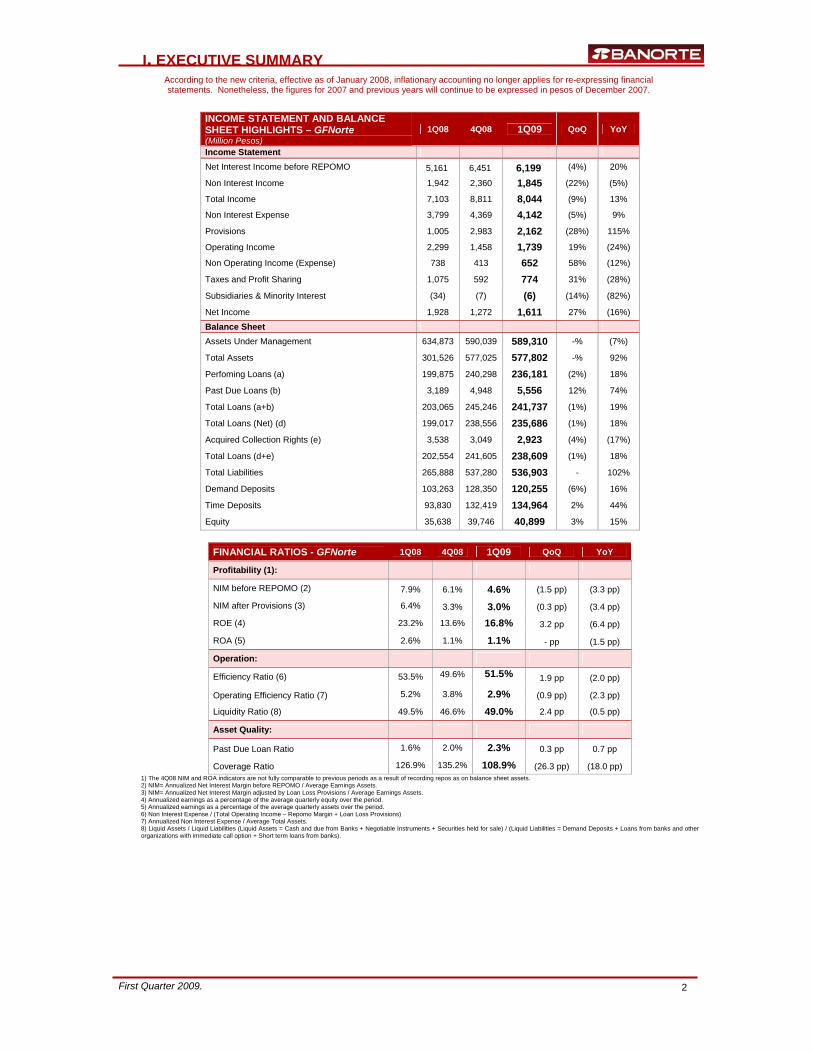
INCOME STATEMENT AND BALANCE SHEET HIGHLIGHTS – GFNorte (Million Pesos)
1Q08 4Q08 1Q09 QoQ YoY
Income Statement
Net Interest Income before REPOMO 5,161 6,451 6,199 (4%) 20%
Non Interest Income 1,942 2,360 1,845 (22%) (5%)
Total Income 7,103 8,811 8,044 (9%) 13%
Non Interest Expense 3,799 4,369 4,142 (5%) 9%
Provisions 1,005 2,983 2,162 (28%) 115%
Operating Income 2,299 1,458 1,739 19% (24%)
Non Operating Income (Expense) 738 413 652 58% (12%)
Taxes and Profit Sharing 1,075 592 774 31% (28%)
Subsidiaries & Minority Interest (34) (7) (6) (14%) (82%)
Net Income 1,928 1,272 1,611 27% (16%) Balance Sheet
Assets Under Management 634,873 590,039 589,310 -% (7%)
Total Assets 301,526 577,025 577,802 -% 92%
Perfoming Loans (a) 199,875 240,298 236,181 (2%) 18%
Past Due Loans (b) 3,189 4,948 5,556 12% 74%
Total Loans (a+b) 203,065 245,246 241,737 (1%) 19%
Total Loans (Net) (d) 199,017 238,556 235,686 (1%) 18%
Acquired Collection Rights (e) 3,538 3,049 2,923 (4%) (17%)
Total Loans (d+e) 202,554 241,605 238,609 (1%) 18%
Total Liabilities 265,888 537,280 536,903 - 102%
Demand Deposits 103,263 128,350 120,255 (6%) 16%
Time Deposits 93,830 132,419 134,964 2% 44%
Equity 35,638 39,746 40,899 3% 15%
FINANCIAL RATIOS - GFNorte 1Q08 4Q08 1Q09 QoQ YoY
Profitability (1):
NIM before REPOMO (2) 7.9% 6.1% 4.6% (1.5 pp) (3.3 pp)
NIM after Provisions (3) 6.4% 3.3% 3.0% (0.3 pp) (3.4 pp)
ROE (4) 23.2% 13.6% 16.8% 3.2 pp (6.4 pp)
ROA (5) 2.6% 1.1% 1.1% - pp (1.5 pp)
Operation:
Efficiency Ratio (6) 53.5% 49.6% 51.5% 1.9 pp (2.0 pp)
Operating Efficiency Ratio (7) 5.2% 3.8% 2.9% (0.9 pp) (2.3 pp)
Liquidity Ratio (8) 49.5% 46.6% 49.0% 2.4 pp (0.5 pp)
Asset Quality:
Past Due Loan Ratio 1.6% 2.0% 2.3% 0.3 pp 0.7 pp
Coverage Ratio 126.9% 135.2% 108.9% (26.3 pp) (18.0 pp) 1) The 4Q08 NIM and ROA indicators are not fully comparable to previous periods as a result of recording repos as on balance sheet assets. 2) NIM= Annualized Net Interest Margin before REPOMO / Average Earnings Assets. 3) NIM= Annualized Net Interest Margin adjusted by Loan Loss Provisions / Average Earnings Assets. 4) Annualized earnings as a percentage of the average quarterly equity over the period. 5) Annualized earnings as a percentage of the average quarterly assets over the period. 6) Non Interest Expense / (Total Operating Income – Repomo Margin + Loan Loss Provisions) 7) Annualized Non Interest Expense / Average Total Assets. 8) Liquid Assets / Liquid Liabilities (Liquid Assets = Cash and due from Banks + Negotiable Instruments + Securities held for sale) / (Liquid Liabilities = Demand Deposits + Loans from banks and other organizations with immediate call option + Short term loans from banks).
I. EXECUTIVE SUMMARY

According to the new criteria, effective as of January 2008, inflationary accounting no longer applies for re-expressing financial statements. Nonetheless, the figures for 2007 and previous years will continue to be expressed in pesos of December 2007.
First Quarter 2009.
3
1) 96.11% owned by GFNorte as of 2Q06. Since 3Q06 97.06% owned by GFNorte. On August of 2006 Banorte merged Bancen. N.C. = Non Comparable. 2) The merger of Leasing and Factoring became effective as of January 31, 2008
SHARE DATA 1Q08 4Q08 1Q09 QoQ YoY
Earnings per Share (Pesos) 0.96 0.63 0.80 27% (16%) Dividends per Share (Pesos) - 0.47 - - - Dividend Payout (Recurring net income) - 15% - - -
Book Value per Share (1) (Pesos) 16.78 18.73 19.26 3% 15%
Total Shares Outstanding (million shares) 2,018.3 2,018.3 2,018.3 - - Stock Price (Pesos) 46.14 24.88 18.83 (59%) (24%) P/BV (Times) 2.75 1.33 0.98 (26%) (64%) Market Capitalization (Million Dollars) 8,753 3,650 2,651 (27%) (70%)
1) Excluding Minority Holdings.
SUBSIDIARIES (Million Pesos)
1Q08 4Q08 1Q09 QoQ YoY
Bank 1,718 1,215 1,347 11% (22%)
Banco Mercantil del Norte (1) 1,718 1,215 1,347 11% (22%)
Broker Dealer 71 (89) 40 N.A. (43%)
Long Term Savings 79 100 119 19% 50%
Retirement Funds (Afore) 33 32 30 (8%) (10%)
Insurance 39 70 77 10% 100%
Annuities 8 (3) 12 N.A. 56%
Other Finance Companies 71 121 101 (16%) 43%
Leasing & Factoring (2) 66 115 94 (18%) 43%
Warehousing 5 6 7 27% 49%
Microlending (Pronegocio) (9) (80) 6 N.A. N.A.
G.F. Banorte (Holding Company) (2) 6 (2) (127%) N.A.
Total Net Income 1,928 1,272 1,611 27% (16%)
I. EXECUTIVE SUMMARY
SHARE PERFORMANCE (Base 100 = December 2005)
Bolsa
Banorte

According to the new criteria, effective as of January 2008, inflationary accounting no longer applies for re-expressing financial statements. Nonetheless, the figures for 2007 and previous years will continue to be expressed in pesos of December 2007.
First Quarter 2009.
4
• Organizational Changes On March 2, Alejandro Garay Espinoza was appointed Managing Director of Administration and on March 23 Javier Márquez Diez-Canedo was named Managing Director of Risk Management.
• Banorte strengthens its presence in Texas. On April 1st, 2009, Grupo Financiero Banorte announced the purchase of the remaining 30% of INB Financial Corp’s shares. ("INB"), the controlling company of Inter National Bank, headquartered in Texas, USA. Through this acquisition, Banorte concludes the original strategy outlined in January 2006, when Banorte acquired 70% of Inter National Bank. Banorte paid US $146.6 million dollars for this remaining stake of INB without having to recurr to external funding. This operation did not have an impact on Banorte’s regulatory capitalization since 100% of the transaction was booked in 2006.
• Issuance of Preferred Non Convertible Subordinated Debentures for Ps 2.2 billion in the Mexican
Stock Exchange. In order to strengthen its regulatory capital; Banorte issued Preferred Non Convertible Subordinated Debentures (BANORTE 09) for a total of Ps 2.2 billion with a 10 year maturity and an interest rate of 28 day TIIE plus 200 basis points. The securities were rated Aaa.mx by Moody's and AA (mex) by Fitch. The first three transactions carried out under this subordinated debt program were issued in 2008 in the local markets for approximately Ps 7.7 billion. • China Development Bank and Banorte sign an agreement of international cooperation On February 10th, 2009 China Development Bank and Grupo Financiero Banorte signed an important cooperation agreement, establishing the foundation through which both institutions can mutually serve their clientele mainly in China, Mexico and the United States by taking advantage of both institutions’ business platforms. • Restructuring Program for SME Clients Despite the prevailing economic environment, Banorte maintains its commitment to support and develop Mexican SMEs. On March 24, the bank launched an aggressive loan restructuring program for its Crediactivo clients, which will allow clients to meet their obligations by extending the loan term for up to 7 years and reducing interest rates if they remain current with their payments.
• Launching of “Banorte Movil” (Mobile). On March 5, the "Banorte Movil" service became available to our clients. This is an innovative electronic banking service that operates via cellular telephones and mobile devices using the Internet. Clients can access this service from anywhere in the country using a cellular phone, regardless of the phone’s model and the mobile telephone provider. During the first weeks of use, 15 thousand electronic banking clients downloaded this application to their cellular telephones.
• Launching of "Dollar Debit Card" On March 30, the "Tarjeta de Debito Dólares" (Dollar Debit Card) was launched, as well as the new "Enlace Dólares sin Chequera" (Dollar Savings Account without Checkbook). Both of these products were developed for clients who reside along Mexico’s border. • Banorte was Awarded "Best Financial Group 2009 in Mexico" by World Finance. In April, World Finance magazine recognized Grupo Financiero Banorte as the “Best Financial Group in Mexico”. This is the first time that a Mexican bank has been granted with this award from this prestigious publication, which is part of the London based "World News Media" publishing group. Banorte was recognized for its constant innovation, originality and quality of its products and services, continuous development of markets, its growing participation in all segments, as well as excellence in client service, among other things.
I. EXECUTIVE SUMMARY
RECENT EVENTS

According to the new criteria, effective as of January 2008, inflationary accounting no longer applies for re-expressing financial statements. Nonetheless, the figures for 2007 and previous years will continue to be expressed in pesos of December 2007.
First Quarter 2009.
5
NET INTEREST INCOME (Million Pesos)
1Q08 4Q08(1) 1Q09 QoQ YoY
Interest Income 11,307 14,061 13,141 (7%) 16% Interest Expense 6,247 7,766 7,095 (9%) 14% Loan Origination Fees 101 156 153 (2%) 52% Fees Paid (2) - - - - - Net Interest Income before REPOMO 5,161 6,451 6,199 (4%) 20% Average Earning Assets 261,871 424,890 540,851 27% 107% Net Interest Margin before REPOMO (3) 7.9% 6.1% 4.6%
1) In accordance with the accounting criteria B-3 “Repos” issued last October 14, as well as the authorization given by the Banking and Securities Commission (CNBV), credit institutions were allowed to classify debt instruments, regardless of their category, as Investments in Securities considering that: i) the guidelines relative to the reclassification of the instruments will be equally applicable to proprietary repos transactions and securities’ lending, given that investment in securities is equally done through these operations; ii) the value of the instruments to be received in repos and securities’ lending transactions may be adjusted to the market value (closing price) of such instruments corresponding to October 1, 2008 in the same manner as was stipulated for the book value adjustment of proprietary investments in securities; iii) once the book value of the instruments to be received in repos and securities’ lending operations has been adjusted, such instruments can be reclassified to any category of investments in securities according with the institutions’ intentionality for those instruments, and they will be later valued according to the valuation standards for each category established in the accounting criteria; iv) the reclassification of investments in securities, as well as the adjustment to the valuation of the repos to be received and securities’ lending transactions, will be done in only one occassion on the date that each institution determines during the last quarter of 2008. 2) Fees Paid, As a result of new accounting standards by the CNByV that went into effect as of January 2007 these fees were reclasificated into Other Fees Paid in Non Interest Income. 3) NIM = Annualized Net Interest Margin before REPOMO / Average Earnings Assets
• Net Interest Income Net Interest Income before Repomo reported a 20% YoY increase in 1Q09, driven by a 16% rise in interest income as a result of 18% annual growth in the performing loan portfolio, a 9 basis point increase in the TIIE average interest rate (TIIE averaged 8.02% in 1Q09 vs. 7.93% in 1Q08), coupled with a 16% increase in demand deposits. NII was also driven by a 52% increase in origination fees resulting from higher volumes, as well as the amortization of deferred fees from loans placed in 2007. NII had a (4%) QoQ loss vs. 4Q08, affected by a (7%) decline in interest income as a result of a 70 basis point decline in the average TIIE rate from the previous quarter (TIIE averaged 8.02% in 1Q09 vs. 8.72% in 4Q08) and less loan origination volumes. On a quarterly basis, the margin was also impacted by a 2% decline in loan fees and a 6% drop in demand deposits (associated with seasonality). Net Interest Margin (NIM) was 4.6% in 1Q09, 3.3 percentage points (pp) lower compared to the same quarter of the previous year. However, these figures are not fully comparable due to the significant increase in productive assets in 4Q08 as a result of accounting changes for the reclassification of repos issued by the National Banking and Securities Commission (CNBV). The NIM declined 1.5 pp in 1Q09 vs. 4Q08, affected by a drop in interest income given lower market interest rates and the impact of the new accounting regulations for repos.
GRUPO FINANCIERO BANORTE
II. FINANCIAL INFORMATION
NIM VS CETES7.9 7.5 7.7
6.1 4.6
7.37.7
8.17.57.4
1Q08 2Q08 3Q08 4Q08 1Q09
NIM
CETES

According to the new criteria, effective as of January 2008, inflationary accounting no longer applies for re-expressing financial statements. Nonetheless, the figures for 2007 and previous years will continue to be expressed in pesos of December 2007.
First Quarter 2009.
6
1) Since 1Q07, it only reflects Income from recoveries and amortizations of Real Estate Portfolios. Until 4Q06, it included income from recoveries and amortization of Acquired Portfolios. 2) Includes Fees received by Recovery Banking and by the Bank. 3) It includes fees from letters of credit, from transactions with pension funds, wharehousing services, financial advisory services and securities trading by the Brokerage House, among others.
• Non Interest Income Non interest Income reported a (5%) YoY and (22%) QoQ decline in 1Q09, affected by a reduction in various line items.
NON INTEREST INCOME (Million Pesos)
1Q08 4Q08 1Q09 QoQ YoY
Services 1,554 1,596 1,465 (8%) (6%) Recovery 190 205 138 (33%) (28%) Trading 198 559 241 (57%) 22% Non Interest Income 1,942 2,360 1,845 (22%) (5%)
• Service Fees Service Fees in 1Q09 reached Ps 1.4 billion, a (6%) YoY and (8%) QoQ decline. On an annual basis, the main declines were a (28%) reduction in fiduciary revenues, (11%) in other fees paid and (10%) in AFORE pension fund fees. Most of these line items were affected by a reduction in business volumes, while the AFORE was affected by changes in regulation. The QoQ decline is due to the (29%) reduction in fiduciary revenues, (10%) in credit card fees, (9%) in account management fees and (7%) in electronic banking services. The drop in these items is explained mainly by lower business volumes given the economic environment, and in the case of credit cards, also as a result of he bank’s initiatives to reduce or eliminate some fees in order to benefit clients and also in anticipation of regulatory changes in this front. • Recovery Non Interest Revenues from recoveries in 1Q09 were lower by (28%) YoY and (33%) QoQ. The YoY drop is mainly explained by lower revenues from investment projects, which generate revenues as the project advances, while the QoQ fall is explained by less recovery activity and a reduction in the revenues from investment projects due to the economic environment. The amount invested in these investment projects at closing of 1Q09 totaled Ps 3.16 billion, and the portfolio continues to be diversified by region, partner and industry. • Trading This line item registered a 22% YoY increase in 1Q09, which is explained by favorable dynamics in FX revenues over the last few months. The (57%) QoQ drop is mainly due to the extraordinary income of Ps 284 million registered in the 4Q08 from positive mark to market valuation from the recognition of substituting a loan from a State government with another loan with higher value in securitized State and Municipalloans. Excluding this extraordinary gain, Trading revenues were (12%) lower, affected mainly by the prevailing interest rate environment, while FX revenues were similar to those registered in the previous quarter.
NON INTEREST INCOME (Million Pesos)
1Q08 4Q08 1Q09 QoQ YoY
Fees charged on Services 2,026 2,138 1,914 (10%) (6%) Fund Transfers 52 63 60 (5%) 14% Account Management Fees 235 253 230 (9%) (2%) Fiduciary 69 72 51 (29%) (26%) Income from Real Estate Portfolios (1) 190 204 137 (33%) (28%) Electronic Banking Services 234 269 250 (7%) 7% Credit Card Fees 581 655 590 (10%) 1%
Fees from IPAB (2) - 1 - -% -%
Fees charged by Afore 256 230 231 - (10%)
Other Fees Charged (3) 408 391 365 (7%) (11%)
Fees Paid on Services 282 337 312 (8%) 11% Fund transfers 5 5 6 27% 22% Other Fees Paid 277 332 305 (8%) 10% Expenses from Real Estate Portfolios (1) - - - - - Net Fees 1,744 1,801 1,602 (11%) (8%)
Trading Income 198 559 241 (57%) 22% Non Interest Income 1,942 2,360 1,845 (22%) (5%)
II. FINANCIAL INFORMATION

According to the new criteria, effective as of January 2008, inflationary accounting no longer applies for re-expressing financial statements. Nonetheless, the figures for 2007 and previous years will continue to be expressed in pesos of December 2007.
First Quarter 2009.
7
Non Interest Expense (Million Pesos)
1Q08 4Q08 1Q09 QoQ YoY
Personnel Expenses 1,504 1,558 1,692 9% 13% + Professional Fees 227 437 334 (23%) 48% + Administrative and Promotion Expenses 1,255 1,288 1,187 (8%) (5%) + Rents, Depreciation & Amortization 417 436 452 4% 8% + Taxes other than income tax 183 391 209 (47%) 14% + Contributions to IPAB 213 259 267 3% 25% = Non Interest Expense 3,799 4,369 4,142 (5%) 9%
• Non Interest Expense Non Interest Expenses in 1Q09 registered a 9% YoY increase, driven by 13% YoY growth in personnel expenses related to the bank’s expansion programs, especially branches. Expenses also grew due to a 48% YoY increase in Professional Fees as a consequence of more expenses for the development of IT projects, as well as more legal and extrajudicial expenses related to portfolio recoveries and an increase in business consulting services. Other Taxes grew 14% YoY due to higher value added tax payments driven by more expenditures over the last year. Rents, Depreciations and Amortizations grew 4% YoY due to larger licensing payments associated with business growth and the impact of foreign exchange movements in these expenditures, as well as transfers of depreciation balances resulting from the merger of the real estate companies. Contributions to IPAB grew 25% YoY as a result of increased deposits. Expenses decreased by (5%) QoQ compared to 4Q08 mainly due to an (8%) QoQ reduction in Administration and Promotional Expenses resulting from less expenditures on infrastructure and systems’ maintenance, as well as computer hardware and software acquisitions. Other Taxes fell (47%) QoQ due to the Ps 220 million non recurring tax update during 4Q08 related to the fiscal treatment of loan portfolios acquired during 2004-2005. Expenses also declined due to a (23%) QoQ reduction in Professional Fees related to IT projects and portfolio recoveries. It is important to mention that in 4Q08, Banorte initiated a series of cost containment measures in anticipation of a weaker economic and business environment, which included the merger of a significant number of branches in order to improve efficiency. In February 2009, 50 branches were merged which will translate into higher efficiencies throughout the rest of the year. The efficiency ratio improved from 53.5% to 51.5% in 1Q09, supported by higher revenues. The slight deterioration from 4Q08’s 49.6% efficiency level was caused mainly by leverage reduction in total revenues. • Provisions Provisions created in 1Q09 reached Ps 2.1 billion, a 115% YoY increase, driven mainly by higher credit card delinquencies and the additional initial reserve requirements for credit cards mandated by authorities. The (28%) QoQ decline is attributed to lower reserve requirements by corporate loans as result of fully reserving an important loan in this segment during 4Q08. Provisions for 1Q09 represented 3.6% of the average loan portfolio, a considerable reduction from the 5% level of 4Q08.
II. FINANCIAL INFORMATION

According to the new criteria, effective as of January 2008, inflationary accounting no longer applies for re-expressing financial statements. Nonetheless, the figures for 2007 and previous years will continue to be expressed in pesos of December 2007.
First Quarter 2009.
8
NON OPERATING INCOME (EXPENSE) NET (Million Pesos)
1Q08 4Q08 1Q09 QoQ YoY
Non Operting Income 850 1,497 904 (40%) 6%
Other Revenues 548 273 421 54% (23%)
Foreign Exchange - - - - -
Recoveries 267 727 403 (45%) 51%
Repomo - Other Revenues - - - - -
Warehousing 35 497 81 (84%) 131%
Non Operating Expense (112) (1,084) (253) (77%) 126%
Other Expenses (77) (589) (173) (71%) 125%
Foreign Exchange - - - - -
Repomo - Other Expenses - - - - -
Warehousing (34) (495) (80) (84%) 135%
Non Operating Income (Expense), net 738 413 652 58% (12%)
• Non Operating Income (Expense), net During 1Q09, Non Operating Income (Expense), Net reached Ps 652 million, a 12% YoY decline due to a Ps 394 million nonrecurring pre-tax gain in 1Q08 from the sale of VISA’s shares (868,138 shares at a net price of USD 42.768 and an exchange rate of Ps 10.62), as well as an increase in Other Expenses caused by the release of reserves for legal contingencies. The 58% QoQ increase resulted from the positive impact of Ps 243 million given the changes to the C-2 accounting criteria for the valuation of benefits to be received from securitization of Mortgage, State and Municipal loan portfolios. Due to this change in criteria, the impact from changes in valuation of these securities will be accounted in Other Products as of January 2009. • Taxes Taxes and Profit Sharing totaled Ps 774 million during 1Q09, a 28% YoY decline due to higher profits registered in 1Q08. On a quarterly basis, Taxes grew 31 % due to higher net income in 1Q09. The effective tax rate in 1Q09 was 32%, the same level as in 4Q08 and lower than the 35% of 1Q08.
• Subsidiaries and Minority Interest This line item reported a loss of Ps 6 million in 1Q09, which breakdowns as follows: a Ps 89 million profit from Subsidiaries - mainly due to positive results from the Insurance company, and a negative impact of Ps 95 million from Minority interest as a consequence of an increase in net income of the AFORE pension fund (Banorte owns 51%), Banco Mercantil del Norte (GFNORTE owns 97.06% of Banorte) and Banorte USA (Banorte owned 70% until end of 1Q09). Capitalization (Million Pesos)
1Q08 2Q08 3Q08 4Q08 1Q09 QoQ YoY
Tier 1 Capital 27,527 29,982 30,538 28,300 29,358 4% 7%
Tier 2 capital 11,524 13,806 14,822 17,076 14,840 (13%) 29%
Net Capital 39,052 43,788 45,360 45,376 44,198 (3%) 13%
Credit Risk assets 187,531 194,173 197,080 204,884 203,501 (1%) 9%
Net Capital/ Credit Risk Assets 20.8% 22.6% 23.0% 22.1% 21.7% (0.4 pp) 0.9 pp
Total Risk Assets (1) 267,175 278,933 287,412 302,279 301,897 -% 13%
Tier 1 10.3% 10.7% 10.6% 9.4% 9.7% 0.4 pp (0.6 pp)
Tier 2 4.3% 5.0% 5.2% 5.6% 4.9% (0.7 pp) 0.6 pp
Capitalization Ratio 14.6% 15.7% 15.8% 15.0% 14.6% (0.4 pp) - pp (1) Includes Market and Operational Risks. Without inter-company eliminations. (*) The capitalization ratio of the last period reported is estimated. (**) The capitalization ratio of 4Q08 was revised upwards due to an adjustment in the calculation of subordinated debentures as regulatory capital.
II. FINANCIAL INFORMATION

According to the new criteria, effective as of January 2008, inflationary accounting no longer applies for re-expressing financial statements. Nonetheless, the figures for 2007 and previous years will continue to be expressed in pesos of December 2007.
First Quarter 2009.
9
• Capitalization At closing of 1Q09, the Capitalization Ratio was 14.6% considering credit, market and operational risks, and 21.7% when considering credit risks only. The Tier 1 capital ratio was 9.7% and 4.9% for Tier 2. The 0.4 percentage points (pp) drop vs. 4Q08 is mainly explained by the amortization last February of USD 300 million in subordinated debentures, which were considered as Tier 2 capital. The Capitalization Ratio remained at the same level registered in 1Q08 due the reinvestment of profits generated during the year and the issuance of Ps 8.9 billion in subordinated debt for during the LTM. This helped to offset a 13% growth in Total Risk Assets, as well as the impact from several regulatory and market driven events. In 2008, the authorities determined that the requirement for operational risk must be fully constituted during a 3 year term in in proportional monthly allotments. At closing of 1Q09, the period from March 2008-2009 has been covered, (13/36 months), with ahaving impacto of 61 basis points on the capitalization ratio.
II. FINANCIAL INFORMATION
CAPITALIZATION RATIO
4.3 5.6 4.9
10.3 9.4 9.7
1Q08 4Q08 1Q09
Tier 1 Tier 2
14.6% 15.0% 14.6%

According to the new criteria, effective as of January 2008, inflationary accounting no longer applies for re-expressing financial statements. Nonetheless, the figures for 2007 and previous years will continue to be expressed in pesos of December 2007.
First Quarter 2009.
10
DEPOSITS (Million Pesos)
1Q08 4Q08 1Q09 QoQ YoY
Non Interest Bearing Demand Deposits 43,342 57,876 54,041 (7%) 25% Interest Bearing Demand Deposits (1) 59,923 70,481 66,213 (6%) 10% Total Demand Deposits (2) 103,266 128,357 120,254 (6%) 16% Time Deposits – Retail 63,067 75,085 82,308 10% 31% Core Deposits 166,333 203,442 202,562 - 22% Money Market (3) 30,904 57,454 52,730 (8%) 71% Total Bank Deposits 197,236 260,896 255,292 (2%) 29%
GFNorte’s Total Deposits (4) 197,084 260,755 255,203 (2%) 29%
Third Party Deposits 168,131 144,916 177,147 22% 5%
Total Assets Under Management 365,368 405,812 432,439 7% 18% 1) Includes Debit Cards. 2) Excludes IPAB cash management checking accounts for loan portfolios managed from Banpaís and Bancen. The balances of these accounts in 1Q08, 4Q08 and 1Q09 were Ps $8 million, Ps $14 million and Ps $16 million, respectively. 3) Includes Bank Bonds (Customers and Financial intermediaries). 4) Includes the eliminations between the subsidiaries (1Q08=153 millions, 4Q08=142 millIons and 1Q09=88 millions).
• Total Deposits At closing of 1Q09, Total Deposits were Ps 255.2 billion, a 29% YoY increase vs. 1Q08, driven mainly by 16% YoY growth in Demand Deposits, and in particular, by an important 25% increase in non-interest bearing demand deposits due to higher balances in Enlace Corporate Checking Accounts. Core Deposits declined by (2%) QoQ, due to seasonal effects as a result of smaller balances held in accounts at the beginning of the year. • Demand and Term Deposits Demand Deposits grew 16% YoY at closing of 1Q09, driven by a 25% YoY increase in non-interest bearing demand deposits due to increased balances in Enlace Corporate Checking Accounts, as well as a 10% increase in interest-bearing demand deposits due to higher balances in Banorte Facil, Suma, Sumanomina, Enlace Individual and Corporate Interest Yielding Checking Accounts, as well as Demand Investments. On a quarterly basis, Demand Deposits fell (6%) affected mainly by a (7%) QoQ drop in non-interest bearing demand deposits and a(6%) QoQ decline in interest bearing demand deposits as a consequence of lower balances held in clients’ accounts at the start of every year. Retail time deposits increased 31% YoY and 10% QoQ in 1Q09, as a result of a successful campaign to promote the "Pagamás" and "Ganamás" retail promissory notes with 7 and 14 day maturities, as well as the traditional 28 day option. As a result of the efforts to increase deposits, 226,000 new personal accounts and 4,150 new corporate accounts were opened during the quarter (net of cancellations). • Money Market Deposits The 71% YoY growth was mainly driven by greater institutional customer balances (companies, states and municipalities), as well as an adequate management of relations with our clients. The (8%) QoQ drop is mainly explained by the migration of mutual funds’ clientele towards other deposit products within the bank. • Third Party Deposits Registered a 5% YoY rise during 1Q09 due to more customer securities received in custody, as well as other assets in custody or under management. The 22% QoQ increase was due to greater assets in custody or under management, as well as third-party investment banking transactions.
• Assets Under Management At closing of 1Q09, total AUM were Ps 432.4 billion, an 18% YoY increase, driven by growth in bank and money market deposits. The 7% QoQ increase from 4Q08 is a result of increased retail time deposits and third-party deposits.
II. FINANCIAL INFORMATION

According to the new criteria, effective as of January 2008, inflationary accounting no longer applies for re-expressing financial statements. Nonetheless, the figures for 2007 and previous years will continue to be expressed in pesos of December 2007.
First Quarter 2009.
11
• Total Performing Loans Total Performing Loans increased 18% YoY, growing from Ps 198.7 billion at closing of 1Q08 to Ps 235.4 billion in 1Q09, excluding loan portfolios managed by Recovery Banking. This growth was driven by all segments in the loan portfolio, especially government, commercial and mortgage loans. On a quarterly basis, total Performing Loans fell (2%) vs 4Q08, mainly due to a reduction in the credit card, payroll, commercial and corporate portfolios. This decline is explained by an industrywide deceleration in loan activityover the last months in Mexico, as a consequence of lower demand in light of the economic environment, coupled with the more restrictive origination policies adopted by most financial institutions. In Banorte’s case, stricter origination standards are preventive measures to face the current market situation. Banorte has tried to offset the decline in industry-wide lending with more penetration in those sectors which continue to provide adequate levels of risk adjusted profitability and lower capital consumption, such as government loans. The bank is also seeking to take advantage of market opportunities derived from lower presence by our competitors in various segments. Loan growth by segments was: I. Loans to Individuals
Consumer + Mortgage: during 1Q09, grew 11% but fell (1%) QoQ. On an annual basis, growth was
mainly driven by an increase in mortgage and payroll loans, while the quarterly decline was due to a reduction in the credit card, payroll and car loans.
⋅ Mortgage: grew 22% YoY and 2% QoQ, despite a (39%) annual and (46%) quarterly decline in new loan production. Lower origination is mainly explained by less credit demand in the market, adjustments to the credit evaluation model and greater restrictions to originate loans in certain product categories. Durign the LTM, 18,360 new loans were placed, and 2,620 during 1Q09.
⋅ Credit Card: Registered an (8%) YoY and QoQ reduction at closing of 1Q09, as a consequence of a (83%) annual and a (16%) quarterly decline in new cards originated due to more conservative policies and less loan demand in the market. At closing of 1Q09, Banorte had 1.19 million accounts, (7%) less than those registered during the same period in 2008.
⋅ Payroll and Personal Loans: At closing of 1Q09, the portfolio grew 3% YoY, as a result of promotional strategies implemented during 2008 to increase penetration in payroll loans. Additionally, the efforts to attract corporate and government payroll clients have expanded the bank’s potential payroll loan client base, and efforts have been made to penetrate our current payroll
PERFORMING LOAN PORTFOLIO (Million Pesos)
1Q08 4Q08 1Q09 QoQ YoY
Commercial 75,914 92,521 89,247 (4%) 18% Consumer 66,618 74,868 74,049 (1%) 11% Corporate 38,696 45,127 43,533 (4%) 12% Government 17,556 26,989 28,592 6% 63%
Sub Total 198,784 239,505 235,421 (2%) 18% Recovery Banking 1,091 794 760 (4%) (30%)
Total 199,875 240,299 236,181 (2%) 18% PERFORMING CONSUMER LOAN PORTFOLIO (Million Pesos)
1Q08 4Q08 1Q09 QoQ YoY
Mortgages 37,978 45,499 46,275 2% 22% Car Loans 7,411 7,594 7,521 (1%) 1% Credit Cards 15,005 15,067 13,837 (8%) (8%) Payroll 6,223 6,707 6,417 (4%) 3% Consumer Loans 66,618 74,868 74,049 (1%) 11%
(Million Pesos) 1Q08 4Q08 1Q09 QoQ YoY
IPAB Loans - - - - - Past Due Loans 3,189 4,948 5,556 12% 74%
Loan Loss Reserves 4,048 6,690 6,051 (10%) 49%
Acquired Rights 3,538 3,049 2,923 (4%) (17%)
II. FINANCIAL INFORMATION
According to the new criteria, effective as of January 2008, inflationary accounting no longer applies for re-expressing financial statements. Nonetheless, the figures for 2007 and previous years will continue to be expressed in pesos of December 2007.
First Quarter 2009.
12
deposit client base. On a quarterly basis, payroll loans dropped (4%) as a result of lower personal loans’ sales and lower credit demand given the country’s adverse employment situation.
⋅ Car Loans: This portfolio grew 1% YoY as a result of enhancements made in 2007 and 2008 to loan origination processes. On a quarterly basis, the portfolio declined (1%) QoQ as a result of lower domestic car sales and a more conservative approach to this segment in response to adverse economic conditions.
II. Loans to Institutions
Commercial: This portfolio grew 18% YoY in 1Q09, due to promotional strategies (Empuje Banorte) targeted to SMEs, which include a package of comprehensive solutions (Paquete PYMES and Crediactivo), as well as the efforts to increase placements at the branch level. The authorities also increased the loan amount that can be originated at branch level using parametric models, which has facilitated the access of SMEs to these loans. The portfolio’s balance fell (4%) QoQ due to payments received from some clients, as well as seasonal effects that reduce loan sales in the first few months of the year and lower loan demand due to an adverse economic environment.
Corporate: Grew 12% YoY, but declined (4%) QoQ in 1Q09. The annual growth was driven by higher
loan placements during the last 12 months derived from attractive market opportunities. In light of the adverse economic environment, it is important to note that Banorte’s corporate loan portfolio is well diversified by regions and sectors, and has low concentration levels. The bank’s 20 most important corporate exposures represent 15% of the bank’s total loan portfolio; with the largest corporate loan representing 1.9% of the total portfolio, while number 20 represents only 0.4%.
Government: Grew 63% YoY and 6% QoQ in 1Q09 as a result of efforts to establish comprehensive
banking relationships with these entities, by offering comprehensive solutions to suit their financial needs, as well as structuring of loans to finance their investment needs.
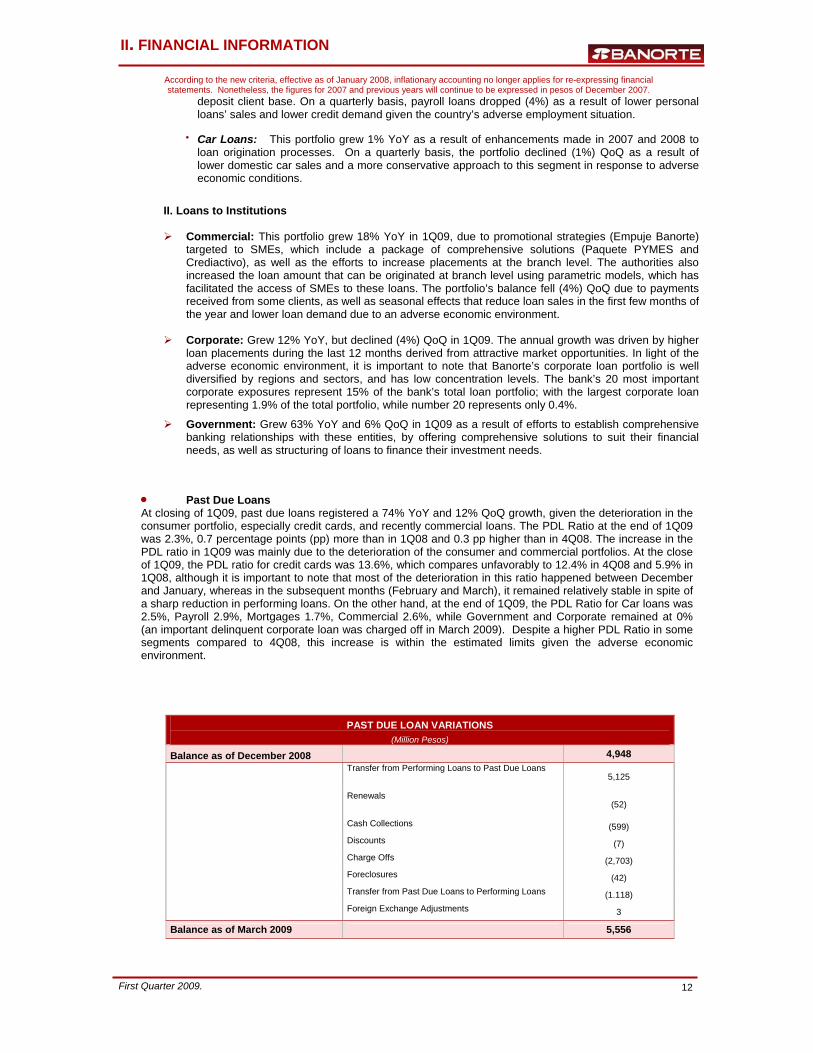
• Past Due Loans At closing of 1Q09, past due loans registered a 74% YoY and 12% QoQ growth, given the deterioration in the consumer portfolio, especially credit cards, and recently commercial loans. The PDL Ratio at the end of 1Q09 was 2.3%, 0.7 percentage points (pp) more than in 1Q08 and 0.3 pp higher than in 4Q08. The increase in the PDL ratio in 1Q09 was mainly due to the deterioration of the consumer and commercial portfolios. At the close of 1Q09, the PDL ratio for credit cards was 13.6%, which compares unfavorably to 12.4% in 4Q08 and 5.9% in 1Q08, although it is important to note that most of the deterioration in this ratio happened between December and January, whereas in the subsequent months (February and March), it remained relatively stable in spite of a sharp reduction in performing loans. On the other hand, at the end of 1Q09, the PDL Ratio for Car loans was 2.5%, Payroll 2.9%, Mortgages 1.7%, Commercial 2.6%, while Government and Corporate remained at 0% (an important delinquent corporate loan was charged off in March 2009). Despite a higher PDL Ratio in some segments compared to 4Q08, this increase is within the estimated limits given the adverse economic environment.
PAST DUE LOAN VARIATIONS (Million Pesos)
Balance as of December 2008 4,948 Transfer from Performing Loans to Past Due Loans
5,125
Renewals (52)
Cash Collections (599)
Discounts (7)
Charge Offs (2,703)
Foreclosures (42)
Transfer from Past Due Loans to Performing Loans (1.118)
Foreign Exchange Adjustments 3
Balance as of March 2009 5,556
II. FINANCIAL INFORMATION
According to the new criteria, effective as of January 2008, inflationary accounting no longer applies for re-expressing financial statements. Nonetheless, the figures for 2007 and previous years will continue to be expressed in pesos of December 2007.
First Quarter 2009.
13
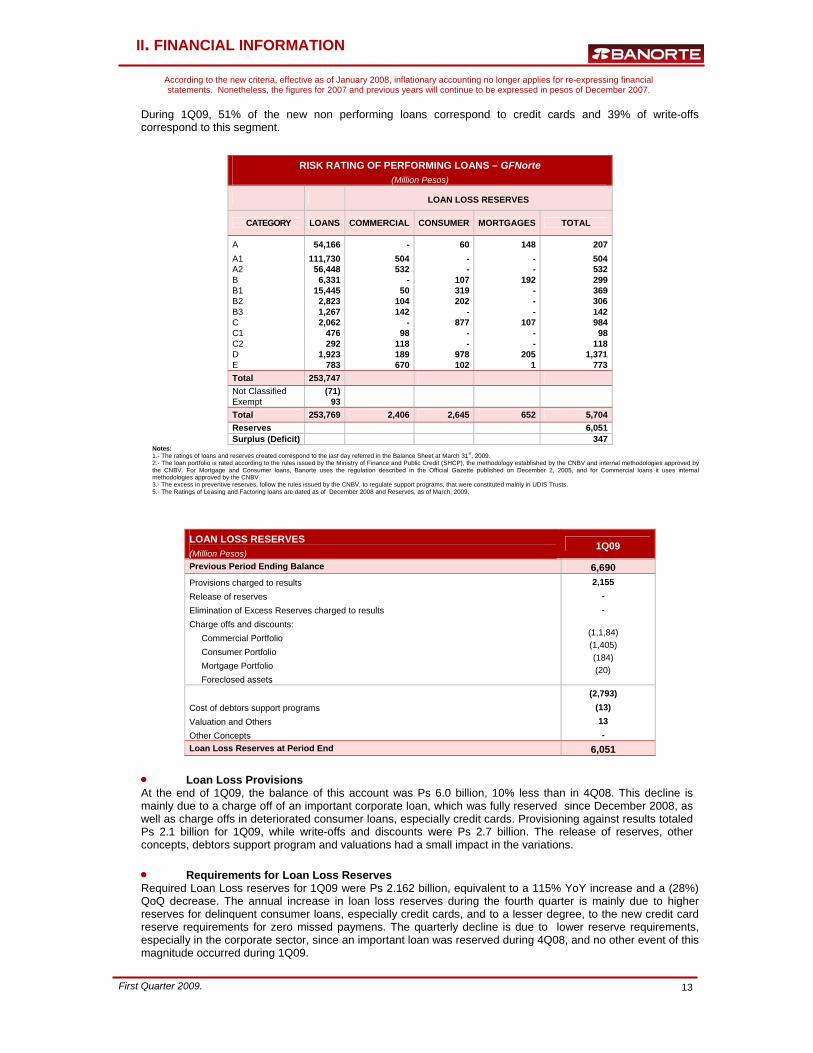
During 1Q09, 51% of the new non performing loans correspond to credit cards and 39% of write-offs correspond to this segment.
RISK RATING OF PERFORMING LOANS – GFNorte (Million Pesos)
LOAN LOSS RESERVES
CATEGORY LOANS COMMERCIAL CONSUMER MORTGAGES TOTAL
A 54,166 - 60 148 207 A1 111,730 504 - - 504 A2 56,448 532 - - 532 B 6,331 - 107 192 299 B1 15,445 50 319 - 369 B2 2,823 104 202 - 306 B3 1,267 142 - - 142 C 2,062 - 877 107 984 C1 476 98 - - 98 C2 292 118 - - 118 D 1,923 189 978 205 1,371 E 783 670 102 1 773 Total 253,747 Not Classified (71) Exempt 93 Total 253,769 2,406 2,645 652 5,704 Reserves 6,051 Surplus (Deficit) 347
Notes: 1.- The ratings of loans and reserves created correspond to the last day referred in the Balance Sheet at March 31st, 2009. 2.- The loan portfolio is rated according to the rules issued by the Ministry of Finance and Public Credit (SHCP), the methodology established by the CNBV and internal methodologies approved by the CNBV. For Mortgage and Consumer loans, Banorte uses the regulation described in the Official Gazette published on December 2, 2005, and for Commercial loans it uses internal methodologies approved by the CNBV. 3.- The excess in preventive reserves, follow the rules issued by the CNBV, to regulate support programs, that were constituted mainly in UDIS Trusts. 5.- The Ratings of Leasing and Factoring loans are dated as of December 2008 and Reserves, as of March, 2009.
LOAN LOSS RESERVES (Million Pesos)
1Q09
Previous Period Ending Balance 6,690 Provisions charged to results 2,155 Release of reserves - Elimination of Excess Reserves charged to results - Charge offs and discounts: Commercial Portfolio Consumer Portfolio Mortgage Portfolio Foreclosed assets
(1,1,84) (1,405) (184)
(20)
(2,793) Cost of debtors support programs (13) Valuation and Others 13 Other Concepts - Loan Loss Reserves at Period End 6,051
• Loan Loss Provisions At the end of 1Q09, the balance of this account was Ps 6.0 billion, 10% less than in 4Q08. This decline is mainly due to a charge off of an important corporate loan, which was fully reserved since December 2008, as well as charge offs in deteriorated consumer loans, especially credit cards. Provisioning against results totaled Ps 2.1 billion for 1Q09, while write-offs and discounts were Ps 2.7 billion. The release of reserves, other concepts, debtors support program and valuations had a small impact in the variations. • Requirements for Loan Loss Reserves Required Loan Loss reserves for 1Q09 were Ps 2.162 billion, equivalent to a 115% YoY increase and a (28%) QoQ decrease. The annual increase in loan loss reserves during the fourth quarter is mainly due to higher reserves for delinquent consumer loans, especially credit cards, and to a lesser degree, to the new credit card reserve requirements for zero missed paymens. The quarterly decline is due to lower reserve requirements, especially in the corporate sector, since an important loan was reserved during 4Q08, and no other event of this magnitude occurred during 1Q09.
II. FINANCIAL INFORMATION

According to the new criteria, effective as of January 2008, inflationary accounting no longer applies for re-expressing financial statements. Nonetheless, the figures for 2007 and previous years will continue to be expressed in pesos of December 2007.
First Quarter 2009.
14
INCOME STATEMENT & BALANCE SHEET HIGHLIGHTS– Banking (Million Pesos)
1Q08 4Q08 1Q09 QoQ YoY
Income Statement Net Interest Income before Repomo 4,903 6,181 5,965 (3%) 22%
Provisions 987 2,914 2,144 (26%) 117%
Non Interest Income 1,532 1,978 1,445 (27%) (6%)
Non Interest Expense 3,408 3,945 3,779 (4%) 11%
Non Operating Income (Expense), Net 767 540 649 20% (15%)
Pre-Tax Income 2,808 1,840 2,137 16% (24%)
Net Income 1,804 1,285 1,418 10% (21%)
Balance Sheet
Performing Loans 193,514 231,400 228,126 (1%) 18%
Deposits 197,245 260,911 255,307 (2%) 29%
• Net Interest Income Net Interest Income before Repomo in 1Q09 increased by 22% YoY, driven by a 18% growth in the overall performing loan portfolio, an increase in fees charged for loan originations and substantial growth in demand deposits. NII dropped (3%) QoQ due to a (1%) decline in performing loans and a reduction in market interest rates. The bank’s NIM was 4.5% at closing of 1Q09, 3.2 percentage points (pp) less than 1Q08 and 0.5 pp less than 4Q08. • Loan Loss Reserves Loan Loss Reserves for 1Q09 were 117% higher YoY and (26%) less QoQ. The annual increase is caused by a rise in credit card delinquencies, while the quarterly reduction is a result of lower reserve requirements in the corporate segment. • Non Interest Income During 1Q09 there was a (6%) YoY and (27%) QoQ decline affected by a reduction in service fees, less income from recoveries of acquired real estate portfolios and trading revenues. • Non interest Expenses Non Interest Expenses (NIE) increased 11% YoY in 1Q09, as a result of higher Personnel Expenses associated with the branch expansion program. On a quarterly basis, NIE dropped (4%) due to lower administration and promotional expenses, a reduction in professional fees, other taxes, as well as lower expenditures in rents, amortizations and depreciations. The efficiency ratio stood at 51% in 1Q09, 2 pp lower vs. 1Q08, but 2.2 pp higher compared to 4Q08, mainly due to lower revenues. • Non Operating Income This line dropped (24%) YoY given the extraordinary income from the sale of VISA shares which was registered during 1Q08. The 20% QoQ increase is a result of the positive impact caused by the modification in the criteria for valuation of benefits to be received from Mortgage, State and Municipal loan securitizations.
• Net Income The Bank’s accumulated profits (100%, including the Afore through the participation method) totaled Ps 1.4 billion during 1Q09, a (21%) YoY decline caused by an increase in provisions and operating expenses, coupled with lower non interest income. Profits grew 10% QoQ given lower provisions, a reduction in operating expenses and an increase in non operating revenues. The bank’s ROE was 15.7% at the end of 1Q09, 7.5 pp lower than in 1Q08, although it represents a 1.2 pp increase vs 4Q08.
II. FINANCIAL INFORMATION
BANKING SECTOR

According to the new criteria, effective as of January 2008, inflationary accounting no longer applies for re-expressing financial statements. Nonetheless, the figures for 2007 and previous years will continue to be expressed in pesos of December 2007.
First Quarter 2009.
15
FINANCIAL RATIOS – Banking Sector (Million Pesos)
1Q08 4Q08 1Q09 QoQ YoY
Profitability
NIM (1) 7.7% 6.0% 4.5% (1.5 pp) (3.2 pp)
ROE (2) 23.2% 14.5% 15.7% 1.2 pp (7.5 pp)
ROA (3) 2.5% 1.1% 1.0% (0.1 pp) (1.5 pp)
Operation
Efficiency Ratio (4) 53.0% 48.4% 51.0% 2.6 pp (2.0 pp)
Operating Efficiency Ratio (5) 4.8% 3.5% 2.7% (0.8 pp) (2.1 pp)
Liquidity Ratio (6) 50.8% 48.9% 51.0% 2.1 pp 0.2 pp
Asset Quality
Past Due Loan Ratio 1.5% 2.0% 2.3% 0.3 pp 0.8 pp
Coverage Ratio 130.6% 136.1% 109.2% (26.9 pp) (21.4 pp)
Growth (7)
Performing Loans (8) 29% 25% 18% (7.0 pp) (11.0 pp)
Core Deposits 11% 16% 22% 6.0 pp 11.0 pp
Total Deposits 13% 28% 29% 1.0 pp 16.0 pp
Capitalization
Net Capital/ Credit Risk Assets 20.8% 22.1% 21.7% (0.4 pp) 0.9 pp
Total Capitalization Ratio 14.6% 15.0% 14.6% (0.4 pp) - pp
1) NIM = Annualized Net Interest Margin before REPOMO / Average Earnings Assets. 2) Annualized earnings as a percentage of the average quarterly equity over the period. 3) Annualized earnings as a percentage of the average quarterly assets over the period. 4) Non Interest Expense / (Total Operating Income – Repomo Margin + Loan Loss Provisions) 5) Annualized Administrative and Promotion Expenses / Average Total Assets. 6) Liquid Assets / Liquid Liabilities (Liquid Assets = Cash and due from Banks + Negotiable Instruments + Securities held for sale, Liquid Liabilities = Demand Deposits + Loans from banks and other institutions with option to redeem any moment + short term loans from banks. 7) Growth versus the previous period. 8) Does not include Fobaproa / IPAB and loans managed by Recovery Banking.
II. FINANCIAL INFORMATION
ROE (BANKING SECTOR)
15.7%14.5%21.9%19.3%
23.2%
1Q08 2Q08 3Q08 4Q08 1Q09
According to the new criteria, effective as of January 2008, inflationary accounting no longer applies for re-expressing financial statements. Nonetheless, the figures for 2007 and previous years will continue to be expressed in pesos of December 2007.
First Quarter 2009.
16
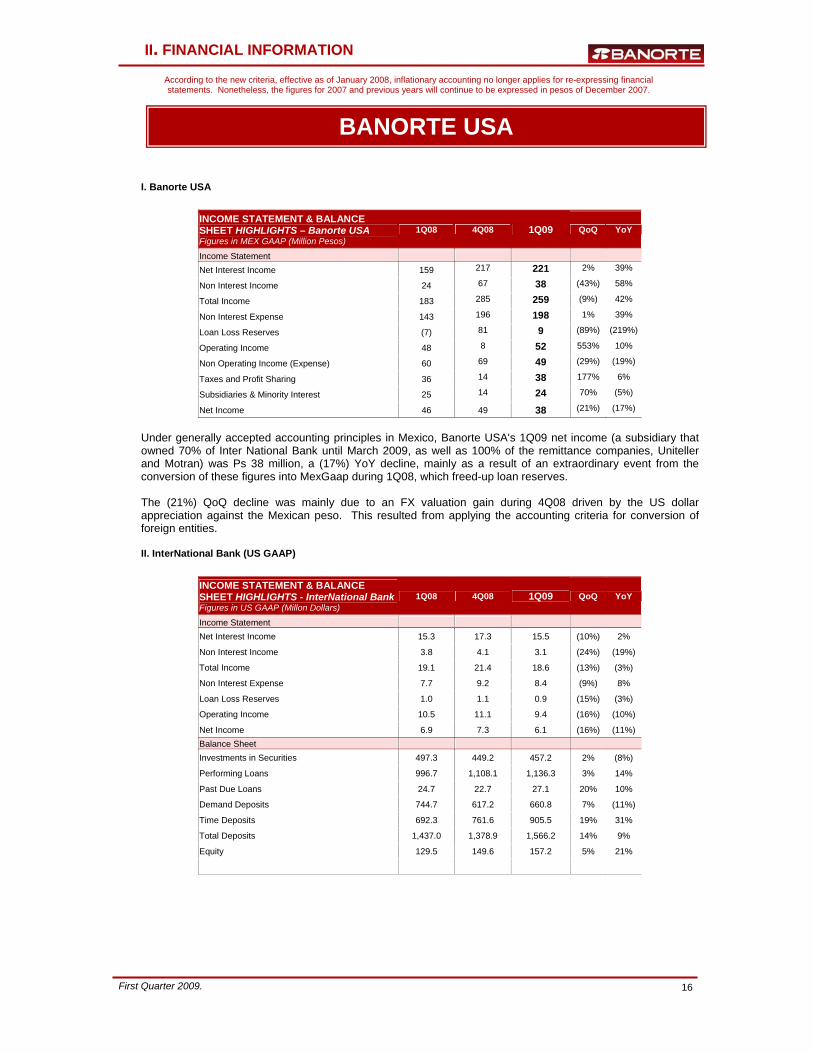
I. Banorte USA
INCOME STATEMENT & BALANCE SHEET HIGHLIGHTS – Banorte USA Figures in MEX GAAP (Million Pesos)
1Q08 4Q08 1Q09 QoQ YoY
Income Statement
Net Interest Income 159 217 221 2% 39%
Non Interest Income 24 67 38 (43%) 58%
Total Income 183 285 259 (9%) 42%
Non Interest Expense 143 196 198 1% 39%
Loan Loss Reserves (7) 81 9 (89%) (219%)
Operating Income 48 8 52 553% 10%
Non Operating Income (Expense) 60 69 49 (29%) (19%)
Taxes and Profit Sharing 36 14 38 177% 6%
Subsidiaries & Minority Interest 25 14 24 70% (5%)
Net Income 46 49 38 (21%) (17%)
Under generally accepted accounting principles in Mexico, Banorte USA's 1Q09 net income (a subsidiary that owned 70% of Inter National Bank until March 2009, as well as 100% of the remittance companies, Uniteller and Motran) was Ps 38 million, a (17%) YoY decline, mainly as a result of an extraordinary event from the conversion of these figures into MexGaap during 1Q08, which freed-up loan reserves. The (21%) QoQ decline was mainly due to an FX valuation gain during 4Q08 driven by the US dollar appreciation against the Mexican peso. This resulted from applying the accounting criteria for conversion of foreign entities. II. InterNational Bank (US GAAP)
INCOME STATEMENT & BALANCE SHEET HIGHLIGHTS - InterNational BankFigures in US GAAP (Millon Dollars)
1Q08 4Q08 1Q09 QoQ YoY
Income Statement
Net Interest Income 15.3 17.3 15.5 (10%) 2%
Non Interest Income 3.8 4.1 3.1 (24%) (19%)
Total Income 19.1 21.4 18.6 (13%) (3%)
Non Interest Expense 7.7 9.2 8.4 (9%) 8%
Loan Loss Reserves 1.0 1.1 0.9 (15%) (3%)
Operating Income 10.5 11.1 9.4 (16%) (10%)
Net Income 6.9 7.3 6.1 (16%) (11%) Balance Sheet Investments in Securities 497.3 449.2 457.2 2% (8%)
Performing Loans 996.7 1,108.1 1,136.3 3% 14%
Past Due Loans 24.7 22.7 27.1 20% 10%
Demand Deposits 744.7 617.2 660.8 7% (11%)
Time Deposits 692.3 761.6 905.5 19% 31%
Total Deposits 1,437.0 1,378.9 1,566.2 14% 9%
Equity 129.5 149.6 157.2 5% 21%
II. FINANCIAL INFORMATION
BANORTE USA

According to the new criteria, effective as of January 2008, inflationary accounting no longer applies for re-expressing financial statements. Nonetheless, the figures for 2007 and previous years will continue to be expressed in pesos of December 2007.
First Quarter 2009.
17
Under US GAAP, Inter National Bank’s (INB) total net income was US $6.1million during 1Q09, an (11%) YoY decline, which is mainly explained by an extraordinary gain from the sale of securities (securities available for sale) in 2008 and to a lesser extent, higher operating expenses. Profits fell (16%) QoQ given less net interest income as a consequence of lower market interest rates in the USA, as well as a reduction in non interest income given the extraordinary gain from the sale of securities registered in 2008. Regarding INB’s asset composition, the bank holds a portfolio of Mortgage Backed Securities (MBS), which showed an (8%) YoY contraction, but grew 2% QoQ. The quality of the underlying mortgages is AAA. At the close of 1Q09, this portfolio shows an unrealized gain of US $6.5 million. Its average weighted life is 3 years. Total performing loans rose 14% YoY, driven mainly by an increase in mortgage loans granted to Americans acquiring recreational or retirement properties in Mexico, and loans to companies guaranteed by commercial real estate. It is important to note that commercial real estate loans have not been affected by the difficult economic situation, as in other regions in the USA, mainly because the Texan economy has proven more resilient than other parts of the country. On a quarterly basis, performing loans rose 3% QoQ, from USD $1.11 billion to USD $1.13 billion, as a result of increased balances in mortgage and commercial loans. PDLs registered a 10% YoY and 20% QoQ increase mainly due to higher mortgage delinquencies, given the adverse market environment for this particular sector. It is important to note that INB uses US criteria to classify past due loans (30+ vs. 60+ days in Mexico). The past due loan ratio was 2.3% at the close of 1Q09, a decrease of 0.1 pp compared to 1Q08, but a 0.3 pp QoQ increase compared to 4Q08. Overall deposits increased 9% YoY and 14% QoQ, driven by higher time deposits. Finally, INB’s capitalization ratio stood at 13.3% at the end of 1Q09, posting a significant 1.8 pp YoY increase. Leverage rose 0.7 pp YoY to 8.2% in 1Q09. With respect to Asset Quality indicators, the Past-Due Loan Ratio fell 0.1 pp YoY to 2.3%, whereas the Reserve Coverage rose 9.4 pp to 54%. Although the profitability and operational ratios deteriorated, they are within acceptable levels considering the difficult situation affecting most US financial institutions. ROE dropped 5.8 pp to 16.5% and ROA decreased 0.3 pp to 1.4%. The NIM fell 0.3 pp to 3.9% and the Efficiency Ratio increased 4.5 pp to 44.9%.
Financial Ratios INB Figures in US GAAP 1Q08 4Q08 1Q09 QoQ YoY
Profitability:
NIM 4.2% 4.4% 3.9% (0.4 pp) (0.3 pp)
ROE 22.3% 20.2% 16.5% (3.6 pp) (5.8 pp)
ROA 1.7% 1.7% 1.4% (0.3 pp) (0.3 pp)
Operational:
Efficiency Ratio 40.3% 43.0% 44.9% 1.8 pp 4.5 pp Asset Quality:
Past Due Loan Ratio 2.4% 2.0% 2.3% 0.3 pp (0.1 pp)
Coverage Ratio 44.5% 61.1% 54.0% (7.1 pp) 9.4 pp
Capitalization:
Leverage Ratio 7.5% 8.0% 8.2% 0.2 pp 0.7 pp
Capitalization Ratio 11.5% 12.5% 13.3% 0.8 pp 1.8 pp
II. FINANCIAL INFORMATION

According to the new criteria, effective as of January 2008, inflationary accounting no longer applies for re-expressing financial statements. Nonetheless, the figures for 2007 and previous years will continue to be expressed in pesos of December 2007.
First Quarter 2009.
18
INCOME STATEMENT HIGHLIGHTS – Recovery Banking (Million Pesos)
1Q08 1Q09 YoY
Net Interest Income (54) (63) 17%
Loan Loss Provisions 34 11 (68%)
Non Interest Income 336 325 (3%)
Non Interest Expense 176 184 5%
Non Operating Income (Expense), net 169 147 (13%)
Pre-tax Income & Subsidiaries 242 214 (12%)
Income Tax & Profit Sharing 75 68 (9%)
Undistributed Earnings of Subsidiaries - - -
Net Income 167 146 (13%) As of 1Q07, the financial information of Sólida Administradora de Portafolios is consolidated in Banorte according to the new accounting standards that went into effect in January 2007.
ASSETS UNDER MANAGEMENT (Million Pesos)
1Q09 ACCOUNTING IN THE BALANCE SHEET
ACCOUNTING IN THE INCOME STATEMENT
Fobaproa-IPAB Portfolios: 1,512 Off balance trusts Fees charged to Fobaproa and Fiduciary
Loans purchased: 32,554 Sólida Asset Management and
Banorte Non Interest Income and Other Revenues and
Expenses (Banorte) Investment Projects: 3,163 Sólida Asset Management Non Interest Income
Banking Sector Portfolio: 26,340 Banorte’s Portfolio and Repossessed assets
Net Interest Income and Other Revenues and Expenses
Total 63,570 • At the end of 1Q09, acquired loan portfolios amounted to Ps 32.6 billion, broken down as follows: 40%
mortgages, 42% corporate and commercial loans, 12% real estate portfolios and 6% foreclosed assets. Revenues stemming from these portfolios during 1Q09 totaled Ps 152 million, 30% lower YoY, while net income was Ps 38 million, (57%) less YoY. Also, the recovery ratio was 56% during the quarter, 40% higher than 1Q08. The Recovery Bank did not acquire any assets during 1Q09.
• In terms of investment projects, the total amount invested by Sólida at the end of 1Q09 was Ps 3.2
billion, a 22% YoY increase compared to 1Q08. Investments are distributed among 33 projects nationwide. The revenues generated by these portfolios during 1Q09 totaled Ps 115 million, (12%) lower YoY, while profits were Ps 25 million, (55%) less YoY from 1Q08.
• At the close of 1Q09, the breakdown of Banorte’s Ps 26.3 billion in proprietary loans managed by the
Recovery Bank was distributed as follows: 31% in credit cards; 29% in mortgage loans; 10% in corporate and commercial loans; 10% in car loans; 9% in Crediactivo, 9% in payroll and personnel and 3% in real estate. Revenues generated by this portfolio during 1Q09 totaled Ps 225 million, a 40% YoY increase from 1Q08, while profits were Ps 83 million, a 261% YoY increase from 1Q08.
RECOVERY BANKING
II. FINANCIAL INFORMATION

According to the new criteria, effective as of January 2008, inflationary accounting no longer applies for re-expressing financial statements. Nonetheless, the figures for 2007 and previous years will continue to be expressed in pesos of December 2007.
First Quarter 2009.
19
Brokerage (Million Pesos) 1Q08 4Q08 1Q09 QoQ YoY
Brokerage Net Income 71 (89) 40 145% (43%) Stockholder’s Equity 1,086 1,143 1,163 2% 7% Assets Under Management 185,612 119,286 92,072 (23%) (50%) Total Assets 1,297 1,662 1,532 (8%) 18% ROE 26.9% (29.3%) 14.0% 43 pp (13 pp) Net Capital Net Capital 990 901 914 2% (8%)
• Broker-Dealer Net Income During 1Q09, the Broker-dealer reported net income of Ps 40 million, a (43%) YoY decline compared to 1Q08, a result of a contraction in commissions and fees charged to clients, mainly in capital market given higher risk aversion, as well as lower revenues from advisory services in investment banking. On a quarterly basis, net income increased 145% due to higher revenues from financial advisory services and lower expenses. Mutual funds At closing of 1Q09, AUMs grew 5% QoQ compared to 4Q08, given the efforts to improve the mutual funds’ returns. On an annualized basis, the AUMs declined given the migration of customers to checking accounts and other deposit products within the bank. Assets Under Management At the end of 1Q09, AUMs totaled Ps 92.1 billion, a (50%) YoY and (23%) QoQ decline, affected mainly by a decrease in mutual funds and portfolio management assets.
II. FINANCIAL INFORMATION
BROKERAGE
ROE (BROKERAGE SECTOR)
26.9%50.6% 18.8%
-29.3%
14.0%
1Q08 2Q08 3Q08 4Q08 1Q09

According to the new criteria, effective as of January 2008, inflationary accounting no longer applies for re-expressing financial statements. Nonetheless, the figures for 2007 and previous years will continue to be expressed in pesos of December 2007.
First Quarter 2009.
20
•
LONG TERM SAVINGS (Million Pesos)
1Q08 4Q08 1Q09 QoQ YoY
Afore Net Income 67 65 60 (8%) (10%) Equity 1,029 1,052 1,112 2% 8% Total Assets 1,143 1,218 1,220 - 7% AUM (SIEFORE) 63,390 56,186 56,516 1% (11%) ROE 26.7% 24.3% 22.1% (2%) (5 pp)
Insurance Net Income 76 138 152 10% 100% Equity 1,928 2,130 2,278 7% 18% Total Assets 12,643 11,306 11,374 1% (10%) Technical Reserves 9,238 7,356 7,359 - (20%) Premiums sold 2,997 1,604 2,080 30% (31%) ROE 16.1% 26.9% 27.6% 0.7 pp 11 pp
Annuities Net Income 15 (5) 24 N.A. 56% Equity 1,152 985 1,009 2% (12%) Total Assets 11,598 14,833 15,491 4% 34% Technical Reserves 10,419 13,612 14,337 5% 38% Premiums sold 598 996 672 (33%) (12%) ROE 5.3% (2.1%) 9.4% 12 pp 4 pp
• Afore During 1Q09, the AFORE reported a net income of Ps 60 million (51% corresponds to Banorte), a (10%) YoY and (8%) QoQ drop. The annual drop is mainly explained by less operating revenues and lower return on investments, while the quarterly decline is a result or lower returns on investments.
At the end of 1Q09, AFORE’s assets under management registered an (11%) YoY drop, given the mark to market losses on its portfoliosunder highly volatile financial markets. However, it is important to point out that as a result of the decline in market interest rates during 1Q09, the mark to market losses accumulated during 2008 have been recovered, and the value of the fund is 0.4% higher from the level at the end of 2008. On the other hand, at closing of 1Q09, the AFORE had a total of 3,219,496 affiliates, representing 8.2% of total affiliates in the system and 9.6% in certified accounts. As of March 2009, the AFORE ranked 7th with a 6% market share. • Insurance Reported Net Income was Ps 152 million in 1Q09 (51% correspond to GFNorte), 100% higher YoY, driven by higher overall revenues as a result of growth in accrued premiums, returns on investments and other income. Expenses also grew at a lower pace than revenues given the containment of acquisition and claims related costs. On a quarterly basis, Net income increased 10%, given an increase in total revenues, as well as lower operating expenses. The number of Premiums issued declined (31%) YoY to Ps 2.08 billion, driven by lower sales of ”Patrimonio Integral Banorte” product. The number of acccrued premiums rose to Ps 1.5 billion at the end of 1Q09, a 9% YoY increase compared to 1Q08. Technical reserves were Ps 7.3 billion, (20%) lower YoY but stable on a quarterly basis. • Annuities Registered profits of Ps 24 million (51% corresponds to GFNorte) during 1Q09, 56% higher than in 1Q08, driven by higher capital and reserve interest payments, as well as the positive impact of mark to market valuations on investment portfolios due to a decreasing interest rate environment. On a quarterly basis, net income grew 553% driven by greater total revenues as a result of higher accrued premiums and a positive impact in the mark to market valuation of investment portfolios from decreasing market interest rates.
II. FINANCIAL INFORMATION
LONG TERM SAVINGS

According to the new criteria, effective as of January 2008, inflationary accounting no longer applies for re-expressing financial statements. Nonetheless, the figures for 2007 and previous years will continue to be expressed in pesos of December 2007.
First Quarter 2009.
21
II. FINANCIAL INFORMATION
ROE (AFORE)
22.1%24.3%
17.5%
4.3%
26.7%
1Q08 2Q08 3Q08 4Q08 1Q09
ROE (INSURANCE)
27.6%26.9%29.9%23.0%16.1%
1Q08 2Q08 3Q08 4Q08 1Q09
ROE (ANNUITIES)
9.4%
-2.1%
8.9%0.0%
5.3%
1Q08 2Q08 3Q08 4Q08 1Q09

According to the new criteria, effective as of January 2008, inflationary accounting no longer applies for re-expressing financial statements. Nonetheless, the figures for 2007 and previous years will continue to be expressed in pesos of December 2007.
First Quarter 2009.
22
OTHER FINANCE COMPANIES (1) (Million Pesos)
1Q08 4Q08 1Q09 QoQ YoY
Leasing and Factoring Net Income 66 115 94 (18%) 43% Equity 1,057 1,184 1,278 8% 21% Loan Portfolio (2) 11,212 13,874 12,791 (8%) 14% Past Due Loans 33 74 92 24% 176% Loan Loss Reserves 38 79 88 12% 121% Total Assets 11,355 14,001 12,927 (8%) 14% ROE 25.8% 38.8% 30.6% (8 pp) 5 pp
Warehousing Net Income 5 6 7 27% 49% Equity 106 124 129 4% 22% Inventories 61 165 479 191% 689% Total Assets 162 321 621 94% 284% ROE 18.3% 18.3% 22.3% 4 pp 4 pp
(1) When making annual comparisons of other finance companies, it is important to keep in mind that as of March 31 2007, the bonding company was divested from Grupo Financiero Banorte. During 1Q07 it reported a net income of Ps $ 9 million, which is not reflected in the results presented in this report. (2) Includes the portfolio of assets under pure leasing registered in property, plant and equipment. • Leasing and Factoring On February 2008, the leasing and factoring companies merged under a regulated Multi-purpose financial corporation (SOFOM). This merger enables, among other things, to optimize the use of capital, improve leverage capacity and create the possibility of achieving higher credit ratings for the merged entity. Results of both companies, as of 1Q08 are presented on a consolidated basis under the denomination “Arrendadora y Factor Banorte, S.A. de C.V.” The Leasing and Factoring Company reported Net Income of Ps 94 million during 1Q09, 43% greater YoY, due to higher Net Interest Income arising from growth in performing loans. On a quarterly basis, Net Income dropped (18%) as a result of greater loan reserves arising from the portfolio’s risk rating of 4Q08. At closing of 1Q09, the Past Due Loan Ratio was 0.72%, while the Capitalization Ratio closed at 9.46%, with average risk assets of Ps 13.1 million.
• Warehousing Last November 28th, the Ministry of Finance (SHCP) modified the authorization given to Almacenadora Banorte to constitute and operate as a General Deposit Warehouse, given the increase in the fixed portion of its stockholders’ equity, which totaled Ps 31,780,651. This was agreed to in the Extraordinary Stockholders' Meeting held on October 1st, 2008. Net Income for the Warehouse during 1Q09 was Ps 7 million, higher by 49% YoY and 27% QoQ due greater inventories and storage services’. At the end of 1Q09, the Capitalization Ratio was 6.05% considering Ps 2.131 billion in total outstanding risk certificates. On December 31st, 2008, Banorte’s warehouse ranked 2nd among the 20 warehousing companies in terms of profits generated.
II. FINANCIAL INFORMATION
OTHER FINANCE COMPANIES

According to the new criteria, effective as of January 2008, inflationary accounting no longer applies for re-expressing financial statements. Nonetheless, the figures for 2007 and previous years will continue to be expressed in pesos of December 2007.
First Quarter 2009.
23
• Pronegocio The Board of Directors approved the merger of Banco Mercantil del Norte with Credito Pronegocio, S.A. of C.V. on January 29th, 2009. Since the approval, Banorte has been working in the gradual transfer of Pronegocio’s operations and expenses into the bank, as well as migrating Pronegocio’s good clients to Banorte’s traditional products. The final transfer will be carried out once the corresponding authorities give the final approval to this merger. Pronegocio posted net income of Ps $6 million for 1Q09, a 162% YoY and 107% QoQ increase due to lower payroll and other operating expenses resulting from the transfer of a portion of them into the bank, as well as a reduction in loan reserves and an increase in net non operating income. At the end of 1Q09, past due loans were Ps 24 million, a (78%) YoY and (36%) QoQ decline, as a result of write-offs applied in 2008. The past due loan ratio closed at 13.2%, lower than the 22.7% registered in 1Q08 and 14.1% in 4Q08. The reserve coverage ratio stood at 86% at the end of 1Q09.
MICROLENDING PRONEGOCIO (Million Pesos)
1Q08 4Q08 1Q09 QoQ YoY
Net Income (9) (80) 6 107% 162%
Equity 82 48 54 12% (25%)
Loan Portfolio 493 269 162 (40%) (67%)
Non Performing Loans 112 38 24 (36%) (78%)
Loan Loss Reserves 34 29 21 (29%) (30%)
Total Assets 582 433 266 (39%) (64%)
ROE (53.8%) (646.0%) 43.8% 690 pp 98 pp
II. FINANCIAL INFORMATION
PRONEGOCIO
ROE (LEASING AND FACTORING)
25.8% 28.5% 18.4%
38.8%30.6%
1Q08 2Q08 3Q08 4Q08 1Q09
ROE (WAREHOUSING)
18.3%24.0%
21.4% 18.3%22.3%
1Q08 2Q08 3Q08 4Q08 1Q09

According to the new criteria, effective as of January 2008, inflationary accounting no longer applies for re-expressing financial statements. Nonetheless, the figures for 2007 and previous years will continue to be expressed in pesos of December 2007.
First Quarter 2009.
24
International Ratings
Rating Agency Rated Institution Rating Category Date
Moody’s Banorte
Negative C-
Baa1 P-2 A-2 P-1
Outlook Modest Financial Strength
Foreign long - term bank deposits Foreign short- term bank deposits
Local long - term bank deposits Local short - term bank deposits
March, 2009
Moody’s Casa de Bolsa Banorte
Negative A2 P-1
Outlook Issue Rating Long Term Issue Rating ShortTerm
March, 2009
Standard & Poors Banorte
Stable BBB- BBB- A-3 A-3
Outlook Long term foreign issuer credit
Long term local currency deposits Short term foreign issuer credit
Short tem local issuer credit
December, 2008
Fitch
Banorte
Grupo Financiero
Banorte
Stable BBB BBB F2 F2 C 2 5
Outlook Long Term Foreign currency Long Term Local currency Short Term Local Currency
Short Term Foreign Currency Individual - Foreign Currency
Support Rating Support Rating
February,
2009
Domestic Ratings
Rating Agency Rated Institution Rating Category Date
Fitch
Banorte
F1 + (mex) AA +(mex) F1 + (mex) AA +(mex)
Short term counterparty risk Long term counterparty risk
Short term CD’s and Term Deposits Long term CD’s and Term Deposits
February, 2009
Arrendadora y Factor Banorte
AA (mex) F1 + (mex)
Medium and Long Term Short Term
May, 2007
Moody’s Domestic Scale Banorte
Aaa.mx MX-1
Long Term Deposits ShortTerm Deposits
March, 2009
Arrendadora
Banorte Aaa.mx MX-1
Issue Rating in Domestic Scale Long Term Issue Rating in Domestic Scale ShortTerm March, 2009
Factor
Banorte Aaa.mx MX-1
Issue Rating in Domestic Scale Long Term Issue Rating in Domestic Scale ShortTerm March, 2009
Other Ratings
Fitch Banorte AAFC1(mex) Financial Asset Administrator February, 2008
Fitch Seguros Banorte Generali AA (mex) Insurance Financial Strength November,
2008
Fitch Casa de Bolsa Banorte
Stable F1 + (mex) AA +(mex)
Outlook Short term counterparty risk Long term counterparty risk
March, 2009
Moodys Casa de Bolsa Banorte
Stable Aaa.mx MX-1
Outlook Issue Rating Long Term Issue Rating ShortTerm
Marzo,2009
II. FINANCIAL INFORMATION
RATINGS

According to the new criteria, effective as of January 2008, inflationary accounting no longer applies for re-expressing financial statements. Nonetheless, the figures for 2007 and previous years will continue to be expressed in pesos of December 2007.
First Quarter 2009.
25
(1) Includes INB since 4Q06 and Uniteller since 1Q07. (2) Includes banking modules and remote teller windows. Excludes 1 branch located in Cayman Island.
• During the quarter, 50 branches were merged of which 14 were located in Mexico City and 36 in the
rest of the country. Also, 7 new branches were opened, 4 of which were in Mexico City, and 5 others were relocated. As part of the branch mergers carried out in 1Q09, 28 ATMs are in the process of being re-installed in the merged branches. Additionally, 561 POS terminals were installed during 1Q09.
• In 2009, 15 new branches will be opened and 5 relocations or refurbishments are programmed.
These movements are part of the 2008 expansion program, but were put on hold due to diverse setbacks.
INFRASTRUCTURE 1Q08 4Q08 1Q09
Employees 17,428 19,997 19,442 Banking (1) 14,459 15,223 15,032 Other 2,969 4,774 4,410 Branches (2)(3) 1,062 1,118 1,075 INB 18 20 20 Pronegocio 97 97 56
ATM’s 3,812 4,136 4,108
II. FINANCIAL INFORMATION
INFRASTRUCTURE

According to the new criteria, effective as of January 2008, inflationary accounting no longer applies for re-expressing financial statements. Nonetheless, the figures for 2007 and previous years will continue to be expressed in pesos of December 2007.
First Quarter 2009.
26
III. ANNEXES
ANNEXES
1. GROUP’S GENERAL INFORMATION 2. SUMMARY OF RESULTS AND FINANCIAL STATEMENTS 3. ACCOUNTING CHANGES AND REGULATIONS
4. LOAN PORTFOLIO SALES TO SOLIDA ADMINISTRADORA DE PORTAFOLIOS
5. NOTES TO THE GROUP’S FINANCIAL STATEMENTS

According to the new criteria, effective as of January 2008, inflationary accounting no longer applies for re-expressing financial statements. Nonetheless, the figures for 2007 and previous years will continue to be expressed in pesos of December 2007.
First Quarter 2009.
27
III. 1 GROUP’S GENERAL INFORMATION
GFNORTE’S GENERAL INFORMATION
GFNorte Ownership of Subsidiaries 1Q09 Banco Mercantil del Norte (1) 97.06% Brokerage House 99.99% Retirement Funds – Afore (2) 51.00% Insurance 51.00% Annuities 51.00% Leasing 99.99% Factor 99.99% Warehouse 99.99% Mcrocredit Unit – Pronegocio (2) 99.99% Banorte USA (2) 100.00%
1) As a resukt of merging Bancen on August 2006. 2) Subsidiary of Banco Mercantil del Norte. Banorte USA owns 100% of Uniteller and 70% of INB.
Holding Company Capital Structure
Number of Shares SERIE O As of March 31, 2009
Number of Shares Outstanding 2,018,347,548
Shares held in the bank’s Treasury (3,666,800)
Group Officers
NAME CURRENT POSITION
Alejandro Valenzuela del Río Chief Executive Officer
BUSINESS UNITS
Luis Fernando Orozco Managing Director – Asset Recovery Carlos Garza Managing Director – Banorte USA Jesús Garza Martínez Managing Director – Commercial Banking Antonio Ortiz Cobos Managing Director – Corporations and SMEs Miguel Javier Huller Grignola Managing Director – Consumer Products Manuel Sescosse Varela Managing Director – Government Banking Fernando Solís Soberón Managing Director – Long Term Savings Ricardo Acevedo Garay Managing Director – Brokerage House
STAFF Alejandro Garay Espinosa Managing Director - Administration Román Martínez Méndez Managing Director - Audit Javier Márquez Diez-Canedo Managing Director - Risk Vacant Chief Corporate Officer Aurora Cervantes Martínez Managing Director - Legal Carla Juan Chelala Managing Director - Marketing Sergio García Robles Gil Chief Financial Officer Prudencio Frigolet Gómez Managing Director – Operations and Technology
According to the new criteria, effective as of January 2008, inflationary accounting no longer applies for re-expressing financial statements. Nonetheless, the figures for 2007 and previous years will continue to be expressed in pesos of December 2007.
First Quarter 2009.
28
Monterrey, N.L., April 29, 2009. Grupo Financiero Banorte announced its operating results for the first quarter of 2009, reporting net income of Ps 1.6 billion, which is 27% higher than the one registered during 4Q08, and 16% lower than 1Q08. Annualized ROE was 17% and ROA was 1.1%. During 1Q08, the Group reported an extraordinary income of Ps 275 million from the cash payment received from the sale of VISA’s shares during its initial public offering. Excluding this non-recurring item, net income fell by 3%, as a result of greater loan loss provisions given the prevailing adeverse economic environment. The bank contributed with $1.34 billion pesos in profits, 84% of the Group’s total, a (22%) YoY decline and a (7%) YoY drop on a recurring basis. Net Interest and Other Income During 1Q09, Net Interest Income increased 20% YoY, driven mainly by the 18% growth in performing loans, as well as the 22% rise in Core deposits. Non Interest Revenues amounted to Ps 1.8 billion in 1Q09, a (5%) YoY decline due to lower revenues from recovery of real estate portfolios and service fees. Trading income registered a 22% YoY increase in 1Q09, which is explained by favorable dynamics in FX revenues. Deposits At the end of March 2009, Total Deposits excluding third-party deposits, were Ps 255.2 billion, a 29% YoY increase, due to the 16% rise in Demand Deposits and 31% increase in Time Deposits. Non interest bearing demand deposits grew by 25% YoY given greater balances managed in corporate accounts. Money market deposits rose 71% in the last 12 months, explained by greater account balances for institutional clients (Corporates, States and Municipalities) and adequate management of client relations. Efficiency Ratio The Efficiency Ratio improved YoY from 54% in 1Q08 to 52% in 1Q09, driven by a positive operating leverage. It is worth noting that Banorte initiated several cost containment measures in 4Q08 given the adeverse economic situation, including the merger of 50 branches, which will result in greater efficiencies for the rest of the year. Loan Portfolio At of the close of 1Q09, the loan portfolio posted an 18% YoY increase to Ps 235.4 billion. This growth is mainly attributed to the bank’s efforts to take advantage of market opportunities, as well as to increase penetration in certain segments, like government and commercial. During the last twelve months, commercial loans increased by 18% to Ps 89.2 billion. The corporate loan portfolio grew 12% to reach the Ps 43.5 billion, while government loans rose 63% to Ps 28.5 billion. Consumer loans grew 11% during with a mixed performance by segments. Credit card loans declined by 8% YoY to Ps 13.8 billion. Payroll and personal loans grew 3% YoY to Ps 6.4 billion (85% of the balance corresponds to payroll loans). Car loans were Ps 7.5 billion, a 1% YoY increase; mortgage loans continue with an upward trend, frowing by 22% YoY to Ps 46.2 billion. The past-due loan ratio stood at 2.3% at the end of 1Q09, one of the lowest in the financial system. Grupo Financiero Banorte ended the quarter with a balance of Ps 5.5 billion in non performing loans. The reserve coverage was 109%. Other Subsidiaries The Long-term Savings Sector (Afore, Insurance and Annuities), reported a profit of Ps 119 million in 1Q09, a 50% YoY increase. During 1Q09, Other Finance Companies (Leasing, Factoring and Warehousing) reported net income of Ps 101 million, a 43% YoY increase. The Broker Dealer profit’s were Ps $40 million during 1Q09.
III. 2 SUMMARY OF RESULTS
SUMMARY OF RESULTS

According to the new criteria, effective as of January 2008, inflationary accounting no longer applies for re-expressing financial statements. Nonetheless, the figures for 2007 and previous years will continue to be expressed in pesos of December 2007.
First Quarter 2009.
29
III. 2 FINANCIAL STATEMENTS
HOLDING
Holding – INCOME STATEMENT(Million Pesos)
1Q08 2Q08 3Q08 4Q08 Accum. 2008 1Q09 2Q09 3Q09 4Q09 Accum.
2009 Income Subsidiaries & Other 1,930 1,806 2,007 1,266 7,009 1,613 1,613Interest Income 3 3 3 3 13 1 1 Interest Expense - - - - - - - Fees & Tariffs - - - - - - - Trading Income - - - - - - - Monetary Position REPOMO - - - - - - - Total Operating Income 1,933 1,809 2,010 1,269 7,022 1,614 1,614Admin & Promotion Expense 2 1 1 2 6 1 1 Operating Income 1,932 1,808 2,009 1,268 7,016 1,612 1,612Non Operating Income - - - - - 2 2 Non Operating Expense - - - - - - - Non Operating Income, net - - - - - 2 2Pre-tax Income 1,932 1,808 2,009 1,268 7,016 1,614 1,614Income Tax & Profit Sharing 3 1 3 - 7 1 1 Tax on Assets - - - - - - - Deferred Income Tax & PS - 1 (1) (5) (5) 2 2
3 1 2 (5) 2 3 3Profit from Cont Ops 1,928 1,806 2,007 1,272 7,014 1,611 1,611 Extraordinary Items, net - - - - - - -Total Net Income 1,928 1,806 2,007 1,272 7,014 1,611 1,611
Holding – BALANCE SHEET (Million Pesos) 1Q08 2Q08 3Q08 4Q08 1Q09 2Q09 3Q09 4Q09 ASSETS Cash & Due from Banks 131 204 157 24 63 Investment in Securities - - - - - Sundry Debtors & Other Accts Receivable, net 11 11 164 12 2 Real Estate, Furniture & Equipment, net - - - - - Investments in Subsidiaries 34,345 36,964 37,574 38,184 39,186 Deferred Taxes - - - 5 3 Goodwill 36 35 33 32 34 Other Assets, Deferred Charges & Intangibles - - - - - TOTAL ASSETS 34,524 37,214 37,929 38,257 39,288 LIABILITIES Due to Banks & Correspondents - - - - - Income Tax & Profit Sharing - - - - - Other Accounts Payable 5 3 1 1 1 Deferred Taxes - 1 - - - TOTAL LIABILITIES 5 3 1 1 1 STOCKHOLDER´S EQUITY Paid-in Capital 12,018 12,020 12,014 12,004 12,007 Premium of Share Subscription & Issuance 1,863 1,863 1,863 1,860 1,859 Subordinated Convertible Debt - - - - - Subscribed Capital 13,881 13,882 13,877 13,865 13,866 Capital Reserves 2,446 2,807 2,767 2,720 2,748 Retained Earnings 21,376 21,035 21,035 16,935 23,965 Surplus (Deficit) from Valuation of Securities - - - (550) (1,315) Results from Conversions of Foreign Ops - - - 1,094 1,244 Surpluss (Deficit) in Capital Restatement - - - - - Results of Non Monetary Fixed Assets - - - - - Results of Non Monetary Investment Assets (5,113) (4,250) (5,493) (2,821) (2,833) Adjustmens in the Employees’ Liabilities - - - - - Net Income 1,928 3,735 5,742 7,014 1,611 Earned Capital 20,638 23,328 24,051 24,391 25,421 Total Stockholder´s Equity 34,519 37,210 37,928 38,256 39,287 TOTAL LIABILITIES & EQUITY 34,524 37,214 37,929 38,257 39,288
Holding – MEMORANDUM ACCOUNTS (Million Pesos) 1Q08 2Q08 3Q08 4Q08 1Q09 2Q09 3Q09 4Q09 Securities held under Custody 3,716 3,716 3,716 3,716 3,716 Other Registration Accounts 1 1 1 1 1 3,717 3,717 3,717 3,717 3,717
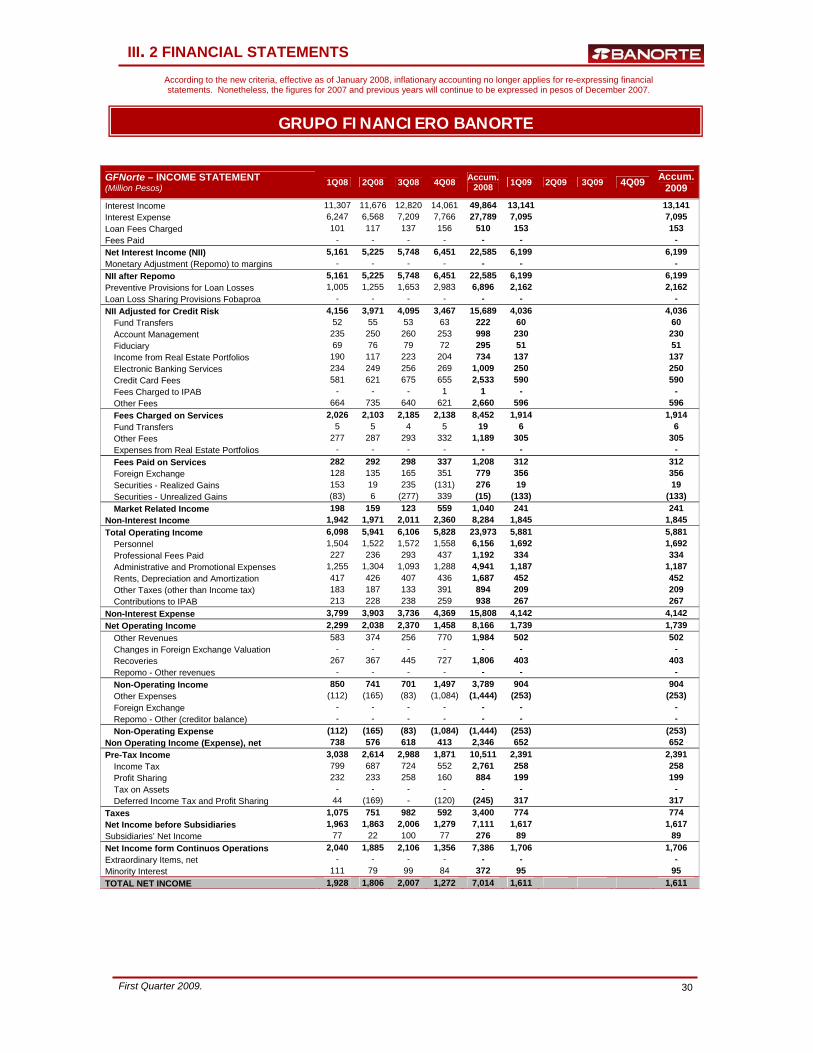
According to the new criteria, effective as of January 2008, inflationary accounting no longer applies for re-expressing financial statements. Nonetheless, the figures for 2007 and previous years will continue to be expressed in pesos of December 2007.
First Quarter 2009.
30
III. 2 FINANCIAL STATEMENTS
GRUPO FINANCIERO BANORTE
GFNorte – INCOME STATEMENT (Million Pesos) 1Q08 2Q08 3Q08 4Q08 Accum.
2008 1Q09 2Q09 3Q09 4Q09 Accum.2009
Interest Income 11,307 11,676 12,820 14,061 49,864 13,141 13,141 Interest Expense 6,247 6,568 7,209 7,766 27,789 7,095 7,095 Loan Fees Charged 101 117 137 156 510 153 153 Fees Paid - - - - - - - Net Interest Income (NII) 5,161 5,225 5,748 6,451 22,585 6,199 6,199 Monetary Adjustment (Repomo) to margins - - - - - - - NII after Repomo 5,161 5,225 5,748 6,451 22,585 6,199 6,199 Preventive Provisions for Loan Losses 1,005 1,255 1,653 2,983 6,896 2,162 2,162 Loan Loss Sharing Provisions Fobaproa - - - - - - - NII Adjusted for Credit Risk 4,156 3,971 4,095 3,467 15,689 4,036 4,036
Fund Transfers 52 55 53 63 222 60 60 Account Management 235 250 260 253 998 230 230 Fiduciary 69 76 79 72 295 51 51 Income from Real Estate Portfolios 190 117 223 204 734 137 137 Electronic Banking Services 234 249 256 269 1,009 250 250 Credit Card Fees 581 621 675 655 2,533 590 590 Fees Charged to IPAB - - - 1 1 - - Other Fees 664 735 640 621 2,660 596 596 Fees Charged on Services 2,026 2,103 2,185 2,138 8,452 1,914 1,914 Fund Transfers 5 5 4 5 19 6 6 Other Fees 277 287 293 332 1,189 305 305 Expenses from Real Estate Portfolios - - - - - - - Fees Paid on Services 282 292 298 337 1,208 312 312 Foreign Exchange 128 135 165 351 779 356 356 Securities - Realized Gains 153 19 235 (131) 276 19 19 Securities - Unrealized Gains (83) 6 (277) 339 (15) (133) (133) Market Related Income 198 159 123 559 1,040 241 241
Non-Interest Income 1,942 1,971 2,011 2,360 8,284 1,845 1,845 Total Operating Income 6,098 5,941 6,106 5,828 23,973 5,881 5,881
Personnel 1,504 1,522 1,572 1,558 6,156 1,692 1,692 Professional Fees Paid 227 236 293 437 1,192 334 334 Administrative and Promotional Expenses 1,255 1,304 1,093 1,288 4,941 1,187 1,187 Rents, Depreciation and Amortization 417 426 407 436 1,687 452 452 Other Taxes (other than Income tax) 183 187 133 391 894 209 209 Contributions to IPAB 213 228 238 259 938 267 267
Non-Interest Expense 3,799 3,903 3,736 4,369 15,808 4,142 4,142 Net Operating Income 2,299 2,038 2,370 1,458 8,166 1,739 1,739
Other Revenues 583 374 256 770 1,984 502 502 Changes in Foreign Exchange Valuation - - - - - - - Recoveries 267 367 445 727 1,806 403 403 Repomo - Other revenues - - - - - - - Non-Operating Income 850 741 701 1,497 3,789 904 904 Other Expenses (112) (165) (83) (1,084) (1,444) (253) (253) Foreign Exchange - - - - - - - Repomo - Other (creditor balance) - - - - - - - Non-Operating Expense (112) (165) (83) (1,084) (1,444) (253) (253)
Non Operating Income (Expense), net 738 576 618 413 2,346 652 652 Pre-Tax Income 3,038 2,614 2,988 1,871 10,511 2,391 2,391
Income Tax 799 687 724 552 2,761 258 258 Profit Sharing 232 233 258 160 884 199 199 Tax on Assets - - - - - - - Deferred Income Tax and Profit Sharing 44 (169) - (120) (245) 317 317
Taxes 1,075 751 982 592 3,400 774 774 Net Income before Subsidiaries 1,963 1,863 2,006 1,279 7,111 1,617 1,617 Subsidiaries’ Net Income 77 22 100 77 276 89 89 Net Income form Continuos Operations 2,040 1,885 2,106 1,356 7,386 1,706 1,706 Extraordinary Items, net - - - - - - - Minority Interest 111 79 99 84 372 95 95 TOTAL NET INCOME 1,928 1,806 2,007 1,272 7,014 1,611 1,611
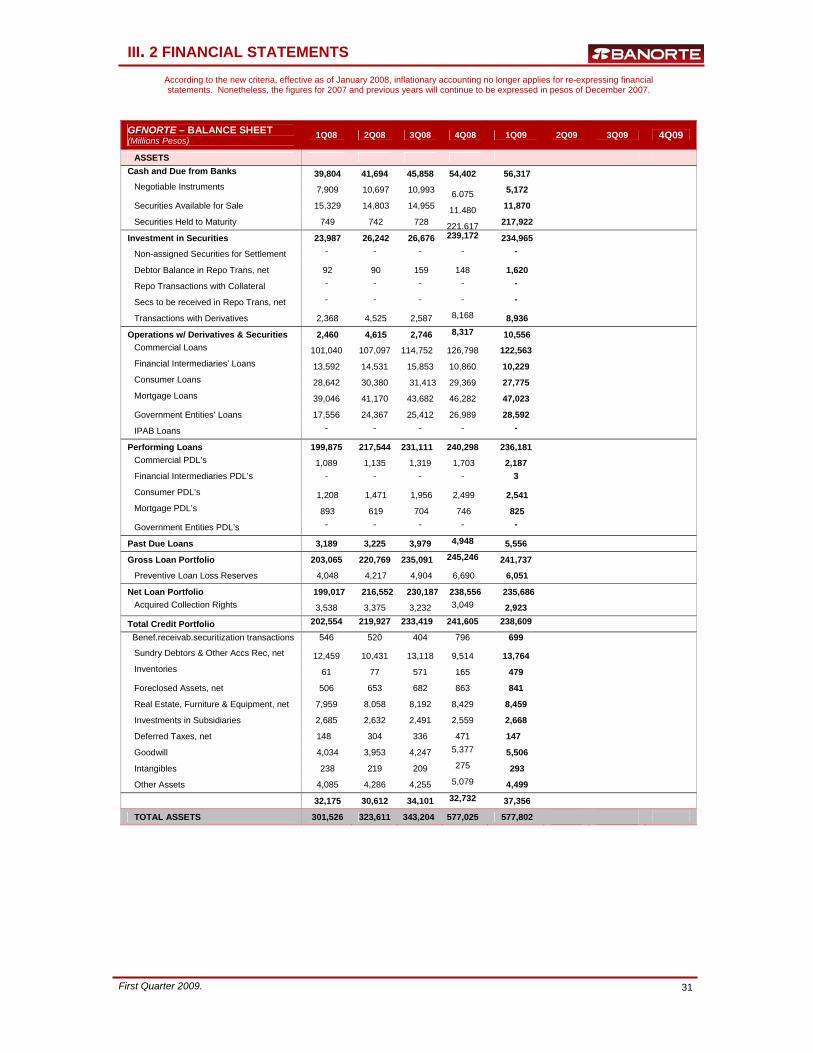
According to the new criteria, effective as of January 2008, inflationary accounting no longer applies for re-expressing financial statements. Nonetheless, the figures for 2007 and previous years will continue to be expressed in pesos of December 2007.
First Quarter 2009.
31
III. 2 FINANCIAL STATEMENTS
GFNORTE – BALANCE SHEET (Millions Pesos) 1Q08 2Q08 3Q08 4Q08 1Q09 2Q09 3Q09 4Q09
ASSETS Cash and Due from Banks 39,804 41,694 45,858 54,402 56,317
Negotiable Instruments 7,909 10,697 10,993 6,075 5,172 Securities Available for Sale 15,329 14,803 14,955 11,480 11,870 Securities Held to Maturity 749 742 728 221,617 217,922
Investment in Securities 23,987 26,242 26,676 239,172 234,965 Non-assigned Securities for Settlement - - - - - Debtor Balance in Repo Trans, net 92 90 159 148 1,620 Repo Transactions with Collateral - - - - - Secs to be received in Repo Trans, net - - - - - Transactions with Derivatives 2,368 4,525 2,587 8,168 8,936
Operations w/ Derivatives & Securities 2,460 4,615 2,746 8,317 10,556 Commercial Loans 101,040 107,097 114,752 126,798 122,563 Financial Intermediaries’ Loans 13,592 14,531 15,853 10,860 10,229 Consumer Loans 28,642 30,380 31,413 29,369 27,775
Mortgage Loans 39,046 41,170 43,682 46,282 47,023
Government Entities’ Loans 17,556 24,367 25,412 26,989 28,592
IPAB Loans - - - - - Performing Loans 199,875 217,544 231,111 240,298 236,181
Commercial PDL’s 1,089 1,135 1,319 1,703 2,187 Financial Intermediaries PDL’s - - - - 3 Consumer PDL’s 1,208 1,471 1,956 2,499 2,541 Mortgage PDL’s 893 619 704 746 825 Government Entities PDL’s - - - - -
Past Due Loans 3,189 3,225 3,979 4,948 5,556 Gross Loan Portfolio 203,065 220,769 235,091 245,246 241,737
Preventive Loan Loss Reserves 4,048 4,217 4,904 6,690 6,051 Net Loan Portfolio 199,017 216,552 230,187 238,556 235,686
Acquired Collection Rights 3,538 3,375 3,232 3,049 2,923 Total Credit Portfolio 202,554 219,927 233,419 241,605 238,609 Benef.receivab.securitization transactions 546 520 404 796 699
Sundry Debtors & Other Accs Rec, net 12,459 10,431 13,118 9,514 13,764 Inventories 61 77 571 165 479 Foreclosed Assets, net 506 653 682 863 841 Real Estate, Furniture & Equipment, net 7,959 8,058 8,192 8,429 8,459 Investments in Subsidiaries 2,685 2,632 2,491 2,559 2,668 Deferred Taxes, net 148 304 336 471 147 Goodwill 4,034 3,953 4,247 5,377 5,506 Intangibles 238 219 209 275 293 Other Assets 4,085 4,286 4,255 5,079 4,499 32,175 30,612 34,101 32,732 37,356 TOTAL ASSETS 301,526 323,611 343,204 577,025 577,802

According to the new criteria, effective as of January 2008, inflationary accounting no longer applies for re-expressing financial statements. Nonetheless, the figures for 2007 and previous years will continue to be expressed in pesos of December 2007.
First Quarter 2009.
32
III. 2 FINANCIAL STATEMENTS
GFNORTE – BALANCE SHEET (Million Pesos) 1Q08 2Q08 3Q08 4Q08 1Q09 2Q09 3Q09 4Q09
LIABILITIES
Demand Deposits 103,26 106,693 107,694 128,350 120,255
Time Deposits 93,830 114,557 133,799 132,419 134,964
Bank Bonds - - - - -
Deposits 197,092 221,250 241,492 260,769 255,219
Immediate Redemption Loans 5,615 3,136 824 1,245 4,180
Short Term Loans 18,538 11,375 11,952 24,803 25,322
Long Term Loans 10,178 10,070 10,395 10,636 10,723
Due to Banks & Correspondents 34,332 24,581 23,170 36,684 40,225
Non-assigned Securities for Settlement 1,745 1,570 1,486 - 420
Creditor Balance in Repo Trans, net 291 605 632 192,727 191,479
Repo Transactions with Collateral - - - 2 304
Secs to be received in Repo Trans, net - - - - -
Transactions with Derivatives 3,157 4,443 2,946 10,746 11,646
Operations w/ Derivatives & Securities 5,192 6,619 5,064 203,475 203,849
Income Tax & Profit Sharing Payable 1,197 1,340 1,512 1,272 496
Other Creditors & Accounts Payable 12,538 13,306 13,654 13,121 17,726
Other Payable Accounts 13,734 14,646 15,166 14,393 18,222
Subordinated Non Convertible Debt 14,561 16,932 17,923 20,613 18,053
Deferred Taxes - - - - -
Deferred Credits 977 1,146 1,269 1,346 1,336
TOTAL LIABILITIES 265,888 285,174 304,085 537,280 536,903
EQUITY
Paid-in Capital 11,965 11,968 11,951 11,941 11,932
Share Subscription Premiums 1,275 1,273 1,187 1,468 1,530
Subordinated Convertible Debentures - - - - -
Subscribed Capital 13,239 13,241 13,138 13,409 13,462
Capital Reserves 2,446 2,807 2,767 2,720 2,748
Retained Earnings 21,376 21,035 21,035 16,935 23,965
Surplus (Deficit) of Secs Available for Sale - - - (550) (1,315)
Results from Conversions of Foreign Ops - - - - -
Results from Valuation of Hedging Secs - - - 1,094 1,244
Surplus (Deficit) in Capital Restatement - - - - -
Results of Non Monetary Fixed Assets - - - - -
Results of Non Monetary –Investment Assets (5,113) (4,250) (5,493) (2,821) (2,833)
Adjustments in the Employee’s Pensions - - - - -
Accumulated Effect of Deferred Liabilities - - - - -
Net Income 1,928 3,735 5,742 7,014 1,611
Earned Capital 20,638 23,328 24,051 24,391 25,421
Minority Interest 1,761 1,868 1,930 1,945 2,016
Total Equity 35,638 38,437 39,119 39,746 40,899
TOTAL LIABILITIES & EQUITY 301,526 323,611 343,204 577,025 577,802

According to the new criteria, effective as of January 2008, inflationary accounting no longer applies for re-expressing financial statements. Nonetheless, the figures for 2007 and previous years will continue to be expressed in pesos of December 2007.
First Quarter 2009.
33
III. 2 FINANCIAL STATEMENTS
GFNORTE – MEMORANDUM ACCOUNTS (Million Pesos) 1Q08 2Q08 3Q08 4Q08 1Q09 2Q09 3Q09 4Q09
On behalf of Third Parties Customer’s Banks 12 16 12 74 30 Dividends Receivable from Customers - - - - - Interest Receivable from Customers - - - - - Settlement of Customer Transactions 37 44 (98) 35 246 Customer Premiums - - - - - Settlement with Clients’ Foreign Currency - - - - - Margin Accounts in Futures’ Operations - - - - - Other Current Accounts - - - - - Customers’ Current Account 49 60 (86) 109 276 Client Securities Received in Custody 185,033 185,766 164,891 118,537 97,315 Securities and Documents Received in Guarantee - - - - - Client Securities Abroad - - - - - Clients’ Securities 185,033 185,766 164,891 118,537 97,315 Clients’ Repurchase Operations 23,511 32,360 32,881 35,688 30,925 Clients’ Repo Transactions w/ Securities - - - - - Purchase of Futures & Forward Contracts notional - - - - - Sale of Futures and Forward Contracts, notional - - - - - Clients’ Option Parchase Operations 144 481 440 274 281 Clients’ Option Sales Operations - - - - - Purchase of Derivatives’ Packages - - - - - Sale of Derivatives’ Packages - - - - - Trusts Ander Administration 2,360 2,602 1,897 2,377 2,244 Transactions On Behalf of Clients 26,015 35,443 35,218 38,340 33,450 TOTAL ON BEHALF OF THIRD PARTIES 211,096 221,269 200,023 156,986 131,042 Endorsement Guarantees Granted - - - - - Loan Obligations 2,846 2,530 2,580 2,793 3,129 Properties in Trusts and Warrant 108,959 108,574 105,738 90,469 90,632 Properties in Custody or Administration 101,841 131,306 149,820 131,886 150,235 Collaterals Received 20,952 21,235 21,574 31,567 31,156 Amounts committed to Operations with Fobaproa - - - - - Drafts in Transit - - - - - Certificates of Deposits in Circulation 1,377 1,692 1,971 3,006 2,825 Letters of Credit to the Corporation as Guarantee - - - - - Securities to the Corporation for Custody 698 856 511 886 900 Government Secs of the Corp under Custody 56 88 641 101 100 Securities of the Corp given as Guarantee - - - - - Securities of the Corp Abroad - - - - - Settlement with FX of the Corp Abroad - - - - - Debts with the Contingency Fund - - - - - Contingent Assets & Liabilities 265 262 266 266 264 Investment bank Trans on Behalf of Third Parties 101,754 109,570 94,858 84,615 91,943 Uncollected Accrued Interest from Past Due Loans 111 104 109 137 181 Investments of Retirement Savings Funds - - - - - Integration of the Credit Portfolio - - - - - Amounts Contracted in Derivatives - - - - - Other Registration Accounts - - - - - Proprietary Transactions 338,858 376,217 378,068 345,726 371,364 Repo Securities to be Received 226,589 238,589 241,457 39,939 31,324 (Minus) Repurchase Creditors (226,81
3)(239,160
)(242,020
)(40,176) (31,414)
Repurchase Transactions (224) (571) (563) (237) (90) Repurchase Debtors 23,194 36,249 40,263 35,054 27,757 (Minus) Repo Securities to be Delivered (23,169) (36,193) (40,173) (34,908) (27,663)
Repurchase Transactions 25 56 90 146 93 TOTAL PROPRIETARY 338,658 375,702 377,595 345,635 371,367

According to the new criteria, effective as of January 2008, inflationary accounting no longer applies for re-expressing financial statements. Nonetheless, the figures for 2007 and previous years will continue to be expressed in pesos of December 2007.
First Quarter 2009.
34
III. 2 FINANCIAL STATEMENTS
GFNORTE - CONSOLIDATED STATEMENT OF CASH FLOW JANUARY 1, 2009 – MARCH 31, 2009
(Million Pesos)
Cash Flow from Operating Activities
Net Income 1,611 Items charged to results that do not generate or require use of resources Results of valuation at reasonable value 122 Provisions for loan losses 2,162 Depreciation and amortization 253 Defferred taxes 317 Provisions for obligations (878) Minoritary interest 95 Undistribuated earnings of subsidiaries (89) 3,593 Change in items related to operations: Decrease (Increase) Deposits (5,550) Decrease (Increase) loan portfolio 834 Decrease (Increase) in portfolios of credit assets - Decrease (Increase) treasury operations (investment in securities) 4,882 Decrease (Increase) financial instruments for sale (1,865) Loans from banks and other institutions 3,541
Decrease (Increase) Deferred taxes 7 Net cash generated or used from operations 5,442 Financing Activities:
Issue of subordinated debentures outstanding (2,560) Increase in other payable accounts 4,707 Stock repurchases 82
Net cash generated or used from financing activities 2,229 Investment Activities : Decrease in fixed assets (264) Decrease in permanent investments in shares (655) Decrease (Increase) in deferred charges or credits 89 Decrease (Increase) foreclosed assets 22 Increase in other accounts receivable (4,948) Net cash generated or used from investment activities (5,756)
Decrease (increase) in cash and equivalents 1,915
Cash and due from banks at the beginning of the year 54,402
Cash and due from banks at the end of the year 56,317

According to the new criteria, effective as of January 2008, inflationary accounting no longer applies for re-expressing financial statements. Nonetheless, the figures for 2007 and previous years will continue to be expressed in pesos of December 2007.
First Quarter 2009.
35
III. 2 FINANCIAL STATEMENTS
GFNORTE – CONSOLIDATED STATEMENTS OF CHANGES IN STOCKHOLDER´S EQUITY JANUARY 1, 2009 – MARCH 31, 2009.
(Million Pesos)
CONTRIBUTED CAPITAL
Fixed Paid-in Capital
Premium from sale of securities
Balance as of December 31,2008 11,941 1,468 Changes stemming from stockholder’s decisions Stock repurchases (9) 63 Capitalization of profits - - Provisions Created - - Increase in Capital - - Total (9) 63 Changes stemming from profits Total profits: Net Income - - Non Monetary Assets Results - (1) Recognition of minority interest - - Total - (1) Balance as of March 31,2009 11,932 1,530
EARNED CAPITAL
Capital Reser-
ves
Retained
earnings
Valuation
Effects of
Securities
Available for
Results from
Conversions of
Foreign Ops
Surplus or Deficit in Capital
Restatement
Results from Non
Monet. Assets
(Investments)
Net Income
Minority Interest
Total Stockholders´ Equity
Balance as of December 31,2008 2,720 16,935 (550) 1,094 - (2,821) 7,014 1,945 39,746 Changes stemming from stockholder’s decisions Stock repurchases 28 - - - - - - - 82 Application of profits - 7,014 - - - - (7,014) - - Provisions created - - - - - - - - - Cash Dividends - - - - - - - - - Increase in Capital 28 7,014 - - - - (7,014) - 82 Total 2,720 16,935 (550) 1,094 - (2,821) 7,014 1,945 39,746 Changes stemming from profits Total profits: Net Income - - - - - - 1,611 - 1,611 Non Monetary Assets Results - 16 (765) 150 - - - - (600) Effects from valuation of instruments - - - - - (12) - - (12) Change to Accounting Criteria (NIF B-10) Total - 16 (765) 150 - (12) 1,611 - 999 Recognition of minority interest - - - - - - - 71 71 Balance as of March 31,2009 2,748 23,965 (1,315) 1,244 - (2,833) 1,611 2,016 40,898

According to the new criteria, effective as of January 2008, inflationary accounting no longer applies for re-expressing financial statements. Nonetheless, the figures for 2007 and previous years will continue to be expressed in pesos of December 2007.
First Quarter 2009.
36
III. 2 FINANCIAL STATEMENTS
BANKING SECTOR
BANKING SECTOR* - INCOME STATEMENT (Million Pesos)
1Q08 2Q08 3Q08 4Q08 Accum. 2008 1Q09 2Q09 3Q09 4Q09 Accum.
2009
Interest Income 10,772 11,250 12,446 13,559 48,027 12,688 12,688 Interest Expense 5,965 6,303 7,059 7,530 26,857 6,873 6,873 Loan Fees Charged 97 112 132 152 493 149 149 Fees Paid - - - - - - - Net Interest Income (NII) 4,903 5,058 5,519 6,181 21,662 5,965 5,965 Monetary Adjustment (Repomo) to margins - - - - - - - NII after Repomo 4,903 5,058 5,519 6,181 21,662 5,965 5,965 Preventive Provisions for Loan Losses 987 1,234 1,587 2,914 6,722 2,144 2,144 Loan Loss Sharing Provisions Fobaproa - - - - - - - NII Adjusted for Credit Risk 3,916 3,824 3,932 3,267 14,940 3,822 3,822
Fund Transfers 52 55 53 63 222 60 60 Account Management 235 250 260 253 998 230 230 Fiduciary 69 76 79 72 295 51 51 Income from Real Estate Portfolios 190 117 223 204 734 137 137 Electronic Banking Services 234 249 256 269 1,009 250 250 Credit Cards Fees 581 621 675 655 2,533 590 590 Fees Charged to IPAB - - - 1 1 - - Other Fees 236 248 245 264 993 229 229 Fees Charged on Services 1,597 1,615 1,791 1,781 6,785 1,547 1,547 Fund Transfers 5 5 4 5 19 6 6 Other Fees 261 275 279 317 1,132 293 293 Expenses from Real Estate Portfolios - - - - - - - Fees Paid on Services 266 280 283 321 1,151 300 300 Foreign Exchange 128 135 165 351 779 356 356 Securities - Realized Gains 158 (68) 197 (174) 114 (23) (23) Securities - Unrealized Gains (85) 7 (277) 340 (16) (134) (134) Market Related Income 201 74 85 518 878 198 198
Non-Interest Income 1,532 1,410 1,592 1,978 6,512 1,445 1,445 Total Operating Income 5,449 5,234 5,524 5,245 21,452 5,267 5,267
Personnel 1,457 1,472 1,466 1,417 5,812 1,571 1,571Professional Fees Paid 219 230 286 428 1,163 330 330Administrative and Promotional Expenses 1,036 1,084 942 1,151 4,213 1,065 1,065Rents, Depreciation and Amortization 332 328 304 321 1,285 355 355Other Taxes (other than Income tax) 151 151 109 369 780 191 191Contribuitons to IPAB 213 228 238 259 938 267 267
Non-Interest Expense 3,408 3,494 3,344 3,945 14,191 3,779 3,779 Net Operating Income 2,041 1,740 2,180 1,300 7,261 1,488 1,488
Other Revenues 576 302 250 276 1,404 425 425Foreign Exchange - - - - - - -Recoveries 265 354 441 727 1,786 397 397Repomo - other revenues - - - - - - -Non-Operating Income 841 656 690 1,002 3,190 822 822 Other Expenses (74) (108) (58) (462) (703) (174) (174)Changes in Foreign Exchange Valuation - - - - - - - Repomo - other expenses (creditor balance) - - - - - - -Non-Operating Expense (74) (108) (58) (462) (703) (174) (174)
Non Operating Income (Expense), net 767 548 633 540 2,487 649 649 Pre-Tax Income 2,808 2,288 2,813 1,840 9,748 2,137 2,137
Income Tax 732 627 669 523 2,551 209 209Profit Sharing 232 232 252 161 877 197 197Tax on Assets - - - - - - -Deferred Income Tax and Profit Sharing 48 (157) 18 (107) (198) 318 318
Taxes 1,011 702 939 578 3,230 724 724 Net Income before Subsidiaries 1,796 1,586 1,874 1,262 6,518 1,413 1,413 Subsidiaries’ Net Income 34 14 28 37 113 29 29Net Income form Continuos Operations 1,830 1,600 1,901 1,299 6,631 1,442 1,442 Extraordinary Items, net - - - - - - -Minority Interest 25 27 21 14 88 24 24TOTAL NET INCOME 1,804 1,573 1,880 1,285 6,543 1,418 1,418
(*) Afore is included in the Subsidiaries’ net income.

According to the new criteria, effective as of January 2008, inflationary accounting no longer applies for re-expressing financial statements. Nonetheless, the figures for 2007 and previous years will continue to be expressed in pesos of December 2007.
First Quarter 2009.
37
III. 2 FINANCIAL STATEMENTS
BANKING SECTOR – BALANCE SHEET (Million Pesos)
1Q08 2Q08 3Q08 4Q08 1Q09 2Q09 3Q09 4Q09
ASSETS Cash and Due from Banks 39,471 41,284 45,391 53,896 55,790 Negotiable Instruments 7,151 9,749 9,967 5,577 4,629
Securities Available for Sale 15,329 14,803 14,826 11,971 12,163
Securities Held to Maturity 749 742 728 221,268 217,573
Investment in Securities 23,229 25,294 25,520 238,636 234,365
Non-assigned Securities pending Settlement - - - - -
Debtor Balance in Repo Trans, net 49 34 61 1 1,502
Repo Transactions with Collateral - - - - -
Secs to be received in Repo Trans, net - - - - -
Transactions with Derivatives 2,368 4,523 2,587 8,168 8,936
Operations w/ Derivatives & Securities 2,417 4,557 2,648 8,169 10,437 Commercial Loans 90,957 97,022 103,446 114,446 111,385 Financial Intermediaries’ Loans 17,329 18,070 19,977 14,331 13,374 Consumer Loans 28,626 30,376 31,409 29,365 27,770 Mortgage Loans 39,046 41,170 43,682 46,282 47,023 Government Entities’ Loans 17,556 24,366 25,401 26,977 28,574 IPAB Loans - - - - -
Performing Loans 193,514 211,003 223,916 231,400 228,126 Commercial PDL’s 944 973 1,180 1,591 2,071 Financial Intermediaries PDL’s - - - - 3 Consumer PDL’s 1,208 1,471 1,956 2,499 2,540 Mortgage PDL’s 893 619 704 746 825 Government Entities PDL’s - - - - - Past Due Loans 3,044 3,063 3,840 4,836 5,440
Gross Loan Portfolio 196,558 214,066 227,756 236,237 233,566
Preventive Loan Loss Reserves 3,976 4,153 4,791 6,582 5,942 Net Loan Portfolio 192,582 209,913 222,966 229,654 227,624 Acquired Collection Rights 3,538 3,375 3,232 3,049 2,923 Total Credit Portfolio 196,120 213,288 226,198 232,704 230,547
Benef.receivab.securitization transactions 546 520 404 796 699 Sundry Debtors & Other Accs Rec, net 12,132 9,992 12,520 9,074 13,355 Foreclosed Assets, net 506 653 682 863 841 Real Estate, Furniture & Equipment, net 6,344 6,339 6,406 6,575 6,654 Investments in Subsidiaries 871 839 866 931 977 Deferred Taxes, net 177 325 360 484 138
Goodwill 4,000 3,920 4,214 5,345 5,475 Intangibles 238 217 208 275 291 Other Assets 4,376 4,638 4,666 4,686 4,190 28,645 26,924 29,923 28,232 32,619
TOTAL ASSETS 290,428 311,867 330,083 562,433 563,758

According to the new criteria, effective as of January 2008, inflationary accounting no longer applies for re-expressing financial statements. Nonetheless, the figures for 2007 and previous years will continue to be expressed in pesos of December 2007.
First Quarter 2009.
38
III. 2 FINANCIAL STATEMENTS
BANKING SECTOR – BALANCE SHEET (Million Pesos)
1Q08 2Q08 3Q08 4Q08 1Q09 2Q09 3Q09 4Q09
LIABILITIES Demand Deposits 103,274 106,725 107,710 128,371 120,269 Time Deposits 93,971 114,746 134,012 132,539 135,038 Bank Bonds - - - - - Deposits 197,245 221,471 241,722 260,911 255,307 Immediate Redemption Loans 5,615 3,136 824 1,245 4,180 Short Term 14,225 6,836 6,569 17,886 19,223 Long Term 7,912 7,718 7,780 8,105 8,193 Due to Banks & Correspondents 27,752 17,691 15,173 27,236 31,596 Non-assigned Securities for Settlement 1,745 1,570 1,486 - 420 Creditor Balance in Repo Trans, net 252 553 537 192,581 191,364
Repo Transactions with Collateral - - - 2 304 Secs to be received in Repo Trans, net - - - - - Transactions with Derivatives 3,156 4,443 2,946 10,746 11,646 Operations w/ Derivatives & Securities 5,153 6,566 4,969 203,330 203,733 Income Tax & Profit Sharing Payable 1,121 1,209 1,328 1,042 426 Other Creditors & Accounts Payable 11,973 12,694 12,946 12,486 17,012 Other Payable Accounts 13,094 13,902 14,274 13,528 17,437 Subordinated Non Convertible Debt 14,561 16,932 17,923 20,613 18,053 Deferred Taxes - - - - - Deferred Credits 923 1,088 1,211 1,291 1,275 TOTAL LIABILITIES 258,727 277,650 295,272 526,908 527,402 STOCKHOLDER¨S EQUITY Paid-in Capital 10,955 10,955 10,955 10,955 10,955 Share Subscription Premiums 856 856 856 853 852 Subordinated Convertible Debentures - - - - - Subscribed Capital 11,811 11,811 11,811 11,808 11,807 Capital Reserves 3,390 4,005 4,005 4,005 4,005 Retained Earnings 14,749 14,039 14,039 13,426 19,988 Results from Valuation of Secs Available for Sale 392 749 (517) (237) (999) Results from Valuation of Hedging Secs (833) 58 (318) (1,626) (1,637) Results from Conversions of Foreign Ops (33) (258) 67 1,123 1,274 Surplus (Deficit) in Capital Restatement - - - - - Results of Non Monetary Fixed Assets - - - - - Results of Non Monetary –Investment Assets 86 71 80 87 87 Adjustments in the Employee’s Pensions - - - - - Accumulated Effect of Deferred Liabilities - - - - - Net Income 1,804 3,378 5,258 6,543 1,418 Earned Capital 19,554 22,042 22,614 23,320 24,135 Minority Interest 335 364 386 397 415
Total Stockholder´s Equity 31,700 34,216 34,811 35,526 36,356 TOTAL LIABILITIES & STOCKHOLDER´S EQUITY 290,428 311,867 330,083 562,433 563,758
BANKING SECTOR – MEMORANDUM ACCOUNTS (MillIon Pesos)
1Q08 2Q08 3Q08 4Q08 1Q09 2Q09 3Q09 4Q09
Endorsement Guarantees Granted - - - - - - - -Contingent Assets & Liabilities 265 262 266 266 264 Irrevocable Lines of Credit 2,846 2,530 2,580 2,793 3,129 Assets held in Trusts or Mandate 108,959 108,574 105,738 90,469 90,632 Assets held in custody or in administration 98,070 127,528 146,036 128,137 146,493 Investment banking transactions for third parties, net 101,754 109,570 94,858 84,615 91,943 Uncharged accrued interest from past - due loans 105 99 104 136 180 Collaterals Received 20,952 21,235 21,574 31,567 31,156 Amounts committed to fobaproa operations - - - - - Investment of retirement saving funds - - - - - Integration of loan portfolio - - - - -
Amounts received in derivative instruments - - - - - Fobaproa trusts - - - - - Repurchase securities to be received 202,305 205,840 208,509 4,248 - (Less) creditors from repos (202,496) (206,363 (208,982) (4,341) - Debtors from repos 9,583 5,768 9,269 - - (Less) Repurchase securities to be delivered (9,595) (5,764) (9,273) - - Other control accounts - - - - - 332,747 369,279 370,680 337,890 363,798

According to the new criteria, effective as of January 2008, inflationary accounting no longer applies for re-expressing financial statements. Nonetheless, the figures for 2007 and previous years will continue to be expressed in pesos of December 2007.
First Quarter 2009.
39
III. 2 FINANCIAL STATEMENTS
BANORTE USA
BANORTE USA – INCOME STATEMENT (Million Pesos)
1Q08 2Q08 3Q08 4Q08 2008 1Q09 2Q09 3Q09 4Q09 2009
Interest Income 299 293 298 363 1,253 379 379Interest Expense 140 130 127 146 542 158 158Loan Fees Charged - - - - - - -Fees Paid - - - - - - -
Net Interest Income (NII) 159 163 171 217 711 221 221Monetary Adjustment (Repomo) to margins - - - - - - -
NII after Repomo 159 163 171 217 711 221 221Preventive Provisions for Loan Losses (7) 17 14 81 104 9 9Loss Sharing Provisions - - - - - - -
NII Adjusted for Credit Risk 166 147 157 136 606 212 212Fund transfers - - - - - - -Account management - - - - - - -Fiduciary - - - - - - -
Income from Loan Portfolios Acquired - - - - - - - Electronic Banking Services - - - - - - -
Credit Card Fees - - - - - - -Fees Charged to IPAB - - - - - - -Other fees 24 24 32 67 147 38 38
Fees Charged on Services, 24 24 32 67 147 38 38Fund transfers - - - - - - -Other fees - - - - - - -Expenses from Loan Portfolios Acquired - - - - - - -
Fees Paid on Services - - - - - - -Foreign exchange - - - - - - -Securities –Realized gains - - - - - - -Securities- Unrealized gains - - - - - - -
Market Related Income - - - - - - -Total Non Interest Income 24 24 32 67 147 38 38Total Operating Income 190 170 189 204 753 251 251
Personnel 57 60 57 72 245 71 71Professional Fees Paid 7 7 7 11 32 11 11Administrative and Promotional Expenses 70 75 75 106 326 111 111Rents, depreciation and amortization 9 9 9 7 34 6 6Taxes, other than income tax - - - - - - -Contributions to IPAB - - - - - - -
Non-Interest Expense 143 152 148 196 638 198 198Operating Income 48 19 41 8 115 52 52
Other Revenues 59 53 49 67 229 48 48 Foreign exchange - - - - - - -Recoveries 1 1 1 2 5 1 1Repomo-other revenues - - - - - - -Non Operating Income 60 55 50 69 234 49 49Other Expenses - - - - - - -Changes in Foreign Exchange Valuation - - - - - - -Repomo-other expenses (creditor balance) - - - - - - -Non Operating Expense - - - - - - -
Non Operating Income (Expense), net 60 55 50 69 234 49 49Pre-tax Income 108 73 91 77 349 101 101Income Tax (36) (25) (29) (14) (105) (38) (38)Profit sharing - - - - - - -Tax on Assets - - - - - - -Deferred Income Tax and Profit sharing - - - - - - -
(36) (25) (29) (14) (105) (38) (38) Net Income before subsidiaries 71 48 62 63 245 62 62
Subsidiaries’ net income - - - - - - -Net Income from continuos operations 71 48 62 63 245 62 62
Extraodinary items, net - - - - - - -Minority Interest (25) (19) (21) (14) (79) (24) (24)
TOTAL NET INCOME 46 30 41 49 166 38 38

According to the new criteria, effective as of January 2008, inflationary accounting no longer applies for re-expressing financial statements. Nonetheless, the figures for 2007 and previous years will continue to be expressed in pesos of December 2007.
First Quarter 2009.
40
BANORTE USA – BALANCE SHEET (Million Pesos) 1Q08 2Q08 3Q08 4Q08 1Q09 2Q09 3Q09 4Q09
ASSETS
Cash and due from Banks 347 459 332 480 492
Negotiable Instruments - - - - -
Securities available for sale 5,312 5,487 5,249 6,227 6,484
Securities held to maturity 10 10 10 13 13
Investment in Securities 5,322 5,497 5,259 6,240 6,498
Non-assigned securities pending Settlement - - - - -
Debtor Balance in Repo Trans, net - - - - -
Repo Transactions with Collateral - - - - -
Secs to be received in Repo Trans, net - - - - -
Transactions with derivatives - - - - -
Operations w/ Derivatives & Securities - - - - -
Commercial Loans 9,063 8,834 10,004 12,845 13,495
Financial Intermediaries’ Loans - - - - -
Consumer Loans 180 166 186 249 239
Mortgage Loans 1,641 1,683 1,950 2,532 2,732
Goverment Entities’ Loans - - - - -
IPAB Loans - - - - -
Fiduciary Collection Rights - - - - -
Performing Loans 10,884 10,683 12,140 15,625 16,466
Commercial PDL’s 120 57 96 183 172
Financial Intermediaries’ PDL’s - - - - -
Consumer PDL’s 1 1 1 1 -
Mortgage PDL’s 16 21 19 41 30
Goverment Entities PDL’s - - - - -
Past Due Loans 137 79 117 225 202
Gross Loan Portfolio 11,021 10,762 12,256 15,850 16,668
Preventive loan loss reserves 119 128 149 259 266
Net Loan Portfolio 10,902 10,634 12,107 15,591 16,402
Credit Assets Portfolio - - - - -
Sundry debtors and other accs rec,net - - - 89 643
Foreclosed assets, net 152 313 326 484 452
Real Estate, Furniture & Equipment, net 580 572 606 753 760
Investments in subsidiaries 7 7 7 9 9
Deferred taxes, net - - - 18 -
Risk Coverage for Mortgage - - - - -
GoodWill 2,512 2,431 2,590 3,263 3,345
Intangible 126 114 112 133 131
Otros Assets 485 685 666 680 269
Other Assets 3,123 3,229 3,368 4,076 3,746
TOTAL ASSETS 20,434 20,712 22,005 27,740 29,001
II. FINANCIAL INFORMATION

According to the new criteria, effective as of January 2008, inflationary accounting no longer applies for re-expressing financial statements. Nonetheless, the figures for 2007 and previous years will continue to be expressed in pesos of December 2007.
First Quarter 2009.
41
III. 2 FINANCIAL STATEMENTS
BANORTE USA – BALANCE SHEET (Million Pesos) 1Q08 2Q08 3Q08 4Q08 1Q09 2Q09 3Q09 4Q09
LIABILITIES Demand Deposits 7,9 7,2 7,3 8,5 9,348 Time Deposits 7,3 7,3 8,2 10, 12,814 Bank Bonds - - - - - Deposits 15,280 14,618 15,517 19,065 22,162 Immediate Redemption Loans - 845 824 1,2 - Short term 768 1,0 1,1 1,6 814 Long term 77 71 73 89 88 Due to banks and correspondents 844 1,9 1,9 2,9 903 Non-assigned securities pending settlement - - - - - Cerditor Balance in Repo Trans, net - - - - - Repo transactions with collateral - - - - - Securities to be received in Repo Trans, net - - - - - Transactions with derivatives, net - - - - - Operations w/ Derivatives & Securities - - - - - Income Tax & Profit Sharing Payable 2 - 2 - - Other creditors & accounts payable 141 141 137 168 179 Other payable accounts 143 141 139 168 179 Subordinated non Convertible Debenture 220 213 226 285 292 Deferred Taxes 44 52 - - 9 Deferred credits 33 34 38 52 48 TOTAL LIABILITIES 16,564 17,014 17,919 22,538 23,592 STOCKHOLDER´S EQUITY Paid-in Capital 3,3 3,3 3,3 3,3 3,346 Share subscription premiums - - - - - Subordinated Convertible Debentures - - - - - Subscribed Capital 3,344 3,346 3,346 3,346 3,346 Capital Reserves - - - - - Retained Earnings 122 122 122 122 284 Results from Valuation of Secs Available for Sale 105 (2) 82 98 122 Results from Conversions of Foreign Ops (81) (199) 43 1,082 1,213 Surplus (Deficit) in capital restatement - - - - - Results of Non Monetary fixed assets - - - - - Results on non monetary - investment assets - - - - - Adjustment in employees’ pensions - - - - - Accumulated effect of Deferred Liabilities - - - - - Net Income 46 76 117 166 38 Earned Capital 192 (3) 365 1,4 1,657 Minority Holdings 334 354 376 387 405 Total Stockholder´s Equity 3,870 3,698 4,087 5,202 5,409
TOTAL LIABILITIES & STOCKHOLDER´S CAPITAL 20,434 20,712 22,005 27,740 29,001
BANORTE USA – MEMORANDUM ACCOUNTS (Million Pesos) 1Q07 2Q07 3Q07 4Q07 1Q09 2Q09 3Q09 4Q09
Endorsement guarantees granted - - - - - Other contingent obligations - - - - - Credit commitments 23 26 33 36 42 Irrevocable lines of credit - - - - - Assets held in trusts or mandate - - - - - Assets held in custody or in administration - - - - - Investment banking transactions for third parties, net - - - - - Amounts committed to fobaproa operations - - - - - Investment of retirement saving funds - - - - - Integration of loan portfolio - - - - - Amounts received in derivative instruments - - - - - Fobaproa trusts - - - - - Repurchase securities to be received - - - - - (Less) creditors from repos - - - - - Debitors from repos - - - - - (Less) Repurchase securities to be delivered - - - - - Other control accounts - - - - - Endorsement guarantees granted 18 21 14 14 42
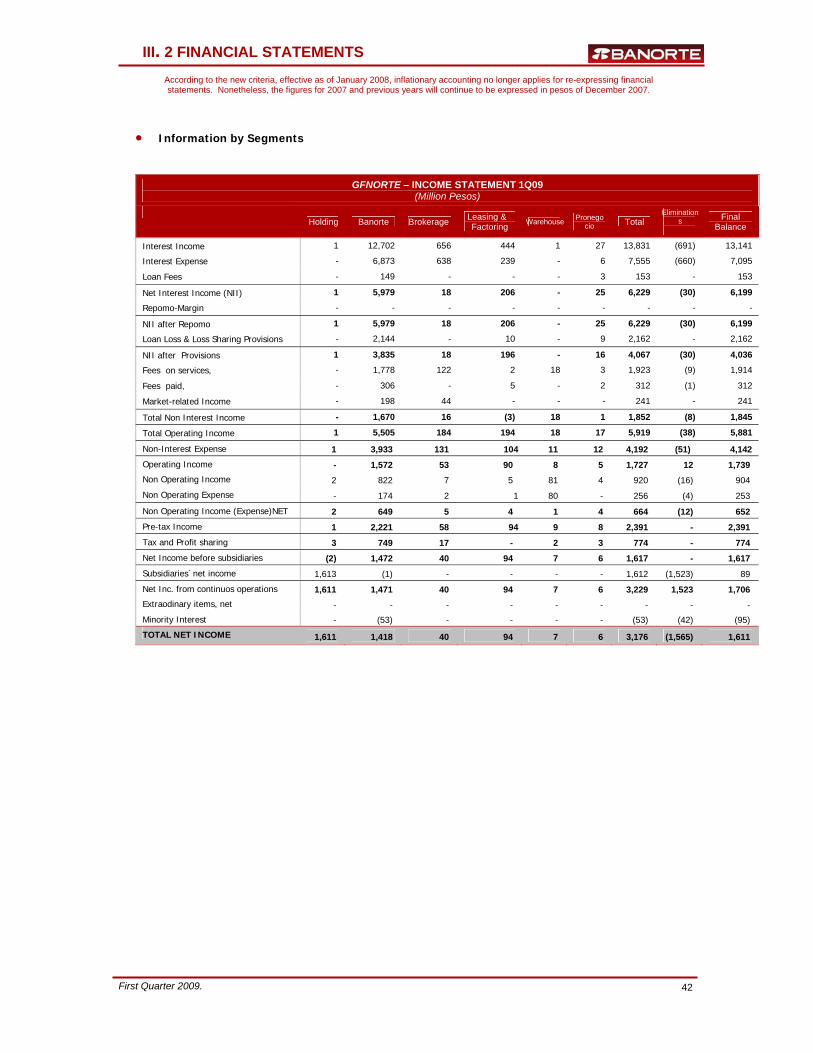
According to the new criteria, effective as of January 2008, inflationary accounting no longer applies for re-expressing financial statements. Nonetheless, the figures for 2007 and previous years will continue to be expressed in pesos of December 2007.
First Quarter 2009.
42
• Information by Segments
GFNORTE – INCOME STATEMENT 1Q09 (Million Pesos)
Holding Banorte Brokerage Leasing &
Factoring Warehouse Pronego cio Total
Eliminations
Final Balance
Interest Income 1 12,702 656 444 1 27 13,831 (691) 13,141
Interest Expense - 6,873 638 239 - 6 7,555 (660) 7,095
Loan Fees - 149 - - - 3 153 - 153
Net Interest Income (NII) 1 5,979 18 206 - 25 6,229 (30) 6,199
Repomo-Margin - - - - - - - - -
NII after Repomo 1 5,979 18 206 - 25 6,229 (30) 6,199
Loan Loss & Loss Sharing Provisions - 2,144 - 10 - 9 2,162 - 2,162
NII after Provisions 1 3,835 18 196 - 16 4,067 (30) 4,036
Fees on services, - 1,778 122 2 18 3 1,923 (9) 1,914
Fees paid, - 306 - 5 - 2 312 (1) 312
Market-related Income - 198 44 - - - 241 - 241
Total Non Interest Income - 1,670 16 (3) 18 1 1,852 (8) 1,845
Total Operating Income 1 5,505 184 194 18 17 5,919 (38) 5,881
Non-Interest Expense 1 3,933 131 104 11 12 4,192 (51) 4,142 Operating Income - 1,572 53 90 8 5 1,727 12 1,739 Non Operating Income 2 822 7 5 81 4 920 (16) 904 Non Operating Expense - 174 2 1 80 - 256 (4) 253
Non Operating Income (Expense)NET 2 649 5 4 1 4 664 (12) 652 Pre-tax Income 1 2,221 58 94 9 8 2,391 - 2,391 Tax and Profit sharing 3 749 17 - 2 3 774 - 774 Net Income before subsidiaries (2) 1,472 40 94 7 6 1,617 - 1,617 Subsidiaries´net income 1,613 (1) - - - - 1,612 (1,523) 89
Net Inc. from continuos operations 1,611 1,471 40 94 7 6 3,229 1,523 1,706 Extraodinary items, net - - - - - - - - -
Minority Interest - (53) - - - - (53) (42) (95)
TOTAL NET INCOME 1,611 1,418 40 94 7 6 3,176 (1,565) 1,611
III. 2 FINANCIAL STATEMENTS

According to the new criteria, effective as of January 2008, inflationary accounting no longer applies for re-expressing financial statements. Nonetheless, the figures for 2007 and previous years will continue to be expressed in pesos of December 2007.
First Quarter 2009.
43
GFNORTE – BALANCE SHEET AS OF 1Q09 (Million Pesos)
ASSETS Holding Banorte Brokerage Leasing & Factoring
Warehouse Pronego cio
Total Eliminations
Final balance
Cash and due from Banks 63 56,309 3 63 16 - 56,455 (139) 56,317 Negotiable Instruments - 4,629 543 - - - 5,172 - 5,172 Securities held for sale - 12,163 111 - - - 12,274 (404) 11,870 Securities held to maturity - 217,573 349 - - - 217,922 - 217,922 Financial Instruments: - 234,365 1,003 - - - 235,368 (404) 234,965 Non-assigned securities to pay - - - - - - - - - Futures receivable, net - 1,502 118 - - - 1,620 - 1,620 Options and derivatives, net - 8,936 - - - - 8,936 - 8,936 Repos & Derivatives : - 10,437 118 - - - 10,556 - 10,556 Commercial - 111,385 - 11,019 - 158 122,563 - 122,563 Financial Intermediaries - 13,374 - 53 - - 13,427 (3,198) 10,229 Consumer - 27,770 - 5 - - 27,775 - 27,775 Mortgage - 47,023 - - - - 47,023 - 47,023 Goverment Entities - 28,574 - 18 - - 28,592 - 28,592 Fobaproa - - - - - - - - - Performing Loans - 228,126 - 11,095 - 158 239,379 (3,198) 236,181 Commercial - 2,071 - 92 - 24 2,187 - 2,187 Financial Intermediaries - 3 - - - - 3 - 3 Consumer - 2,540 - - - - 2,541 - 2,541 Mortgage - 825 - - - - 825 - 825 Goverment Entities - - - - - - - - - Past Due Loans - 5,440 - 92 - 24 5,556 - 5,556 Total Credit - 233,566 - 11,187 - 182 244,935 (3,198) 241,137Preventive loan loss reserves - 5,942 - 88 - 21 6,051 - 6,051 Net Loan Portfolio - 227,624 - 11,099 - 162 238.884 (3,198) 235,686 Acquired collection rights - 2,923 - - - - 2,993 - 2,993 Total Loans - 230,547 - 11,099 - 162 241,807 (3,198) 238,609
Benef.receivab.securitization - 699 - - - - 699 - 699 Sundry debtors and other 2 13,417 105 141 58 8 13,731 33 13,764 Merchandise Inventory - - - - 479 - 479 - 479 Foreclosed assets, net - 841 - - - - 841 - 841 Real Estate, Furniture & Equipment, - 6,727 12 1,605 56 60 8,459 - 8,459 Investments in subsidiaries 39,186 974 18 - - - 40,178 (37,509) 2,668 Deferred taxes 3 138 - - - 31 172 (26) 147 GoodWill 31 5,475 - - - - 5,506 - 5,506 Intangible 3 291 - - - - 293 - 293 Otros Assets - 4,191 272 20 11 4 4,499 - 4,499 Total Other Assets 39,225 32,053 407 1,766 604 103 74,159 (37,503) 36,657 TOTAL ASSETS 39,228 564,411 1,532 12,927 621 266 618,346 (40,544) 577,802
III. 2 FINANCIAL STATEMENTS

According to the new criteria, effective as of January 2008, inflationary accounting no longer applies for re-expressing financial statements. Nonetheless, the figures for 2007 and previous years will continue to be expressed in pesos of December 2007.
First Quarter 2009.
44
GFNORTE – BALANCE SHEET AS OF 1Q09 (Million Pesos)
LIABILITIES Holding Banorte Brokerage Leasing & Factoring
Warehouse
Prone-gocio Total Eliminations
Final
balance
Demand Deposits - 120,268 - - - - 120,268 (13) 120,255
Time Deposits - 135,038 - - - - 135,038 (74) 134,964
Bonds - - - - - - - - -
Deposits - 255,305 - - - - 255,305 (86) 255,219
Demand - 4,180 - - - - 4,180 - 4,180
Short term - 19,223 - 8,631 466 201 28,520 (3,198) 25,322
Long term - 8,193 - 2,529 - - 10,723 - 10,723
Due to banks & corresp. - 31,596 - 11,160 466 201 43,423 (3,198) 40,225
Assigned securities to pay - 420 - - - - 420 - 420
Non-assigned securities to pay - - - - - - - - -
Futures receivable, net - 191,364 115 - - - 191,479 - 191,479
Options and derivatives, net - 11,950 - - - - 11,950 - 11,950
Repos & Derivatives: - 203,313 115 - - - 203,429 - 203,429
Income Tax & Profit Sharing - 458 37 - 1 - 496 - 496
Other Payable accounts 1 17,089 200 434 15 6 17,745 (20) 17,726
Other payable accounts 1 17,547 237 434 16 6 18,241 (20) 18,222 Subordinated non Convertible Debenture
- 18,053 - - - - 18,053 - 18,053
Deferred Taxes - - 16 - 10 - 26 (26) -
Deferred credits - 1,275 - 56 - 5 1,336 - 1,336
TOTAL LIABILITIES 1 527,510 369 11,649 492 212 540,233 (3,330) 536,903
STOCKHOLDER´S EQUITY
Paid-in Capital 12,007 10,955 540 306 87 195 24,091 (12,159) 11,932
Share subscription premiums 1,859 852 - - - - 2,710 (1,180) 1,530
Subordinated Convertible Debentures - - - - - - - - -
Subscribed Capital 13,866 11,807 540 306 87 195 26,801 (13,339) 13,462
Capital Reserves 2,748 4,005 72 195 17 - 7,037 (4,289) 2,748
Retained Earnings 23,965 19,988 446 683 17 (147) 44,953 (20,988) 23,965
Surplus (Deficit) from securities (1,315) (999) 41 - - - (2,273) 958 (1,315)
Results from coverage securities valuation
- (1,637) - - - - (1,637) 1,637 -
Results of foreign operations exchange
1,244 1,274 24 - - - 2,542 (1,298) 1,244
Excess (Insuf.) in capital restatement - - - - - - - - -
Non Mon assets results Fixed Assets - - - - - - - - -
Non Mon assets results Investm subsidiaries
(2,833) 87 - - - - (2,746) (87) (2,833)
Adjustment in the employees pension funds
- - - - - - - - -
Net Income 1,611 1,418 40 94 7 6 3,176 (1,565) 1,611
Earned Capital 25,421 24,135 623 972 42 (142) 51,051 (25,630) 25,421
Minority Holdings - 960 - - - - 960 1,056 2,016
Total Stockholder´s Equity 39,287 36,901 1,163 1,278 129 54 78,812 (37,913) 40,899
TOT. LIAB. & STOCKHOL. EQUITY 39,288 564,411 1,532 12,927 621 266 619,044 (41,243) 577,802
III. 2 FINANCIAL STATEMENTS

According to the new criteria, effective as of January 2008, inflationary accounting no longer applies for re-expressing financial statements. Nonetheless, the figures for 2007 and previous years will continue to be expressed in pesos of December 2007.
First Quarter 2009.
45
III. 3 ACCOUNTING CHANGES
ACCOUNTING CHANGES AND REGULATIONS • General guidelines applicable to the financial information of holding companies of financial institutions subject to supervision by the National Banking and Securities Commission (CNBV.) On April 27, 2005, the CNBV issued general provisions applicable to the financial information of the controlling companies of financial groups in order to homologate the information that financial groups issue to the public for the analysis of their solvency and economic stability. This is done in order to facilitate savings and investment decision-making. GFNorte’s Financial Statements can be found in our website at www.banorte.com/informacion_financiera • Provisions for implementation of the new Basel Capital Agreement. On October 3th, 2005, the CNBV published the agreement signed by financial authorities and the Mexican Banker’s Association in order to implement the new capital guidelines that contain the standards and principles known as Basel II that will enable the bank’s capital to reflect with greater precision the credit, market and operational risks. • New rules for banking institutions’ capital requirements. On December 28, 2005, the Ministry of Finance(Secretaria de Hacienda y Credito Publico (SHCP)), issued new regulations for capital requirements, establishing a greater number of of bands and higher capital requirements. These new regulations came into effect on January, 2006. • B-11 Bulletin. The income and amortizations from investments in collection rights will be recognized according to according to the rules established in the B-11 critera of the CNBV using one of the three different methods established in this critera for that effect. • B-10 Bulletin “Inflation Effects”. When comparing 2008 results vs. reported figures for previous periods are not fully comparable, as a result of the NIF B10 “Inflation Effects” norm taking effect in January of this year. This norm indicates that the economic environment is non-inflationary when the accumulated inflation rate over the last three years is less than 26%. Under this context, it is not necessary to re-express financial statements as of January 2008. For the purpose of comparisons, 2007 and previous year’s results are expressed in pesos of December 2007. • Change in rules for loan loss reserves requirements According to the new provisions of the CNBV published on August 22, 2008 in the DOF regarding the percentage of credit card reserves when there are no delinquent payments, and according to the second transitory article which makes it possible to make such adjustments by October, the impact of the change will be gradual. The percentage applied to reserves for zero delinquent payments for september is 1.72%, and at the close of October the change will be completed by applying a 2.5% reserve percentage for zero delinquent payments. • Repo Transactions and reclassification of investments in securities NEW ACCOUNTING CRITERIA On October 14, 2008 the CNBV published a series of changes to its accounting criteria in the Official Gazette of the Federation (DOF). Such changes became effective the following day. The most important changes include: • Criterion B-3 “Repurchasing and Sales Agreements” Repurchase or Resale Agreement operations will be recorded according to the financial substance of the operation itself which is financing with collateral, in which the purchaser of securities gives cash as financing in exchange for financial assets that serve as protection in case of default. Financial assets given as collateral by the purchaser of securities, pursuant to criterion C-1 are still recognized in the balance sheet provided that the risks, benefits and control of the same are kept. On the repurchase and sale operation contract date, the entity acting as the purchaser of securities should record the incoming cash or a debt-liquidating account as well as an account payable at a reasonable value at the initially agreed price, which represents the obligation to return such cash to the purchaser of securities. Throughout the life of the repurchasing and sale agreement, the account payable mentioned above will be valued at its reasonable value by acknowledging the interest on the repurchasing and sale agreement in the period’s results as accrued, according to the effective interest method that affects such account payable. On the repurchase and sale agreement operation contract date, the entity acting as the purchaser of securities should record the outlay of availabilities or a creditor-liquidating account, as well as an account receivable at a reasonable value, at initially the agreed price, which represents the right to recover the cash.
According to the new criteria, effective as of January 2008, inflationary accounting no longer applies for re-expressing financial statements. Nonetheless, the figures for 2007 and previous years will continue to be expressed in pesos of December 2007.
First Quarter 2009.
46
Throughout the life of the repurchasing and sale agreement, the account receivable mentioned above will be valued at its reasonable value by acknowledging the interest on the repurchase and sale agreement in the period’s results as accrued, according to the effective interest method that affects such account receivable. PREVIOUS ACCOUNTING CRITERIA Repurchase or Resale Agreement Operations Represent the temporary purchase or sale of certain financial instruments in exchange for an established premium with the obligation to resell or repurchase such securities in the future. When the Institution acts as the seller of securities, the net position represents the difference between the fair value of the securities covered by the repurchase agreement (asset position) which, in turn, represents the securities to be received through the transaction, valued according to the investment valuation methods established for trading securities, and the value of the present value of the price at maturity (liability position). When the Institution acts as the purchaser of securities, the net position represents the difference between the present value of the price at maturity (asset position) and the fair value of the securities received under the repurchase agreement (liability position) which are valued according to the method discussed in the preceding paragraph. The debit or credit balance resulting from transactions involving repurchase agreements is presented under assets or liabilities in the consolidated balance sheet under the heading “Securities and derivative financial instruments”. For repurchase transactions entered into for periods exceeding three business days, a guarantee must be provided to mitigate market and counterpart risks. Guarantees received for repurchase transactions not involving the transfer of ownership are recognized in memoranda accounts and are considered as restricted assets. a. Reclassification of Securities In view of the current economic situation and considering the worldwide financial system crisis, the CNBV has adjusted various criteria, especially those relative to Repurchase or Resale Agreement operations, to allow reporting debt securities independently of the category in which they are found, within the “Investment in Securities” line item. This is to avoid restricting financial market liquidity and volatility securities' prices. Furthermore, the Commission authorized the Institution, by means of Document No. 100-035/2008 issued on October 16, 2008 and Document No. 100-042/2008 issued on November 10, 2008, to reclassify the investment-in-securities holding position and the position of receivable securities in Repurchase or Resale Agreement operations, pursuant to the rules set forth in such documents. Therefore, during October, the Institution reclassified from the "Negotiable Securities" item to "Securities-held-to-maturity" item a total of 6,035,947,400 titles whose book value at the reclassification date was Ps 12,803. Additionally, from the “Securities available for sale” item the Institution reclassified to “Securities-held-to-maturity” a total of 560,523,193 instruments whose book value was USD 553 million and € 20 million. The above reclassification was due to the valuation loss that negotiable securities were showing when valuated at a reasonable value, caused by market volatility. By December 31, 2008 the position in securities-held-to-maturity has not shown indications of permanent deterioration. The effect of the valuation at reasonable value that would have been acknowledged if the above reclassification had not been made, would have shown up in the period results Ps (20) million and in shareholders’ equity Ps (710) million.
III. 3 ACCOUNTING CHANGES

According to the new criteria, effective as of January 2008, inflationary accounting no longer applies for re-expressing financial statements. Nonetheless, the figures for 2007 and previous years will continue to be expressed in pesos of December 2007.
First Quarter 2009.
47
III. 3 ACCOUNTING CHANGES
• Main changes resulting from new accounting criteria and norms. Among the main changes resulting from the new measures and norms issued or modified by the Commission and CINIF that became effective as of January 1st, 2009 are: The C-2 criteria, "Securitizations", establishes that in this type of transaction, the assigner can decide to transfer the risks and benefits and/or control of financial assets or not to the assignee. It establishes that the benefits from the asignee's surplus will be recognized as "benefits to be received in securitization transactions" and remain valued since its initial registration, at a reasonable value, with any valuation adjustments recognized in the results of the exercise. This valuation must be consistent with “Entity with a Specific Purpose”, Entidad de Propósito Especifico (EPE) accounting policies established as the securitization medium. If an assigner provides administrative services for transferred assets, an asset or liability must be registered initially from management of assets and liabilities, at its reasonable value according to the C-1 measure as follows: a) An asset is registered if payment exceeds the cost and expenses incurred in providing the service; to the contrary a liability is registered. b) Later, such asset or liability will be valued at a reasonable value, registering the effects of its valuation in the results of the exercise. Benefits of the remaining balances of securitization operations and the asset from management of financial assets transferred will be exhibited under the heading "Benefits to be received in securitization operations". The valuation of benefits to be received, as well as the asset or liability from management will be exhibited under the heading of "Other products" or "Other expenses", as appropriate. The effects of said measure, in the event of having been applied to securitizations effective December 31st, 2008 are detailed as follows: In realized securitization operations, the financial assets were eliminated from the balance sheet based on the effective accounting measures to date, C-1 "Transfer of financial assets" and C-2 "Securitization". Given that the new accounting measures that substitute the previous ones are applied prospectively, no retroactive recording will apply for operations performed prior to applying this measure, which is why the re-valuation of financial asset transfers previously registered is not required. Notwithstanding, in accordance with these new accounting measures, securitized loans for mortgage, state and municipal government portfolios that Banorte carried out during 2006 and 2007, respectively, did not fulfill the requirements of the new accounting measures for elimination from the balance sheet, given that in both operations most of the inherent risks and/or benefits are retained. The C-5 measure "Consolidation of Entities with a Specific Purpose" defines the particular norms related to the consolidation of EPEs. It establishes that an entity must consolidate an EPE when the economic substance of the relationship between both entities indicates that it controls said EPE.
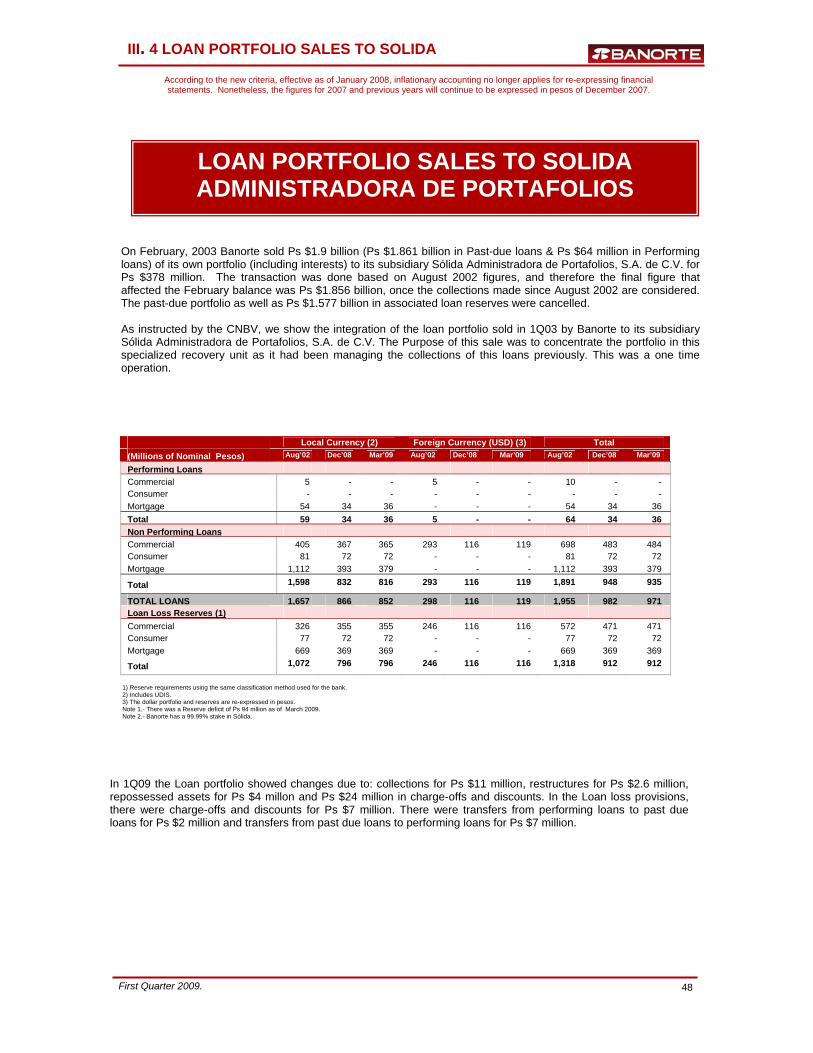
According to the new criteria, effective as of January 2008, inflationary accounting no longer applies for re-expressing financial statements. Nonetheless, the figures for 2007 and previous years will continue to be expressed in pesos of December 2007.
First Quarter 2009.
48
III. 4 LOAN PORTFOLIO SALES TO SOLIDA
LOAN PORTFOLIO SALES TO SOLIDA ADMINISTRADORA DE PORTAFOLIOS
On February, 2003 Banorte sold Ps $1.9 billion (Ps $1.861 billion in Past-due loans & Ps $64 million in Performing loans) of its own portfolio (including interests) to its subsidiary Sólida Administradora de Portafolios, S.A. de C.V. for Ps $378 million. The transaction was done based on August 2002 figures, and therefore the final figure that affected the February balance was Ps $1.856 billion, once the collections made since August 2002 are considered. The past-due portfolio as well as Ps $1.577 billion in associated loan reserves were cancelled. As instructed by the CNBV, we show the integration of the loan portfolio sold in 1Q03 by Banorte to its subsidiary Sólida Administradora de Portafolios, S.A. de C.V. The Purpose of this sale was to concentrate the portfolio in this specialized recovery unit as it had been managing the collections of this loans previously. This was a one time operation.
Local Currency (2) Foreign Currency (USD) (3) Total (Millions of Nominal Pesos) Aug’02 Dec’08 Mar’09 Aug’02 Dec’08 Mar’09 Aug’02 Dec’08 Mar’09
Performing Loans Commercial 5 - - 5 - - 10 - -Consumer - - - - - - - - - Mortgage 54 34 36 - - - 54 34 36 Total 59 34 36 5 - - 64 34 36Non Performing Loans Commercial 405 367 365 293 116 119 698 483 484Consumer 81 72 72 - - - 81 72 72 Mortgage 1,112 393 379 - - - 1,112 393 379
Total 1,598 832 816 293 116 119 1,891 948 935
TOTAL LOANS 1,657 866 852 298 116 119 1,955 982 971Loan Loss Reserves (1) Commercial 326 355 355 246 116 116 572 471 471Consumer 77 72 72 - - - 77 72 72 Mortgage 669 369 369 - - - 669 369 369
Total 1,072 796 796 246 116 116 1,318 912 912
1) Reserve requirements using the same classification method used for the bank. 2) Includes UDIS. 3) The dollar portfolio and reserves are re-expressed in pesos. Note 1.- There was a Reserve deficit of Ps 94 mllion as of March 2009. Note 2.- Banorte has a 99.99% stake in Sólida.
In 1Q09 the Loan portfolio showed changes due to: collections for Ps $11 million, restructures for Ps $2.6 million, repossessed assets for Ps $4 millon and Ps $24 million in charge-offs and discounts. In the Loan loss provisions, there were charge-offs and discounts for Ps $7 million. There were transfers from performing loans to past due loans for Ps $2 million and transfers from past due loans to performing loans for Ps $7 million.

According to the new criteria, effective as of January 2008, inflationary accounting no longer applies for re-expressing financial statements. Nonetheless, the figures for 2007 and previous years will continue to be expressed in pesos of December 2007.
First Quarter 2009.
49
III. 4 LOAN PORTFOLIO SALES TO SOLIDA
Local Currency (1) Foreign Currency (USD)(2) Total
(Millions of Nominal Pesos) Dec’08 Mar’09 Dec’08 Mar’09 Dec’08 Mar’09
Performing Loans
Commercial 129,995 128,548 15,377 14,277 145,372 142,825
Consumer 29,116 27,531 - - 29,116 27,531
Mortgage 43,784 44,328 - - 43,784 44,328
Fobaproa / IPAB - - - - - -
Performing Loans 202,895 200,407 15,377 14,277 218,272 214,684
Non Performing Loans
Commercial 1,738 2,171 153 214 1,891 2,385
Consumer 2,570 2,612 - - 2,570 2,612
Mortgage 1,098 1,175 - - 1,098 1,175
Non Performing Loans 5,406 5,958 153 214 5,559 6,172
TOTAL LOANS 208,301 206,365 15,530 14,491 223,831 220,856
Loan Loss Reserves 6,950 6,243 285 337 7,235 6,580
Net Loan Portfolio 201,351 200,122 15,245 14,154 216,596 214,276
Loan Loss Reserves 130.15% 106.61%
% Past Due Loans 2.48% 2.79%
1) Includes UDIS. 2) The dollar portfolio and reserves are re-expressed in pesos.
As instructed by the CNBV for purposes of determining financial indicators and a general disclosure referred to regulations, we show the integration of the Banorte’s portfolio including the portfolio which was sold to Sólida Administradora de Portafolios, S.A. de C.V..

According to the new criteria, effective as of January 2008, inflationary accounting no longer applies for re-expressing financial statements. Nonetheless, the figures for 2007 and previous years will continue to be expressed in pesos of December 2007.
First Quarter 2009.
50
NOTES TO FINANCIAL STATEMENTS
III. 5 NOTES TO FINANCIAL STATEMENTS
FINANCIAL INSTRUMENTS AND VALUATION EFFECTS 1Q09 (Million Pesos) NEGOTIABLE INSTRUMENTS
BOOK VALUE INTEREST UNREALIZED
GAIN (LOSS) MARKET VALUE
Goverment Securities 2,704 1 (1) 2,704
Cetes 100 - 1 101
Bonds 24 - (2) 23
Bondes - - - -
Bpas 2,580 1 (1) 2,580
Brems - - - -
UMS - - - -
UdiBonds - - - -
Stock Certificates - - - -
Banking Securities 2,336 - - 2,336
Notes 2,335 - - 2,336
Cedes - - - -
Bonds - - - -
Stock Certificates - - - -
Other Bank Papers - - - -
Private 16 - 9 26
Commercial Paper Pesos 16 - 9 25
Commercial Paper U.S. Dollars - - - -
PEMEX - - - -
Eurobonds - - - -
Stock Certificates - - - -
Bank Paper - - - -
Foreign Goverment 102 - - 102
Treasury Bonds - - - -
Treasury Bill - - - -
Treasury Notes - - - -
Shares listed in the SIC - - - -
Guarantee (collateral) for futures 4 - - 4
Mutual Funds - - - -
Total 5,163 1 9 5,172SECURITIES HELD TO MATURITY Cetes 697 6 - 702
Affected papers as collateral - - - -
Derechos Fiduciarios - - - -
Goverment Securities 161,684 211 - 161,895
Bonds 634 1 - 635
Bondes 33,240 56 - 33,296
Bpas 125,186 113 - 125,298
Brems - - - -
UMS 2,598 32 - 2,630
UdiBonds 3 1 - 3
Cetes - - - -
Stock Certificates 23 10 - 33
Banking Securities 29,846 59 - 29,905
Notes - - - -
Cedes 9,743 10 - 9,753
Bonds 5,854 8 - 5,862
Stock Certificates 13,279 41 - 13,320
Other Bank Papers 971 - - 971
Private 24,897 145 - 25,042
Commercial Paper Pesos - - - -
Commercial Paper U.S. Dollars - - - -
PEMEX 5,446 104 - 5,550
Eurobonds - - - -
Stock Certificates 19,381 41 - 19,421
Structured Notes 70 - - 70
Other Debt Securities 349 - - 349
Government Securities 13 - - 13
Subordinated Notes 16 - - 16
Total 217,501 421 - 217,922

According to the new criteria, effective as of January 2008, inflationary accounting no longer applies for re-expressing financial statements. Nonetheless, the figures for 2007 and previous years will continue to be expressed in pesos of December 2007.
First Quarter 2009.
51
III. 5 NOTES TO FINANCIAL STATEMENTS
SECURITIES HELD FOR SALE 1Q09 (Million Pesos)
SECURITIES HELD FOR SALE BOOK VALUE INTEREST UNREALIZED
GAIN (LOSS) MARKET VALUE
Goverment Securities 6,411 26 48 6,485
Mexican Government Securities (UMS) 512 6 2 521
Treasury Bonds - - - -
Private company bonds 2 - 102 104
Private company bonds - - 25 25
GFNorte’s Stock 61 - (61) -
BMV’s Stock 234 - (123) 111
Bonds 4,180 57 (680) 3,556
Eurobonds 566 25 (218) 373
Bank Paper - - - -
Structured notes - - - -
PEMEX 691 12 (7) 695
Subordinated securities - - - -
Swaps for hedging purposes - - - -
Total 12,656 126 (912) 11,870
SECURITIES ASSIGNED FOR SETTLEMENT 1Q09 (Million Pesos)
SECURITIES ASSIGNED FOR SETTLEMENT BOOK VALUE INTEREST UNREALIZED
GAIN (LOSS) MARKET VALUE
Government securities 420 - - 420
Cetes - - - -
Bonds 24 - - 24
Bondes - - - -
Bpas 396 - - 396
Brems - - - -
UMS - - - -
UdiBonds - - - -
2U CBIC - - - -
Stock Certificates - - - -
Bank Paper - - - -
Private - - - -
Foreign Goverment - - - -
Total 420 - - 420
REPURCHASE AGREEMENT OPERATIONS 1Q09 (Million Pesos)
FINANCIAL STATEMENT SALES
MARKET VALUE INDIVIDUAL COMPENSATION
RECEIVABLES ON
REPURCHASE AGREEMENT
SECURITIES TO BE DELIVERED
GLOBAL POSITION
ASSET BALANCE
LIABILITY BALANCE
Goverment Securities 30,223 190,984 (160,761) 13 160,774
Banking Securities 1,101 18,546 (17,445) - 17,445
Private Securities - 13,248 (13,248) - 13,248
Total 31,324 222,778 (191,454) 13 191,467
FINANCIAL STATEMENT PURCHASES
MARKET VALUE INDIVIDUAL COMPENSATION
RECEIVABLES ON
REPURCHASE AGREEMENT
SECURITIES TO BE DELIVERED
GLOBAL POSITION
ASSET BALANCE
LIABILITY BALANCE
Goverment Securities 36,202 34,940 (1,262) 1,578 316
Banking Securities 993 963 (29) 29 -
Private Securities - - - - -
Total 37,195 35,904 (1,291) 1,607 316
1,620 191,783
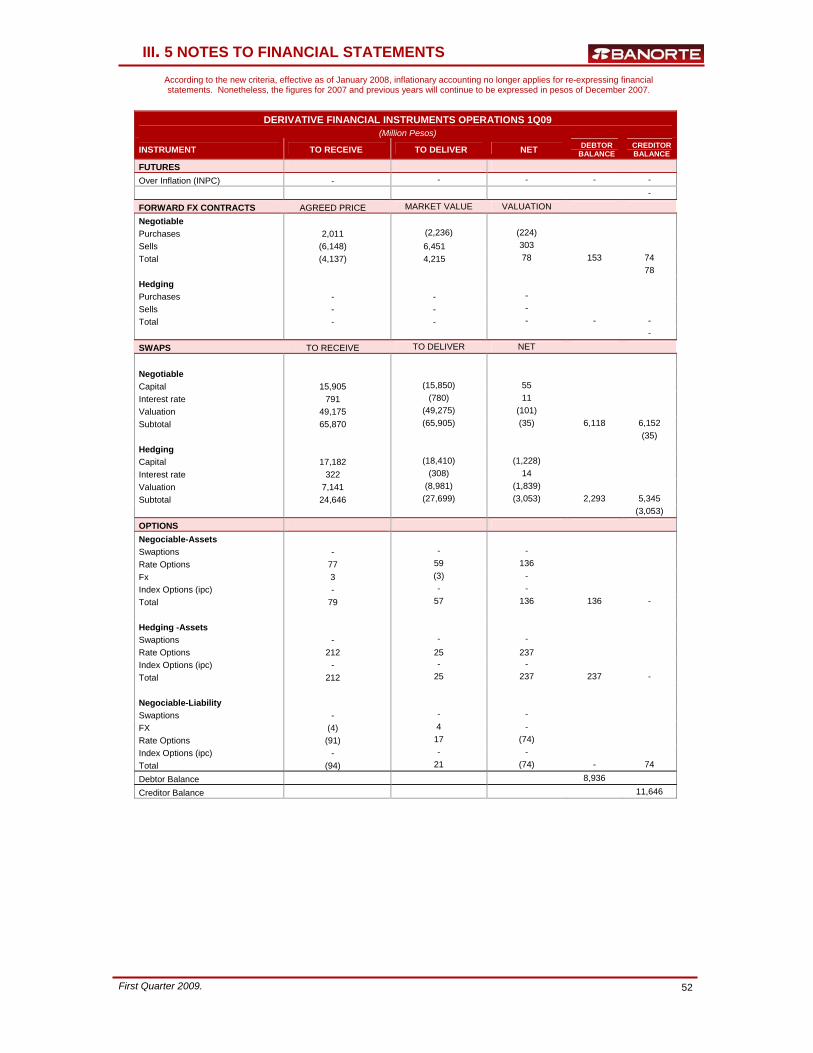
According to the new criteria, effective as of January 2008, inflationary accounting no longer applies for re-expressing financial statements. Nonetheless, the figures for 2007 and previous years will continue to be expressed in pesos of December 2007.
First Quarter 2009.
52
III. 5 NOTES TO FINANCIAL STATEMENTS
DERIVATIVE FINANCIAL INSTRUMENTS OPERATIONS 1Q09 (Million Pesos)
INSTRUMENT TO RECEIVE TO DELIVER NET DEBTOR BALANCE
CREDITOR BALANCE
FUTURES
Over Inflation (INPC) - - - - -
-
FORWARD FX CONTRACTS AGREED PRICE MARKET VALUE VALUATION
Negotiable Purchases 2,011 (2,236) (224) Sells (6,148) 6,451 303 Total (4,137) 4,215 78 153 74 78 Hedging Purchases - - - Sells - - - Total - - - - - -
SWAPS TO RECEIVE TO DELIVER NET
Negotiable Capital 15,905 (15,850) 55 Interest rate 791 (780) 11 Valuation 49,175 (49,275) (101) Subtotal 65,870 (65,905) (35) 6,118 6,152 (35) Hedging Capital 17,182 (18,410) (1,228) Interest rate 322 (308) 14 Valuation 7,141 (8,981) (1,839) Subtotal 24,646 (27,699) (3,053) 2,293 5,345 (3,053)
OPTIONS
Negociable-Assets Swaptions - - - Rate Options 77 59 136 Fx 3 (3) - Index Options (ipc) - - - Total 79 57 136 136 - Hedging -Assets Swaptions - - - Rate Options 212 25 237 Index Options (ipc) - - - Total 212 25 237 237 - Negociable-Liability Swaptions - - - FX (4) 4 - Rate Options (91) 17 (74) Index Options (ipc) - - - Total (94) 21 (74) - 74
Debtor Balance 8,936
Creditor Balance 11,646

According to the new criteria, effective as of January 2008, inflationary accounting no longer applies for re-expressing financial statements. Nonetheless, the figures for 2007 and previous years will continue to be expressed in pesos of December 2007.
First Quarter 2009.
53
III. 5 NOTES TO FINANCIAL STATEMENTS
NOTIONAL PRINCIPAL AMOUNT IN DERIVATIVE OPERATIONS 1Q09 (Mililon Pesos)
PRODUCT KIND UNDERLYING CURRENCY NOTIONAL
FX Forwards Purchases Exchange Rate (Dollar) MXN 2,011
FX Forwards Sales Exchange Rate (Dollar) MXN 6,148
FX Options Purchases Exchange Rate (Dollar) MXN 65
FX Options Sales Exchange Rate (Dollar) MXN 67
Interest Rate Options Purchases TIIE MXN 33,464 Interest Rate Options Sells TIIE MXN 9,989 Interest Rate Swaptions USLI/IRS TIIE MXN - Interest Rate Swaptions TIIE/IRS TIIE MXN - Interest Rate Swaps USLI/IRS LIBOR MXN 9,502 Interest Rate Swaps TIIE/IRS TIIE MXN 189,637 FX Swaps CS EURMXN FIX/FIX MXN 1,010 FX Swaps CS USDCETE CETE MXN 3,750 FX Swaps CS USDMXN FIX/FIX MXN 28,327 Futures in MEXDER Purchases TIIE MXN - Futures in MEXDER Sales TIIE MXN - Futures in MEXDER Purchases CETE MXN - Futures in MEXDER Sales CETE MXN - Futures in MEXDER Purchases M10 MXN - Futures in MEXDER Sales M10 MXN -
INVESTMENT IN NON GOVERNMENTAL FINANCIAL INSTRUMENTS THAT RESPRESENT MORE THAN 5%NET CAPITAL 1Q09
(Million Pesos) INDUSTRY INVESTMENT INSTRUMENT AMOUNT % NET CAPITAL
BANCOMER Banking Bond 11,166 26%

According to the new criteria, effective as of January 2008, inflationary accounting no longer applies for re-expressing financial statements. Nonetheless, the figures for 2007 and previous years will continue to be expressed in pesos of December 2007.
First Quarter 2009.
54
III. 5 NOTES TO FINANCIAL STATEMENTS
Quarter ending balance of Ps 93 million pesos in debtors support programs with a cost for the period of Ps 8 million.
LOAN PORTFOLIO (Million Pesos)
Local Currency UDIS Foreign Currency Total
1Q08 1Q09 1Q08 1Q09 1Q08 1Q09 1Q08 1Q09 Performing Loans
Commercial 75,800 92,361 291 297 24,948 29,905 101,040 122,563 Financial Intermediaries 12,435 10,119 - - 1,157 109 13,592 10,229 Consumer 28,367 27,448 94 88 180 239 28,642 27,775 Mortgages 36,388 43,449 1,017 842 1,641 2,732 39,046 47,023 Goverment Entities 17,252 28,303 - - 305 289 17,556 28,592 Fobaproa - - - - - - - -
Total 170,242 201,681 1,403 1,228 28,230 33,273 199,875 236,181 Past Due Loans
Commercial 940 1,914 6 6 144 268 1,089 2,187 Financial Intermediaries - 3 - - - - - 3 Consumer 1,207 2,540 - - 1 - 1,208 2,540 Mortgages 540 749 336 47 16 30 893 825 Goverment Entities - - - - - - - - Total 2,687 5,206 342 53 161 298 3,189 5,556 Total Propietary Loans 172,929 206,887 1,744 1,280 28,391 33,570 203,065 241,737
COST OF BALANCES OF FINAPE, FOPIME, MORTGAGE UDIS AND MORTGAGE FOVI LOAN PORTFOLIOS AS OF 1Q09
()Million Pesos) TOTAL
PERIOD COST BALANCE OF LOAN PORTFOLIO
FINAPE - -
FOPYME - -
Mortgage UDIS 7.6 92.5
Mortgage FOVI - -
7.6 92.5
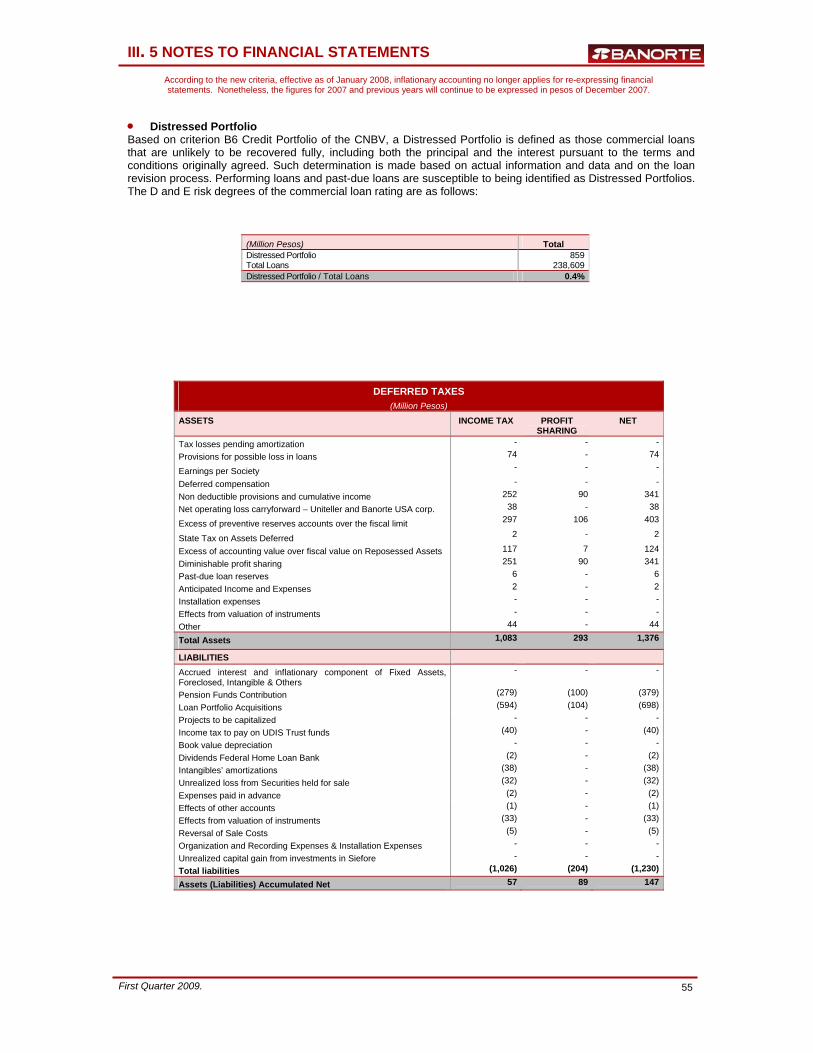
According to the new criteria, effective as of January 2008, inflationary accounting no longer applies for re-expressing financial statements. Nonetheless, the figures for 2007 and previous years will continue to be expressed in pesos of December 2007.
First Quarter 2009.
55
• Distressed Portfolio Based on criterion B6 Credit Portfolio of the CNBV, a Distressed Portfolio is defined as those commercial loans that are unlikely to be recovered fully, including both the principal and the interest pursuant to the terms and conditions originally agreed. Such determination is made based on actual information and data and on the loan revision process. Performing loans and past-due loans are susceptible to being identified as Distressed Portfolios. The D and E risk degrees of the commercial loan rating are as follows:
III. 5 NOTES TO FINANCIAL STATEMENTS
(Million Pesos) Total Distressed Portfolio 859 Total Loans 238,609 Distressed Portfolio / Total Loans 0.4%
DEFERRED TAXES (Million Pesos)
ASSETS INCOME TAX PROFIT SHARING
NET
Tax losses pending amortization - - -
Provisions for possible loss in loans 74 - 74
Earnings per Society - - -
Deferred compensation - - -
Non deductible provisions and cumulative income 252 90 341
Net operating loss carryforward – Uniteller and Banorte USA corp. 38 - 38
Excess of preventive reserves accounts over the fiscal limit 297 106 403
State Tax on Assets Deferred 2 - 2
Excess of accounting value over fiscal value on Reposessed Assets 117 7 124
Diminishable profit sharing 251 90 341
Past-due loan reserves 6 - 6
Anticipated Income and Expenses 2 - 2
Installation expenses - - -
Effects from valuation of instruments - - -
Other 44 - 44
Total Assets 1,083 293 1,376
LIABILITIES Accrued interest and inflationary component of Fixed Assets, Foreclosed, Intangible & Others
- - -
Pension Funds Contribution (279) (100) (379)
Loan Portfolio Acquisitions (594) (104) (698)
Projects to be capitalized - - -
Income tax to pay on UDIS Trust funds (40) - (40)
Book value depreciation - - -
Dividends Federal Home Loan Bank (2) - (2)
Intangibles’ amortizations (38) - (38)
Unrealized loss from Securities held for sale (32) - (32)
Expenses paid in advance (2) - (2)
Effects of other accounts (1) - (1)
Effects from valuation of instruments (33) - (33)
Reversal of Sale Costs (5) - (5)
Organization and Recording Expenses & Installation Expenses - - -
Unrealized capital gain from investments in Siefore - - -
Total liabilities (1,026) (204) (1,230)
Assets (Liabilities) Accumulated Net 57 89 147

According to the new criteria, effective as of January 2008, inflationary accounting no longer applies for re-expressing financial statements. Nonetheless, the figures for 2007 and previous years will continue to be expressed in pesos of December 2007.
First Quarter 2009.
56
LONG TERM DEBT AS OF 1Q09 (Million Pesos)
TYPE OF DEBT
CURRENCY
DATE OF ISSUE
AMOUNT (Pesos)
ORIGINAL AMOUNT (Million
Ps, Dlls or UDIS)
TERM INTEREST RATE
MATURITY INTEREST PAYMENT
CD’s- Banorte U01001 UDIs Jan 11 ’01 378 90 10 years 8.13% Dec 30 ’10 E/182 days Step-Up Subordinated Callable Notes Due 2014 USD Feb 17 ’04 4,150 300 10 years 5.875% Feb 17 ‘14 E/ 180 days
Non Convertible Subordinated Bonds 2006 USD Oct 13 ’06 5,533 400 1 year 6.135% Oct 13 ‘16 E/ 180 days
Non Convertible Subordinated Bonds 2006 USD Oct 13 ’06 2,767 200 15 years 6.862% Oct 13 ‘21 E/ 180 days
Non Convertible Subordinated Bonds Q Banorte 08 MXN Mar 11 ‘08 3,000 3,000 10 years TIIE + 0.60% Feb 27 ‘18 E/ 28 days
Non Convertible Subordinated Bonds Q Banorte 08U UDIs Mar 11 ‘08 1,871 441 20 years 4.95% Feb 27 ‘18 E/ 182 days
Non Convertible Subordinated Bonds Q Banorte 08-2 MXN Jun 27 ‘08 2,750 2,750 10 years TIIE + 0.77% Jun 15 ’18 E/ 28 days
Non Convertible Subordinated Bonds Q Banorte 09 MXN Mar 30 ‘09 1,338 1,338 10 years TIIE + 2.00% Mar 18 ‘19 E/ 28 days
III. 5 NOTES TO FINANCIAL STATEMENTS
BANK AND OTHER ENTITIES LOANS’ AS OF 1Q09 (Million Pesos)
LOCAL CURRENCY
INTEREST
RATE
TERM (DAYS)
FOREIGN CURRENCY
INTEREST RATE
TERM (DAYS)
TOTAL
LOANS FROM LOCAL BANKS - - - 207 4.05% 1,400 207
LOANS FROM FOREIGN BANKS GENERATED IN THE COUNTRY
- - - 1,020 L+0.9 899 1,020
LOANS FROM FOREIGN BANK GENERATED FROM CAYMAN
- - - 4,299 3.21% 489 4,299
LOANS FROM DEVELOPMENT BANKS 5,836 4.75% 530 2,260 3.38% 30 8,096
LOANS FROM PUBLIC FUNDS 6,372 7.26% 504 560 1.56% 442 6,932 CALL MONEY & LOANS FROM BANKS 22,231 7.99% 115 - - - 22,231 LOANS FROM FIDUCIARY FUNDS 514 5.36% 4,487 - - - 514
PROVISIONS FOR INTEREST 125 N.A. N.A. - - - 125 35,078 8,346 43,424 Eliminations (3,198) - (3,198) Total 31,880 8,346 40,225

According to the new criteria, effective as of January 2008, inflationary accounting no longer applies for re-expressing financial statements. Nonetheless, the figures for 2007 and previous years will continue to be expressed in pesos of December 2007.
First Quarter 2009.
57
III. 5 NOTES TO FINANCIAL STATEMENTS
TRADING INCOME 1Q09 (Million Pesos)
VALUATION EFFECTS Negotiable Instruments (1)
Securities Held to Maturity (15)
Repurchase Agreements (1)
Derivative instruments (116)
Futures -
From repo trasactions -
Range -
Inflation Adjustment -
Total (133)
Dividends Received -RESULTS FORM BUYING AND SELLING
Negotiable Instruments 17
Securities Held for Sell (5)
Hedging Derivatives 7
Securities Held to Maturity -
Inflation Adjustment -
Total of Buying and Selling Instruments 19
FX Spot 217
FX Forwards 150
FX Futures -
FX Futures TIIE -
FX Hedging -
Changes in FX Valuation (16)
Intermediation of metals 2
Changes in valuation of Metals 2Total Foreign Exchange 356
Inflation Adjustment -
Total of Buying and Selling 374
TOTAL TRADING INCOME 241

According to the new criteria, effective as of January 2008, inflationary accounting no longer applies for re-expressing financial statements. Nonetheless, the figures for 2007 and previous years will continue to be expressed in pesos of December 2007.
First Quarter 2009.
58
III. 5 NOTES TO FINANCIAL STATEMENTS
• Risk Management
Credit Risk Credit risk is the risk of clients failing to meet their payments. Therefore, it is essential to correctly manage such a risk in order to maintain a quality loan portfolio. The objectives of credit risk management at GFNorte are:
⋅ Improve the quality, diversification and composition of the loan portfolio in order to optimize the risk-performance (yield) ratio
⋅ Provide Executive Management with reliable, timely information to assist decision making regarding loans.
⋅ Provide the Business Areas with clear and sufficient tools to support loan placement and follow-up.
⋅ Create economic value for shareholders by efficient loan risk management.
⋅ Comply with the information requirements that the authorities set forth regarding loan risk management.
⋅ Perform risk management in accordance with the best practices, implementing models, methodologies, procedures and systems based on the main advances worldwide.
Individual Credit Risk
The Bank of the Group separate the loan portfolio into two large groups: consumer loans and company loans. The individual loan risk for consumer loans is identified, measured and controlled by a parametric system (scoring) that includes origination and behavior models for each of the consumer products: mortgage, car, payroll loans and credit cards. The individual risk for company loans is identified, measures and controlled by the Target Markets, Risk Acceptance Criteria and Banorte’s Internal Risk Qualification (CIR). The Target Markets and Risk Acceptance Criteria are tools that, along with the Internal Risk Qualification, are part of GFNorte’s Loan Strategy and give support to loan risk level estimation. The Target Markets are activities selected by region and economic activity – backed by economic research and loan behavior analysis – where Banorte is interested in placing loans. The Risk Acceptance Criteria are parameters that describe the risk identified by the industry, which makes it possible to estimate the risk involved for the bank when granting a loan to customer on the bases of their economic activity. The types of risk contemplated in the Risk Acceptance Criteria are financial risk, operation risk, market risk, company life cycle, legal, regulatory, loan experience and management quality. Early Alerts are a set of criteria based on borrower information and indicators and their conditions that were established as a mechanism for the timely prevention and identification of a probable deterioration in the loan portfolio, thereby enabling the institution to take prompt preventive actions to mitigate the credit risk.. Banorte’s CIR aligns with the “general PROVISIONS applicable to the loan qualification method of loan institution” issued by the CNByV on December 2, 2005. Banorte’s CIR was certified by the CNBV and by an international external auditor in 2001. Banorte’s CIR is applied to commercial loans equal to or greater than an amount in Mexican pesos equivalent to four million investment units on the qualification date.
Portfolio Credit Risk GFNorte has designed a portfolio credit risk method that, besides contemplating the major and latest international practices in identification, measurement, control and follow-up, has been adapted to work within the context of the Mexican Financial System. This credit risk methodology makes it possible to know the current value of the portfolio loans of GFNorte, that is, the loan exposure, allowing surveillance of the risk concentration levels per risk qualification, geographical regions, economic activities, currency and type of product in order to know the portfolio’s profile and take action to direct it toward a diversification which will maximize profitability with the lowest risk. Calculating loan exposure implies generating a cash flow of each one of the loans, of both capital and interest to discount it later. This exposure is sensible to changes in the market, thereby facilitating calculations under different economic scenarios.

According to the new criteria, effective as of January 2008, inflationary accounting no longer applies for re-expressing financial statements. Nonetheless, the figures for 2007 and previous years will continue to be expressed in pesos of December 2007.
First Quarter 2009.
59
III. NOTES TO FINANCIAL STATEMENTS
The method, in addition to contemplating loan exposure, takes into consideration the probability of non-compliance, the recovery level associated to each client and the classification of the debtor based on the Merton model. The probability of non-compliance is the probability that the debtor will not meet his/her debt obligation with the bank according to the originally agreed terms and conditions. The probability of non-compliance is based on the transition matrixes that the Banks calculate from the migration of the debtors through different risk qualification levels. The recovery ratio is the percentage of total exposure that is estimated to be recovered if the debtor fails to comply. The classification of the debtor, based on the Merton model, associates the debtor’s future behavior to loan and market factors on which his “credit health” depends, as determined by statistical techniques. The results are risk measures such as the expected and unexpected loss at a one-year horizon. The expected loss is the credit portfolio's loss distribution average, which is used to measure the following year’s expected loss due to non-compliance or variations in debtors’ credit quality. This unexpected loss is an indicator of the loss that could be expected in extreme scenarios and is measured as the difference between the maximum loss given the distribution of losses, at a specific reliability level that in the case of the Banking Sector is 95%, and the expected loss. The results obtained are used as a tool for better decision-making in granting loans and in the diversification of the portfolio, according to the Banks’ global strategy. The individual risk identification tools and the portfolio credit risk methodology are periodically checked and updated to allow the application of new techniques that may support or strengthen them. By March 31, 2009, the Banco Mercantil del Norte and Pronegocio total portfolio was Ps 220,068 million. The expected loss represents 2.6% and the unexpected loss is 4.3% with respect to the total portfolio. The average expected loss is 2.7% during the period between January and March 2009
General rules for risk diversification in asset and liability operations applicable to loan institutions
In compliance with the risk diversification rules in asset and liability operations, Banco Mercantil del Norte submits the following information: Basic capital by December 31, 2008 $28,300 I. Financings whose individual amount represents
more than 10% of the basic capital: Credit operations
− Number of financings 3 − Total amount of financings $10,557 − % vs. basic capital 37%
Money Market operations − Number of financings 2 − Total amount of financings $5,899 − % vs. basic capital 21%
Transactions in overnight
− Number of financings 3 − Amount of financings taken as a whole $13,755 − % in relation to basic capital 49%
*Investments with Banks in checking accounts
II. Maximum amount of financing with the 3 major Common Risk debtors and groups $33,163
In compliance with the risk diversification rules for asset and liability transactions, the following information is provided below regarding ProNegocio (Millions of pesos): Basic capital as of December 31, 2008 $48

According to the new criteria, effective as of January 2008, inflationary accounting no longer applies for re-expressing financial statements. Nonetheless, the figures for 2007 and previous years will continue to be expressed in pesos of December 2007.
First Quarter 2009.
60
III. 5 NOTES TO FINANCIAL STATEMENTS
III. Financing whose individual amount represents more than 10% of basic capital: Credit transactions
− Number of financings 0 − Amount of financings taken as a whole $0
% in relation to basic capital 0% Money market transactions
− Number of financings 0 − Amount of financings taken as a whole $0* − % in relation to basic capital 0% *Investments with Banks in checking accounts
IV. Maximum amount of financing with the 3 largest debtors and Common Risk groups $0* *99.78% of this amount corresponds to checking account investments with Banks
Market Risk
⋅ Value at Risk The exposure to market risk is determined through the calculation of the Value at Risk (“VaR”). The meaning of the VaR under this method is the potential loss which could be generated in the valuation of the portfolios at a given date. This methodology is used both for the calculation of market risk and for the establishment and control of internal limits. In order to calculate the Value at Risk (VaR), the Institution applies the nonparametric historical simulation method, considering for such purpose a 99% confidence level, using the 500 immediate historical scenarios, multiplying the result by a security factor that fluctuates between 3 and 4 depending on the annual Back Testing results calculated up to the previous quarter, also considering 10 days to break up the risk portfolio in question. These measures make it possible to insure considering unforeseen volatilities in the main risk factors that affect such portfolios. Such methodology is applied to all financial instrument portfolios within and beyond the balance, including money market and treasury transactions, capital, foreign-exchange and derivatives held for trading and hedging purposes, which are exposed to variations in their value due to changes in the risk factors affecting their market valuation (domestic and foreign interest rates, exchange rates and indexes, among others). The average VaR for the January – March 2009 quarter for the portfolio is Ps 2,376 million.
Million Pesos 1Q08 2Q08 3Q08 4Q08 1Q09Total Var * 2,230 2,298 2,210 2,447 2,376 Net Capital ** 40,041 44,724 46,410 44,149 45,113 VaR/Net Capital 5.57% 5.14% 4.76% 5.54% 5.27% * Quarter Average of Bank and Brokerage House ** Net capital of the Banking Sector is the arithmetic sum of the net capitals of Bank and Brokerage House. Moreover, the average Value at Risk per risk factor of the portfolio of instruments described for the Bank and
Brokerage House, during the first quarter of 2009 is shown below:
Risk Factor VaR
Domestic interest rate 2,837
Foreign interest rate 271
Exchange rate 1,281
Capitals 97
Bond Prices in Foreign Currency 640Total VaR of Bank and Brokerage House 2,376
The VaR for each of the risk factors shown is determined by simulating 500 historical scenarios of the variables that make up each of such factors, maintaining constant the variables that affect the other risk factors mentioned above. Similarly, the consolidated Value at Risk for the Bank and Brokerage House considers the correlations of all the risk factors that affect portfolio valuation. That is why the arithmetic sum of the Value at Risk per Risk Factor does not match.

According to the new criteria, effective as of January 2008, inflationary accounting no longer applies for re-expressing financial statements. Nonetheless, the figures for 2007 and previous years will continue to be expressed in pesos of December 2007.
First Quarter 2009.
61
III. 5 NOTES TO FINANCIAL STATEMENTS
⋅ Backtesting Analysis In order to validate the daily VaR calculation measurement effectiveness, as a measure of market risk, the Backtesting analysis is updated weekly. This analysis makes it possible to compare the results estimated by VaR with the actual results.
⋅ Sensitivity Analysis and Extreme Conditions Test To enrich the analysis and to obtain the desired impact that movements on risk factors may have on positions, sensitivity analizes and tests under extreme conditions are periodically implemented. These analizes prevent the Institution from negative situations that could arise in which extraordinary losses result from the valuation of financial instruments in position.
Liquidity Risk and Balance
In response to the Banking Sector’s need to measure Liquidity Risk and to have consistent follow-up, the Banks us financial ratios, such as the Liquidity Ratios (Liquid Assets / Liquid Liabilities). Liquid Assets include availabilities, securities to negotiate and securities available for sale. Liquid Liabilities include demand deposits, demand interbanking loans and short-term interbanking loans. For liquidity risk quantification and follow-up, the Banking Sector uses for the dollar portfolios, the criteria that the Bank of Mexico established for developing the Liquidity Coefficient, which makes it possible to evaluate the differentials between asset and liability flows in different periods of time. This promotes a healthier distribution of terms for these assets. Moreover, to prevent the risk of concentrating terms and re-appreciation date for each of the Banks in the Banking Sector, a Gap Analysis is made to face the resources with sources of funding, detecting any concentration in advance. These analyses are made separately per currency (domestic, foreign, and udis). The structural risk of the Balance is evaluated using the analysis of balance simulation, among others, which allows the evaluation of future static or dynamic behavior in the Balance Sheet. It analyzes sensitivity to movements in domestic, foreign and real rates obtaining the impact that they have on the Economic Value and on the Net Interest Income. Likewise, tests are conducted under extreme conditions wherein the result of extreme changes is evaluated on rates, funding and exchange rates. Projections are periodically compared with real data as a measure of evaluation of the effectiveness of the simulation model. These tests make it possible to evaluate the suppositions and methodology used, and if necessary, adjust them. With the objective of strengthening follow-up of risk, early detection alarms have been determined, which allow the anticipation of problems and if necessary, put contingency plans into action.
Operational Risk As of January 2003, GFNorte established a formal operational risk department called the "Operational Risk Management Department" (ARO) within the General Directorship of Risk Management. Our institution defines Operational Risk as the potential loss due to failures or deficiencies in the internal controls, errors in operation processing and storing or in data transmitting, as well as to adverse administrative and judicial rulings, fraud or theft (this definition includes Technological and Legal risk). The objectives of the Operational Risk Management are: a) To allow and support the organization to reach its institutional objectives through the prevention and management of operational risks; b) To insure that the existing operational risks and the required controls are duly identified, assessed and in line with the risk strategy established by the organization; and c) To insure that the operational risks are duly quantified in order to make the proper capital allocation per operational risk. Pillars of Operational Risk Management I. Policies, Objectives and Guidelines As part of the institutional regulations, there are documented policies, objectives, guidelines, methodologies and responsible areas in Operating Risk management. The Operating Risk Directorship maintains close communication and coordination with the Regulatory Comptrollership in order to facilitate effective Internal Control in which the proper procedures and controls are established that will mitigate Operating Risk in the processes, and provide follow up through the Internal Audit Department.
According to the new criteria, effective as of January 2008, inflationary accounting no longer applies for re-expressing financial statements. Nonetheless, the figures for 2007 and previous years will continue to be expressed in pesos of December 2007.
First Quarter 2009.
62
III. 5 NOTES TO FINANCIAL STATEMENTS
The Regulatory Comptrollership, as part of the Internal Control System, carries out the following activities to mitigate risk: a) Internal control validations; b) Institutional regulations management and control; c) Monitoring of operating processes’ internal control by means of control indicators reports, that are reported by the process comptrollers in the various areas; d) Money Laundering Prevention process management; e) Control and follow up of the regulatory provisions; f) Analysis and assessment of the operating processes and projects with the participation of the responsible directors of each process in order to insure adequate internal control. II. Quantitative and Qualitative Measuring Tools Operating Losses Database To record operating loss events, a system has been developed internally known as the "Operating Loss and Events Capture System" (SCERO). This system enables the central information supplier areas to directly record such events online, which are classified by Type of Event in accordance with the following categories:
This historical Database provides the statistics of the operating events in which the institution has incurred so as to be able to determine their trends, frequencies, impact and distribution. Moreover, the Database will make it possible in the future to have enough information to calculate the capital requirements per Advances Models.
⋅ Legal and Fiscal Contingencies Database
For the recording and follow-up of legal, administrative and tax issues that may arise from adverse unappealable ruling, an internal system called “Legal Risk Issues Monitoring System” (SMARL) was developed. This system enables the central data supplying areas to record such events directly and on-line, which are then classified by company, sector and legal issue, among others.
As part of GFNorte’s legal risk management, legal and fiscal contingencies are estimated by the attorneys that process the issues based on an internal methodology. This makes it possible to create the necessary book reserve to face such estimated contingencies.
⋅ Risk Management Model GFNorte has defined objectives, which are achieved through different plans, programs and projects. Compliance with such objectives may be adversely affected due to operating risks, for which reason a methodology must be in place to manage them within the organization. Consequently, operating risk management is now an institutional policy defined and supported by senior management. To perform Operating Risk Management, each of the operating risks involved in the processes must be identified in order to analyze them. In this regard, the risks identified by the Regulatory Comptrollership are recorded in a risk matrix and processed in order to eliminate or mitigate them (seeking to reduce their severity or frequency) by defining tolerance levels, as the case may be. At present, work is being done on developing a new Institution Operating Risk Management Model and the technological tools needed to implement it.
Types of Events Description Internal Fraud Losses derived from a type of action intended to defraud, unlawfully take goods or sidestep
regulations, laws or company policies (excluding diversity/discrimination events) in which at least one company party is involved.
External Fraud Losses derived from a type of action intended to defraud, unlawfully take goods or sidestep the laws, caused by a third party.
Labor Relations and Safety in the Workplace
Losses caused by acts that are incompatible with the legislation or labor agreements regarding hygiene or safety, the payment of personal damage claims, or cases associated with diversity/discrimination.
Customers, Products & Business Practices
Losses caused by involuntary noncompliance or negligence of a professional obligation to specific customers (including fiduciary and adjustment requirements), or due to the nature or design of a product.
Natural Disasters and Other Events
Losses caused by damage or harm to material assets as a consequence of natural disasters or other events.
Incidences in the Business and Systems Failures
Losses caused by incidences in the business and systems failures
Process Execution, Delivery and Management
Losses caused by errors in operations processing or management, as well as the relations with commercial counterparties and providers.
According to the new criteria, effective as of January 2008, inflationary accounting no longer applies for re-expressing financial statements. Nonetheless, the figures for 2007 and previous years will continue to be expressed in pesos of December 2007.
First Quarter 2009.
63
III. 5 NOTES TO FINANCIAL STATEMENTS
III. Required Capital Calculation As of November 2007, the Official Gazette of the Federation published the Capitalization Rules for Operation Risk, establishing the use of a Basic Model, which is periodically calculated and reported to the authority.
IV. Information and Reporting The information generated by the Database and the Management Model is processes periodically to report to the Risk Policies Committee and the Board of Directors regarding the main operating events that were detected, the trends, identified risks (risk matrix) and their mitigating strategies. Reporting is also done on the status of the main Operating Risk mitigation initiatives implemented by the various areas of the organization.
Technology risk
Technological Risk is defined in our institution as all potential losses from damage, interruption, alteration or failures derived from the use of or dependence on hardware, software, systems, applications, networks and any other information distribution channel in the rendering of banking services to the customers.. This risk forms an inherent part of Operating Risk, which is why its management is handled collectively throughout the entire organization. To address the Operating Risk associated with information integrity, and “Integrity Committee” has been created. Its objectives are to align security and information control efforts under a prevention focus, to define new strategies, policies, processes or procedures and to provide solutions to information security issues that affect or may affect the Institutional patrimony. The functions established by the CNBV or Technology Risk Management are performed by the Institution under institution regulatory and Integrity Committee guidelines. To address the Operating Risk caused by high impact external events, GFNorte has a Business Continuity Plan (BCP) and Disaster Recovery Plan (DRP) based on a same-time data replication system at an alternate computer site. All the above cover the back up and recovery of the Institution’s critical applications in the event or any relevant operating contingency.
Legal risk
Legal Risk is defined as the potential loss from failure to comply with the applicable legal and administrative provisions, the issuance of indisputable unfavorable court rulings and the application of penalties regarding the operations that the institution performs. The Legal Risk must be measured as an inherent part of Operating Risk in order to understand and estimate its impact. Therefore, those legal issues which result in actual operating losses of the SMARL system are later recorded in the SCERO in accordance with a predetermined classification. Based on the statistics of the current legal issues and real loss events, the Institution can identify specific legal or operating risks, which are analyzed in order to eliminate or mitigate them in an attempt to reduce or limit their future occurrence or impact.

According to the new criteria, effective as of January 2008, inflationary accounting no longer applies for re-expressing financial statements. Nonetheless, the figures for 2007 and previous years will continue to be expressed in pesos of December 2007.
First Quarter 2009.
64
III. 5 NOTES TO FINANCIAL STATEMENTS
• Internal Control The companies that make up GFNorte has an Internal Control System (SCI) that has been structured according to the guidelines set forth by its Board of Directors and that addresses the requirements indicated by the regulating authorities. The SCI's mission is to help in the operation of an adequate internal control in the operation and in data generating and recording. It is made up of various elements:
A. Board of Directors with the support of the Risk Policies Committee and the Audit and Corporate
Practices Committee (CAPS).
B. CEO and the direct reports, such as the Risk Management Unit (UAIR), Legal and Controlling
Departments who are responsible for enforcing the proper control and risk levels in the Group's
operations.
C. Internal Audit, External Audit and Commissary (The Commissary applies only to GFNorte subsidiaries)
as additional support structures to check how the Internal Control System functions and provide
reasonable assurance regarding the reliability of the generated data.
D. The Executive Group as those mainly responsible for SCI assurance according to the functions and
responsibilities assigned to them. In addition to promoting the enforcement of the regulations established
for the Institution and the strategies set forth by the CEO GFNorte.
E. Documents that establish the general control criteria that should be followed in the operation and
reporting of transactions; in optimizing human, material and technological resources; in the use, security,
timeliness and reliability of the information; and in the due compliance with the external and internal
regulations. Code of Conduct that regulates the behavior that each advisor, officer or employee of the
Group should assume while performing their activities.
F. Policy and procedure manuals that regulate documentation, recording and liquidation operations that the
Institution carries out and establish the control points that should be observed, assuring the separation of
functions, clear assigning of responsibilities, safekeeping of information and prevention of unlawful acts.
During 1Q09, SCI continued to work properly developing activities associated with strengthening risk control, assessment and management, establishing and monitoring controls, and insuring information quality.
A. The various Corporate Governance Committees have had the required financial, economic, accounting
and/or legal information for proper decision-making.
B. The policy and procedure manuals have been updated as per the changes in external regulations, new
products, and changes in the Institution's processes or improvements to internal controls. Additionally,
there has been continuous follow-up of the improvement actions regarding the observations made by the
different members of the SCI.
The Supervisory Authorities’ requirements have been addressed and the information required by the external
regulations has been submitted.
• Treasury Policy GFNorte’s Banking Sector Treasury is the central unit in charge of balancing its resource needs, monitoring and managing the regulatory levels, eliminating the rate risk of fixed-rate placement operations by using coverage and implementing arbitrage strategies. The cash currencies and investment in securities are in Mexican pesos and U.S. dollars.

According to the new criteria, effective as of January 2008, inflationary accounting no longer applies for re-expressing financial statements. Nonetheless, the figures for 2007 and previous years will continue to be expressed in pesos of December 2007.
First Quarter 2009.
65
III. 5 NOTES TO FINANCIAL STATEMENTS
• Internal and External Liquidity Sources The internal liquidity sources, in local as well as foreign currency, come from the various deposit products that the institution offers its customers, that is checking accounts and term deposits. Another source is the sales of the institution’s assets. External liquidity sources include various mechanisms to access the debt and capital markets. For instance, issuing credit titles, loans from other institution including the Central Bank and international agencies, as well as issuing subordinate debts. This concept also considers the liquidity that the bank obtains by reporting the securities the institution has that are feasible for this type of operation. Another alternative for getting resources is by issuing capital shares. • Dividend Policy During the April 30, 2003 session, the Board of Directors approved a dividend payment policy in which it will propose to the General Ordinary Stockholders’ Meeting a dividend payment consisting of at least 15% of the Partnership’s net recurring profit, providing that there is no legal impediment and that market conditions and the Partnership’s financial situation allow it. • Related Parties Loans At GFNorte, the amount of the loans performed with related individuals and companies, does not exceed the established limit of 50% of the Tier 1 capital. As of March 31, 2009 and December 31, 2008, the loans granted to related parties totaled Ps $8,990 million and Ps $8,216 million, respectively. • People in Charge The undersigned represent under oath that, within the scope of our respective functions, we have drawn up the information relative to Grupo Financiero Banorte contained in this report, which, to the best of our knowledge, reasonably reflects its situation. Dr. Alejandro Valenzuela del Río Chief Executive Officer of Grupo Financiero Banorte, S. A. B. de C. V. Ing. Sergio García Robles Gil Chief Financial Officer C.P. Román Martínez Méndez Managing Director Audit Lic. Jorge Eduardo Vega Camargo Executive Director Comptrollership C.P. Nora Elia Cantú Suárez Executive Director Accounting

According to the new criteria, effective as of January 2008, inflationary accounting no longer applies for re-expressing financial statements. Nonetheless, the figures for 2007 and previous years will continue to be expressed in pesos of December 2007.
First Quarter 2009.
66
• Basis for submitting Financial Statements
Grupo Financiero Banorte (GFNorte) issues consolidated financial statements with its Subsidiaries in accordance with the General Provisions Applicable to Financial Information of the Regulating Agencies of Financial Groups Subject to Supervision by the National Banking and Securities Commission (CNByV) published in the Official Gazette of the Federation on April 27, 2005 and modified on August 11, 2006, August 14, 2006, December 19,2006 and January 8,2007. As a result of the norm NIF B10 “Inflation Effects” taking effect and according to INIF 9 “Presentation of comparable financial statements as a consequence of NIF B-10 taking effect”, which mentions that the economic enviornment is non inflationary when accumulated inflation for the last three years is lees than 26%. Under this context, it is not necessary to re-express financial statements as of January 2008 and for comparison pruposes, figures for 2007 and previous years are expressed in December 2007 pesos. In order to comply with the new general provisions applicable to the financial information of holding companies, since 2Q05, the Quarterly Report provides consolidated information for the financial group.
Banking Sector (Banorte) Issues consolidated financial statements with trust funds in udis and its subsidiaries in conformity with the General Provisions for Financial Information of Credit Institutions in effect as published on December 2, 2006 and modified on March 3, 2006, March 28, 2006, September 15, 2006, December 6,2006, December 8, 2006 and January 12, 2007 . As a result of the norm NIF B10 “Inflation Effects” taking effect and according to INIF 9 “Presentation of comparable financial statements as a consequence of NIF B-10 taking effect”, which mentions that the economic enviornment is non inflationary when accumulated inflation for the last three years is lees than 26%. Under this context, it is not necessary to re-express financial statements as of January 2008 and for comparison pruposes, figures for 2007 and previous years are expressed in December 2007 pesos.
Grupo Financiero Banorte (GFNorte) and Banking Sector (Banorte) The financial information contained in this document has been developed according to the regulations issued by the CNByV for the regulating agency and the financial entities that make up the Financial Group and to Norms of Financial Information (Normas de Información Financiera NIF), emitted by the Mexican Council for the Investigation and Development of Norms of Financial Information, A.C. (CINIF). The regulations of the CNByV and the NIF mentioned above differ given the specialized operations of the Credit Institutions. Moreover, there is a difference in the generally accepted accounting principles of the United States (US GAAP) and the regulations and principles established by the American authorities for this type of financial entities. In order to present the information contained herein in an international format, the classification format and the presentation of certain financial information differ from the format used for the financial information published in Mexico. The information contained in this document is based on the non-audited financial information of each of the entities to which it refers.
III. 5 NOTES TO FINANCIAL STATEMENTS


![Welcome [] Tax...• Deduction for net interest expense limited to: Trade or business interest income plus 30% of adjusted taxable income plus Floor plan financing interest • For](https://static.fdocuments.us/doc/165x107/5e2ade910f5b4744531a6029/welcome-tax-a-deduction-for-net-interest-expense-limited-to-trade-or-business.jpg)


![GPT Interim Result presentation [website] · Net interest expense (50.1) (59.0) Corporate overheads (13.8) (16.4) Tax expense (5.9) (5.7) Non-core income 5.0 6.1 Funds From Operations](https://static.fdocuments.us/doc/165x107/5f7cf15a9105576a5e550678/gpt-interim-result-presentation-website-net-interest-expense-501-590-corporate.jpg)


