Penang Population Q2 - June 2006
31
-
Upload
alexcus1539 -
Category
Documents
-
view
226 -
download
5
description
statistic penang
Transcript of Penang Population Q2 - June 2006

PPPeeennnaaannnggg SSStttaaatttiiissstttiiicccsss QQQuuuaaarrrttteeerrr 222,,, 222000000666
Submitted to the Penang State Government
by
Socio-Economic & Environmental Research Institute
10 Brown Road, 10350 Penang
Tel: (04) 228 3306 Fax: 226 7042
E-mail: [email protected]
Website: http://www.seri.com.my
PENANG STATISTICS (Quarter 2, 2006)
Socio-economic & Environmental Research Institute (SERI) 1
CONTENTS PHYSICAL ATTRIBUTES
Area, Location & Climate 3
DEMOGRAPHY
Penang: Estimated Population (in ‘000) and Distribution by Districts 3
Penang: Estimated Population by Sex (in ‘000) 3
Penang: Estimated Population by Ethnic Group (in ‘000) 4
ECONOMIC
Penang: Gross Domestic Product (in 1987 – Constant Prices) 5
Penang: Sectoral Share of Gross Regional Product (%) 5
Penang: Gross Regional Product by Economic Sectors for Quarter 1 2005 & Quarter 1 2006 5
Penang: Gross Domestic Product Per Capita (In Real Prices) and Ratio of State to National Per
Capita GDP
6
EMPLOYMENT
Penang: Percentage of Employed Persons by Industry (%), 2001 – 2004 6
Penang: Percentage Distribution of Employed Persons by Economic Sectors and Gender, 2002
- 2003
7
Penang: Labour Force Participation Rate by Gender and Ethnic Group (%), 2002 - 2005 7
PRIMARY SECTOR
AGRICULTURE
Penang: Agriculture Areas (In Hectares), 1998 - 2003 8
LIVESTOCK
Penang: Livestock Survey, 2002 - 2004 8
Penang: Production and Value of Livestock, 2003 - 2004 9
FISHERIES Penang: Landings of Marine Fish, 1995 - 2005 9
Penang: Aquaculture Production and Value, 1995 - 2005 10
SECONDARY SECTOR
MANUFACTURING Penang: Approved Manufacturing Projects, Employment & Capital Investment, 1990 - 2006 10
Penang: Approved Manufacturing Projects By Industry, 2004 - 2006 11
Approved Manufacturing Projects And Investment By State, 2002 - 2006 11
TERTIARY SECTOR
UTILITIES
WATER
Penang: Water Output And Consumption (‘000) cubic metres), 1991 - 2006 12
Penang: Daily Water Supply, 2005 - 2006 13
ELECTRICITY Penang: Electricity Supplied and Consumed 13
Penang: Power Demand & Supply, 2000 - 2010 13
TELECOMMUNICATIONS Direct Exchange Line (DEL) Penetration Rate by State, 2003 - 2005 14
Internet Dial-Up Penetration Rate by State, 2003 - 2005 15
Percentage Share of Hand Phone Subscriber Base, 2005 16
TRANSPORT
ROAD TRANSPORT New Motor Vehicle Registration, 2005 17
Motor Vehicle Re-registration, 2005 17

PENANG STATISTICS (Quarter 2, 2006)
Socio-economic & Environmental Research Institute (SERI) 2
TRADE
TRADE BALANCE
Export, Import & Balance of Trade, 2005 - 2006 (RM million) 18
AIRPORT
Aircraft Movement per annum, 1991 - 2006 19
Number of Passengers (Domestic & International) per annum, 1991 - 2006 19
Cargo Handled (Domestic & International) per annum, 1991 - 2006 20
PORT
Annual Number of Shipcalls, 1990 – 2006 21
Gross Registered Tonnage (Domestic & Foreign), 1990 – 2006 21
Type of Cargo Handled, 1990 – 2006 22
TOURISM
Penang: Average Occupancy Rate, Number of Registered Guests and Estimated Total 23
Visitor Arrivals, 2000 – 2004
PROPERTY Penang: House Price Index, 1988 - 2003 23
Penang: Number of Property Transactions by Sector, 2004 & 2005 24
Penang: Value of Property Transactions by Sector, 2004 & 2005 (RM Million) 24
EDUCATION
Penang: Number of Schools, Students & Teachers At The Primary Level, Jan 2005 25
Penang: Number of Schools, Students & Teachers At The Secondary Level, Jan 2005 25
Penang: Number of Students Taking Public Exams and Passing Rates, 2004 - 2005 25
Penang: Number of Private Education Institutions (as of 31 December 2004) 25
HEALTH
Life Expectancy at Birth (Malaysia) 26
Life Expectancy at Birth (Penang) 26
Vital Statistics of Penang (per thousand), 1995 - 2005 26
Penang: Ratio of Medical Professionals-Population, 1996 – 2005 26
Penang: Health Facilities, 1999 – 2005 26
Penang: Number Of Hospital Beds (Government & Private) and Ratio of Hospital Beds to 27
Population, 2005
Penang: Number of Beds, Bed Occupancy Rate (BOR) & Average Length of Stay (ALOS) 27
for Government Hospitals, 2005
Penang: HIV / AIDS (Total Identified Cases), 1999 – 2005 27
Penang: 10 Main Causes of Hospital Deaths (Government), 2005 27
SELECTED NATIONAL STATISTICS
Malaysia: Gross Domestic Product by Sector (Current Prices & 1987 Prices) 28
Malaysia: Currency Exchange Rates 28
Malaysia: National Indices & Employment Data 29
Malaysia: Federal Government Accounts 29
Malaysia: Producer Price Index 29
Malaysia: Consumer Price Index 30
Malaysia: Index of Industrial Production 30
Disclaimer : All data are correct at the time of publication and are subject to adjustments and revision by
the respective sources. The Socio-economic & Environmental Research Institute (SERI) will not
be responsible for any loss or damage caused by the usage of any information obtained from
this publication.

PENANG STATISTICS (Quarter 2, 2006)
Socio-economic & Environmental Research Institute (SERI) 3
PPPHHHYYYSSSIIICCCAAALLL AAATTTTTTRRRIIIBBBUUUTTTEEESSS
Area:
State of Penang 1,030 sq km
Timur Laut 119 sq km
Barat Daya 173 sq km
Seberang Perai Utara 262 sq km
Seberang Perai Tengah 235 sq km
Seberang Perai Selatan 241 sq km
Location:
Latitudes 5°8’ - 5°35’
Longitudes 100°8’ - 100°32’
DDDEEEMMMOOOGGGRRRAAAPPPHHHYYY
Penang: Estimated Population (in ‘000) and Distribution by Districts District 1991 2000 2004 2005 2006
(census) (census) (estimate) (estimate) (estimate)
Timur Laut 395.7 444.9 476.2 483.0 486.6
Barat Daya 122.8 169.4 191.3 195.5 201.5
Seberang Perai Utara 224.6 259.8 283.4 288.0 292.8
Seberang Perai Tengah 236.3 313.6 348.8 356.0 362.4
Seberang Perai Selatan 84.8 125.7 143.1 146.3 149.1
State of Penang 1,064.2 1,313.4 1,442.8 1,468.8 1,492.4 Source: State Population Report, Penang, 1991, Department of Statistics (DOS), Malaysia; Population and Housing
Census of Malaysia 2000: Population Distribution and Basic Demographic Characteristics, DOS, Malaysia;
DOS, Penang.
Note: Slight discrepancies may occur due to rounding.
Penang: Estimated Population by Sex (in ‘000) Gender 1991 2000 2004 2005 2006
(census) (census) (estimate) (estimate) (estimate)
Male 526.0 654.1 715.2 727.3 738.2
Female 538.1 659.4 727.6 741.5 754.2
Total 1,064.2 1,313.4 1,442.8 1,468.8 1,492.4 Source: State Population Report, Penang, 1991, DOS, Malaysia; Population and Housing Census of Malaysia 2000:
Population Distribution and Basic Demographic Characteristics, DOS, Malaysia; DOS, Malaysia; DOS,
Penang.
Note: Slight discrepancies may occur due to rounding.

PENANG STATISTICS (Quarter 2, 2006)
Socio-economic & Environmental Research Institute (SERI) 4
Penang: Estimated Population by Ethnic Group (in ‘000) Ethnic Group 1991 2000 2004 2005 2006
(census) (census) (estimate) (estimate) (estimate)
Malaysian: 1,048.3 1,265.1 1,370.1 1390.6 1,407.4
Malays 405.4 533.1 587.3 600.3 612.3
Other Bumiputera 1.1 3.9 5.0 5.3 5.6
Chinese 523.2 588.7 626.4 631.8 635.3
Indians 112.8 133.9 145.4 147.1 148.0
Others 5.8 5.4 6.0 6.1 6.2
Non-Malaysian Citizens 15.9 48.4 72.7 78.2 85.0
Total 1,064.2 1,313.4 1,442.8 1,468.8 1,492.4 Source: State Population Report, Penang, 1991, DOS, Malaysia; Population and Housing Census of Malaysia 2000:
Population Distribution and Basic Demographic Characteristics, DOS, Malaysia; DOS, Penang.
Note: Slight discrepancies may occur due to rounding.
Source: Department Of Statistics, Penang
Population By Ethnic Group, 2006
41.40%
42.57%
9.92%
0.42%
5.70%
Bumiputera Chinese Indian Others Non-Malaysian
PENANG STATISTICS (Quarter 2, 2006)
Socio-economic & Environmental Research Institute (SERI) 5
EEECCCOOONNNOOOMMMIIICCC
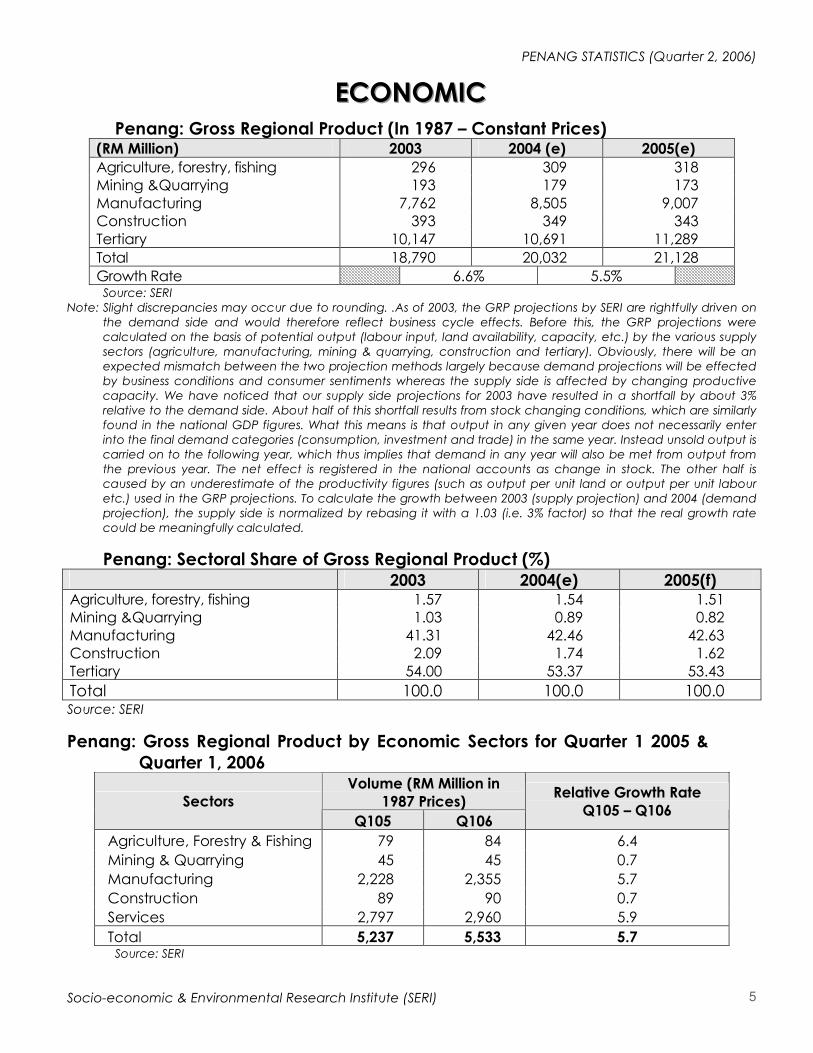
Penang: Gross Regional Product (In 1987 – Constant Prices) (RM Million) 2003 2004 (e) 2005(e)
Agriculture, forestry, fishing 296 309 318
Mining &Quarrying 193 179 173
Manufacturing 7,762 8,505 9,007
Construction 393 349 343
Tertiary 10,147 10,691 11,289
Total 18,790 20,032 21,128
Growth Rate 6.6% 5.5% Source: SERI
Note: Slight discrepancies may occur due to rounding. .As of 2003, the GRP projections by SERI are rightfully driven on
the demand side and would therefore reflect business cycle effects. Before this, the GRP projections were
calculated on the basis of potential output (labour input, land availability, capacity, etc.) by the various supply
sectors (agriculture, manufacturing, mining & quarrying, construction and tertiary). Obviously, there will be an
expected mismatch between the two projection methods largely because demand projections will be effected
by business conditions and consumer sentiments whereas the supply side is affected by changing productive
capacity. We have noticed that our supply side projections for 2003 have resulted in a shortfall by about 3%
relative to the demand side. About half of this shortfall results from stock changing conditions, which are similarly
found in the national GDP figures. What this means is that output in any given year does not necessarily enter
into the final demand categories (consumption, investment and trade) in the same year. Instead unsold output is
carried on to the following year, which thus implies that demand in any year will also be met from output from
the previous year. The net effect is registered in the national accounts as change in stock. The other half is
caused by an underestimate of the productivity figures (such as output per unit land or output per unit labour
etc.) used in the GRP projections. To calculate the growth between 2003 (supply projection) and 2004 (demand
projection), the supply side is normalized by rebasing it with a 1.03 (i.e. 3% factor) so that the real growth rate
could be meaningfully calculated.
Penang: Sectoral Share of Gross Regional Product (%) 2003 2004(e) 2005(f)
Agriculture, forestry, fishing 1.57 1.54 1.51
Mining &Quarrying 1.03 0.89 0.82
Manufacturing 41.31 42.46 42.63
Construction 2.09 1.74 1.62
Tertiary 54.00 53.37 53.43
Total 100.0 100.0 100.0 Source: SERI
Penang: Gross Regional Product by Economic Sectors for Quarter 1 2005 &
Quarter 1, 2006 Volume (RM Million in
1987 Prices) Sectors
Q105 Q106
Relative Growth Rate
Q105 – Q106
Agriculture, Forestry & Fishing 79 84 6.4
Mining & Quarrying 45 45 0.7
Manufacturing 2,228 2,355 5.7
Construction 89 90 0.7
Services 2,797 2,960 5.9
Total 5,237 5,533 5.7 Source: SERI

PENANG STATISTICS (Quarter 2, 2006)
Socio-economic & Environmental Research Institute (SERI) 6
Penang: Gross Regional Product Per Capita (In Real Prices) and Ratio of State to
National Per Capita GDP 2000 2001 2002 2003 2004 2005
GRP per capita(RM) 13,101.72 12,309.64 12,588.48 13,261.67 13,884.11 14,384.57
Ratio of State to
national per capita
GDP
1.46 1.40 1.40 1.43 1.43 1.47
Source: SERI
* Please note that GRP per capita for Penang and its ratio to the national per capita GDP were previously
quoted in current prices
EEEMMMPPPLLLOOOYYYMMMEEENNNTTT
Penang: Percentage of Employed Persons by Industry (%), 2001 - 2004 Industry 2001 2002 2003 2004
Agriculture , hunting and forestry 1.5 1.8 1.2 2.4
Fishing 0.7 0.6 0.8 1.5
Mining and quarrying 0.2 0.0 0.1 0.1
Manufacturing 40.8 40.4 37.1 37.7
Electricity, gas and water supply 0.5 0.4 0.5 0.4
Construction 6.4 7.0 6.6 7.1
Wholesale and retail trade; repair of motor
vehicles, motorcycles and personal and
household goods
15.6 16.0 16.4 15.0
Hotels and restaurants 7.4 6.8 8.6 8.2
Transport, storage and communication 4.7 5.3 5.3 5.5
Financial intermediation 2.3 2.6 2.3 2.2
Real estate, renting and business activities 4.4 4.3 4.5 4.2
Public administration and defense; compulsory
social security
4.2 3.9 4.2 3.5
Education 4.2 4.2 4.7 5.0
Health and social work 2.8 2.6 2.6 1.9
Other community, social and personal service 2.0 1.9 2.1 2.2
Private households with employed persons 2.4 2.3 2.9 3.1
Extra-territoral organisations and bodies 0.0 0.0 0.0 0.0
Total 100.0 100.0 100.0 100.0 Source: Labour Force Survey, DOS, Malaysia
Note: Slight discrepancies may occur due to rounding.

PENANG STATISTICS (Quarter 2, 2006)
Socio-economic & Environmental Research Institute (SERI) 7
Penang: Percentage Distribution of Employed Persons by Economic Sectors and
Gender, 2002 – 2003 (%) 2002 2003
Industry Male Female Male Female
Agriculture, hunting and forestry 2.7 0.5 1.8 0.4
Fishing 0.9 0.1 1.3 0.0
Mining and quarrying 0.1 0 0.1 0.1
Manufacturing 37.9 44.2 33.8 42.3
Electricity, gas and water supply 0.6 0.1 0.8 0.2
Construction 10.7 1.2 10.3 0.9
Wholesale and retail trade; repair of motor vehicles,
motorcycles and personal and household goods 17.6 13.5 18.5 13.3
Hotels and restaurants 6.5 7.2 8.8 8.3
Transport, storage and communication 7.6 1.7 7.3 2.1
Financial intermediation 1.9 3.5 1.9 2.8
Real estate, renting and business activities 4.1 4.6 4.1 5.2
Public administration and defense; compulsory social
security 4.8 2.6 5.3 2.5
Education 2.2 7.3 2.8 7.8
Health and social work 0.9 5.3 1.3 4.7
Other community, social and personal service 1.6 2.4 2.1 2.2
Private households with employed persons 0.0 5.8 0.1 7.3
Extra-territoral organizations and bodies 0 0 0 0
Total (%) 100.0 100.0 100.0 100.0
Total (‘000 persons) 389.2 253.9 407.5 266.8 Source: Labour Force Survey, DOS, Malaysia
Note: Slight discrepancies may occur due to rounding.
Penang: Labour Force Participation Rate by Gender (%), 2002 - 2005
Gender 2002 2003 2004 2005
Male 83.8 81.6 81.9 80.9
Female 53.4 52.2 50.4 49.2
Total 68.4 66.7 65.9 64.8 Source: Labour Force Survey, DOS, Malaysia
Note: Slight discrepancies may occur due to rounding.

PENANG STATISTICS (Quarter 2, 2006)
Socio-economic & Environmental Research Institute (SERI) 8
PPPRRRIIIMMMAAARRRYYY SSSEEECCCTTTOOORRR
AAAGGGRRRIIICCCUUULLLTTTUUURRREEE
Penang: Agriculture Areas (hectares), 1998-2003 Year
Type 1998 1999 2000 2001 2002 2003
Rubber 13,487 13,097 13,013 12,758 12,758 12,758
Oil Palm 15,158 13,182 13,018 12,988 12,988 12,988
Paddy 14,351 28,125 28,125 13,448 13,448 13,448
Coconut 2,479 2,481 2,364 2,339 2,309 2,313
Cocoa 143 141 104 104 75 75
Vegetables 1,778 1,711 1,566 1,718 1,545 404
Fruits 6,929 7397 7,283 6,830 6,760 6,802
Cloves 69 87 67 52 41 41
Nutmeg 86 81 82 75 70 38
Cash Crops 474 416 197 247 190 242
Others n.a. n.a. 438 87 55 89
Total 54,954 66,718 66,257 50,646 50,240 49,199 Source: Derived from data from the Jabatan Pertanian Negeri Pulau Pinang
Note: Slight discrepancies may occur due to rounding.
LLLIIIVVVEEESSSTTTOOOCCCKKK
Penang: Livestock Survey, 2002-2004 2002 2003 2004
Type of
livestock No. of
Livestock
Farmers
No. of
Livestock
No. of
Livestock
Farmers
No. of
Livestock
No. of
Livestock
Farmers
No. of
Livestock
Buffalo 33 282 34 300 24 351
Cow 893 9,888 896 10,886 837 9,468
Goat 165 3,891 142 3,763 182 4,592
Lamb 27 653 29 695 25 415
Pig 273 298,674 246 297,923 235 292,130
Chicken 368 9,601,730 454 14,177,026 357 9,496,590
Duck 42 266,335 49 456,100 31 159,000
Quail 15 80,000 2 9,600 7 67,600 Source: Livestock Survey,2002,2003 & 2004 Department of Veterinary Services, Penang

PENANG STATISTICS (Quarter 2, 2006)
Socio-economic & Environmental Research Institute (SERI) 9
Penang: Production and Value of Livestock, 2003 – 2004
Source: Livestock Survey 2003 & 2004, Department of Veterinary Services, Penang
FFFIIISSSHHHEEERRRIIIEEESSS
Penang: Landings of Marine Fish, 1995 - 2005 Quantity Value
Year ('000 tonnes) (RM million)
1995 46.18 151.24
1996 37.61 154.88
1997 37.53 158.79
1998 35.47 189.18
1999 34.79 137.84
2000 35.90 148.27
2001 35.07 139.27
2002 31.99 130.10
2003 32.21 147.48
2004 30.76 121.49
2005 20.05 90.90 Source: Department of Fisheries, Penang
2003 2004
Production Value Production Value
Commodity
(Metric Tonnes) (RM Million) %
(Metric Tonnes) (RM Million) %
Meat
Cow 989.84 11.78 2.15 848.94 10.10 2.41
Buffalo 17.20 0.20 0.04 57.69 0.69 0.16
Goat /
Lamb 29.06 0.35 0.06 21.82 0.26 0.06
Pig 19,889.59 108.40 19.78 18,176.50 99.06 23.67
Chicken 73,857.00 339.74 61.99 49,583.88 228.09 54.50
Duck 3,182.11 15.43 2.82 414.57 2.01 0.48
Quail 2.91 0.03 0.01 12.07 0.11 0.03
Rabbit 0.79 0.01 0.00 1.60 0.02 0.00
Eggs (No. of eggs) (No. of eggs)
Chicken 350,330,280 70.07 12.78 284,998,820 71.25 17.03
Duck 6,440,000 1.61 0.29 10,848,000 4.34 1.04
Quail 1,356,000 0.12 0.02 20,120,000 2.21 0.53
Milk (Liter) (Liter)
Fresh milk 455,440.00 0.34 0.06 455,440 0.34 0.08
Total 548.08 100.00 Total 418.48 100.00

PENANG STATISTICS (Quarter 2, 2006)
Socio-economic & Environmental Research Institute (SERI) 10
Penang: Aquaculture Production and Value, 1995 - 2005
Freshwater Pond
Aquaculture
Brackishwater Cage
Culture Cockle Culture
Brackishwater Pond
Culture Year
MT RM Mil MT RM Mil MT ('000) RM Mil MT RM Mil
1995 31.10 0.12 1,105.10 15.29 15.30 7.61 606.37 10.91
1996 76.30 0.25 1,090.69 13.43 16.43 8.13 835.65 13.98
1997 108.01 0.38 1,145.67 14.61 13.11 9.59 643.05 11.96
1998 106.96 0.41 1,836.16 17.7 13.17 9.14 957.12 15.08
1999 110.68 0.33 1,247.42 14.45 13.99 9.73 498.76 8.82
2000 236.49 0.67 1,313.56 19.14 13.12 9.18 407.96 7.57
2001 191.39 0.60 2,093.25 28.84 11.6 8.12 778.02 12.74
2002 270.42 0.81 2,308.53 33.04 9.05 6.33 780.19 14.82
2003 348.99 1.04 2,617.44 41.92 9.42 6.60 859.01 17.33
2004 721.82 2.01 2,089.11 36.95 8.06 7.99 1,060.39 17.71
2005 966.81 2.33 1,895.29 32.73 10.99 10.67 1,378.60 20.24 MT= Metric Tonnes
Source: Department of Fisheries, Penang
SSSEEECCCOOONNNDDDAAARRRYYY SSSEEECCCTTTOOORRR
MMMAAANNNUUUFFFAAACCCTTTUUURRRIIINNNGGG Penang: Approved Manufacturing Projects, Employment & Capital
Investment, 1990 - 2006 Approved Projects
Year Malaysia Penang
% of
national
Potential Employment Capital Investment
(RM Million)
1990 906 132 14.6 24,952 1,867.26
1991 973 125 12.8 22,455 1,525.13
1992 874 119 13.6 14,295 1,096.05
1993 686 87 12.7 10,378 516.82
1994 870 95 10.9 15,203 934.49
1995 898 89 9.9 13,779 1,606.65
1996 782 97 12.4 11,993 3,185.40
1997 759 90 11.9 9,736 1,449.10
1998 844 104 12.3 10,911 2,685.29
1999 725 95 13.1 14,928 4,777.80
2000 798 132 16.5 15,327 4,459.60
2001 928 124 13.4 14,630 3,837.30
2002 792 110 13.9 13,487 2,398.30
2003 965 137 14.2 9,890 1,923.00
2004 1,101 144 13.1 9,235 2,030.15
2005 1,026 148 14.4 21,904 4,808.18
2006
(Jan – Mar) 199 25 12.6 1,347 382.5
Source: MIDA Penang
Note: Slight discrepancies may occur due to rounding. Data is subject to adjustments and revisions by MIDA.
PENANG STATISTICS (Quarter 2, 2006)
Socio-economic & Environmental Research Institute (SERI) 11
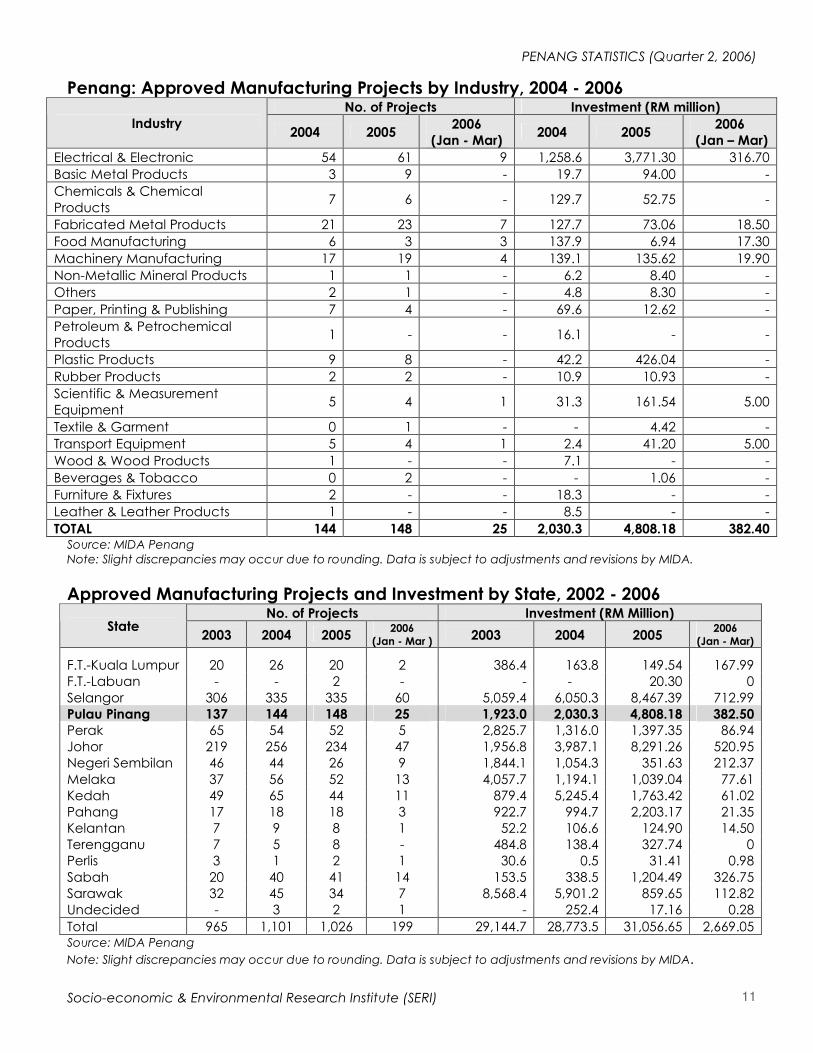
Penang: Approved Manufacturing Projects by Industry, 2004 - 2006
No. of Projects Investment (RM million)
Industry 2004 2005
2006
(Jan - Mar) 2004 2005
2006
(Jan – Mar)
Electrical & Electronic 54 61 9 1,258.6 3,771.30 316.70
Basic Metal Products 3 9 - 19.7 94.00 -
Chemicals & Chemical
Products 7 6 - 129.7 52.75 -
Fabricated Metal Products 21 23 7 127.7 73.06 18.50
Food Manufacturing 6 3 3 137.9 6.94 17.30
Machinery Manufacturing 17 19 4 139.1 135.62 19.90
Non-Metallic Mineral Products 1 1 - 6.2 8.40 -
Others 2 1 - 4.8 8.30 -
Paper, Printing & Publishing 7 4 - 69.6 12.62 -
Petroleum & Petrochemical
Products 1 - - 16.1 - -
Plastic Products 9 8 - 42.2 426.04 -
Rubber Products 2 2 - 10.9 10.93 -
Scientific & Measurement
Equipment 5 4 1 31.3 161.54 5.00
Textile & Garment 0 1 - - 4.42 -
Transport Equipment 5 4 1 2.4 41.20 5.00
Wood & Wood Products 1 - - 7.1 - -
Beverages & Tobacco 0 2 - - 1.06 -
Furniture & Fixtures 2 - - 18.3 - -
Leather & Leather Products 1 - - 8.5 - -
TOTAL 144 148 25 2,030.3 4,808.18 382.40 Source: MIDA Penang
Note: Slight discrepancies may occur due to rounding. Data is subject to adjustments and revisions by MIDA.
Approved Manufacturing Projects and Investment by State, 2002 - 2006 No. of Projects Investment (RM Million)
State 2003 2004 2005
2006
(Jan - Mar ) 2003 2004 2005 2006
(Jan - Mar)
F.T.-Kuala Lumpur 20 26 20 2 386.4 163.8 149.54 167.99
F.T.-Labuan - - 2 - - - 20.30 0
Selangor 306 335 335 60 5,059.4 6,050.3 8,467.39 712.99
Pulau Pinang 137 144 148 25 1,923.0 2,030.3 4,808.18 382.50
Perak 65 54 52 5 2,825.7 1,316.0 1,397.35 86.94
Johor 219 256 234 47 1,956.8 3,987.1 8,291.26 520.95
Negeri Sembilan 46 44 26 9 1,844.1 1,054.3 351.63 212.37
Melaka 37 56 52 13 4,057.7 1,194.1 1,039.04 77.61
Kedah 49 65 44 11 879.4 5,245.4 1,763.42 61.02
Pahang 17 18 18 3 922.7 994.7 2,203.17 21.35
Kelantan 7 9 8 1 52.2 106.6 124.90 14.50
Terengganu 7 5 8 - 484.8 138.4 327.74 0
Perlis 3 1 2 1 30.6 0.5 31.41 0.98
Sabah 20 40 41 14 153.5 338.5 1,204.49 326.75
Sarawak 32 45 34 7 8,568.4 5,901.2 859.65 112.82
Undecided - 3 2 1 - 252.4 17.16 0.28
Total 965 1,101 1,026 199 29,144.7 28,773.5 31,056.65 2,669.05 Source: MIDA Penang
Note: Slight discrepancies may occur due to rounding. Data is subject to adjustments and revisions by MIDA.

PENANG STATISTICS (Quarter 2, 2006)
Socio-economic & Environmental Research Institute (SERI) 12
TTTEEERRRTTTIIIAAARRRYYY SSSEEECCCTTTOOORRR
UUUTTTIIILLLIIITTTIIIEEESSS
WWWAAATTTEEERRR
Penang: Water Output And Consumption (‘000 cubic Metres), 1991 - 2006 Year Output % Increase Consumption % Increase
1991 177,829 - 141,866 -
1992 185,413 4.3% 147,424 3.9%
1993 188,685 1.8% 152,477 3.4%
1994 204,006 8.1% 159,598 4.7%
1995 220,550 8.1% 172,321 8.0%
1996 236,124 7.1% 184,541 7.1%
1997 242,531 2.7% 198,038 7.3%
1998 245,425 1.2% 195,668 -1.2%
1999 257,307 4.8% 195,801 0.1%
2000 271,258 5.4% 208,183 6.3%
2001 278,395 2.6% 216,380 3.9%
2002 280,161 0.6% 224,632 3.8%
2003 277,066 -1.1% 223,390 -0.6%
2004 292,858 5.7% 233,057 4.3%
2005 298,985 2.1% 240,999 3.4%
2006 (Jan - Apr) 100,855 2.4% 80,976 3.0%
Source: Derived from data provided by Perbadanan Bekalan Air Pulau Pinang Sdn Bhd (PBAPP)
Penang: Water Output & Consumption
0
50,000
100,000
150,000
200,000
250,000
300,000
350,000
1991 1992 1993 1994 1995 1996 1997 1998 1999 2000 2001 2002 2003 2004 2005
Million Cubic M
etres
Output Consumption
Source: Derived from data provided by Perbadanan Bekalan Air Pulau Pinang Sdn Bhd

PENANG STATISTICS (Quarter 2, 2006)
Socio-economic & Environmental Research Institute (SERI) 13
Penang: Daily Water Supply, 2005 – 2006 2005 2006 (As At April)
Penang
Island
Seberang
Perai
Penang
State
Penang
Island
Seberang
Perai
Penang
State
No. of Treatment Plants 5 4 9 5 4 9
Max. Capacity of Treatment
Plants (cu.m/day) 309,429 956,370 1,265,799 309,364 956,818 1,266,182
Average Daily Production
(cu.m) 96,002 723,134 819,136 84,355 756,356 840,711
Average Daily Consumption
(cu.m) 316,055 344,215 660,271 327,419 347,379 674,798
No. of Services (consumers) 212,523 218,136 430,659 216,125 220,966 437,091
Daily Consumption (cu.m)
Per Consumer 1.49 1.58 1.53 1.51 1.57 1.54
Per Industrial Consumer 5.72 4.74 5.23 5.98 4.66 5.32
Per Domestic Consumer 1.01 1.10 1.05 1.01 1.10 1.05 Source: Derived from data provided by Perbadanan Bekalan Air Pulau Pinang Sdn Bhd
EEELLLEEECCCTTTRRRIIICCCIIITTTYYY
Penang: Electricity Supplied and Consumed Transaction 2006 (Jan – Mar)
Total Supply (GWh) 2,111,440
Consumption of Electricity (Gwh)
Own Consumption by Private Installation (GWh) 1.966
Distribution by Public Installation by Types of Consumers (GWh)
Domestic 297,149
Commercial 444,601
Industrial 1,219,814
Public Lighting 9,907
Total 1,971,471
Electricity Exported 0
Losses in Transmissions and Statistical Discrepancies 138,003
Note: Excluding demand of 132kV customers supplied via direct 132kV connection
Source: Tenaga Nasional Berhad, Penang
Penang: Power Demand & Supply, 2000 - 2010 Year Maximum Demand (MW) Installed Capacity (MW) Excess Capacity %
2000 950 2,518 62%
2001 1,012 2,828 64%
2002 1,049 2,666 61%
2003 1,085 2,788 61%
2004 1,108 2,795 60%
2005 1,121 2,957 62%
2006 1,202 3,254 63%
2007 1,284 3,294 61%
2008 1,361 3,294 59%
2009 1,437 3,267 56%
2010 1,529 3,267 53%
Note: Excluding demand of 132kV customers supplied via direct 132kV connection
Source: Tenaga Nasional Berhad, Penang

PENANG STATISTICS (Quarter 2, 2006)
Socio-economic & Environmental Research Institute (SERI) 14
TTTEEELLLEEECCCOOOMMMMMMUUUNNNIIICCCAAATTTIIIOOONNNSSS
Direct Exchange Line (DEL) Penetration Rate by State, 2003 - 2005 2005
State 2003 2004 Quarter 1 Quarter 2 Quarter 3 Quarter 4
Johor 19.5 18.5 18.3 18.0 17.9 17.9
Kedah & Perlis 15.2 14.3 13.6 13.4 13.6 14.9
Kelantan 10.1 9.2 9.0 8.9 8.8 8.8
Melaka 22.2 20.4 20.3 20.1 20.1 20.1
Negeri Sembilan 19.2 18.2 18.2 18.0 18.0 17.9
Pahang 13.7 12.8 12.8 12.6 12.5 12.4
Penang 25.9 24.2 24.2 23.9 23.9 23.9
Perak 20.0 19.4 18.9 18.4 18.4 18.3
Selangor 23.6 21.9 22.2 22.0 22.0 21.9
Terengganu 13.8 12.9 12.7 12.5 12.5 12.6
Wilayah Persekutuan Kuala
Lumpur 25.9 24.6 24.2 23.9 23.7 23.6
Wilayah Persekutuan Labuan 17.7 17.0 16.9 16.9 16.5 17.0
Sabah 7.2 6.7 6.7 6.6 6.5 6.6
Sarawak 12.2 11.5 11.4 11.4 11.3 11.3
Malaysia 18.1 17.2 16.8 16.5 16.5 16.6 Note: Direct Exchange Line (DEL) connects a customer’s equipment to the Public Switched telephone Network (PSTN)
and has a dedicated port on a telephone exchange. The penetration rate refers to the total DELs to residential
as well business.
Source: Malaysian Communications and Multimedia Commission (MCMC)
Source: Malaysian Communications and Multimedia Commission (MCMC)
Direct Exchange Line (DEL) Penetration Rate by State, Quarter 4 2005
17.9
14.9
8.8
20.1
17.9
12.4
23.9
18.3
21.9
12.6
23.6
17.0
6.6
11.3
0.0
5.0
10.0
15.0
20.0
25.0
30.0
Johor
Kedah & Perlis
Kelantan
Melaka
Negeri Sembila
n
Pahang
Penang
Perak
Selangor
Terengganu
Wila
yah Persekutuan Kuala
Lumpur
Wila
yah Persekutuan Labuan
Sabah
Sarawak
Malaysia

PENANG STATISTICS (Quarter 2, 2006)
Socio-economic & Environmental Research Institute (SERI) 15
Internet Dial-Up Penetration Rate by State, 2003 - 2005 2005
State 2003 2004 Quarter 1 Quarter 2 Quarter 3 Quarter 4
Johor 9.6 9.9 10.1 10.2 10.2 10.3
Kedah 6.3 6.6 6.6 6.7 6.7 6.8
Kelantan 6.9 6.7 6.2 6.2 6.2 6.2
Melaka 11.5 11.8 11.9 12 12.1 12.2
Negeri Sembilan 10.5 10.8 10.9 11 11.1 11.1
Pahang 6.7 6.3 6.4 6.4 6.4 6.5
Penang 15.8 16.3 16.6 16.7 17.1 17.1
Perak 8.0 8.5 8.6 8.7 8.5 8.6
Perlis 8.3 9.3 9.4 9.5 9.7 9.7
Selangor 14.2 14.3 14.5 14.6 14.6 14.6
Terengganu 6.6 6.5 6.5 6.6 6.6 6.6
Wilayah Persekutuan Kuala
Lumpur 32.8 34.5 34.2 34.5 34.6 34.6
Wilayah Persekutuan Labuan 17.8 16.6 16.5 16.6 16.6 16.6
Sabah 3.6 4.2 4.2 4.3 4.3 4.3
Sarawak 6.2 6.7 6.7 6.7 6.8 6.8
Malaysia 11.4 12.7 13.2 13.7 13.8 13.9 Source: Malaysian Communications and Multimedia Commission (MCMC), PIKOM
Source: Malaysian Communications and Multimedia Commission (MCMC), PIKOM
Internet Dial-Up Penetration Rate by State, Quarter 4 2005
10.3
6.8 6.2
12.2 11.1
6.5
17.1
8.6 9.7
14.6
6.6
34.6
16.6
4.36.8
0
5
10
15
20
25
30
35
40
Johor
Kedah
Kelantan
Melaka
Negeri Sembila
n
Pahang
Penang
Perak
Perlis
Selangor
Terengganu
Wila
yah Persekutuan Kuala Lumpur
Wila
yah Persekutuan Labuan
Sabah
Sarawak
Malaysia

PENANG STATISTICS (Quarter 2, 2006)
Socio-economic & Environmental Research Institute (SERI) 16
Percentage Share of Hand Phone Subscriber Base, 2005
State Percentage Share of Hand Phone
Subscriber Base
Selangor 24.7
Johor 13.7
Wilayah Persekutuan Kuala Lumpur 9.7
Penang 7.4
Perak 7.3
Sabah 6.4
Kedah 5.9
Sarawak 5.9
Pahang 4.5
Negeri Sembilan 3.9
Kelantan 3.7
Melaka 3.0
Terengganu 2.9
Perlis 0.8
Wilayah Persekutuan Labuan 0.2
Source: MCMC (Derived from Hand Phone Users Survey 2005)
Source: MCMC (Derived from Hand Phone Users Survey 2005)
Percentage Share of Hand Phone Subscriber Base, 2005
24.7%
13.7%
9.7%7.4%
7.3%
6.4%
5.9%
4.5%
0.2%
0.8%2.9%3.0%
3.7%
3.9%
5.9%
Selangor Johor
Wilayah Persekutuan Kuala Lumpur Penang
Perak Sabah
Kedah Sarawak
Pahang Negeri Sembilan
Kelantan Melaka
Terengganu Perlis
Wilayah Persekutuan Labuan
PENANG STATISTICS (Quarter 2, 2006)
Socio-economic & Environmental Research Institute (SERI) 17
RRROOOAAADDD TTTRRRAAANNNSSSPPPOOORRRTTT
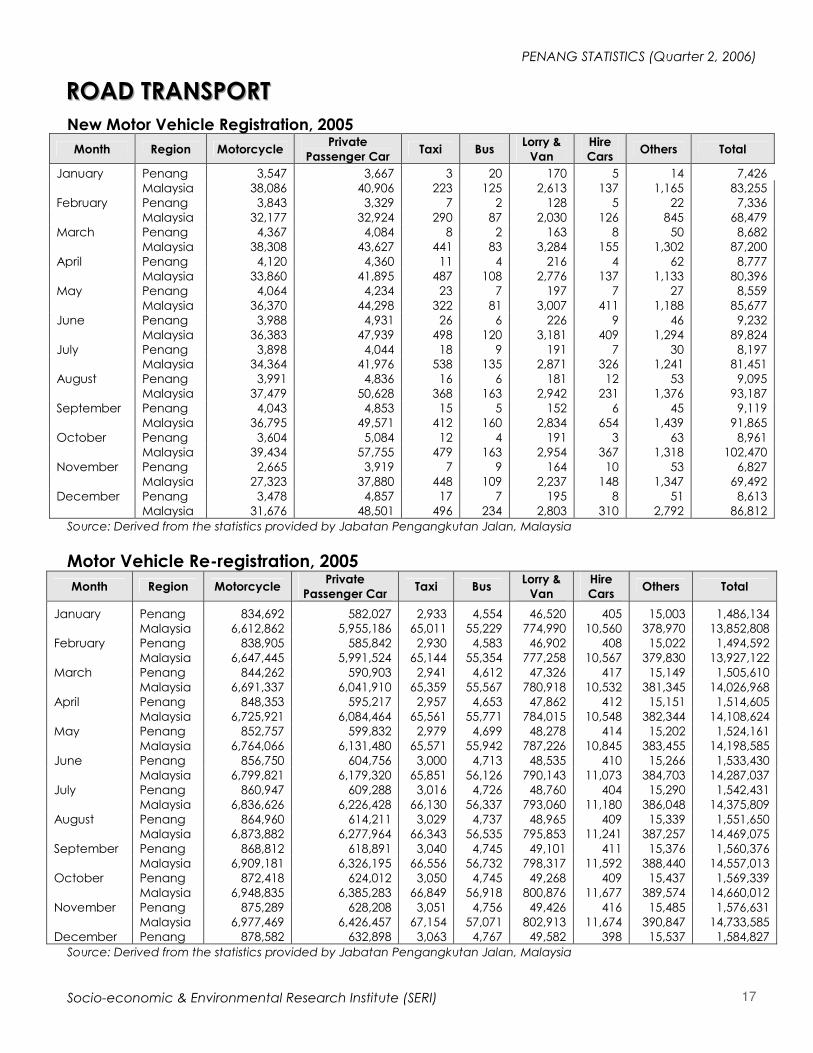
New Motor Vehicle Registration, 2005
Month Region Motorcycle Private
Passenger Car Taxi Bus
Lorry &
Van
Hire
Cars Others Total
January Penang 3,547 3,667 3 20 170 5 14 7,426
Malaysia 38,086 40,906 223 125 2,613 137 1,165 83,255
February Penang 3,843 3,329 7 2 128 5 22 7,336
Malaysia 32,177 32,924 290 87 2,030 126 845 68,479
March Penang 4,367 4,084 8 2 163 8 50 8,682
Malaysia 38,308 43,627 441 83 3,284 155 1,302 87,200
April Penang 4,120 4,360 11 4 216 4 62 8,777
Malaysia 33,860 41,895 487 108 2,776 137 1,133 80,396
May Penang 4,064 4,234 23 7 197 7 27 8,559
Malaysia 36,370 44,298 322 81 3,007 411 1,188 85,677
June Penang 3,988 4,931 26 6 226 9 46 9,232
Malaysia 36,383 47,939 498 120 3,181 409 1,294 89,824
July Penang 3,898 4,044 18 9 191 7 30 8,197
Malaysia 34,364 41,976 538 135 2,871 326 1,241 81,451
August Penang 3,991 4,836 16 6 181 12 53 9,095
Malaysia 37,479 50,628 368 163 2,942 231 1,376 93,187
September Penang 4,043 4,853 15 5 152 6 45 9,119
Malaysia 36,795 49,571 412 160 2,834 654 1,439 91,865
October Penang 3,604 5,084 12 4 191 3 63 8,961
Malaysia 39,434 57,755 479 163 2,954 367 1,318 102,470
November Penang 2,665 3,919 7 9 164 10 53 6,827
Malaysia 27,323 37,880 448 109 2,237 148 1,347 69,492
December Penang 3,478 4,857 17 7 195 8 51 8,613
Malaysia 31,676 48,501 496 234 2,803 310 2,792 86,812
Source: Derived from the statistics provided by Jabatan Pengangkutan Jalan, Malaysia
Motor Vehicle Re-registration, 2005
Month Region Motorcycle Private
Passenger Car Taxi Bus
Lorry &
Van
Hire
Cars Others Total
January Penang 834,692 582,027 2,933 4,554 46,520 405 15,003 1,486,134
Malaysia 6,612,862 5,955,186 65,011 55,229 774,990 10,560 378,970 13,852,808
February Penang 838,905 585,842 2,930 4,583 46,902 408 15,022 1,494,592
Malaysia 6,647,445 5,991,524 65,144 55,354 777,258 10,567 379,830 13,927,122
March Penang 844,262 590,903 2,941 4,612 47,326 417 15,149 1,505,610
Malaysia 6,691,337 6,041,910 65,359 55,567 780,918 10,532 381,345 14,026,968
April Penang 848,353 595,217 2,957 4,653 47,862 412 15,151 1,514,605
Malaysia 6,725,921 6,084,464 65,561 55,771 784,015 10,548 382,344 14,108,624
May Penang 852,757 599,832 2,979 4,699 48,278 414 15,202 1,524,161
Malaysia 6,764,066 6,131,480 65,571 55,942 787,226 10,845 383,455 14,198,585
June Penang 856,750 604,756 3,000 4,713 48,535 410 15,266 1,533,430
Malaysia 6,799,821 6,179,320 65,851 56,126 790,143 11,073 384,703 14,287,037
July Penang 860,947 609,288 3,016 4,726 48,760 404 15,290 1,542,431
Malaysia 6,836,626 6,226,428 66,130 56,337 793,060 11,180 386,048 14,375,809
August Penang 864,960 614,211 3,029 4,737 48,965 409 15,339 1,551,650
Malaysia 6,873,882 6,277,964 66,343 56,535 795,853 11,241 387,257 14,469,075
September Penang 868,812 618,891 3,040 4,745 49,101 411 15,376 1,560,376
Malaysia 6,909,181 6,326,195 66,556 56,732 798,317 11,592 388,440 14,557,013
October Penang 872,418 624,012 3,050 4,745 49,268 409 15,437 1,569,339
Malaysia 6,948,835 6,385,283 66,849 56,918 800,876 11,677 389,574 14,660,012
November Penang 875,289 628,208 3,051 4,756 49,426 416 15,485 1,576,631
Malaysia 6,977,469 6,426,457 67,154 57,071 802,913 11,674 390,847 14,733,585
December Penang 878,582 632,898 3,063 4,767 49,582 398 15,537 1,584,827
Source: Derived from the statistics provided by Jabatan Pengangkutan Jalan, Malaysia

PENANG STATISTICS (Quarter 2, 2006)
Socio-economic & Environmental Research Institute (SERI) 18
TTTRRRAAADDDEEE
TTTRRRAAADDDEEE BBBAAALLLAAANNNCCCEEE
Export, Import & Balance of Trade (BOT), 2005 – 2006 (RM million)
Source: Department of Statistics, Malaysia
Note: Data for 2005 is preliminary. Data is subject to adjustments and revisions by DOS.
Penang: Balance of Trade, 2004 - 2005
0.00
2,000.00
4,000.00
6,000.00
8,000.00
10,000.00
12,000.00
14,000.00
16,000.00
Jan-05
Feb-05
Mar-05
Apr-05
May-05
Jun-05
Jul-05
Aug-05
Sep-05
Oct-05
Nov-05
Dec-05
Jan-06
Feb-06
Mar-06
RM
Mill
ion
Export Import BOT
Source: Derived from data provided by Department of Statistics, Malaysia
MALAYSIA PENANG 2005
Export Import BOT Export Import BOT
Jan 39,039.40 31,430.84 7,608.55 11,171.89 8,531.97 2,639.92
Feb 36,722.37 29,556.26 7,166.11 10,038.82 7,791.17 2,247.66
Mar 46,814.28 36,578.10 10,236.17 13,174.06 9,876.81 3,297.25
Apr 43,541.85 35,089.94 8,451.91 12,909.35 9,462.37 3,446.98
May 42,662.30 35,992.80 6,669.50 12,478.31 9,929.21 2,549.09
June 44,528.86 36,791.45 7,737.41 13,745.45 10,206.36 3,539.09
Jul 43,592.81 37,635.77 5,957.04 13,480.92 10,699.66 2,781.26
Aug 46,591.13 36,841.12 9,750.01 14,186.85 10,464.68 3,722.17
Sept 47,679.76 40,060.82 7,618.94 13,586.52 10,710.96 2,875.56
Oct 49,722.99 39,203.45 10,519.54 14,416.95 10,954.49 3,462.47
Nov 43,424.36 34,791.96 8,632.40 12,778.53 9,338.35 3,440.18
Dec 49,467.72 40,037.39 9,430.33 15,000.75 10,946.75 4,053.99
TOTAL 533,787.81 434,009.91 99,777.90 156,968.40 118,912.77 38,055.62
MALAYSIA PENANG 2006
Export Import BOT Export Import BOT
Jan 43,160.77 34,344.14 8,816.62 12,232.83 9,585.38 2,647.45
Feb 42,269.38 34,884.31 7,385.07 12,012.51 9,567.31 2,445.20
Mar 51,275.35 41,695.35 9,580.00 15,010.92 11,502.72 3,508.21
TOTAL 136,705.50 110,923.80 25,781.69 39,256.26 30,655.41 8,600.86

PENANG STATISTICS (Quarter 2, 2006)
Socio-economic & Environmental Research Institute (SERI) 19
PPPEEENNNAAANNNGGG AAAIIIRRRPPPOOORRRTTT
Aircraft Movement per annum, 1991 - 2006
Year No. of Movement
1991 30,818
1992 36,826
1993 35,034
1994 35,950
1995 35,556
1996 36,956
1997 35,445
1998 31,816
1999 27,465
2000 27,951
2001 29,102
2002 28,840
2003 26,474
2004 29,182
2005 31,111
2005 (Jan – Apr) 10,286
2006 (Jan – Apr) 10,355 Source: Derived from series of Airport Statistics, Malaysia Airports Berhad
Number of Passengers (Domestic & International) per annum, 1991 – 2006
No. of Passengers (millions) Year
Domestic International Total
1991 1.27 0.90 2.17
1992 1.56 1.08 2.64
1993 1.65 1.13 2.78
1994 1.58 1.20 2.78
1995 1.60 1.25 2.85
1996 1.70 1.18 2.88
1997 1.68 1.23 2.91
1998 1.35 1.10 2.45
1999 1.35 1.10 2.45
2000 1.48 1.27 2.74
2001 1.35 1.20 2.55
2002 1.31 1.21 2.51
2003 1.43 1.00 2.43
2004 1.66 1.34 2.99
2005 1.56 1.28 2.83
2005 (Jan – Apr) 0.48 0.39 0.87
2006 (Jan – Apr) 0.53 0.45 0.98 Note: Slight discrepancies may arise due to rounding.
Source: Derived from series of Airport Statistics, Malaysia Airports Berhad
PENANG STATISTICS (Quarter 2, 2006)
Socio-economic & Environmental Research Institute (SERI) 20
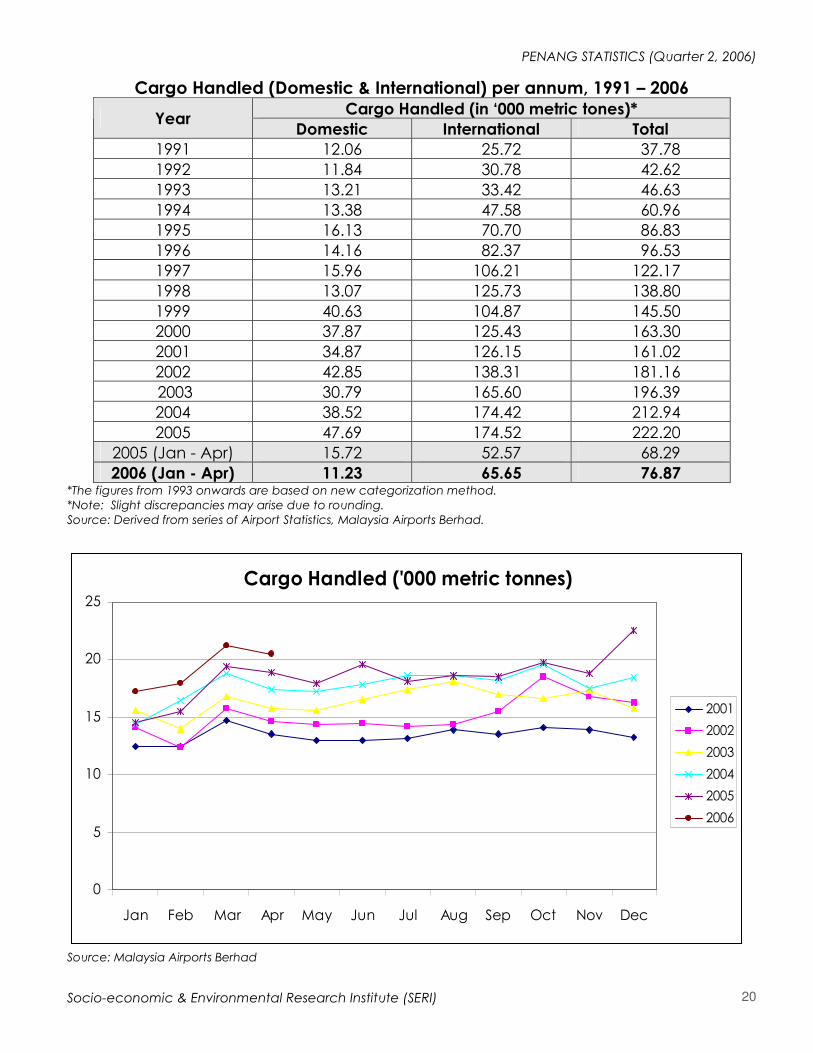
Cargo Handled (Domestic & International) per annum, 1991 – 2006 Cargo Handled (in ‘000 metric tones)*
Year Domestic International Total
1991 12.06 25.72 37.78
1992 11.84 30.78 42.62
1993 13.21 33.42 46.63
1994 13.38 47.58 60.96
1995 16.13 70.70 86.83
1996 14.16 82.37 96.53
1997 15.96 106.21 122.17
1998 13.07 125.73 138.80
1999 40.63 104.87 145.50
2000 37.87 125.43 163.30
2001 34.87 126.15 161.02
2002 42.85 138.31 181.16
2003 30.79 165.60 196.39
2004 38.52 174.42 212.94
2005 47.69 174.52 222.20
2005 (Jan - Apr) 15.72 52.57 68.29
2006 (Jan - Apr) 11.23 65.65 76.87 *The figures from 1993 onwards are based on new categorization method.
*Note: Slight discrepancies may arise due to rounding.
Source: Derived from series of Airport Statistics, Malaysia Airports Berhad.
Cargo Handled ('000 metric tonnes)
0
5
10
15
20
25
Jan Feb Mar Apr May Jun Jul Aug Sep Oct Nov Dec
2001
2002
2003
2004
2005
2006
Source: Malaysia Airports Berhad

PENANG STATISTICS (Quarter 2, 2006)
Socio-economic & Environmental Research Institute (SERI) 21
PPPEEENNNAAANNNGGG PPPOOORRRTTT
Annual Number of Shipcalls, 1990 - 2006
Year Domestic Foreign Total
1990 2,437 3,091 5,528
1991 2,750 3,051 5,801
1992 3,058 3,208 6,266
1993 1,327 4,716 6,043
1994 1,379 4,820 6,199
1995 1,443 5,022 6,465
1996 1,416 5,117 6,533
1997 1,725 5,346 7,071
1998 2,553 5,072 7,625
1999 2,635 4,736 7,371
2000 3,250 4,013 7,263
2001 3,019 4,399 7,418
2002 2,824 4,748 7,572
2003 2,220 4,199 6,419
2004 3,182 3,831 7,013
2005 2,400 3,822 6,222
2005 (Jan – Mar) 611 974 1,585
2006 (Jan - Mar) 585 1,033 1,618 Source: Derived from the statistics provided by Penang Port Sdn Bhd
Gross Registered Tonnage (Domestic & Foreign) in Million, 1990 - 2006
Year Domestic Foreign Total
1990 2.38 14.78 17.16
1991 2.41 15.05 17.46
1992 2.81 15.33 18.14
1993 1.75 18.02 19.77
1994 1.95 23.40 25.35
1995 2.06 25.26 27.32
1996 2.43 26.76 29.19
1997 2.59 28.23 30.82
1998 5.29 25.93 31.22
1999 5.18 24.35 29.53
2000 7.09 21.87 28.96
2001 6.11 23.37 29.48
2002 4.72 25.58 30.29
2003 4.14 25.80 29.94
2004 3.95 29.16 33.10
2005 3.11 32.83 35.94
2005 (Jan – Mar) 0.74 7.79 8.53
2006 (Jan – Mar) 0.74 9.70 10.44 Source: Derived from the statistics provided by Penang Port Sdn Bhd

PENANG STATISTICS (Quarter 2, 2006)
Socio-economic & Environmental Research Institute (SERI) 22
Gross Registered Tonnage (Domestic & Foreign)
0
5
10
15
20
25
30
35
1990 1991 1992 1993 1994 1995 1996 1997 1998 1999 2000 2001 2002 2003 2004 2005
million tonnes
Domestic Foreign
Source: Derived from the statistics provided by Penang Port Sdn Bhd
Type of Cargo Handled, 1990 - 2006 (million freight tonnes)
Year General
Cargo Dry Bulk Liquid
Bulk Containerised
Total Container
1990 2.21 2.06 2.73 3.85 10.85 222,441
1991 2.02 2.31 2.94 4.79 12.06 251,849
1992 1.99 2.46 3.14 5.63 13.22 303,367
1993 1.96 2.90 3.28 6.22 14.36 330,915
1994 1.93 2.60 3.31 7.29 15.14 386,182
1995 2.12 2.99 3.46 8.10 16.67 433,474
1996 2.11 3.20 3.52 8.67 17.50 454,765
1997 2.59 3.37 4.11 9.62 19.69 506,863
1998 1.67 2.23 3.86 8.69 16.45 510,307
1999 1.85 2.77 3.99 10.15 18.76 566,409
2000 1.84 3.46 4.11 11.06 20.47 635,423
2001 2.00 3.75 4.10 10.61 20.45 604,294
2002 2.07 4.00 4.39 11.34 21.80 634,042
2003 1.89 4.08 4.18 12.24 22.39 688,171
2004 1.81 3.73 4.38 13.50 23.42 772,024
2005 1.79 3.80 4.11 13.87 23.57 795,289
2005 (Jan – Mar)
0.35 0.83 0.98 3.21 5.36 194,579
2006 (Jan - Mar)
0.31 0.86 1.04 3.35 5.56 196,608
Source: Derived from the statistics provided by Penang Port Sdn Bhd
PENANG STATISTICS (Quarter 2, 2006)
Socio-economic & Environmental Research Institute (SERI) 23
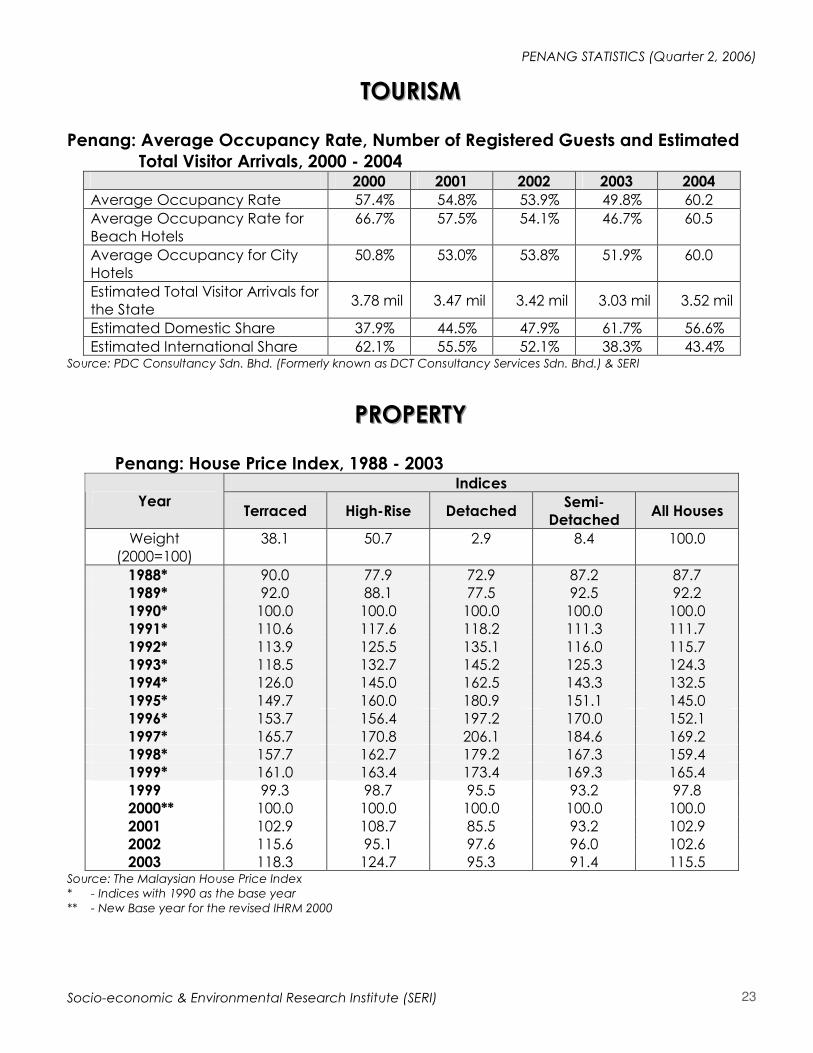
TTTOOOUUURRRIIISSSMMM
Penang: Average Occupancy Rate, Number of Registered Guests and Estimated
Total Visitor Arrivals, 2000 - 2004 2000 2001 2002 2003 2004
Average Occupancy Rate 57.4% 54.8% 53.9% 49.8% 60.2
Average Occupancy Rate for
Beach Hotels
66.7% 57.5% 54.1% 46.7% 60.5
Average Occupancy for City
Hotels
50.8% 53.0% 53.8% 51.9% 60.0
Estimated Total Visitor Arrivals for
the State 3.78 mil 3.47 mil 3.42 mil 3.03 mil 3.52 mil
Estimated Domestic Share 37.9% 44.5% 47.9% 61.7% 56.6%
Estimated International Share 62.1% 55.5% 52.1% 38.3% 43.4% Source: PDC Consultancy Sdn. Bhd. (Formerly known as DCT Consultancy Services Sdn. Bhd.) & SERI
PPPRRROOOPPPEEERRRTTTYYY
Penang: House Price Index, 1988 - 2003 Indices
Year Terraced High-Rise Detached
Semi-
Detached All Houses
Weight
(2000=100)
38.1 50.7 2.9 8.4 100.0
1988* 90.0 77.9 72.9 87.2 87.7
1989* 92.0 88.1 77.5 92.5 92.2
1990* 100.0 100.0 100.0 100.0 100.0
1991* 110.6 117.6 118.2 111.3 111.7
1992* 113.9 125.5 135.1 116.0 115.7
1993* 118.5 132.7 145.2 125.3 124.3
1994* 126.0 145.0 162.5 143.3 132.5
1995* 149.7 160.0 180.9 151.1 145.0
1996* 153.7 156.4 197.2 170.0 152.1
1997* 165.7 170.8 206.1 184.6 169.2
1998* 157.7 162.7 179.2 167.3 159.4
1999* 161.0 163.4 173.4 169.3 165.4
1999 99.3 98.7 95.5 93.2 97.8
2000** 100.0 100.0 100.0 100.0 100.0
2001 102.9 108.7 85.5 93.2 102.9
2002 115.6 95.1 97.6 96.0 102.6
2003 118.3 124.7 95.3 91.4 115.5 Source: The Malaysian House Price Index
* - Indices with 1990 as the base year
** - New Base year for the revised IHRM 2000

PENANG STATISTICS (Quarter 2, 2006)
Socio-economic & Environmental Research Institute (SERI) 24
Penang: Number of Transactions by Price Range for the Principal Property Sub-
Sectors, 2004 & 2005 Price Range (RM) Year Residential Commercial Industrial Agricultural Development Others Total
2004 560 20 1 80 218 16 895 0 - 25,000
2005 504 44 1 224 319 8 1,100
2004 1,719 33 5 106 239 13 2,115 25,001 - 50,000
2005 1,747 206 2 149 303 12 2,419
2004 2,864 40 10 51 174 4 3,143 50,000 - 75,000
2005 2,445 109 2 98 112 2 2,768
2004 3,019 110 9 58 129 11 3,336 75,001 - 100,000
2005 2,665 105 7 98 107 4 2,986
2004 3,958 238 33 62 140 8 4,439 100,001 - 150,000
2005 3,697 273 22 94 131 10 4,227
2004 2,419 309 45 45 129 5 2,952 150,001 - 200,000
2005 2,404 292 44 71 114 3 2,928
2004 1,441 282 72 33 79 2 1,909 200,001 - 250,000
2005 1,486 362 50 45 88 4 2,035
2004 2,552 738 251 76 266 9 3,892 250,001 - 500,000
2005 2,330 761 243 107 256 10 3,707
2004 538 274 68 30 188 11 1,109 500,001 - 1,000,000
2005 621 264 97 42 164 8 1,196
2004 135 57 74 28 200 8 502 1,000,001 & Above
2005 112 65 62 22 211 2 474
2004 19,205 2,101 568 569 1,762 87 24,292 Total
2005 18,011 2,481 530 950 1,805 63 23,840
Source: Jabatan Penilaian dan Perkhidmatan Harta
Penang: Value of Transactions by Price Range for the Principal Property Sub-Sectors,
2004 & 2005 (in RM million) Price Range (RM) Year Residential Commercial Industrial Agricultural Development Others Total
2004 12.77 0.27 0.00 1.04 3.13 0.22 17.43 0 - 25,000
2005 10.94 0.77 0.02 2.90 4.07 0.12 18.82
2004 70.50 1.27 0.19 3.99 9.20 0.45 85.60 25,001 - 50,000
2005 67.98 8.51 0.08 5.69 11.52 0.41 94.19
2004 185.15 2.65 0.65 3.22 11.05 0.26 202.98 50,000 - 75,000
2005 159.16 7.01 0.12 6.18 6.98 0.14 179.59
2004 269.02 9.89 0.83 4.95 11.49 0.93 297.11 75,001 - 100,000
2005 234.86 9.27 0.63 8.76 9.56 0.34 263.42
2004 501.63 30.66 4.26 7.73 17.54 1.02 562.84 100,001 - 150,000
2005 467.53 35.54 2.92 11.68 16.31 1.31 535.29
2004 421.40 55.38 8.14 8.16 23.09 0.82 516.99 150,001 - 200,000
2005 417.93 52.45 8.01 12.46 19.90 0.54 511.29
2004 325.72 64.92 16.81 7.48 17.91 0.45 433.29 200,001 - 250,000
2005 336.51 82.90 11.48 10.19 20.05 0.91 462.04
2004 866.61 257.02 85.36 28.20 95.16 3.15 1,335.50 250,001 - 500,000
2005 800.78 266.83 84.57 36.03 92.24 3.87 1,284.32
2004 353.82 178.77 46.36 21.11 132.05 7.21 739.32 500,001 - 1,000,000
2005 415.92 171.71 66.58 27.91 117.75 5.22 805.09
2004 230.98 94.43 291.77 66.33 767.01 11.59 1,462.11 1,000,001 & Above
2005 190.34 147.20 213.85 39.65 750.75 6.24 1,348.03
2004 3,237.60 695.26 454.37 152.21 1,087.63 26.10 5,653.17 Total
2005 3,101.95 782.19 388.26 161.45 1,049.13 19.10 5,502.08
Source: Jabatan Penilaian dan Perkhidmatan Harta

PENANG STATISTICS (Quarter 2, 2006)
Socio-economic & Environmental Research Institute (SERI) 25
EEEDDDUUUCCCAAATTTIIIOOONNN Penang: Number of Schools, Students & Teachers at the Primary Level, Jan 2005
Enrolment Type of
School
No. of
Schools Male Female
No. of
Students
No. of
Classes
No. of
Teachers
Non-Teaching
Staff
SK 113 38,595 36,104 74,699 2,300 4,276 579
SRK 29 8,720 8,123 16,843 510 1,019 141
SJK (C) 90 29,543 27,737 57,280 1,682 2,975 461
SJK (T) 28 2,893 3,025 5,918 223 400 108
SK Khas 3 80 69 149 29 54 19
Total 263 79,831 75,058 154,889 4,744 8,724 1,308 Source: Jabatan Pendidikan Negeri, Pulau Pinang
Penang: Number of Schools, Students & Teachers at the Secondary Level, Jan 2005 Enrolment Type of
School
No. of
Schools Male Female
No. of
Students
No. of
Classes
No. of
Teachers
Non-Teaching
Staff
SMK 96 51,704 52,749 104,453 3,233 6,294 1,025
SMT 6 1,396 739 2,135 105 442 107
SMKA 4 1,210 1,526 2,736 97 226 58
SM Khas 1 95 73 168 19 44 18
SMBP 1 373 240 613 24 64 34
SM + SR (Special
Model) 1 456 466 922 33 74 17
Total 109 55,234 55,793 111,027 3,511 7,144 1,259 Source: Jabatan Pendidikan Negeri, Pulau Pinang
Penang: Number of Students Taking Public Exams and Passing Rates, 2004 - 2005 No. of Students No. of Passes Passing Rate (%)
2004 2005 2004 2005 2004 2005
UPSR 23,521 24,125 15,210 16,202 64.7 67.2
PMR 19,600 20,677 12,677 14,394 64.6 69.6
SPM 18,354 20,644 15,968 n.a 87.0 n.a
STPM 3,725 3,899 3,567 n.a 95.8 n.a Source: Jabatan Pendidikan Negeri, Pulau Pinang
Penang: Number of Private Education Institutions (as of 31 December 2004) Type of Institution No. of Institutions No. of Students No. of Teachers
Private Primary Schools 2 170 26
Private Secondary Schools 4 380 42
Private Religious Primary Schools 0 0 0
Private Religious Secondary Schools 0 0 0
Chinese Independent Schools 5 2,781 184
International Schools 3 1,209 144
Expatriate Schools 2 293 27
Special Need Schools 3 128 20
Language Centres 8 358 25
Computer Centres 29 1,418 116
Tuition Centres 120 6,100 542
Skills Training Centres 24 154 48
Kindergartens 325 21,106 986*
Total Private Education Institutions 525 34,097 2,160 Note: Including assistant teachers
Source: Jabatan Pendidikan Swasta, Malaysia

PENANG STATISTICS (Quarter 2, 2006)
Socio-economic & Environmental Research Institute (SERI) 26
HHHEEEAAALLLTTTHHH Life Expectancy at Birth (Malaysia): 2002
(Projections)
2003
(Projections)
2004
(Projections)
Male 70.2 70.3 70.4
Female 75.6 75.9 76.2 Source: Department of Statistics. Malaysia
Life Expectancy at Birth (Penang): 2003
Male 70.4
Female 75.3 Source: Penang State Health Department
Vital Statistics of Penang (per thousand), 1995 - 2005 1995 1996 1997 1998 1999 2000 2002 2003 2004 2005
Crude Birth Rate 24.9 23.6 21.8 20.8 20.9 19.00 18.17 17.76 16.77 16.27
Crude Death Rate 5.9 6.4 6.2 6.2 6.09 6.00 6.01 5.35 5.66 5.53
Infant Mortality Rate 7.2 7.5 7.0 6.2 5.55 5.31 6.5 4.8 4.30 3.98
Prenatal Mortality
Rate 9.9 9.5 8.6 8.3 8.97 7.35 9.2 6.6 6.50 8.04
Neonatal Mortality
Rate 5.0 5.3 4.9 4.1 3.98 4.90 4.6 3.8 3.40 3.20
Toddler Mortality Rate 0.4 0.4 0.3 0.4 0.19 0.15 0.2 0.3 0.10 0.16
Maternal Mortality
Rate 0.3 0.3 0.4 0.5 0.16 0.16 0.6 0.3 0.44 0.41
Source: Penang State Health Department
Penang: Ratio of Medical Professionals – Population, 1996 - 2005 1996 1997 1998 1999 2000 2001 2002 2003 2004 2005
Doctor 1:1432 1:1353 1:1244 1:1194 1:1145 1:1031 1:1028 1:1014 1:963 1:840
Dentist 1.1071 1:9258 1:9425 1.8203 1:7871 1:7729 1:8912 1:8335 1:8744 1:7095
Nurse 1:677 1:728 1:689 1.633 1:600 1:577 1:596 1:569 1:531 1:501 Source: Penang State Health Department
Penang: Health Facilities 1999 - 2005 1999 2000 2002 2003 2004 2005
Government Hospital 5 5 5 6 6 6
Private Hospital 11 11 11 11 11 11
Private Maternity Home 8 8 8 8 8 7
Private Medical Centre 6 6 3 6 6 6
Mother & Child Health Care 12 12 14 14** 14** 6**
Health Centre 16 16 30* 30* 30* 26*
Rural Clinics 61 61 62 62 62 62
Midwives-quarters-cum-clinics 3 3 2 2 2 n.a * Inclusive of Polyclinic & Hospitals’ Outpatient Department
** Inclusive of MCH Clinic located in Health Clinic Building
n.a Not available
Source: Penang State Health Department

PENANG STATISTICS (Quarter 2, 2006)
Socio-economic & Environmental Research Institute (SERI) 27
Penang: Number of Hospital Beds (Government & Private) and Ratio of Hospital
Beds to Population, 2005 Government Private Total Ratio
Total 1955 1985 3940 1:1.0153 Source: Penang State Health Department
Penang: Number of Beds, Bed Occupancy Rate (BOR) & Average Length of Stay
(ALOS) for Government Hospitals, 2005 2005
Hospital Beds BOR ALOS
Hospital Pulau Pinang 1,090 69.26 5.18
RHSP (Hospital Seberang Jaya) 314 86.67 3.01
RHSP (Hospital Bukit Mertajam) 242 44.40 3.25
Hospital Sungai Bakap 130 39.22 2.79
Hospital Balik Pulau 71 46.59 3.35
Hospital Kepala Batas* 108 64.49 6.11
Total 1,955 64.49 4.15 RHSP = Rangkaian Hospital Seberang Perai (A merging hospital which consists of Hospital Seberang Jaya & Hospital
Bukit Mertajam, but physically still 2 hospitals)
* Hospital Kepala Batas commenced its services on 1st Jan 2003
Source: Penang State Health Department, series of Penang Health Information and from unpublished sources
Penang: HIV/AIDS (Total Identified Cases), 1999 - 2005
1999 2000 2001 2002 2003 2004 2005
HIV 225 194 215 268 266 308 251
AIDS 105(55) 70(52) 69(34) 88(45) 49(20) 59(34) 70(50)
Note: ( ) = deaths
Source: Penang State Health Department
Penang: 10 Main Causes of Hospital Deaths (Government), 2005
Ranking Main Causes of Death Total Deaths
% of Deaths to
Total Hospital
Deaths
1 Septicaemia 381 19.58%
2 Malignant Neoplasm 273 14.03%
3 Cerebo-Vascular Diseases 266 13.67%
4 Ischaemic Heart Diseases 223 11.46%
5 Pneumonia 173 8.89%
6 Diseases of Pulmonary Circulation
and Other form of hearth diseases 161 8.27%
7 Transport Accident 143 7.35%
8 Diseases of the Digestive System 134 6.89%
9 Renal Failure 130 6.68%
10 Certain Condition Originating in
the Perinatal Period 62 3.18%
Total Deaths 1946 100.00% Source: Penang State Health Department

PENANG STATISTICS (Quarter 2, 2006)
Socio-economic & Environmental Research Institute (SERI) 28
SSSEEELLLEEECCCTTTEEEDDD NNNAAATTTIIIOOONNNAAALLL SSSTTTAAATTTIIISSSTTTIIICCCSSS Malaysia: Gross Domestic Product by Sector (Current Prices & 1987 Prices)
RM Million Component
Q1/05 Q2/05 Q3/05 Q4/05 Q1/06
National Accounts (GDP) at Current Prices 116,117 119,958 128,706 130,458 128,866
Agriculture, Forestry and Fishing 9,539 10,736 11,607 11,023 11,275
Mining and Quarrying 17,068 16,733 20,924 20,454 20,762
Manufacturing 36,049 37,221 38,208 39,944 39,744
Electricity, Gas and Water 3,502 3,693 3,726 3,583 3,666
Construction 3,536 3,896 3,892 3,881 3,523
Wholesale and Retail Trade, Hotel and Restaurants 15,319 15,494 16,912 17,520 16,882
Transport, storage and Communication 7,762 7,852 8,158 8,289 8,278
Finance, Insurance, real estate and business services 12,648 13,090 13,611 13,860 13,781
Other Services 7,054 7,311 7,536 7,638 7,591
Government Services 8,127 8,556 8,825 9,135 8,454
Less : Imputed bank service charges 6,112 6,282 6,416 6,232 6,529
Plus : import duties 1,625 1,657 1,724 1,365 1,438
National Accounts (GDP) at 1987 Prices 62,869 64,386 66,848 68,072 66,170
Agriculture, Forestry and Fishing 4,969 5,446 5,801 5,410 5,330
Mining and Quarrying 4,503 4,108 4,418 4,475 4,344
Manufacturing 19,765 20,394 20,884 21,681 21,355
Electricity, Gas and Water 2,624 2,769 2,793 2,686 2,748
Construction 1,676 1,829 1,818 1,809 1,646
Wholesale and Retail Trade, Hotel and Restaurants 9,201 9,210 9,847 10,201 9,766
Transport, storage and Communication 5,674 5,631 5,807 5,932 5,924
Finance, Insurance, real estate and business services 9,570 10,049 10,208 10,417 10,143
Other Services 4,955 5,046 5,151 5,194 5,183
Government Services 4,603 4,845 4,998 5,158 4,773
Less : Imputed bank service charges 5,934 6,227 6,199 5,936 6,147
Plus : import duties 1,263 1,285 1,320 1,044 1,105
Source: Bank Negara Malaysia
Note: Data is subject to adjustments and revisions by Bank Negara Malaysia
Malaysia: Exchange Rates Period USD GBP EUR AUD JPY100 SGD
Q4/2004 3.8000 7.0934 4.9289 2.8751 3.5967 2.2944
Q1/2005 3.8000 7.1918 4.9909 2.9544 3.6376 2.3240
Q2/2005 3.8000 7.0510 4.7833 2.9199 3.5334 2.2905
Q3/2005 3.7715 6.7339 4.6022 2.8661 3.3911 2.2516
Q4/2005 3.7766 6.6003 4.4892 2.8093 3.2212 2.2377
Q1/2006 3.7256 6.5265 4.4817 2.7505 3.1888 2.2891
Q2/2006 3.6479 6.6691 4.5870 2.7223 3.1899 2.2952
Source: Bank Negara Malaysia
January - February Currency 2004 2005
2005 2006 % Change
Per Unit
US dollar 3.8000 3.7871 3.8000 3.7390 1.6
Pound Sterling 6.9652 6.8939 7.1659 6.5661 9.1
Singapore Dollar 2.2487 2.2759 2.3207 2.2921 1.2
Euro 4.7262 4.7165 4.9762 4.4993 10.6
Per 100 Units
Japanese Yen 3.5154 3.4459 3.6523 3.2077 13.9
Thai Baht 9.4437 9.4127 9.8424 9.4507 4.1
Philippine Peso 6.7801 6.8803 6.8804 7.1638 -4.0
Indonesia Rupiah 0.0426 0.0391 0.0412 0.0400 3.1
Saudi Arabian Riyal 101.4104 100.9792 101.3267 99.6984 1.6
Source: The Malaysian Economy in Brief, March 2006, Department of Statistics, Malaysia

PENANG STATISTICS (Quarter 2, 2006)
Socio-economic & Environmental Research Institute (SERI) 29
Malaysia: National Indices & Employment Data
Unit Description Latest Period Latest Data Previous
Period
Industrial Production Index 2000=100 Apr-06 130.7 138.9
Employment (million persons) Q4/2005 9.998 10.101
Employment % of labour force Q4/2005 96.2 96.2
Unemployment (million persons) Q4/2005 0.400 0.398
Unemployment % of labour force Q4/2005 3.8 3.8
Average salaries and wages per
employee in manufacturing sector RM per month Apr-06 1,721.7 1,740.4
Consumer Price Index 2005=100 May-06 103.6 103.4
Producer Price Index 1989=100 Apr-06 172.8 169.3
Source: Bank Negara Malaysia
Malaysia: Federal Government Accounts
RM Million Component
2002 2003 2004
Public Sector Operations
General Government
Revenue 96,763 107,055 116,328
Operating Expenditure 75,450 84,163 101,649
Current Account 21,313 22,892 14,679
NPFE’s Operating Surplus 45,324 55,651 81,875
Public Sector Current Account 66,637 78,543 96,554
Net Development Expenditure 69,125 83,315 56,716
Public Sector Overall Balance -2,488 -4,772 39,838
Domestic Financing -4,699 15,147 -37,872
Bank -13,139 -6,104 -60,731
Non-Bank 8,440 21,251 22,859
Foreign Borrowing 7,187 -10,375 -1,966 Source: Bank Negara Malaysia
Malaysia: Producer Price Index 1989 = 100
January - February
Average Section
Weights 2005 2005 2006 % Change
Food & Live Animals Chiefly for Food 14.88 141.1 140.0 141.8 1.3
Beverages and Tobacco 2.08 170.6 169.9 172.0 1.2
Crude Materials, Inedible Except Fuels 17.96 137.0 132.4 146.6 10.7
Mineral Fuel / Lubricants & Related Materials 18.82 274.4 230.8 311.1 34.8
Animal & Vegetable Oils & Fats 8.47 172.7 167.1 173.3 3.7
Chemicals & Related Products N.E.S. 4.42 127.3 127.0 125.1 -1.5
Manufactured Goods Classified Chiefly by
Material 10.82 128.6 128.1 128.7 0.5
Machinery & Transport Equipment 18.35 110.9 110.5 110.6 0.1
Miscellaneous Manufactured Articles 3.61 131.8 130.6 132.6 1.5
Commodities & Transactions N.E.C. in the S.I.T.C. 0.59 130.1 130.1 130.6 0.4
Total 100.00 160.8 150.9 169.5 12.3
Source: The Malaysian Economy in Brief, March 2006, Department of Statistics, Malaysia

PENANG STATISTICS (Quarter 2, 2006)
Socio-economic & Environmental Research Institute (SERI) 30
Malaysia: Consumer Price Index 2005=100
Period
All groups
Food &
non-alcoholic
beverages
Alcoholic
beverages &
tobacco
Clothing &
footw
ear
Housing, water,
electricity, gas &
other fuels
Furnishings,
household
equipment &
routine
Health
Transport
Communication
Recreation
services and
culture
Education
Restaurant &
hotels
Miscella
neous
goods and
services
2003 95.7 94.4 79.0 102.9 97.9 98.3 97.0 93.4 99.3 100.8 96.9 95.0 97.4
2004 97.1 94.6 87.8 101.0 98.8 98.7 98.3 94.1 100.0 99.9 98.2 96.6 98.7
2005 100.0 100.0 100.0 100.0 100.0 100.0 100.0 100.0 100.0 100.0 100.0 100.0 100.0
2006
Jan 101.8 102.8 105.1 98.8 100.5 100.7 101.4 103.6 99.5 100.4 100.8 102.3 101.3
Feb 101.9 102.6 105.2 99.8 100.7 100.8 101.6 103.6 99.4 100.8 101.1 102.5 101.7
Mar 103.4 102.3 105.2 98.6 101.2 100.8 101.6 113.2 99.2 100.7 101.2 102.9 101.5
Apr 103.4 102.3 105.2 99.6 101.2 101.0 101.7 112.2 98.9 100.7 101.3 103.2 102.0
May 103.6 102.9 105.3 99.4 101.4 101.0 101.9 112.2 98.7 100.7 101.3 103.5 103.2
Note: Data from 2003 – 2006 refers to Consumer Price Index (2005=100) for Malaysia.
Source: Department of Statistics, Malaysia
Malaysia: Index of Industrial Production 2000 = 100
Period All Divisions Mining Electricity Manufacturing Export-Oriented
Industries
Domestic-oriented
Industries
Weight 100.0 23.37 5.96 70.67 0.80 0.20
2000 100.0 100.0 100.0 100.0 100.0 100.0
2001 96.7 103.1 108.7 93.5 91.3 102.5
2002 101.2 104.9 119.9 98.4 95.7 109.0
2003 110.5 110.5 126.8 109.1 107.9 114.0
2004 122.5 117.0 137.2 123.0 123.8 119.9
2005 127.5 117.6 145.1 129.3 130.8 123.2
2006
Jan 130.2 120.5 142.7 132.4 135.1 121.8
Feb 123.8 108.7 138.9 127.5 130.1 117.2
Mar 138.9 121.6 158.2 142.9 146.0 130.7
Apr 130.7 110.7 152.3 135.5 136.6 131.3
Export-Oriented Industries
Of Which Period
2006
Total
Electronic
&
Electrical Electronics Electricals
Chemicals
& Chemical
Products
Petroleum
Products
Textiles &
Wearing
Apparel
Wood &
Wood
Products
Rubber
Products
Off-Estate
Processing Others
Jan 135.1 133.2 155.0 90.6 154.7 162.0 86.7 112.5 123.3 101.6 96.3
Feb 130.1 132.9 148.8 101.9 137.3 149.3 80.6 99.4 127.7 112.7 94.5
Mar 146.0 150.4 172.4 107.4 144.7 171.0 86.3 114.8 143.6 133.0 121.1
Apr 136.6 138.4 158.6 98.8 141.9 147.5 90.9 110.0 147.0 138.0 121.2
Domestic-Oriented Industries Period
2006
Total Non-metallic
Mineral
Products
Iron and
steel
Food
Manufac-
turing
Transport
Equipment
Fabricated
Metal
Products
Paper
Products
Tobacco
Products Beverages
Jan 121.8 109.0 96.3 119.4 162.6 121.9 119.0 155.2 81.0
Feb 117.2 100.3 92.7 119.1 146.4 131.3 120.9 120.8 74.3
Mar 130.7 115.6 106.1 132.8 161.6 156.0 120.5 86.0 98.7
Apr 131.3 113.2 101.3 131.0 173.8 157.9 121.2 89.1 80.1 Source: Department of Statistics, Malaysia
Note: Under the new Industrial Production Index (2000=100), LNG processing has been reclassified as petroleum products (previously
classified as chemicals and chemical products). Petroleum products have now been categorised under export-oriented industries
(previously: domestic-oriented industries).