PEER-REVIEWED ARTICLE bioresources€¦ · Rua Cora Coralina, 330, Campinas, 13083-896, Brazil; *...
17
PEER-REVIEWED ARTICLE bioresources.com De Oliveira et al. (2018). “Lactic acid from fermentation,” BioResources 13(2), 2187-2203. 2187 Evaluation of Hybrid Short Path Evaporation to Concentrate Lactic Acid and Sugars from Fermentation Regiane Alves de Oliveira, a, * Andrea Komesu, b Carlos Eduardo Vaz Rossell, c Maria Regina Wolf Maciel, a and Rubens Maciel Filho a Lactic acid is an important organic compound that finds various applications in the chemical, pharmaceutical, food, and medical industries. Many of these applications require lactic acid with high purity. Hybrid short path evaporation (HSPE) is a separation process well studied in the petrochemical sector that is mainly used to obtain compounds with high purity. It is also a process offering small residence time, low pressure, and environmentally friendliness. The concentration process of lactic acid was studied by using HSPE in the presence of high total reducing sugar content remaining from sugarcane molasses fermentation. In this work, the influence of operational conditions, such as evaporator temperature (86.4 °C to 153.6 °C), internal condenser temperature (7.95 °C to 18 °C), and feed flow rate (8.27 to 21.7 mL/min), on lactic acid concentration and mass percentages were evaluated. The results showed that all variables influenced the process. Mathematical models were developed for the mass percentage and concentration of the total reducing sugar in the distilled stream and for the mass percentage at residue stream. Under the best operational conditions, the concentration of lactic acid (≈ 247.7 g/L) was 2.5 times higher than the initial fermentation broth (≈ 100.1 g/L). Keywords: Lactic acid; Downstream; Hybrid short path evaporation; Total reducing sugar Contact information: a: Laboratory of Optimization, Design and Advanced Process Control, School of Chemical Engineering, University of Campinas – Unicamp, 13083-852, Campinas – SP, Brazil; b: Departamento de Ciências do Mar [Department of Marine Sciences], Federal University of São Paulo - UNIFESP, 11070-100, Santos- SP, Brazil; c: Interdisciplinary Center of Energy Planning (NIPE), University of Campinas (Unicamp). Rua Cora Coralina, 330, Campinas, 13083-896, Brazil; * Corresponding author: [email protected] INTRODUCTION Lactic acid (LA) is an organic acid that can be produced either via fermentation or conventional organic synthesis. The production through fermentation is preferred because, among other advantages, the lactic acid can be produced from renewable substrates such as starchy materials (Juodeikiene et al. 2015), lignocellulosic biomass (Abdel-Rahman et al. 2011), food waste (Tang et al. 2016), glycerol (Murakami et al. 2016), microalgae (Vanthoor-Koopmans et al. 2013), and sugarcane molasses (Oliveira et al. 2016). Sugarcane molasses is a potential raw material for lactic acid production. It is an agro- industrial by-product generated from the sugar industry. Brazil is the largest sugarcane producer worldwide producing more than 600 million tons per year (MAPA 2015). During sugar production, approximately 17.9 million tons of molasses are generated as the by- product (Hauly et al. 2003). It contains approximately 40% to 60% of sucrose, which can be converted to lactic acid through the use of microorganisms (Dumbrepatil et al. 2008).
Transcript of PEER-REVIEWED ARTICLE bioresources€¦ · Rua Cora Coralina, 330, Campinas, 13083-896, Brazil; *...

PEER-REVIEWED ARTICLE bioresources.com
De Oliveira et al. (2018). “Lactic acid from fermentation,” BioResources 13(2), 2187-2203. 2187
Evaluation of Hybrid Short Path Evaporation to Concentrate Lactic Acid and Sugars from Fermentation
Regiane Alves de Oliveira,a,* Andrea Komesu,b Carlos Eduardo Vaz Rossell,c
Maria Regina Wolf Maciel,a and Rubens Maciel Filho a
Lactic acid is an important organic compound that finds various applications in the chemical, pharmaceutical, food, and medical industries. Many of these applications require lactic acid with high purity. Hybrid short path evaporation (HSPE) is a separation process well studied in the petrochemical sector that is mainly used to obtain compounds with high purity. It is also a process offering small residence time, low pressure, and environmentally friendliness. The concentration process of lactic acid was studied by using HSPE in the presence of high total reducing sugar content remaining from sugarcane molasses fermentation. In this work, the influence of operational conditions, such as evaporator temperature (86.4 °C to 153.6 °C), internal condenser temperature (7.95 °C to 18 °C), and feed flow rate (8.27 to 21.7 mL/min), on lactic acid concentration and mass percentages were evaluated. The results showed that all variables influenced the process. Mathematical models were developed for the mass percentage and concentration of the total reducing sugar in the distilled stream and for the mass percentage at residue stream. Under the best operational conditions, the concentration of lactic acid (≈ 247.7 g/L) was 2.5 times higher than the initial fermentation broth (≈ 100.1 g/L).
Keywords: Lactic acid; Downstream; Hybrid short path evaporation; Total reducing sugar
Contact information: a: Laboratory of Optimization, Design and Advanced Process Control, School of
Chemical Engineering, University of Campinas – Unicamp, 13083-852, Campinas – SP, Brazil;
b: Departamento de Ciências do Mar [Department of Marine Sciences], Federal University of São Paulo -
UNIFESP, 11070-100, Santos- SP, Brazil; c: Interdisciplinary Center of Energy Planning (NIPE),
University of Campinas (Unicamp). Rua Cora Coralina, 330, Campinas, 13083-896, Brazil;
* Corresponding author: [email protected]
INTRODUCTION
Lactic acid (LA) is an organic acid that can be produced either via fermentation or
conventional organic synthesis. The production through fermentation is preferred because,
among other advantages, the lactic acid can be produced from renewable substrates such
as starchy materials (Juodeikiene et al. 2015), lignocellulosic biomass (Abdel-Rahman et
al. 2011), food waste (Tang et al. 2016), glycerol (Murakami et al. 2016), microalgae
(Vanthoor-Koopmans et al. 2013), and sugarcane molasses (Oliveira et al. 2016).
Sugarcane molasses is a potential raw material for lactic acid production. It is an agro-
industrial by-product generated from the sugar industry. Brazil is the largest sugarcane
producer worldwide producing more than 600 million tons per year (MAPA 2015). During
sugar production, approximately 17.9 million tons of molasses are generated as the by-
product (Hauly et al. 2003). It contains approximately 40% to 60% of sucrose, which can
be converted to lactic acid through the use of microorganisms (Dumbrepatil et al. 2008).

PEER-REVIEWED ARTICLE bioresources.com
De Oliveira et al. (2018). “Lactic acid from fermentation,” BioResources 13(2), 2187-2203. 2188
Lactic acid is the most important hydrocarboxylic acid (Wang et al. 2016), and it
has a wide variety of applications in pharmaceutical products, cosmetics, food industry,
package industry, chemistry, and medical areas (Komesu et al. 2014a). However, the
versatility of applications can only be fully exploited if the compound has a cost-effective
production (Komesu et al. 2016). The greatest challenge in its production is to obtain high
purity lactic acid, which is related to downstream processes (Pal et al. 2009). Many
processes have been developed for lactic acid separation and purification, such as
electrodialysis, via ion-exchange membrane, adsorption, crystallization, and solvent
extraction (Joglekar et al. 2006). However, there are still challenges to overcome viz., low
efficiency, high cost, toxic solvent usage, and residual disposal, causing environmental
problems (Yu et al. 2015). Some of these difficulties can be associated with some of the
physical properties of lactic acid, such as its low volatility, association with water, and
thermal decomposition at high temperature.
In this sense, hybrid short path evaporation (HSPE) may be a suitable process for
lactic acid recovery and purification (Yu et al. 2015). It is an environmentally friendly and
gentle technique with scope for large-scale application in pharmaceutical and cosmetic
industries (Chen et al. 2012). It is also considered appropriate for the purification of other
thermally sensitive substances like liquids with low vapor pressure and high molecular
weight (Lin et al. 2014), besides reducing the hazard of thermal decomposition and
avoiding the use of abundant toxic solvents (Wang et al. 2013). The HSPE is a special case
of short path evaporation that works at high vacuum. Lower pressures are desirable because
they decrease the boiling point of the substances, reducing the thermal decomposition
(Komesu et al. 2015b). The separation efficiency depends on operation conditions like
distilling temperature and pressure, feed flow rate, as well as their interactions (Yu et al.
2015).
In previous works (Komesu et al. 2013; 2014a; 2015b; Oliveira et al. 2017), our
research group studied the purification of the lactic acid from fermentation broth using
HSPE. In these works, the influence was evaluated of operational parameters that could
affect the HSPE process using fermentation product containing about 5 % (w/w) of lactic
acid. The results showed that LA with high purity (≈ 89.7 %) was obtained. By the fact that
HSPE is affected by the feed composition, new studies for lactic acid recovery using
different fermentation broth concentrations are required. Bearing all this in mind, the
objective of this paper was to produce the lactic acid in high concentration (≈ 100 g/L) by
fermentation route and evaluate the separation process using HSPE in presence of high
amount of total reducing sugars. This will enable researchers to optimize fermentation
broths to improve the performance of the separation process.
EXPERIMENTAL Materials Propagation of microorganisms and inoculum preparation
The microorganism Lactobacillus plantarum CCT 3751 (from Fundação André
Tosello – Coleção de Culturas Tropical, Campinas, Brazil) was grown in MRS (de Man et
al. 1960) broth (de Man et al. 1960) and incubated for 24 h at 37 °C in a vertical incubator.
The inoculum was prepared in a 250-mL Erlenmeyer flask containing approximately 100
mL of MRS broth, and incubated for 18 h, at 37 °C, and 120 rpm in an orbital shaker. The
inoculum media was centrifuged (Eppendorf, Hauppauge, USA) for 10 min, at 4 °C, and
PEER-REVIEWED ARTICLE bioresources.com
De Oliveira et al. (2018). “Lactic acid from fermentation,” BioResources 13(2), 2187-2203. 2189
6,000 rpm. The supernatant was discarded and the cell pellet was suspended again in 100
mL of sterile water to be used as an inoculum in the fermentation. The inoculum was added
to the bioreactor in a sterile mode using a peristaltic pump of the bioreactor.
Preparation of the bioreactor and fermentation broth
Fermentations were carried out in a New Brunswick Bioflo®/Celligen® 115
bioreactor (New Brunswick Scientific, New Jersey, USA) with a working volume of 1 L.
The bioreactor was cleaned, assembled, and equipped with previously calibrated probes.
The fermentation broth was prepared with 200 g/L of total reducing sugar (TRS) content
from sugarcane molasses (Brazilian Bioethanol Science and Technology Laboratory-
CTBE, Campinas, Brazil) without pretreatment, 20 g/L of yeast extract, and 5 g/L of
sodium acetate. Then, the fermentation broth was transferred to the bioreactor to be
sterilized in a vertical autoclave, at 121 °C for 30 min. The bioreactor temperature was
adjusted to 37 °C and an agitation speed of 200 rpm. The pH was maintained at 6.0 ± 0.1
through automatic dosing of a sterile 4 M Ca(OH)2 solution, through real-time monitoring
during the fermentation process.
Methods Samples from fermentation were utilized for measuring LA production, TRS
consumption, cell growth, and by-product formations. The temperature and pH were
continuously monitored. Cell dry weight was used to characterize the microorganism
growth with time. All of the samples from fermentation and after separation processes were
analyzed using high-performance liquid chromatography (HPLC) (Agilent, Santa Clara,
USA). For sugar analysis, the column used was Bio-Rad Aminex ®HPX-87P (Bio-Rad,
Hercules, USA) (300 mm × 7.8 mm × 9 μm) at 55 °C. Milli-Q water was used as the mobile
phase at a flow rate of 0.5 mL/min with automatic injection. For organic acids analysis, the
column Bio-Rad Aminex ®HPX-87H (300 mm × 7.8 mm × 9 μm) was used at 35 °C, using
sulfuric acid (5 mM) as the mobile phase at a flow rate of 0.6 mL/min with automatic
injection.
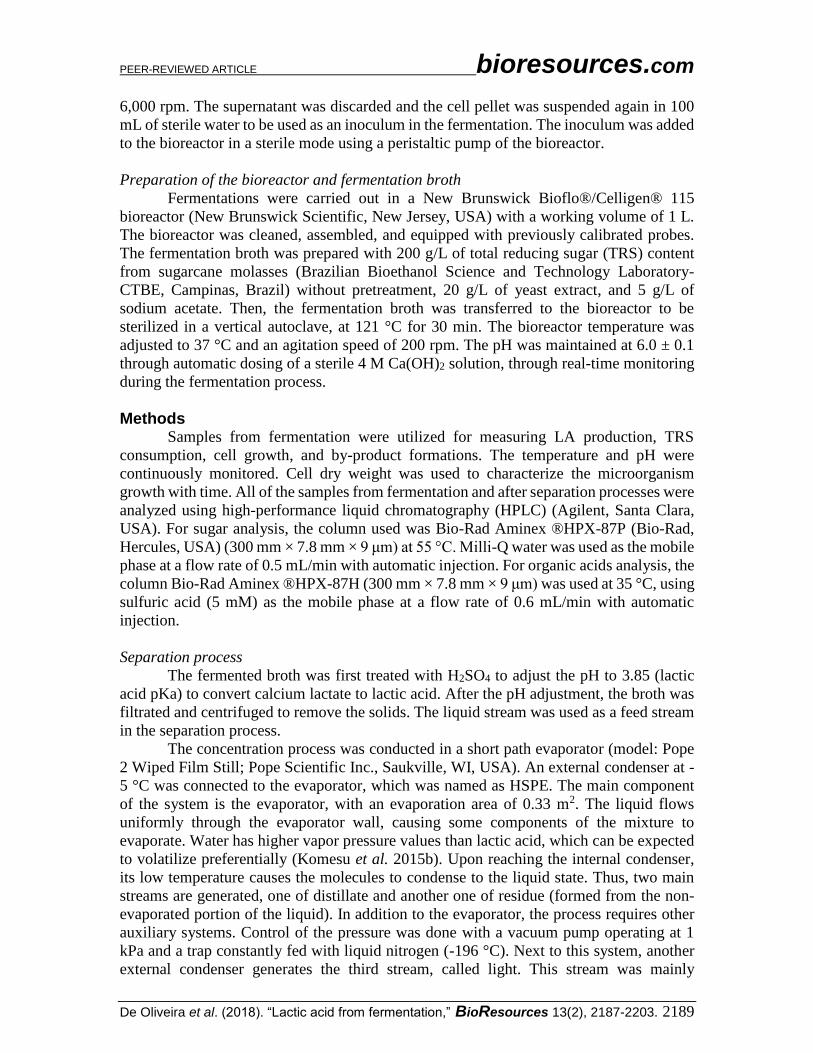
Separation process
The fermented broth was first treated with H2SO4 to adjust the pH to 3.85 (lactic
acid pKa) to convert calcium lactate to lactic acid. After the pH adjustment, the broth was
filtrated and centrifuged to remove the solids. The liquid stream was used as a feed stream
in the separation process.
The concentration process was conducted in a short path evaporator (model: Pope
2 Wiped Film Still; Pope Scientific Inc., Saukville, WI, USA). An external condenser at -
5 °C was connected to the evaporator, which was named as HSPE. The main component
of the system is the evaporator, with an evaporation area of 0.33 m2. The liquid flows
uniformly through the evaporator wall, causing some components of the mixture to
evaporate. Water has higher vapor pressure values than lactic acid, which can be expected
to volatilize preferentially (Komesu et al. 2015b). Upon reaching the internal condenser,
its low temperature causes the molecules to condense to the liquid state. Thus, two main
streams are generated, one of distillate and another one of residue (formed from the non-
evaporated portion of the liquid). In addition to the evaporator, the process requires other
auxiliary systems. Control of the pressure was done with a vacuum pump operating at 1
kPa and a trap constantly fed with liquid nitrogen (-196 °C). Next to this system, another
external condenser generates the third stream, called light. This stream was mainly
PEER-REVIEWED ARTICLE bioresources.com
De Oliveira et al. (2018). “Lactic acid from fermentation,” BioResources 13(2), 2187-2203. 2190
composed of water from the evaporation process. The system feeding (40 g of raw material)
was conducted through a peristaltic pump Cole Parmer Masterflex 77200-60 (Cole Parmer,
Chicago, USA). The agitation of the system was fixed at 250 rpm. Details of the equipment
can be found in Komesu et al. (2014a).
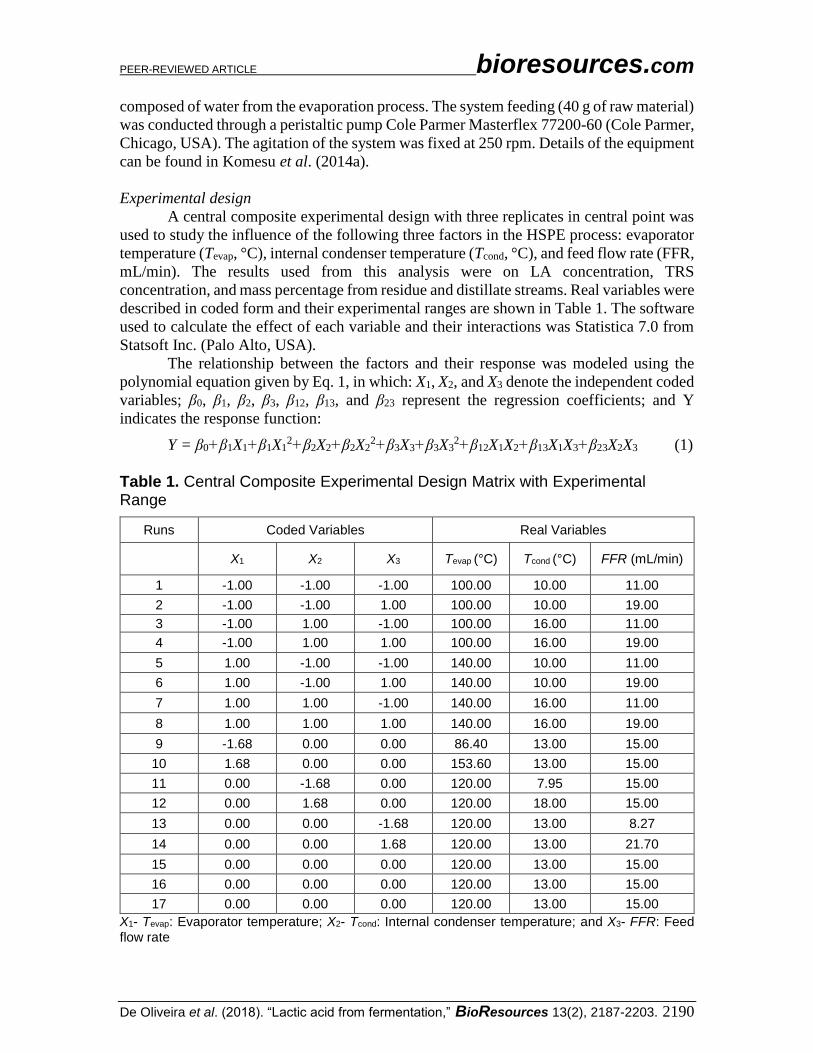
Experimental design
A central composite experimental design with three replicates in central point was
used to study the influence of the following three factors in the HSPE process: evaporator
temperature (Tevap, °C), internal condenser temperature (Tcond, °C), and feed flow rate (FFR,
mL/min). The results used from this analysis were on LA concentration, TRS
concentration, and mass percentage from residue and distillate streams. Real variables were
described in coded form and their experimental ranges are shown in Table 1. The software
used to calculate the effect of each variable and their interactions was Statistica 7.0 from
Statsoft Inc. (Palo Alto, USA).
The relationship between the factors and their response was modeled using the
polynomial equation given by Eq. 1, in which: X1, X2, and X3 denote the independent coded
variables; β0, β1, β2, β3, β12, β13, and β23 represent the regression coefficients; and Y
indicates the response function:
Y = β0+β1X1+β1X12+β2X2+β2X2
2+β3X3+β3X32+β12X1X2+β13X1X3+β23X2X3 (1)
Table 1. Central Composite Experimental Design Matrix with Experimental Range
Runs Coded Variables Real Variables
X1 X2 X3 Tevap (°C) Tcond (°C) FFR (mL/min)
1 -1.00 -1.00 -1.00 100.00 10.00 11.00
2 -1.00 -1.00 1.00 100.00 10.00 19.00
3 -1.00 1.00 -1.00 100.00 16.00 11.00
4 -1.00 1.00 1.00 100.00 16.00 19.00
5 1.00 -1.00 -1.00 140.00 10.00 11.00
6 1.00 -1.00 1.00 140.00 10.00 19.00
7 1.00 1.00 -1.00 140.00 16.00 11.00
8 1.00 1.00 1.00 140.00 16.00 19.00
9 -1.68 0.00 0.00 86.40 13.00 15.00
10 1.68 0.00 0.00 153.60 13.00 15.00
11 0.00 -1.68 0.00 120.00 7.95 15.00
12 0.00 1.68 0.00 120.00 18.00 15.00
13 0.00 0.00 -1.68 120.00 13.00 8.27
14 0.00 0.00 1.68 120.00 13.00 21.70
15 0.00 0.00 0.00 120.00 13.00 15.00
16 0.00 0.00 0.00 120.00 13.00 15.00
17 0.00 0.00 0.00 120.00 13.00 15.00
X1- Tevap: Evaporator temperature; X2- Tcond: Internal condenser temperature; and X3- FFR: Feed flow rate

PEER-REVIEWED ARTICLE bioresources.com
De Oliveira et al. (2018). “Lactic acid from fermentation,” BioResources 13(2), 2187-2203. 2191
RESULTS AND DISCUSSION
Fermentation Processes The fermentation process was carried out four times to obtain a sufficient volume
of medium for the HSPE process. For each process, the yield (Y), productivity (P), and
remaining total reducing sugar content (RTRS) were calculated to evaluate the processes
using Eqs. 2, 3, and 4, respectively:
𝑌(g/g) = 𝐿𝑎𝑐𝑡𝑖𝑐 𝑎𝑐𝑖𝑑 𝑝𝑟𝑜𝑑𝑢𝑐𝑒𝑑(g)
𝑇𝑅𝑆 consumed (g) (2)
𝑃(gL−1h−1) = 𝐿𝑎𝑐𝑡𝑖𝑐 𝑎𝑐𝑖𝑑(g/L)
𝑇𝑖𝑚𝑒(h) (3)
𝑅TRS (%) = (𝑇𝑅𝑆 𝑓𝑖𝑛𝑎𝑙 (g)
𝑇𝑅𝑆 𝑖𝑛𝑖𝑡𝑖𝑎𝑙 (g)) 𝑥 100 (4)
The results of Y, P, and RTRS for the fermentation process are shown in Table 2,
which indicates a high LA yield (Y = 0.98 g/g) and productivity (P = 2.84 gL-1h-1). The
microorganism presented a homofermentative process with the total amount of
monosaccharides being consumed first to produce LA, and without any by-product
formations. The remaining sugar after the fermentation process was mainly sucrose in a
concentration of 82.16 g/L. In all the cases, the fermentative process was interrupted before
the TRS consumption, once it was aimed to analyze the sucrose effect in the HSPE process.
Even though, the final concentration of LA was high (100.11 g/L), it was similar to many
previous studies with concentrations around 100 g/L (Hu et al. 2016; Nair et al. 2016; Ou
et al. 2016; Wang et al. 2016; Zhou et al. 2016).
Table 2. Fermentation Broth Composition for Lactic Acid Production before and
after the Treatment with H2SO4.
Sucrose (g/L)
Glucose (g/L)
Fructose (g/L)
Lactic acid (g/L)
Y (g/g)
P (g L-1 h-1)
RTRS
(%)
Fermented broth *
82.16 0.00 1.35 100.11 0.98 2.84 42.38
Standard deviation
21.18 0.00 1.79 22.98 0.01 0.46 8.66
Treated broth H2SO4
76.01 6.46 3.90 96.70 - - -
* The values for the Fermented broth are average of the results of four fermentation batches. Y: Yield; P: Productivity; and RTRS: Remaining total reducing sugar
Hybrid Short Path Evaporation Process Table 2 shows that the feed stream used in HSPE process had high concentrations
of TRS and LA. The results of the experimental design for the distillate and residue streams
are presented in Table 3. The light stream was not subjected to statistical analysis because
it did not have any of the analyzed components (lactic acid, sucrose, glucose, and fructose).
Mass percentages of distilled and residue streams were defined as shown in Eqs. 5 and 6.

PEER-REVIEWED ARTICLE bioresources.com
De Oliveira et al. (2018). “Lactic acid from fermentation,” BioResources 13(2), 2187-2203. 2192
𝐷 (%) = (𝐷𝑖𝑠𝑡𝑖𝑙𝑙𝑒𝑑 𝑚𝑎𝑠𝑠(g)
𝐷𝑖𝑠𝑡𝑖𝑙𝑙𝑒𝑑 𝑚𝑎𝑠𝑠(g)+𝑅𝑒𝑠𝑖𝑑𝑢𝑒 𝑚𝑎𝑠𝑠(g)+𝐿𝑖𝑔ℎ𝑡 𝑚𝑎𝑠𝑠(g)) 𝑥 100 (5)
𝑅 (%) = (𝑅𝑒𝑠𝑖𝑑𝑢𝑒 𝑚𝑎𝑠𝑠(𝑔)
𝐷𝑖𝑠𝑡𝑖𝑙𝑙𝑒𝑑 𝑚𝑎𝑠𝑠(g)+𝑅𝑒𝑠𝑖𝑑𝑢𝑒 𝑚𝑎𝑠𝑠(g)+𝐿𝑖𝑔ℎ𝑡 𝑚𝑎𝑠𝑠(g)) 𝑥 100 (6)
In Table 3, the runs identified by the numbers 15, 16, and 17 correspond to central
points, performed in triplicates at the same operating conditions to determine the
experimental error.
Table 3. Lactic Acid and Total Reducing Sugar Concentrations, and Mass
Percentages Produced by Hybrid Short Path Evaporation
Runs Distilled Stream Residue Stream
Lactic Acid (g/L) TRS (g/L)
D (%)
Lactic Acid (g/L) TRS (g/L)
R (%)
1 59.43 28.73 12.53 247.69 141.64 35.67
2 47.74 44.14 7.02 139.71 108.55 54.98
3 0.00 0.00 0.00 154.25 132.31 50.68
4 87.72 76.48 1.89 143.06 126.21 49.66
5 103.66 89.05 9.76 175.40 154.59 19.59
6 85.91 77.95 9.95 180.26 143.64 44.59
7 109.13 92.97 2.27 166.93 140.42 32.41
8 108.33 92.74 2.98 148.28 122.57 47.20
9 32.97 27.88 1.44 148.25 123.21 51.01
10 111.44 91.75 5.08 164.36 137.03 36.61
11 64.14 55.97 14.52 156.03 128.83 31.43
12 0.00 0.00 4.90 242.41 119.83 21.95
13 56.15 45.46 1.38 164.83 133.85 28.96
14 92.89 75.99 8.13 145.80 120.49 53.45
15 91.36 70.35 2.84 166.87 133.61 44.82
16 89.38 74.23 5.71 143.33 118.47 52.77
17 93.69 62.95 4.51 172.28 118.12 51.36
TRS: Total reducing sugar; D: Mass percentage in the distilled stream; and R: Mass percentage in the residue stream
In the distilled stream, central points presented are 91.48 g/L ± 2.16 g/L of LA,
69.18 g/L ± 5.73 g/L of TRS, and 4.35% ± 1.44% of D. For the residue stream, LA was
160.83 g/L ± 15.39 g/L, TRS was 123.40 g/L ± 8.84 g/L and R was 49.65% ± 4.24%. The
error of each central point was less than 10%. The only response with a higher variation
was D, which corresponded to 33% and was highly associated with the small amount of
mass in this stream that unfortunately maximized the error. In addition, the increased
temperature allowed the evaporation of higher portions of water to the light stream, and
consequently, the distillate stream became more viscous, hindering the material flow inside
the equipment, which made collecting the distillate stream more difficult and caused higher
variations in the mass percentage value. This problem could be solved in different ways,
such as:

PEER-REVIEWED ARTICLE bioresources.com
De Oliveira et al. (2018). “Lactic acid from fermentation,” BioResources 13(2), 2187-2203. 2193
Removal of TRS a prior to the HSP
Optimizations of the HSPE operational parameters in order to find a temperature
that no cause crystallization of the sugars;
Fermentation of all the sugars before goes to the HSPE process.
As is well known, HSPE is a process widely used in the petrochemical sector to
separate components of economic interest. The result is a set of compounds with very high
purity and high concentration, ready to be used. In the case of lactic acid, this approach
would be very interesting, especially for using this molecule in the medical sector. The
removal of sugars a priori or after HSPE implies the addition of one more step in the overall
process. However, the changes in the operational parameters for the optimization of the
lactic acid separation may result in a downstream process that uses fewer steps as possible,
and resulting in a product of very high purity and concentration, as needed for the medical
industry.
Distilled stream analysis
Statistical analyses were developed for the distilled stream for the responses: LA,
TRS, and D. The variable effects are shown in Table 4, considering a confidence level of
95%.
For LA, the statistically significant variables were: Tevap (linear and quadratic), Tcond
(linear and quadratic), FFR (linear), and the interactions between: Tevap and Tcond, Tevap and
FFR, and Tcond and FFR (Table 4). The Tevap was the variable of highest effect. Table 3
shows that the higher LA concentrations were obtained in the residue stream, which means
that the best operation condition for LA concentration was to minimize the amount of LA
in the distillate stream.
A regression model for LA concentration in the distillate stream is given in Eq. 7:
LA = 90.3445+50.3935X1–5.8251X12–14.5609X2–
34.2027X22+17.4655X3+11.8390X1X2–23.6454X1X3+29.0857X2X3 (7)
In Eq. 7, the variables X1, X2, and X3 represent the coded values of Tevap, Tcond, and FFR,
respectively. The ANOVA for LA concentration is given in Table 5. For Eq. 7, the F9,7
calculated (4.04) was higher than F9,7 tabulated (3.68) at the 95% confidence level, which
showed that the model adequately explained the experimental data variation. However, F5,2
calculated (139.59) was higher than F5,2 tabulated (19.30) indicating that the model cannot
be used to make predictions. Observing Eq. 7, the Tevap should be the absolute minimum
value to minimize the LA concentration on the distilled stream, and the same should happen
with the FFR. However, the Tcond is a harder behaviour to predict and could be minimized
or elevated to the extreme of the studied values, to obtain a lower LA concentration.
Variable effects for the TRS concentration are presented in Table 4. It is possible
to see that: Tevap (linear), Tcond (quadratic), FFR (linear), and the interactions between: Tevap
and FFR, and Tcond and FFR, are statistically significant variables of the process. The Tevap
was the variable of highest effect, as well as the LA concentration.
The mathematical model for TRS concentration as a function of operating
conditions is given by Eq. 8, in which the variables X1, X2, and X3 represent coded values
of Tevap, Tcond, and FFR, respectively.
TRS = 68.2454+45.5120X1–22.7135X22+19.3158X3–25.8063X1X3+17.9875X2X3 (8)

PEER-REVIEWED ARTICLE bioresources.com
De Oliveira et al. (2018). “Lactic acid from fermentation,” BioResources 13(2), 2187-2203. 2194
Table 4. Estimated Effects on the Distilled and Residue Streams at 95%
Confidence Level
Distilled Stream Residue Stream
RC SE t(2) p RC SE t(2) p
Lactic Acid Concentration Lactic Acid Concentration
Mean 90.3445 1.2447 72.5824 0.0002 160.9173 8.8704 18.1409 0.0030
(1) Tevap (L) 50.3935 1.1691 43.1060 0.0005 1.9397 8.3313 0.2328 0.8376
Tevap (Q) -5.8251 1.2867 -4.5271 0.0455 -3.8227 9.1698 -0.4169 0.7173
(2) Tcond (L) -14.5609 1.1691 -12.4552 0.0064 2.1550 8.3313 0.2587 0.8201
Tcond (Q) -34.2027 1.2867 -26.5813 0.0014 26.5218 9.1698 2.8923 0.1016
(3) FFR (L) 17.4655 1.1691 14.9398 0.0045 -24.1603 8.3313 -2.9000 0.1012
FFR (Q) -4.1877 1.2867 -3.2546 0.0828 -4.5206 9.1698 -0.4930 0.6708
(1) * (2) 11.8390 1.5274 7.7508 0.0162 12.4078 10.8853 1.1399 0.3725
(1) * (3) -23.6454 1.5274 -15.4803 0.0041 26.3473 10.8853 2.4204 0.1366
(2) * (3) 29.0857 1.5274 19.0420 0.0027 18.3221 10.8853 1.6832 0.2344
TRS Concentration TRS Concentration
Mean 68.2454 3.3015 20.6713 0.0023 122.9943 5.0939 24.1452 0.0017
(1) Tevap (L) 45.5120 3.1008 14.6776 0.0046 11.0927 4.7843 2.3185 0.1463
Tevap (Q) -0.2067 3.4129 -0.0606 0.9572 7.5483 5.2658 1.4335 0.2881
(2) Tcond (L) -10.5181 3.1008 -3.3921 0.0770 -6.1592 4.7843 -1.2874 0.3268
Tcond (Q) -22.7135 3.4129 -6.6553 0.0218 3.4571 5.2658 0.6565 0.5789
(3) FFR (L) 19.3158 3.1008 6.2293 0.0248 -13.2477 4.7843 -2.7690 0.1094
FFR (Q) 0.4369 3.4129 0.1280 0.9098 5.4636 5.2658 1.0375 0.4085
(1) * (2) 3.7717 4.0514 0.9310 0.4501 -10.8922 6.2510 -1.7425 0.2236
(1) * (3) -25.8063 4.0514 -6.3698 0.0238 2.5952 6.2510 0.4152 0.7183
(2) * (3) 17.9875 4.0514 4.4399 0.0472 5.0200 6.2510 0.8031 0.5062
Mass Percentage Mass Percentage
Mean 0.0437 0.0083 5.2629 0.0343 0.4930 0.0244 20.1778 0.0024
(1) Tevap (L) 0.0141 0.0078 1.8142 0.2113 -0.1046 0.0229 -4.5578 0.0449
Tevap (Q) -0.0086 0.0086 -1.0058 0.4204 -0.0175 0.0253 -0.6910 0.5610
(2) Tcond (L) -0.0707 0.0078 -9.0729 0.0119 0.0135 0.0229 0.5869 0.6167
Tcond (Q) 0.0370 0.0086 4.3114 0.0498 -0.1385 0.0253 -5.4837 0.0317
(3) FFR (L) 0.0126 0.0078 1.6222 0.2462 0.1454 0.0229 6.3342 0.0240
FFR (Q) 0.0020 0.0086 0.2277 0.8410 -0.0359 0.0253 -1.4200 0.2915
(1) * (2) 0.0080 0.0102 0.7849 0.5147 0.0143 0.0300 0.4783 0.6796
(1) * (3) 0.0113 0.0102 1.1065 0.3838 0.0537 0.0300 1.7918 0.2150
(2) * (3) 0.0198 0.0102 1.9441 0.1913 -0.0763 0.0300 -2.5453 0.1259
RC: Regression coefficient; SE: standard error; L: Linear constant; and Q: Quadratic constant

PEER-REVIEWED ARTICLE bioresources.com
De Oliveira et al. (2018). “Lactic acid from fermentation,” BioResources 13(2), 2187-2203. 2195
Table 5. ANOVA of Distilled and Residue Streams at 95% Confidence Level
Source of Variation
Sum of Squares
Degrees of Freedom
Mean Square
Fcalculated Ftabulated
Distilled
Lactic Acid Concentration
Regression 16959.260697 9 1884.362300 4.04 F9,7 = 3.68
Residues 3265.993440 7 466.570491 139.59 F5,2 = 19.30
Lack of fit 3256.661047 5 651.332209
Non-predictive Model Pure error 9.332393 2 4.666197
Total 20225.254137 16
TRS Concentration
Regression 12420.101311 9 1380.011257 3.96 F9,7 = 3.68
Residues 2436.700696 7 348.100099 14.45 F5,2 = 19.30
Lack of fit 2371.046444 5 474.209289
Predictive Model Pure error 65.654251 2 32.827126
Total 14856.802007 16
Mass Percentage
Regression 0.024553 9 0.002728 5.57 F9,7 = 3.68
Residues 0.003427 7 0.000490 2.91 F5,2 = 19.30
Lack of fit 0.003013 5 0.000603
Predictive Model Pure error 0.000415 2 0.000207
Total 0.027980 16
Residue
Mass Percentage
Regression 0.183709 9 0.020412 5.32 F9,7 = 3.68
Residues 0.026692 7 0.003813 2.57 F5,2 = 19.30
Lack of fit 0.023096 5 0.004619
Predictive Model Pure error 0.003596 2 0.001798
Total 0.210401 16
The model adequacy was analyzed by an ANOVA, obtaining a correlation
coefficient of 0.9956. The ANOVA data for TRS concentration are presented in Table 5.
The model constructed was considered predictive according to the F-test (Table 5). The
F9,7 calculated (3.96) was higher than F9,7 tabulated (3.68) at a 95% confidence level, which
shows that the model adequately explains the experimental data variation. The F5,2
calculated (14.95) was lower than F5,2 tabulated (19.30), indicating that the model can be
used to make predictions. Using the model (Eq. 8), it was possible to obtain the response
surface in the distilled stream in functions of Tcond and Tevap (Fig. 1a), FFR and Tevap (Fig.
1b), and FFR and Tcond (Fig. 1c).

PEER-REVIEWED ARTICLE bioresources.com
De Oliveira et al. (2018). “Lactic acid from fermentation,” BioResources 13(2), 2187-2203. 2196
Fig. 1. Response surface for TRS in the distilled stream as function of: a) Tcond and Tevap; b) FFR and Tevap; and c) FFR and Tcond
To keep the TRS in the highest possible concentration in the distilled stream, Fig.
1 shows that Tevap and FFR should be high (153.6 °C and 21.7 mL/min), and the Tcond
should be an intermediate temperature (13.0 °C). This combination would allow the
distilled stream to have the highest possible TRS concentration, which is quite desirable to
separate the LA in the residue stream. In this case, it is important to highlight that the feed
stream used here had a high sugar concentration to allow the analysis of the behaviour of
these compounds during the process. As demonstrated by Komesu et al. (2014b), the
composition of a real fermented broth has an influence on the process, when compared to
the results of a synthetic LA solution (Komesu et al. 2013). Using the synthetic media, the
authors achieved only a lower lactic acid concentration than that using a fermented broth
from molasses. This was attributed to the main difference between the solutions of the
presence of sugars in the fermented broth. But in general, this fact can be also be associated
to the synergistic effects of the components from the fermentation, such as sugars, salts,
proteins, and other organic compounds. In fact, the residual sugars in the feed stream
represent an important challenge in the separation process. Depending on the evaporator
temperature, the sugars can be caramelized and, in this case, accumulating them inside the
equipment. It causes a loss of mass from the feed flow and thus creates an operational
problem.
PEER-REVIEWED ARTICLE bioresources.com
De Oliveira et al. (2018). “Lactic acid from fermentation,” BioResources 13(2), 2187-2203. 2197
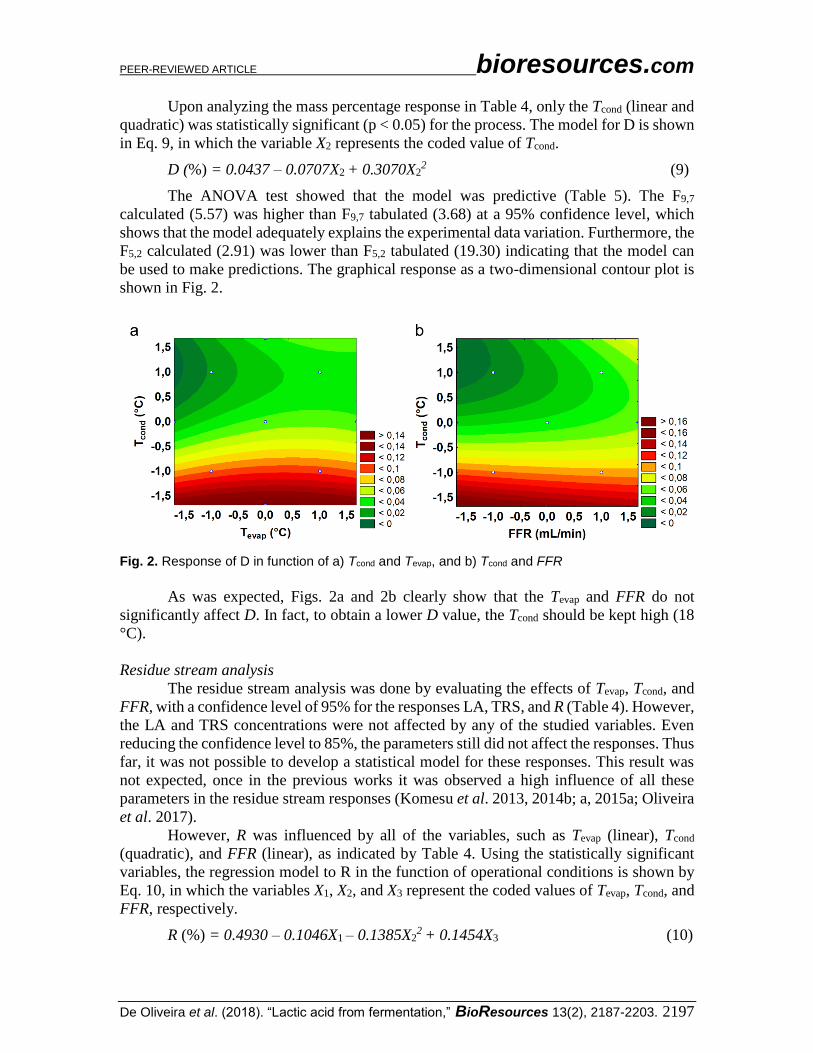
Upon analyzing the mass percentage response in Table 4, only the Tcond (linear and
quadratic) was statistically significant (p < 0.05) for the process. The model for D is shown
in Eq. 9, in which the variable X2 represents the coded value of Tcond.
D (%) = 0.0437 – 0.0707X2 + 0.3070X22 (9)
The ANOVA test showed that the model was predictive (Table 5). The F9,7
calculated (5.57) was higher than F9,7 tabulated (3.68) at a 95% confidence level, which
shows that the model adequately explains the experimental data variation. Furthermore, the
F5,2 calculated (2.91) was lower than F5,2 tabulated (19.30) indicating that the model can
be used to make predictions. The graphical response as a two-dimensional contour plot is
shown in Fig. 2.
Fig. 2. Response of D in function of a) Tcond and Tevap, and b) Tcond and FFR
As was expected, Figs. 2a and 2b clearly show that the Tevap and FFR do not
significantly affect D. In fact, to obtain a lower D value, the Tcond should be kept high (18
°C).
Residue stream analysis
The residue stream analysis was done by evaluating the effects of Tevap, Tcond, and
FFR, with a confidence level of 95% for the responses LA, TRS, and R (Table 4). However,
the LA and TRS concentrations were not affected by any of the studied variables. Even
reducing the confidence level to 85%, the parameters still did not affect the responses. Thus
far, it was not possible to develop a statistical model for these responses. This result was
not expected, once in the previous works it was observed a high influence of all these
parameters in the residue stream responses (Komesu et al. 2013, 2014b; a, 2015a; Oliveira
et al. 2017).
However, R was influenced by all of the variables, such as Tevap (linear), Tcond
(quadratic), and FFR (linear), as indicated by Table 4. Using the statistically significant
variables, the regression model to R in the function of operational conditions is shown by
Eq. 10, in which the variables X1, X2, and X3 represent the coded values of Tevap, Tcond, and
FFR, respectively.
R (%) = 0.4930 – 0.1046X1 – 0.1385X22 + 0.1454X3 (10)

PEER-REVIEWED ARTICLE bioresources.com
De Oliveira et al. (2018). “Lactic acid from fermentation,” BioResources 13(2), 2187-2203. 2198
The F9,7 calculated (5.35) was higher than F9,7 tabulated (3.68) at a 95% confidence
level, which shows that the model adequately explained the experimental data variation.
The F5,2 calculated (2.57) was lower than F5,2 tabulated (19.30) indicating that the model
can be used to make predictions. Based on the model, Fig. 3 represents the relationship
between the dependent and independent variables in three-dimensional response surfaces.
The model explains 98.28% of the data variation. In this case, to obtain a higher percentage
of mass in the residue stream, the Tcond should in the middle (13.0 °C), Tevap should be low
(86.4 °C), and FFR should be high (21.7 mL/min).
Fig. 3. Response surface for R as a function of: a) Tcond and Tevap, b) FFR and Tevap, and c) FFR and Tcond
General Analysis The main goal of the process studied was to obtain richer LA fractions. In this study,
it was achieved in the residue stream. The residue and distilled streams contained mainly
LA, but TRS were present in high concentrations in both streams. For the distilled stream,
the lowest LA concentration obtained was 32.9 g/L in run 9. In this case, the TRS content
was 27.9 g/L, which represents almost 85% of the LA concentration.
The highest concentration of LA was found on the residue stream from run 1 (247.7
g/L), which also contained approximately 57% of TRS compared to the LA concentration.
However, in run 12 (242.4 g/L), LA was concentrated 2.5 times compared to the input
stream (96.7 g/L). The TRS was concentrated at 1.38 times compared to the input stream,
representing less than 50% of the LA concentration. This denotes the lowest amount of
TRS related to the LA concentration for the residue stream. As it is well known, for most
of LA applications, the presence of TRS are undesirable, which makes the concentration

PEER-REVIEWED ARTICLE bioresources.com
De Oliveira et al. (2018). “Lactic acid from fermentation,” BioResources 13(2), 2187-2203. 2199
of LA in run 12 of the residue stream more advantageous, when compared with the other
runs. Run 12 also obtained one of the lowest mass percentages. In the distilled stream, the
same run presented no LA and TRS, with approximately 5% of the residue mass. This
observation makes the conditions used in this run the best for achieving a high LA
concentration with lower TRS content. The optimum conditions for this run were: Tevap and
FFR in the middle range (120 °C and 15 mL/min), and a high Tcond (18 °C).
The results obtained in this work were quite different from those obtained in
previous studies. The main difference between these studies was the feed composition
stream used in the separation process. In previous studies (Komesu et al. 2013, 2014a,b,
2015a,b), the authors’ research group has studied the LA concentration using a
fermentation broth composed by 5% (w/w) of LA containing a minimal amount of residual
sugar in the HSPE. In this work, the fermentation broth used had high LA (approximately
100 g/L) and TRS (approximately 85 g/L) concentrations. The results obtained in this work
showed that high sugar concentration had a crucial role in terms of separation behaviour
and operational difficulties. Komesu et al. (2014b) found the maximum LA concentration
in the residue stream, as well as in this work, keeping the same operational parameters.
However, the feed stream was composed mainly of 5% (w/w) of LA, focusing on a study
in which the sucrose from molasses had already been completely depleted. However, as it
is well known, just by varying the equipment parameters, it is possible to obtain completely
different results. This is clear from comparing another work from Komesu et al. (2015b),
which shows that just by changing the Tevap conditions, it was possible to attain a higher
lactic acid amount in the distilled stream, even using a similar feed stream from molasses
fermentation composed of 5% (w/w) LA.
The majority of previous studies used synthetic solutions for developing the models
when the fermentation broth was a more complex mixture. In fact, the presence of residual
sugar hardly affects the performance of the separation process and every single parameter
has to be re-adjusted in accordance with the sugar content.
As for each of the models developed, the parameters should be studied according
to different aims, and always with very specific feed streams. For example, to obtain:
• Higher TRS in the distilled stream: The evaporator temperature should be high
(153.6 °C), the internal condenser temperature should be an intermediate temperature (13
°C), and the feed flow rate should be high (21.7 mL/min);
• Lower mass percentage in the distilled stream: Internal condenser temperature
should be high (18 °C);
• Higher mass percentage in the distilled stream: Evaporator temperature should be
low (86.4 °C), internal condenser temperature should be an intermediate temperature (13
°C), and the feed flow rate should be high (21.7 mL/min).
• Lower lactic acid concentration in the distilled stream, to concentrate it in the
residue stream: Evaporator temperature and feed flow rate should be low (86.4 °C and 8.27
mL/min, respectively), and internal condenser temperature could be in the minimum or
maximum level (7.95 °C or 18 °C, respectively).
Based on the results obtained in this work, it can be concluded that carrying out the
lactic acid concentration by HSPE is advantageous because of the high operating pressure
(1000 Pa) compared to the literature which uses conventional molecular distillation. In
addition, the operating pressure is usually below 0.1 Pa and two or more steps of refining
are required (Komesu et al. 2014a). Moreover, many patents reported in the literature show
the industrial interest and potential of molecular distillation for lactic acid production
(Komesu et al. 2017).
PEER-REVIEWED ARTICLE bioresources.com
De Oliveira et al. (2018). “Lactic acid from fermentation,” BioResources 13(2), 2187-2203. 2200
CONCLUSIONS
1. The methodology used allowed an estimate of the parameters that matter for obtaining
a higher total reducing sugar (TRS) concentration in the distilled stream, which means
it may be possible to separate the sugars from organic acids using the hybrid short path
evaporation (HSPE) process.
2. Working with three operational variables, such as evaporator temperature, internal
condenser temperature, and feed flow rate, it was possible to obtain models for the mass
percentage, concentrations of the TRS and lactic acid in the distilled stream, and the
mass percentage in the residue stream. It was observed that the HSPE operational
parameters could change for different feed compositions.
3. It was observed that lactic concentration was influenced by internal condenser
temperature, evaporator temperature, and feed flow rate in the distilled stream.
4. The HSPE process is suitable and has advantages for lactic acid separation and
purification, such as being environmentally friendly, reduces the hazard of thermal
decomposition, and avoids the use of toxic solvents.
5. L. plantarum was effective in producing a high concentration of lactic acid (100.11
g/L) with a high conversion rate using molasses as a substrate (98%). In addition, the
productivity was also satisfactory (2.84 g L-1h-1).
ACKNOWLEDGMENTS
The authors are grateful for the financial support from the São Paulo Research
Foundation - FAPESP (Project No. 2013/26290-5).
REFERENCES CITED
Abdel-Rahman, M. A., Tashiro, Y., and Sonomoto, K. (2011). “Lactic acid production
from lignocellulose-derived sugars using lactic acid bacteria: Overview and limits,”
Journal of Biotechnology 156(4), 286-301. DOI: 10.1016/j.jbiotec.2011.06.017
Chen, L., Zeng, A., Dong, H., Li, Q., and Niu, C. (2012). “A novel process for recovery
and refining of L-lactic acid from fermentation broth,” Bioresource Technology 112,
280-284. DOI: 10.1016/j.biortech.2012.02.100
de Man, J. C., Rogosa, M., and Sharpe, M. E. (1960). “A medium for the cultivation of
Lactobacilli,” Journal of Applied Bacteriology 23(1), 130-135. DOI: 10.1111/j.1365-
2672.1960.tb00188.x
Dumbrepatil, A., Adsul, M., Chaudhari, S., Khire, J., and Gokhale, D. (2008).
“Utilization of molasses sugar for lactic acid production by Lactobacillus delbrueckii
subsp. delbrueckii Mutant Uc-3 in batch fermentation,” Applied and Environmental
Microbiology 74(1), 333-335. DOI: 10.1128/AEM.01595-07
Hauly, M. C. de O., Oliveira, A. R. de, and Oliveira, A. S. de (2003). “Produção de ácido
lático por Lactobacillus curvatus em melaço de cana-de-açúcar [Production of lactic
acid by Lactobacillus curvatus in sugarcane molasses],” Semina: Ciências Agrárias
24(1), 133. DOI: 10.5433/1679-0359.2003v24n1p133

PEER-REVIEWED ARTICLE bioresources.com
De Oliveira et al. (2018). “Lactic acid from fermentation,” BioResources 13(2), 2187-2203. 2201
Hu, J., Lin, Y., Zhang, Z., Xiang, T., Mei, Y., Zhao, S., Liang, Y., and Peng, N. (2016).
“High-titer lactic acid production by Lactobacillus pentosus FL0421 from corn stover
using fed-batch simultaneous saccharification and fermentation,” Bioresource
Technology 214, 74-80. DOI: 10.1016/j.biortech.2016.04.034
Joglekar, H. G., Rahman, I., Babu, S., Kulkarni, B. D., and Joshi, A. (2006).
“Comparative assessment of downstream processing options for lactic acid,”
Separation and Purification Technology 52(1), 1-17. DOI:
10.1016/j.seppur.2006.03.015
Juodeikiene, G., Vidmantiene, D., Basinskiene, L., Cernauskas, D., Bartkiene, E., and
Cizeikiene, D. (2015). “Green metrics for sustainability of biobased lactic acid from
starchy biomass vs chemical synthesis,” Catalysis Today 239, 11-16. DOI:
10.1016/j.cattod.2014.05.039
Komesu, A., Martinez, P. F. M., Lunelli, B. H., Filho, R. M., and Maciel, M. R. W.
(2015a). “Lactic acid purification by reactive distillation system using design of
experiments,” Chemical Engineering and Processing: Process Intensification 95, 26-
30. DOI: 10.1016/j.cep.2015.05.005
Komesu, A., Martins, P. F., Lunelli, B. H., Morita, A. T., de Coutinho, P. L. A., Filho, R.
M., and Maciel, M. R. W. (2013). “Lactic acid purification by hybrid short path
evaporation,” Chemical Engineering Transactions 32, 2017-2022. DOI:
10.3303/CET1332337
Komesu, A., Martins, P. F., Lunelli, B. H., Oliveira, J., Maciel Filho, R., and Wolf
Maciel, M. R. (2014a). “Evaluation of lactic acid purification from fermentation broth
by hybrid short path evaporation using factorial experimental design,” Separation and
Purification Technology 136, 233-240. DOI: 10.1016/j.seppur.2014.09.010
Komesu, A., Martins, P. F., Lunelli, B. H., Rocha, J. O., Maciel Filho, R., and Wolf
Maciel, M. R. (2015b). “The effect of evaporator temperature on lactic acid purity
and recovery by short path evaporation,” Separation Science and Technology 50(10),
1548-1553. DOI: 10.1080/01496395.2014.975363
Komesu, A., Martins, P. F., Oliveira, J., Lunelli, B. H., Maciel Filho, R., and Wolf
Maciel, M. R. (2014b). “Purification of lactic acid produced from sugarcane
molasses,” Chemical Engineering Transactions 37, 367-372. DOI:
10.3303/CET1437062
Komesu, A., Oliveira, J. A. R. de, Maciel, M. R. W., and Maciel Filho, R. (2016).
“Simulation of molecular distillation process for lactic acid,” Journal of Chemistry
and Chemical Engineering 10(5), 230-234. DOI: 10.17265/1934-7375/2016.05.005
Komesu, A., Wolf Maciel, M.R., Oliveira, J.A.R. de, Martins, L.H. da S., Maciel Filho,
R. (2017). “Purification of lactic acid produced by fermentation: Focus on non-
traditional distillation processes,” Separation and Purification Reviews 46(3), 241-
254. DOI:10.1080/15422119.2016.1260034.
Lin, W., Wu, F. W., Yue, L., Du, Q. G., Tian, L., and Wang, Z. X. (2014). “Combination
of urea complexation and molecular distillation to purify DHA and EPA from sardine
oil ethyl esters,” Journal of the American Oil Chemists’ Society 91(4), 687-695. DOI:
10.1007/s11746-013-2402-1

PEER-REVIEWED ARTICLE bioresources.com
De Oliveira et al. (2018). “Lactic acid from fermentation,” BioResources 13(2), 2187-2203. 2202
MAPA - Ministério da Agricultura, Pecuária e Abastecimento (2015). Brazilian
Sugarcane, Sugar and Ethanol Production, Ministério da Agricultura, Pecuária e
Abastecimento [Ministry of Agriculture, Livestock and Food Supply], Brasilia,
Brazil. Available at:
http://www.agricultura.gov.br/assuntos/sustentabilidade/agroenergia/arquivos-
precos/producao-brasileira-de-cana-de-acucar-acucar-e-etanol.pdf/view
Murakami, N., Oba, M., Iwamoto, M., Tashiro, Y., Noguchi, T., Bonkohara, K., Abdel-
Rahman, M. A., Zendo, T., Shimoda, M., Sakai, K., et al. (2016). “L-Lactic acid
production from glycerol coupled with acetic acid metabolism by Enterococcus
faecalis without carbon loss,” Journal of Bioscience and Bioengineering 121(1), 89-
95. DOI: 10.1016/j.jbiosc.2015.05.009
Nair, N. R., Nampoothiri, K. M., Banarjee, R., and Reddy, G. (2016). “Simultaneous
saccharification and fermentation (SSF) of jackfruit seed powder (JFSP) to L-lactic
acid and to polylactide polymer,” Bioresource Technology 213, 283-288. DOI:
10.1016/j.biortech.2016.03.020
Oliveira, R. A. de, Komesu, A., Vaz Rossell, C. E., Wolf Maciel, M. R., Maciel Filho, R.,
Vaz, C. E., Wolf Maciel, M. R., and Maciel Filho, R. (2017). “Hybrid short path
evaporation as an option to lactic acid recovery from fermentation broth,” Chemical
Engineering Transactions 57, 37-42. DOI: 10.3303/CET1757007
Oliveira, R. A. de, Maciel Filho, R., Rossell, C. E. V. (2016). “High lactic acid
production from molasses and hydrolysed sugarcane bagasse,” Chemical Engineering
Transactions 50, 307-312. DOI: 10.3303/CET1650052
Ou, M. S., Awasthi, D., Nieves, I., Wang, L., Erickson, J., Vermerris, W., Ingram, L. O.,
and Shanmugam, K. T. (2016). “Sweet sorghum juice and bagasse as feedstocks for
the production of optically pure lactic acid by native and engineered Bacillus
coagulans strains,” BioEnergy Research 9(1), 123-131. DOI: 10.1007/s12155-015-
9670-6
Pal, P., Sikder, J., Roy, S., and Giorno, L. (2009). “Process intensification in lactic acid
production: A review of membrane based processes,” Chemical Engineering and
Processing: Process Intensification 48(11–12), 1549-1559. DOI:
10.1016/j.cep.2009.09.003
Tang, J., Wang, X., Hu, Y., Zhang, Y., and Li, Y. (2016). “Lactic acid fermentation from
food waste with indigenous microbiota: Effects of pH, temperature and high OLR,”
Waste Management 52, 278-285. DOI: 10.1016/j.wasman.2016.03.034
Vanthoor-Koopmans, M., Wijffels, R. H., Barbosa, M. J., and Eppink, M. H. M. (2013).
“Biorefinery of microalgae for food and fuel,” Bioresource Technology 135, 142-149.
DOI: 10.1016/j.biortech.2012.10.135
Wang, Y., Chen, C., Cai, D., Wang, Z., Qin, P., and Tan, T. (2016). “The optimization of
L-lactic acid production from sweet sorghum juice by mixed fermentation of Bacillus
coagulans and Lactobacillus rhamnosus under unsterile conditions,” Bioresource
Technology 218, 1098-1105. DOI: 10.1016/j.biortech.2016.07.069
Wang, Z., Wu, Z., and Tan, T. (2013). “Studies on purification of 1,3-propanediol by
molecular distillation,” Biotechnology and Bioprocess Engineering 18(4), 697-702.
DOI: 10.1007/s12257-012-0804-9

PEER-REVIEWED ARTICLE bioresources.com
De Oliveira et al. (2018). “Lactic acid from fermentation,” BioResources 13(2), 2187-2203. 2203
Yu, J., Zeng, A., Yuan, X., Zhang, X., and Ju, J. (2015). “Optimizing and scale-up
strategy of molecular distillation for the purification of lactic acid from fermentation
broth,” Separation Science and Technology 50, 2518-2524. DOI:
10.1080/01496395.2015.1056363
Zhou, J., Ouyang, J., Xu, Q., and Zheng, Z. (2016). “Cost-effective simultaneous
saccharification and fermentation of L -lactic acid from bagasse sulfite pulp by
Bacillus coagulans CC17,” Bioresource Technology 222, 431-438. DOI:
10.1016/j.biortech.2016.09.119
Article submitted: October 5, 2017; Peer review completed: December 29, 2017; Revised
version received and accepted: January 30, 2018; Published: February 1, 2018.
DOI: 10.15376/biores.13.2.2187-2203