
Peaking China's CO2 Emissions: Trends and Mitigation Potential
22
WORKING PAPER | September 2015 | 1 WORKING PAPER CONTENTS 1. Introduction............................................................... 1 2. Comparison of Scenarios.......................................... 2 3. Understanding Peak Emissions ................................. 8 4. The Need for Deep Decarbonization .......................... 9 5. Early Peaking or Late Peaking: An Uncertainty Analysis.. 13 6. Conclusions and Policy Recommendations ............ 15 Annex | Models Surveyed in this Analysis ................ 18 Endnotes ..................................................................... 20 OCN Working Papers contain preliminary research, analysis, findings, and recommendations. They are circulated to stimulate timely discussion and critical feedback and to influence ongoing debate on emerging issues. Suggested Citation: National Center for Climate Strategy and International Cooperation of China, Tsinghua University Energy, Environment and Economy Institute, Open Climate Network, “Peaking China’s CO2 Emissions: Trends and Mitigation Potential.” Working Paper. Washington, DC: Open Climate Network. 1. INTRODUCTION The IPCC Fifth Assessment Report (IPCC AR5) states that, if the increase in global mean surface temperature is to have a likely chance of being limited to two degrees Celsius by 2100, the global “budget” left for CO 2 emissions is less than 1,778 Gt CO 2 . 1 This space will be exhausted in less than 30 years if global CO 2 emissions continue their current trend. China is both the largest developing country and the largest CO 2 emitter in the world. Low- carbon development has become an urgent need both domestically and internationally. China’s rapidly growing energy consumption and its coal-dominated energy mix create additional and serious environmental problems, including local air pollution and depletion of water resources, as well as the possibility of energy insecurity. In this context, China has made great strides in controlling carbon emissions 2 and has increasingly taken on a leadership role in tackling global climate change, while moving to a cleaner and more efficient low-carbon economy. As vice Premier Gaoli Zhang pointed out, responding to climate change is necessary if China is to achieve sustainable development at home and fulfill its international obligations as a responsible major country. 3 The 12th Five-Year-Plan (FYP) period (2011–15) marked a new era in China’s climate actions. The country incorporated binding energy- and carbon-intensity PEAKING CHINA’S CO 2 EMISSIONS: TRENDS AND MITIGATION POTENTIAL NATIONAL CENTER FOR CLIMATE STRATEGY AND INTERNATIONAL COOPERATION OF CHINA | Qiang Liu, Yi Chen, Chuan Tian and Xiaoqi Zheng TSINGHUA UNIVERSITY ENERGY, ENVIRONMENT AND ECONOMY INSTITUTE | Fei Teng, Alun Gu, Xi Yang and Xin Wang CONTRIBUTING AUTHORS | Emily Matthews (Independent Editor) and Ranping Song (World Resources Institute)
Transcript of Peaking China's CO2 Emissions: Trends and Mitigation Potential
WORKING PAPER | September 2015 | 1
WORKING PAPER
CONTENTS1. Introduction............................................................... 1
2. Comparison of Scenarios .......................................... 2
3. Understanding Peak Emissions ................................. 8
4. The Need for Deep Decarbonization .......................... 9
5. Early Peaking or Late Peaking: An Uncertainty Analysis ..13
6. Conclusions and Policy Recommendations ............ 15
Annex | Models Surveyed in this Analysis ................ 18
Endnotes ..................................................................... 20
OCN Working Papers contain preliminary research, analysis, findings, and recommendations. They are circulated to stimulate timely discussion and critical feedback and to influence ongoing debate on emerging issues.
Suggested Citation: National Center for Climate Strategy and International Cooperation of China, Tsinghua University Energy, Environment and Economy Institute, Open Climate Network, “Peaking China’s CO2 Emissions: Trends and Mitigation Potential.” Working Paper. Washington, DC: Open Climate Network.
1. INTRODUCTIONThe IPCC Fifth Assessment Report (IPCC AR5) states that, if the increase in global mean surface temperature is to have a likely chance of being limited to two degrees Celsius by 2100, the global “budget” left for CO2 emissions is less than 1,778 Gt CO2.1 This space will be exhausted in less than 30 years if global CO2 emissions continue their current trend. China is both the largest developing country and the largest CO2 emitter in the world. Low-carbon development has become an urgent need both domestically and internationally. China’s rapidly growing energy consumption and its coal-dominated energy mix create additional and serious environmental problems, including local air pollution and depletion of water resources, as well as the possibility of energy insecurity.
In this context, China has made great strides in controlling carbon emissions2 and has increasingly taken on a leadership role in tackling global climate change, while moving to a cleaner and more efficient low-carbon economy. As vice Premier Gaoli Zhang pointed out, responding to climate change is necessary if China is to achieve sustainable development at home and fulfill its international obligations as a responsible major country.3 The 12th Five-Year-Plan (FYP) period (2011–15) marked a new era in China’s climate actions. The country incorporated binding energy- and carbon-intensity
PEAKING CHINA’S CO2 EMISSIONS: TRENDS AND MITIGATION POTENTIALNATIONAL CENTER FOR CLIMATE STRATEGY AND INTERNATIONAL COOPERATION OF CHINA | Qiang Liu, Yi Chen, Chuan Tian and Xiaoqi Zheng TSINGHUA UNIVERSITY ENERGY, ENVIRONMENT AND ECONOMY INSTITUTE | Fei Teng, Alun Gu, Xi Yang and Xin Wang CONTRIBUTING AUTHORS | Emily Matthews (Independent Editor) and Ranping Song (World Resources Institute)
2 |
reduction targets, and non-fossil energy (nuclear, hydro, solar, wind, biomass, and geothermal) targets into China’s top economic and social development plan, marking the institutionalization of domestically enforceable climate-change policies. To achieve these targets, the government has developed and implemented a suite of plans and policy instruments, and is on track to beat its 2015 targets.4 By 2014, China had reduced its energy intensity and CO2 emissions intensity by 29.9 percent and 33.8 percent respectively, compared to 2005 levels.5
In 2014, China pledged to peak its CO2 emissions by around 2030, with the intention of trying to peak earlier, and to increase the proportion of non-fossil fuels in its primary energy consumption to about 20 percent in 2030.6 In 2015, China’s intended nationally determined contribution (INDC)7 echoed the peak year and CO2 intensity goals, and also put forward two additional goals for 2030: (1) reducing carbon intensity by 60 to 65 percent below 2005 levels and (2) increasing its forest carbon stock volume by around 4.5 billion cubic meters above 2005 levels.8
How might these goals be achieved? In order to understand how China might develop its economy while controlling CO2 emissions, this paper surveys a number of recent modeling scenarios that project the country’s economic growth, energy mix, and associated emissions for the coming decades.
In section 2, this paper first examines several “reference” scenarios. They project that China’s emissions will continue to increase and, by the target year of 2030, will have grown by anywhere between 21 percent and more than 100 percent. The paper then examines a number of “alternative” scenarios that assume the implementation of additional, more aggressive, policies. Eight out of 12 of these alternative scenarios project that CO2 emissions will peak or plateau between 2030 and 2040 and decline thereafter, while four scenarios project an emissions peak around 2020. The paper then provides a more detailed comparison of the scenarios, highlighting their results, and examining their underlying assumptions about key driving forces behind China’s development and how each of them can impact CO2 emissions.
Section 3 analyzes the interactions among these drivers that will determine how early, or late, the peak in emissions is likely to occur, at what level, and how steeply emissions will decline afterwards. Section 4 provides a
more in-depth analysis of one alternative scenario, to illustrate how a CO2 emissions peak could be achieved in 2030 and how CO2 emissions could be steeply reduced by 2050. This alternative scenario suggests that such a development path can be achieved through deep decarbonization of the economy and the use of advanced technologies to enable major efficiency gains, particularly in the industry, transport, and construction sectors.
Section 5 presents an uncertainty analysis of the factors that are likely to influence the timing of China’s CO2 emissions peak. Section 6 provides a summary of conclusions based on the scenario analysis and makes recommendations on policy actions that will be important to achieve deep decarbonization of China’s economy.
2. COMPARISON OF SCENARIOSThis section of the report surveys energy- and emissions-modeling scenarios for China from 12 recent representative studies.9 Most of these studies were published after 2010 and they reflect the most recent projections made by the relevant research teams.
It is difficult to make comparisons across models because of their different methodologies, macro-economic drivers, embedded assumptions, parameters within models, and different storylines assigned by the modelers. Nevertheless, it is still valuable to interpret the impacts of different social and economic assumptions on China’s long-term energy transition and shifts in the energy mix. Despite the differences among scenarios, the results still provide reasonable indications of China’s possible emissions pathways. The information presented here can provide a useful input for policymakers in China as they confront energy-related decision-making in the coming decades, and for international audiences as they seek to understand the implications of China’s climate commitments and policies.
The literature on energy and climate modeling includes three broad categories of scenarios. The first category is the so-called “no new policy scenario,” which includes energy or climate policies implemented before a base year or “cut-off year” (for example, 2010); assumes that no new policies will be adopted after the base year; and projects the emission trends that can be expected under these assumptions. The second category is the “current policy scenario,” which projects emissions under currently implemented and planned policies. (Planned policies

Peaking China’s CO2 Emissions: Trends and Mitigation Potential
WORKING PAPER | September 2015 | 3
are those policies and measures that have not yet been implemented at the time of the base year but have been included in well-established policy proposals.) The third category is the “alternative scenario,” which might not be based on current or planned policies, but instead assumes the adoption of breakthrough technologies, and innovative policy and behavior change. Alternative scenarios are based on technologies, policies, and measures that encourage a shift in the patterns of both energy consumption and CO2 emissions away from past trends. Alternative scenarios are based on predetermined storylines, such as strong carbon pricing or adherence to low carbon-development pathways.
In this paper, we combine a number of “no new policy scenarios” with “current policy scenarios” to form the category “reference scenarios.” The rationale is that it is difficult to separate the first two categories based on information contained in the literature. The existing literature is often not clear on which policies have been considered in the scenarios and which have not, and the stage of policy implementation is often also unclear. Thus, in this section, we focus our analysis on two categories only: reference scenarios and alternative scenarios.10
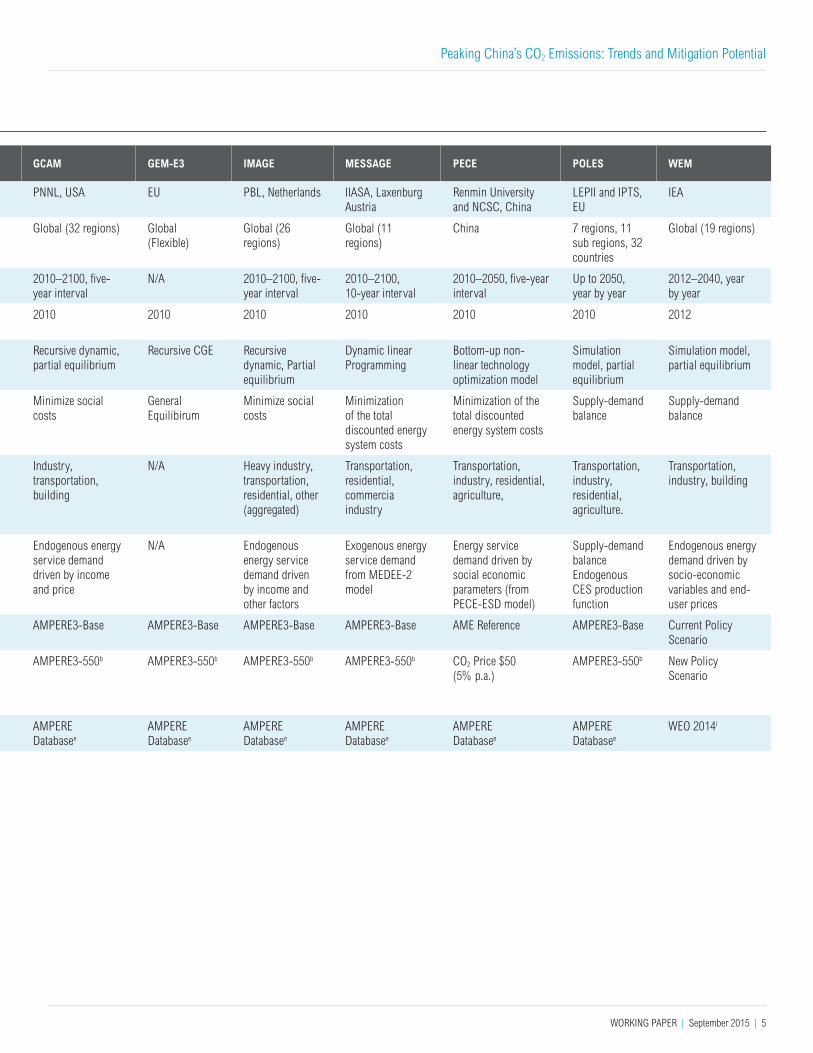
Table 1 summarizes the major features of the various models surveyed in this report. Additional information is provided in Annex A.
2.1 CO2 Emissions: Reference ScenariosFigure 1 shows the range of projected CO2 emissions under the “Reference Scenarios” that were collated for this paper.
For year 2030, all reference scenarios project a continuously increasing trend of China’s emissions relative to the 2010 level, although the increase factor differs across models. The lowest estimate is from AIM-Enduse, which projects a 21 percent increase by 2030; the highest is from GCAM 3.0, which projects a 119 percent increase in year 2030. Three Chinese models (China-MARKAL, PECE and ERI) project emissions increases that range from 68 to 74 percent above levels in 2010; this is very close to the median value of 77 percent among all scenarios surveyed. In terms of absolute emissions in year 2030, the models project a range from 9.6 Gt CO2 to 17 Gt CO2, with a median of 14.6 Gt CO2.
Figure 1 | China’s CO2 Emissions, 2010–2050, Projected By Reference Scenarios (Projected CO2 emissions from fossil fuel and industrial processes)
GtC
O2/
yr
2010 2020 2030 2040 2050
5
10
15
20 GCAM 3.0
POLES AMPERE
GEM-E3-ICCS
DNE21 V.12
MESSAGE V.4
PECE 2
IMAGE 2.4
China MARKAL/TIMES
WEM
AIM-Enduse 12.1
ERI
Sources: See Table 1 for data sources for each scenario.

4 |
MODEL AIM-ENDUSE CHINA-MARKAL DNE-21 DDPP ERI-3E GCAM GEM-E3 IMAGE MESSAGE PECE POLES WEM
DEVELOPERNIES, Japan Tsinghua University, China RITE, Japan NCSC and Tsinghua
University, ChinaERI, China PNNL, USA EU PBL, Netherlands IIASA, Laxenburg
AustriaRenmin University and NCSC, China
LEPII and IPTS, EU
IEA
REGION COVERAGEGlobal (32 regions) National Global (10 regions) China China Global (32 regions) Global
(Flexible)Global (26 regions)
Global (11 regions)
China 7 regions, 11 sub regions, 32 countries
Global (19 regions)
TIME HORIZON2010–2050 2010–2050 2010–2100 2010–2050 2010–2050 2010–2100, five-
year intervalN/A 2010–2100, five-
year interval2010–2100, 10-year interval
2010–2050, five-year interval
Up to 2050, year by year
2012–2040, year by year
BASE YEAR2010 2010 2010 2010 2010 2010 2010 2010 2010 2010 2010 2012
MODEL CLASSRecursive dynamic, partial equilibrium
Recursive dynamic, partial equilibrium
Dynamic non-linear optimization
Bottom-up non-linear technology optimization model
Unknown Recursive dynamic, partial equilibrium
Recursive CGE Recursive dynamic, Partial equilibrium
Dynamic linear Programming
Bottom-up non-linear technology optimization model
Simulation model, partial equilibrium
Simulation model, partial equilibrium
OBJECTIVE FUNCTION
Minimize annual cost
Minimize annual cost Cost minimization Supply-demand balance
Meet both development and environmental needs by cutting coal consumption
Minimize social costs
General Equilibirum
Minimize social costs
Minimization of the total discounted energy system costs
Minimization of the total discounted energy system costs
Supply-demand balance
Supply-demand balance
END-USE SECTORS
Agriculture, transportation, rural, urban, commercial, industry
Industry, transportation, urban/rural residential, commercial
Demand including gaseous fuel, liquid fuel, solid fuel and electricity
Transportation, industry, building,agriculture,
Urban/rural residential, commercial, industry, transportation
Industry, transportation, building
N/A Heavy industry, transportation, residential, other (aggregated)
Transportation, residential, commercia industry
Transportation, industry, residential, agriculture,
Transportation, industry, residential, agriculture.
Transportation, industry, building
DEMANDS
Exogenous energy service demand by social economic parameters
Exogenously provided by Energy Service Demand Projection Model or endogenously driven by energy service marginal prices
Exogenously provided by historical data and IPCC SRES B2
Endogenous energy demand driven by social-economic parameters
Economic values transferred into product and service demand by STOCK model
Endogenous energy service demand driven by income and price
N/A Endogenous energy service demand driven by income and other factors
Exogenous energy service demand from MEDEE-2 model
Energy service demand driven by social economic parameters (from PECE-ESD model)
Supply-demand balanceEndogenous CES production function
Endogenous energy demand driven by socio-economic variables and end-user prices
NAME OF SELECTED REFERENCE SCENARIO
EMF27-Base-FullTech
ROSECREF AMPERE3-Base N/A Reference Scenario AMPERE3-Base AMPERE3-Base AMPERE3-Base AMPERE3-Base AME Reference AMPERE3-Base Current Policy Scenario
NAME OF SELECTED ALTERNATIVE SCENARIO
EMF27-550-FullTech
ROSE 45-40-40 AMPERE3-550b China Deep Decarbonization Scenario (only one scenario)
Coal Cap Policy Scenario
AMPERE3-550b AMPERE3-550b AMPERE3-550b AMPERE3-550b CO2 Price $50 (5% p.a.)
AMPERE3-550b New Policy Scenario
DATA SOURCEEMF27 Databasec RoSE Databased AMPERE
Databasee
AMPERE Databasee
China Coal Cap Study Projecth
AMPERE Databasee
AMPERE Databasee
AMPERE Databasee
AMPERE Databasee
AMPERE Databasee
AMPERE Databasee
WEO 2014i
Table 1 | Major Features of Models Surveyed in this Studya
a Scenarios developed by the MIT-Tsinghua China Energy and Climate Project and the New Climate Economy Project are not included in this study because they are developed by the same team with DDPP with quite similar results. The aim of scenario comparison is to compare views from various modeling groups.Therefore, the two scenarios are excluded to maintain the balance.
b Scenarios with the name “AMPERE3-550” are not 550 ppm scenarios for China, because the policy effort represented in this scenario is stronger than in the European Union or the United States. See section 2.3.
c International Institute for Applied Systems Analysis, EMF27 Database, 2012.Available at: https://secure.iiasa.ac.at/web-apps/ene/EMF27DB.d Unpublished data from the Roadmaps towards Sustainable Energy futures (RoSE) project. Data were acquired and analyzed by the authors. More information about Rose can be found at: http://www.rose-project.org/.
e International Institute for Applied Systems Analysis, AMPERE Database, 2014. Available at: https://tntcat.iiasa.ac.at/AMPEREDB/.h Unpublished data from the China Coal Cap Project. Data were acquired and analyzed by authors. More information about China Coal Cap project can be found at: http://www.nrdc.cn/coalcap/index.php/Index/index.
i International Energy Agency, 2014. World Energy Outlook 2014.
Peaking China’s CO2 Emissions: Trends and Mitigation Potential
WORKING PAPER | September 2015 | 5
MODEL AIM-ENDUSE CHINA-MARKAL DNE-21 DDPP ERI-3E GCAM GEM-E3 IMAGE MESSAGE PECE POLES WEM
DEVELOPERNIES, Japan Tsinghua University, China RITE, Japan NCSC and Tsinghua
University, ChinaERI, China PNNL, USA EU PBL, Netherlands IIASA, Laxenburg
AustriaRenmin University and NCSC, China
LEPII and IPTS, EU
IEA
REGION COVERAGEGlobal (32 regions) National Global (10 regions) China China Global (32 regions) Global
(Flexible)Global (26 regions)
Global (11 regions)
China 7 regions, 11 sub regions, 32 countries
Global (19 regions)
TIME HORIZON2010–2050 2010–2050 2010–2100 2010–2050 2010–2050 2010–2100, five-
year intervalN/A 2010–2100, five-
year interval2010–2100, 10-year interval
2010–2050, five-year interval
Up to 2050, year by year
2012–2040, year by year
BASE YEAR2010 2010 2010 2010 2010 2010 2010 2010 2010 2010 2010 2012
MODEL CLASSRecursive dynamic, partial equilibrium
Recursive dynamic, partial equilibrium
Dynamic non-linear optimization
Bottom-up non-linear technology optimization model
Unknown Recursive dynamic, partial equilibrium
Recursive CGE Recursive dynamic, Partial equilibrium
Dynamic linear Programming
Bottom-up non-linear technology optimization model
Simulation model, partial equilibrium
Simulation model, partial equilibrium
OBJECTIVE FUNCTION
Minimize annual cost
Minimize annual cost Cost minimization Supply-demand balance
Meet both development and environmental needs by cutting coal consumption
Minimize social costs
General Equilibirum
Minimize social costs
Minimization of the total discounted energy system costs
Minimization of the total discounted energy system costs
Supply-demand balance
Supply-demand balance
END-USE SECTORS
Agriculture, transportation, rural, urban, commercial, industry
Industry, transportation, urban/rural residential, commercial
Demand including gaseous fuel, liquid fuel, solid fuel and electricity
Transportation, industry, building,agriculture,
Urban/rural residential, commercial, industry, transportation
Industry, transportation, building
N/A Heavy industry, transportation, residential, other (aggregated)
Transportation, residential, commercia industry
Transportation, industry, residential, agriculture,
Transportation, industry, residential, agriculture.
Transportation, industry, building
DEMANDS
Exogenous energy service demand by social economic parameters
Exogenously provided by Energy Service Demand Projection Model or endogenously driven by energy service marginal prices
Exogenously provided by historical data and IPCC SRES B2
Endogenous energy demand driven by social-economic parameters
Economic values transferred into product and service demand by STOCK model
Endogenous energy service demand driven by income and price
N/A Endogenous energy service demand driven by income and other factors
Exogenous energy service demand from MEDEE-2 model
Energy service demand driven by social economic parameters (from PECE-ESD model)
Supply-demand balanceEndogenous CES production function
Endogenous energy demand driven by socio-economic variables and end-user prices
NAME OF SELECTED REFERENCE SCENARIO
EMF27-Base-FullTech
ROSECREF AMPERE3-Base N/A Reference Scenario AMPERE3-Base AMPERE3-Base AMPERE3-Base AMPERE3-Base AME Reference AMPERE3-Base Current Policy Scenario
NAME OF SELECTED ALTERNATIVE SCENARIO
EMF27-550-FullTech
ROSE 45-40-40 AMPERE3-550b China Deep Decarbonization Scenario (only one scenario)
Coal Cap Policy Scenario
AMPERE3-550b AMPERE3-550b AMPERE3-550b AMPERE3-550b CO2 Price $50 (5% p.a.)
AMPERE3-550b New Policy Scenario
DATA SOURCEEMF27 Databasec RoSE Databased AMPERE
Databasee
AMPERE Databasee
China Coal Cap Study Projecth
AMPERE Databasee
AMPERE Databasee
AMPERE Databasee
AMPERE Databasee
AMPERE Databasee
AMPERE Databasee
WEO 2014i
Table 1 | Major Features of Models Surveyed in this Studya

6 |
For year 2050, the reference scenarios project that emissions will increase by a factor between 59 percent and 153 percent, relative to the 2010 level, with a median value of 101 percent. That is, emissions in year 2050 are forecast to be approximately double the emissions level of 2010. In terms of absolute emissions, the models project a range from 12.7 Gt CO2 to 19.3 Gt CO2 with the median value being 15.7 Gt CO2.
2.2 CO2 Emissions: Alternative ScenariosMany alternative scenarios have been designed and reported, using various energy modeling platform comparison exercises, for example, AMPERE, EMF, AMF, and ROSE. Most of these scenarios have been designed to achieve a given global emissions goal. In these cases, a specific country’s emissions path is determined by the global emissions budget and the principle of budget
allocation among countries, rather than being determined by countries’ policies.
To enable emissions analysis based on policy strength, the current study uses carbon price as a proxy variable to select scenarios with comparable policy strength. In this study, the carbon price proxy is set at USD7–USD10 in 2020 and then roughly doubled every ten years until 2040. The 2020 carbon price proxy is set at this level because, under such an assumption, the sectors that account for about four percent of China’s GDP would be heavily affected, producing a comparable effect to that of the EU case under the 20 euro carbon price,11 indicating strong policy effort.
Figure 2 shows the range of projected emissions under the “Alternative Scenarios” selected from the literature.
Figure 2 | China’s CO2 Emissions, 2010–2050, Projected by Alternative Scenarios (Projected CO2 emissions from fossil fuel and industry process)
GtC
O2/
yr
10
5
0
15
20
2010 2020 2030 2040 2050
GCAM 3.0
POLES AMPERE
GEM-E3-ICCS
DNE21 V.12
MESSAGE V.4
PECE 2
IMAGE 2.4
China MARKAL/TIMES
WEM
AIM-Enduse 12.1
ERI
DDPP
Sources: See Table 1 for data sources for each scenario.
Peaking China’s CO2 Emissions: Trends and Mitigation Potential
WORKING PAPER | September 2015 | 7
For year 2030, the models’ projected emissions range from 8.1 Gt CO2 (AIM-Enduse) to 13.7 Gt CO2 (GCAM3.0), with a median of 10.3 Gt CO2. Compared with emissions in 2010, the models project a median increase of 38 percent, which is significantly lower than the projected increase under the reference scenarios.
Between 2010 and 2050, the models’ projected emissions range from a decrease of 40 percent (AIM-Enduse) to an increase of 44 percent (GCAM3.0), with a median decrease of three percent. In terms of absolute emissions, the models project a range from 4.7 Gt CO2 (AIM-Enduse) to 11 Gt CO2 (GCAM3.0) with a median of 7.4 Gt CO2.
2.3 Peak Years and Levels of CO2 EmissionsAs Figure 1 demonstrated, most models project that emissions under reference scenarios will continue to increase through 2050, though three models project peaking around 2040 (IMAGE, DNE21, and ERI). For models that project a peak in 2040, the peaking levels range from 12.2 GtCO2 (ERI) to 17 GtCO2 (DNE21), with a median of 15.5 GtCO2.
The average annual growth rate (AAGR) of emissions across all reference scenarios is 4.4 percent from 2010 to 2020, 2.1 percent from 2020 to 2030, 0.6 percent from 2030 to 2040, and 0.1 percent from 2040 to 2050.
Figure 2 shows that the majority of the alternative scenarios envisage a CO2 peak in 2030, while four models (AIM-Enduse, GEM-E3, Poles and ERI) project a peak in 2020 and one model (GCAM3.0) projects a peak as late as 2040. The peaking levels range from 8.4 GtCO2 (AIM-Enduse) to 13.7 GtCO2 (GCAM), with a median value of 10.3 GtCO2.
The AAGR of emissions across all alternative scenarios is 2.8 percent from 2010 to 2020, 0.12 percent from 2020 to 2030, -0.7 percent from 2030 to 2040 and -2.4 percent from 2040 to 2050.12 The alternative scenarios thus seem to suggest that China’s emissions will plateau between 2020 and 2030, at the relatively lower median AAGR of 0.12 percent, and nine out of 12 scenarios show an AAGR of less than 0.8 percent.
The exact year in which CO2 emissions will peak will be heavily influenced by the fluctuation of macroeconomic parameters (notably GDP, see Section 3.2 and Section 5). Policy attention, therefore, might more productively focus on the total cumulative emissions that might be expected over the coming decades.
2.4 Cumulative Levels of CO2 EmissionsThe recent IPCC AR5 report and other scientific publications have made clear the strong relationship between cumulative CO2 emissions and global temperature increase. This highlights the importance of examining cumulative CO2 emissions under a range of scenarios. According to the IPCC AR5, to maintain a likely chance of limiting the mean global temperature increase to 2°C above preindustrial levels, the “emissions budget” should not exceed 3,666 GtCO2. As of 2011, the world had already emitted roughly 1,888 GtCO2.13 Thus, a global budget of about 1,778 GtCO2 remains for all GHG emissions from 2012 onward.
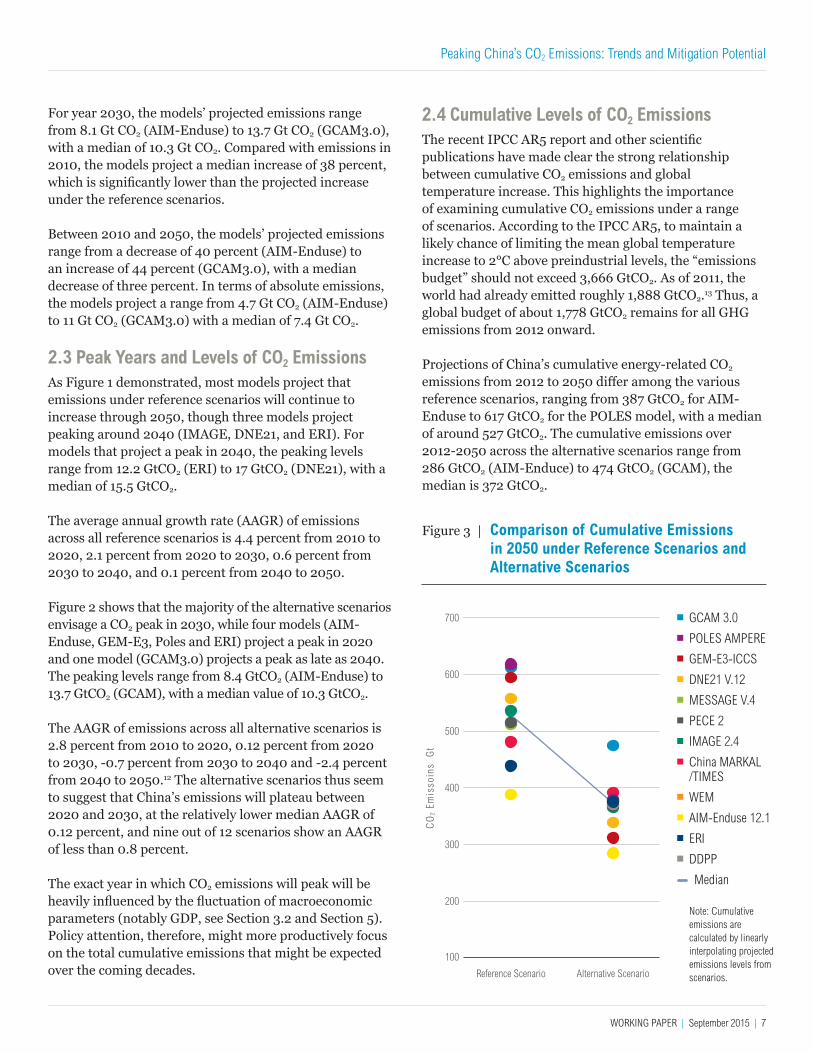
Projections of China’s cumulative energy-related CO2 emissions from 2012 to 2050 differ among the various reference scenarios, ranging from 387 GtCO2 for AIM-Enduse to 617 GtCO2 for the POLES model, with a median of around 527 GtCO2. The cumulative emissions over 2012-2050 across the alternative scenarios range from 286 GtCO2 (AIM-Enduce) to 474 GtCO2 (GCAM), the median is 372 GtCO2.
Figure 3 | Comparison of Cumulative Emissions in 2050 under Reference Scenarios and Alternative Scenarios
CO
2 Em
isso
ins
Gt
100
Reference Scenario Alternative Scenario
700
600
500
400
300
200
GCAM 3.0
POLES AMPERE
GEM-E3-ICCS
DNE21 V.12
MESSAGE V.4
PECE 2
IMAGE 2.4
China MARKAL /TIMES
WEM
AIM-Enduse 12.1
ERI
DDPP
Median
Note: Cumulative emissions are calculated by linearly interpolating projected emissions levels from scenarios.
8 |
3. UNDERSTANDING PEAK EMISSIONSScenarios are useful tools for understanding the dynamics of Chinese emissions and preparing for a long-term economic and energy transformation. However, this paper has already demonstrated the wide diversity of projected emissions paths for China, even within the same broad category (such as reference scenarios or alternative scenarios). Before we can gain more valuable insights from these scenarios, it is important to understand why they are so different.
In this analysis, we use a decomposition analysis framework to compare emissions scenarios across models and allow us to better understand the driving forces that largely determine cumulative CO2 emissions and therefore the timing and level of a CO2 emissions peak. The framework is explained in more detail in Box 1.
3.1 Key Driving Forces Impacting the Timing of Peak EmissionsAs presented in Box 1, the four major drivers of emissions are population growth, GDP growth, energy consumption, and the average emissions factor of the energy mix.14 The growth of population and GDP will drive the emissions increase, and the improvements in energy intensity and energy mix will offset the upward trend. The peaking of emissions—or the dynamics of change of emissions—can therefore be presented as the relationship among these driving factors, as follows.
The interrelationship between the decline rate of carbon intensity of GDP and GDP growth rate. One necessary condition for CO2 emissions to peak is that the annual decline rate of CO2 intensity of GDP should be larger than the annual growth rate of GDP.
The interrelationship between the decline rate of carbon intensity of energy use and the growth rate of energy consumption. The decline rate of carbon intensity of energy use must be larger than the growth rate of energy consumption.
The interrelationship between the annual decline rate of per capita CO2 emissions and the annual growth rate of population. In order to reach a CO2 emissions peak, the annual decline rate of per capita CO2 emissions must be greater than the annual growth rate of population.
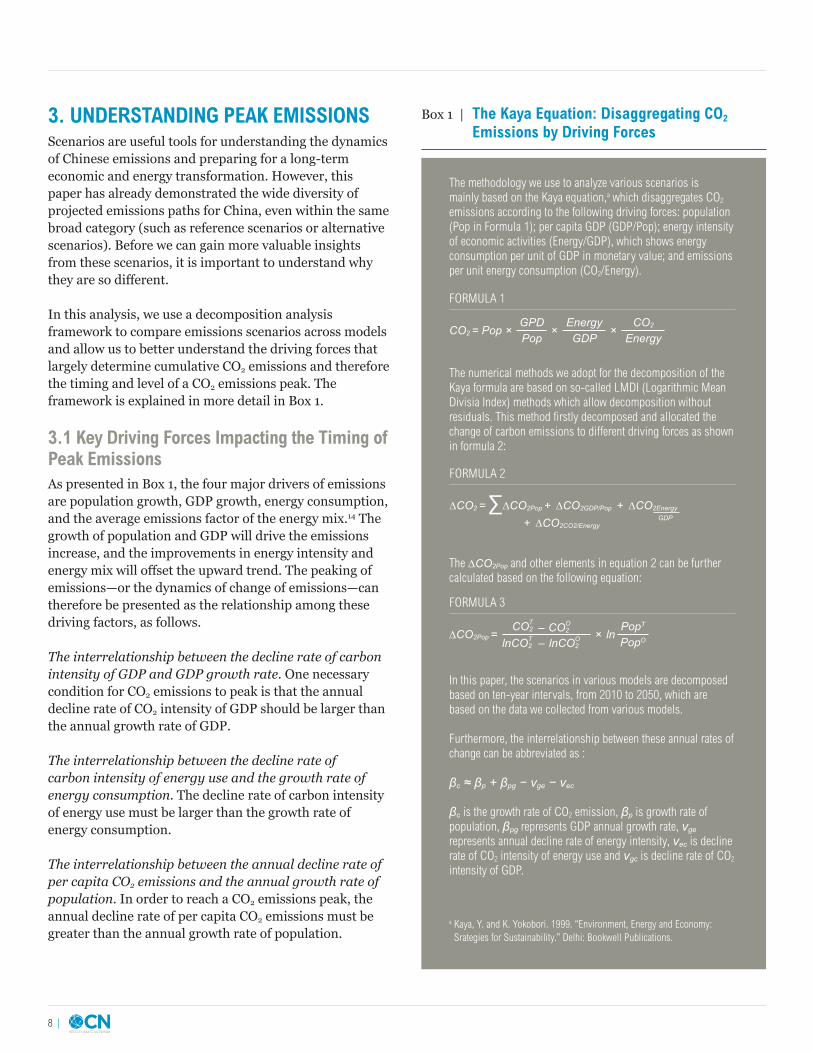
Box 1 | The Kaya Equation: Disaggregating CO2 Emissions by Driving Forces
The methodology we use to analyze various scenarios is mainly based on the Kaya equation,a which disaggregates CO2 emissions according to the following driving forces: population (Pop in Formula 1); per capita GDP (GDP/Pop); energy intensity of economic activities (Energy/GDP), which shows energy consumption per unit of GDP in monetary value; and emissions per unit energy consumption (CO2/Energy).
CO2 = Pop ×GPD Pop
Energy GDP
CO2 Energy
× ×
FORMULA 1
The numerical methods we adopt for the decomposition of the Kaya formula are based on so-called LMDI (Logarithmic Mean Divisia Index) methods which allow decomposition without residuals. This method firstly decomposed and allocated the change of carbon emissions to different driving forces as shown in formula 2:
∆CO2 = ∆CO2Pop ∆CO2GDP/Pop+∆CO2CO2/Energy+
+
FORMULA 2
∑ ∆CO2EnergyGDP
The ∆CO2Pop and other elements in equation 2 can be further calculated based on the following equation:
FORMULA 3
∆CO2Pop =PopT
PopO×––CO2 T
lnCO2T lnCO2
OCO2
O
ln
In this paper, the scenarios in various models are decomposed based on ten-year intervals, from 2010 to 2050, which are based on the data we collected from various models.
Furthermore, the interrelationship between these annual rates of change can be abbreviated as :
βc ≈ βp + βpg − νge − νec
βc is the growth rate of CO2 emission, βp is growth rate of population, βpg represents GDP annual growth rate, νge represents annual decline rate of energy intensity, νec is decline rate of CO2 intensity of energy use and νgc is decline rate of CO2 intensity of GDP.
a Kaya, Y. and K. Yokobori. 1999. “Environment, Energy and Economy: Srategies for Sustainability.” Delhi: Bookwell Publications.
Peaking China’s CO2 Emissions: Trends and Mitigation Potential
WORKING PAPER | September 2015 | 9
3.2 Summary of Conclusions from the Decomposition AnalysisReference ScenariosBoth reference scenarios and alternative scenarios share the same population assumptions. According to the projections, the population AAGR between 2010 and 2020 is in the range of 0.3 to 0.7 percent (the actual AAGR between 2010 and 2014 was 0.5 percent).15 The reference scenarios’ projections of average annual GDP growth between 2010 and 2020 range from 6.2 percent to 11 percent (actual AARG between 2010 and 2014 was 8.1 percent,)16 indicating a much higher level of uncertainty, which is reflected in the wide range of emissions projections in the reference scenarios.
The projected total decline in energy intensity over the period 2010–2020 ranges from -24 percent to -46 percent, with a median AAGR of -4.5 percent. Energy-intensity reduction is the second-largest source of uncertainty in the projection of overall emissions in the reference scenarios. The median annual growth rate in per capita GDP across the reference scenarios is 8.6 percent per year. And the reference scenarios project a near-zero improvement in emissions per unit of energy consumption.
The combined result of these various projections is a median of 4.4 percent increase in emissions annually between 2010 and 2020.
For the period between 2020 and 2030, the median annual growth rate in per capita GDP across various scenarios is 4.4 percent per year, energy intensity declines at -2.3 percent per year. Combining the projections indicates a median 2.1 percent increase in emissions annually between 2020 and 2030.
Alternative ScenariosAAGR of emissions across all the alternative scenarios is 2.8 percent from 2010 to 2020, and 0.12 percent from 2020 to 2030. This represents a reduction in the growth rate of emissions, relative to that predicted by the reference scenarios, of 1.6 percent annually between 2010 and 2020 and 2.0 percent annually between 2020 and 2030. The source of this additional mitigation is the combination of accelerated energy-intensity improvement (energy/GDP) and reduced carbon intensity of energy use. Before 2020, the major contributor is improved energy intensity, which contributes about one
percent, while reduced carbon intensity of energy use contributes another 0.5 percent per year. From 2020 to 2030, however, reduced carbon intensity of energy use dominates, contributing about 1.5 percent per year while the contribution of energy intensity improvement declines to about 0.5 percent per year.
The decomposition analysis reveals two major findings. The first is that the potential for improvements in energy intensity dwindles—in both reference and alternative scenarios—before 2030, which results in the rate of energy-intensity improvement declining to roughly three percent per year around 2030. The second is that, to maintain a higher rate of decarbonization, the incremental contribution will mainly come from the development of non-fossil-fuel energy sources in the energy mix.
4. THE NEED FOR DEEP DECARBONIZATIONAs described earlier, the precise year of a peak in China’s CO2 emissions is of less importance than the total cumulative emissions over the coming two to three decades. According to the median projection of the reference scenarios, if more aggressive action is not undertaken, China’s emissions between 2012 and 2050 will account for about 30 percent of the remaining global carbon budget. To avoid this outcome, it is necessary to target a steep decline after the emissions peak has been achieved. This can be realized only through deep decarbonization of the economy.
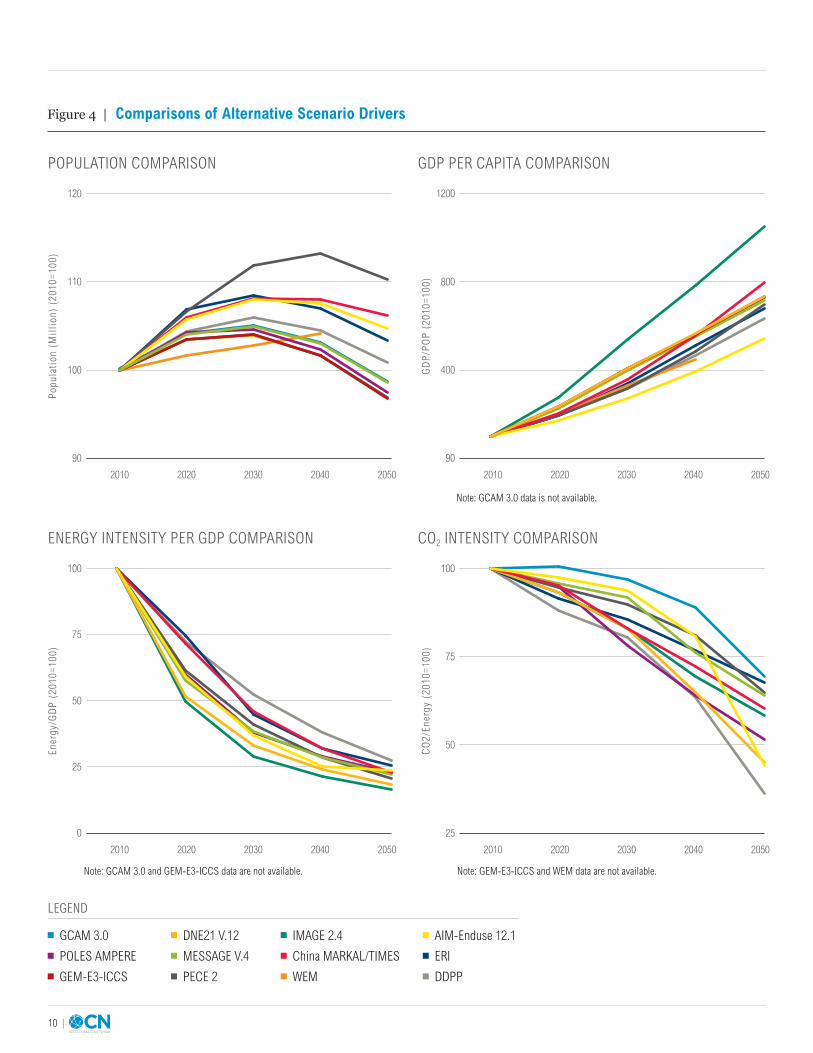
4.1 Key Indicators Relevant to Deep DecarbonizationFigure 4 presents comparisons of projections for the time period 2010 to 2050, as developed in the alternative scenarios. They cover the key indicators of population growth, per capita GDP growth, decrease in energy intensity (energy/unit GDP), and decrease in carbon intensity (carbon/unit energy).
Most of the alternative scenarios incorporate accelerated decarbonization into their narratives. However, given the diversity of parameters and assumptions among these scenarios, it is helpful to select and examine one scenario in greater detail.
10 |
Figure 4 | Comparisons of Alternative Scenario Drivers
Popu
lati
on (
Mil
lion
) (2
010=
100)
110
100
90
120
2010 2020 2030 2040 2050
GD
P/P
OP
(20
10=1
00) 800
400
90
1200
2010 2020 2030 2040 2050
POPULATION COMPARISON
Ener
gy/G
DP
(20
10=1
00)
50
25
0
100
2010 2020 2030 2040 2050
75
ENERGY INTENSITY PER GDP COMPARISON
CO
2/En
ergy
(20
10=1
00)
75
50
25
100
2010 2020 2030 2040 2050
CO2 INTENSITY COMPARISON
GDP PER CAPITA COMPARISON
GCAM 3.0
POLES AMPERE
GEM-E3-ICCS
DNE21 V.12
MESSAGE V.4
PECE 2
IMAGE 2.4
China MARKAL/TIMES
WEM
AIM-Enduse 12.1
ERI
DDPP
LEGEND
Note: GCAM 3.0 data is not available.
Note: GCAM 3.0 and GEM-E3-ICCS data are not available. Note: GEM-E3-ICCS and WEM data are not available.
Peaking China’s CO2 Emissions: Trends and Mitigation Potential
WORKING PAPER | September 2015 | 11
This study has chosen to examine the Deep Decarbonization Pathways Project (DDPP) scenario, in part because the authors were involved in developing the scenario and have access to its underlying assumptions and data that are not universally available for the other alternative scenarios. The aim is to shed light on the conditions (for example, population and GDP growth rates) and the specific social and economic changes that will likely be necessary to underpin the transition to a very low carbon-emissions path that is consistent, not only with China’s domestic policy goals, but with achieving the global 2°C target.
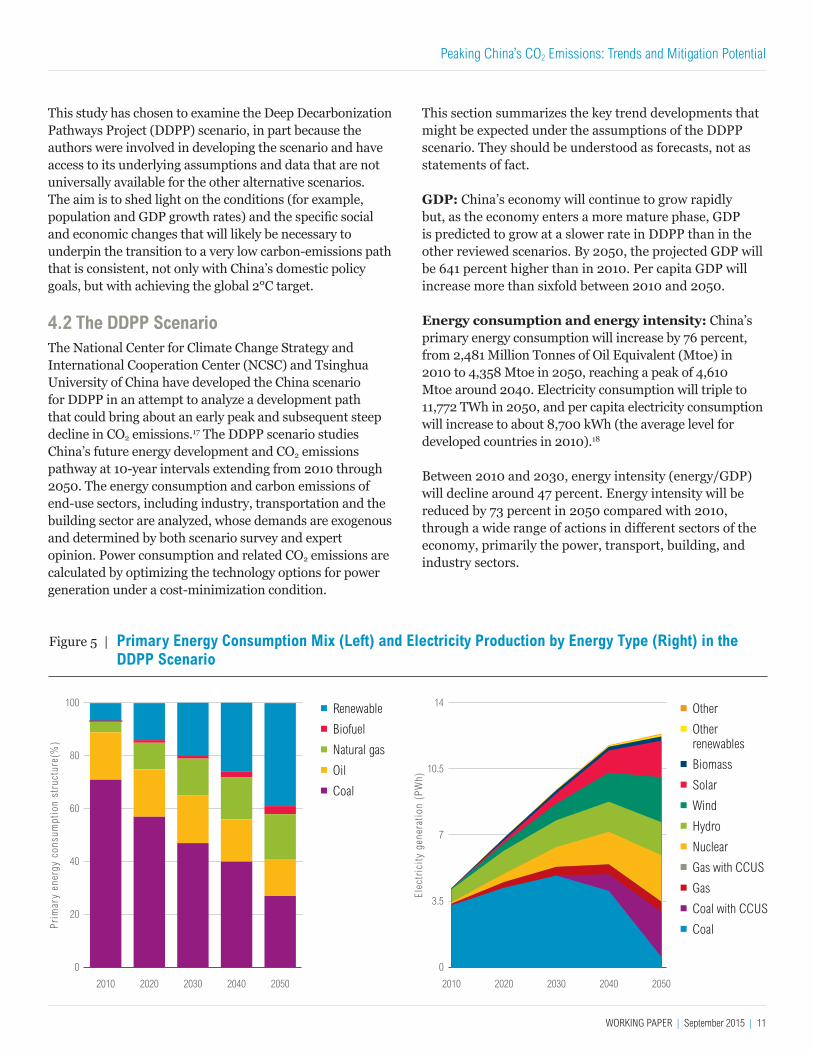
4.2 The DDPP ScenarioThe National Center for Climate Change Strategy and International Cooperation Center (NCSC) and Tsinghua University of China have developed the China scenario for DDPP in an attempt to analyze a development path that could bring about an early peak and subsequent steep decline in CO2 emissions.17 The DDPP scenario studies China’s future energy development and CO2 emissions pathway at 10-year intervals extending from 2010 through 2050. The energy consumption and carbon emissions of end-use sectors, including industry, transportation and the building sector are analyzed, whose demands are exogenous and determined by both scenario survey and expert opinion. Power consumption and related CO2 emissions are calculated by optimizing the technology options for power generation under a cost-minimization condition.
This section summarizes the key trend developments that might be expected under the assumptions of the DDPP scenario. They should be understood as forecasts, not as statements of fact.
GDP: China’s economy will continue to grow rapidly but, as the economy enters a more mature phase, GDP is predicted to grow at a slower rate in DDPP than in the other reviewed scenarios. By 2050, the projected GDP will be 641 percent higher than in 2010. Per capita GDP will increase more than sixfold between 2010 and 2050.
Energy consumption and energy intensity: China’s primary energy consumption will increase by 76 percent, from 2,481 Million Tonnes of Oil Equivalent (Mtoe) in 2010 to 4,358 Mtoe in 2050, reaching a peak of 4,610 Mtoe around 2040. Electricity consumption will triple to 11,772 TWh in 2050, and per capita electricity consumption will increase to about 8,700 kWh (the average level for developed countries in 2010).18
Between 2010 and 2030, energy intensity (energy/GDP) will decline around 47 percent. Energy intensity will be reduced by 73 percent in 2050 compared with 2010, through a wide range of actions in different sectors of the economy, primarily the power, transport, building, and industry sectors.
Figure 5 | Primary Energy Consumption Mix (Left) and Electricity Production by Energy Type (Right) in the DDPP Scenario
Pri
mar
y en
ergy
con
sum
ptio
n st
ruct
ure(
%)
80
60
20
40
0
100
2010 2020 2030 2040 2050
Elec
tric
ity
gene
rati
on (
PW
h)
10.5
7
3.5
0
14
2010 2020 2030 2040 2050
Renewable
Biofuel
Natural gas
Oil
Coal
Other
Other renewables
Biomass
Solar
Wind
Hydro
Nuclear
Gas with CCUS
Gas
Coal with CCUS
Coal

12 |
DDPP assumes that China is currently at a more advanced stage of industrialization than of urbanization. Therefore, the industry sector is projected to have a different energy consumption trajectory from that of the building and transport sectors. Industrial energy use is projected to increase by 39 percent between 2010 and 2050, and the associated emissions are expected to peak at around 7,200 Mt between 2020 and 2025. However, energy use in the transport sector is projected to increase by 130 percent between 2010 and 2050, with associated emissions expected to peak at around 1,780 Mt in 2030. Building sector energy consumption is projected to increase by 92 percent between 2010 and 2050, with emissions expected to peak at around 2,650 Mt in 2030. The combined emissions of the transportation and building sectors are projected to decline to 2,456 Mt in 2050.
Carbon intensity of Energy: Shifts in China’s energy mix play a key role (see Figure 5). The share of coal in primary energy consumption will fall from 71 percent in 2010 to 27 percent in 2050, while the share of non-fossil fuels will increase from 7.9 percent to 42 percent. Natural gas will increase its share from 3.8 percent to 17 percent over the same period. In 2050, the share of all renewables in total power generation will rise to 52 percent, while
nuclear energy will account for another 20 percent. The combination of increasing non-fossil electricity and application of carbon capture, utilization and storage (CCUS, see below) in thermal power generation will reduce the CO2 emissions per unit of electricity generation in 2050 to less than 10 percent of the level in 2010.
With accelerated deployment of CCUS, 2,737 Mt CO2 will be captured in 2050, equal to 32 percent of the carbon emissions projected by the scenario in the absence of CCUS.19 This amount is close to the upper limit of what can be expected from China’s CCUS development.20
CO2 EmissionsIn terms of emissions, the result of interactions among the trends described above is as follows:
▪ Energy-related CO2 emissions are projected to reach a peak around 2030 at 11,477 Mt CO2 but will decrease significantly to 5,173 Mt CO2 in 2050.
▪ The decline rate of carbon emissions per unit of GDP is projected to increase from 57 percent in 2030 to 90 percent in 2050, relative to the 2005 level,
CO
2 em
issi
on p
er u
nit
GD
P (
kgC
O2
/ U
S$
2005
pri
ce)
2.0
1.5
0.5
1.0
0
2.5
2010 2030 2050
2.34
1.72
1.68
0.72
0.98
0.420.17
0.46
0.16
Figure 6 | Comparison of DDPP and Other Scenarios: Projected CO2 Emissions (left) and Carbon Intensity of GDP (right)
Gt
CO
2
10.5
7.0
3.5
0
14
2010 2030 20402020 2050
Notes: the shaded areas represent the range of CO2 emissions projections in various alternative scenarios reviewed in section 2. The red line represents CO2 emissions projected by the DDPP scenario (left). The orange line represents CO2 emissions per unit of GDP in the DDPP scenario (right). The variation of 2010 data is explained by the fact that some of the alternative scenarios used predicted rather than historical data.
Peaking China’s CO2 Emissions: Trends and Mitigation Potential
WORKING PAPER | September 2015 | 13
demonstrating an acceleration of decarbonization after 2030 (see Figure 6). This decarbonization path is consistent with the possible range of scenarios in the IPCC AR5 scenario database21 that have a greater than 50 percent probability of achieving the 2°C goal.
▪ Per capita carbon emissions show a similar trend to total emissions, reaching 7.4, 8.1, 6.8 and 3.8 tons in 2020, 2030, 2040 and 2050 respectively. Per capita carbon emissions peak in 2030, at about the same level as EU per capita emissions in 1990.
5. EARLY PEAKING OR LATE PEAKING: AN UNCERTAINTY ANALYSISA number of uncertainties influence China’s efforts to peak CO2 emissions by 2030.
Population GrowthOf the various factors influencing CO2 emissions in the Kaya Identity, population growth is the least uncertain. By 2030, China’s population is expected to have stabilized and be trending toward zero or even negative growth, easing the associated energy service demand. Population growth—at least in the case of China—is therefore a driver that is compatible with earlier peaking of CO2 emissions.
GDP GrowthAs a successful and rapidly industrializing economy, China has experienced remarkably high GDP growth rates. Between 1990 and 2010, China’s GDP grew at an average rate of 10.5 percent per year; it has currently slowed to approximately 7.4 percent per year.22 China has paid a price in terms of severe pollution and depleted natural resources but the country might expect both GDP growth rates and environmental damages to stabilize as the economy matures. Nevertheless, the current development pattern which relies primarily on heavy industry is not sustainable for China’s future development. Transformation to an innovative, low-carbon development pattern is needed, in which more attention is paid to the quality, as well as the quantity, of economic growth.
Relatively small changes in GDP growth rates can have enormous implications for energy consumption and CO2 emissions. If the annual average GDP growth rate can be held to 7.5 percent from 2010 to 2020, then, by 2020, total energy consumption is projected to be 4.8 Gtce, in which case CO2 emissions would exceed 10 Gigatons (Gt). However, if the annual average GDP growth rate rises by just one percent and the energy intensity of GDP declines by the same amount, the energy consumption in 2020 would likely increase by 430 Mtce and CO2 emissions by 750 Million Tons (Mt).
The DDPP scenario assumes that China’s GDP in 2030 is 3.3 times larger than in 2010. However, if China’s GDP is four times larger, and the decline rate of energy intensity of GDP remains unchanged, the energy consumption of 2030 would reach 6.65 Gtce. Assuming current trends in non-fossil fuel use remain unchanged, CO2 emissions would reach 12.5 Gt, and coal consumption would increase by 600 Mt in 2030, bringing more substantial environmental issues.
If the annual average GDP growth rate is higher than five percent in 2030, then peaking CO2 emission by that date would require significant extra effort beyond that assumed in the current DDPP scenario. Based on the experience of developed countries, GDP growth in the post-industrialization period is not likely to exceed three percent annually. Therefore, in the longer term, China’s GDP growth is likely to fall back to somewhere in this range after 2030, which ultimately would help accelerate a long-term decrease in CO2 emissions. Based on China’s INDC targets, the country’s per capita CO2 emissions could peak at a substantially lower level—and at a substantially lower per capita GDP level—than those typical of developed countries.23
It remains the case that China’s record of strong economic growth is a factor that increases the odds of a later peaking in CO2 emissions. However, the greater the rate of decline in energy intensity and carbon intensity, the more scope China will have for economic growth while still meeting its emissions targets. The relationship between GDP growth, energy consumption and associated emissions is not fixed; if China can achieve a dramatic decoupling of these elements, future GDP growth need not create a significant increase in future emissions.

14 |
Decline of Energy Intensity of GDPChina’s energy intensity of GDP decreased by 57 percent between 1990 and 2012 but it remains high—twice the world average, 2.5 times that of the United States and 4.3 times that of Japan in 2010. The primary reason is not that China lags behind in energy efficiency and advanced technologies. China has endeavored to develop energy-saving technologies and energy-efficiency levels are close to developed countries.24 Rather, China’s high energy intensity is mainly due to differences in national economic structure and the product value chain. Industry accounts for more than 40 percent of total GDP in China. End-use energy consumption accounts for 70 percent of total energy consumption, of which 50 percent is consumed by the energy-intensive raw-materials industry.25
In developed countries, the industrial sector accounts, on average, for less than 30 percent of GDP. High-tech industries and the service sector account for a large proportion and the energy consumption per unit of added value is quite low. By contrast, China’s industrial products are middle to low end in the international value chain, with high energy consumption and low added value.
Because structural factors are primary contributers to China’s high energy intensity of GDP, great potential remains for China to decrease it. In the future, energy savings resulting from structural changes in the industry sector and continued technology upgrades will generate major effects, even as the potential for achieving savings through greater efficiency within economic sectors diminishes with the transition away from China’s current reliance on heavy industry. The DDPP projects that, from 2010 to 2030, the decline in energy intensity can likely be maintained at an annual rate of 3.0–3.5 percent. Thus, the current “immaturity” of China’s industry sector is a positive factor that is conducive to an earlier date for peaking CO2 emissions. After 2030, however, as industrial restructuring and technology upgrades mature, great efforts will be needed to keep the decline rate of energy intensity of GDP at a level of three percent. Significant absolute emissions reductions will depend more on adjustments in the energy mix (see below).
Based on the experience of post-industrial countries, the annual decline rate in the energy intensity of GDP usually does not exceed two percent,26 while the GDP growth rate usually does not exceed three percent. Slower GDP growth and the adjustment of the energy mix in developed countries could result in CO2 emissions peaks
being achieved and emissions could continue to fall in the post-industrialization period. Therefore, the period 2010 to 2030 represents a window during which China can take advantage of its industrial restructuring and maximize its chances of achieving an early emissions peak. If, on the other hand, China’s decline rate of energy intensity of GDP decreases from 3.25 percent annually (as assumed in the DDPP scenario) to 2.25 percent annually, then energy demand by 2030 will reach almost 7 Gtce, which is 1.34 Gtce more than projected in the DDPP scenario. The corresponding CO2 emissions would exceed 13 Gt and achieving the CO2 emissions peak would be postponed to 2035 or later. Therefore, maintaining a high decline rate in the energy intensity of GDP is a necessary condition to reach an early CO2 emissions peak.
Decline of CO2 Intensity of Energy UseCO2 intensity of energy use can be greatly diminished by the development of energy sources such as hydropower, wind power, solar power, and nuclear power. It also can be diminished by the substitution of natural gas for coal. Non-fossil fuels and natural gas have seen rapid development in recent years but they still account for only a small fraction of total energy supply and fossil-fuel consumption continues to rise to meet growing demand.
Current trends in non-fossil fuels, natural gas, and nuclear energy development, and the projected growth in energy demand of 1.5 percent per year, are compatible with reaching a CO2 emission peak by about 2030. By 2030, non-fossil fuels are projected to account for 20–25 percent of the energy mix, equivalent to 1.2–1.5 Gtce. The installed capacity of hydropower should reach 400 GW and the installed capacity of wind power and solar power is expected to reach 440GW and 350GW respectively. The installed capacity of nuclear power is also planned to rise to 150GW. As a result, the CO2 intensity of energy use should decrease by 20 percent relative to 2010.
By 2030, new non-fossil energy is projected to be supplied mainly by solar power, wind power, biomass and nuclear energy; usable hydropower resources should be almost fully exploited. Solar energy and wind power have great further potential but energy transportation, storage, grid stability and distribution capacity are all barriers that impede their utilization. Nuclear energy also has great potential but it is subject to perhaps the greatest level of uncertainty among all energy technologies. China currently has 20 GW installed capacity of nuclear power.27 Following the Fukushima nuclear accident in Japan,

Peaking China’s CO2 Emissions: Trends and Mitigation Potential
WORKING PAPER | September 2015 | 15
China’s nuclear energy security was strengthened. Higher standards have been established for the construction of nuclear power plants and the rate of development has slowed. By 2020, operating nuclear capacity is planned to rise to 60GW, and continue rising to 150GW by 2030. The newly increased installed capacity would be more than 10 GW annually, which would meet 20–30 percent of energy demand. By 2050, the total installed capacity of nuclear power would approach 330GW.
However, the path and scale of nuclear power development largely depend on consensus between the people and governments of all levels. If consensus cannot be reached, and nuclear energy development is blocked, greater effort will be needed to develop renewables to meet both increasing energy demand and the non-fossil-fuel target established by China. The future supply of natural gas and oil might be constrained by resource limits and issues of import security. In the absence of serious efforts, a major portion of the energy demand gap is likely to be filled by coal. By 2030, if the installed capacity of nuclear power stations is 50GW lower than assumed in the DDPP scenario, coal consumption could increase by more than 150 Mt, creating about 300 Mt of CO2 emissions. After 2030, without substantial growth of installed capacity of nuclear energy, the adjustment of China’s energy mix would slow down and fossil-fuel consumption would keep rising. The CO2 emissions peak could be delayed for 5–10 years.
International Energy Market and Key TechnologiesChina is increasingly dependent on the international market for its oil and natural gas. Dependence on oil imports reached 58 percent in 2012, while imports of natural gas accounted for 29 percent of total natural gas supply. Several forecasts indicate that oil import dependency could rise to 70 percent and natural gas imports could account for 50 percent of supply by 2020 and that rising trends could continue to 2030. Import dependency not only challenges national energy security, it also creates great uncertainty regarding the future energy mix. If the international market for oil and/or natural gas should tighten or destabilize significantly, China would probably be forced to consume more domestic coal resources and use more coal chemical technologies. Thus, coal consumption and corresponding CO2 emissions would be significantly increased. Though China has great potential resources in unconventional gas development, including shale gas and coal-bed
methane, uncertainties remain over technology costs and environmental impacts. The state of the future international energy market therefore represents a major negative uncertainty for the trend and timeframe of CO2 emissions reduction.
Carbon capture, utilization and storage (CCUS) is a key technology with great potential to reduce CO2 emissions even while China continues to exploit coal resources. Under the DDPP scenario, CCUS is assumed to reduce total CO2 emissions by one third in 2050. However, CCUS technology still faces many challenges, including unclear national strategies and policies, lack of financing, concern about the integrity of storage, and uncertainty regarding technology innovation. At present, the energy consumption involved in carbon capture is generally considered too high (extra consumption equivalent to 20–30 percent of the fuel) and capture costs are significant (about USD15–75 per ton of CO2 in the power sector, and USD25–55 per ton in the industrial sector).28 Without rapid technology innovation, and in the absence of reasonable carbon-pricing mechanisms, large-scale CCUS development faces enormous difficulties and seems likely to have a negative impact relative to the emissions pathway proposed under the DDPP scenario.
6. CONCLUSIONS AND POLICY RECOMMENDATIONS6.1 ConclusionsChina’s development needs are to advance people’s living standards and eliminate poverty. These needs drive China’s economic growth, and the huge production and service demands that push up China’s energy consumption and CO2 emissions. It follows that holding the increase in service demands to a manageable level and transforming industrial production to more sustainable patterns are prerequisites for China’s low-carbon development. Policies and measures of the kind assumed in the DDPP scenario, which guide both producers and consumers in different end-use sectors, will be of critical importance in the coming decades.
In this paper, we reviewed recent modeling exercises in order to analyze the impacts of China’s climate actions on emissions. Our analysis suggests that, without additional policy intervention, China’s CO2 emissions will continue to grow until 2040 or 2050 and will approximately double from their 2010 level. The alternative scenarios, however, suggest that peaking CO2 emissions around 2030

16 |
requires the rate of growth in emissions to be reduced by two percent below the reference level. This would result in a plateau in China’s emissions from 2020 to 2030. Expressed in terms of energy intensity, the DDPP scenario suggests that a reduction in energy intensity of 73 percent compared to 2010 levels will be crucial by 2050.
We have shown that the different models vary greatly in their projections of overall CO2 emissions. The variation is due mainly to their different assumptions regarding drivers, and the most important difference lies in projections of GDP growth. This fact seems likely to explain why the target in China’s INDC is expressed in the form of emissions per unit of GDP (emissions intensity) rather than in the form of an absolute emissions target.
This result also suggests that debate over the precise timing of a peak in China’s emissions should not dominate the country’s approach to policy development. The exact year in which peaking occurs will be overwhelmingly impacted by fluctuations in GDP growth over the next two decades and fluctuations in GDP are subject to significant uncertainty. Nevertheless, it is clear what needs to be done.
To peak CO2 emissions in some year approximately around 2030—and to set China on track to limit cumulative emissions through 2050—China will need additional policies and measures to achieve deeper reductions in its energy intensity per unit of GDP. We also conclude that such reductions need not interfere with China’s projected levels of economic development.
As discussed earlier in this paper, the first necessary condition to reach a CO2 emissions peak is that the annual decline rate of CO2 intensity of GDP must be higher than the annual growth rate of GDP.
The authors project that China’s annual decline rate of CO2 intensity of GDP between 2020 and 2030 will be between 3.1 percent and 5.3 percent,29 with a higher degree of probability for a decline rate between 3.1 percent and 4.5 percent.30 The World Bank and China’s State Council Development Research Center project that China’s potential annual GDP growth, assuming proper reform and no major shocks, will be five percent between 2025 and 2030.31
These two sets of projections imply, therefore, that if sufficient effort is made to maintain the maximum decline rate in energy intensity—5.3 percent—China’s emissions can peak around the year 2030 while its economy can still grow at its full potential growth rate.
There is further synergy, because the greatest scope for reductions in emissions per unit of GDP lies in the evolution of China’s economic structure, principally its shift from heavy industry to a more diverse, service-oriented, and higher value profile, which is one of the chief measures needed for China to achieve its economic potential.32 Additional efforts to reduce energy intensity will facilitate the transformation of China’s development pathway.
The goal of peaking emissions by around 2030 can best be achieved through a combination of improvement in energy intensity (energy per unit of GDP) and in carbon intensity (emissions per unit of energy consumption). The policy debate should therefore focus on measures that will enable reductions of energy intensity and carbon intensity, and how these measures will contribute to reducing the emissions growth rate by two percent below the rate currently projected. This is the essential policy goal that must be pursued if China’s emissions are to plateau between 2020 and 2030, and to achieve a steep decline as early as possible.
Our analysis has also suggested that the potential for decline in energy intensity will be limited over time, as industrial transformation is achieved and lower cost efficiency improvements are exploited. Thus the achievement of emissions peaking around 2030 will also be largely dependent on how quickly China can achieve its stated goal regarding the share of non-fossil fuel energy in primary energy consumption.
6.2 RecommendationsEarly and effective actions must be launched for each major sector of China’s economyIn the power-generation sector, the government should prioritize the development of non-fossil fuels until they dominate the energy mix of the sector. Electrifying end-use sectors that currently rely on fossil fuels – and generating power from renewable energy sources – are essential steps to achieving deep decarbonization. The electricity-pricing mechanism should be reformed to enable sustainable development of the power sector. Outdated power plants should be phased out as part of an effort to increase the generating efficiency of thermal power plants. Because China’s energy system is dominated by coal, scale-up of CCUS techonologies in thermal power plants will also be essential.
Peaking China’s CO2 Emissions: Trends and Mitigation Potential
WORKING PAPER | September 2015 | 17
In the industry sector, the government needs to control major energy-intensive industrial outputs, discourage outdated production capacity, and cultivate strategic emerging industries to enable transformation of the structure of the industry sector. Policies to improve industrial energy efficiency should be continued, including investment in research and development of advanced technologies, and promoting the application of energy-saving techniques and technologies. Coal use in industry needs to be reduced and CCUS application will be needed in energy-intensive industries such as cement, iron and steel, chemicals, and petrochemicals.
In the building sector, the government needs to optimize urban planning and place restrictions on mass demolition of old buildings. While meeting people’s needs for improved living standards, the growth in floor area of residential dwellings should be contained at a reasonable level. The government should also improve the energy efficiency of heating supply and electrical appliances and reduce fossil-fuel use by popularizing the use of waste heat and distributed renewables. Additional research and development investment for alternative energy technologies is greatly needed.
In the transport sector, the government needs to slow the growth rate of private transportation service demands through encouraging the use of public transportation and enhancing the implementation of transit-oriented development in urban-construction planning. The government should also require further improvements in the energy efficiency of vehicles and optimize the energy mix of the transport sector by promoting the electrification of trains and cars and accelerating the development of biofuels.
China should promote the transition to a low-carbon energy system by shifting its focus from targeting carbon-intensity control to targeting total carbon-emissions controlChina has a carbon-intensity control system in place and has set carbon intensity-reduction targets for each five-year plan; the target for each year is therefore determined. The carbon-intensity reduction target and the energy-intensity reduction target have, together, become the main high-level policy in the 12th FYP for controlling the growth of energy use and CO2 emissions. This approach is expected to continue during 13th FYP.
China’s GDP is likely to grow relatively quickly over the next ten to fifteen years. The policy of reducing energy and carbon intensity will help to control the rate of increase in CO2 emissions, but it will not be sufficient to stabilize—much less reduce—total CO2 emissions. In the short and medium term, the main task is to slow down the rapid growth of CO2 emissions before 2020; this would build a strong foundation for achieving an emissions peak around 2030. A vitally important step is therefore to shift away from carbon-intensity control toward a policy of dual control of carbon intensity and total CO2 emissions. To this end, it will be essential to establish the carbon-emission allowance-allocation management system to determine and allocate the carbon-emission allowance for each province, autonomous region, and municipality. In addition, given the overall scale of China’s economy and the diversity and complexity of the country’s many regions and sectors, it will be necessary to begin with more stringent requirements on the principal sources of CO2 emissions, that is, the most carbon-intensive sectors and products. Mandatory carbon-emissions standards could be used as a forcing mechanism to promote the low-carbon transition in key industries and sectors, and the development and use of low-carbon products.
In the long term, it will be necessary to achieve a steady decrease in CO2 emissions. This will require the establishment of an economy-wide, total-carbon-emissions-control regulatory system and correspondingly strong mechanisms for implementation and enforcement.
18 |
AIM/Enduse is a bottom-up, technology-rich model based on a linear optimization framework to minimize the system cost, comprising initial fixed costs, operating
costs, energy costs, taxes and subsidies. The user of AIM-Enduse also can choose various constraints to bound the model. The AIM-Enduse world version divides the world into 32 regions and China is represented as a single region.
China-MARKAL is a national energy model with rich bottom-up technology details. It use the MARKAL as the modeling framework, with the objective function of minimizing the total annual cost, which includes annualized investments, annual operating costs, minus revenue from exported energy carriers, plus taxes on emissions and costs of demand losses.
DNE21 is an integrated assessment model consisting of an energy-system model, a macro-economic model, and a climate-change model. Those three models are hard linked. The macro-economic model is driven by exogenous population growth and GDP growth, and generates final energy demand which will be sent to energy system models. The energy-system model will take the final energy demand and minimize the total cost of the energy system. The energy-supply technologies are modeled by a bottom-up approach while the energy end-use technologies are modeled in a top-down approach. The DNE21 model divides the world into 10 regions. China and other neighboring countries are combined into one region.
ERI-3E is a hybrid model that connects a CGE model with a technology-rich, end use sector model. The CGE is used to project the economic development pattern including structures of consumption, investment, and import/outport. These projections, in monetory value, are translated into physical terms through the STOCK model to drive the Enduse model. The Enduse model will meet final demand by optimizing the energy system within given constraints.
GCAM is a dynamic-recursive model with technology-rich representations of the economy, energy, and land use, linked to a climate model. GCAM can be used to explore climate-change mitigation policies including carbon taxes, carbon trading, regulations and accelerated deployment of energy technology. GCAM has been used to explore the potential role of emerging energy-supply technologies and the greenhouse-gas consequences of specific policy measures
or energy-technology adoption including; CO2 capture and storage, bioenergy, hydrogen systems, nuclear energy, renewable energy technology, and energy-use technology in buildings, industry, and the transportation sectors.
GEM-E3 is a recursive, dynamic, computable, general equilibrium model that covers the interactions between the economy, the energy system, and the environment. The GEM-E3 model simultaneously computes the equilibrium in the goods and services markets, as well as in production factors (labor and capital). The economic agents optimize their objective functions (welfare for households and cost for firms) and determine separately the supply or demand of labor, capital, energy, and other goods. Market prices guarantee a global equilibrium endogenously. Economic production is modeled with a nested CES production function, using capital, labor, energy and intermediate goods. The consumers decide endogenously on their demand for goods and services using a nested extended Stone Geary utility function. The world version of GEM-E3 is based on GTAP 8 and regional aggregation is flexible.
The IMAGE is a dynamic, integrated assessment framework to analyze global change. IMAGE comprises two main systems. The Human or socio-economic system describes the long-term development of human activities relevant for sustainable development. The Earth system describes changes in the natural environment. The two systems are linked by the impacts of human activities on the Earth system, and by the impacts of environmental change in the Earth system on the Human system. The IMAGE framework uses the detailed energy system model “The IMage Energy Regional model” (TIMER) to describe the long-term dynamics of the energy system. TIMER is a simulation model. The results obtained depend on a single set of deterministic algorithms, according to which the system state in any future year is derived entirely from previous system states.
MESSAGE is a dynamic, linear programming model designed for the optimization of energy supply and utilization. MESSAGE I1 was developed at IIASA on the basis of MESSAGE, a Model for Energy Supply Strategy Alternatives and their General Environmental Impact. The main emphasis in this development was put on a user-friendly interface for data entry and all program calls necessary. The data structures have been changed to a databank based on keywords, which simplifies automated
ANNEX | MODELS SURVEYED IN THIS ANALYSIS
Peaking China’s CO2 Emissions: Trends and Mitigation Potential
WORKING PAPER | September 2015 | 19
data processing. In the mathematical formulation some options have been eliminated from the model, and the multi-objective option has been developed further. The reference point optimization method, adapted to dynamic modeling into a reference trajectory optimization method, is implemented.
PECE model comprises three sub-models, which include PECE-SE (social economic model); PECE-ESD (energy service demand model) and PECE-ES (energy technology model). PECE-ES model is a bottom-up, non-linear technology optimization model in which least-cost technology choices are made under a series of restrictions (for example,the demand for energy services, the restriction on energy supply, the restriction on technological feasibility, etc.). The costs calculated in the model include annualized fixed cost of recruited devices during that year, variable operation cost (operation and maintenance cost of devices, and fuel cost), cost of installing removal devices (CCUS for pulverized coal-fired power plants, etc.) and cost of emissions taxes (carbon tax, energy tax, etc.). This model is based on the partial equilibrium framework and is used as a tool to estimate future energy demand and emissions. It simulates the flows of energy and materials in an economy, from the source or supply of primary energy and materials, through conversion into secondary energy and materials, to the delivery of various forms of energy to the end-use services. In the model, these flows of energy and materials are characterized through detailed representation of technologies providing an end-use, scenario-driven analysis. The model also considers the existing device quantities in the starting year of the scenario horizon and calculates the retirement of the devices at the end of their life span.
The POLES model is a world simulation model for the energy sector and industrial GHG-emitting activities. It works in a year-by-year recursive simulation (up to 2100) and partial equilibrium framework, with endogenous international energy prices and lagged adjustments of supply and demand by world region. The POLES model combines a high degree of detail on the key components of the energy system and a strong economic consistency, because all changes in these key components are at least partly determined by relative price changes at sectoral level, regarding both demand and supply. Thus, each mitigation scenario can be described as the set of consistent transformations of the initial baseline case that
are induced by the introduction of a carbon constraint or carbon value/penalty. The model identifies 43 consuming regions of the world, with 22 energy-demand sectors and about 40 energy technologies; the description of climate-policy-induced changes can therefore be quite extensive. The POLES model relies on a framework of permanent inter-technology competition, with dynamically changing attributes for each technology, for which the model provides dynamic cumulative processes through the incorporation of Two Factor Learning Curves, while price-induced mechanisms of technology diffusion and transformation of the energy demand are also included in the simulations.
The WEM is a simulation model covering energy supply, energy transformation and energy demand. The majority of the end-use sectors use stock models to characterize the energy infrastructure. In addition, energy-related CO2 emissions and investments related to energy developments are specified. Though the general model is built up as a simulation model, specific costs play an important role in determining the share of technologies in satisfying an energy-service demand. In different parts of the model, Logit and Weibull functions are used to determine the share of technologies based upon their specific costs. This includes investment costs, operating and maintenance costs, fuel costs and, in some cases, costs for emitting CO2.
DDPP model, a bottom-up model, studies China’s future energy development and carbon-emissions pathway at 10-year intervals extending from 2010 through 2050. DDPP model is based on four sectors, including the industry, transportation, building, and power sectors, with the prediction function of energy consumption and carbon emissions at national level. DDPP model is driven by service demand and the macro-economy, which are exogenous and determined by both scenario survey and expert opinion. Power consumption and related carbon emissions are calculated using the TIMES model to optimize the technology options for power generation under a cost-minimization condition.
20 |
ENDNOTES1. IPCC. 2014: “Climate Change 2014: Mitigation of Climate Change.”
Contribution of Working Group III to the Fifth Assessment Report of the Intergovernmental Panel on Climate Change [Edenhofer, O., R. Pichs-Madruga, Y. Sokona, E. Farahani, S. Kadner, K. Seyboth, A. Adler, I. Baum, S. Brunner, P. Eickemeier, B. Kriemann, J. Savolainen, S. Schlömer, C. von Stechow, T. Zwickel and J.C. Minx (eds.)]. Cambridge, UK and New York, USA: Cambridge University Press.
2. This report focuses on CO2 emissions from fossil-fuel combustion. It does not consider CO2 emissions from other sources or emissions of other greenhouse gases.
3. “Build Consensus and Implement Actions For a Cooperative and Win-Win Global Climate Governance System.” Address by China’s Vice Premier Zhang Gaoli to the UN Climate Summit, New York, 23 September, 2014.
4. Song, R., W. Dong, J. Zhu, X. Zhao, Y. Wang. 2015. “Assessing Imple-mentation of China’s Climate Policies in the 12th Five-Year Period.” Working paper. Beijing: World Resources Institute.
5. Li Keqiang. “Escalate Development Quality and Strengthen Actions to Address Climate Change.” http://www.gov.cn/guowuyuan/2015-06/12/content_2878792.htm.
6. White House. “US-China Joint Announcement on Climate Change.” November 12, 2014. http://www.whitehouse.gov/the-press-of-fice/2014/11/11/us-china-joint-announcement-climate-change.
7. As input to international climate change negotiations under the United Nations Framework Convention on Climate Change, Intended Nationally Determined Contributions (INDCs) outline the post-2020 climate goals and actions that countries intend to undertake.
8. Government of China. 2015. “Enhanced Actions on Climate Change: Chi-na’s Intended Nationally Determined Contribution.” Available at: http://www.ndrc.gov.cn/xwzx/xwfb/201506/W020150630783447810119.doc
9. See Table 1 for details.10. Our definition of reference scenarios cannot be conflated with business-
as-usual (BaU) scenarios. Scenarios categorized as “BaU” generally explicitly exclude some current or planned policies, whereas our refer-ence scenarios include some scenarios that include such policies. This is important to consider in any efforts to compare efforts among countries.
11. The results were calculated by authors. The reason is that the industry sector accounts for a larger share of China’s economy than in the Euro-pean Union (EU) and the United States. Thus, under a uniform carbon-price assumption, the impact on China’s economy would be much higher than on the economies of the EU and United States (about seven times higher). From this perspective, the uniform carbon price or equal marginal cost is not an appropriate emissions budget allocation scheme for China and other developing countries. However, most global IAMs models do assume an equal marginal cost allocation scheme in their burden-sharing framework, implying that developing countries will take on a greater burden (in terms of share of GDP) than developed countries.
12. Calculated using the median value of all scenarios.13. IPCC. 2014. “Climate Change 2014: Mitigation of Climate Change.”
Contribution of Working Group III to the Fifth Assessment Report of the Intergovernmental Panel on Climate Change [Edenhofer, O., R. Pichs-Madruga, Y. Sokona, E. Farahani, S. Kadner, K. Seyboth, A. Adler, I. Baum, S. Brunner, P. Eickemeier, B. Kriemann, J. Savolainen, S. Schlömer, C. von Stechow, T. Zwickel and J.C. Minx (eds.)]. Cambridge, UK and New York, USA: Cambridge University Press.
14. He, J.K. 2013. “Analysis of CO2 Emissions Peak of China: Targets and Strategies.” China Population Resources and Environment. 23.
15. National Buearu of Statiscs of China. National Database. Accessble at http://data.stats.gov.cn/easyquery.htm?cn=C01.
16. National Buearu of Statiscs of China. National Database. Accessble at http://data.stats.gov.cn/easyquery.htm?cn=C01.
17. This scenario is developed by using the SACC model of NCSC, which is built to analyze the carbon mitigation strategy of China.
18. The developed countries refer to United States, Germany, France, and Japan. Data are from the World Bank online data source, http://data.worldbank.org/country.
19. Without CCUS application, CO2 emissions in 2050 are estimated to be 7,587 Mt.
20. Asian Development Bank. 2015. “Roadmap for CCS Demonstration and Deployment for the People’s Republic of China.”
21. Fu Sha, Zou Ji, Liu Linwei, 2015. “An Analysis of China’s INDC.” Avail-able at: http://www.ncsc.org.cn/article/yxcg/ir/201507/20150700001490.shtml.
22. National Bureau of Statistics of China, National Database. Available at: http://data.stats.gov.cn/easyquery.htm?cn=C01.
23. Fu Sha, Zou Ji, Liu Linwei. 2015. “An Analysis of China’s INDC.” Avail-able at: http://www.ncsc.org.cn/article/yxcg/ir/201507/20150700001490.shtml.
24. Qingyi Wang, 2013 Energy Data. Energy Foundation: 2013. Available at http://www.efchina.org/Attachments/Report/reports-20131212-zh/reports-20131212-zh.
25. National Bureau of Statistic of China, China Statistical Year Book 2013- 2014,Available at http://www.stats.gov.cn/.
26. Between 1990 and 2010, the decline rate in energy/GDP was 1.75 per-cent in the United States and 1.55 percent in the EU. The average decline rate in all developed countries over the same period was 1.25 percent.
27. National Bureau of Statistic of China, China Statistical Abstract 2015[M]. China Statistics Press.
28. Hongguang Jin. “Technical Problems and Challenges Faced by CO2 Cap-ture Technologies.” [EB] Presentation to World Bank Technical Seminar. December 3, 2013.
29. China’s official target is to achieve 40 percent to 45 percent CO2 intensity reduction by 2020 and achieve 60 percent to 65 percent reduction by 2030, both relative to 2005. If China achieves a 40 percent reduction in CO2 intensity in 2020 and a 65 percent reduction in 2030, the annual decline rate of CO2 intensity of GDP between 2020 and 2030 will be 5.3 percent. If the emissions reductions in 2020 and 2030 are 45 percent and 60 percent respectively, the annual decline rate of CO2 intensity of GDP between 2020 and 2030 will be 3.1 percent.
30. According to the most recently published energy data by the National Bureau of Statistics of China, in 2015, China’s CO2 intensity of GDP has declined 33.8 percent from its 2005 level, which outperforms the progress target (30.1 percent) in line with a 45 percent CO2 intensity re-duction by 2020. It is therefore a good indication that the 2020 emissions intensity reduction target of 45 percent is likely to be achieved. Under this condition, to successfully realize China’s 2030 emissions reduction target, the annual decline rate of CO2 intensity of GDP between 2020 and 2030 needs to be between 3.1 percent and 4.5 percent.
31. World Bank and the Development Research Center of the State Council, P. R. China. 2013. “China 2030: Building a Modern, Harmonious, and Creative Society.” Washington, D.C.: World Bank. DOI: 10.1596/978-0-8213-9545-5.
32. World Bank and the Development Research Center of the State Council, P. R. China. 2013. “China 2030: Building a Modern, Harmonious, and Creative Society.” Washington, D.C.: World Bank. DOI: 10.1596/978-0-8213-9545-5.

Peaking China’s CO2 Emissions: Trends and Mitigation Potential
WORKING PAPER | September 2015 | 21

www.openclimatenetwork.org
Copyright 2015 Open Climate Network. This work is licensed under the Creative Commons Attribution 4.0 International License. To view a copy of the license, visit http://creativecommons.org/licenses/by/4.0/.
ABOUT OCNThe Open Climate Network (OCN) brings together independent research institutes and stakeholder groups to monitor countries’ progress on climate change. We seek to accelerate the transition to a low-emission, climate-resilient future by providing consistent, credible information that enhances accountability both among and within countries. www.openclimatenetwork.org.
This working paper is part of an OCN initiative to inform the post-2020 GHG mitigation goals in Intended Nationally Determined Contributions under the United Nations Framework Convention on Climate Change. The OCN Secretariat, based at the World Resources Institute, is managing this multi-country effort. For more information regarding this initiative, contact [email protected].
ACKNOWLEDGMENTSWe would like to thank the many people who contributed to the ideas and discussions that have shaped this working paper. We greatly appreciate the guidance and early review provided by Juan-Carlos Altamirano, Thomas Damassa, Taryn Fransen and Paul Joffe. Further thanks go to Mengpin Ge, Courtney Durham and Merton Price for their invaluable research, administration and design support. Funding for this project was provided by ClimateWorks Foundation. While our reviewers and funders were very generous with their time and advice, this working paper represents the views of the authors alone.
ABOUT INSTITUTE OF ENERGY, ENVIRONMENT AND ECONOMY AT TSINGHUA UNIVERSITYInstitute of Energy, Environment and Economy (3E) was established in 1980 in Tsinghua University. 3E is a pioneer and a top think tank in terms of research on energy systems analysis and climate change in China. 3E has more than 30 full time researchers working on energy and climate change modelling, energy strategy and planning, low carbon development, international climate regime, new and renewable energy, energy efficiency and energy conservation.
ABOUT NATIONAL CENTER FOR CLIMATE CHANGE STRATEGY AND INTERNATIONAL COOPERATIONThe National Center for Climate Change Strategy and International Cooperation (NCSC) is an institutional organization directly subordinate to the National Development and Reform Commission of China. It is the only national level research center that works on climate change strategy and international cooperation. With more than 70 researchers, NCSC conducts systematic studies on climate change strategic planning, policies and regulations, international negotiation and cooperation, statistics and assessment, carbon market management and information consulting.
P R O D U C E D I N P A R T N E R S H I P W I T H