PDOs EOR Screening Methodology for Heavy-Oil …€¦ · PDOs EOR Screening Methodology for...
26
Georg Warrlich, Ibrahim Al-Waili, Dhiya Said, Mohamed Diri, Nabil Al-Bulushi, Jonathan Strauss, Mohammed Al-Kindi, Fahad Al- Hadhrami, Ton van Heel, John van Wunnik (PDO) Bert-Rik de Zwart, Carl Blom, Rifaat Al-Mjeni, Paul Boerrigter (Shell Technology Oman) SPE-155546 PDOs EOR Screening Methodology for Heavy-Oil Fractured Carbonate Fields - a Case Study
Transcript of PDOs EOR Screening Methodology for Heavy-Oil …€¦ · PDOs EOR Screening Methodology for...
Georg Warrlich, Ibrahim Al-Waili, Dhiya Said,
Mohamed Diri, Nabil Al-Bulushi, Jonathan
Strauss, Mohammed Al-Kindi, Fahad Al-
Hadhrami, Ton van Heel, John van Wunnik
(PDO)
Bert-Rik de Zwart, Carl Blom, Rifaat Al-Mjeni,
Paul Boerrigter
(Shell Technology Oman)
SPE-155546
PDOs EOR Screening Methodology for Heavy-Oil
Fractured Carbonate Fields - a Case Study
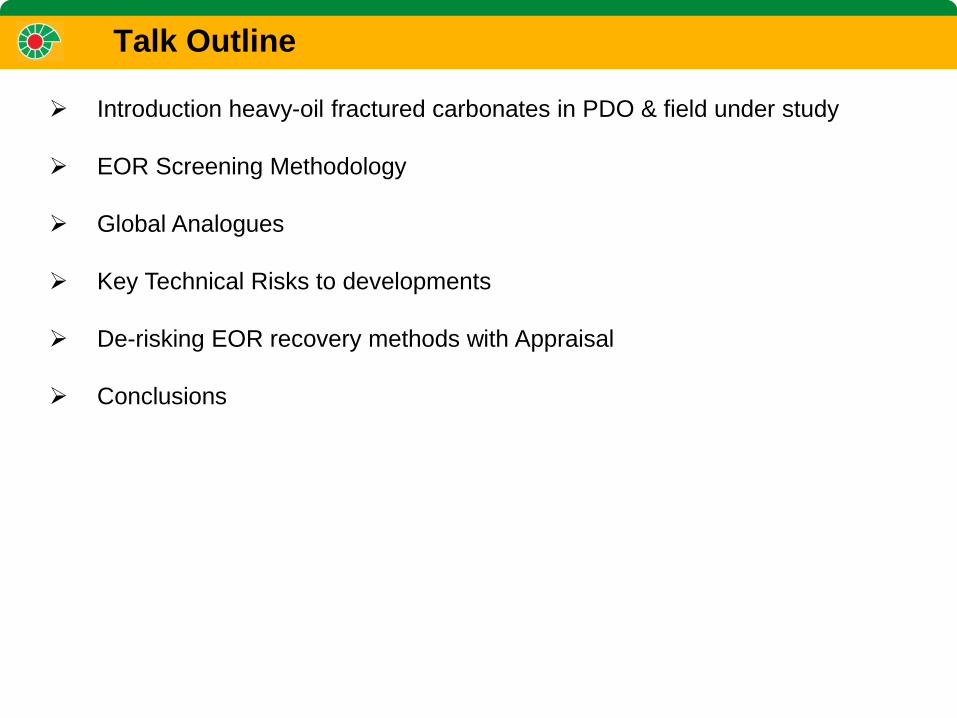
Talk Outline
Introduction heavy-oil fractured carbonates in PDO & field under study
EOR Screening Methodology
Global Analogues
Key Technical Risks to developments
De-risking EOR recovery methods with Appraisal
Conclusions
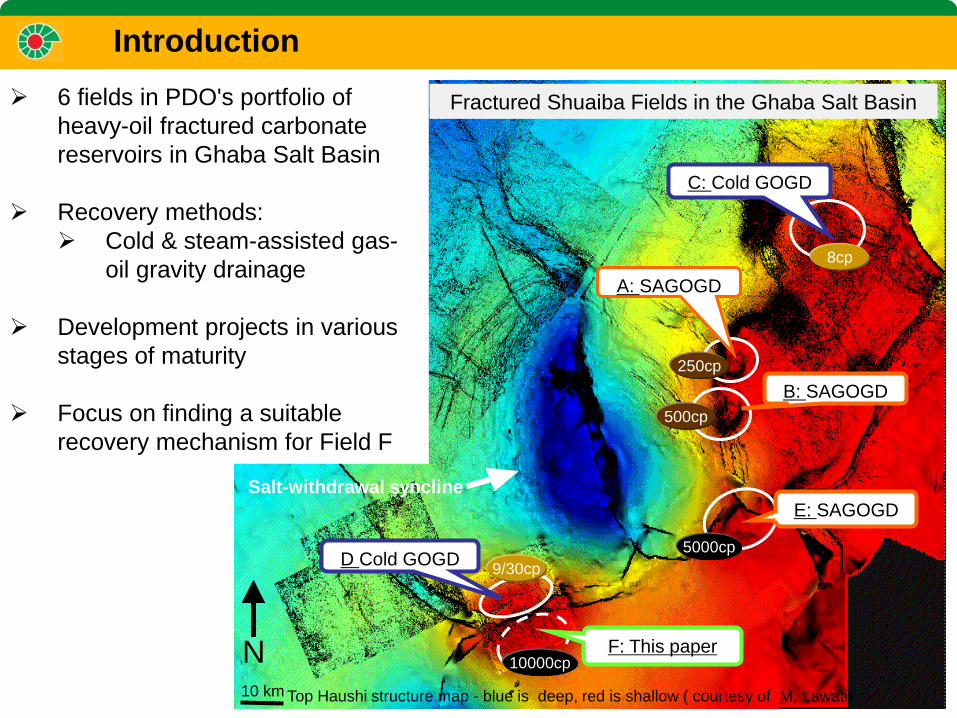
Top Haushi structure map - blue is deep, red is shallow ( courtesy of M. Lawati)
N
Fractured Shuaiba Fields in the Ghaba Salt Basin
Salt-withdrawal syncline
10 km
C: Cold GOGD
A: SAGOGD
B: SAGOGD
D Cold GOGD
F: This paper
500cp
250cp
8cp
9/30cp
E: SAGOGD
10000cp
5000cp
Introduction
6 fields in PDO's portfolio of
heavy-oil fractured carbonate
reservoirs in Ghaba Salt Basin
Recovery methods:
Cold & steam-assisted gas-
oil gravity drainage
Development projects in various
stages of maturity
Focus on finding a suitable
recovery mechanism for Field F
RZ
4
Res. Zone
Haw
ar
Sh
ua
iba
Rese
rvo
ir
Wate
r-fille
d R
ese
rvo
ir r
ocks
Tig
ht
Lim
esto
ne
Sat.
Oil
Porosit
y
GR
F-1
F-3
F-2
F-5
F10 F-9
F-8
F-7
F-6
Field F
Field D
Kh
ara
ib
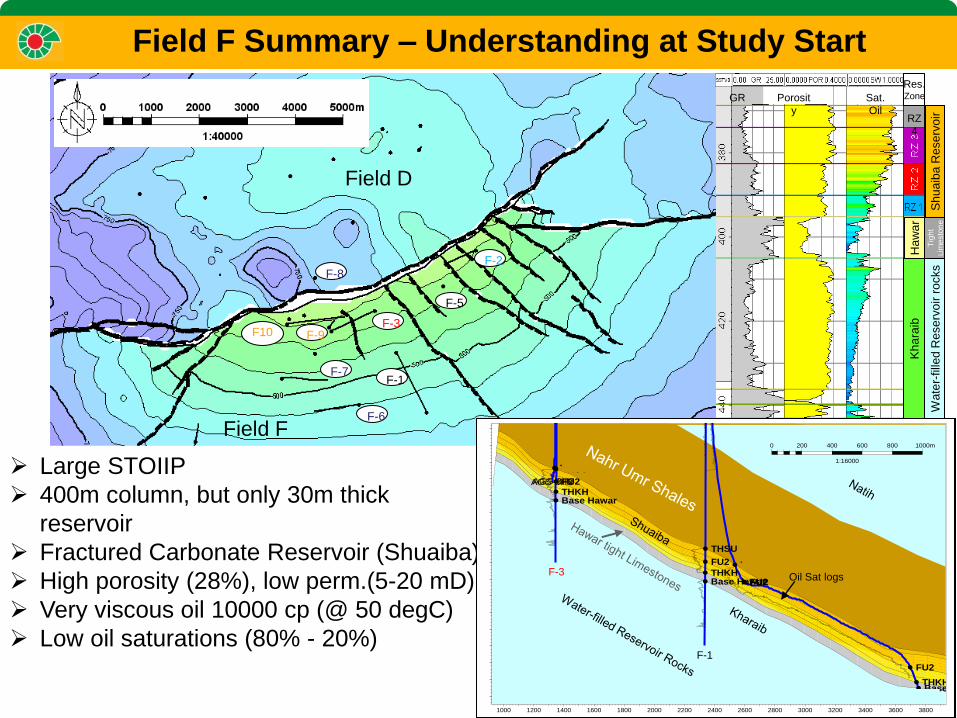
Field F Summary – Understanding at Study Start
Large STOIIP
400m column, but only 30m thick
reservoir
Fractured Carbonate Reservoir (Shuaiba)
High porosity (28%), low perm.(5-20 mD)
Very viscous oil 10000 cp (@ 50 degC)
Low oil saturations (80% - 20%)
AGS-1H1
AGS-3H1
AGS-3H2AGS-3H3
AGS-1H2
THSU
FU2
THKHBase Hawar
THSU
FU2FU2
FU2
THKHBase Hawar
THSU
FU2THKHBase Hawar
THSUTHSU
AGS-4H1
AGS-4H2
AGS-4H3
THSU
THSU
THSU
FU2
THKH
AGS-2H1
AGS-2H2THSU
FU2
THKH
Base Hawar
THSUFU2
AG-20H1AG-4H1
AGS-2H1
AGS-3H1
THSU
FU2
THKHBase Hawar
THSU
FU2THKHBase Hawar
THSU
FU2THKHBase Hawar
THSU
FU2THKHBase Hawar
1000 1200 1400 1600 1800 2000 2200 2400 2600 2800 3000 3200 3400 3600 3800
-640
-600
-560
-520
-480
-440
-400
-360
-320
0 200 400 600 800 1000m
1:16000
6300 6400 6500 6600 6700 6800 6900 7000 7100 7200 7300 7400 7500 7600 7700
-800
-780
-760
-740
-720
-700
-680
-660
-640
-620
0 100 200 300 400 500m
1:8000
14960 15040 15120 15200 15280 15360 15440 15520 15600 15680 15760 15840
-400
-380
-360
-340
-320
-300
0 50 100 150 200 250m
1:5000
400 800 1200 1600 2000 2400 2800 3200 3600 4000 4400 4800 5200
-560
-520
-480
-440
-400
-360
-320
-280
-240
0 250 500 750 1000 1250m
1:27500
F-3
F-1
Oil Sat logs
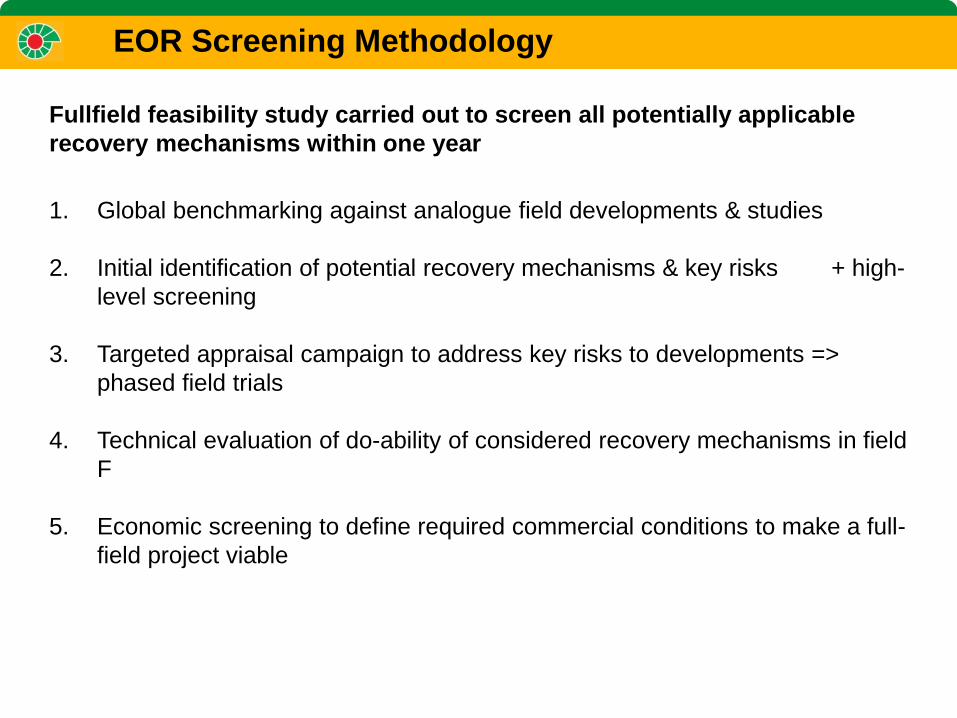
EOR Screening Methodology
Fullfield feasibility study carried out to screen all potentially applicable
recovery mechanisms within one year
1. Global benchmarking against analogue field developments & studies
2. Initial identification of potential recovery mechanisms & key risks + high-
level screening
3. Targeted appraisal campaign to address key risks to developments =>
phased field trials
4. Technical evaluation of do-ability of considered recovery mechanisms in field
F
5. Economic screening to define required commercial conditions to make a full-
field project viable
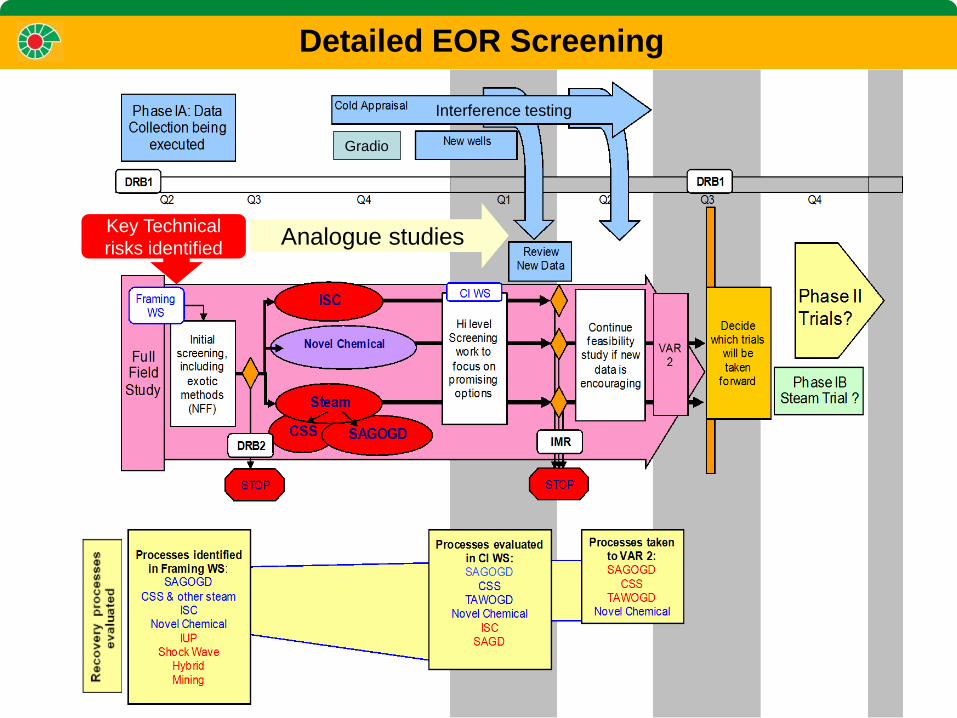
Detailed EOR Screening
Gradio
Interference testing
Analogue studies Key Technical
risks identified
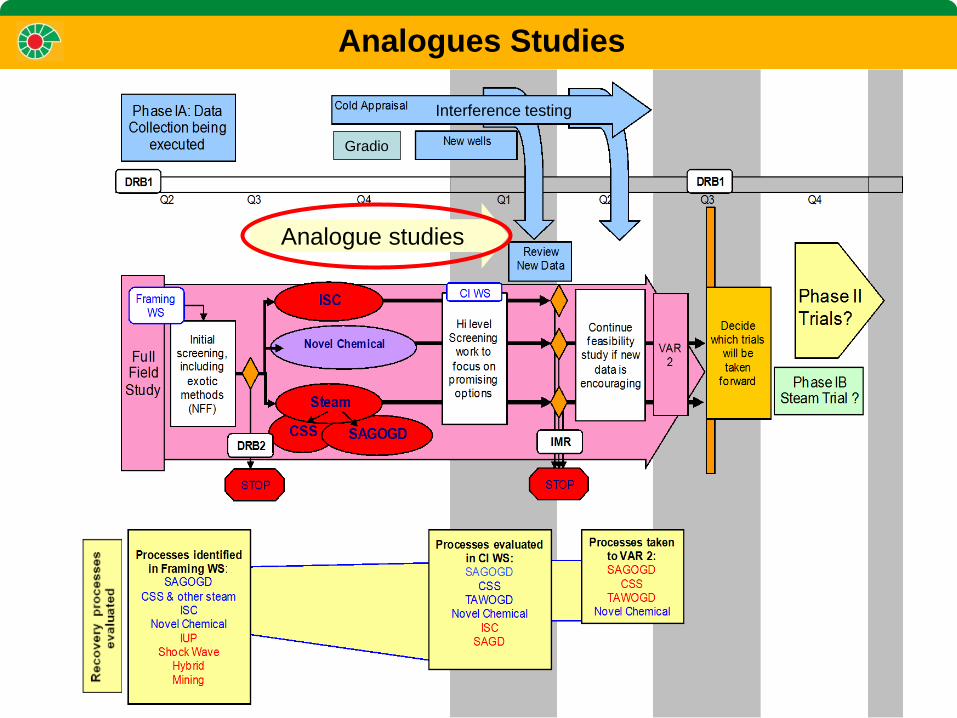
Analogues Studies
Gradio
Interference testing
Analogue studies
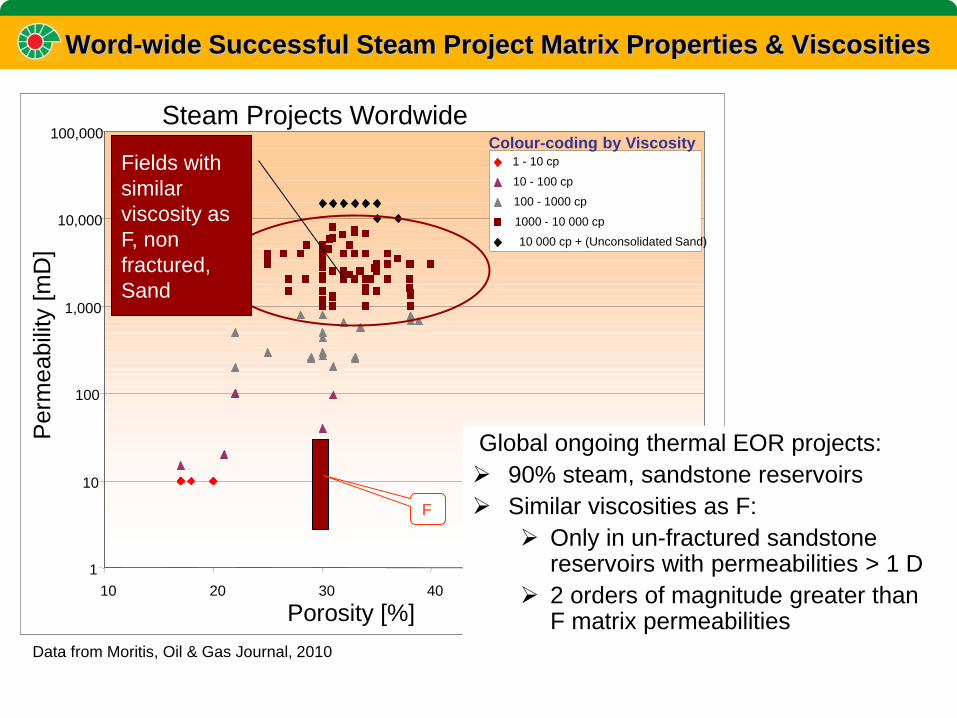
Steam Projects Wordwide
1
10
100
1,000
10,000
100,000
10 20 30 40 50 60
Porosity [%]
Perm
eabili
ty [
mD
]
1 - 10 cp
10 - 100 cp
100 - 1000 cp
1000 - 10 000 cp
10 000 cp + (Unconsolidated Sand)
Word-wide Successful Steam Project Matrix Properties & Viscosities
Global ongoing thermal EOR projects:
90% steam, sandstone reservoirs
Similar viscosities as F:
Only in un-fractured sandstone reservoirs with permeabilities > 1 D
2 orders of magnitude greater than F matrix permeabilities
Data from Moritis, Oil & Gas Journal, 2010
Colour-coding by Viscosity
Fields with
similar
viscosity as
F, non
fractured,
Sand
F
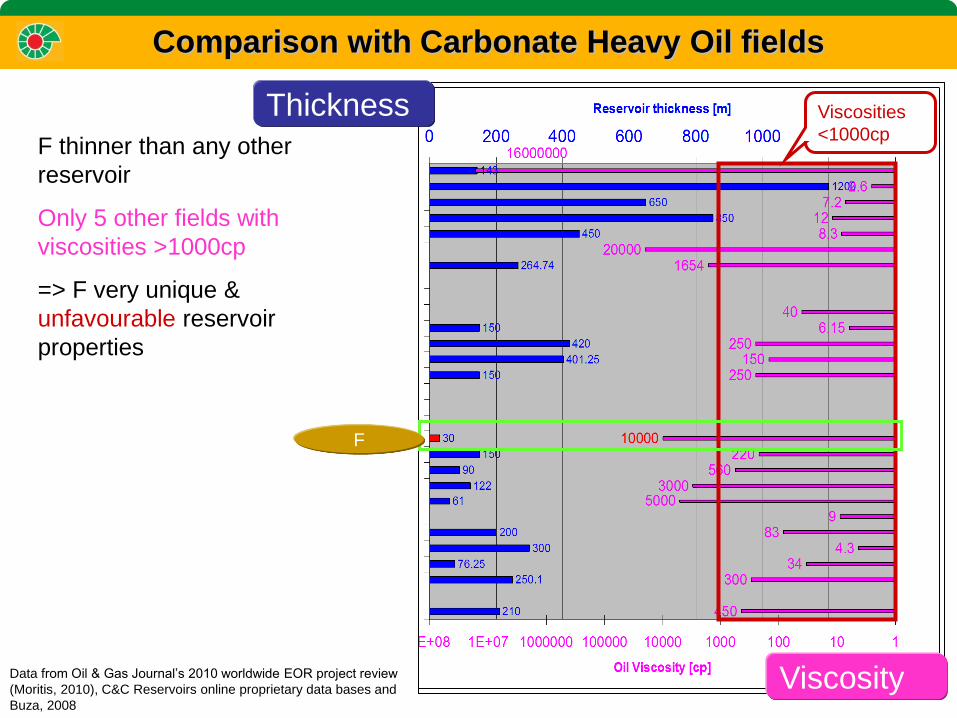
Comparison with Carbonate Heavy Oil fields
F
Viscosity
Thickness Viscosities
<1000cp F thinner than any other
reservoir
Only 5 other fields with
viscosities >1000cp
=> F very unique &
unfavourable reservoir
properties
Data from Oil & Gas Journal’s 2010 worldwide EOR project review
(Moritis, 2010), C&C Reservoirs online proprietary data bases and
Buza, 2008
1
10
100
1000
10000
100000
0 5 10 15 20 25 30 35
Matrix Porosity [%]
Perm
eab
ilit
y [
mD
]
5 - 10cp
10 - 100cp100 - 1000cp
>1000Frac Perm
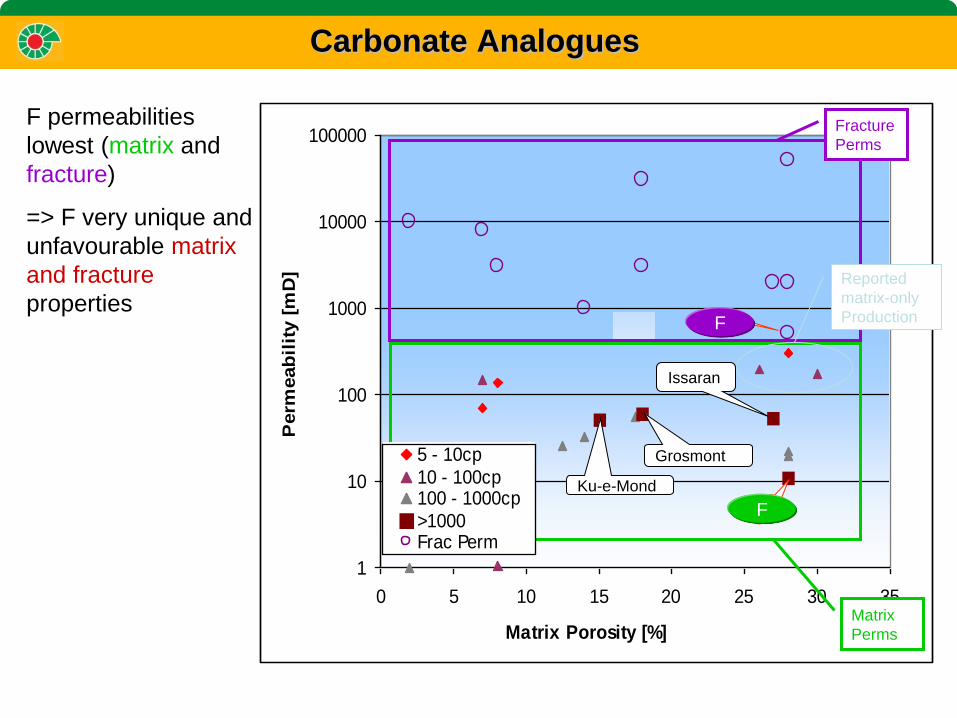
Carbonate Analogues
1
10
100
1000
10000
100000
0 5 10 15 20 25 30 35
Matrix Porosity [%]
Per
mea
bilit
y [m
D]
5 - 10cp
10 - 100cp100 - 1000cp
>1000Frac Perm
Fracture
Perms
Grosmont
Ku-e-Mond
Issaran
S
Reported
matrix-only
Production
Matrix
Perms
1
10
100
1000
10000
100000
0 5 10 15 20 25 30 35
Matrix Porosity [%]
Perm
eab
ilit
y [
mD
]
5 - 10cp
10 - 100cp100 - 1000cp
>1000Frac Perm
AG
S
F permeabilities
lowest (matrix and
fracture)
=> F very unique and
unfavourable matrix
and fracture
properties F
F
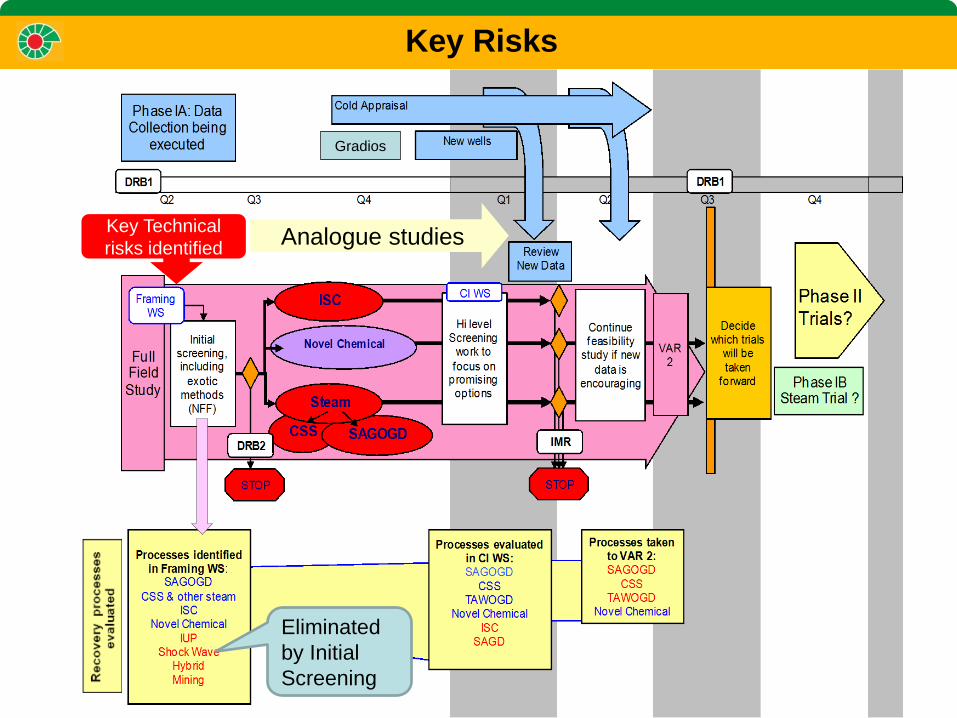
Key Risks
Key Technical
risks identified
Gradios
Analogue studies
Eliminated
by Initial
Screening
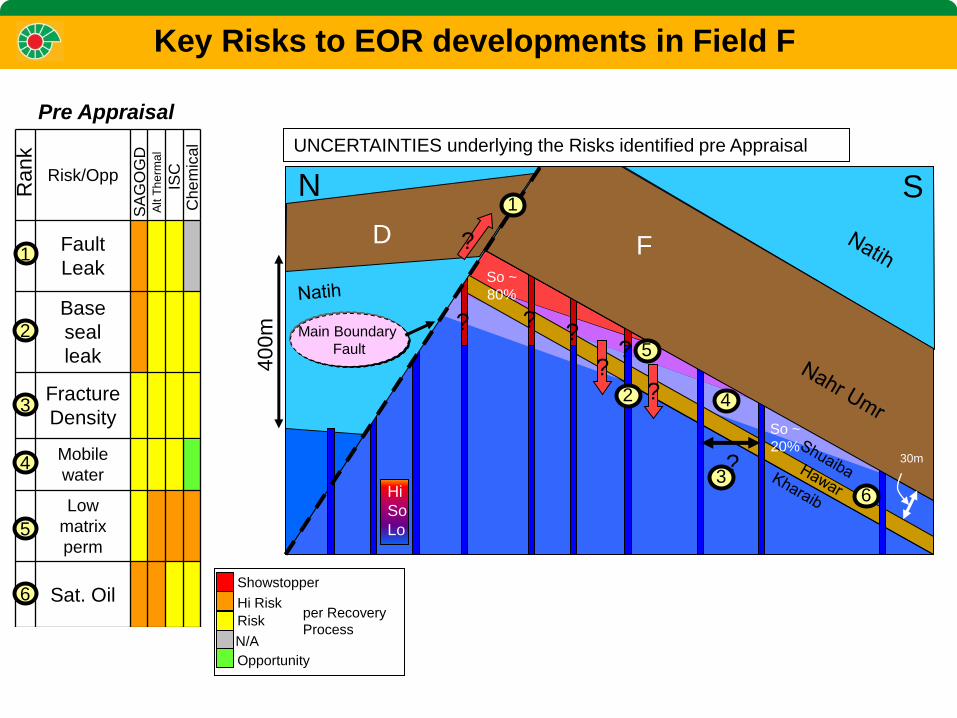
Risk/Opp
1 Fault
Leak
2
Base
seal
leak
3 Fracture
Density
4 Mobile
water
5
Low
matrix
perm
6 Sat. Oil
7 Water
supply and
disposal
SA
GO
GD
A
lt T
he
rma
l
ISC
C
he
mic
al
Rank
1
7
5
4
3
2
6
UNCERTAINTIES underlying the Risks identified pre Appraisal
D F
? ? ?
?
?
?
?
1
2
3
4
5 ?
Main Boundary
Fault
So ~
80%
So ~
20%
40
0m
30m
N S
Showstopper
per Recovery
Process
Opportunity
Risk
Hi Risk
N/A
Hi
So
Lo
Pre Appraisal
Key Risks to EOR developments in Field F
6
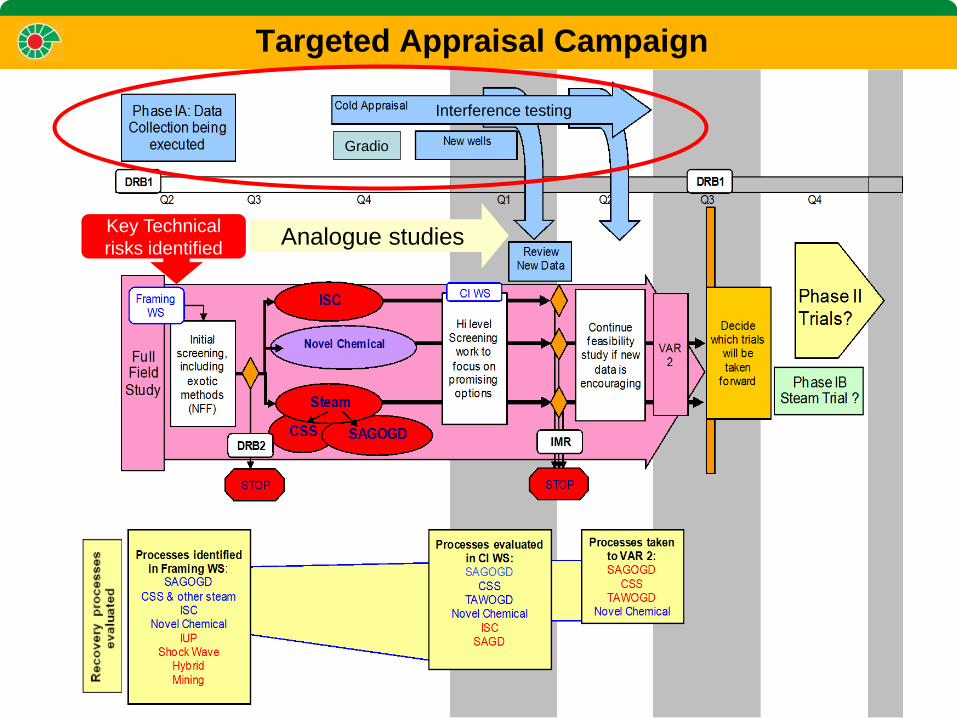
Targeted Appraisal Campaign
Key Technical
risks identified
Gradio
Interference testing
Analogue studies
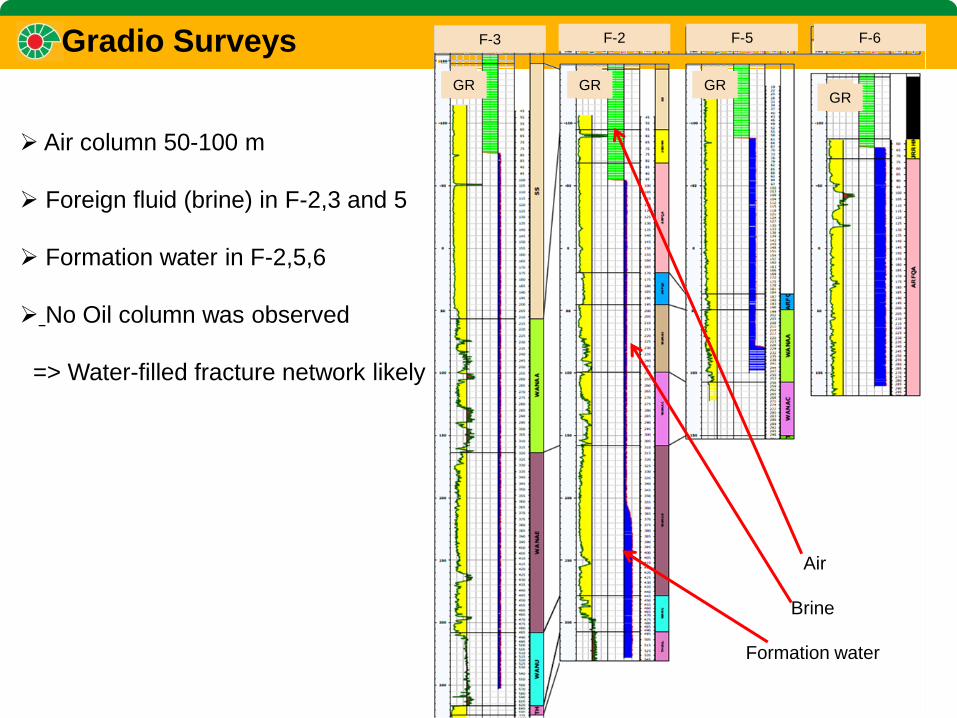
Air
Brine
Formation water
F-3 F-2 F-5 F-6
GR GR GR GR
Gradio Surveys
Air column 50-100 m
Foreign fluid (brine) in F-2,3 and 5
Formation water in F-2,5,6
No Oil column was observed
=> Water-filled fracture network likely
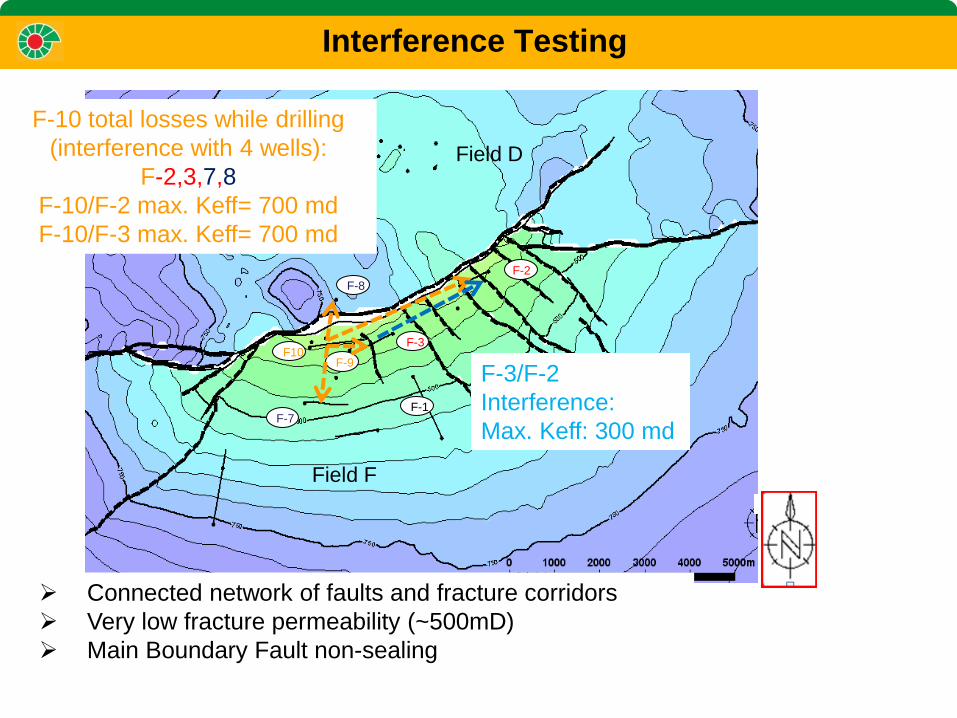
F-1
F-3 F10
F-9
F-8
F-7
Field F
Field D
F-10 total losses while drilling
(interference with 4 wells):
F-2,3,7,8
F-10/F-2 max. Keff= 700 md
F-10/F-3 max. Keff= 700 md
F-3/F-2
Interference:
Max. Keff: 300 md
Interference Testing
Connected network of faults and fracture corridors
Very low fracture permeability (~500mD)
Main Boundary Fault non-sealing
F-2
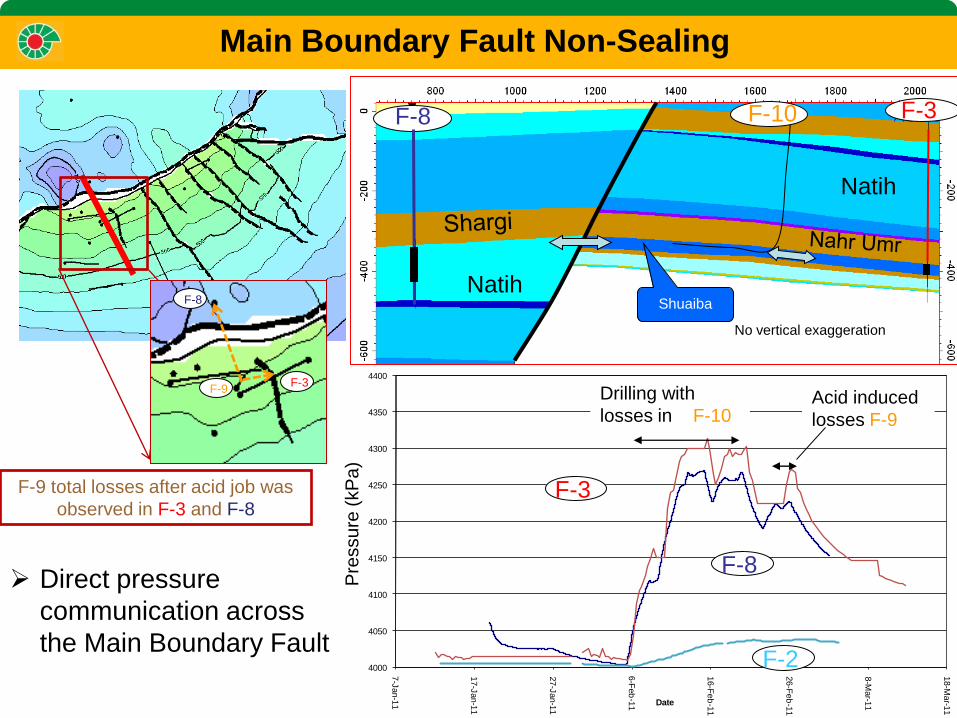
Direct pressure
communication across
the Main Boundary Fault
F-10
Natih
Natih
F-8
No vertical exaggeration
Shuaiba
F-3
4000
4050
4100
4150
4200
4250
4300
4350
4400
7-J
an-1
1
17-J
an-1
1
27-J
an-1
1
6-F
eb
-11
16-F
eb
-11
26-F
eb
-11
8-M
ar-1
1
18-M
ar-1
1
Pre
ssu
re (
kP
a)
Date
Effect of AGS10 Total Losses
AGS8 AGS3 AGS2
F-2
F-8
F-3
Drilling with
losses in F-10 Acid induced
losses F-9
Pre
ssu
re (
kP
a)
Main Boundary Fault Non-Sealing
F-9 total losses after acid job was
observed in F-3 and F-8
F-8
F-3 F-9
F-10
F-9
Gauge
Packer
Inject
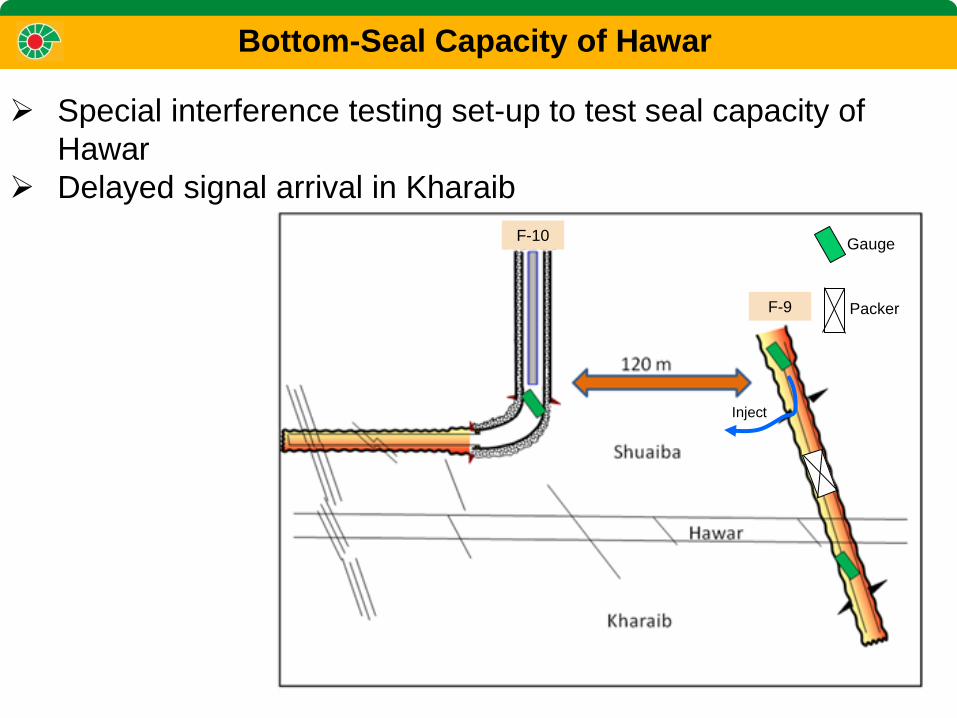
Bottom-Seal Capacity of Hawar
Special interference testing set-up to test seal capacity of
Hawar
Delayed signal arrival in Kharaib
Hawar
Sh
ua
iba
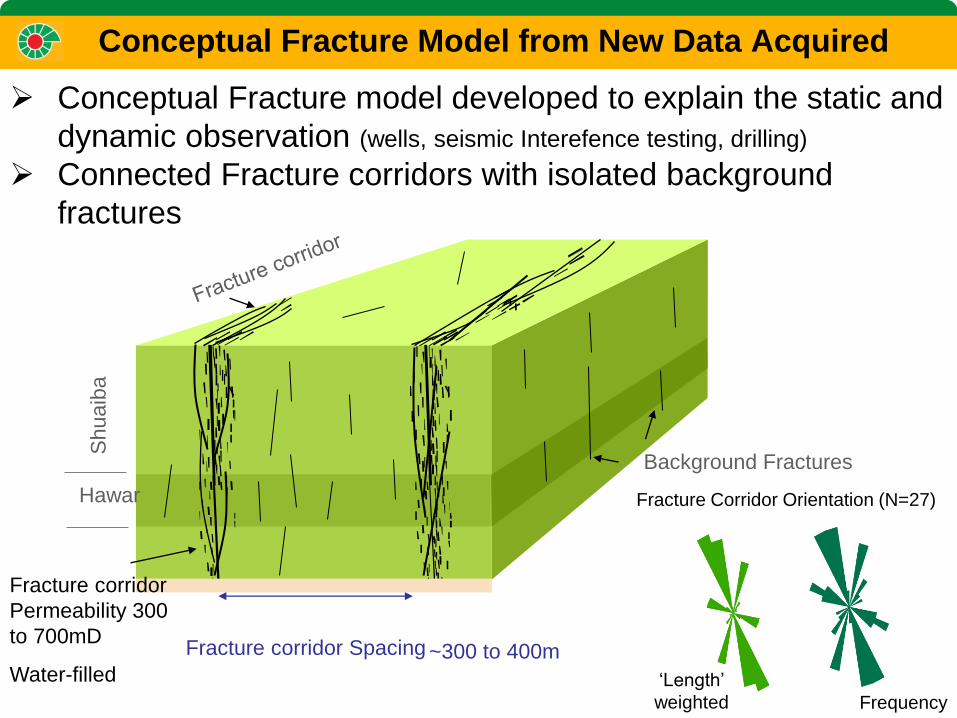
Fracture corridor Spacing ~300 to 400m
Background Fractures
Fracture corridor
Permeability 300
to 700mD
Water-filled
Frequency
‘Length’
weighted
Fracture Corridor Orientation (N=27)
Conceptual Fracture Model from New Data Acquired
Conceptual Fracture model developed to explain the static and
dynamic observation (wells, seismic Interefence testing, drilling)
Connected Fracture corridors with isolated background
fractures
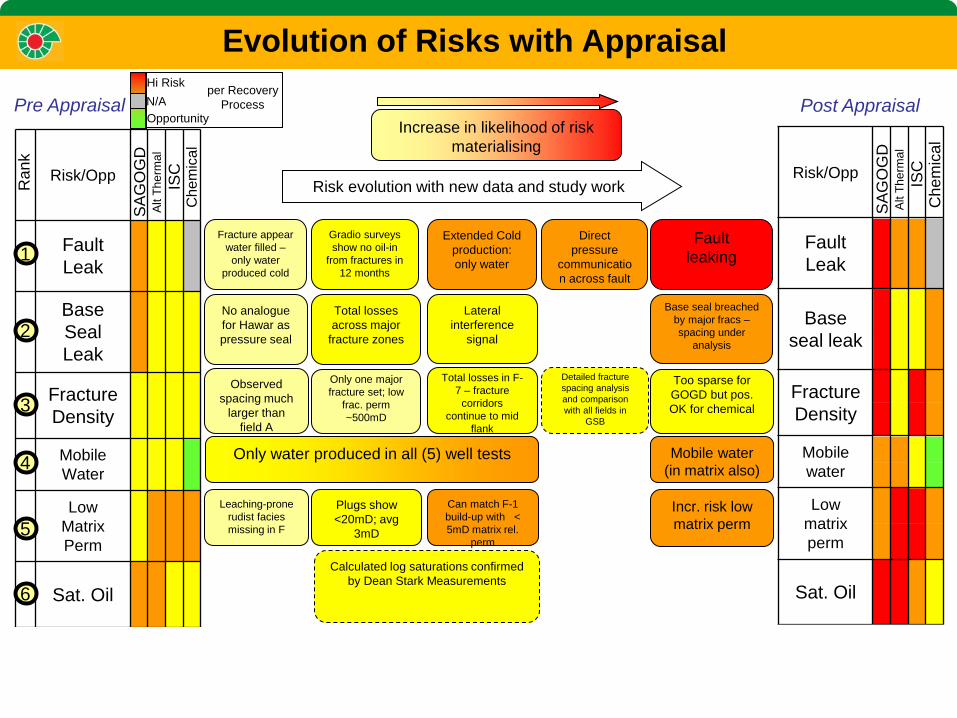
Fracture appear
water filled –
only water
produced cold
Gradio surveys
show no oil-in
from fractures in
12 months
Extended Cold
production:
only water
Direct
pressure
communicatio
n across fault
No analogue
for Hawar as
pressure seal
Total losses
across major
fracture zones
Lateral
interference
signal
Observed
spacing much
larger than
field A
Only one major
fracture set; low
frac. perm
~500mD
Total losses in F-
7 – fracture
corridors
continue to mid
flank
Detailed fracture
spacing analysis
and comparison
with all fields in
GSB
Only water produced in all (5) well tests
Plugs show
<20mD; avg
3mD
Can match F-1
build-up with <
5mD matrix rel.
perm
Leaching-prone
rudist facies
missing in F
Calculated log saturations confirmed
by Dean Stark Measurements
Increase in likelihood of risk
materialising
Risk evolution with new data and study work
Risk/Opp
Fault
Leak
Base
seal leak
Fracture
Density
Mobile
water
Low
matrix
perm
Sat. Oil
Water
supply
and
disposal
SA
GO
GD
A
lt T
he
rma
l
ISC
C
he
mic
al
Post Appraisal Pre Appraisal
Hi Risk
Opportunity
per Recovery
Process N/A
Fault
leaking
Base seal breached
by major fracs –
spacing under
analysis
Too sparse for
GOGD but pos.
OK for chemical
Mobile water
(in matrix also)
Incr. risk low
matrix perm
Evolution of Risks with Appraisal
Risk/Opp
1 Fault
Leak
2
Base
Seal
Leak
3 Fracture
Density
4 Mobile
Water
5
Low
Matrix
Perm
6 Sat. Oil
7
Water
Supply
and
Disposal
SA
GO
GD
A
lt T
he
rma
l
ISC
C
hem
ica
l
Ran
k
1
7
5
4
3
2
6
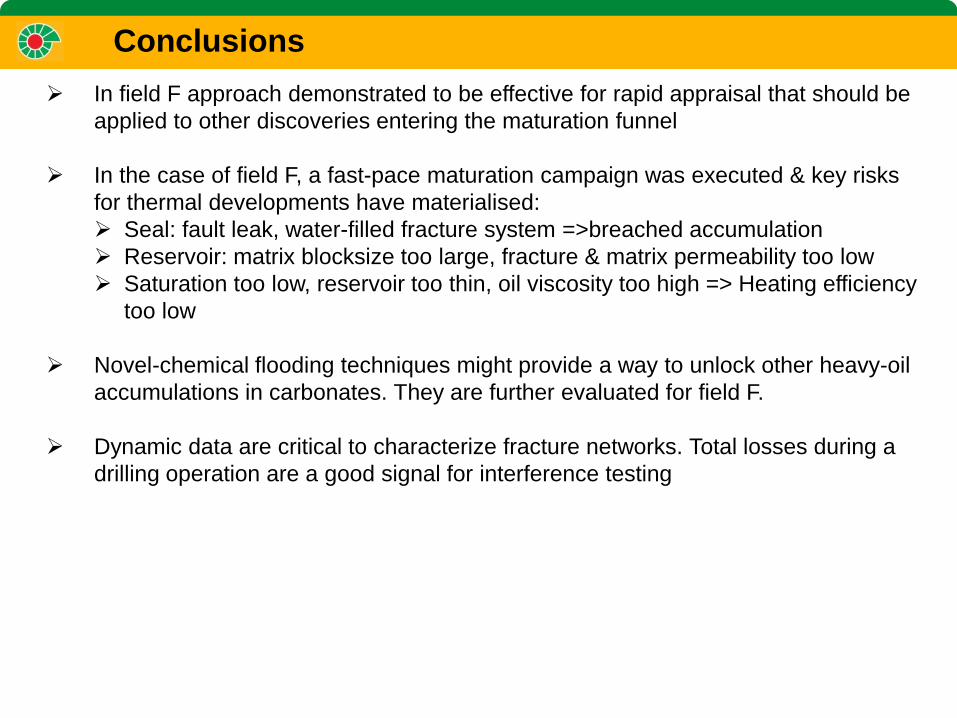
Conclusions
In field F approach demonstrated to be effective for rapid appraisal that should be
applied to other discoveries entering the maturation funnel
In the case of field F, a fast-pace maturation campaign was executed & key risks
for thermal developments have materialised:
Seal: fault leak, water-filled fracture system =>breached accumulation
Reservoir: matrix blocksize too large, fracture & matrix permeability too low
Saturation too low, reservoir too thin, oil viscosity too high => Heating efficiency
too low
Novel-chemical flooding techniques might provide a way to unlock other heavy-oil
accumulations in carbonates. They are further evaluated for field F.
Dynamic data are critical to characterize fracture networks. Total losses during a
drilling operation are a good signal for interference testing
Petroleum Development Oman
Analogues Methodology
Extensive research has been carried out to find analogues for F
Analysis of general energy measures for steam projects
Data base & literature research for heavy all heavy oil developments (SPE, CC
data base, Oil & Gas Journal)
Scanning of field data from the heavy-oil Carbonate provinces (Middle East,
Europe, Canada, Mexico)
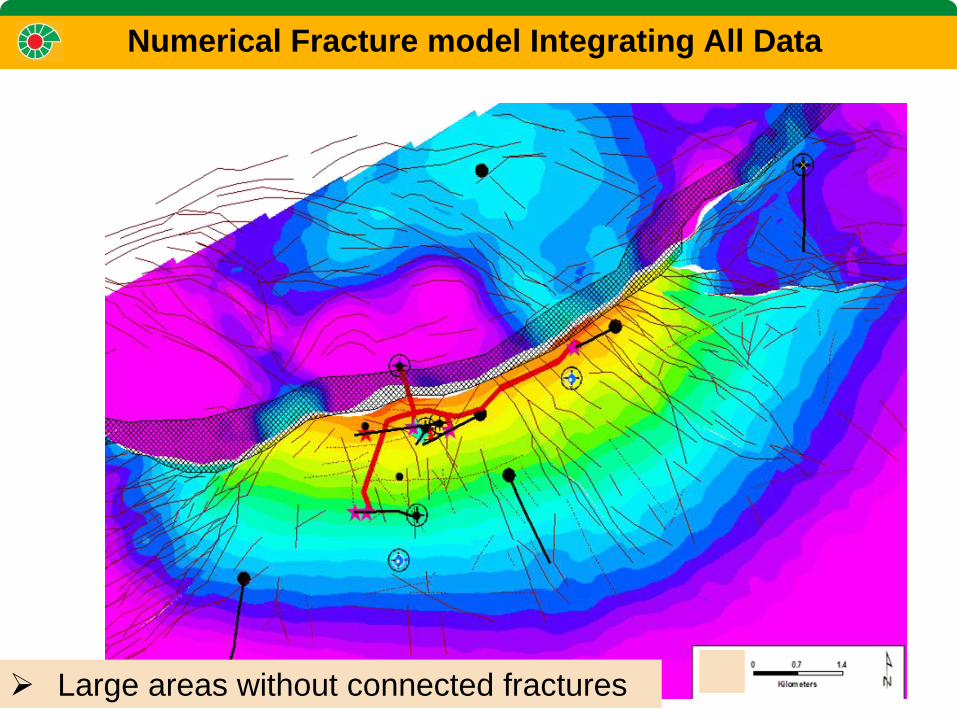
Numerical Fracture model Integrating All Data
Large areas without connected fractures
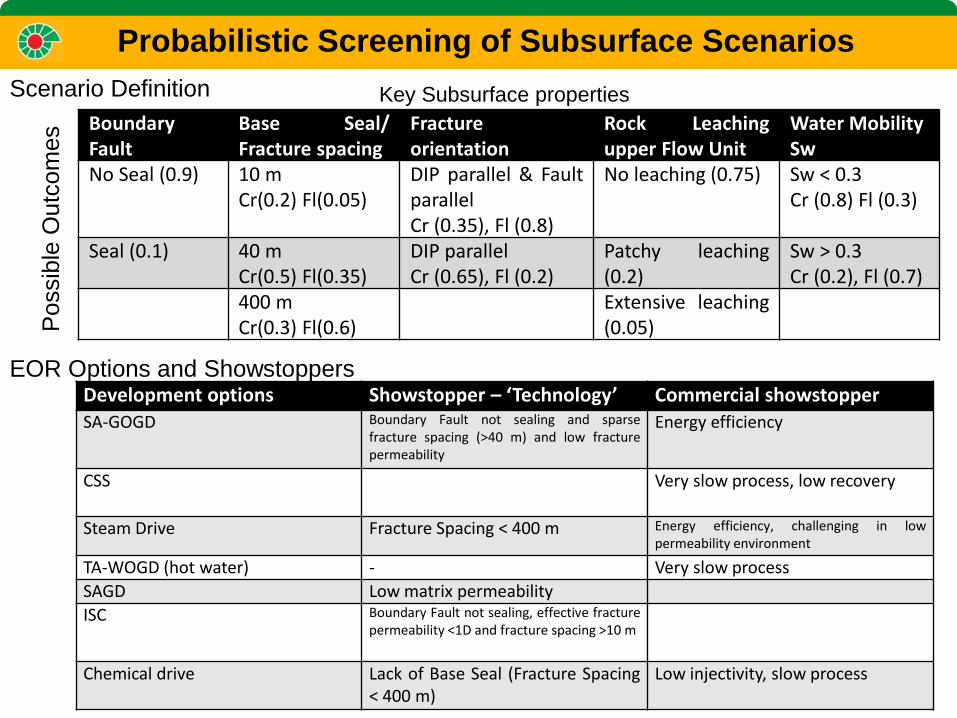
Probabilistic Screening of Subsurface Scenarios
Scenario Definition
Boundary Fault
Base Seal/ Fracture spacing
Fracture orientation
Rock Leaching upper Flow Unit
Water Mobility Sw
No Seal (0.9) 10 m Cr(0.2) Fl(0.05)
DIP parallel & Fault parallel Cr (0.35), Fl (0.8)
No leaching (0.75) Sw < 0.3 Cr (0.8) Fl (0.3)
Seal (0.1) 40 m Cr(0.5) Fl(0.35)
DIP parallel Cr (0.65), Fl (0.2)
Patchy leaching (0.2)
Sw > 0.3 Cr (0.2), Fl (0.7)
400 m Cr(0.3) Fl(0.6)
Extensive leaching (0.05) P
ossib
le O
utc
om
es
Key Subsurface properties
Development options Showstopper – ‘Technology’ Commercial showstopper SA-GOGD Boundary Fault not sealing and sparse
fracture spacing (>40 m) and low fracture permeability
Energy efficiency
CSS Very slow process, low recovery
Steam Drive Fracture Spacing < 400 m Energy efficiency, challenging in low permeability environment
TA-WOGD (hot water) - Very slow process
SAGD Low matrix permeability
ISC Boundary Fault not sealing, effective fracture permeability <1D and fracture spacing >10 m
Chemical drive Lack of Base Seal (Fracture Spacing < 400 m)
Low injectivity, slow process
EOR Options and Showstoppers
0
0.1
0.2
0.3
0.4
0.5
0.6
0.7
0.8
0.9
1
SAGOGD CSS Steam Drive SAGD ISC (quasi
SAGOGD)
Solvent Drive Solvent Ass.
GOGD
TAWOGD
Crest Flank
0
0.1
0.2
0.3
0.4
0.5
0.6
0.7
0.8
0.9
1
SAGOGD CSS Steam Drive SAGD ISC (quasi
SAGOGD)
Solvent Drive Solvent Ass.
GOGD
TAWOGD
Crest Flank
Chemical
Drive
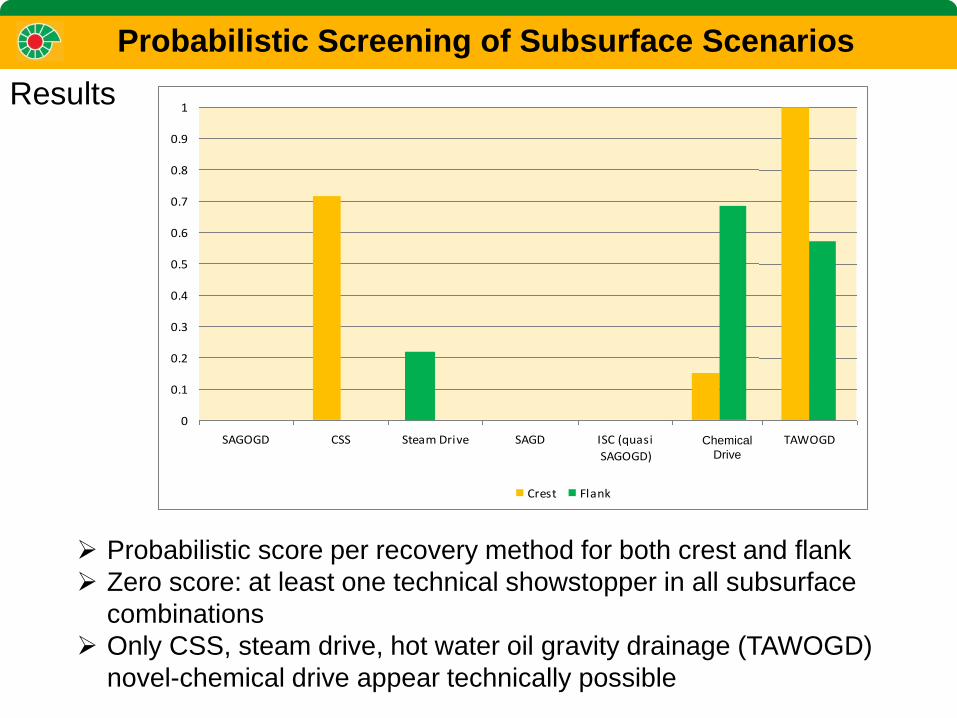
Probabilistic Screening of Subsurface Scenarios
Results
Probabilistic score per recovery method for both crest and flank
Zero score: at least one technical showstopper in all subsurface
combinations
Only CSS, steam drive, hot water oil gravity drainage (TAWOGD)
novel-chemical drive appear technically possible
Petroleum Development Oman
The Authors thank
Petroleum Development Oman
and
Sultanate of Oman Ministry of Oil and Gas
for permission to present this work
Acknowledgements
Warrlich, GEO12