Simplifying Fraud Analytics: Title 10 Steps to Detect and ... Fraud Analytics: 10 Steps to Detect...
11
WHITE PAPER Simplifying Fraud Analytics: 10 Steps to Detect and Prevent Insurance Fraud
Transcript of Simplifying Fraud Analytics: Title 10 Steps to Detect and ... Fraud Analytics: 10 Steps to Detect...
Title
WHITE PAPER
Simplifying Fraud Analytics: 10 Steps to Detect and Prevent Insurance Fraud
ii
ContentsIntroduction ........................................................................................................... 1
Step 1: Gearing Up for Data Management .................................................... 1
Step 2: Visualizing Data ...................................................................................... 2
Step 3: Harnessing Business Rules ................................................................... 3
Step 4: Searching Databases ........................................................................... 3
Step 5: Detecting Anomalies ............................................................................ 4
Step 6: Delving Deeper With Predictive Modeling ...................................... 4
Step 7: Realizing the Value of Text Analytics .................................................. 5
Step 8: Identifying Organized Fraud Through Social Network Link Analysis ............................................................................. 6
Step 9: Managing and Triaging Alerts ............................................................ 7
Step 10: Knowing Your Deployment Options ............................................... 7
Capturing the Benefits ....................................................................................... 8
Conclusion ............................................................................................................. 8
For More Information .......................................................................................... 8
IntroductionInsurance fraud has existed wherever insurance policies are written, taking different forms to suit the economic times. Today the magnitude of insurance fraud is not only startling but increasing. Recent studies by the US National Insurance Crime Bureau (NICB) reported a 24 percent rise in questionable claims for the period 2011 to 2013.¹ The full scale of insurance fraud is not known. And if fraudulent behavior is not discovered at the time the claim is submitted, the insurer may never know it occurred. Consequently, an uninvestigated claim can’t be labeled as fraudulent to investigate.
Insurance fraud comes in many shapes and sizes. Most insurers continue to focus on claims fraud, but fraudulent activities are prevalent through the entire insurance life cycle, from the initial application process to claims. As losses continue to grow, detecting and preventing fraud is consistently ranked among the top three investment and strategic priorities for insurance executives. Technology is playing a more impor-tant part in combating this issue; in fact, a study by the Coalition Against Insurance Fraud found that 95 percent of insurers are using anti-fraud technology.²
Traditional fraud detection systems tend to focus on opportunistic or soft fraud. This is when an individual takes advantage of a situation to pay a lower premium or exag-gerate a claim. But hard fraud perpetrated by organized crime rings is growing – and so is the sophistication and velocity of attacks. While it is impossible to predict future trends in fraudulent activities, it’s obvious that there is no one bulletproof fraud detec-tion technique. However, insurers that adhere to the following 10 steps offer the best chance for detecting both opportunistic and organized fraud.
Step 1: Gearing Up for Data ManagementData is the most valuable commodity for detecting and preventing insurance fraud. Unfortunately, information silos are still prevalent in the insurance industry. Insurers typi-cally have multiple legacy transactional systems, often for each line of business.
Hence when an insurer has an individual with profiles across multiple systems, it needs to be able to identify them as the same person and resolve different data variations into a single entity. In many cases, entity resolution can be solved using simple business rules based on data items like date of birth and phone numbers. But in many cases this is not enough, especially as fraudsters are deliberately trying to hide or manipulate identities. To combat these challenges, insurers are now using advanced analytical tech-niques such as probabilistic matching to determine the actual statistical likelihood that two entities are the same.
1
As losses continue to grow, detecting and preventing fraud is consistently ranked among the top three investment and stra-tegic priorities for insurance executives.
1 Scafidi, Frank. “Third Quarter 2013 Questionable Claims.” National Insurance Crime Bureau. November 18, 2013. Accessed March 4, 2016. https://www.nicb.org/newsroom/news-releases/third-quarter-2013-questionable-claims.
2 “The State of Insurance Fraud Technology.” Coalition Against Insurance Fraud and SAS. September 2014. http://www.sas.com/en_us/whitepapers/coalition-against-insurance-fraud-the-state-of-insurance-fraud-tech-nology-105976.html.
2
Companies should not underestimate the amount of work required for data manage-ment. It’s not uncommon to dedicate more than 50 percent of the fraud technology implementation effort to data integration and data quality. An enterprise data architec-ture can standardize and rationalize data across the enterprise, address data quality and accessibility, easily incorporate external data, and include mechanisms to capture and use both structured and unstructured data.
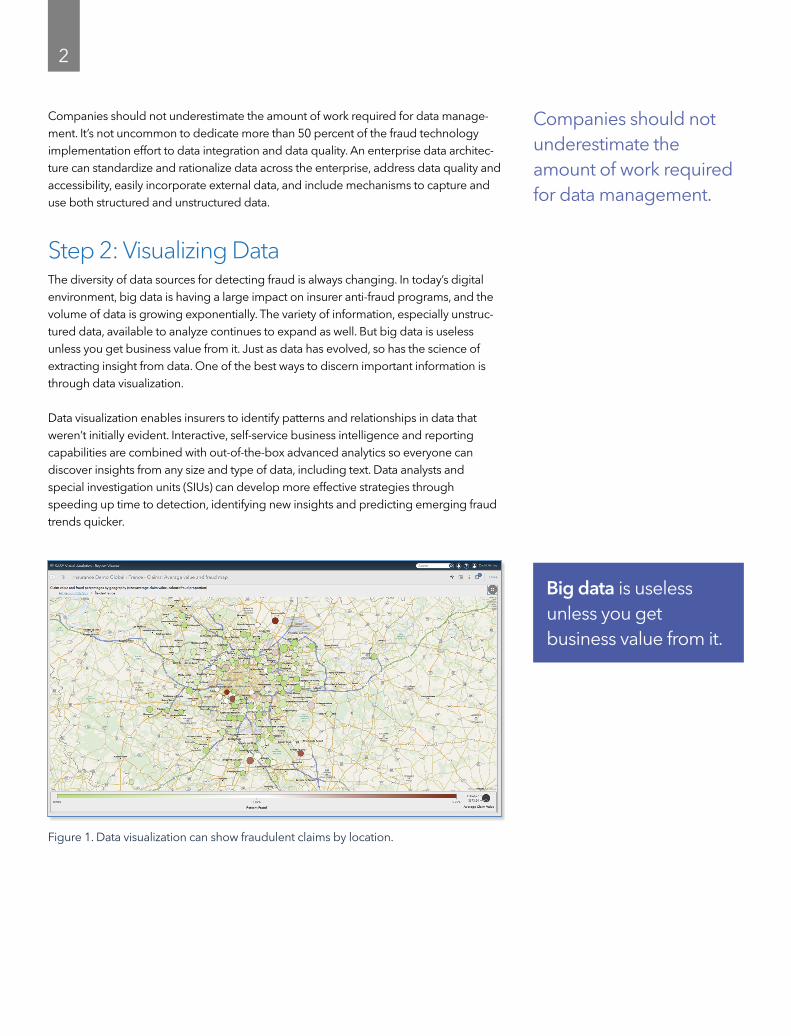
Step 2: Visualizing DataThe diversity of data sources for detecting fraud is always changing. In today’s digital environment, big data is having a large impact on insurer anti-fraud programs, and the volume of data is growing exponentially. The variety of information, especially unstruc-tured data, available to analyze continues to expand as well. But big data is useless unless you get business value from it. Just as data has evolved, so has the science of extracting insight from data. One of the best ways to discern important information is through data visualization.
Data visualization enables insurers to identify patterns and relationships in data that weren’t initially evident. Interactive, self-service business intelligence and reporting capabilities are combined with out-of-the-box advanced analytics so everyone can discover insights from any size and type of data, including text. Data analysts and special investigation units (SIUs) can develop more effective strategies through speeding up time to detection, identifying new insights and predicting emerging fraud trends quicker.
Companies should not underestimate the amount of work required for data management.
Figure 1. Data visualization can show fraudulent claims by location.
Big data is useless unless you get business value from it.

3
Step 3: Harnessing Business RulesRules-based systems test each transaction against a predefined set of algorithms or business rules to detect known types of fraud based on specific patterns of activity. These systems flag any claims that look suspicious due to their aggregate scores or relation to threshold values.
The advantage of the flag approach is its simplicity. After initially configuring the business rules, it is easy to match activities to accounts with very little investment or training. Unfortunately, business rules often generate high false-positive rates and undetected fraud because fraudsters can easily learn and manipulate such rules. In fact, 17 percent of the Coalition Against Insurance Fraud survey respondents cited excessive false-positives/negatives as the biggest challenge to implementing an anti-fraud solution. Thus it’s important that insurers have the ability to review and change rules on a regular basis (at least half-yearly) due to deterioration. In addition, business rules are based on past fraud experiences, so they fail to detect new fraud techniques.
Step 4: Searching Databases Insurance companies have been relying on internal data to identify and fight claims for decades. But often this is not enough to recognize suspicious activities, and capitalizing on existing external data has become crucial. Adding sources such as industry consor-tiums that aggregate and share historical claims data to validate new claims, fraud watch lists, public records, medical billing data, underwriting information and auto esti-mates can have tremendous impact on fraud modeling.
The availability of this huge bank of collective data, powered by search interfaces, allows adjusters and investigators to view massive amounts of information from numerous sources. Is this claimant on a hot list? What other claims activity is associated with this individual or entity? How many claims were accepted or denied? What suspi-cious patterns become evident, now that you have a broader perspective?
Figure 2. Bar chart showing the frequency of a business rule triggered by claims activity.
Unfortunately, business rules often generate high false-positive rates and undetected fraud because fraudsters can easily learn and manipulate such rules.
4
A clear advantage of searching with third-party data is that you can identify patterns of fraud beyond your own organization. But database searching has its limitations. For one, it is only effective if you can find a positive match in the third-party database – which can be challenge as fraudsters are often deliberately concealing or manipulating their identities. Absence of a record is not a meaningful finding, nor does a positive finding indicate intent to defraud. Investigators must be skilled at reviewing and inter-preting data to effectively use these services.
The past few years have seen the introduction of nonprofit organizations, like the South African Insurance Crime Bureau, tasked with addressing cross-industry fraud. This consortium approach is based on a collaboration between the insurance companies in sharing data to identify and curb cross-carrier or syndicated fraud. Other countries that have already implemented this tactic include the UK, Turkey and Canada.
Step 5: Detecting AnomaliesWith anomaly detection, you define baselines for key performance indicators (KPIs) associated with tasks or events, then set thresholds. When a threshold for a particular measure is exceeded, then the event is reported. Outliers or anomalies could indicate a new or previously unknown pattern of fraud.
This analytical technique is straightforward, easy to implement, and – besides detecting unknown fraud patterns – can be useful for evaluating individual performance and iden-tifying employee training opportunities. Once in place, the system functions automati-cally. Adjuster and SIU activities are monitored, and you can quickly identify and correct problems.
Step 6: Delving Deeper With Predictive ModelingHistorically, insurance companies have adhered to a pay-and-chase process rather than a predictive model aimed at preventing fraud before a bad policy is written, a loss is incurred, or a payout is made on fraudulent claims.
A predictive modeling process is where data scientists, statisticians and quantitative analysts use data mining tools to build predictive models that produce fraud propensity scores. As data is entered and updated, claims are automatically scored for their likeli-hood to be fraudulent and made available for review. Predictive modeling tends to be more accurate than other fraud detection methods. Information can be collected and cross-referenced from a variety of data sources. This diversity of resources provides a better balance of data than the more labor-intensive business rules flagging system.
A clear advantage of searching with third-party data is that you can identify patterns of fraud beyond your own organization.
Outliers or anomalies could indicate a new or previously unknown pattern of fraud.
Predictive modeling tends to be more accurate than other fraud detection methods.
5
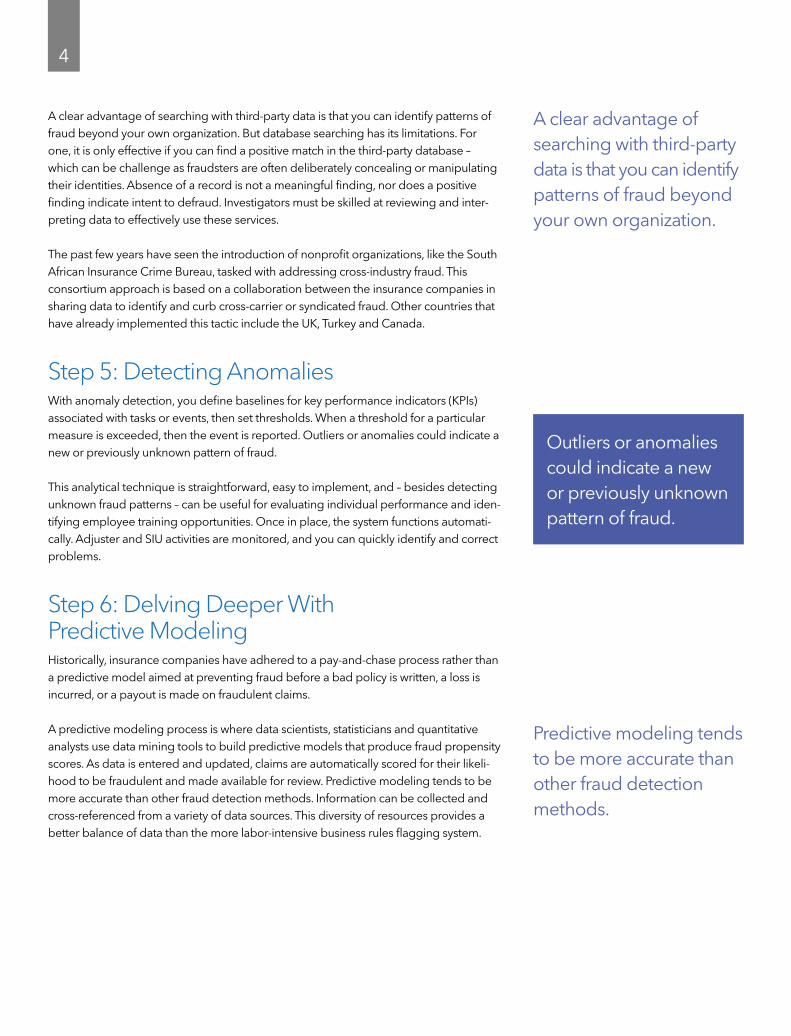
Step 7: Realizing the Value of Text AnalyticsWithin many insurance organizations, some of the most useful information is buried within unstructured textual data. The claims process collects and generates large volumes of text-based information, such as adjuster notes, emails, customer service calls and claimant interviews. In fact, unstructured data can represent up to 80 percent of claims data.
Text mining software accesses the unstructured text, parses it to distill meaningful data, and analyzes the newly created data to gain a deeper understanding of the claim. For example, you might use text mining to look for scripted comments in auto-accident claims. It would be a little suspicious if multiple claimants, allegedly unrelated, all say exactly the same thing. Text mining can be very helpful in revealing these types of discrepancies or conditions.
A new area of text mining is the ability to analyze the huge amount of data available within the social media world. Investigators are now searching Facebook, YouTube and other social media websites for incriminating evidence of the claimant. While this social media angle is rather advanced, some insurance companies are using software to effec-tively mine and analyze this unstructured text data in meaningful ways.
Figure 3. An example of a word cloud based on loss ratio.
Unstructured data can represent up to 80 percent of claims data.

6
Step 8: Identifying Organized Fraud Through Social Network Link AnalysisOrganized fraud involving multiple linked claims is pervasive and continues to expand. To address organized fraud rings, insurers can capitalize on emerging, highly sophisticated capabilities to analyze social networks and identify connections and patterns.
Network link analysis has proven effective in identifying organized fraud activities by modeling relationships between entities in claims and new business. The key entity is individual or claimant, but other types of entities may be locations, service providers, telephone numbers and vehicle identification numbers – to name just a few. Large volumes of seemingly unrelated claims can be checked, and then patterns and problems identified. This technique might show a high-activity account with links from many accounts, or a low-activity account with strong links to a master account. It might reveal multiple claims in a short period of time from related parties, such as members of a single family, or the classic ring associated with staged accident scams.
Network link analysis should be fully automated, with the system continuously updating the interrelated networks with new claims and policies and rescoring for fraud. If a network score indicates fraud, then this can be used to flag the new claim as it is notified and the system matches it to the network. Investigators can search across the full customer base of claims and policies in seconds and turn up visual indications of connections and overlaps among them.
Insurers have successfully used network link analysis to identify the presence of orga-nized fraud rings and take appropriate action. Furthermore, insurers can use these linking and network scoring techniques to not only avoid paying fraudulent claims at first notification of loss, but also check new policies for connections to historical fraud to avoid proliferation of fraud.
Figure 4. Example of social network analysis showing a suspicious network.
Investigators can search across the full customer base of claims and policies in seconds and turn up visual indications of connections and overlaps among them.
7
Step 9: Managing and Triaging Alerts No anti-fraud technology is an absolute silver bullet. The best strategy for detecting and preventing insurance fraud is a hybrid approach with multiple analytical techniques working together. By using an online scoring engine that uses a combination of business rules, anomaly detection, advanced analytical tools and social network link analytics, insurers can calculate the propensity for fraud with a high degree of certainty.
The management of suspicious activities and fraud cases is critical to the business, but also very time-sensitive. Rules often regulate how quickly an insurance company must respond to a claim, resulting in overwhelmed SIU experts and potential fraudulent activities going uninvestigated. Alert management assembles and prioritizes alerts and routes them to the appropriate team member. This provides investigators with a more complete perspective on the risk, enabling them to conduct more efficient, effective investigations, leading to reduced costs and most importantly, better fraud prevention.
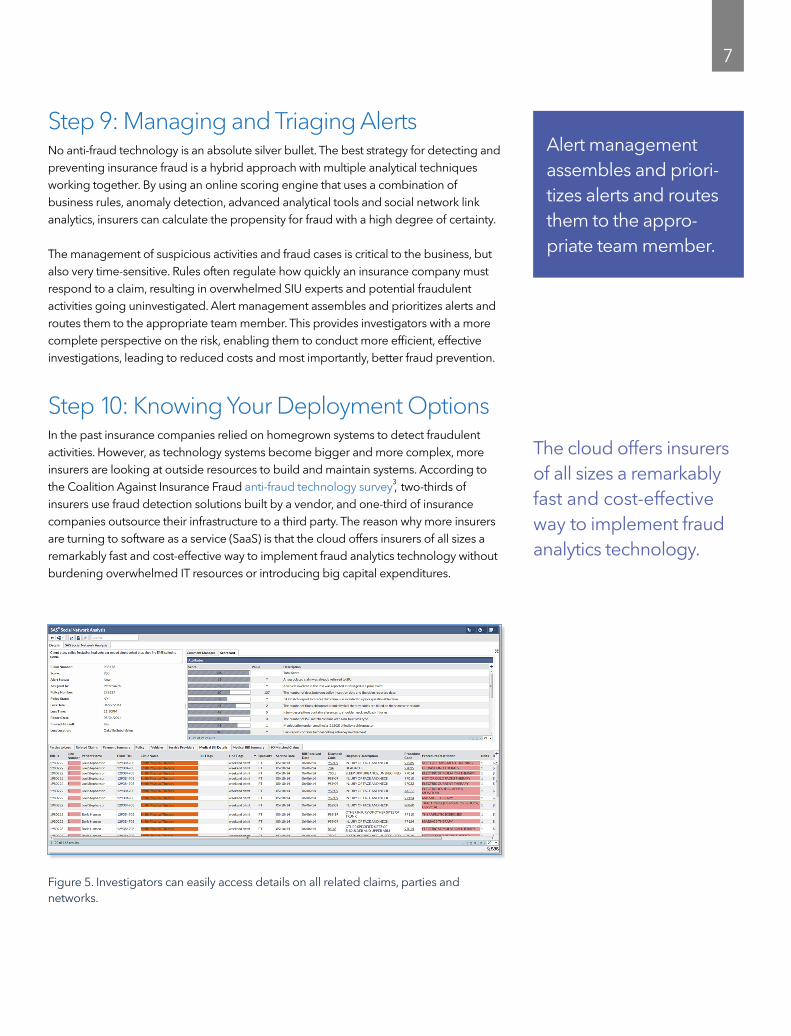
Step 10: Knowing Your Deployment OptionsIn the past insurance companies relied on homegrown systems to detect fraudulent activities. However, as technology systems become bigger and more complex, more insurers are looking at outside resources to build and maintain systems. According to the Coalition Against Insurance Fraud anti-fraud technology survey3, two-thirds of insurers use fraud detection solutions built by a vendor, and one-third of insurance companies outsource their infrastructure to a third party. The reason why more insurers are turning to software as a service (SaaS) is that the cloud offers insurers of all sizes a remarkably fast and cost-effective way to implement fraud analytics technology without burdening overwhelmed IT resources or introducing big capital expenditures.
Alert management assembles and priori-tizes alerts and routes them to the appro-priate team member.
Figure 5. Investigators can easily access details on all related claims, parties and networks.
The cloud offers insurers of all sizes a remarkably fast and cost-effective way to implement fraud analytics technology.
8
Capturing the Benefits SAS has a large number of insurers across the globe that are already benefiting from following these steps and using these types of technologies. Some examples include:
• Allianz Insurance in the Czech Republic saved approximately CZK 110 million (US$4.5 million) per year by reducing the number of fraudulent claims paid.
• Poste Assicura in Italy has estimated savings of between 5 and 10 percent of claims paid.
• CNA in the US has seen savings of over $6.4 million and improved its rate of cases flagged for fraud from 3.7 to 8.1 percent within two years.
• A US Tier 1 insurer has seen an 80 to 90 percent reduction in the average days to detect suspicious claims.
ConclusionIt has become imperative for insurers to develop a reliable and effective strategy to proactively deal with mounting insurance fraud problem. SAS® Fraud Framework for Insurance enables insurers to detect, prevent and manage both opportunistic and profes-sional fraud across multiple lines of business. It includes components for fraud detection and alert management, along with the ability to uncover hidden relationships among fraudsters so you can focus on stopping the highest-value fraud networks.
Data and analytics can dramatically help with the detection of fraudulent activity and patterns, but claims adjusters and SIUs will always be required to turn the analytical insights into useful results. The time is right for insurance companies to invest in tech-nology and resources to prevent claims fraud before it reaches epidemic proportions.
For More InformationLearn more about SAS solutions for insurance fraud at sas.com/insurance.
And visit the Analytic Insurer blog: blogs.sas.com/content/insurance.

SAS and all other SAS Institute Inc. product or service names are registered trademarks or trademarks of SAS Institute Inc. in the USA and other countries. ® indicates USA registration. Other brand and product names are trademarks of their respective companies. Copyright © 2017, SAS Institute Inc. All rights reserved. 105573_G55389.0617
To contact your local SAS office, please visit: sas.com/offices