Regional haze state implementation plan for...
83
1 REGIONAL HAZE STATE IMPLEMENTATION PLAN FOR WISCONSIN January 18, 2012 Wisconsin Department of Natural Resources
Transcript of Regional haze state implementation plan for...

1
REGIONAL HAZE STATE IMPLEMENTATION PLAN FOR WISCONSIN
January 18, 2012
Wisconsin Department of Natural Resources

2
TABLE OF CONTENTS
Part I. Executive Summary
3
Part II. Introduction 4 Regulatory Background 4 Regional Haze Rule and Applicable Wisconsin Requirements
5
Part III. Wisconsin Contribution to Visibility Impairment
7
Part IV. Wisconsin Implementation Plan Elements 9 1. Regional Planning – MRPO and Regional Consultation 9 2. Defined Baseline and Natural Visibility Conditions 11 3. Emissions Inventory 13 4. Best Available Retrofit Technology 20 BART for EGU Sources 22 BART for Non-EGU Point Sources 23 5. Reasonable Progress Goals 26 6. Long-term Strategy 36 Emission Reductions Due to Ongoing Air Pollution Control Programs 36 Additional Emission Limitations and Schedules of Compliance 37 Potential Future Projects and Impacts 37 Other Factors Considered 38 Anticipated Net Effect on Visibility 38 7. Periodic Implementation Planning and Adequacy 39 8. Monitoring Strategy
40
Part V. List of Appendices
42

3
Part I. Executive Summary The Wisconsin Department of Natural Resources (WDNR, or Department) submits this State Implementation Plan (SIP) to address requirements of the federal Regional Haze Rule (referred to hereafter as the “Haze Rule”) for reducing visibility impacts to federal Class I areas caused by man-made sources. The Haze Rule requires consultation between the states, tribes, and Federal Land Managers (FLMs) who are responsible for managing the Class I areas. Technical analyses show that sources in Wisconsin impact visibility at the Isle Royale National Park and Seney Wilderness Area in northern Michigan, and the Boundary Waters Canoe Wilderness Area and Voyageurs National Park in northern Minnesota. The requirements for Wisconsin fulfilled by this Haze SIP submittal include: (1) Demonstrating fulfillment for regional planning and consultation in cooperation with other affected states; (2) providing the baseline and natural visibility conditions for Class I areas affected by Wisconsin; (3) meeting near-term reasonable progress goals (RPG) for reducing haze precursor pollutants; (4) providing a long-term strategy for visibility improvement; (5) implementing Best Available Retrofit Technology (BART) requirements for the subset of major emission sources shown subject to BART; and (6) addressing direct haze monitoring for Class I areas and indirect monitoring used for technical support and analysis of progress in reducing haze. For purposes of fulfilling regional haze and other fine particulate matter (PM2.5) requirements, several Midwest states exhibiting contribution, including Wisconsin, Illinois, Indiana, Michigan and Ohio, participated in the Midwest Regional Planning Organization (MRPO) and pursued consultation with Minnesota. The MRPO performed air quality modeling to help the states identify their relative levels of contribution to haze and the scope of emission reductions necessary to meet the reasonable progress goals. The assessments addressed known and potential control strategies established during 2005 to 2007. This document describes Wisconsin’s strategy for meeting the reasonable progress goals by 2018 for Class I areas which relies primarily on existing control programs and implementation of BART for affected major sources. In this SIP, Wisconsin commits to evaluate reasonable progress for every 10 year period beginning with the period after 2018. In addition, Wisconsin commits to re-evaluating RPG for meeting the first period RPG goals as part of the 2013 required review. These periodic regional progress evaluations are to meet the eventual goal of achieving pristine visibility conditions in these protected areas by 2064 as required under the Haze Rule. Wisconsin is meeting the requirement for a "long-term strategy" under this SIP through the enforceable control programs committed in meeting the RPG requirement and noting that additional emission reductions are anticipated from certain future air regulatory programs and revised air quality standards. Together, these two elements are fully anticipated to result in a "uniform rate of visibility improvement" consistent with the goal of reaching pristine conditions before 2064. Additionally, Wisconsin will continue its efforts to maintain monitoring networks and emissions inventories, participate in regional planning and consultation, and will provide the required progress reports and future SIP revisions for the Regional Haze Rule.

4
Part II. Introduction The following describes Wisconsin’s fulfillment of State Implementation Plan (SIP) requirements established by the federal Regional Haze Rule for purposes of remedying and protecting visibility in designated federal Class I areas. The Regional Haze Rule was adopted on July 1, 1999 (64 FR 35714) and incorporated under 40 CFR part 51.308 as part of Subpart P – Protection of Visibility. States subject to the Haze Rule were required to submit their SIPs no later than December 17, 2007.
Regulatory Background The Clean Air Act (CAA) under section 169A(b)(2) requires each state in which a Class I area resides – and any state from which emissions are reasonably anticipated to cause or contribute to impairment of visibility of such a Class I area – to make reasonable progress towards remedying the impairment due to man-made air pollution. Two discreet components of reasonable progress requirements are the implementation of Best Available Retrofit Technology (BART) as expeditiously as practicable for certain major emission sources, and establishing a long-term (10 to 15 year) strategy for making continued visibility improvements. The U.S. Environmental Protection Agency (EPA) has designated 156 protected national and state parks and wilderness areas as applicable Class I areas based on importance of visibility in those areas. In conjunction with these state requirements, section 169B of the CAA directs EPA to study the chemistry of visibility impairment and identify sources or regions contributing to the impairment of the Class I areas. Based on this information, EPA is then required to establish Visibility Transport Regions and Commissions consisting of states which together are found to contribute to a Class I area visibility degradation. In 1999, EPA concluded that certain groups of states do act together in impacting visibility, and therefore formed regional planning organizations (RPOs) in order to fulfill visibility requirements on a coordinated basis. Specifically, EPA mandated Wisconsin as part of the Midwest RPO, which includes the states of Illinois, Indiana, Ohio, Michigan, and Wisconsin. The CAA requires such RPOs to perform technical assessments and to cooperatively meet visibility requirements for the affected Class I areas. Analysis performed by the Midwest RPO confirmed that Wisconsin emission sources do contribute to visibility impairment of MRPO Class I areas in Michigan and Minnesota.1 Participating in an RPO does not alleviate any state's obligation towards other affected Class I areas. To implement the CAA requirements for the CAA Visibility program, EPA established 40 CFR Subpart P "Protection of Visibility." EPA structured this regulation to address two principal forms of identified visibility impairment:
1) "Reasonably Attributable Visibility Impairment" – impairment attributable to a single source or small group of sources. This portion of the visibility program specifically applies to states with Class I areas, and outlines requirements for reasonable progress in
1 Regional Air Quality Analyses for Ozone, PM2.5, and Regional Haze: Technical Support Document. LADCO. Online. http://www.ladco.org/reports/technical_support_document/tsd/tsd_version_iv_april_25_2008_final.pdf . September 15, 2010.

5
reducing haze and adopting long-term strategies - both of which include BART and new source review requirements.
2) "Regional Haze" – widespread haze from a multitude of sources which impairs visibility in every direction over a large area. This portion of the Visibility program implements requirements similar to Reasonably Attributable requirements, but provides mechanisms for extending requirements to contributing states and implementing controls as necessary across broad source categories, including area and mobile source sectors. The Regional Haze program also adopts a schedule of remedying man-made visibility impacts in the Class I areas by 2064.
Wisconsin, being identified as a contributing state, is specifically subject to requirements under the Regional Haze program, 40 CFR Part 51.308.
Regional Haze Rule and Applicable Wisconsin Requirements The Regional Haze Rule, 40 CFR Part 51.308, requires all states with Class I areas – and states contributing to those areas – to submit SIPs by December 17, 2007. On January 15, 2009, EPA made a finding that 37 states (including Wisconsin), the District of Columbia, and the Virgin Islands failed to submit all or a portion of their Regional Haze SIP. The notice established a deadline of January 15, 2011 by which states must fulfill SIP submittal requirements or EPA would issue a Federal Implementation Plan (FIP). Wisconsin, along with the other MRPO states, are submitting delayed Regional Haze SIPs beyond the 2007 deadline. Delays allowed states to take advantage of federal and state emission reduction requirements including the federal CAIR program, perform applicable BART determinations, and complete the analysis of emission reductions and resulting improvements to regional visibility. The Regional Haze Rule requires reasonable progress towards improving visibility, with the goal of achieving natural visibility conditions in the protected Class I areas by 2064. Contributing states are required to participate in a regional planning and consultation process as identified by EPA. Each affected state must submit an initial plan to achieve reasonable progress goals, which are part of a long-term strategy, by 2018. These goals are submitted to EPA for approval, but are not directly enforceable. Rather, the primary requirement is ensuring that each state is addressing its share of emission reductions in a reasonable manner as established through the regional planning and consultation process. EPA can implement FIP elements if they find a state is deficient in meeting rate of progress or that additional reasonable control options are available. Rather than taking that approach, EPA has committed to establishing federal control programs – such as the Clean Air Interstate Rule (CAIR) and its intended replacement, the Cross-State Air Pollution Rule (CSAPR) – to reduce regional pollutants. The state must re-assess and revise an incremental progress plan every 10 years, with 5 year intermediate controls progress assessments thereafter to meet continued reasonable progress goals for natural conditions by 2064. The review of control programs and meeting RPG goals for the first 10 year period is due in 2013.
6
The Regional Haze Rule provides several general provisions that states must address in the SIPs. Pursuant to 40 CFR 51.308, these requirements include: (1) Participating in a regional planning and consultation process; (2) setting reasonable progress goals; (3) calculating baseline and natural visibility conditions; (4) providing a long-term strategy for regional haze; (5) implementing Best Available Retrofit Technology (BART) for specific emission sources; and (6) providing a monitoring strategy and other implementation plan requirements. For contributing states like Wisconsin, meeting certain plan elements, such as RPG, is based on meeting the state's share of emission reductions as determined through the RPO and consultation process (see 40 CFR 51.308(d)(3)(ii)). This Haze SIP submittal is Wisconsin’s first 10-year plan for meeting reasonable progress goals.

7
Part III. Wisconsin Contribution to Visibility Impairment The Midwest RPO process confirmed that participating states, including Wisconsin, contribute to visibility impacts of Class I areas in Michigan and Minnesota. To assess the contribution, the MRPO first performed back trajectory analysis of historic air flow and meteorological conditions for 2000 through 2005. To build on this analysis and assess relative impacts, the MRPO then conducted photochemical modeling using the Comprehensive Air quality Model with extensions (CAMx) for visibility impacts in 2018 based on several versions of emission inventories projected to represent base conditions and known emission controls (refer to Part IV, Section 3 below). Examination of multiple base years provides for a more complete technical assessment. Details of this analysis and apportionment of contribution are documented in Appendix 1 of the MRPO document, “Regional Haze in the Midwest: Summary of Technical Information”.2 A summary of results and a list of all Class I areas potentially impacted by the MRPO states is included in Appendix B. In identifying contribution, the MRPO states considered 2% or more of light extinction as significant and impacting visibility. For purposes of MRPO and the regional haze analysis, light extinction is measured in deciviews (dv). The results of the back trajectory analysis and photochemical modeling, summarized in Table 1, show Wisconsin contributes more than 5% light extinction to all four Class I areas within Michigan and Minnesota. For these areas Wisconsin's average annual impact to visibility is estimated to range from 6 to 18%, depending on the methodology and year(s) of concern. The Class I areas identified as impacted by Wisconsin emissions are the Isle Royale National Park, Seney Wilderness Area, Boundary Waters Canoe Area, and Voyageurs National Park (refer to Appendix A for locations). Based on this analysis of visibility impact, Wisconsin is subject to the Regional Haze Rule and must fulfill implementation plan requirements relative to these four Class I areas. Appendix B of the MRPO analysis also shows Wisconsin potentially contributing more than 2% visibility impact to Class I areas in Arkansas and Missouri. However, according to the criteria established by the Arkansas-Missouri RPO for that area only Illinois, Indiana, and Ohio are identified as significant contributors. It should be noted that emission reduction measures which aid Wisconsin in meeting its MRPO Regional Haze requirements will also aid to decrease visibility impacts at any other Class I areas, including those addressed by the Arkansas-Missouri RPO.
2 Regional Haze in the Midwest: Summary of Technical Information. LADCO. Online. http://www.ladco.org/reports/rpo/consultation/products/regional_haze_in_the_upper_midwest_summary_of_technical_information_v2.2_feb_22_2008.pdf. September 15, 2010.

8
Table 1 – Wisconsin Culpability to Visibility Impairment in Northern Class I Areas
State Back-trajectory
Analysis (2000-2005 data)
CAMx Modeling 2018 Emissions
(Round 4)1
CAMx Modeling 2018 Emissions
(Round 5) 2
Boundary Waters Illinois 2.7% 5.2% 5.1% Indiana 1.2% 2.9% 3.9% Michigan 0.7% 3.4% 4.8% Minnesota 37.6% 30.5% 23.5% Wisconsin 10.6% 10.4% 10.9% Isle Royale Illinois 7.0% 8.7% Indiana 5.6% 5.2% Michigan 12.7% 13.4% Minnesota 14.1% 9.5% Wisconsin
N/A
12.6% 10.9% Seney Illinois 9.7% 6.3% 7.9% Indiana 2.2% 9.6% 11.6% Michigan 14.7% 13.8% 18.1% Minnesota 3.8% 4.8% 1.6% Wisconsin 8.4% 13.8% 18.1% Voyageurs Illinois 1.2% 3.0% 7.1% Indiana N/A 1.6% 4.6% Michigan 1.6% 2.0% 4.9% Minnesota 36.9% 35.0% 31.0% Wisconsin 9.7% 6.3% 7.9%
Reference: “Regional Haze in the Midwest: Summary of Technical Information”, MRPO 2008 1 Round 4 modeling uses 2002 base year data for conducting modeling 2 Round 5 modeling uses 2005 base year data for conducting modeling

9
Part IV. Wisconsin Implementation Plan Elements As described for the Regional Haze requirements, Wisconsin must demonstrate implementation or fulfilling of specific Regional Haze plan elements as identified by 40 CFR 51.308(d) and (e). This section is intended to make this demonstration and presents the following plan elements:
1. Regional Planning - MRPO and Regional Consultation 2. Defining Baseline and Natural Visibility Conditions for Affected Class I Areas 3. Visibility Related Emissions Inventory 4. Best Available Retrofit Technology (BART) 5. Reasonable Progress through 2018 6. Long-Term Strategy though 2018 7. Periodic Implementation Planning and Adequacy 8. Monitoring Strategy
1. Regional Planning - MRPO and Regional Consultation Under the Regional Haze Rule, states contributing to visibility impairment of a Class I area are required to consult with the affected states in meeting obligations for their share of emissions. The consultation process is required to occur between the states responsible for the Class I areas, the Federal Land Managers (FLMs), U.S. EPA, and other affected parties. Wisconsin fulfilled these requirements by participating in the Midwest RPO process, as described below, and by meeting the current requirements for Reasonable Progress and Long Term Strategy as described in sections 5 and 6. In 1999, EPA formed the RPOs to address Regional Haze requirements and designated Wisconsin as part of the Midwest RPO which is targeted to address Class I areas in Minnesota and Michigan. The MRPO includes the states of Illinois, Indiana, Michigan, Ohio, and Wisconsin, and directly consulted with Minnesota. The MRPO is organized as follows: Policy Steering Committee consisted of the Environmental Directors of the member states, tribal leaders, FLMs, and the Regional Administrator of U.S. EPA - Region 5. The Policy Steering Committee provided the overall policy direction for the MRPO, and met, as needed, to oversee the progress of the effort.
Technical Steering Committee consisted of the Directors of the Air Quality offices of the member states, plus tribal representatives, FLMs, and the Director of the Air and Radiation Division of U.S. EPA - Region 5. The Technical Steering Committee was responsible for the management of the regional planning effort, and met on a regular basis to carry out these duties. Project Team consisted of representatives of the member states, participating tribes, FLMs, and U.S. EPA to implement the directions of the Technical Steering Committee and to guide the technical aspects of the planning effort. The Project Team met on a regular basis.

10
Through the MRPO, Wisconsin has participated in consultations convened by Minnesota to address the Boundary Waters and Voyageurs Class I areas and consultations convened by Michigan through the Lake Michigan Air Directors Consortium (LADCO) and the Midwest RPO for the Isle Royale and Seney Class I areas. These consultations also included the Central Regional Air Planning Association (CENRAP), and the Western Regional Air Partnership (WRAP) along with FLMs and U.S. EPA representatives involved with these Northern Class I areas. This group engaged in analysis of visibility conditions and control strategies needed to improve visibility at these four Class I areas. The MRPO process additionally addressed Wisconsin's obligations for planning and consultation relative to all other non-MRPO Class I areas. For these other Class I areas, the MRPO conducted technical analysis of contribution and consulted with the other regional RPOs on these findings. Specifically, Wisconsin worked with states from the Mid-Atlantic, Northeast Visibility Union (MANE-VU) region, to address regional haze issues affecting Acadia National Park and Moosehorn Wilderness Area in Maine, Great Gulf Wilderness Area in New Hampshire, Brigantine Wilderness Area in New Jersey, and Lye Brook Wilderness in Vermont. Wisconsin and the MRPO also participated in the consultation process established by CENRAP to develop coordinated strategies for Class I areas in the Central states, including Mingo and Hercules-Glades in Missouri, and Upper Buffalo and Caney Creek in Arkansas. Through these consultations, Wisconsin was determined not to be a significant contributor to any other Class I area at this time.
In meeting the Haze Rule requirements for the individual MRPO states and for regional planning and consultation, the MRPO process addressed the following major tasks:
Developed regional emissions inventories (historic and future); Determined background and natural visibility conditions for MRPO Class I areas; Technical analysis of each states contribution to visibility impairment for all Class I areas; Determined which pollutants are major contributors and visibility precursors; Performed trajectory and photochemical air quality modeling; Prepared technical support documents for BART control options; Evaluated regional control options for reducing visibility impairing pollutants; Performed technical analysis and modeling for purposes of regional visibility impacts and
reasonable progress obligations through 2018 for the MRPO Class I area. Full documentation of the MRPO process, including meeting minutes, technical reports, modeling results, can be found at http://www.ladco.org. Major work products include: Regional Haze Technical Support Document; List of Class I Areas Impacted; Regional Haze in the Upper Midwest: Summary of Technical Information (February 2008); BART Control Strategy Evaluations; Reasonable Progress for Class I Areas in the Northern Midwest – Factor Analysis (July 2007); SIP Modeling Emissions Inventories;
11
Identification and Evaluation of Control Measures for EGUs and Non-EGUs, Mobile Sources; Integrated Planning Model (IPM) Summaries
2. Defined Baseline and Natural Visibility Conditions The Regional Haze Rule requires that baseline and natural visibility conditions be established for the affected Class I area (40 CFR 51.308(d)(2)). The baseline represents the current level of visibility impact and is defined as the visibility seen for the 20% best and worst days for each Class I area. Natural conditions were estimated from the distributions of pollutants measured during the baseline scaled to estimates of annual average natural conditions made by Trijonis3. Under the rule, reducing visibility impacts to natural conditions by 2064 at all times represents the objective to meet the Clean Air Act’s goal of eliminating visibility impairment. The MRPO aided Michigan and Minnesota in determining both Baseline and Natural Visibility conditions, provided in Table 2, for their respective Class I areas. As required by the Haze Rule, the MRPO analyzed monitored data for 2000 through 2004. The baseline visibility condition values were derived using the average for the 20% worst and 20% best days for each year. These values were calculated using the reconstructed light extinction equation revised by the IMPROVE Steering Committee in 2005. Additional details on pollutant contributions at the Class I areas may be found in the MRPO technical support document (TSD). In particular, the MRPO states affecting the Northern Class I areas agreed that the priority emissions and sources are SO2 from point sources (EGUs and non-EGUs); NOX from point sources (EGUs and non-EGUs) and mobile sources; and NH3 from agricultural operations (see Reasonable Progress Goals at Section 5). The U.S. EPA guidance for the Regional Haze Rule directs states to determine a “uniform rate of visibility improvement” (URI) that would be maintained during each decade-long implementation period in order to attain natural visibility conditions by 2064. The URI can be viewed as a “glide path” from the baseline to natural visibility conditions (Figure 1). Under the Haze Rule, moving from the baseline to natural conditions is used as a primary measure in states for meeting reasonable progress and long-term strategy (see Sections 5 and 6).
3 Copeland, S. A., Pitchford, M. L., and Ames, R. B. 2008. Regional haze rule natural level estimates using the revised IMPROVE aerosol reconstructed light extinction algorithm. Presented at the Air & Waste Management Association Visibility Specialty Conference, Moab, April 2008.

12
Table 2 – Baseline and Natural Visibility Conditions for Northern Class I Areas
20% Worst Days Average
2000 2001 2002 2003 2004 Baseline Value (2000-2004 average)
Natural Conditions
Isle Royale 20.53 23.07 21.97 22.35 20.02 21.59 12.36 Seney 22.94 25.91 25.38 24.48 23.15 24.37 12.65 Boundary Waters 20.20 20.04 20.76 20.13 18.18 19.86 11.61 Voyageurs 19.55 18.57 20.14 20.25 18.87 19.48 12.05 20% Best Days Average
2000 2001 2002 2003 2004 Baseline Value (2000-2004 average)
Natural Conditions
Isle Royale 6.49 7.16 7.07 6.99 6.12 6.77 3.72 Seney 6.50 6.78 7.82 8.01 6.58 7.14 3.73 Boundary Waters 6.00 6.92 7.00 6.45 5.77 6.43 3.42 Voyageurs 7.01 7.12 7.53 7.68 6.37 7.14 4.26
Reference: MRPO TSD, 2008 Figure 1 – Visibility “Glide Paths” for Northern Class I Areas
13
3. Emissions Inventory
Modeled Emissions Under 40 CFR 51.308(d)(4)(v), a state is required to prepare a statewide emission inventory of pollutants which are reasonably anticipated to cause or contribute to visibility impairment in any mandatory Class I area. These pollutants are sulfur dioxide (SO2), nitrogen oxides (NOX), particulate matter (PM10 and PM2.5), ammonia (NH3), and reactive organic gases (ROG). The MRPO facilitated a process to compile inventories for 2005 actual emissions and several cases of future emissions projected through 2018 for the region. This inventory was then used to model air quality and visibility impacts for the affected Class 1 areas. A summary of 2005 statewide visibility related emissions by source category is provided in Table 3A. The largest source of SO2 and NOX emissions in 2005 is the electric generating sector (EGUs), followed next in quantity by non-EGU (industrial stationary sources) for SO2 and non-EGU and mobile sources for NOX. This 2005 inventory provided the basis for growth and control scenarios projected out to 2018 as further described below. The procedures followed in compiling the 2005 emissions are briefly described here, with detailed information provided in Section 3 of the MRPO TSD. EGU and non-EGU point stationary source emissions are as reported by the sources to the 2005 Wisconsin Air Emissions Inventory (AEI) database. EGU emissions are corroborated by the EPA Clean Air Markets Division (CAMD) EGU database. On-road mobile source emissions were prepared using the CONCEPT model and using transportation data supplied by Wisconsin Department of Transportation.4 Off-road mobile source emissions were estimated using EPA’s National Mobile Inventory Model (NMIM2005). Railroad and marine source emissions were estimated using local data for 2005.5 Emissions for air sources were estimated by WDNR using the Federal Aviation Administration’s Emission Dispersion and Modeling System. Area source emissions were estimated using EPA’s Emission Inventory Improvement Program.
4 LADCO On-Road Emissions Inventory Development Using Concept MV. Online. http://www.ladco.org/reports/rpo/emissions/NREL_LADCO_FinalReport09.pdf. December 15, 2010. 5 LADCO Nonroad Emission Inventory Project for Locomotive, Commercial Marine and Recreational Marine Emission Sources. Online. http://www.ladco.org/reports/rpo/emissions/nonroad_locomotive_commercial_marine_recreational_marine_final_report_environ.pdf. December 15, 2010.
14
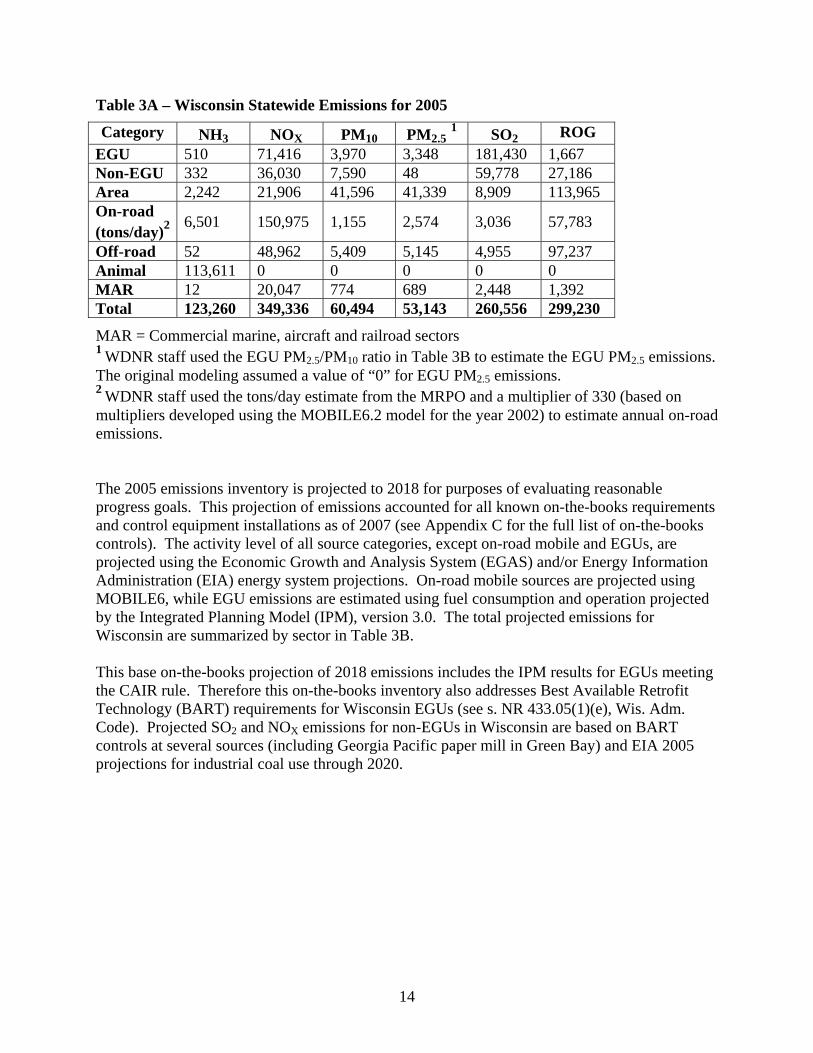
Table 3A – Wisconsin Statewide Emissions for 2005
Category NH3 NOX PM10 PM2.5 1 SO2 ROG
EGU 510 71,416 3,970 3,348 181,430 1,667 Non-EGU 332 36,030 7,590 48 59,778 27,186 Area 2,242 21,906 41,596 41,339 8,909 113,965 On-road (tons/day)2 6,501 150,975 1,155 2,574 3,036 57,783
Off-road 52 48,962 5,409 5,145 4,955 97,237 Animal 113,611 0 0 0 0 0 MAR 12 20,047 774 689 2,448 1,392 Total 123,260 349,336 60,494 53,143 260,556 299,230
MAR = Commercial marine, aircraft and railroad sectors 1 WDNR staff used the EGU PM2.5/PM10 ratio in Table 3B to estimate the EGU PM2.5 emissions. The original modeling assumed a value of “0” for EGU PM2.5 emissions. 2 WDNR staff used the tons/day estimate from the MRPO and a multiplier of 330 (based on multipliers developed using the MOBILE6.2 model for the year 2002) to estimate annual on-road emissions. The 2005 emissions inventory is projected to 2018 for purposes of evaluating reasonable progress goals. This projection of emissions accounted for all known on-the-books requirements and control equipment installations as of 2007 (see Appendix C for the full list of on-the-books controls). The activity level of all source categories, except on-road mobile and EGUs, are projected using the Economic Growth and Analysis System (EGAS) and/or Energy Information Administration (EIA) energy system projections. On-road mobile sources are projected using MOBILE6, while EGU emissions are estimated using fuel consumption and operation projected by the Integrated Planning Model (IPM), version 3.0. The total projected emissions for Wisconsin are summarized by sector in Table 3B. This base on-the-books projection of 2018 emissions includes the IPM results for EGUs meeting the CAIR rule. Therefore this on-the-books inventory also addresses Best Available Retrofit Technology (BART) requirements for Wisconsin EGUs (see s. NR 433.05(1)(e), Wis. Adm. Code). Projected SO2 and NOX emissions for non-EGUs in Wisconsin are based on BART controls at several sources (including Georgia Pacific paper mill in Green Bay) and EIA 2005 projections for industrial coal use through 2020.

15
Table 3B – Projected Wisconsin Statewide Emissions for 2018 (On-the-Books)
Category NH3 NOX PM10 PM2.5 SO2 ROG
EGU 683 56,158 8,827 7,445 127,073 1,179 Non-EGU 419 30,116 9,109 47 32,831 34,204 Area 2,856 22,804 50,047 49,744 7,998 109,427 On-road (tons/day)1 7,326 45,705 1,221 1,287 660 22,572 Off-road 58 25,611 2,712 2,555 70 60,720 Animal 103,388 0 0 0 0 0 MAR 8 9,346 315 275 1,157 704 Total 114,738 189,741 72,231 61,353 169,790 228,806
MAR = Commercial marine, aircraft and railroad sectors 1 WDNR staff used the tons/day estimate from the MRPO and a multiplier of 330 (based on multipliers developed using the MOBILE6.2 model for the year 2002) to estimate annual on-road emissions. Overall, significant decreases from 2005 emissions are projected for SO2 and NOX based on the 2018 on-the-books controls. SO2 emissions are projected to decrease by 35% and NOX emissions decrease by 46%. Large decreases in SO2 emissions are projected from implementation of a combination of fuel switching and emission controls in the EGU sector (30%) as well as a multi-faceted reduction in SO2 emissions from the non-EGU sector (55%). Decreases are also projected for NOX in these two sectors: 21% at EGUs and 16% at non-EGUs. Mobile source (on-road and off-road sources) controls are projected to result in significant NOX emissions reductions of 64%. For the other pollutant emissions: PM10 and PM2.5 emissions are projected to increase, and ROG and NH3 emissions are projected to decrease. The emissions increase in PM10 and PM2.5 is deemed by WDNR to be insignificant relative to the visibility improvements projected from reduction of SO2 and NOX emissions.
Adjusted Emissions Since the EGU sector is the largest source of emissions, additional EGU emission cases are evaluated in order to determine the robustness of meeting the RPG goals for the first 10 year period. For direct comparison and identification of EGU cases addressed by the modeled visibility impact runs, refer to Table 4. Of particular note is the decrease seen in actual emissions between 2005 and 2010. This decrease is a result of both added pollutant control systems and decreased energy consumption related to the economy. In particular 2009 was the first year for CAIR NOX requirements and reflects a recent historic low in annual electricity usage. Additional cases were developed for the EGU sector by MRPO and WDNR staff to compare emission reductions (see Table 4). Case A includes the on-the-books controls from EGU’s – these emission reductions are reflected in Table 3B above. In Case B, WDNR staff performed a “simple emissions growth” for EGU emissions from 2010 to 2018. For this projection, WDNR staff first assumed a 1% per year growth in peak demand for Wisconsin electricity consumption

16
from 2010 to 2018. Then the projection was adjusted to reflect committed SO2 controls as of May 2011 (see also Figure 2).6 The adjustments reflect an assumed 90% SO2 control efficiency for controls installed or committed at the following units: Alliant Energy – Columbia Units 1 and 2; Dairyland Power – Genoa Unit 1 and John P. Madgett Unit 1; WE Energies – South Oak Creek Units 5, 6, 7 and 8. It should be noted that the emission reductions in the 2018 “simple emissions growth” estimate are based on a combination of controls and reduced electricity consumption related to both economic downturn and demand reduction effort. The specific effect on long-term emissions due to either factor – current economic conditions or demand reduction – cannot be specifically identified but the overall affect should not be discounted in this analysis. Note, the WDNR recently became aware that SO2 control is not committed at this unit. To reflect the non-committed control at JPM, adjustments will be made to two cases of projected 2018 emissions in Table 4 (p. 17): Case B (Simple Emissions Growth) is increased from 70,528 to 75,007 annual tons SO2; Case D (Committed Controls – updated will do) is increased from 105,228 to 106,804 annual tons SO2. WDNR maintains that even with the increased emissions from JPM, Wisconsin meets RPG due to the lower emissions allocations under the CSAPR compared to CAIR and the proposed CATR. An additional 2018 emissions projection, referred to as Case C, is similar to Case A in reflecting on the books control requirements as well as additional controls committed to by EGUs that Wisconsin was aware of as of 2007, such as switching from coal to gas or the We Energies consent decree. However, Case C does not include the controls projected by IPM in meeting the CAIR rule beyond those already committed for operation. This approach reflects the open trading market structure of the CAIR program with no strict requirement for meeting reductions locally. That is why Case C, although lower than 2005 emissions, results in higher emissions (SO2 only) than the Case A on-the-books emissions estimate. Case D is presented to reflect the Case C control scenario but updated to reflect controls committed to by EGUs as of May 2011 in response to CAIR/CSAPR and EGU MACT. Both Case C and D are based on IPM 3.0 fuel projections. As noted in the discussion of BART below (Section 4), the Cross-State Air Pollution Rule (CSAPR) is intended to replace CAIR requirements. Under the finalized CSAPR rule (76 FR 48208, August 8, 2011) the 2014 emissions budgets for Wisconsin are 28,572 tons for NOx and 38,117 tons for SO2. Under a current proposal (76 FR 63860, October 14, 2011), the 2014 emission budgets for Wisconsin may be increased to 31,045 tons for NOx and 45,874 tons for SO2. Similar or greater emission reductions are anticipated in Wisconsin under the CSAPR restricted trading programs as compared to the open market trading under CAIR. Case E represents Wisconsin emission allocations from the emission budgets that were initially proposed for the CSAPR (i.e., the Clean Air Transport Rule (CATR) proposal). It should be noted that these CATR emission budgets have a trading limitation of 10% (i.e. even under possible trading scenarios, SO2 emissions would remain below 79,000 tons and NOx below 39,000 tons). Note that the 2014 CATR projections were very close to the simple emissions growth 2018 projection 6 Draft Strategic Energy Assessment. Wisconsin Public Service Commission. October 2010.

17
in case B (70,528 tons SO2 and 36,047 tons NOx). To ensure continued fulfillment of Regional Haze requirements Wisconsin will re-evaluate projected emissions when CSAPR emission budgets and implementation requirements are finalized,. Cases A, C, D and E use the IPM CAIR/CATR modeling, which has the benefit of showing emissions under control programs without depressed electricity demand, and therefore are anticipated to reflect a conservatively high estimate of EGU sector emissions. Conversely, Case B of simple emissions growth and control illustrate that EGU sector emissions may be considerably lower than the IPM-based emission cases A, C and D, and on target with the IPM-based emission Case E. Including these various 2018 emissions estimates gives a range of emission reductions from EGUs to be considered for meeting reasonable progress goals for visibility improvement (see Section 5). None of the cases in Table 4 represents total legally enforceable controls that will be installed by 2018. Wisconsin believes that a combination of committed controls and legally enforceable controls are appropriate in meeting reasonable progress goals under the Regional Haze Rule. Table 4 – Annual Emissions of SO2 and NOX in 2005 – 2010 and 2018 (Projected) for EGU Sources in Wisconsin
Annual Emissions (Tons) Year/Scenario
SO2 NOX
Modeled by MRPO for Visibility Impacts?
Actual Emissions 1 2005 181,430 71,416 Yes 2006 166,665 64,883 No 2007 133,629 51,710 No 2008 129,695 47,347 No 2009 104,314 33,264 No 2010 109,472 33,289 No Projected 2018 Emissions Case A – On-the-books 2 127,073 56,158 Yes
Case B – Simple emissions growth 3 75,007 36,047 No
Case C – Will do 4 150,340 55,019 Yes
Case D – Committed controls (updated will do) 5
106,804 48,410 No
Case E – CATR 6 71,514 35,391 No
1 Emissions based on actual emissions from CAMD EGU database. 2 MRPO projections based on 2005 actual emissions and on-the-books control requirements (CAIR and Consent Decrees). 3 WDNR staff estimate, grown from 2010 actual emissions from CAMD EGU database and adjusted to reflect committed controls as of May 2011. 4 MRPO projections based on 2005 actual emissions and committed controls as of 2007.

18
5 Projections based on Case C and adjusted to reflect committed controls as of May 2011 in response to CAIR/CATR/CSAPR and EGU MACT. 6 IPM 4.01 projections reflecting 2014 emission allocations for Wisconsin (Note: emission trading limited to 10%). Figure 2 – Actual and Projected (2018) SO2 and NOX Emissions for EGUs in Wisconsin 1
Case A *
Base *
Base * Case B
Case A *
Case B
0
20
40
60
80
100
120
140
160
180
200
2000 2005 2010 2015 2020
Year
An
nu
al E
mis
sio
ns
(10
00
ton
s)
SO2
NOx
* Modeled for visibility impact by MRPO. 1 Actual emissions are shown for 2005 – 2010. The 2018 “on the books” emissions inventory initially developed and modeled for visibility RPG included estimated BART controls (applied to 2005 actual emissions) for several non-EGU sources in Wisconsin: Georgia-Pacific Consumer Products LP in Green Bay New Page - Wisconsin Rapids Pulp in Wisconsin Rapids Packaging Corporation of America in Tomahawk Procter & Gamble Paper Products Company in Green Bay Thilmany, LLC in Kaukauna
Georgia Pacific in Green Bay is the only industrial source determined to be subject to BART in Wisconsin. The BART controls at Georgia Pacific will reduce emissions by an estimated 10,240 tons/year SO2 and 2,533 tons/year NOx. A reasonable adjustment can be made to the projected 2018 non-EGU emissions by first adding the initially assumed BART emission reductions back on to these projected emissions, and then subtracting the estimated BART emission reductions at Georgia Pacific. This adjustment results in an estimated 48,147 tons/year SO2 and 33,363 tons/year NOx for the non-EGU sector in 2018.

19
Summary The non-EGU adjusted emissions essentially add 15,316 tons SO2 and 3,257 tons NOx to the 2018 on-the-books non-EGU emission projections used in the MRPO visibility modeling. However, much lower EGU emissions than the 2018 on-the-books EGU emissions are also projected. For example, Case B emission projections are lower than the on-the-books EGU projections by 56,545 tons SO2 and 20,111 tons NOx. The actual and projected emissions for point sources (EGUs and non-EGUs) are shown for select years and cases in Figure 3. Accounting for the lower EGU emissions projected in Case B (Table 4) – along with the higher projected non-EGU emissions – is expected to produce more beneficial visibility results than on-the-books controls alone modeled in Case A (Table 4). These adjusted emissions should be reflected in the interim review of meeting RPG for the first 10 year period. Wisconsin’s Reasonable Progress Goals (Section 5) and Long Term Strategy (Section 6) expand on these emission reductions as they relate to visibility improvement at the Northern Class I areas.

20
Figure 3 – Actual and Projected (2018) SO2 and NOX Emissions for Point Sources (EGUs and Non-EGUs) in Wisconsin 1,2
Case A *
Base *
Case B
Case B
Base *Case A *
0
50
100
150
200
250
300
2000 2005 2010 2015 2020
Year
An
nu
al E
mis
sio
ns
(1
00
0 t
on
s)
SO2
NOx
* Modeled for visibility impact by MRPO. 1 Actual emissions shown for 2005 and 2010. Non-EGU 2009 actual emissions used in place of 2010 non-EGU emissions (data not yet available). 2 Case B 2018 projection based on 2005 non-EGU emissions less GP BART reductions of 10,240 tons SO2 and 2,533 tons NOX.
4. Best Available Retrofit Technology BART Background
A core federal requirement for addressing visibility impairment in the federal Class I areas is the implementation of a control program known as Best Available Retrofit Technology (BART) for certain older major sources directly impairing visibility. This BART control requirement addresses sources constructed in the decade before New Source Performance Standards (NSPS) first came into effect, and as a result have minimal or less than adequate emission controls. The federal requirements for identifying sources subject to BART, and the methods for determining appropriate emission control requirements, are set forth by the US EPA under 40 CFR Part 51, Appendix Y, Guidelines for BART Determinations Under the Regional Haze Rule.7
7 Title 40: Protection of Environment, Part 51 – Requirements for Preparation, Adoption, and Submittal of Implementation Plans, Appendix Y to Part 51 – Guidelines for BART Determinations Under the Regional Haze Rule. Online. http://ecfr.gpoaccess.gov/cgi/t/text/text-idx?c=ecfr&sid=12c576278c3887c8025da9c8f39c0b17&rgn=div9&view=text&node=40:2.0.1.1.2.22.11.14.39&idno=40. November 15, 2008.

21
In order to meet the federal requirements, Wisconsin implemented rules for BART as provided under NR Ch. 433, Wis. Adm. Code, that address emissions of PM, SO2, and NOX. The Wisconsin rules establish that electricity generating units (EGUs) meet BART requirements for SO2 and NOX by meeting the Federal Clean Air Interstate Rule (CAIR) requirements. For all other cases, the Wisconsin rules establish a process for determining those sources subject to BART and applicable BART emission reduction requirements on a case-by-case basis. As part of this process the source must submit an analysis of potential pollution control technologies and their installation cost and related issues. Sources must implement BART requirements by December 31, 2015.8 Note, the U.S. EPA recently proposed that the CSAPR will be sufficient for EGUs to comply with their BART requirements (December 23, 2011). BART Modeling
Under the state rule the CALPUFF air quality model is used to determine a source's visibility impairment on a Class I area for those sources found to be an appropriate age to be eligible under the BART program. If the modeled results show a significant reduction in visibility, the source is subject to BART or "BART-affected". The default protocol for the CALPUFF modeling and threshold for determining if a source is subject to BART controls is a follows:
A source is BART-affected if the modeled reduction in visibility at any individual Class I area is greater than 0.5 deciviews (dv) for more than 2% of the year (7 days) as compared to the natural background visibility. The CALPUFF/CALMET modeling domain represents a coarse meteorological grid. This approach to applying the CALPUFF model is discussed in more detail within a protocol developed by the states in the Lake Michigan Air Directors Consortium (LADCO).9
The CALPUFF analyses, as allowed under the state rule, for several sources utilized more specific data not universally available. This alternate analysis correspond to the VISTAS protocol developed by a large group of stakeholders, including the U.S. EPA, the VISTAS member state agencies and tribes, the Federal Land Managers (FLMs), industry representatives, and consulting experts. 10 One specific difference involved applying the CALPUFF model to see changes in visibility over smaller geographic areas (referred to as higher resolution / fine grid modeling). Another modification under this alternate approach is that the natural background threshold of visibility in the CALPUFF modeling was the annual average of natural background visibility for the Class I area. This average natural background value typically produces higher background impairment levels which results in smaller changes in visibility associated with changes in emission levels.
8 August 14, 2010 - Delayed installation date from 2013 as a rule change. See final rulemaking at https://health.wisconsin.gov/admrules/public/Rmo?nRmoId=5086. 9 “Single Source Modeling to Support Regional Haze BART Modeling Protocol.” March 21, 2006. Lake Michigan Air Directors Consortium, Des Plaines, IL. 10 Protocol for the Application of the CALPUFF Model for Analyses of Best Available Retrofit Technology (BART). Online. http://www.vistas-sesarm.org/BART/VISTASBARTModelingProtocol_Dec222005.pdf. November 15, 2008.

22
BART for EGU Sources All of the EGUs found subject to BART, listed in Table 5, are also subject to CAIR under 40 CFR part 97, and therefore meet sulfur dioxide (SO2) and nitrogen oxide (NOX) BART under Wisconsin state rules. However, the CAIR rule is in effect only until the CSAPR implementation begins. The EGU NOX and SO2 budgets under the CSAPR are expected to ensure reductions by 2018 at least equivalent to those anticipated with full implementation of the CAIR program. Therefore, the CSAPR should be sufficient to meet an updated EPA "better than BART" assessment. As discussed in the Emission Inventory section above (Section 3), projected EGU emissions in 2018 under CSAPR (38,117 tons SO2 and 28,72 tons NOx) are much lower than projected 2018 EGU emissions under CAIR (127,073 tons SO2 and 56,158 tons NOx). Note, the U.S. EPA recently proposed that the CSAPR will be sufficient for EGUs to comply with their BART requirements (December 23, 2011). Wisconsin will evaluate the impact of the final CSAPR emission budgets and respond to EPA findings relative to CSAPR and BART equivalency as needed. The next Regional Haze SIP revision will include emission reductions based on the final CSAPR emission budgets. The BART technical support document (TSD) for EGUs was submitted to the U.S. EPA as a separate SIP submittal for BART implementation. The EGU sources were required to conduct a BART analysis for PM, as this pollutant is not covered under CAIR or the replacement CSAPR. Based on the submitted PM BART analyses from the EGUs, and consideration by WDNR of available controls, costs, and visibility impairment in keeping with the Regional Haze Rule Guidelines for BART, WDNR is proposing a BART determination for BART-subject boilers at these sources. This determination found the existing PM control equipment (electrostatic precipitator or baghouse) and permit limitations satisfactory for BART. The revised BART TSD for EGUs is provided in the document, “BART TSD for EGUs – Revised July 2011.” WDNR received comments on this portion of the July 2011 Draft Haze SIP during the public comment period. In responding to comments, WDNR maintains that the existing PM control equipment (electrostatic precipitator or baghouse) and permit limitations are satisfactory for BART. The BART Response to Comments and Final BART Determination are found in the BART SIP submittal.

23
Table 5 – PM BART Determination for Wisconsin EGU Sources
Source Name Emission Units
(B = Boiler)
PM Permit Emission Limit
(Lbs/mmBtu) County
Electrostatic Precipitator Control
Alliant Energy – Columbia 1 B-21, B-22 0.60 (B-21) 0.10 (B-22)
Columbia
Alliant Energy – Edgewater B-24 0.13 Sheboygan
Alliant Energy – Nelson Dewey B-22 0.10 Grant
Wisconsin Energy – Oak Creek B-27,28 0.03 Milwaukee
Wisconsin Energy – Pleasant Prairie B-21, B-22 0.10 Kenosha
Wisconsin Public Service Corporation – JP Pulliam Plant
B-27 0.30 Brown
Baghouse Control
Dairyland Power Coop – Alma B-25,26 0.10 Buffalo
Dairyland Power Coop – Genoa B-20 0.034 Vernon
Wisconsin Energy – Valley B-21, B-22, B-23, B-24
0.15 Milwaukee
1 In February 2011, Alliant Energy – Columbia received approval from the PSCW to install scrubbers and baghouses at boilers B21 and B22, which are expected to be placed into service in 2014. Alliant submitted the associated construction permit application to WDNR in July 2011. The Department will update the Haze SIP for the next implementation period when the proposed particulate matter (PM) limitations at Columbia are available.
BART for Non-EGU Point Sources The status of non-EGU sources as BART-subject is summarized in Table 6. The pollutants of concern emitted by boilers at these facilities are SO2, NOX, and PM. The WDNR determined that four facilities have sources that are potentially subject to BART based on source category and age criteria. Based on visibility modeling the WDNR determined that the Green Bay Georgia Pacific (GP) facility is the only source subject to BART. The BART determination for

24
Georgia Pacific is described below. The BART TSD for non-EGUs is located in Wisconsin’s BART SIP. Based on visibility modeling results the three other BART eligible industrial facilities listed in Table 6 – Thilmany (a.k.a. International Paper Kaukauna facility), Packing Corporation of America-Tomahawk, and Mosinee Paper Corporation – do not exceed the threshold of 7-day visibility impact in any base year to any single Class I area. Therefore the WDNR determined these sources are not subject to BART control requirements. The modeling evaluation for these facilities relied on the VISTAS protocol for utilizing more specific model inputs and smaller grid analysis for visibility impacts compared to the default approach. The details for these visibility modeling analyses are located in Wisconsin’s BART SIP. Table 6 – Status of Wisconsin Non-EGU Sources Potentially Subject to BART
Source Name Eligible Emission
Units (B = Boiler)
BART-subject Status
County
Georgia Pacific – Green Bay B-26, B-27 Subject Brown
International Paper Kaukauna facility (a.k.a. Thilmany)
B-11 Not subject * Outagamie
Packing Corporation of America – Tomahawk
B-24 Not subject * Lincoln
Mosinee Paper Corporation B-20, B-21, B-24 Not subject * Marathon
* Determination based on CALPUFF modeling using VISTAS modeling protocol. BART Determination for Georgia Pacific The pollutants of concern emitted from the BART-subject boilers at GP (B-26 and B-27) are SO2, NOx and PM. As required under the Wisconsin's BART rule, Georgia Pacific submitted an engineering analysis of control options for the affected boilers. WDNR prepared a technical support document and proposed BART controls and associated permit requirements. The WDNR BART determination was subject to comment by the Federal Land Managers and public comment as required under the Haze rule. The documentation of the amended BART determination including response to received comment – as well as the associated Title V operating permit for GP updated with emission limitations and language reflecting BART – is provided in the document “BART Determination – Amended July 2011, Georgia Pacific Broadway Mill, Green Bay WI” (Attachment 3 of Wisconsin’s BART SIP). WDNR received comments on this portion of the July 2011 Draft Haze SIP during the public comment period. Responses to these comments are provided in the BART SIP submittal. The finalized PM BART requirements for BART boilers B26 and B27 are the existing emission limitation of 0.30 Lb/mmBtu. The final BART determination for SO2
25
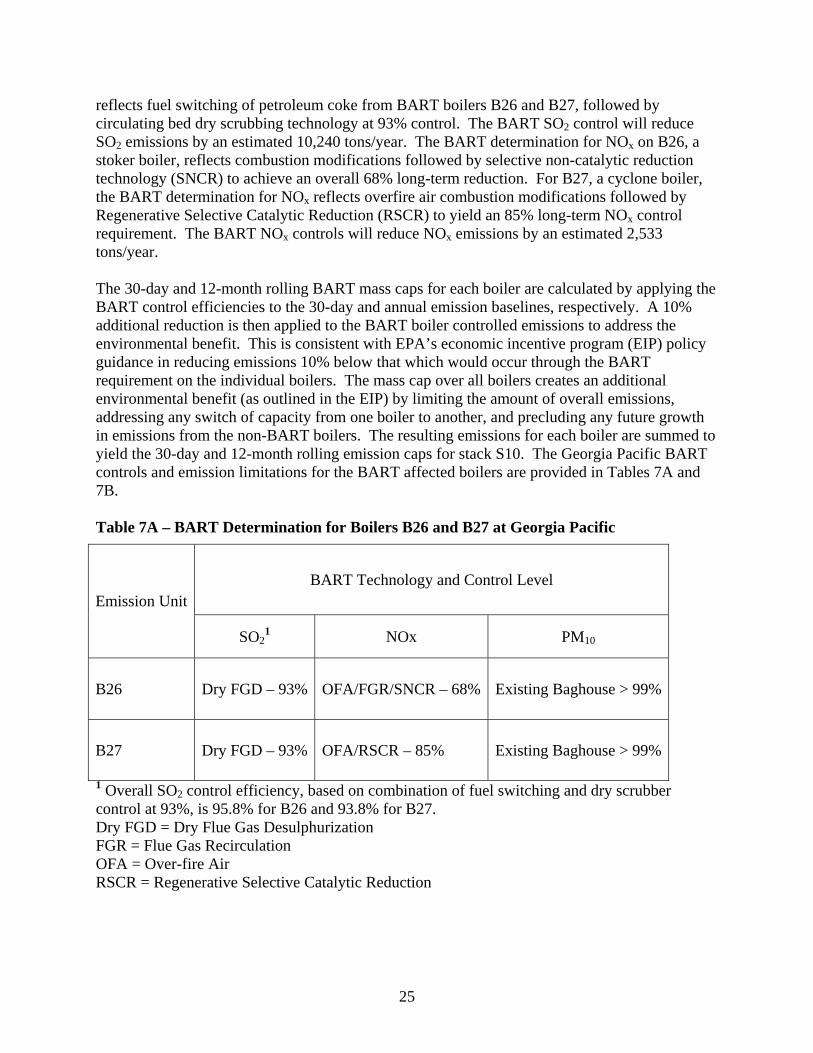
reflects fuel switching of petroleum coke from BART boilers B26 and B27, followed by circulating bed dry scrubbing technology at 93% control. The BART SO2 control will reduce SO2 emissions by an estimated 10,240 tons/year. The BART determination for NOx on B26, a stoker boiler, reflects combustion modifications followed by selective non-catalytic reduction technology (SNCR) to achieve an overall 68% long-term reduction. For B27, a cyclone boiler, the BART determination for NOx reflects overfire air combustion modifications followed by Regenerative Selective Catalytic Reduction (RSCR) to yield an 85% long-term NOx control requirement. The BART NOx controls will reduce NOx emissions by an estimated 2,533 tons/year. The 30-day and 12-month rolling BART mass caps for each boiler are calculated by applying the BART control efficiencies to the 30-day and annual emission baselines, respectively. A 10% additional reduction is then applied to the BART boiler controlled emissions to address the environmental benefit. This is consistent with EPA’s economic incentive program (EIP) policy guidance in reducing emissions 10% below that which would occur through the BART requirement on the individual boilers. The mass cap over all boilers creates an additional environmental benefit (as outlined in the EIP) by limiting the amount of overall emissions, addressing any switch of capacity from one boiler to another, and precluding any future growth in emissions from the non-BART boilers. The resulting emissions for each boiler are summed to yield the 30-day and 12-month rolling emission caps for stack S10. The Georgia Pacific BART controls and emission limitations for the BART affected boilers are provided in Tables 7A and 7B. Table 7A – BART Determination for Boilers B26 and B27 at Georgia Pacific
BART Technology and Control Level Emission Unit
SO21 NOx PM10
B26 Dry FGD – 93% OFA/FGR/SNCR – 68% Existing Baghouse > 99%
B27 Dry FGD – 93% OFA/RSCR – 85% Existing Baghouse > 99%
1 Overall SO2 control efficiency, based on combination of fuel switching and dry scrubber control at 93%, is 95.8% for B26 and 93.8% for B27. Dry FGD = Dry Flue Gas Desulphurization FGR = Flue Gas Recirculation OFA = Over-fire Air RSCR = Regenerative Selective Catalytic Reduction

26
Table 7B – Summary of SO2 and NOx BART Compliance Requirements
Pollutant Tons Emitted in any 30 Day Period
at Stack S10 Tons Emitted in any 12 Month Period
at Stack S10
SO2 268 2,340
NOx 110 977
PM 0.30 lbs/mmBtu
5. Reasonable Progress Goals Wisconsin is required under 40 CFR 51.308(d)(1) to establish Reasonable Progress Goals (RPGs) regarding visibility improvement and attaining a natural level visibility. Wisconsin participated in the MRPO process to perform analysis for RPGs for Class I areas located in other MRPO states. The detailed RPG analysis is presented in Section 5 of the MRPO TSD. As described below, Wisconsin meets its RPG obligation for the first 10 year period through 2018. Class I Area RPG Demonstration Boundary Waters Voyageurs
Meets URI Line
Isle Royale Seney
Meets 4 factor requirement Meets requests for action by
other states Meets Wisconsin portion of
contribution Background As discussed in Section 2, the primary test for meeting RPG is looking at projected emissions in 2018 relative to the URI line. The URI is the uniform rate of visibility improvement which reflects the line drawn from baseline visibility (current emission levels) to the natural visibility conditions, for each Northern Class I area. If future emissions are expected to be above this URI glide path, there are 4 factors, listed below, that are considered in determining whether the RPG requirements are being met.
The costs of compliance. The time necessary for compliance The energy and non-air environmental impacts. The remaining useful life of the source.
27
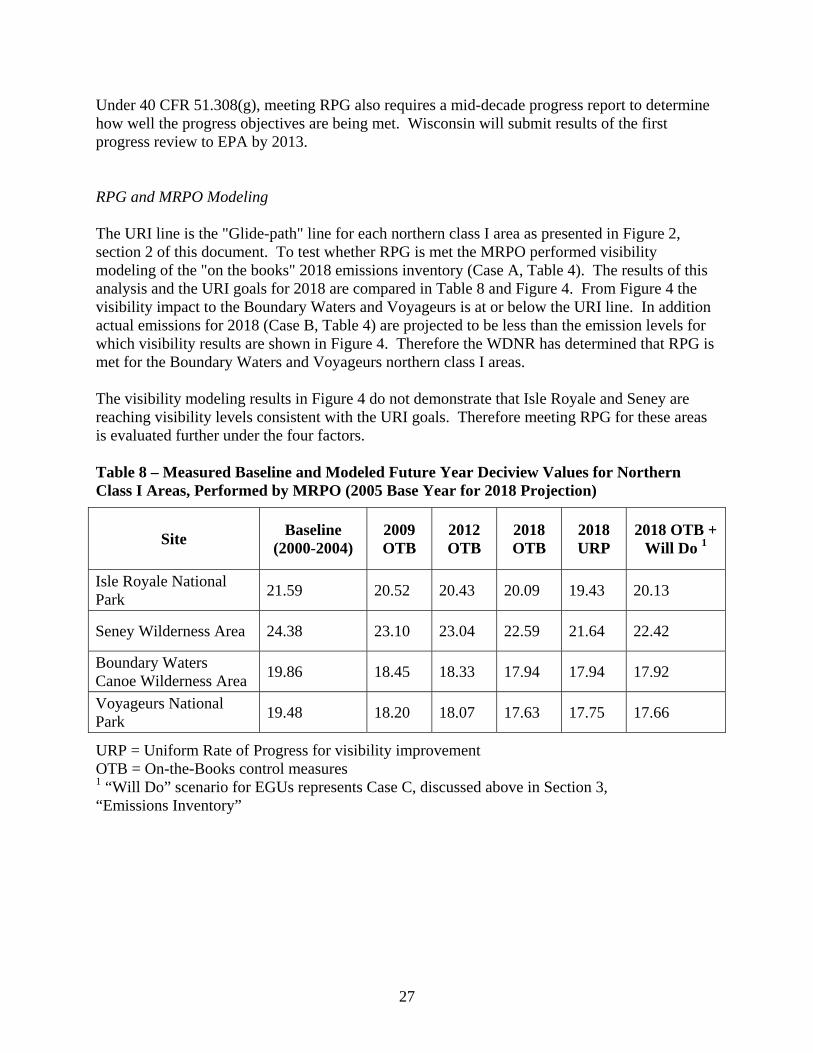
Under 40 CFR 51.308(g), meeting RPG also requires a mid-decade progress report to determine how well the progress objectives are being met. Wisconsin will submit results of the first progress review to EPA by 2013. RPG and MRPO Modeling The URI line is the "Glide-path" line for each northern class I area as presented in Figure 2, section 2 of this document. To test whether RPG is met the MRPO performed visibility modeling of the "on the books" 2018 emissions inventory (Case A, Table 4). The results of this analysis and the URI goals for 2018 are compared in Table 8 and Figure 4. From Figure 4 the visibility impact to the Boundary Waters and Voyageurs is at or below the URI line. In addition actual emissions for 2018 (Case B, Table 4) are projected to be less than the emission levels for which visibility results are shown in Figure 4. Therefore the WDNR has determined that RPG is met for the Boundary Waters and Voyageurs northern class I areas. The visibility modeling results in Figure 4 do not demonstrate that Isle Royale and Seney are reaching visibility levels consistent with the URI goals. Therefore meeting RPG for these areas is evaluated further under the four factors. Table 8 – Measured Baseline and Modeled Future Year Deciview Values for Northern Class I Areas, Performed by MRPO (2005 Base Year for 2018 Projection)
Site Baseline
(2000-2004) 2009 OTB
2012 OTB
2018 OTB
2018 URP
2018 OTB + Will Do 1
Isle Royale National Park
21.59 20.52 20.43 20.09 19.43 20.13
Seney Wilderness Area 24.38 23.10 23.04 22.59 21.64 22.42
Boundary Waters Canoe Wilderness Area
19.86 18.45 18.33 17.94 17.94 17.92
Voyageurs National Park
19.48 18.20 18.07 17.63 17.75 17.66
URP = Uniform Rate of Progress for visibility improvement OTB = On-the-Books control measures 1 “Will Do” scenario for EGUs represents Case C, discussed above in Section 3, “Emissions Inventory”

28
Figure 4 – Visibility “Glide Paths” and 2018 Modeled Deciview Values for Northern Class I Areas 1
1 Visibility estimates for 2018 reflect on-the-books controls. Demonstrating RPG for Isle Royale and Seney The WDNR has determined that RPG for Isle Royal and Seney is met through consideration of the following:
1. Lower projected emissions vs. modeled emissions 2. Four factors – compliance timeframe 3. Meeting identified contribution and reduction obligations 4. Meeting "asks" by other states
1. Lower Projected Emissions vs. Modeled Emissions The MRPO states agreed that the priority emission sources affecting visibility of the Northern Class I areas are: SO2 from point sources (EGUs and non-EGUs), NOX from point sources (EGUs and non-EGUs), NOx from mobile sources, and NH3 from agricultural operations. In this context this section presents two findings: 1) that overall Wisconsin emissions are being reduced below the modeled inventories for the important source sectors and; 2) Emissions are being

29
reduced below modeled inventories for individual sources (northern sources) with the greatest impact to Seney and Isle Royale. The WDNR concludes that any shortfall in meeting the URI line is reduced versus the modeled results for Seney and Isle Royale. Further, any shortfall cannot be identified and an appropriate response formulated without an updated modeling effort. In ensuring emission reductions and evaluating RPG, the WDNR will continue to evaluate if any additional emission reductions are necessary to meet the state’s RPG as part of the evaluation due to EPA by 2013. Overall Emissions The Emission Inventory section above shows cases of projected emissions for the EGU sector that are significantly lower (Cases B, D and E) than on-the-books (Case A) and will do (Case C). For the non-EGU or industrial sector, the adjusted emission projections are higher than the on-the-books modeled emissions. This low projection for the non-EGU sector results from the assumption of on-the-books BART controls for industrial sources other than Georgia Pacific. Overall the EGU and non-EGU stationary source emissions, shown in Table 3, are projected to be lower than the modeled emissions demonstrating visibility impact above the URI line. Source Specific Emissions The MRPO effort produced a list of the top 30 sources affecting visibility in each of the Northern Class I areas. Wisconsin sources on this list for Seney Wildlife Refuge and Boundary Waters Canoe Area are shown in Tables 8A and 8B, respectively (see also Figure 5). For each source a relationship of emissions and distance is determined - Emissions per year (Q) / Distance to class I area (D). This ratio is a simple metric for assessing the potential importance of a source to the visibility impact of a specific class I area. The sources with the largest values are expected to have the largest visibility impact. The sources in the table are listed first by largest expect impact. In compiling the Q/D information the MRPO used the "on the books" 2018 inventory. This Q/D then does not include significant controls installed and committed since that effort. For comparison the table provides the additional committed control levels and the source's actual emissions in 2009 before these controls. This comparison simply shows that for both Seney and Isle Royale the emissions from the top-tier of sources will be significantly reduced. These emission reductions are expected to be significantly more beneficial than equivalent emission reductions from the overall source sector. However this assessment cannot be made until a new modeling effort is completed. Further, the extent of any additional controls must be identified through that same modeling effort. Therefore, the Department concludes that source specific reductions will occur which will reduce the visibility impact for both Seney and Isle Royale. As noted above in Section 4 for BART at Georgia-Pacific, the mass cap over all of the boilers (BART and non-BART) at the common stack S10 creates an additional environmental benefit (as outlined in the EIP) by limiting the amount of overall emissions, addressing any switch of capacity from one boiler to another, and precluding any future growth in emissions from the non-BART boilers. This mass cap further contributes to RPG for this implementation period.

30
Table 8A – Wisconsin Sources Contributing to Visibility Impairment at Seney
Actual 2009 Emissions (tons) 1
Controls not Modeled Facility ID Name
(Q/d)NOx + (Q/d)SO2
(Lbs/min/km) SO2 NOx SO2 NOx
460033090 Alliant Energy - Edgewater 0.263 13,448 2,962 90%-unit 5
111003090 Alliant Energy - Columbia 0.254 26,865 5,265 > 90%
606034110 Dairyland Power Coop – Alma 0.195 14,849 4,736 > 90%
405032870 Georgia Pacific 0.178 13,105 3,143 55% - S10
70% - S10
737009020 WPSC – Weston 0.166 8,994 3,821
241007800 We Energies – Valley 0.131 5,376 1,817
405031990 WPSC – JP Pulliam 0.129 4,385 3,389
445031180 Thilmany LLC 0.095 7,629 2,293
663020930 Dairyland Power Coop – Genoa 0.086 6,479 1,574 > 90%
735008010 PCA – Tomahawk 0.074 4,787 1,589
241007690 We Energies – Oak Creek 0.073 14,823 5,530 >95% 90%
772009480 Stora Enso – Biron Mill 0.054 5,249 2,413
438039360 NewPage Wisconsin Systems, Inc.
0.041 0 0
772010690 Domtar A. W. LLC – Nekoosa 0.037 4,905 1,338
744008100 Rhinelander Paper 0.036 2,796 1,661
405032210 Procter & Gamble Paper 0.03 862 857
772010140 Wisconsin Rapids 0.023 1,825 2,218
445030960 Kimberly Mill 0.021 0 5
737009570 Wausau Paper Mills, LLC 0.017 1,432 682
1 Reported to the WDNR Air Emissions Inventory

31
Table 8B – Wisconsin Sources Contributing to Visibility Impairment at Isle Royale
Actual 2009 Emissions (tons)1
Controls not Modeled Facility ID Name
(Q/d)NOx + (Q/d)SO2
(Lbs/min/km) SO2 NOx SO2 NOx
111003090 Alliant Energy - Columbia 0.234 26,865 5,265 90%
606034110 Dairyland Power Coop - Alma 0.220 14,849 4,736 90%
460033090 Alliant Energy - Edgewater 0.205 13,448 2,962 90% -Unit 5
737009020 WPSC - Weston 0.175 8,994 3,821
405032870 Georgia Pacific 0.138 13,105 3,143 55%-S10
70%-S10
241007800 We Energies - Valley 0.105 5,376 1,817
405031990 WPSC – JP Pulliam 0.100 4,385 3,389
802033320 Xcel Energy Bay Front Generating Station
0.094 738 915
735008010 PCA – Tomahawk 0.091 4,787 1,589
663020930 Dairyland Power Coop - Genoa 0.087 6,479 1,574 90%
445031180 Thilmany LLC 0.077 7,629 2,293
772009480 Stora Enso – Biron Mill 0.054 5,249 2,413
744008100 Rhinelander Paper 0.044 2,796 1,661
772010690 Domtar A. W. LLC - Nekoosa 0.037 4,905 1,338
438039360 NewPage Wisconsin Systems, Inc.
0.037 0 0
772010140 Wisconsin Rapids Fiber and Energy Mill
0.024 1,825 2,218
405032210 Procter & Gamble Paper Products Company
0.023 862 857
816009590 Murphy Oil 0.021 537 459
445030960 Kimberly Mill 0.018 0 5
737009570 Wausau Paper Mills, LLC (aka Mosinee Paper Corp.)
0.017 1,432 682
1 Reported to the WDNR Air Emissions Inventory

32
Figure 5 – Map of WI Facilities Contributing to Visibility Impairment at Northern Class I Areas

33
2. Four Factors - Compliance Timeframe In considering the factor of "time necessary for compliance" the EGU control programs and BART requirements included are implementing emission reductions in an expeditious and reasonable time-frame. U.S. EPA's own assessment of requirements describes that the CAIR and CSAPR are capturing emission reductions on a schedule that is as soon as can be practically implemented for the sector. The CSAPR FIP (replacing CAIR) indicates that EGU NOX and SO2 budgets will likely ensure reductions by 2018 at least equivalent to those caused by implementation of the CAIR program in Wisconsin. On this basis, the CSAPR is likely to achieve the BART EGU reductions achieved through CAIR. As part of the RPG evaluation work the MRPO contracted EC/R to perform an analysis of control options for each sector and implementation timeframes. One conclusion of the MRPO EC/R analysis is that CAIR is being implemented as fast as possible. Another portion of the EC/R analysis showed that additional progress in visibility for Seney and Isle Royale is limited by the time necessary for compliance rather than potential control levels and cost. For non-EGU stationary sources other regulatory requirements are addressing potential emission reductions on a practical schedule. Several regulatory requirements are expected to significantly affect emissions from the industrial boilers as well as the EGU boilers identified in Tables 8A and 8B, the northern boilers. These programs include PM2.5 reasonably available control technology (RACT), attainment with the 1-hour SO2 National Ambient Air Quality Standards (NAAQS) and NO2 NAAQS, and acid gas requirements under the ICI and EGU Boiler Maximum Achievable Control Technology (MACT) rules. All of these programs have compliance time-frames consistent with the 2018 RPG date. It should also be noted that EPA has committed to evaluating ICI boiler control measures for the Phase 2 of the CSAPR. EPA addressed in the proposed Phase 1 of the CSAPR that industrial sector controls are not included in that phase, as further evaluation of available control measures and compliance timeframes is required before implementing a program for this sector. EPA's conclusion that further evaluation is needed before proposing controls to the ICI boiler sector supports the WDNR conclusion that controls cannot be implemented any faster for this sector. Therefore, based on EPA's own assessment for implementing controls and the EC/R analysis, the states will not be able to implement deeper emission reductions more rapidly than current regulatory program efforts. Since the time for compliance is a limiting step the consideration of the other RPG factors is not evaluated for this RPG determination. In ensuring emission reductions and evaluating RPG, the WDNR commits to evaluating the implementation results of the discussed regulatory programs. 3. Meeting identified contribution and reduction obligations The rate of emission reduction projected for Wisconsin sources compared to Michigan and Minnesota shows that Wisconsin is meeting its share of visibility improvement. Figures 6 and 7 show the total SO2 and NOx emitted by sources in Michigan, Minnesota and Wisconsin. Of the

34
three MRPO states, both Michigan and Minnesota have similar or higher visibility impairment contribution to Isle Royale compared to Wisconsin, and only Michigan has higher visibility impairment contribution to Seney compared to Wisconsin. Figures 6 and 7 show that Wisconsin emissions, using the "on the books" inventory, decrease at a similar or greater rate than Michigan and Minnesota emissions. Further, as previously identified, Wisconsin emissions (particularly EGUs) are anticipated to be significantly lower than those shown in Figures 6 and 7. This is supported by the NOx and SO2 budgets under the CSAPR, which are similar to or less than the Michigan and Minnesota budgets. Also, the finalized SO2 and NOx BART control levels for Georgia-Pacific in Wisconsin are higher than the SO2 and NOx BART control levels for industrial sources in both Michigan and Minnesota. Since Wisconsin sources are achieving emission reductions as rapidly as Michigan and Minnesota, WDNR has determined that Wisconsin is meeting its emission reductions obligations for its portion of contribution to RPG for the first 10 year period. Figure 6 – SO2 Emissions in 2005 and 2018 (projected based on on-the books controls) for MI, MN, and WI 1,2
MI -26% reduction
MN - 30% reduction
WI - 27% reduction
0
50
100
150
200
250
300
350
400
450
2000 2005 2010 2015 2020
Year
An
nu
al S
O2
Em
issi
on
s(1
000
ton
s)
1 WI on-the-book non-EGU projections corrected to only include BART emission reductions at Georgia Pacific. 2 Total 6-state (IL, IN, MI, MN, OH, WI) estimated SO2 emissions % reduction from 2005 to 2018 is 46% (3,509,106 tpy to 1,884,040 tpy).
35
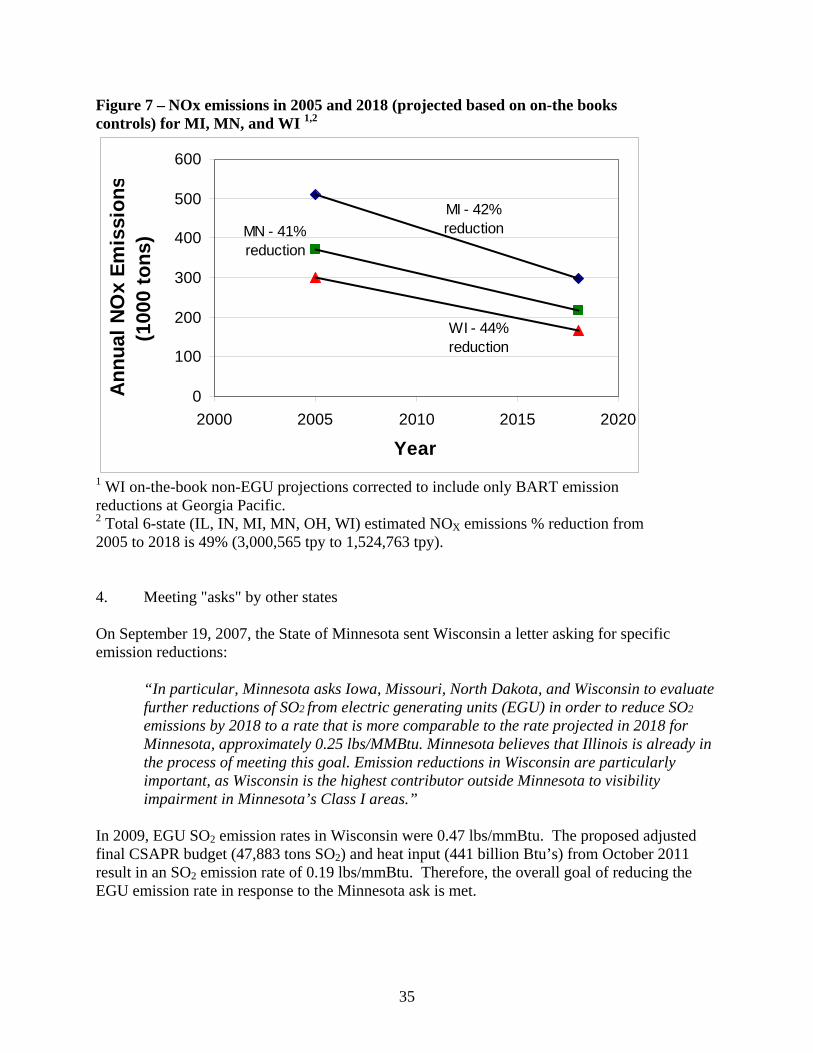
Figure 7 – NOx emissions in 2005 and 2018 (projected based on on-the books controls) for MI, MN, and WI 1,2
MI - 42% reductionMN - 41%
reduction
WI - 44% reduction
0
100
200
300
400
500
600
2000 2005 2010 2015 2020
Year
An
nu
al N
Ox
Em
issi
on
s(1
000
ton
s)
1 WI on-the-book non-EGU projections corrected to include only BART emission reductions at Georgia Pacific. 2 Total 6-state (IL, IN, MI, MN, OH, WI) estimated NOX emissions % reduction from 2005 to 2018 is 49% (3,000,565 tpy to 1,524,763 tpy). 4. Meeting "asks" by other states On September 19, 2007, the State of Minnesota sent Wisconsin a letter asking for specific emission reductions:
“In particular, Minnesota asks Iowa, Missouri, North Dakota, and Wisconsin to evaluate further reductions of SO2 from electric generating units (EGU) in order to reduce SO2
emissions by 2018 to a rate that is more comparable to the rate projected in 2018 for Minnesota, approximately 0.25 lbs/MMBtu. Minnesota believes that Illinois is already in the process of meeting this goal. Emission reductions in Wisconsin are particularly important, as Wisconsin is the highest contributor outside Minnesota to visibility impairment in Minnesota’s Class I areas.”
In 2009, EGU SO2 emission rates in Wisconsin were 0.47 lbs/mmBtu. The proposed adjusted final CSAPR budget (47,883 tons SO2) and heat input (441 billion Btu’s) from October 2011 result in an SO2 emission rate of 0.19 lbs/mmBtu. Therefore, the overall goal of reducing the EGU emission rate in response to the Minnesota ask is met.

36
6. Long-term Strategy Wisconsin is required under 40 CFR 51.308(d)(3) to submit a long-term strategy addressing regional haze for each mandatory Class I area which may be affected by emissions from within the state, in order to “achieve the reasonable progress goals established by States having mandatory Class I areas.” The long-term strategy must include enforceable emission limitations, compliance schedules and other measures necessary to achieve the RPGs. The long-term strategy must be set every 10 years, and part of the requirement is to show the RPG for the next 10 years. Section 5 above discusses how Wisconsin is meeting the first RPG (through 2018) – this RPG includes the required enforceable limits and schedules. Most of the long-term strategy discussion here addresses future anticipated rules and actions in Wisconsin.
Emission Reductions Due to Ongoing Air Pollution Control Programs Under 40 CFR 51.308(d)(3)(v)(F), WDNR is required to ensure that emission limitations and control measures used to meet the RPG are enforceable. The CAIR requirements have been adopted as state regulations and the CSAPR requirements will need to be adopted as state regulations as well, unless Wisconsin depends on EPA’s FIP program structure. The BART control evaluations are required by a state rule (NR 433), and the limits and provisions of each source’s BART determination are enforceable through permits / administrative order. WDNR considered several ongoing or expected control programs in participating in the MRPO development of RPGs for Class I areas where the state contributed to visibility impairment. These controls are discussed in Section 3 above (also see Appendix C). Several EGUs in Wisconsin and throughout the MRPO region have begun to install controls for CAIR. EPA has committed to address interstate transport and contribution for NOX associated with ozone, and NOX and SO2 associated with PM2.5, via Phase 1 and Phase 2 of the CSAPR FIPs. Additional emission reductions in the EGU sector are expected under Wisconsin’s Case D scenario (see Section 3), which is based on IPM 3.0 fuel projections, and considers the CAIR control/emission levels known as of 2011 that will be in place by 2018. Large reductions in NOX emissions are also taking place under rate-of-progress for ozone. One non-EGU source in Wisconsin (Georgia Pacific paper mill in northeast Wisconsin) is subject to BART – the final determination of required SO2 and NOX reductions is proposed in this SIP. Three additional non-EGU sources have been determined to not be subject to BART, based on revised air quality modeling. Additional details on BART are found in Section 4. Significant emissions reductions for the mobile sector – included in the modeling of predicted 2018 emissions – are also expected to result from several federal rules that are undergoing implementation through 2018: Tier II for on-highway mobile sources Heavy-duty diesel (2007) engine standards Low sulfur fuel standards Federal control programs for nonroad mobile sources

37
Additional Emission Limitations and Schedules of Compliance Wisconsin is required under 40 CFR 51.308(d)(3) to identify additional measures to meet visibility goals when ongoing programs alone are not sufficient. Sufficient controls for setting the visibility goal are those that are shown to meet the URI visibility glide path, or to be reasonable based on the four factors as well as visibility impacts (see Reasonable Progress Goals section above). WDNR believes that reasonable controls include U.S. EPA’s CSAPR Phase 1 and Phase 2 FIP commitments, on-the-books controls affecting Wisconsin mobile sources, and BART controls. As mentioned in the Reasonable Progress Goals section above, the study by EC/R evaluated the primary source categories that may impact Class I areas in the region. The category of sources having the largest impact on Class I areas is EGUs. All major EGUs are subject to Phase 1 CAIR and will also be subject to Phase 1 CSAPR. It should be noted that Phase 2 CSAPR is focused on the upcoming ozone and PM2.5 ambient standard revisions. WDNR is making the presumption that U.S. EPA is already making efforts to examine cost-effective control strategies in the shortest timeframe possible as part of CSAPR, and that EGUs in the state will continue to meet those intentions. ICI boilers were also reviewed by EC/R, and showed potentially reasonable additional controls on a cost basis. WDNR may use results from the EC/R study for reasonable controls for ICI boilers – should Wisconsin’s long-term strategy be determined to be insufficient – with a focus on the significant emission sources in Tables 8A and 8B in the Reasonable Progress Goals section. The other categories of sources analyzed by EC/R have less impact on the Class I areas than EGUs and boilers and are not being pursued for control beyond what is already on the books. It should also be noted that the MRPO, in general, has ongoing studies for meeting visibility improvement goals. These studies will continue to be used by WDNR staff. WDNR plans to include updated emission predictions of agricultural ammonia in the Five Year SIP Assessment, and is studying potential mechanisms for targeted reductions from the sector as part of the next RPG for the period 2019-2028. Such reductions are expected to help meet the emission reduction goals associated with the future visibility goals for the Northern Class I areas. WDNR will continue to evaluate if any additional emission reductions are necessary, including those from ICI boilers, RICE and turbines, and mobile sources, as needed to meet the state’s RPG. WDNR will continue to share information with other states on NOX and SO2 controls in the state, for those states to include in RPGs for their Class I areas.
Potential Future Projects and Impacts Other actions are likely to take place over the next 10 years that will improve visibility in the Class I areas in 2018. These potential actions have not been included in this RPG. EGU MACT and ICI MACT regulations – which control hazardous air pollutants (HAPs) from boilers – may also lead to lower future emissions reductions from EGUs and industrial boilers that impact visibility. Industrial Boiler MACT and EGU MACT were finalized in late 2011. WDNR has not adjusted its 2018 emission reduction estimates to account for these regulations. Tighter National Ambient Air Quality Standard (NAAQS) for ozone and PM2.5, as well as NO2 and SO2, may

38
cause parts of Wisconsin and other surrounding states to become nonattainment for these pollutants, requiring reductions in the primary or precursor pollutants. These additional reductions in precursor emissions will likely further reduce regional haze by 2018. Finally, it should be noted that ICI boiler emissions are expected to be regulated under the second phase of the CSAPR if the Boiler MACT proves inadequate to ensure reductions in SO2 and NOx sufficient to meet modeled ozone and PM NAAQS attainment for the key dates – likely to be on or before 2018.
Other Factors Considered In consideration of construction activities and their effect on regional haze, construction activities in Wisconsin are subject to federal non-road standards for construction equipment and vehicles. The impact of these activities will continue to be mitigated through the federal general conformity and transportation conformity rules. For the construction of new major sources, the visibility impacts of such sources will continue to be managed in conformance with existing requirements pertaining to New Source Review (NSR) and Prevention of Significant Deterioration (PSD). This involves analysis of visibility impacts and consultation with FLMs in determining if a new major source or major modification is installing Best Available Control Technology (BACT), and if it may have an adverse impact on visibility in Class I areas. WDNR commits to ensuring that permitting of new and modified sources through Wisconsin’s NSR program is consistent with making reasonable progress toward the visibility goals of the Haze SIP. Source retirement and replacement schedules, which must be considered under 40 CFR 51.308 (d)(3)(v)(D) in developing reasonable progress goals, will be managed in conformance with existing requirements under the PSD program. WDNR has worked with land managers in the state to prepare a plan to address controllable fire activities that can impact visibility locally: “Wisconsin Smoke Management Best Management Practices for Prescribed Burning” (October 25, 2010). This plan being reviewed by EPA for certification is located in Appendix D.
Anticipated Net Effect on Visibility Under 40 CFR 51.308(d)(3)(v)(G), WDNR is required to address the net effect on visibility resulting from changes projected in point, area, and mobile source emissions by 2018. The emission inventory used for this SIP addresses changes to point, area, and mobile source inventories by the end of the first implementation period. Factors taken into consideration for the emissions projections include population growth; industrial, energy and natural resources development; land management; and air pollution control. These changes, and their net effect on visibility, are described in the Reasonable Progress Goals section above. The MRPO TSD shows that the reasonable progress goals for the Northern Class I areas in northern Minnesota (Boundary Waters and Voyageurs) will be achieved by 2018 from implementation of “on the books” and “will do” control measures in the states contributing to visibility impairment, however those in northern Michigan (Isle Royale and Seney) may not be achieved; however, WDNR expects that Wisconsin’s existing and planned controls will ensure it has included all measures needed to achieve its apportionment of emission reduction obligations. Control

39
requirements will be evaluated for the 2013 implementation assessment report associated with the 2018 RPG review process, and periodically as required in the Regional Haze Rule. Additional emission reductions will be achieved in Wisconsin that were not included as “on the books” and “will do” controls in the MRPO analysis. Additional emission reductions in the EGU sector are expected under Wisconsin’s Case D scenario (Table 4) – which is based on IPM 3.0 fuel projections, and considers the CAIR control/emission levels known as of 2011 that will be in place by 2018 – as well as Case E (Table 4) which represents Wisconsin emission allocations under the CATR proposal (emissions greater than the CSAPR). Consideration of these additional EGU emission reductions in future Haze SIP submittals is expected to satisfy Wisconsin’s required participation in keeping visibility improvement at the Northern Class I areas close to or below the glide path.
7. Periodic Implementation Planning and Adequacy Under 40 CFR 51.308(f), certain states are required to revise their regional haze implementation plan and submit a plan revision to the EPA by July 31, 2018 and every ten years thereafter. In addition, 40 CFR 51.308(g) requires periodic reports evaluating progress towards the reasonable progress goals established for each mandatory Class I area, with potential follow-up actions listed in 40 CFR 51.308(h). The specific states to which these requirements apply are listed in 40 CFR 51.300. Although Wisconsin is not one of the states listed under 40 CFR 51.300, WDNR will participate in the MRPO efforts to address these requirements. Wisconsin’s long-term strategy contains enforceable emission reduction measures that are expected to achieve the reasonable progress goals in 2018. WDNR will participate in reassessment and revision of the goals in 2018 and every 10 years thereafter. WDNR will also continue in its efforts to maintain monitoring networks and emissions inventories, and will continue to provide separately the required progress reports every five years, as well as future SIP revisions for the Regional Haze Rule. The reasonable progress report will evaluate the progress made towards the reasonable progress goal for each mandatory Class I area where Wisconsin sources are determined to impact visibility. WDNR will continue to have periodic calls as needed with the Northern Class I consultation group including states, tribes, FLMs, and EPA. The MRPO states and Minnesota will continue to do technical evaluations that will be necessary to determine if the Class I areas are reaching their RPGs. In the five-year report, WDNR will undertake an emission review to determine if the emission reductions projected to occur through the application of BART, CAIR/CSAPR, and the other components of WDNR’s long-term strategy have occurred. The review will also look at what new emission sources have begun operation. Depending on the findings of the five-year progress report, WDNR will evaluate what actions, if any, are appropriate and necessary. In particular, WDNR will re-evaluate the significant emission sources in Tables 8A and 8B in the Reasonable Progress Goals section for emission reductions should Wisconsin be above its projected emissions inventory for the 2013 progress assessment point.

40
8. Monitoring Strategy Wisconsin currently maintains a monitoring network to measure and report levels of various pollutants, including those that contribute to impairment of visibility in Class I areas. Wisconsin is not required to perform direct Haze monitoring, and therefore does not commit our monitoring network under the Haze SIP. Wisconsin's ongoing monitoring efforts and resulting data will be used to certify and Q/A modeling efforts used in evaluating visibility impacts and contribution – with a focus on the Class I areas in Michigan and Minnesota – via the MRPO process. WDNR believes this approach fulfills 40 CFR 51.308(d)(4)(iii) of the Haze Rule. Wisconsin’s monitoring program relies upon Wisconsin’s network of State and Local Air Monitoring Sites (SLAMS), which include the following types of monitors: PM2.5 speciation, photochemical assessment monitoring (PAM), and special purpose monitors (SPM). Since there are no Class I areas located in the state, Wisconsin does not operate any monitoring sites under the federal Interagency Monitoring of Protected Visual Environments (IMPROVE) program; however, Wisconsin does operate Speciation Trends Network (STN) sites. Figure 8 illustrates Wisconsin’s ambient monitoring network. Specific site information, including the pollutants measured, site locations (address and latitude/longitude), and the sampling schedule, is found in the WDNR Air Monitoring document, “Network Plan 2011” (June 2010).11
11 Network Plan 2011. Wisconsin Department of Natural Resources – Air Monitoring Section (June 2010). Online. http://dnr.wi.gov/air/pdf/2011_Network_Plan_FINAL.pdf. November 3, 2010.

Figure 8 – Wisconsin Monitoring Locations

42
Part V. List of Appendices Appendix A. Primary Federal Class I Areas Affected by Wisconsin Stationary Source Emissions Appendix B. Draft List of Class I Areas Located Within (or Impacted by) Midwest RPO States Appendix C. List of On-the-Books Controls Assumed by MRPO Appendix D. WI Smoke Management Plan

Appendix A. Northern Federal Class I Areas Impacted by Wisconsin Emission Sources
Note: Rainbow Lake is not one of the listed 156 Class I areas under the Regional Haze Rule.

June 26, 2007
Draft List of Class I Areas Located Within
(or Impacted by) Midwest RPO States The purpose of this paper is to provide a draft list of Class I areas located within or impacted by a Midwest Regional Planning Organization (MRPO) State. A variety of technical analyses were considered in developing the draft list, including base year (2002) and future year (2018) modeling, back trajectories, and other data analyses. This information shows that every MRPO State impacts multiple Class I areas in the eastern U.S. Regulatory Requirements EPA’s regional haze rule requires a state to “address regional haze I each mandatory Class I Federal area located within the State and in each mandatory Class I Federal area located outside the State which may be affected by emissions from within the State.” (40 CFR Part 51.308(d)) EPA has interpreted this provision as requiring a table identifying each mandatory Class I Federal area located within the State and each mandatory Class I Federal area located outside the State affected by emissions from within the State (see Draft EPA Checklist for Regional Haze SIPs Submitted Under 40 CFR 51.308 - 7/13/06 Staff Draft ). Discussion Technical analyses conducted by the RPOs were consulted to obtain information on areas of influence and culpability for Class I areas in the eastern U.S.1 A summary of this information is provided below and in Table 1. For the MRPO analyses, a state was assumed to affect visibility impairment in a Class I area if it contributes 2% (or more) to total light extinction. This criterion was selected based on a review of the back trajectory and modeling results which showed that states contributing 2% (or more) make-up about 90-95% of total light extinction, whereas states contributing 5% (or more) make-up only about 75-80% of total light extinction. For the other RPO analyses, deference was given to the criteria established by each group to identify contributing states. (1) MRPO Back Trajectory Analyses An initial trajectory analysis was conducted using data for 1997-2001 (all sampling days), a start height of 200 m, and a 72-hour (3-day) trajectory period (Cite: “Quantifying Transboundary Transport of PM2.5: A GIS Analysis”, May 2003, LADCO). By combining trajectory frequencies with concentration information, the average contribution to PM2.5 mass and individual PM2.5 species was estimated (which, in turn, was used to estimate the average contribution to light extinction). The results for 17 Class I areas in eastern U.S. were examined to identify those Class I areas where an MRPO state had at least a 2% contribution to total light extinction (based on all days).
1 Back trajectories and modeling conducted by the WRAP indicate that the Midwest RPO States are not
important contributors to visibility impairment due to sulfates and nitrates in western Class I areas (Cite: “Attribution of Haze Phase I Report, Geographic Attribution for the Implementation of the Regional Haze Rule”, March 14, 2005). The analyses show only five groups of western Class I areas with at least 5% contribution from states outside the WRAP. The outside-WRAP contribution is generally small (on the order of 0-15%), and is likely due mostly to nearby CENRAP states.
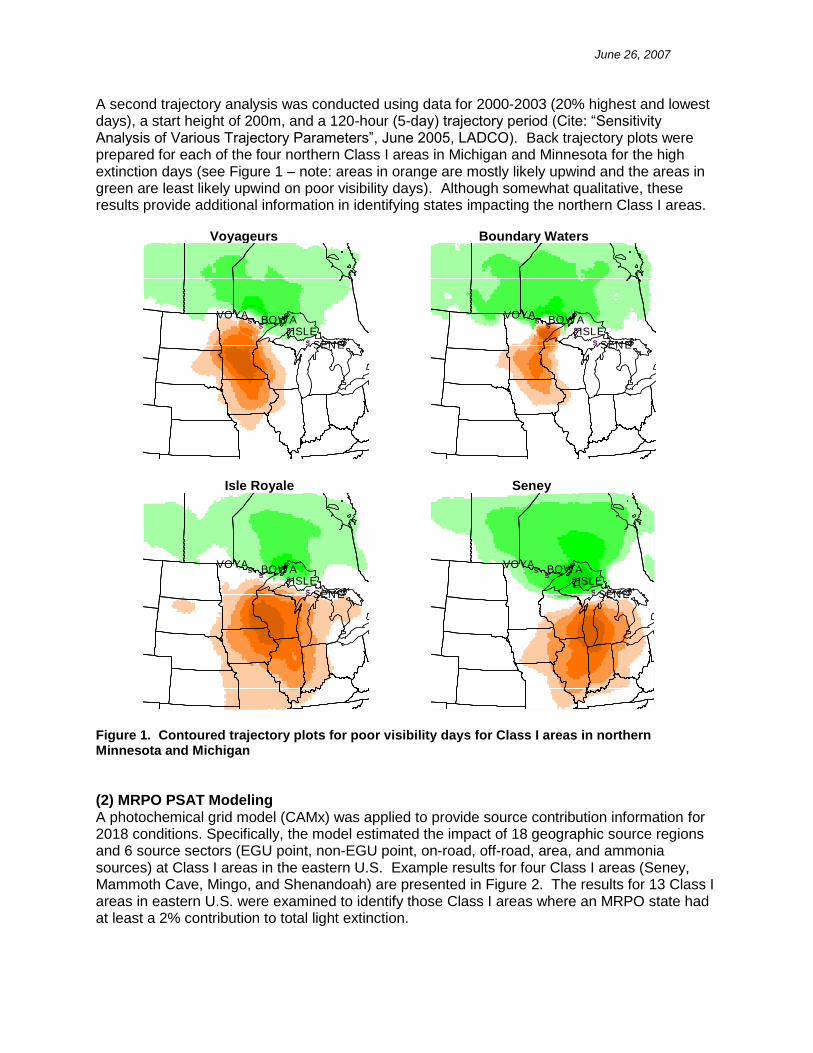
June 26, 2007
A second trajectory analysis was conducted using data for 2000-2003 (20% highest and lowest days), a start height of 200m, and a 120-hour (5-day) trajectory period (Cite: “Sensitivity Analysis of Various Trajectory Parameters”, June 2005, LADCO). Back trajectory plots were prepared for each of the four northern Class I areas in Michigan and Minnesota for the high extinction days (see Figure 1 – note: areas in orange are mostly likely upwind and the areas in green are least likely upwind on poor visibility days). Although somewhat qualitative, these results provide additional information in identifying states impacting the northern Class I areas. Voyageurs Boundary Waters
#S#S
#S
#S
ISLE
VOYA
SENE
BOWA
#S#S
#S
#S
ISLE
VOYA
SENE
BOWA
Isle Royale Seney
#S#S
#S
#S
ISLE
VOYA
SENE
BOWA
#S#S
#S
#S
ISLE
VOYA
SENE
BOWA
Figure 1. Contoured trajectory plots for poor visibility days for Class I areas in northern Minnesota and Michigan
(2) MRPO PSAT Modeling A photochemical grid model (CAMx) was applied to provide source contribution information for 2018 conditions. Specifically, the model estimated the impact of 18 geographic source regions and 6 source sectors (EGU point, non-EGU point, on-road, off-road, area, and ammonia sources) at Class I areas in the eastern U.S. Example results for four Class I areas (Seney, Mammoth Cave, Mingo, and Shenandoah) are presented in Figure 2. The results for 13 Class I areas in eastern U.S. were examined to identify those Class I areas where an MRPO state had at least a 2% contribution to total light extinction.

June 26, 2007
Figure 2. Source region contributions to light extinction based on MRPO PSAT modeling for select Class I areas: Seney, Mammoth Cave, Mingo, and Shenandoah
(3) MANE-VU Contribution Assessment A weight-of-evidence report was prepared by NESCAUM (on behalf of MANE-VU) to understand the causes of sulfate-driven visibility impairment at Class I areas in the northeastern and mid-Atlantic portions of the U.S. (cite: “Contributions to Regional Haze in the Northeast and Mid-Atlantic United States”, August 2006) The report provides information on the relative contribution of various emissions sources and geographic source regions. The analytical and assessment tools considered include Eulerian and Lagangian air quality models, and data analysis techniques, such as source apportionment analyses, back trajectories, and examination of emissions and monitoring data. Sulfate impacts were quantified using five analytical techniques based on 2002 conditions: REMSAD, Q/d, CALPUFF (w/ NWS data), CALPUFF (w/ MM5 data), and percent time upwind (based on trajectory analyses). Figure 3 summarizes the five sets of results for three MANE-VU Class I areas. Although no specific criteria were identified in the report to determine a significant contribution, the States of Vermont, New Hampshire, Maine, and New Jersey assumed a 2% sulfate impact in recent letters to other states inviting them to consult on reasonable progress goals. The MRPO States identified as contributing to a MANE-VU Class I area were Illinois, Indiana, Michigan, and Ohio

June 26, 2007
Figure 3. Percent contribution results using different techniques for ranking state contributions to sulfate levels at MANE-VU Class areas (cite: “Contributions to Regional Haze in the Northeastern and Mid-Atlantic Portions of the U.S.”, August 2006)

June 26, 2007
(4) Missouri-Arkansas Contribution Assessment The draft Consultation Plan for the two Missouri and two Arkansas Class I areas provides information on source regions affecting these Class I areas (i.e., areas of influence) using a variety of data and analyses. (cite: “Central Class I Areas Consultation Plan”, States of Missouri and Arkansas, February 2007) A decision on whether a given state is a contributor to visibility impairment in these Class I areas was based on the combined results of three approaches: areas of influence (see Figure 4), PSAT modeling (based on 2018 conditions), and monitoring data analyses (PMF and back trajectories). According to the draft plan, if a state was a major contributor for at least two of the three approaches (for either sulfate or nitrate), then it was determined to be a significant contributor. The MRPO States identified as contributing to a central CENRAP Class I area were Illinois, Indiana, and Ohio.
Figure 4. Areas of Influence for Central CENRAP Class I Areas (cite: “Central Class I Areas Consultation Plan”, States of Missouri and Arkansas, February 2007)
(5) VISTAS Area of Influence Analysis Areas of influence (AOI) were identified for Class I areas in the southeastern U.S. using residence time plots based on wind trajectory direction and frequency, and weighted by visibility impact (light extinction by ammonium sulfate, ammonium nitrate, or elemental carbon). (Cite: “VISTAS Areas of Influence Analysis”, Draft, February 28, 2007). These extinction-weighted residence time analyses were overlayed on gridded emissions (for both 2002 and 2018) to define emission sources in the areas of greatest influence for each Class I area. Figure 5 shows the plots for two VISTAS Class I areas. AOIs were defined on the basis of residence times greater than 10%. The MRPO States identified as contributing to a VISTAS Class I area were Illinois, Indiana, and Ohio.

June 26, 2007
Figure 5. Areas of Influence for Shenandoah (left) and Mammoth Cave (right) for 2018 conditions (cite: “VISTAS Area of Influence Analyses” PowerPoint presentation, November 28, 2006) Note: green circles indicate 100- and 200-km radii from Class I area, red line perimeter indicate AOI with residence time > 10%, and orange line perimeter indicate AOI with residence time > 5%

June 26, 2007
Table 1. Draft List of Class I Areas Impacted by MRPO States - References
AREA NAME IL IN MI OH WI
81.401 Alabama.
Sipsey Wilderness Area (1) (1)
81.404 Arkansas.
Caney Creek Wilderness Area (2), (4) (2), (4) (2), (4)
Upper Buffalo Wilderness Area (1),(2),(4),(5) (2), (4) (2), (4) (2)
81.408 Georgia.
Cohotta Wilderness Area
Okefenokee Wilderness Area
Wolf Island Wilderness Area
81.411 Kentucky.
Mammoth Cave NP (1), (2), (5) (1), (2), (5) (1), (2) (1), (2), (5)
81.412 Louisiana.
Breton Wilderness Area
81.413 Maine.
Acadia National Park (3) (3) (3) (3)
Moosehorn Wilderness Area. (3) (3) (3) (3)
81.414 Michigan.
Isle Royale NP. (1), (2) (1), (2) (1), (2) (1), (2)
Seney Wilderness Area (1), (2) (1), (2) (1), (2) (1), (2) (1), (2)
81.415 Minnesota.
Boundary Waters Canoe Area Wilderness (2) (2) (2) (1), (2)
Voyageurs NP (2) (2) (1), (2)
81.416 Missouri.
Hercules-Glades Wilderness Area (2), (4), (5) (2), (4), (5) (2), (4) (2)
Mingo Wilderness Area (2), (4), (5) (2), (4), (5) (2) (2), (4) (2)
81.419 New Hampshire.
Great Gulf Wilderness Area (3) (3) (3) (1), (3)
Pres. Range-Dry River Wilderness Area.
81.42 New Jersey.
Brigantine Wilderness Area (3) (3) (1), (3) (1), (3)

June 26, 2007
81.422 North Carolina.
Great Smoky Mountains NP{1} (1) (1) (1)
Joyce Kilmer-Slickrock Wilderness Area{2}
Linville Gorge Wilderness Area.
Shining Rock Wilderness Area.
Swanquarter Wilderness Area
81.426 South Carolina.
Cape Romain Wilderness
81.428 Tennessee.
Great Smoky Mountains NP{1}. (1) (1) (1)
Joyce Kilmer-Slickrock Wilderness{2}
81.431 Vermont.
Lye Brook Wilderness (2), (3) (2), (3) (2), (3) (1), (2), (3)
81.433 Virginia.
James River Face Wilderness. (2) (2) (2) (2), (5)
Shenandoah NP (2), (3) (1), (2), (3) (2), (3) (1),(2),(3),(5)
81.435 West Virginia.
Dolly Sods/Otter Creek Wilderness. (2), (3) (1), (2), (3) (1), (2), (3) (1),(2),(3),(5)
Key (1) MRPO Back Trajectory Analyses (2) MRPO PSAT Modeling (3) MANE-VU Contribution Assessment (4) Missouri-Arkansas Contribution Assessment (5) VISTAS Areas of Influence

On-the-Books Control Measures Used in MRPO Analysis 1
• Power Plants
o Title IV (Phases I and II) o NOX SIP Call o Clean Air Interstate Rule
• On-road Mobile Source Programs
o Federal Motor Vehicle Emission Control Program o Inspection – maintenance programs o Reformulated gasoline
• Non-road Mobile Source Programs
o Federal control programs o Large Spark Ignition and Recreational Vehicle standards o Heavy-duty diesel (2007) engine standard / Low sulfur fuel o Federal railroad/locomotive standards o Federal commercial marine vessel engine standards
• Area Sources
o Consumer solvents o Architectural and industrial maintenance coatings o Aerosol coatings o Portable fuel containers
• Other Point Sources
o VOC 2-, 4-, 7-, and 10-year MACT standards o Combustion Turbine MACT o Consent decrees (refineries, ethanol plants, and ALCOA) o NOX Reasonably Available Control Technology (RACT) in Illinois, Ohio
and Wisconsin
1 Regional Air Quality Analyses for Ozone, PM2.5, and Regional Haze: Technical Support Document. LADCO. Online. http://www.ladco.org/reports/technical_support_document/tsd/tsd_version_iv_april_25_2008_final.pdf . September 15, 2010.

1
Wisconsin
Smoke Management Best Management
Practices for Prescribed Burns

2
Wisconsin Smoke Management Best Management Practices Table of Contents
Page Introduction 3 Smoke Management Best Management Guidelines 5 Glossary 13 Literature Cited 17 Appendices: A – Federal and State Laws Related to Smoke Management 19 B – Managing Prescribed Fire in Wisconsin 23 C -- Smoke Production and Dispersion 25 D – Guideline for Use of the Ventilation Index 28

3
INTRODUCTION
Prescribed fire is an important tool in Wisconsin for restoring and maintaining fire dependent ecosystems, providing wildlife habitat, reducing hazardous fuel buildups, meeting silvicultural and other needs. However, wildland fire (wildfire and prescribed fire) can be a large, intermittent source of particulates that have the potential to cause significant short-term impacts on human health, welfare, safety, and visibility. This Smoke Management Best Management Practices (SMBMP) document has been developed to minimize those potential air quality impacts while optimizing the opportunity to use fire as a land management tool. In 2005, several public and private land management agencies and organizations agreed to develop and implement SMBMP to mitigate potential air quality impacts from prescribed fire. In general, agencies and organizations in Wisconsin that conduct prescribed burns prepare site specific individual burn plans. State law and/or local ordinances may require burn permits for “open burning.” Currently most prescribed fire plans include provisions that address the effects of smoke. These SMBMP will begin a formal effort to minimize impact of smoke produced from managed wildland fires in Wisconsin. The signatories to this SMBMP document agree to abide by its provisions for prescribed fires they ignite for resource benefit. These SMBMP have been developed based on the principles identified in Section VI, “Smoke Management Programs” of the U.S. Environmental Protection Agency’s (EPA) April 23, 1998 “Interim Air Quality Policy on Wildland and Prescribed Fires” (http://fire.r9.,fws.gov/ifcc/smoke/EPA_Policy.htm ) The Lands and Forestry Divisions and the Bureau of Air Management (Air and Waste Division) of the Wisconsin Department of Natural Resources (WDNR) serve as the central authority for the State’s SMBMP. The SMBMP guidelines will become effective when the Department WDNR certifies in writing to Environmental Protection Administration (EPA) that a SMP has been adopted and implemented. The SMBMP document should be reviewed annually and amended as necessary to achieve the purpose of the SMBMP and incorporate changes in regulations, policies and advances in technology. Organizations that May Wish to Sign-on to the SMBMP In Wisconsin, The Nature Conservancy (TNC), WDNR, National Park Service (NPS), U.S. Fish & Wildlife Service (USFWS), U. S. Forest Service (USFS), Department of Defense (DOD), the Bureau of Indian Affairs (BIA), Menominee Indian Tribe of Wisconsin (MITW), Pheasants Forever, and several non-profit conservation groups all use fire to accomplish goals and objectives ranging from ecosystem management to fuels reduction. USDA conservation programs (i.e. Conservation Reserve Program, Wildlife Habitat Incentives Program) offered through the Farm Service Agency and Natural Resources Conservation Service (NRCS), place an emphasis on prescribed fire, making the increased use of prescribed fire in the private sector a general trend. Signing organizations agree to follow the SMBMP guidelines in the next section as part of their burn plan. Use of Fire as an Ecosystem Management Tool in Wisconsin The use of prescribed fire presents the need to weigh the trade-offs associated with the ecological benefit of this practice vs. the impact of increased emissions from current and accelerated burning programs. Part of this trade-off involves the careful consideration of and application of smoke management techniques to minimize the impact of emissions, while still meeting ecological needs. An example of this trade-off to be considered is the increased fuel consumption from a wild fire

4
burning under severe meteorological conditions versus the reduced fuel consumption of a prescribed fire ignited that might burn under moderate weather conditions. Many of the vegetative cover types within the state evolved with fire as the natural process for restoration and maintenance (Curtis). Prescribed fire, therefore, is the preferred management tool when safety and environmental conditions permit. Vegetative types ranging from grasslands and prairie plantings, to wetlands, savannas, conifer and hardwood forests, brush lands and agricultural fields are all treated with fire. Broadcast burning is the preferred method for landscape scale land treatments. Piled slash is burned throughout the year for cover type conversion, site preparation, and to mitigate insect and disease related problems, such as oak wilt. Use of prescribed fire has been intermittent since the post-logging era wildland fires. The various ecosystem types that have a fire dependent element reflect the impacts of this intermittent pattern. Savannas, pine barrens, grasslands, and many other plant communities require fire for health and maintenance. The differing degree of fire occurrence over the past 100 years has contributed to the loss of acreage of these ecosystems. In summary, the main reasons to use prescribed fire include:
Wildlife habitat improvement and maintenance Site preparation and seed production Ecosystem management and restoration Maintenance of biological diversity Restoration of fire as a natural process Control of insect and disease Fuel reduction, including hazardous fuels Minimizing the potential for significant air quality impacts from wildfire The training of fire personnel resources Testing of fire suppression equipment and suppression techniques.

5
SMOKE MANAGEMENT BEST MANAGEMENT PRACTICES GUIDELINES
Purpose These Smoke Management Best Management Practices (SMBMP) are a set of guidelines and procedures that are followed by signatory organizations to reduce the adverse effects of smoke from prescribed fires. The goal of the Wisconsin SMBMP is to prevent violations of the federal fine particles standard (PM2.5) and minimize adverse effects including:
Health effects from smoke inhalation o Premature death o Decreased lung function o Increased asthma attacks and chronic bronchitis o Acute respiratory symptoms o Respiratory and cardiopulmonary related hospital admissions o Increased work and school absences
Visibility related travel hazards o Aircraft o Highways o Rail
Electric utility hazards Violations of an ambient air quality standard Decreased visibility in scenic vistas
Authorization to Burn The WDNR Division of Forestry is responsible for issuing permits for open burning in organized protection areas, outside of incorporated cities or villages, of Wisconsin (Figure 1), for forest fire protection purposes. In cooperative protection areas, town chairpersons are responsible for issuing permits for open burning for forest fire protection purposes. This authority is stated in Wisconsin State Statute Chapter 26 and associated administrative rules. The WDNR issues written permits for open burning of vegetative materials. A permit is not required when the ground is covered with snow. Permitting of open burning is also administered locally when municipalities or townships have local ordinances more restrictive than the state rules. Wisconsin Administrative Code, NR 429.04(1), prohibits open burning with certain exceptions. One of those exceptions is backfires to control forest fires or fires set for forest or wildlife habitat management with the approval of the department where no reasonable alternative is available. Factors in considering the reasonableness of alternatives may include: 1) costs of other alternatives, 2) availability of other alternatives; or 3) effectiveness of each of the other alternatives in comparison to a prescribed burn in achieving the land management objectives. In addition, NR 429.04(2) specifies that all allowed open burning shall be conducted in a safe pollution-free manner, when wind and weather conditions will minimize adverse effects and in conformance with local and state fire protection regulations. Prescribed burning on public lands in Wisconsin is done under the on-site supervision of an agency certified burn boss.

6
Figure 1
Historically the Federal agencies in Wisconsin have complied with state burning regulations. Procedures for coordinating open burning restrictions between state and federal agencies have been handled by the Wisconsin Interagency Fire Council. These SMBMP are a formal agreement among signatory agencies for state burning regulation compliance for the purposes of future smoke related emission and impact reduction. In the event that an air quality watch or advisory is declared by WDNR, signatories to this SMBMP agree to cancel all open burning related to prescribed fire use for the applicable county or counties affected by the burn while the advisory remains in effect. The WDNR has a website at http://dnr.wi.gov/air/aq/health/status.asp for air quality watches and advisories. Burn Plans All signatories to this SMBMP agree to have burn plans that incorporate the elements listed below. They should be on file at agency or organization offices and are available upon request. These prescribed burn plans will include the following elements at a minimum:
Location and legal description (Town, Range, Section and quarter-quarter section) of the area to be treated, including ownership.
Personnel and/or certified prescribed burn boss responsible for managing the fire. Type of vegetation or fuel model (utilizing the National Fire Behavior Prediction System) to
be burned. Area in acres to be burned. Amount of fuel to be consumed* Fire prescription including smoke management components and ventilation index limits. Criteria the fire manager will use for making go-no-go burn decisions.

7
Safety and contingency plans. *As an example, if burning in a fuel model 6 (brush fuel type), and the objective is to top kill 75% of the woody vegetation ,this can be calculated by multiplying average fuel present (6 tons/acre) by 75%. This results in amount of fuel to be consumed equaling 4-1/2 tons/acre. Smoke Management Best Management Practices for Burn Plans Actions to Minimize Fire Emissions – The burn plan should document the steps to be taken prior to, during, and after the burn to reduce air emissions. This could include, but may not be limited to, any of the following measures (NWCG Smoke Management Guide for Prescribed and Wildland Fires, 2001):
Minimize the area burned; reduce the acreage burned per burning period, or use non-fire treatments.
Reduce the fuel loading in the area to be burned by mechanical means, or by using frequent, low intensity burns to gradually reduce fuels.
Reduce the amount of fuel consumed by the fire by burning when large non-target fuel moistures and duff moistures are higher.
Minimize emissions per ton of fuel consumed, by using mass ignition techniques, using backing fires, increasing combustion efficiency and performing rapid and complete mop-up.
Pre-treat heavy fuels or use firing techniques that exclude them from the burn. Minimize potential smoke impacts on sensitive receptors
Evaluate Smoke Dispersion and Sensitive Receptor Sites Prescribed burn plans should identify and evaluate potential smoke impacts on sensitive receptors. Fires should be timed to minimize exposure of sensitive populations (those that smoke may present particular health risks). There are 5 steps to address sensitive receptor sites and smoke dispersion: 1. Identify and list sensitive receptor sites 2. Specify the requirements for smoke dispersal at sensitive receptor sites 3. Check for Air Quality Watches or Advisories 4. Notify affected populations and authorities 5. Identify monitoring plans for sensitive receptor sites These steps are further described below. 1. Identify and list sensitive receptor sites Sensitive receptor sites are usually defined as locations where human populations tend to concentrate and where smoke could impact the health of those populations or significantly impact visibility that may be detrimental to health or the enjoyment of scenic qualities of the landscape. These may be residential concentrations in the form of towns or cities, or locations where people tend to gather in groups such as parks and schools. Travel routes such as highways may be labeled as sensitive receptor sites where smoke can be a factor in potential motor vehicle accidents. Particular areas along highways or other locations may be more prone to being declared sensitive receptor sites because of topographic and microclimate features. 2. Specify the requirements for smoke dispersal at sensitive receptor sites The plan should identify the distance and direction from the burn site to local sensitive receptor areas where appropriate. Fire prescriptions will specify minimum requirements for the atmospheric capacity for smoke dispersal such as minimum surface and upper level wind speeds, desired wind direction, minimum mixing height, and dispersion index. Utilize the Ventilation Index explained in Appendix D for minimum requirements.
8
Another source of information for burn day decisions in counties with an air quality monitor is the Air Quality Index (AQI). Check the AQI for the area of the burn and downwind impact zone on the WDNR internet website, at http://dnrmaps.wi.gov/wisards . Values at or above the AQI orange (unhealthy for sensitive groups) or red (unhealthy) categories for the burn and the downwind impact zone should be considered in the decision making process. 3. Check for Air Quality Watches or Advisories The burn boss or prescribed fire manager responsible for a proposed prescribed burn has the responsibility to assure that there is no air quality advisory or watch in effect for the county or counties affected by smoke dispersal on the day that the prescribed burn occurs. Check the WDNR website at http://dnr.wi.gov/air/aq/health/status.asp or the National Weather Service website at http://www.crh.noaa.gov/mkx/ which posts air quality watches and advisories. 4. Notify affected populations and authorities The burn plan should identify actions that will be taken to notify populations and authorities at sensitive receptors, including those in adjacent jurisdictions, prior to the fire. The plan should also identify contingency recommendations that should be taken during a fire to reduce the exposure of people at sensitive receptors if smoke intrusions occur. These recommendations are from the National Wildfire Coordinating Group’s Smoke Management Techniques Course (Rx-410) and include the following:
Notify sensitive receptors and DNR Air Management as soon as possible when conditions change.
Place field observers at sensitive receptors to monitor smoke conditions. Work with local health agencies and DNR Air Management (issues air quality health
advisories). Relocate smoke-sensitive people. Terminate project. Accelerate completion of project.
5. Identify monitoring plans for sensitive receptor sites The plan should identify how the effects of the fire on air quality at sensitive receptors areas should be monitored. The extent of the monitoring plan should match the size of the fire, fuel loading and consider the proximity to smoke sensitive areas. For small, or short duration fires (such as those in grass or leaf litter), visual monitoring of the directions of the smoke plume and monitoring nuisance complaints by the public may be sufficient. Other monitoring techniques include posting personnel at sensitive receptors to look for smoke intrusions and continued tracking of meteorological conditions during the fire. For fires in fuels with longer duration burning (such as timber litter or slash), and which are expected to last more than one day, locating real-time PM monitors at sensitive receptors may be warranted to facilitate timely response to smoke impacts. Smoke Management Best Management Practices Related to Road Impacts The Wisconsin Department of Transportation (WDOT) is responsible for maintaining the state and federal highways within Wisconsin. WDOT has 8 Region offices to serve the transportation needs of Wisconsin motorists, location and right-of-way contacts are available on the following web site www.dot.wisconsin.gov/business/rules/docs/contact-row.pdf. Planning for smoke management adjacent to state and federal highways begins with contacting the local WDOT Regional Office to determine if a DOT permit is required. If a prescribed burn is being planned within WDOT right-of-way (ROW) by another state or federal land management agency, organization or private landowner, and a DOT permit is required, the following documents will be submitted to the WDOT Regional Right of Way permit contact:

9
1. Application/Permit To Work on Highway Right-Of-Way (WDOT Form DT 1812) 2. The Burn Plan
*WDOT forms are available from the local Regional office and online www.dot.wisconsin.gov/forms/docs/dt1812.doc.
Processing time for permit approval is up to 30 days and is intended for non-emergency activities. The approval of an annual permit rather than an individual permit may be desirable to accommodate flexibility in the time range to complete multiple burns adjacent to highways planned by state and federal land managers. The thresholds for pre-planning the distance of a burn from travel routes should be determined on a site-by-site basis. Property ownership, rural vs. urban environment, average daily traffic (ADT) and the justification for burning within the vegetated ROW should be evaluated and addressed within the burn plan. Participation in the WDOT ROW permit process as described above should assure that the Burn Boss/Fire Manager should receive specific information on the required signage and its proper placement within the ROW. The WDOT brochure Work Zone Safety: Guidelines for Construction, Maintenance, & Utility Operations is an excellent reference and is available on line at www.dot.wisconsin.gov/business/rules/docs/wzsb.pdf . The use of electronically programmable signs for smoke warning and speed reduction is an option. The responsibility for providing standard signs or renting the programmable signs lies with the agency or organization conducting the prescribed burn. Traffic control devices placed and maintained by the State, County, City or other local officials are required by Wisconsin Law to conform to the Wisconsin Manual on Uniform Traffic Control Devices. The manual can be downloaded from www.dot.wisconsin.gov/business/engrserv/ . For emergency situations fire officials should immediately call 911 or local law enforcement or contact the local Region WDOT Emergency Coordinator for the fastest response. The use of signage, the decision to temporarily close a state or federal highway and to reroute traffic must be coordinated with WDOT in cooperation with fire officials and law enforcement. Responsibility for county, city, or town roads is under the jurisdiction of the local unit of government. Fire managers/burn bosses need to contact local highway officials for the permitting process. Please refer to the following website for contact information for each County Highway Commissioner in Wisconsin www.wcha.net/CO/Co_Map_Page.htm . Authority to control traffic must be coordinated with state, county, or local units of government having jurisdiction over the road. The best practice would be not to burn when it is apparent that smoke would be placed over a roadway. For detailed information about all roads within the state of Wisconsin including State and Federal Routes, County roads, Town roads or others, please visit the following website: www.dot.wisconsin.gov/travel/maps . Smoke Management Best Management Practices Related to Railway Impacts Contact the emergency management representative for the specific railroad effected. These representatives should have firsthand knowledge of their internal processes for emergency response to smoke and the timing of rail activity along the rail line.

10
The Official Rail Map and directory of railroads is available from the WDOT public website: www.dot.wisconsin.gov/travel/rail . The Wisconsin Rail Map, Emergency Railroad Phone Numbers and Required Clearances near Railroad Tracks are just a few of the documents available to assist in planning for smoke management along railroad corridors. Smoke Management Best Management Practices Related to Air Traffic Impacts The coordinating agency should contact any private and/or public airport within 10 miles of the closest burn perimeter so that air traffic control is aware of the situation. Prescribed burning within 5 miles of an airport perimeter should be closely coordinated with the airport manager/owner so that the burn does not conflict with airport usage (e.g. new pilot training). Airport locations can be obtained using www.dot.wisconsin.gov/travel/air . This link can provide detailed information on locations and contact information. Smoke Management Best Management Practices Related to Utility Impacts The safety of fire line personnel in relation to fire use near overhead transmission lines, where smoke, ash and incidental mist from fire line operations may contaminate the insulators on transmission structures is a consideration. Standard utility recommendations are to maintain a minimum radial distance of 35 feet between firefighters, vehicles and transmission structures to protect fire fighting personnel from this electrical hazard. Further recommendations would be to place containment lines no closer than 100 feet of and parallel to the edge of the outer most conductor. Planning to address the direction and dispersion of smoke in these situations is critical as a heavy smoke plume on power lines may cause a conductor to ground short. Consider including any utility owner or operator that maybe impacted in the planning process. Qualified company representatives are responsible for safely adhering to all other rules pertaining to this subject matter. Smoke Management Best Management Practices and Dispersion The National Weather Service (NWS) forecast offices in Green Bay, Sullivan, LaCrosse, Duluth, MN, and Minneapolis, MN provide twice daily fire weather forecasts every day during the fire season (generally April 1 to November 1). The fire weather forecasts issued by the respective NWS offices, at 0700 and again by 1500, include projected smoke management information. The Fire Weather Annual Operating Plan (FWAOP) available at the forecast offices or most agency dispatch or coordination centers provides extensive forecast information. State and Federal Agency Prescribed fire managers who plan ignitions at other than the forecast time may request dispersion/ventilation criteria as part of a spot weather forecast from the NWS. At this time a spot weather forecast from the NWS is not available to the private sector. To ensure optimum dispersal of smoke emissions during prescribed burns, the mixing height should be deep enough and have sufficient transport wind speed to ensure the dilution and dispersal of emission concentrations. The ventilation index multiplies mixing height (measured in feet) and transport wind speed (measured in knots per hour) to produce an index that expresses the ability of the atmosphere to disperse emissions. This dispersion information is included as part of the daily fire weather forecast. It describes the mixing height, transport wind speed and ventilation index for the peak or low conditions during the forecast period. For more information on the ventilation index refer to Appendix D. Public Education and Awareness Agencies and organizations should work to establish and maintain programs to stress the use and importance of fire for ecosystem and related land management goals. Public health and safety are critical to this effort. The Wisconsin Prescribed Fire Council has been working towards this goal since 2002.

11
Surveillance and Enforcement: Failing to follow the burn plan prescription, agency and TNC certified burn bosses would be subject to that organization’s specific review protocols and possible disciplinary action. Formal after-action reports generated by any agency review should be forwarded to that agency’s representative to the Wisconsin Interagency Fire Council (WIFC). The agency representative will then forward the review on to the remaining members of WIFC, to promote lessons learned. Agencies are encouraged to include private sector members from the Wisconsin Prescribed Fire Council Board of Directors in any after-action review. Agency-certified prescribed burn bosses follow a pre-burn go-no-go procedure to ensure that the burn day parameters meet the burn plan prescription including SMBMP. Private sector agencies, who are signatories on this SMBMP, who do not follow the burn plan prescription would be subject to the following peer review protocol. Smoke intrusions and/or escaped prescribed burn are two examples that could trigger a review. A three person review team will be organized consisting of: 1) representative chosen by the private burn boss, 2) WDNR representative, and 3) representative from the WIFC agreed to by both WDNR and the private burn manager/boss. The group would review the burn proposal, weather conditions, go-no-go decision process, and other factors regarding the prescribed burn. The review team would make recommendations to the WDNR and WIFC as to appropriate corrective actions. These actions could include (but are not limited to): no action (plan was good and followed), removal as a signatory to the SMBMP document, prescribed burn plans requiring a peer review before being implemented, or denied future approval under NR429. WDNR, as the central authority, in consultation with WIFC would make the finial determination on recommended actions. Should legal action be taken for a prescribed burn that may trigger a review, the review may be delayed or pre-empted by necessary legal considerations. Private sector burn managers/burn bosses are encouraged to summit one burn plan per year to the WDNR Fire Operations Specialist (1500 N. Johns Street, Dodgeville, WI 53533) for a peer review. Private sector burn bosses are encouraged to utilize Wisconsin Prescribed Fire Council’s go-no-go checklist to ensure that the burn day parameters meet the burn plan prescription, including smoke management concerns. Optional Air Quality Protection Agencies should consider opportunities to establish specific, stringent protection for those special areas requiring additional regulation in the interest of public health and safety. Recognition of these areas should be documented in site-specific burn unit plans, along with the steps to minimize impacts. Program Evaluation To evaluate the effectiveness of the SMBMP, an interagency prescribed fire stakeholder group should annually review information on acres burned by fuel type with prescribed fire. Reports of nuisance complaints or smoke intrusions should be noted and the interagency prescribed fire stakeholder group should use this information to measure the effectiveness of this plan. The WDNR recommends that SMBMP member agencies maintain records necessary to demonstrate an Exceptional Event, per Environmental Protection Agency 40 CFR Parts 50 and 51, Treatment of Data Influenced by Exceptional Events; Final Rule, for the necessary time that the WDNR is required to report data to the EPA. In 2009, the duration was 4 years.
In addition, the WDNR should review data from the existing PM2.5, and ozone monitors in Wisconsin. Correlations of air quality (NAAQS) with prescribed fire should be assessed for the interagency prescribed fire stakeholder group. In the event an exceedance (PM10, PM2.5, or ozone) is recorded, WDNR will notify the principal contacts listed in the Memorandum of Agreement between the

12
signatories of these SMBMP to ensure the documentation necessary to demonstrate an Exceptional Event is collated and available.
The interagency prescribed fire stakeholder group should also review annually:
The acres of prescribed burns by fuel type and any associated air quality issues,
The need for changes in the SMBMP.
This SMBMP document is an evolving and will undergo ongoing evaluation using stakeholder input.
Upon implementation of this plan, signatories should annually submit electronically on WDNR forms by January 31 of each year to the Forest Protection Section – Operations Specialist the following:
Acres prescribed burned by fuel type for the previous calendar year. Date of burns. Duration of burns. Moisture content (if available) Location and legal description of burns conducted. Nuisance complaints or smoke intrusions.
WDNR will estimate emissions based upon stakeholder inputs for inclusion in the annual emissions report for the previous calendar year to EPA.

13
GLOSSARY Air Quality -- The characteristics of the ambient air (all locations accessible to the general public) as indicated by concentrations of the six air pollutants for which national standards have been established [i.e., particulate matter (PM), sulfur dioxide (SO2), nitrogen dioxide (NO2), ozone (O3), carbon monoxide (CO) and lead], and by measurement of visibility in mandatory Federal Class I areas. Air Quality Advisory -- An air quality advisory is issued when the ambient air quality in an area is unhealthy for sensitive individuals or when the air quality is expected to degrade to that level within a few hours. Air Quality Watch – An air quality watch is called for an area when the air quality forecasts for the next day, or the next few days, indicates that there is a potential for air quality to become unhealthy for sensitive individuals. Ambient Air -- That portion of the atmosphere, external to buildings, to which the general public has access. Attainment area -- A geographic area in which levels of a criteria air pollutant meet the national ambient air quality standard, or NAAQS for the pollutant. An area may have on acceptable level for one criteria air pollutant, but may have unacceptable levels for others. Thus, an area could be both attainment and non-attainment at the same time. Attainment areas are defined using federal pollutant limits set by EPA. Burn Boss -- Person responsible for supervising a prescribed burn from ignition through mop-up. Class I Area -- An area set aside under the Clean Air Act (CAA) to receive the most stringent protection from air quality degradation. Mandatory Class I Federal areas are (1) international parks, (2) national wilderness areas which exceed 5,000 acres in size, (3) national memorial parks which exceed 5,000 acres in size, and (4) national parks which exceed 6,000 acres and were in existence prior to the 1977 CAA Amendments. The extent of a mandatory Class I Federal area includes subsequent changes in boundaries, such as park expansions. Combustion -- Burning. Many important pollutants, such as sulfur dioxide, nitrogen oxides, and particulates (PM10) are combustion products, often products of the burning of fuels such as coal, oil, gas and wood Criteria air pollutants -- A group of very common air pollutants regulated by EPA on the basis of criteria (information on health and/or environmental effects of pollution) and for which NAAQS have been established. In general, criteria air pollutants are widely distributed all over the country. They are: particulate matter (PM), carbon monoxide (CO), sulfur dioxide (SO2), ozone (03), Nitrogen Oxide (NOx) and lead (Pb).

14
Emission -- Release of pollutants into the air from a mobile source (e.g. vehicle), stationary source (e.g. industry), or area sources (e.g. gas stations, chimneys, vegetative burning). We say sources emit pollutants Fuel -- Includes combustible vegetative matter such as grass, trees, shrubs, limbs, branches, duff, and stumps. Haze -- Particles in the air that scatter light and degrade visibility. Monitoring (monitor) -- Measurement of air pollution is referred to as monitoring. EPA, state and local agencies measure the types and amounts of pollutants in the ambient in community air. National Ambient Air Quality Standards (NAAQS) -- National standards for maximum acceptable concentrations of “criteria” pollutants in the ambient air. Designed to protect public health with an adequate margin of safety (primary standard), and to protect public welfare from any known or anticipated adverse effects of such pollutants (e.g., visibility impairment, soiling, materials damage, etc.) in the ambient air (secondary standard). Non-attainment area -- A geographic area in which the level of a criteria air pollutant is higher than the level allowed by the federal standards. A single geographic area may have levels that are acceptable of one criteria air pollutant but unacceptable levels of one or more other criteria air pollutants; thus, an area can be both attainment and non-attainment at the same time. Nuisance Smoke -- Amounts of smoke in the ambient air, that interfere with a right or privilege common to members of the public, including the use or enjoyment of public or private resources. Ozone -- A highly reactive gas consisting of three oxygen atoms. Particulate Matter (PM) --Any airborne finely divided material mixture of very small particles that are suspended in the atmosphere, except uncombined water, which exists as a solid or liquid at standard conditions (e.g., dust, smoke, mist, fumes, or smog). PM10 -- Particles with an aerodynamic diameter less than or equal to a nominal 10 micrometers (including PM2.5). Concentrations in the air are measured as micrograms per cubic meter of air (µg/m3). PM2.5 -- Particles with an aerodynamic diameter less than or equal to a nominal 2.5 micrometers. Concentrations in the air are measured as micrograms per cubic meter of air (µg/m3). Prescription -- Measurable criteria that guide selection of appropriate management response and actions. Prescription criteria may include the meteorological conditions affecting the area under prescription, as well as factors related to the state of the area to be burned such as the fuel moisture condition and other physical parameters. Other criteria

15
which may be considered include safety, economic, public health, environmental, geographic, administrative, social or legal considerations, and ecological and land use objectives. Prevention of Significant Deterioration (PSD) -- A requirement in the Clean Air Act, which establishes the maximum allowable increases in ambient air concentrations of selected air pollutants above baseline concentrations in areas designated as Class I, Class II, or Class III. Prescribed Fire -- Any fire ignited by management actions to meet specific objectives. For federal agencies a written, approved prescribed fire plan must exist, and NEPA requirements (where applicable) must be met, prior to ignition. Sensitive populations -- Those populations to which smoke emissions may present particular health risks. Sensitive Receptors -- Locations where human population tend to concentrate and where smoke could impact the health of those population or significantly impact visibility that may be detrimental to either health or the enjoyment of scenic qualities of the landscape. These may be residential concentrations in the form of towns or cities, or locations where people tend gather in groups such as parks. Travel routes such as highways may be labeled as sensitive receptor sites where smoke can be a factor in potential motor vehicle accidents. Particular areas along highways or other locations may be more prone to being declared sensitive receptor sites because of topographic and microclimate features. (i.e.--Population centers such as towns and villages, camp grounds and trails, hospitals, nursing homes, schools, roads, airports, mandatory Class I Federal areas, etc. where smoke and air pollutants can adversely affect public health, safety and welfare.) Smoke Management Best Management Practices (SMBMP) -- Establishes a basic framework of procedures and requirements for managing smoke from fires that are managed for resource benefits. The purposes of SMBMPs are to mitigate the health, nuisance and public safety hazards (e.g., on roadways and at airports) posed by smoke intrusions into populated areas; to prevent deterioration of air quality and NAAQS violations; and to address visibility impacts in mandatory Class I Federal areas in accordance with the regional haze rules. Source -- any place or object from which pollutants are released, such as power plants, factories, dry cleaners, gas stations, farms, motor and consumer products. State Implementation Plan (SIP) -- State implementation plans are collections of the regulations and emission reduction measures used by a state to reduce air pollution in order to attain and maintain NAAQS or to meet other requirements of the Act. The Clean Air Act requires that EPA approve each state implementation plan. Violation of the PM NAAQS -- As revised in 2006, the daily PM10 standard is violated when the 99th percentile of the distribution of 24-hour concentrations for a period of 1 year (averaged over 3 calendar years) exceeds 150 µg/m3 at any monitor within an area. PM2.5 are set at a daily concentration less than or equal to 35 µg/m3, and an annual mean

16
concentration of less than or equal to 15 µg/m3. For PM2.5 the daily standard is violated when the 98th percentile of the distribution of the 24-hour concentrations for a period of 1 year (averaged over 3 calendar years) exceed 35 µg/m3 at any monitor within an area. The annual standard is violated when the annual arithmetic mean of the 24-hour concentrations from a network of one or more population-oriented monitors (averaged over 3 calendar years) exceeds 15 µg/m3. Wildfire -- An unplanned and unwanted wildland fire including unauthorized human-caused fire, escaped prescribed fire projects, and all other wildland fires where the objective is to put the fire out. Wildland Fire -- Any non-structural fire that occurs in the wildland. Two distinct types of wildland fire have been defined in Wisconsin and include wildfire and prescribed fire. Wisconsin Interagency Fire Council – The Wisconsin Interagency Fire Council consists of representatives of the Wisconsin Department of Natural Resources, US Fish & Wildlife Service, US Forest Service, Menominee Tribal Enterprises, Bureau of Indian Affairs and National Park Service. For the purposes of the Smoke Management Best Management Practices, WIFC would also include representatives of the other signatories to the SMBMP including, but not limited to, The Nature Conservancy and the Wisconsin Prescribed Fire Council.

17
LITERATURE CITED Anderson, G.K., Sandberg, D.V., Norheim, R. 2004. Fire Emissions Production Simulator (FEPS) User’s Guide ver. 1. USDA Pacific Northwest Research Station, Fire and Environmental Research Applications team. Seattle, WA
Anderson, H.E. 1982. Aids in Determining Fuel Models for Estimating Fire Behavior. Gen. Tech. Rep. INT-122. Fort Collins, CO.
Curtis, J.T. 1959. The Vegetation of Wisconsin: An Ordination of Plant Communities. Univ. of Wisconsin Printing. Madison, WI
Dorney, J. R. 1981. The Impact of Native Americans on Pre-settlement Vegetation in Southeastern Wisconsin. Wisconsin Academy of Sciences, Vol. 69: 26-36.
Dorney, C.H., Dorney, J.R. 1989. An Unusual Oak Savanna in Northeastern Wisconsin: The Effect of Indian-Caused Fire. American Midland Naturalist, Vol. 122, #1: 103-113.
EPA. 1992. Prescribed burning background document and technical information document for prescribed burning best available control measures. Office of Air Quality Planning and Standards, Research Triangle Park, NC 27711. EPA-45012-92-003.
EPA. 1998. Interim air quality policy on wildland and prescribed fires. Office of Air Quality Planning and Standards, Research Triangle Park, NC 27711.
Michigan DNR. 2006. Michigan Smoke Management Program.
MN ICS. 2007. Minnesota Smoke Management Plan.
National Wildfire Coordination Group. 2001. Smoke Management Guide for Prescribed and Wildland Fire. PMS 420-2. Boise, ID.
National Wildfire Coordination Group. 2003. Smoke Management Techniques Instructor Guide, Course RX-410. NFES 2475, Boise, ID
Ottmar, R. D., and R. E. Vihnanek. 1999. Stereo photo series for quantifying natural fuels. Volume V: Midwest Red and White Pine, Northern Tallgrass Prairie, and Mixed Oak Types in the Central and Lake States. PMS 834. Boise, ID.
Peterson, J., and B. Leenhouts. 1997. What wildland fire conditions minimize emissions and hazardous air pollutants and can land management goals still be met? (Unpublished support document to the EPA Interim Air Quality Policy on Wildland and Prescribed Fires. August 15, 1997.)
Sandberg, D.V., Ottmar, R.D., Peterson, J.L., and Core, J. 2002. Wildland fire on ecosystems: effects of fire on air. Gen. Tech. Rep. RMRS-GTR-42-vol. 5. Ogen, UT.
Scott, J.H., Burgan, R.E. 2005. Standard fire behavior fuel models: a comprehensive set for use with Rothermel’s surface spread model. Gen. Tech. Rep. RMRS-GTR-153. Fort Collins, CO.
Williams, G.W. 2000. Introduction to Aboriginal Fire Use in North America. Fire Mgmt Today 60(Summer): 8-12.

18
Table 1
Interagency Prescribed Burns Completed Agency 2002 2003 2004 2005 2006 2007 2008 2009 Total
Acres 2002-2009
USF&WS
5677 6928 5996 9345 7681 9601 7982 7359 60569
WDNR
18750 19750 19500 20000 19000 27000 21550 21330 166880
USFS
586 2108 1259 1045 3211 1201 3450 775 13635
TNC
818 636 609 418 895 596 375 550 4897
Pheasants Forever
100 150 295 200 850 870 500 775 13635
NRCS
40 30 350 830 1015 3826 7010 13101
DoD Fort McCoy
5121 5583 5627 5270 5731 4856 3130 550 4897
BIA
400 630 720 100 350 1258 3458
WDOT 160 280 80 120 80 20 30
770
Mississippi Valley Consevancy
129 56 22 60 267
MITW
140 11 371 280 521 514 850 2936
Total Acres
31052 35335 33727 37629 39198 45760 41677 48157 319087
NOTE: The prescribed burn acres in Table 1 are the best data available; some burn acreage may have been missed or double reported.

19
APPENDICES
Appendix A Federal and State Laws Related to Smoke Management Best Management Practices
Legal Requirements and Environmental Regulations for Wisconsin Smoke Management Best Management Practices The Clean Air Act (Public Law 95-95) as amended in 1977 and 1990 identifies standards and legal requirements that must be met by the EPA, other Federal agencies, the states, and industry. Prior to 1990, the Federal Clean Air Act did not directly address prescribed burning. However, the latest amendments contain a number of sections which may result in both direct and indirect regulatory controls. Section 109 of the Clean Air Act (CAA) requires EPA to develop primary ambient air quality standards to protect human health and secondary standards to protect welfare. In July of 1987, the EPA promulgated ambient air quality standards for those particulates less than 10 microns in diameter (PM10). The PM10 standards were designed to protect that portion of the population which is most susceptible to the effects of airborne respirable particles with an adequate margin of safety. However, more recent research indicated that the PM10 standard did not protect those people who already had existing respiratory problems. As a result EPA issued their initial fine particulate standards in July, 1997 to regulate those particulates less than 2.5 microns in diameter (PM2.5). These standards are of interest to the fire community because approximately 70% of the particulate emitted from biomass burning are in this size range. More current epidemiological studies indicate a much stronger relationship between increases in PM2.5 concentrations and mortality and morbidity. As a result, EPA revised these standards in September, 2006 reducing the 24 hr standard from 65 to 35 micrograms per cubic meter (µg/m3). The annual standard stayed the same at 15 (µg/m3). (Table B1, PM Ambient Air Quality Standards)
Table A1 (From MI SMP 2007)
EPA’s PM Standards: Old and New
150 µg/m3
1 expected exceedance
Revoked150 µg/m3
1 expected exceedance
50 µg/m3
Annual average
PM10
(Coarse Particles)
35 µg/m3
98th percentile
15 µg/m3
Annual average
65 µg/m3
98th percentile
15 µg/m3
Annual average
PM2.5
(Fine Particles)
24-hourAnnual24-hourAnnual
2006 Standards
September 21, 2006
1997 Standards
July 17, 1997

20
Wisconsin has several monitoring sites, Green Bay, Milwaukee and Madison, that have measured violations of the new 24-hour PM2.5 standard base on 2005 through 2007 monitoring data. Based on this information and additional monitoring data EPA has designated three nonattainment counties in Wisconsin: Milwaukee, Racine and Waukesha Counties. Wisconsin is currently working on a comprehensive plan with Illinois, Indiana, Michigan and Ohio to address ozone, PM2.5 and haze problems. DNR’s analysis indicates that the problem is regional in nature and the most effective way to deal with the problem is to limit emissions of SO2 and NOx on a regional basis. NOx comes from combustion in cars, trucks, off-road equipment, power plants and industrial sources. SO2 comes primarily from coal combustion in power plants and industrial boilers.
Up-to-date monitoring data and monitor address information is available from the DNR web site at http://dnrmaps.wi.gov/wisards under the “Reports” and “Find Location” tabs. Section 110 CAA requires the state to develop State Implementation Plans (SIPs) which identify how the state will attain and maintain national ambient air quality standards (NAAQS) and meet other Federal air quality regulations. Section 112 identifies 188 hazardous air pollutants; the EPA has focused their attention on 33 of the 188 pollutants at this time. Five of these are emitted from biomass burning: Acetaldehyde, Acrolein, 1,3 Butadiene, Formaldehyde, and Polycyclic organic matter. While this section focuses control requirements on major and minor stationary air pollution sources, the State and EPA are trying to determine the risk to the public from all air toxic emission sources including biomass burning. Sections 160-169 provide for the prevention of significant deterioration of air quality in those areas of the county which currently have air quality concentrations which are better than the standards set under Section109. Section 169A provides visibility protection for the mandatory Federal Class I areas There are no Class I areas in Wisconsin where visibility is an air quality related value. However, Wisconsin must submit a plan to limit the effects of our sources on visibility on any Class I area. The closest Class I areas are in Michigan and Minnesota; i.e.. Seney National Wildlife Refuge and Isle Royale National Park in Michigan, and Voyageurs National Park and Boundary Waters Canoe Area Wilderness in Minnesota. Section 176 (c) prohibits Federal Agencies from permitting, approving, providing financial assistance, or supporting in any way an activity which does not conform to an EPA approved State Implementation Plan. This section of the Act only applies to federal agencies. However, a federal agency’s prescribed burn emissions are presumed to conform to these plans provided the burn is conducted under certified Smoke Management Best Management Practices (SMBMP), and thus no determination is required. Section 319 directs EPA to promulgate regulations governing the review and handling of air quality monitoring data influenced by an exceptional event. These regulations were designed to codify a number of existing EPA policies into a rule. That rule was published on March 22, 2007. The Rule provides that if exceptional events cause violations of the NAAQS, EPA would use its discretion not to re-designate an area as non-attainment. One of those policies included in the Rule was the 1998 EPA Interim Air Quality Policy on Wildland and Prescribed Fire. The policy integrated two public policy goals: (1) to allow fire to function as

21
nearly as possible in its natural role in maintaining healthy wildland ecosystems, and (2) to protect public health and welfare by mitigating the impacts of air pollution emissions on air quality and visibility. The document identified significant procedural and legal benefits for the States and the users of wildland fire if they develop smoke management programs that are State certified. A State Smoke Management Program would establish a standard framework of those related procedures and requirements for managing smoke from prescribed fires. As a result of the new Exceptional Events Rule, EPA has committed to revise the Interim Policy, which will be forthcoming. The Rule defines an exceptional event as an event that:
Affects air quality Is not reasonably controllable or preventable Is an event caused by human activity that is unlikely to reoccur at a particular location Is a natural event
Examples of Exceptional Events are:
Chemical Spills and Industrial Accidents Structural Fires Exceedances due to Transported Pollution Exceedances due to a Terrorist Attack Natural Events:
Volcanic & Seismic Activities Natural Disasters & Associated Clean-up Activities High Wind Events Wildfires Stratospheric Ozone Intrusions
The rule states that wildfires will be treated as natural events. Prescribed fires managed for resources benefits may qualify for exceptional events if they meet certain criteria:
“Unlikely to recur at the same location” and “not reasonably controllable or preventable” Where State certifies that a smoke management program or basic smoke management practices, were in place
EPA’s handling of data from all other fires will continue to be addressed under the Interim Air Quality Policy for Wildland and Prescribed Fires.
Agency Authority The Wisconsin Department of Natural Resources (WDNR) has the authority to implement and enforce Federal regulations related to air quality standards. The WDNR maintains the air monitor system throughout the state. If an air monitor in the state records a violation of the NAAQS, then the area in violation of the standard is designated as “non-attainment” area. As required by Section 110 of the CAA, the state must submit a SIP to the EPA identifying what measures the state will take to reduce emissions affecting the area in order to meet and maintain compliance with the standard. Each plan shall include “enforceable emission limitation and other control measures” as required by Section 110. This would apply to facilities and sources that contribute to the violation of the standard. Construction and modification of stationary sources within non-attainment areas would be subject to emission offset regulations which require any new emissions to obtain emission offsets from existing air pollution sources. This requirement is designed to result in a net emission decrease to help bring the area back into attainment. By implementing the requirements of a SIP that has EPA approval, the WDNR enforces compliance with air quality standards within the State of Wisconsin. Regulatory instruments that may be

22
included in a SIP in order to return an area to compliance with an air quality standard, include statutes, rules, orders, or permit conditions. If any of these become part of a federally approved WI SIP, the measure would become both State and Federal enforceable Wisconsin is currently working to develop a Regional Haze SIP and PM2.5 SIP as a member of the Midwest Regional Planning Organization (RPO) which includes Michigan, Ohio, Indiana, and Illinois. The projects underway by the Midwest RPO include visibility monitoring, data analysis, photochemical modeling, and engineering analysis of selected large PM2.5 emitters in the region.

23
Appendix B
Managing Prescribed Fire in Wisconsin
Basis for Developing Smoke Management Best Management Practices (SMBMP) The purposes of the SMBMP are directly related to the mitigation of any public health, nuisance and safety hazards posed by smoke intrusions into populated areas and roadways. The goals are to prevent deterioration of air quality and National Ambient Air Quality Standards (NAAQS) violations, and address visibility impacts on mandatory Class 1 Federal areas. The NAAQS referred to here are for particulate matter (PM) less than 2.5 microns (PM2.5) and PM less than 10 microns (PM10) in diameter. The reasons SMBMP are being developed for Wisconsin are: 1. There has been an increase in the use of prescribed fire in Wisconsin. Table A1 identifies a trend of increased use of prescribed fire in Wisconsin. This follows a nationwide trend identified by federal and state land managers. This increase of prescribed fire has strong ecosystem and landscape management implications to increase biodiversity and productivity. 2. To utilize a voluntary program to prevent PM NAAQS violations related to emissions from prescribed fire managed for resource benefits. Implementation of SMBMP by land management agencies, organizations and the private sector should reduce potential emissions and smoke impacts from prescribed fires so that emissions do not result in “non-attainment” status with NAAQS and state air quality standards. The EPA Interim Guidance document explains that states which implement a certified SMP and do violate the PM10 or PM2.5 standards will not have areas designed as “non-attainment”, if the State demonstrates that prescribed and/or wildland fire significantly contributed to the concentration of pollutants that exceeded the standards. This incentive by the EPA for implementation of a Smoke Management Plan is important if an area of the state were to violate the air quality standards due to smoke produced by prescribed burning. The EPA Exceptional Events Rule published on March 22, 2007 states that all wildfires will be considered as natural events and will not be counted in determining an areas attainment or non-attainment status. The impact of prescribed fires may be discounted if the burn was conducted under a certified Smoke Management Plan or the burner was using basic smoke management practices (as defined by the applicable air quality regulatory agency). 3. The EPA Regional Haze Rule to protect and improve visibility in mandatory Class I areas the Lake States. Section 169A of the Clean Air Act Amendments (CAAA) of 1977 sets forth “the national goal of preventing any future, and remedying any existing, impairment of visibility in mandatory Class I Federal areas which impairment results from man-made air pollution.” The EPA rules issued in 1980 included language directed at those sources “reasonably attributable” to visibility impairment. With the addition of section 169B of the CAAA of 1990, congress addressed “regional haze” visibility impairment in the nation’s national parks and wilderness areas. The EPA determined that all 156 listed mandatory Class I areas across the nation demonstrate impaired visibility based on monitoring data from the Interagency Monitoring of Protected Visual Environments (IMPROVE). This includes the Class 1 areas of Seney National Wildlife Refuge and Isle Royale National Park in Michigan, and Voyageurs National Park and Boundary Waters Canoe Area Wilderness in Minnesota. For the Class

24
I areas, in Minnesota and Michigan, smoke from Wisconsin prescribed fires have not been shown to be a significant contributor to visibility impairment. EPA published their final Regional Haze Rule on July 1, 1999 (64FR35714). This rule is directed at man-made air pollution sources that have the potential to cause or contribute to visibility impairment including: 1) stationary sources (industry), 2) mobile sources (vehicles), 3) area sources (gas stations, dry cleaners, etc.), and 4) the use of managed fire. Of the pollutants most responsible for haze (nitrates, sulfates, soil material, organic carbon, and elemental carbon), nitrates, organic carbon and elemental carbon are produced by vegetative burning. The regional haze program goal is to show continued improvement in monitored visibility in Class 1 areas and restore natural background conditions by 2064. Other factors that do not apply to Wisconsin at this time but are “strong indications” that a smoke management plan is necessary are listed in the EPA “Interim Air Quality Policy on Wildland and Prescribed Fires” issued April 1998. These include any of the following if they result from fire use: 1. Citizens increasingly complain of smoke intrusions. 2. The trend of monitored air quality values is increasing (approaching the daily or annual NAAQS for PM2.5 or PM10) because of significant contributions from fires managed for resource benefits. 3. Fires cause or significantly contribute to monitored air quality that is already greater than 85 percent of the daily or annual NAAQS for PM2.5 or PM10. 4. Fires in the area significantly contribute to visibility impairment in mandatory Class I Federal areas.

25
Appendix C
Smoke Production and Dispersion Overview and Definition of Smoke Dispersion Information pertaining to smoke dispersion is an important element of these SMBMP. Smoke dispersion is directly related to ventilation, which is the process within the atmosphere that mixes and transports smoke away from its source. Ventilation is a function of atmospheric stability, mixing height and transport winds. Mixing height is defined as the upper limit of an unstable mixed layer, in which upward and downward exchange of air occurs. In theory, the mixing height represents the level that smoke will rise to before spreading out horizontally. Transport wind is defined as the arithmetic average of the wind speed and direction within the mixed layer. Transport wind should provide a basic estimate of the movement of the smoke column as it advects out of the source region. Just as various indices are used to estimate fire behavior, a ventilation index has been developed to estimate the lower atmosphere’s ability to diffuse and disperse smoke. The Ventilation Index (also known as the Dispersion Index) is calculated by multiplying the mixing height (feet) by the transport wind (knots). A high Ventilation Index usually means that smoke will disperse in an efficient manner. A low Ventilation Index usually means that the dispersion of smoke in the lower atmosphere will be hindered. Caution should be used when interpreting the Ventilation Index, as the values can sometimes be misleading. For instance, a high Ventilation Index can be produced with either a high transport wind and low mixing height or a low transport wind and high mixing height. In both of these situations, smoke dispersion may still be hindered.
Table C1
Ventilation Index Dispersion Category 0 – 12,999 Poor
13,000-29,999 Fair 30,000 – 60,000 Good 60,000 or greater Excellent
Smoke dispersion information is available on the Fire Weather Planning Forecast (FWF), which is issued twice daily during the fire season at 7 am and 3 pm. Average mixing height and transport wind for the noon to 6 pm period are provided for the daytime periods (through day 2) in the Fire Weather Planning Forecast. The Ventilation Index, which is labeled as smoke dispersal in the FWF, is also averaged between noon and 6 pm, and is provided for the daytime periods of the forecast through day 2. Average values are used in order to provide a more representative estimate for prescribed burn projects, which may be started at varying times of the day (depending on the agency, type and size of the project). Fire Weather Planning Forecasts are posted on all local National Weather Service (NWS) websites. Smoke dispersion forecasts are also available as part of a spot forecast request. Climate Factors that Influence Smoke Dispersion in Wisconsin Wisconsin resides in the humid continental climate region, due to its interior location in the mid-latitudes of North America. The state lies in the boundary zone between many different air masses, including those of polar and tropical origin. As a result, Wisconsin experiences highly variable weather conditions and large seasonal changes in temperature. Weather conditions are most variable during the spring and fall months, when the jet stream migrates across the Great Lakes, resulting in strong storm systems tracking through the region. Lake Superior and Lake Michigan strongly influence local weather conditions near their respective shorelines in northwest and eastern Wisconsin.

26
Here are some more detailed explanations of the various factors that influence smoke dispersion potential in Wisconsin: Air Masses and Frontal Systems are the main factors that influence day-to-day variations in smoke dispersion. There are five different types of air masses that affect the United States, including continental polar, continental arctic, continental tropical, maritime polar and maritime tropical. Wisconsin can be affected by all of these air masses during the course of a fire season, but is most commonly affected by continental polar, maritime polar and maritime tropical air masses. Continental polar air masses, which arrive from northern Canada, are usually cool, dry and stable, and sometimes result in low mixing heights and poor smoke dispersion due to the presence of a subsidence inversion. Maritime polar air masses form over the northern Pacific Ocean region, where they take on their typical cool, moist and unstable characteristics. However, these air masses usually lose most of their moisture as they ascend the west slopes of the Rocky Mountains, and warm as they descend the east slopes. By the time they arrive in Wisconsin, they are usually dry, mild and unstable. As a result, mixing heights are typically quite high in air masses of Pacific origin. Maritime tropical air masses, which originate from the Gulf of Mexico, are usually warm, moist and unstable. Frontal systems can also have a significant effect on smoke dispersion. Cold fronts are usually accompanied by windy and unstable conditions, which provide for excellent smoke dispersion. Conditions are quite variable with warm fronts, with stable conditions and poor smoke dispersion expected north of the front, and unstable and windy conditions to the south. Latitude, which controls the sun angle and length of the day, is responsible for seasonal temperature contrasts. Mid-latitude locations such as Wisconsin experience sharp changes in seasonal temperatures due to widely varying sun angle and day length. These temperature changes can significantly impact smoke dispersion. For example, mixing heights are typically lowest during the winter months, since daytime heating is limited due to low sun angle, short day length and snow covered ground. During the spring and summer, increased solar heating due to a high sun angle and longer day length is usually sufficient to mix out low level inversions, resulting in higher mixing heights and more effective smoke dispersion. Lake Superior and Lake Michigan have a significant impact on smoke dispersion, especially during the spring and summer months. Lake breezes, which frequently develop in northwest and eastern Wisconsin from April through August, often result in poor smoke dispersion near the lakeshore. Lake breezes typically form during the late morning or early afternoon, become strongest during the mid to late afternoon, then weaken by early evening. On most days, the lake breeze front will only push inland 5 to 10 miles, but in extreme cases, may move inland 50 miles or more. Stable conditions develop as the cooler marine air penetrates inland, forcing warmer air aloft. In addition to smoke dispersion concerns, shifting winds associated with a lake breeze front can occasionally cause fire control problems. Upper Level Disturbances, also known as upper level troughs of low pressure, often result in improved smoke dispersion as they pass through the western Great Lakes region. These disturbances, which are usually accompanied by pockets of cold air aloft, often produce windy and unstable conditions, and help to generate large scale rising motion in the atmosphere. Weather Patterns that Affect Smoke Dispersion in Wisconsin Wisconsin usually receives good ventilation throughout most of the fire season. During the months of April through October, solar radiation is usually strong enough to either mix out or lift inversions

27
that are near the surface. However, there are some typical seasonal weather patterns that cause smoke dispersion problems.
During the early spring and late fall, strong Canadian high pressure systems often sag into the northern Great Lakes region and persist for several days. These Canadian highs typically have strong subsidence inversions, which gradually lower toward the surface, leading to poor smoke dispersal. Ventilation is especially poor when widespread low clouds (stratus) are present. The low clouds typically form in two ways; either due to low level east winds advecting marine moisture off of Lake Michigan, or due to the presence of a warm front over Iowa and northern Illinois, which lifts warm, moist air from the Gulf of Mexico over the top of the cooler Canadian air mass. The poor smoke dispersal is the net result of low mixing heights (generally 1,000-2,000 feet) and light winds.
Persistent (lasting up to a week or more) summertime high pressure systems accompanied by a large blocking ridge of high pressure aloft can produce significant smoke dispersion problems. Although daytime mixing heights are often sufficiently high, transport winds are typically too light to support efficient smoke dispersion. The stagnant conditions eventually lead to reduced visibility and poor air quality, especially during the nighttime and early morning hours, when smoke particles aloft fall back to the surface.
Radiation inversions (also known as nocturnal inversions), which develop as the earth’s surface cools at night, can trap smoke near the ground during the nighttime and morning hours. Radiation inversions can occur throughout the year, and typically form on nights when skies are clear and winds are light. Summertime radiation inversions tend to be shallower, and usually mix out earlier in the morning, than those that develop during the spring and fall.
Inland intrusions of cool, stable marine air associated with lake breeze fronts (or persistent onshore winds) can significantly hinder smoke dispersion during the spring and summer months. Lake breeze fronts are most common on days when winds at the surface and aloft are light. Lake breezes that develop near Lake Superior in northwest Wisconsin typically have a northerly component to their wind direction, while those that develop near Lake Michigan (and the bay of Green Bay) have an easterly component. Although a lake breeze front will typically remain within 5 to 10 miles of the lake during the early to mid afternoon, they can occasionally penetrate well inland (50 miles or more) before weakening during the late afternoon or early evening hours.

28
Appendix D Guidance for Use of the Ventilation Index and Dispersion Tables
The Ventilation Index (also known as the Dispersion Index) is calculated by multiplying the mixing height (feet) by the transport wind (knots). A high Ventilation Index usually means that smoke will disperse in an efficient manner. A low Ventilation Index usually means that the dispersion of smoke in the lower atmosphere will be hindered.
Table D1
Ventilation Index Dispersion Category 0 – 12,999 Poor
13,000-29,999 Fair 30,000 – 60,000 Good 60,000 or greater Excellent
Note: In using the ventilation index, exercise caution with high transport wind speed and low mixing height or low transport wind and high mixing height. Either combination may result in a false representation of an acceptable category, which can result in smoke dispersion problems and potential control problems. When utilizing the ventilation index it is important to consider the total fuel load being burned, both in terms of the fuel loading (tons of fuel per acre) and the total area to be treated. The proximity of downwind smoke sensitive areas to the burn unit should also be considered, so that in general the lower the expected total fuel consumption and the farther away from smoke sensitive receptors, the lower the ventilation index can be. Additionally, practices that reduce the total fuel load available for consumption can lower the acceptable dispersion category either by reduction of fuel, or acres to be treated. Two methods that can be utilized for mitigation of smoke impacts during the burn planning process are as follows: Method A: This method may be used as a general guide to use the Ventilation Index in combination with a smoke screening map to screen for sensitive downwind receptors. It is recommended for those burn units with low to moderate potential for smoke impacts. 1. From the Daily Burn Unit Size chart (Table D2) select the size of the planned burn unit* in acres. 2. Determine the general fuel category which best represents the majority of the burn unit. 3. On a map of the area locate the sensitive downwind receptors that could be impacted by smoke produced by the burn unit. 4. Use the Dispersion Category charts (Table D3) and determine the minimum distance which a burn should take place upwind of a sensitive receptor on a certain Dispersion Category day. Note: These are voluntary guidelines which may vary based on the local unit’s definition of smoke sensitive receptor and the ability to mitigate potential smoke problems by instituting traffic controls when smoke could impact major roads or by burning under fuel moisture conditions which limit consumption of heavier fuels.
Note: Use of these charts assumes no more than one burn unit within a 5 mile radius.

29
DAILY BURN UNIT SIZES – Table D2 Small <50 acres
Medium 50 – 150 acres Large 150-500 acres
Landscape 500 + acres Distances to Smoke Sensitive Areas (from MN SMP)– Table D3
General Fuel Category
Daily Fire size
(acres)*
Dispersion Index Category
Minimum dist. to downwind smoke
sensitive areas (miles)
NA POOR 0.25 Single large pile or Scattered small piled fuels NA FAIR or BETTER No limitation
< 50 POOR 0.25 < 50 FAIR or BETTER No limitation 50 - 150 POOR No burning 50 - 150 FAIR or BETTER No limitation 150 - 500 POOR No burning 150 - 500 FAIR 0.25 150 - 500 GOOD or BETTER No limitation 500+ POOR No burning 500+ FAIR 0.75 500+ GOOD 0.50
Grass or Leaf litter
500+ EXCELLENT 0.25
< 50 POOR No burning (See above exception for pile(s))
< 50 FAIR 0.50 < 50 GOOD or BETTER No limitation 50 -150 POOR No burning 50 - 150 FAIR 0.50 50 - 150 GOOD or BETTER No limitation 150 - 500 POOR No burning 150 - 500 FAIR 0.75 150 - 500 GOOD 0.50 150 - 500 EXCELLENT 0.25 500+ POOR No burning 500+ FAIR 1.0 500+ GOOD 0.75
Timber, slash, or piled fuels
500+ EXCELLENT 0.50

30
Note: On Poor Category days no burning is suggested within ¼ mile of any downwind smoke sensitive area and is not recommended in general.
As an example, for a 500 acre burn in grass fuels, a minimum distance that a burn should occur upwind of a sensitive receptor would be: greater than 0.25 miles with Excellent Dispersion, greater than 0.5 mile with Good Dispersion, greater than 0.75 miles with Fair Dispersion and there should be no burn under Poor Dispersion. Method B: Recommended for Complex Prescribed Burns where there is a high potential for smoke impacts.
1. Estimate the fuel loading for the area to be burned. This may be done formally, utilizing site-
specific survey data if available or by consulting the fuel model information found in: Aids in Determining Fuel Models for Estimating Fire Behavior, or Standard Fire Behavior: A Comprehensive Set for Use with Rothermel’s Surface Spread Model or the digital photo series at http://depts.washington.edu/nwfire/dps/.
2. Determine the acreage to be burned in one day. 3. Estimate the expected fuel consumption using hand calculations or computer models such as
FOFEM or CONSUME. Selection of higher fuel moistures (such as higher 100 and 1,000 hour fuel moisture), which should reduce the fuel available for consumption, should be factored into the calculations.
4. Determine the total PM10 and PM2.5 emissions per day based on outputs from #3. 5. Locate downwind sensitive receptors that could be impacted from your smoke. 6. Utilize a dispersion computer program to screen for the potential to exceed ambient air quality
standards. Mapping guidance to identify the closet smoke sensitive target and distance from the prescribed fire.
1. Locate on a map the prescribed fire and all potential smoke sensitive targets, plus areas known to already have air pollution problems.
2. Determine the wind direction that should have the least impact on smoke sensitive targets.
3. Draw a line representing the centerline of the path of the smoke plume using the wind direction chosen in the previous step.
4. Determine the distance from the edge of the prescribed fire to the nearest smoke-sensitive target.
5. To allow for horizontal dispersion of the smoke, as well as shifts in wind direction, draw two other lines from the burn at an angle of 30 degrees from the centerline.

31
Figure D1 Smoke Plotter (NWCG RX 410)