*Draft* New Mexico State Implementation Plan Regional Haze ... · *Draft* New Mexico State...
190
*Draft* New Mexico State Implementation Plan Regional Haze Section 308 New Mexico Environment Department Air Quality Bureau June 21, 2010
Transcript of *Draft* New Mexico State Implementation Plan Regional Haze ... · *Draft* New Mexico State...
*Draft*
New Mexico State Implementation Plan
Regional Haze Section 308
New Mexico Environment Department Air Quality Bureau
June 21, 2010

New Mexico Section 308 Regional Haze SIP ii
TABLE OF CONTENTS CHAPTER 1: INTRODUCTION.......................................................................................................... 1
1.1 Overview of Visibility and Regional Haze.................................................................................. 1 1.2 New Mexico Class I Areas .......................................................................................................... 2 1.3 Summary of the Regional Haze Rule .......................................................................................... 4 1.4 Background on the Regional Haze Rule...................................................................................... 4
1.4.1 The 1977 Clean Air Act Amendments .................................................................................... 4 1.4.2 Phase I Visibility Rules – The New Mexico Visibility Protection Plan.................................. 5 1.4.3 The 1990 Clean Air Act Amendments .................................................................................... 5 1.4.4 Submittal of the New Mexico 309 SIP.................................................................................... 7
1.5 Purpose of this Document............................................................................................................ 7 1.5.1 Basic Plan Elements ................................................................................................................ 7
CHAPTER 2: NEW MEXICO REGIONAL HAZE SIP DEVELOPMENT PROCESS.................... 11 2.1 Federal Land Manager Consultation ......................................................................................... 11 2.2 State Consultation...................................................................................................................... 12 2.3 Tribal Consultation .................................................................................................................... 14 2.4 Public and Stakeholder Outreach .............................................................................................. 14
CHAPTER 3: NEW MEXICO CLASS I AREAS .............................................................................. 15 3.1 Bandelier Wilderness Area........................................................................................................ 15 3.2 Bosque del Apache National Wildlife Refuge........................................................................... 15 3.3 Carlsbad Caverns National Park................................................................................................ 16 3.4 Gila Wilderness ......................................................................................................................... 17 3.5 Pecos Wilderness....................................................................................................................... 18 3.6 Salt Creek Wilderness ............................................................................................................... 19 3.7 San Pedro Parks Wilderness ...................................................................................................... 20 3.8 Wheeler Peak Wilderness.......................................................................................................... 21 3.9 White Mountain Wilderness...................................................................................................... 22
CHAPTER 4: REGIONAL HAZE MONITORING NETWORK ...................................................... 24 4.1 Overview of IMPROVE Network ............................................................................................. 24 4.2 New Mexico IMPROVE Monitoring Network ......................................................................... 26
4.2.1 Bandelier Wilderness ............................................................................................................ 27 4.2.2 Bosque del Apache National Wildlife Refuge ...................................................................... 28 4.2.3 Carlsbad Caverns National Park ........................................................................................... 28 4.2.4 Gila Wilderness ..................................................................................................................... 30 4.2.5 Pecos Wilderness .................................................................................................................. 30 4.2.6 Salt Creek Wilderness ........................................................................................................... 31 4.2.7 San Pedro Parks Wilderness.................................................................................................. 32 4.2.8 Wheeler Peak Wilderness...................................................................................................... 33 4.2.9 White Mountain Wilderness.................................................................................................. 34
4.3 New Mexico Regional Haze Monitoring Commitments ........................................................... 35 CHAPTER 5: TECHNICAL INFORMATION AND DATA............................................................. 37
5.1 WRAP and Technical Support .................................................................................................. 37 5.1.1 WRAP Committees and Workgroups ................................................................................... 37 5.1.2 WRAP Technical Support System ....................................................................................... 39
CHAPTER 6: NEW MEXICO CLASS ONE AREA BASELINE, NATURAL CONDITIONS, AND UNIFORM RATE OF PROGRESS ........................................................................................................... 40
6.1 Baseline and Current Visibility Conditions............................................................................... 40 6.3 Monitoring Data ........................................................................................................................ 41 6.4 Natural Visibility Conditions..................................................................................................... 41 6.5 Uniform Progress....................................................................................................................... 42

New Mexico Section 308 Regional Haze SIP iii
CHAPTER 7: VISIBILITY IMPAIRMENT AT NEW MEXICO CLASS I AREAS ........................ 44 7.1 Bandelier Wilderness................................................................................................................. 45 7.2 Bosque del Apache National Wildlife Refuge........................................................................... 47 7.3 Carlsbad Caverns National Park................................................................................................ 48 7.4 Gila Wilderness ......................................................................................................................... 50 7.5 Pecos Wilderness, Wheeler Peak Wilderness............................................................................ 51 7.6 Salt Creek Wilderness ............................................................................................................... 53 7.7 San Pedro Parks Wilderness ...................................................................................................... 54 7.8 White Mountain Wilderness...................................................................................................... 56
CHAPTER 8: SOURCES OF VISIBILITY IMPAIRMENT.............................................................. 58 8.1 Anthropogenic Sources.............................................................................................................. 58 8.2 Natural Sources ......................................................................................................................... 58 8.3 Overview of Emission Inventory System – WRAP Technical Support System ....................... 58 8.4 New Mexico Emissions Data .................................................................................................... 59
CHAPTER 9: VISIBILITY MODELING AND SOURCE APPORTIONMENT.............................. 64 9.1 Modeling Overview................................................................................................................... 64 9.2 Summary of Modeling Results for CMAQ ............................................................................... 66
9.2.1 CMAQ Modeling by Pollutant.............................................................................................. 66 9.3 Summary of PSAT Modeling Results ....................................................................................... 74
9.3.1 Bandelier Wilderness ............................................................................................................ 75 9.3.2 Bosque del Apache National Wildlife Refuge ...................................................................... 77 9.3.3 Carlsbad Caverns National Park ........................................................................................... 79 9.3.4 Gila Wilderness ..................................................................................................................... 81 9.3.5 Pecos Wilderness, Wheeler Peak Wilderness ....................................................................... 83 9.3.6 Salt Creek Wilderness ........................................................................................................... 85 9.3.7 San Pedro Parks Wilderness.................................................................................................. 87 9.3.8 White Mountain Wilderness.................................................................................................. 89
9.4 Summary of WEP Results ......................................................................................................... 91 9.4.1 Bandelier Wilderness ............................................................................................................ 91 9.4.2 Bosque del Apache National Wildlife Refuge ...................................................................... 95 9.4.3 Carlsbad Caverns National Park ........................................................................................... 98 9.4.4 Gila Wilderness ................................................................................................................... 102 9.4.5 Pecos Wilderness, Wheeler Peak Wilderness ..................................................................... 105 9.4.6 Salt Creek Wilderness ......................................................................................................... 108 9.4.7 San Pedro Parks Wilderness................................................................................................ 112 9.4.8 White Mountain Wilderness................................................................................................ 115
CHAPTER 10: BEST AVAILABLE RETROFIT TECHNOLOGY (BART) EVALUATION......... 119 10.1 Introduction ............................................................................................................................. 119 10.2 SO2: Regional SO2 Milestone and Backstop Trading Program............................................... 119 10.3 Summary of BART Modeling Results (Visibility Impact Analysis)....................................... 120
10.3.1 New Mexico Process ...................................................................................................... 120 10.3.2 Subject-to-BART Determination .................................................................................... 125 10.3.3 Determining BART......................................................................................................... 125
Step 1 – Identify All Available Retrofit Control Technologies ................................................................ 125 Step 4 – Evaluate Impacts and Document the Results .............................................................................. 125
10.4 Summary of BART Control Analysis for PNM San Juan....................................................... 126 10.5 Visibility Improvement Resulting from BART Evaluation in New Mexico.......................... 127
CHAPTER 11: REASONABLE PROGRESS GOAL DEMONSTRATION ..................................... 128 11.1 Reasonable Progress Requirements......................................................................................... 128 11.2 Four Factor Analysis Performed for New Mexico Sources..................................................... 129
11.2.1 Detailed Description of the Four Factors........................................................................ 130

New Mexico Section 308 Regional Haze SIP iv
11.2.2 Source Selection Process for Four Factor Analysis ........................................................ 130 11.2.3 Four Factor Analyses for New Mexico........................................................................... 131
11.3 Setting Reasonable Progress Goals ......................................................................................... 138 11.3.1 Bandelier Wilderness Area ............................................................................................. 139 11.3.2 Bosque del Apache National Wildlife Refuge................................................................ 139 11.3.3 Carlsbad Caverns National Park ..................................................................................... 140 11.3.4 Gila Wilderness............................................................................................................... 141 11.3.5 Pecos / Wheeler Peak Wilderness Areas ........................................................................ 142 11.3.6 Salt Creek Wilderness Area ............................................................................................ 143 11.3.7 San Pedro Parks Wilderness Area................................................................................... 144 11.3.8 White Mountain Wilderness Area .................................................................................. 145
11.4 Conclusions for State-Wide Reasonable Progress................................................................... 146 CHAPTER 12: LONG-TERM STRATEGY (LTS) ............................................................................ 149
12.1 Overview ................................................................................................................................. 149 12.2 Other States’ Class I Areas Affected by New Mexico Emissions........................................... 149
12.2.1 Nitrate Contributions from New Mexico on Surrounding States' Class I Areas............. 149 12.2.2 Sulfate Contributions from New Mexico on Surrounding State's Class I Areas ............ 153
12.3 New Mexico Class I Areas Affected by Other States, Nations and Areas of the World......... 157 12.3.1 Nitrate Emissions............................................................................................................ 157 12.3.2 Sulfate Emissions............................................................................................................ 158
12.4 Summary of Interstate Consultation ........................................................................................ 159 12.5 Estimated Contributions from CENRAP and Eastern U.S. ..................................................... 159 12.6 Estimated International Contribution to New Mexico's Class I Areas .................................... 159 12.7 Required Factors for the Long-Term Strategy......................................................................... 160
12.7.1 Emission Reductions Due to Ongoing Air Pollution Control Programs......................... 160 12.7.2 New Source Review Program......................................................................................... 160 12.7.3 Prevention of Significant Deterioration (PSD) Program ................................................ 160 12.7.4 Minor Source BACT Program........................................................................................ 161 12.7.5 Title V Operating Permit Program.................................................................................. 161 12.7.6 New Source Performance Standards (NSPS).................................................................. 161 12.7.7 National Emission Standards for Hazardous Air Pollutants ........................................... 162 12.7.8 New Mexico Reasonably Attributable Visibility Impairment Rules .............................. 162 12.7.9 Ongoing Implementation of Federal Mobile Source Regulations .................................. 162 12.7.10 Ongoing Implementation of State Mobile Source Regulations ...................................... 163 12.7.11 Ongoing Implementation of Programs to Meet PM10 NAAQS ...................................... 163 12.7.12 Measures to Mitigate the Impacts of Construction Activities......................................... 164 12.7.13 Emission Limitations and Schedules of Compliance...................................................... 164 12.7.14 Source Retirement and Replacement Schedules............................................................. 165 12.7.15 Agricultural and Forestry Smoke Management Techniques........................................... 165 12.7.16 Enforceability of New Mexico’s Measures .................................................................... 166
12.8 Additional Measures in the Long-Term Strategy .................................................................... 166 12.8.1 Future Federal Mobile Programs .................................................................................... 166 12.8.2 Efforts to Address Offshore Shipping............................................................................. 167 12.8.3 Long-Term Control Strategies for BART Facilities ....................................................... 168 12.8.4 Evaluation of Control Strategies for Sources Identified in the Reasonable Progress - Four-Factor Analysis ................................................................................................................................. 168 12.8.5 Oil and Gas ..................................................................................................................... 168
12.9 Projection of the Net Effect on Visibility ................................................................................ 169 CHAPTER 13: OTHER SIP REQUIREMENTS AND COMMITMENTS........................................ 179
13.1 Enforceability of Emission Limitations and Control Measures............................................... 179 13.2 Commitment to Future 308 SIP Revisions .............................................................................. 179
New Mexico Section 308 Regional Haze SIP v
13.3 Commitment to Periodic Progress Reports.............................................................................. 180 13.4 Determination of Plan Adequacy ............................................................................................ 180
APPENDICES AND TECHNICAL SUPPORT DOCUMENTATION................................................... 181
LIST OF TABLES Table 1-1: New Mexico Class I Areas .......................................................................................................... 3 Table 4-1: IMPROVE Monitors in New Mexico........................................................................................ 26 Table 6-1: Baseline Conditions for 20% Worst Days................................................................................. 40 Table 6-2: Baseline Conditions for 20% Best Days ................................................................................... 41 Table 6-3: 2064 Natural Conditions Goal for 20% Worst Days................................................................. 42 Table 6-4: Summary of Best and Worst Visibility Days for New Mexico Class I Areas........................... 43 Table 7-1: IMPROVE Monitor Aerosol Composition................................................................................ 44 Table 8-1: New Mexico SO2 Emission Inventory – 2002 & 2018.............................................................. 60 Table 8-2: New Mexico NOX Emission Inventory – 2002 & 2018 ............................................................ 60 Table 8-3: New Mexico VOC Emission Inventory – 2002 & 2018 ........................................................... 61 Table 8-4: New Mexico Primary Organic Aerosol (POA) Emission Inventory – 2002 & 2018 ................ 61 Table 8-5: New Mexico Elemental Carbon (EC) Emission Inventory – 2002 & 2018 .............................. 62 Table 8-6: New Mexico Soil (PM Fine/PM2.5) Emission Inventory – 2002 & 2018.................................. 62 Table 8-7: New Mexico Coarse Mass (PM Coarse) Emission Inventory – 2002 & 2018.......................... 62 Table 8-8: New Mexico Ammonia (NH3) Emission Inventory – 2002 & 2018 ......................................... 63 Table 9-1: Summary of CMAQ Modeling Progress Towards 2018 ........................................................... 66 Table 9-2: Pollutant Breakdown on 20% Worst Days for Bandelier Wilderness ....................................... 67 Table 9-3: Pollutant Breakdown on 20% Worst Days for Bosque del Apache NWR ................................ 68 Table 9-4: Pollutant Breakdown on 20% Worst Days for Carlsbad Caverns NP ....................................... 69 Table 9-5: Pollutant Breakdown on 20% Worst Days for Gila Wilderness................................................ 70 Table 9-6: Pollutant Breakdown on 20% Worst Days for Pecos Wilderness, Wheeler Peak Wilderness .. 71 Table 9-7: Pollutant Breakdown on 20% Worst Days for Salt Creek Wilderness...................................... 72 Table 9-8: Pollutant Breakdown on 20% Worst Days for San Pedro Parks Wilderness ............................ 73 Table 9-9: Pollutant Breakdown on 20% Worst Days for White Mountain Wilderness ............................ 74 Table 10-1 Regional Sulfur Dioxide Emissions and Milestone Report Summary ................................... 120 Table 10-2: Visibility Impact Analysis of PNM's San Juan Generating Station ...................................... 122 Table 11-1: 20% Best and Worst Days Baseline, Natural Conditions, and Uniform Rate of Progress Goal for New Mexico Class I Areas.................................................................................................................. 129 Table 11-2: Estimated Costs of Potential Emission Control Devices for FCCU #1 at Navajo Refining Co., Artesia Refinery ........................................................................................................................................ 132 Table 11-3: Estimated Energy and Non-Air Environmental Impacts of Potential Emission Control Devices for FCCU #1 at Navajo Refining Co........................................................................................... 133 Table 11-4: Estimated Costs of Potential Emission Control Devices for FCCU at Western Refining Southwest, Bloomfield Refinery............................................................................................................... 134 Table 11-5: Estimated Energy and Non-Air Environmental Impacts of Potential Emission Control Devices for FCCU #1 at Western Refining Southwest, Bloomfield Refinery.......................................... 135 Table 11-6: Estimated Costs of Potential Emission Control Devices for CO Boiler at Western Refining Southwest, Gallup Refinery ...................................................................................................................... 137 Table 11-7: Estimated Energy and Non-Air Environmental Impacts of Potential Emission Control Devices for CO Boiler at Western Refining Southwest, Gallup Refinery ................................................ 137 Table 11-8: Reasonable Progress Goals for 20% Worst Days and 20% Best Days for New Mexico Class I Areas ......................................................................................................................................................... 138 Table 12-1: Nitrate Contribution to Haze in Baseline Years for Worst 20% Days .................................. 150 Table 12-2: Sulfate Contribution to Haze in Baseline Years for Worst 20% Days .................................. 153

New Mexico Section 308 Regional Haze SIP vi
Table 12-3: Nitrate Contribution to New Mexico Haze in Baseline Years for 20% Worst Days............. 157 Table 12-4: WRAP Nitrate Contribution to New Mexico Haze Baseline Years for Worst 20% Days .... 158 Table 12-5: Sulfate Contribution to New Mexico Haze in Baseline Years for Worst 20% Days ............ 158 Table 12-6: WRAP Sulfate Contribution to New Mexico Haze Baseline Years for Worst 20% Days .... 159 Table 12-7: Class I Area Visibility Summary for BAND1 on 20% Worst Days...................................... 171 Table 12-8: Class I Area Visibility Summary for BOAP1 on 20% Worst Days ...................................... 172 Table 12-9: Class I Area Visibility Summary for GUMO1 on 20% Worst Days..................................... 173 Table 12-10: Class I Area Visibility Summary for GILA1 on 20% Worst Days ..................................... 174 Table 12-11: Class I Area Visibility Summary for SACR1 on 20% Worst Days .................................... 175 Table 12-12: Class I Area Visibility Summary for SAPE1 on 20% Worst Days ..................................... 176 Table 12-13: Class I Area Visibility Summary for WHIT1 on 20% Worst Days .................................... 177 Table 12-14: Class I Area Visibility Summary for WHPE1 on 20% Worst Days.................................... 178
LIST OF FIGURES Figure 1-1: Federal Class I Areas within the United States .......................................................................... 1 Figure 1-2: Class I Areas in the Western Region.......................................................................................... 2 Figure 1-3: Map of New Mexico Class I Areas ............................................................................................ 3 Figure 1-4: Illustration of Uniform Rate of Progress.................................................................................... 9 Figure 3-1: Bandelier Wilderness ............................................................................................................... 15 Figure 3-2: Bosque del Apache National Wildlife Refuge ......................................................................... 16 Figure 3-3: Carlsbad Caverns National Park .............................................................................................. 17 Figure 3-4: Gila Wilderness........................................................................................................................ 18 Figure 3-5: Pecos Wilderness ..................................................................................................................... 19 Figure 3-6: Salt Creek Wilderness .............................................................................................................. 20 Figure 3-7: San Pedro Parks Wilderness..................................................................................................... 21 Figure 3-8: Wheeler Peak Wilderness ........................................................................................................ 22 Figure 3-9: White Mountain Wilderness .................................................................................................... 23 Figure 4-1: IMPROVE Monitor at Salt Creek Wilderness ......................................................................... 24 Figure 4-2: Four Modules Used for Regional Haze Sampling ................................................................... 24 Figure 4-3: Map of New Mexico IMPROVE Sites..................................................................................... 27 Figure 4-4: Bandelier National Monument ................................................................................................. 27 Figure 4-5: Bosque del Apache National Wildlife Refuge ......................................................................... 28 Figure 4-6: Map of Carlsbad Caverns National Park.................................................................................. 29 Figure 4-7: Guadalupe Mountains National Park ....................................................................................... 29 Figure 4-8: Gila Wilderness........................................................................................................................ 30 Figure 4-9: Pecos Wilderness ..................................................................................................................... 31 Figure 4-10: Salt Creek Wilderness ............................................................................................................ 32 Figure 4-11: San Pedro Parks Wilderness................................................................................................... 33 Figure 4-12: Wheeler Peak Wilderness ...................................................................................................... 34 Figure 4-13: White Mountain Wilderness .................................................................................................. 35 Figure 7-1: Reconstructed Aerosol Components for 20% Worst Days (2000-2004) ................................. 44 Figure 7-2: Reconstructed Aerosol Components for 20% Best Days (2000-2004) .................................... 45 Figure 7-3: Average Species Contribution to 20% Best and Worst Days Baseline.................................... 45 Figure 7-4: Monthly Average Species Variation for All Sampled Days During the Baseline Period ........ 46 Figure 7-5: Baseline Worst Day Aerosol Composition Compared to 2018 URP, 2018 Projected Visibility and 2064 Natural Conditions Goal.............................................................................................................. 46 Figure 7-6: Average Species Contribution to 20% Best and Worst Days Baseline.................................... 47 Figure 7-7: Monthly Average Species Variation for All Sampled Days during the Baseline Period......... 47

New Mexico Section 308 Regional Haze SIP vii
Figure 7-8: Baseline Worst Day Aerosol Composition Compared to 2018 URP, 2018 Projected Visibility and 2064 Natural Conditions Goal.............................................................................................................. 48 Figure 7-9: Average Species Contribution to 20% Best and Worst Days Baseline.................................... 48 Figure 7-10: Monthly Average Species Variation for All Sampled Days during the Baseline Period ....... 49 Figure 7-11: Baseline Worst Day Aerosol Composition Compared to 2018 URP, 2018 Projected Visibility and 2064 Natural Conditions Goal ............................................................................................. 49 Figure 7-12: Average Species Contribution to 20% Best and Worst Days Baseline.................................. 50 Figure 7-13: Monthly Average Species Variation for All Sampled Days during the Baseline Period ....... 50 Figure 7-14: Baseline Worst Day Aerosol Composition Compared to 2018 URP, 2018 Projected Visibility and 2064 Natural Conditions Goal ............................................................................................. 51 Figure 7-15: Average Species Contribution to 20% Best and Worst Days Baseline.................................. 51 Figure 7-16: Monthly Average Species Variation for All Sampled Days during the Baseline Period ....... 52 Figure 7-17: Baseline Worst Day Aerosol Composition Compared to 2018 URP, 2018 Projected Visibility and 2064 Natural Conditions Goal ............................................................................................. 52 Figure 7-18: Average Species Contribution to 20% Best and Worst Days Baseline.................................. 53 Figure 7-19: Monthly Average Species Variation for All Sampled Days during the Baseline Period ....... 53 Figure 7-20: Baseline Worst Day Aerosol Composition Compared to 2018 URP, 2018 Projected Visibility and 2064 Natural Conditions Goal ............................................................................................. 54 Figure 7-21: Average Species Contribution to 20% Best and Worst Days Baseline.................................. 54 Figure 7-22: Monthly Average Species Variation for All Sampled Days during the Baseline Period ....... 55 Figure 7-23: Baseline Worst Day Aerosol Composition Compared to 2018 URP, 2018 Projected Visibility and 2064 Natural Conditions Goal ............................................................................................. 55 Figure 7-24: Average Species Contribution to 20% Best and Worst Days Baseline.................................. 56 Figure 7-25: Monthly Average Species Variation for All Sampled Days during the Baseline Period ....... 56 Figure 7-26: Baseline Worst Day Aerosol Composition Compared to 2018 URP, 2018 Projected Visibility and 2064 Natural Conditions Goal ............................................................................................. 57 Figure 9-1: URP by Pollutant on 20% Worst Days for Bandelier Wilderness ........................................... 67 Figure 9-2: URP by Pollutant on 20% Worst Days for Bosque del Apache NWR .................................... 68 Figure 9-3: URP by Pollutant on 20% Worst Days for Carlsbad Caverns NP ........................................... 69 Figure 9-4: URP by Pollutant on 20% Worst Days for Gila Wilderness.................................................... 70 Figure 9-5: URP by Pollutant on 20% Worst Days for Pecos Wilderness, Wheeler Peak Wilderness ...... 71 Figure 9-6: URP by Pollutant on 20% Worst Days for Salt Creek Wilderness .......................................... 72 Figure 9-7: URP by Pollutant on 20% Worst Days for San Pedro Parks Wilderness................................. 73 Figure 9-8: URP by Pollutant on 20% Worst Days for White Mountain Wilderness ................................ 74 Figure 9-9: PSAT for Sulfate on 20% - Regional Contributions ................................................................ 75 Figure 9-10: PSAT Sulfate on 20% Worst Days – WRAP States and Regional Contributions ................. 76 Figure 9-11: PSAT for Nitrate on 20% Worst Days – Regional Contributions.......................................... 76 Figure 9-12: PSAT Nitrate on 20% Worst Days – WRAP States and Regional Contributions.................. 77 Figure 9-13: PSAT for Sulfate on 20% Worst Days – Regional Contributions ......................................... 77 Figure 9-14: PSAT Sulfate on 20% Worst Days – WRAP States and Regional Contributions ................. 78 Figure 9-15: PSAT for Nitrate on 20% Worst Days – Regional Contributions.......................................... 78 Figure 9-16: PSAT for Nitrate on 20% Worst Days – WRAP States and Regional Contributions............ 79 Figure 9-17: PSAT for Sulfate on 20% Worst Days – Regional Contributions ......................................... 79 Figure 9-18: PSAT for Sulfate on 20% Worst Days – WRAP States and Regional Contributions............ 80 Figure 9-19: PSAT Nitrate on 20% Worst Days – Regional Contributions ............................................... 80 Figure 9-20: PSAT Nitrate on 20% Worst Days – WRAP States and Regional Contributions.................. 81 Figure 9-21: PSAT Sulfate on 20% Worst Days – Regional Contributions ............................................... 81 Figure 9-22: PSAT Sulfate on 20% Worst Days – WRAP States and Regional Contributions ................. 82 Figure 9-23: PSAT Nitrate on 20% Worst Days – Regional Contributions ............................................... 82 Figure 9-24: PSAT Nitrate on 20% Worst Days – WRAP States and Regional Contributions.................. 83 Figure 9-25: PSAT Sulfate on 20% Worst Days – Regional Contributions ............................................... 83
New Mexico Section 308 Regional Haze SIP viii
Figure 9-26: PSAT Sulfate on 20% Worst Days – WRAP States and Regional Contributions ................. 84 Figure 9-27: PSAT Nitrate on 20% Worst Days – Regional Contributions ............................................... 84 Figure 9-28: PSAT Nitrate on 20% Worst Days – WRAP States and Regional Contributions.................. 85 Figure 9-29: PSAT Sulfate on 20% Worst Days – Regional Contributions ............................................... 85 Figure 9-30: PSAT Sulfate on 20% Worst Days – WRAP States and Regional Contributions ................. 86 Figure 9-31: PSAT Nitrate on 20% Worst Days – Regional Contributions ............................................... 86 Figure 9-32: PSAT Nitrate on 20% Worst Days – WRAP States and Regional Contributions.................. 87 Figure 9-33: PSAT for Sulfate on 20% - Regional Contributions .............................................................. 87 Figure 9-34: PSAT Sulfate on 20% Worst Days – WRAP States and Regional Contributions ................. 88 Figure 9-35: PSAT for Nitrate on 20% Worst Days – Regional Contributions.......................................... 88 Figure 9-36: PSAT Nitrate on 20% Worst Days – WRAP States and Regional Contributions.................. 89 Figure 9-37: PSAT Sulfate on 20% Worst Days – Regional Contributions ............................................... 89 Figure 9-38: PSAT Sulfate on 20% Worst Days – WRAP States and Regional Contributions ................. 90 Figure 9-39: PSAT Nitrate on 20% Worst Days – Regional Contributions ............................................... 90 Figure 9-40: PSAT Nitrate on 20% Worst Days – WRAP States and Regional Contributions.................. 91 Figure 9-41: Weighted Emissions Potential – Nitrogen Oxides ................................................................. 92 Figure 9-42: Weighted Emissions Potential – Sulfur Oxides ..................................................................... 92 Figure 9-43: Weighted Emissions Potential – Organic Carbon .................................................................. 93 Figure 9-44: Weighted Emissions Potential – Elemental Carbon............................................................... 93 Figure 9-45: Weighted Emissions Potential – Fine Particulate Matter....................................................... 94 Figure 9-46: Weighted Emissions Potential – Coarse Particulate Matter ................................................... 94 Figure 9-47: Weighted Emissions Potential – Nitrogen Oxides ................................................................. 95 Figure 9-48: Weighted Emissions Potential – Sulfur Oxides ..................................................................... 96 Figure 9-49: Weighted Emissions Potential – Organic Carbon .................................................................. 96 Figure 9-50: Weighted Emissions Potential – Elemental Carbon............................................................... 97 Figure 9-51: Weighted Emissions Potential – Fine Particulate Matter....................................................... 97 Figure 9-52: Weighted Emissions Potential – Coarse Particulate Matter ................................................... 98 Figure 9-53: Weighted Emissions Potential – Nitrogen Oxides ................................................................. 98 Figure 9-54: Weighted Emissions Potential – Sulfur Oxides ..................................................................... 99 Figure 9-55: Weighted Emissions Potential – Organic Carbon ................................................................ 100 Figure 9-56: Weighted Emissions Potential – Elemental Carbon............................................................. 100 Figure 9-57: Weighted Emissions Potential – Fine Particulate Matter..................................................... 101 Figure 9-58: Weighted Emissions Potential – Coarse Particulate Matter ................................................. 101 Figure 9-59: Weighted Emissions Potential – Nitrogen Oxides ............................................................... 102 Figure 9-60: Weighted Emissions Potential – Sulfur Oxides ................................................................... 103 Figure 9-61: Weighted Emissions Potential – Organic Carbon ................................................................ 103 Figure 9-62: Weighted Emissions Potential – Elemental Carbon............................................................. 104 Figure 9-63: Weighted Emissions Potential – Fine Particulate Matter..................................................... 104 Figure 9-64: Weighted Emissions Potential – Coarse Particulate Matter ................................................. 105 Figure 9-65: Weighted Emissions Potential – Nitrogen Oxides ............................................................... 105 Figure 9-66: Weighted Emissions Potential – Sulfur Oxides ................................................................... 106 Figure 9-67: Weighted Emissions Potential – Organic Carbon ................................................................ 106 Figure 9-68: Weighted Emissions Potential – Elemental Carbon............................................................. 107 Figure 9-69: Weighted Emissions Potential – Fine Particulate Matter..................................................... 107 Figure 9-70: Weighted Emissions Potential – Coarse Particulate Matter ................................................. 108 Figure 9-71: Weighted Emissions Potential – Nitrogen Oxides ............................................................... 109 Figure 9-72: Weighted Emissions Potential – Sulfur Oxides ................................................................... 109 Figure 9-73: Weighted Emissions Potential – Organic Carbon ................................................................ 110 Figure 9-74: Weighted Emissions Potential – Elemental Carbon............................................................. 110 Figure 9-75: Weighted Emissions Potential – Fine Particulate Matter..................................................... 111 Figure 9-76: Weighted Emissions Potential – Coarse Particulate Matter ................................................. 111

New Mexico Section 308 Regional Haze SIP ix
Figure 9-77: Weighted Emissions Potential – Nitrogen Oxides ............................................................... 112 Figure 9-78: Weighted Emissions Potential – Sulfur Oxides ................................................................... 113 Figure 9-79: Weighted Emissions Potential – Organic Carbon ................................................................ 113 Figure 9-80: Weighted Emissions Potential – Elemental Carbon............................................................. 114 Figure 9-81: Weighted Emissions Potential – Fine Particulate Matter..................................................... 114 Figure 9-82: Weighted Emissions Potential – Coarse Particulate Matter ................................................. 115 Figure 9-83: Weighted Emissions Potential – Nitrogen Oxides ............................................................... 115 Figure 9-84: Weighted Emissions Potential – Sulfur Oxides ................................................................... 116 Figure 9-85: Weighted Emissions Potential – Organic Carbon ................................................................ 116 Figure 9-86: Weighted Emissions Potential – Elemental Carbon............................................................. 117 Figure 9-87: Weighted Emissions Potential – Fine Particulate Matter..................................................... 117 Figure 9-88: Weighted Emissions Potential – Coarse Particulate Matter ................................................. 118 Figure 10-1: Visibility Improvement from BART Controls at San Juan Generating Station................... 127 Figure 11-1: Uniform Rate of Progress Comparison to Reasonable Progress Goals for Bandelier ......... 139 Figure 11-2: Uniform Rate of Progress Comparison to Reasonable Progress Goals for Bosque del Apache.................................................................................................................................................................. 140 Figure 11-3: Uniform Rate of Progress Comparison to Reasonable Progress Goals for Carlsbad Caverns.................................................................................................................................................................. 141 Figure 11-4: Uniform Rate of Progress Comparison to Reasonable Progress Goals for Gila .................. 142 Figure 11-5: Uniform Rate of Progress Comparison to Reasonable Progress Goals for Wheeler Peak... 143 Figure 11-6: Uniform Rate of Progress Comparison to Reasonable Progress Goals for Salt Creek ........ 144 Figure 11-7: Uniform Rate of Progress Comparison to Reasonable Progress Goals for San Pedro Parks.................................................................................................................................................................. 145 Figure 11-8: Uniform Rate of Progress Comparison to Reasonable Progress Goals for White Mountain.................................................................................................................................................................. 146 Figure 11-9: OMC and EC Emissions Affecting New Mexico's Class I Areas........................................ 147 Figure 11-10: Impacts from Sources Outside of WRAP on New Mexico................................................ 148 Figure 12-1: Nitrate Contributions from New Mexico on Arizona Class I Areas .................................... 150 Figure 12-2: Nitrate Contributions from New Mexico on Colorado Class I Areas .................................. 151 Figure 12-3: Nitrate Contributions from New Mexico on Nevada Class I Areas..................................... 151 Figure 12-4: Nitrate Contributions from New Mexico on Utah Class I Areas ......................................... 152 Figure 12-5: Nitrate Contributions from New Mexico on Texas Class I Areas ....................................... 152 Figure 12-6: Nitrate Contributions from New Mexico on Wyoming Class I Areas ................................. 153 Figure 12-7: Sulfate Contributions from New Mexico on Arizona Class I Areas .................................... 154 Figure 12-8: Sulfate Contributions from New Mexico on Colorado Class I Areas .................................. 154 Figure 12-9: Sulfate Contributions from New Mexico on Nevada Class I Areas..................................... 155 Figure 12-10: Sulfate Contributions from New Mexico on Utah Class I Areas ....................................... 155 Figure 12-11: Sulfate Contributions from New Mexico on Texas Class I Areas ..................................... 156 Figure 12-12: Sulfate Contributions from New Mexico on Wyoming Class I Areas............................... 156

New Mexico Section 308 Regional Haze SIP 1
CHAPTER 1: INTRODUCTION
1.1 Overview of Visibility and Regional Haze
Good visibility is important to the enjoyment of national parks and scenic areas. Across the country, regional haze has decreased the visual range from 140 miles to 35-90 miles in the West, and from 90 miles to 15 -25 miles in the East. Regional haze is air pollution that is transported long distances, causing reduced visibility in national parks and wilderness areas. This haze is composed of small particles that absorb and scatter light, affecting the clarity and color of what we see. The pollutants that create this haze are sulfates, nitrates, organic carbon, elemental carbon and soil dust. Human-caused (anthropogenic) sources include industry, motor vehicles, agricultural and forestry burning, and windblown dust from roads and farming practices. There are 156 national parks and wilderness areas that have been designated by Congress as "mandatory federal Class I areas" (referred to herein as Class I areas) (Figure 1-1 and Figure 1-2). The Clean Air Act contains a national goal of reducing man-made visibility impairment in all Class I areas. To meet this goal, the U.S. Environmental Protection Agency (EPA) adopted the Regional Haze Rules in July 1999. These rules complement and are in addition to "Phase I" visibility rules adopted by EPA in 1980.
Figure 1-1: Federal Class I Areas within the United States

New Mexico Section 308 Regional Haze SIP 2
Figure 1-2: Class I Areas in the Western Region
1.2 New Mexico Class I Areas
New Mexico has nine (9) Class I areas: Bosque del Apache National Wildlife Refuge, Carlsbad Caverns National Park, and the Bandelier, Gila, Pecos, Salt Creek, San Pedro Parks, Wheeler Peak, and White Mountain Wilderness Areas. To protect visibility, Congress designated in 1977 all wilderness areas over 5,000 acres and all national parks over 6,000 acres as mandatory federal Class I areas and subject to the visibility protection requirements in the Clean Air Act. Table 1-1 lists the Class 1 areas in New Mexico along with their acreages. Figure 1-1 shows the locations of Class I areas within, and within 100 kilometers of, New Mexico.

New Mexico Section 308 Regional Haze SIP 3
Table 1-1: New Mexico Class I Areas
Class I Area Acreage
Bosque del Apache National Wildlife Refuge 80,850 Carlsbad Caverns National Park 46,435 Bandelier Wilderness 23,267 Gila Wilderness 433,690 Pecos Wilderness 167,416 Salt Creek Wilderness 8,500 San Pedro Parks Wilderness 41,132 Wheeler Peak Wilderness 6,027 White Mountain Wilderness 31,171
Figure 1-3: Map of New Mexico Class I Areas
New Mexico Section 308 Regional Haze SIP 4
1.3 Summary of the Regional Haze Rule
The goal of the Regional Haze Rule is to eliminate human-caused visibility impairment in Class I areas across the country. It contains strategies to improve visibility over the next 60 years, and requires states to adopt implementation plans. The Regional Haze Rule provides two paths for developing and adopting regional haze implementation plans. One is "Section 308" (40 CFR 51.308), and requires most states to develop long-term strategies out to the year 2064. These strategies must be shown to make "reasonable progress" in improving visibility in Class I areas inside the state and in neighboring jurisdictions. The other is "Section 309" (40 CFR 51.309), and is an option for nine western states and one city – Arizona, California, Colorado, Idaho, Nevada, New Mexico, Oregon Utah, Wyoming, and the City of Albuquerque. These states (and the City of Albuquerque) can choose to follow Section 309 and adopt regional haze strategies for the period of 2003 to 2018. The regional haze strategies are based on recommendations from the Grand Canyon Visibility Transport Commission (GCVTC) for protection the 16 Class I areas in the Colorado Plateau area.
1.4 Background on the Regional Haze Rule
1.4.1 The 1977 Clean Air Act Amendments
National Visibility Goal In 1977, Congress amended the Clean Air Act to include provisions to protect the scenic vistas of the nation's national parks and wilderness areas. In these amendments, Congress declared as a national visibility goal:
The prevention of any future, and the remedying of any existing impairment of visibility in mandatory class I Federal areas which impairment results from manmade air pollution. (Section 169A)
To address this goal, the EPA developed regulations to reduce the impact of large industrial sources on nearby Class I areas. It was recognized at the time that regional haze, which comes from a wide variety of sources that may be located far from a Class I areas, was also a part of the visibility problems. However, monitoring networks and visibility models were not yet developed to the degree necessary to understand the causes of regional haze. Prevention of Significant Deterioration The 1977 Clean Air Act Amendments established Prevention of Significant deterioration (PSD) requirements, which included protecting visibility in national parks, national wilderness areas, national monuments, and national seashores. The PSD program includes area specific (Class I, II, and III) increments or limits on the maximum allowable increasing air pollutants (particulate matter or sulfur dioxide) and a preconstruction permit review process for new or modifying major sources that allows for careful consideration of control technology, consultation with FLMs on visibility impacts and public participation in permitting decisions. Best Available Retrofit Technology Under Section 169A(b), Congress established new requirements on major stationary sources in operation within a 15-year period prior to enactment of the 1977 amendments that can be reasonably attributed to cause visibility impairment in a mandatory Class I federal area. Such sources must install best available retrofit technology (BART) as determined by the State. In determining BART, the State must take into consideration the costs of compliance, the energy and non-air quality environmental impacts of

New Mexico Section 308 Regional Haze SIP 5
compliance, any existing pollution control technology in use at the source, the remaining useful life of the source, and the degree of improvement in visibility which may reasonably be anticipated to result from the use of such technology.
1.4.2 Phase I Visibility Rules – The New Mexico Visibility Protection Plan
In 1980, EPA adopted regulations to address "reasonably attributable visibility impairment" (RAVI), or visibility impairment caused by one or a small group of man-made sources generally located in close proximity to a specific Class I area. These became known as EPA's "Phase I" visibility rules. At that time, EPA deferred writing rules to address regional haze, because they lacked the monitoring, modeling, and scientific information needed to understand the nature of long-range transport and formation of regional haze. EPA adopted "Phase II" rules on regional haze in July 1999. EPA approved New Mexico's Phase I (RAVI) visibility SIP on January 27, 2006.
1.4.3 The 1990 Clean Air Act Amendments
Although the 1980 regulation addressed reasonably attributable visibility impairment from specific sources, it did not adequately address visibility impairment from large collections of sources whose emissions are mixed and transported over long distances. In the 1990 amendments to the Clean Air Act, Congress established the requirements to address regional haze. They gave EPA the authority to establish visibility transport commissions and promulgate regulations to address regional haze. The 1990 amendments also established a visibility transport commission to investigate and report on regional haze visibility impairment in the Grand Canyon National Park and nearby Class I areas. Grand Canyon Visibility Transport Commission Finding and Recommendations The 1990 Clean Air Act Amendments created the Grand Canyon Visibility Transport Commission (GCVTC). The GCVTC was given the charge to assess the currently available scientific information pertaining to adverse impacts on visibility from potential growth in the region, identify clean air corridors, and recommend long-range strategies for addressing regional haze for Class I areas on the Colorado Plateau. The GCVTC completed significant technical analyses and developed recommendations to improve visibility in the 16 mandatory federal Class I areas on the Colorado Plateau. These 16 Class I areas are as follows: Arches National Park, Black Canyon of the Gunnison Wilderness, Bryce Canyon National Park, Canyonlands National Park, Capital Reef National Park, Flat Tops Wilderness, Grand Canyon National Park, Maroon Bells Wilderness, Mesa Verde National Park, Mount Baldy Wilderness, Petrified Forest National Park, San Pedro Parks Wilderness, Sycamore Canyon Wilderness, Weminuche Wilderness, West Elk Wilderness, and Zion National Park. The GCVTC found that visibility impairment on the Colorado Plateau was caused by a wide variety of sources and pollutants. A comprehensive strategy was needed to address all of the causes of regional haze. The GCVTC submitted these recommendations to EPA in a report dated June 1996 for consideration in rule development. These recommendations were: Air Pollution Prevention. Air pollution prevention and reduction of per capita pollution was a high priority for the Commission. The Commission recommended policies based on energy conservation, increased energy efficiency and promotion of the use of renewable resources for energy production. Clean Air Corridors. Clean air corridors are geographic areas that provide a source of clean air to the 16 Class I areas of the Colorado Plateau. For these areas, the Commission primarily recommended careful tracking of emissions growth that may affect air quality in these corridors, and ultimately the 16 Class I areas.

New Mexico Section 308 Regional Haze SIP 6
Stationary Sources. For stationary sources, the Commission recommended closely monitoring the impacts of current requirements under the Clean Air Act and ongoing studies. It also recommended regional targets for sulfur dioxide (SO2) emissions from stationary sources, starting in 2000. If these targets are exceeded, a regional cap and market-based emission trading program should be implements. Areas In and Near Parks. The Commission's research and modeling showed that a host of sources adjacent to parks and wilderness areas, including large urban areas, have significant visibility impacts. However, the Commission lacked sufficient data regarding the visibility impacts of emissions from some areas in and near parks and wilderness areas. In general, the models used by the Commission were not readily applicable to such areas. Pending further studies of these areas, the Commission recommended that local, state, tribal, federal, and private parties cooperatively develop strategies, expand data collection, and improve modeling for reducing or preventing visibility impairment in areas within and adjacent to parks and wilderness areas. Mobile Sources. The Commission recognized that mobile source emissions are projected to decrease through about 2005 due to improved control technologies. The Commission recommended capping emissions at the lowest level achieved and establishing a regional emissions budget, and also endorsed national strategies aimed at further reducing tailpipe emissions, including the so-called 49-state low emission vehicle, or 49-state LEV. Road Dust. The Commission's technical assessment indicated that road dust is a large contributor to visibility impairment on the Colorado Plateau. As such, it requires urgent attention. However, due to considerable skepticism regarding the modeled contribution of road dust to visibility impairment, the Commission recommended further study in order to resolve the uncertainties regarding both near-field and distant effects of road dust, prior to taking remedial action. Since this emission source is potentially such a significant contributor, the Commission felt that it deserved high priority attention and, if warranted, additional emissions management actions. Emissions from Mexico. Mexican sources are also shown to be significant contributors, particularly of SO2 emissions. However, data gaps and jurisdictional issues made this a difficult issue for the Commission to address directly. The Commission recommendations called for continued bi-national collaboration to work on this problem, as well as additional efforts to complete emissions inventories and increase monitoring capacities. These matters should receive high priority for regional and national action. Fire. The Commission recognized that fire plays a significant role in visibility on the Plateau. In fact, land managers propose aggressive prescribed fire programs aimed at correcting the buildup of biomass due to decades of fire suppression. Therefore, prescribed fire and wildfire levels are projected to increase significantly during the studied period. The Commission recommended the implementation of programs to minimize emissions and visibility impacts from prescribed fire, as well as to educate the public. Future Regional Coordinating Entity. Finally, the Commission believed there was a need for an entity like the Commission to oversee, promote, and support many of the recommendations in their report. To support that entity, the commission developed a set of recommendations addressing the future administrative, technical and funding needs of the Commission or a new regional entity. The Commission strongly urged the EPA and Congress to provide funding for these vital functions and give them a priority reflective of the national importance of the Class I areas on the Colorado Plateau. The Western Regional Air Partnership The GCVTC recognized the need for a long-term organization to address the policy and technical studies needed to address regional haze. The Western Regional Air Partnership (WRAP) was formed in

New Mexico Section 308 Regional Haze SIP 7
September 1997 as the successor organization to the GCVTC. The WRAP is made up of western states, tribes and federal agencies. The states are Alaska, Arizona, California, Colorado, Idaho, Montana, New Mexico, North Dakota, Oregon, South Dakota, Utah, Washington, and Wyoming. The WRAP established stakeholder-based technical and policy oversight committees to assist in managing the development of regional haze work products. Stakeholder-based working groups and forums were established to focus attention on the policy and technical work products the states and tribes need to develop their implementation plans. Additional information about the WRAP can be found on the WRAP web site at http://www.wrapair.org.
1.4.4 Submittal of the New Mexico 309 SIP
In December 2003, the New Mexico Environmental Improvement Board adopted and the New Mexico Environment Department submitted to EPA the New Mexico Section 309 Regional Haze SIP. EPA did not act on this SIP. On January 15, 2009, EPA issued a Finding of Failure to Submit a State Implementation Plan in compliance with 40 CFR Part 51. Since New Mexico submitted a Regional Haze SIP in 2003, EPA found New Mexico failed to submit under 40 CFR 51.309(g) and 40 CFR 51.309(d)(4).
1.5 Purpose of this Document
This Regional Haze SIP has been prepared to meet the requirements of the Federal Regional Haze Rule, Section 40 CFR, Part 51, Section 308. It contains strategies and elements related to each requirement of this federal rule. The appendices provide additional information related to the strategies, including citations of new rules associated with this SIP, technical analysis, and reports prepared by WRAP. Relation to the WRAP's Regional Technical Support System The WRAP's Technical Support System (TSS) was the source for the majority of key technical information and data used in this SIP. The TSS includes the emissions information, modeling, methodology, and other information that was utilized to develop the reasonable progress goals and long-term strategies within this plan. The WRAP TSS can be found at http://vista.cira.colostate.edu/tss/. Mandatory Federal Class I Areas Addressed in this SIP The Regional Haze Rule under 40 CFR 51.308 requires states to address visibility protection for regional haze in New Mexico's Class I areas. These areas are listed in Section 1.2 and shown in Figure 1-3.
1.5.1 Basic Plan Elements
Natural Sources of Visibility Impairment Natural sources of visibility impairment include anything not directly attributed to human-caused (anthropogenic) emissions of visibility-impairing pollutants. Natural events (e.g. windblown dust, wildfire, biogenic emissions) also introduce pollutants that contribute to haze. Specific natural events can lead to high short-term concentrations of visibility-impairing particulate matter and its precursors. Therefore, natural visibility conditions, for the purpose of New Mexico's Regional Haze Program, are represented by a long-term average of conditions expected to occur in the absence of emissions normally attributed to human activities. Natural visibility conditions reflect contemporary vegetated landscape, land-use patterns, and meteorological/climatic conditions. Natural sources, particularly wildfire and windblown dust, can be major contributors to visibility impairment. However, these emissions cannot be realistically controlled or prevented by the States, and therefore the focus of the regional haze strategies in this document are on human-caused (anthropogenic) sources. While current methods of analysis of monitoring data do not provide a clear distinction between natural and anthropogenic emissions, certain pollutant species, such as SO2 and nitrogen oxides (NOx) are

New Mexico Section 308 Regional Haze SIP 8
more representative of anthropogenic sources, while organic carbon (OC) and coarse particulate matter (CM or PM10) are more representative of natural sources such as wildfire and dust, respectively. Human-Caused (Anthropogenic) Sources of Visibility Impairment Anthropogenic sources of visibility impairment include anything directly attributable to human activities that produce emissions of visibility-impairing pollutants. Examples include industry, energy, transportation, construction, mining, agricultural activities, home heating, and outdoor burning. Anthropogenic sources can be local, regional, or international. Efforts to regulate anthropogenic emissions are mostly limited to inside the United States. Emissions from Mexico, Canada, and off-shore marine shipping emissions in the Pacific Ocean are examples of anthropogenic sources that have the potential contribute to visibility impairment in New Mexico, but are beyond the jurisdiction of the New Mexico Environment Department. Deciview Measurement The Interagency Monitoring for Protected Visual Environments (IMPROVE) network provides States with a mechanism to monitor and collect data regarding the emissions of haze-impairing pollutants. Each IMPROVE monitor collects particulate concentration data which are converted into reconstructed light extinction through a complex calculation using the IMPROVE equation. Reconstructed light extinction (referred to as bext) is expressed in units of inverse megameters (1/Mm or Mm-1). The Regional Haze Rule requires the tracking of visibility conditions in terms of the Haze Index (HI) metric expressed in the deciview (dv) unit (40 CFR 51.308(d)(2)). Generally, a one deciview change in the haze index is considered a humanly perceptible change under ideal conditions, regardless of background visibility conditions. The relationship between extinction (Mm-1), haze index (dv) and visual range (mi) are indicated by the following scale:
Baseline and Current Conditions The Regional Haze Rule requires the calculation of baseline conditions for each Class I area. Baseline conditions are defined as the five year average (annual values for 2000 - 2004) of IMPROVE monitoring data (expressed in deciviews) for the most-impaired (20% worst) days and the least-impaired (20% best) days. For this regional haze plan submittal, the baseline conditions are the reference point against which visibility improvement is tracked. For future plan progress reports and updates, baseline conditions are used to calculate progress from the beginning of the regional haze program. Current conditions for the best and worst days are calculated from a multiyear average, based on the most recent 5-years of monitored data available. This value will be revised at the time of each periodic plan revision, and will be used to illustrate the amount of progress made since the last plan revision, and the amount of progress made from the baseline period of the program. Natural Conditions The visibility that would exist under natural conditions (absent any anthropogenic impairment) would vary based on the contribution of natural sources and meteorological conditions on a given day. For that reason, natural conditions, as defined in this document, consist of a level of visibility (in deciviews) for both the most-impaired (20% worst) days and the least-impaired (20% best) days. Since no visibility monitoring data exists from the pre-anthropogenic impairment period, these estimates of natural

New Mexico Section 308 Regional Haze SIP 9
conditions are based on EPA guidance on how to estimate natural conditions (EPA Document: Guidance for Estimating Natural Visibility Conditions Under the Regional Haze Rule, EPA-454/B-03-005, September 2003). Reasonable Progress Goals For each Class I area the State must establish goals (measured in deciviews) that provide for reasonable progress towards achieving natural visibility conditions. The reasonable progress goals (RPG) are interim goals that represent incremental visibility improvement over time for the most-impaired (20% worst) days and no degradation in visibility for the least-impaired (20% best) days. The first regional haze plan that States must submit to EPA needs to include RPGs for the year 2018, also known as the "2018 milestone year". The State has flexibility in establishing different RPGs for each Class I area. In establishing the RPG, the State must consider four factors: the costs of compliance; the time necessary for compliance; the energy and non-air quality environmental impacts of compliance; and the remaining useful life of any potentially affected sources. States must demonstrate how these factors were taken into consideration in selecting the goal for each Class I area. Uniform Rate of Progress The uniform rate of progress (URP) is the calculation of the slope of the line between baseline visibility conditions and natural visibility conditions over the 60-year period (Figure 1-4). For the first regional haze plan, the first benchmark is the deciview level that should be achieved in 2018. This is the 2018 Milestone, and applies to both the 20% worst days and the 20% best days.
Figure 1-4: Illustration of Uniform Rate of Progress
The URP calculation is as follows:
• Compare baseline conditions to natural conditions. The difference between these two different conditions represents the amount of progress needed to reach natural visibility conditions. In this example, the State has determined that the baseline for the 20% worst days for the Class I area is 10.2 dv and estimated that natural background is 5.7 dv, a difference of 4.5 dv.
• Calculate the annual average visibility improvement needed to reach natural conditions by 2064
by dividing the total amount of improvement needed by 60 years (the period between 2004 and 2064). In this example, this value is 0.075 dv/yr.

New Mexico Section 308 Regional Haze SIP 10
• Multiply the annual average visibility improvement needed by the number of years in the first planning period (the period from 2004 until 2018). In this example, this value is 1.05 dv. This is the uniform rate of progress that would be needed during the first planning period to attain natural visibility conditions by 2064.
The URP is not a presumptive target. When establishing RPGs, the State may determine RPGs at greater, lesser or equivalent visibility improvement than the URP. In cases where the RPG results in less improvement in 2018 than the URP, the State must demonstrate why the URP is not achievable, and why the RPGs are "reasonable". Long-Term Strategy The Regional Haze Rule also requires States to submit a long-term strategy (LTS) that includes enforceable measures to achieve RPGs. The LTS must identify all anthropogenic sources inside the State that affect Class I areas both inside and outside the State. The first long-term strategy will cover 10 to 15 years, with reassessment and revision of those goals and strategies in 2018 and every 10 years thereafter. At a minimum, the following factors must be considered in developing the long-term strategy:
• Measures to mitigate the impact of construction activities; • Emission limitations and schedules for compliance to achieve the RPG; • Source retirement and replacement schedules; • Smoke management techniques for agricultural and forestry burning, including plans to reduce
smoke impacts; • Enforceability of emission limitations and control measures; and • The anticipated net affect on visibility due to projected changes in point, area, and mobile source
emissions over the period addressed in the long term strategy. Best Available Retrofit Technology (BART) Best Available Retrofit Technology (BART) requirements apply to certain older industrial facilities that began operating before national rules were adopted in 1977 to prevent new facilities from causing visibility impairment. BART applies to facilities built between 1962 and 1977, which have potential emissions greater than 250 tons per year, and which fall into one of 26 specific source categories. These facilities must be evaluated to see how much they contribute to regional haze and if retrofitting with controls is feasible and cost effective. The BART process consists of three-steps: (1) determining BART-eligibility; (2) determining if a source is "subject to BART" by conducting modeling of Class I visibility impacts; and (3) conducting an analysis of BART controls (retrofitting) for those sources subject to BART that contribute to regional haze. In determining BART controls, the State must take into account several factors, including the existing control technology in place at the source, the costs of compliance, energy and non-air environmental impacts of compliance, remaining useful life of the source, and the degree of visibility improvement that is reasonably anticipated from the use of such technology.

New Mexico Section 308 Regional Haze SIP 11
CHAPTER 2: NEW MEXICO REGIONAL HAZE SIP DEVELOPMENT PROCESS
The Regional Haze Rule contains requirements for state, federal, and tribal consultation. The New Mexico Regional Haze State Implementation Plan (SIP) was developed through a process of consultation with other States, Tribes, the Environmental Protection Agency (EPA), state and federal natural resource agencies, other stakeholders, and the public. This chapter contains a description of the requirements from the Regional Haze Rule. For additional details regarding individual consultation, see Chapter 11 (Long-Term Strategy).
2.1 Federal Land Manager Consultation
40 CFR Section 51.308(i) of the Regional Haze Rule requires coordination between states and the Federal Land Managers (FLMs). New Mexico has provided agency contacts to the FLMs as required under 51.308(i)(1). During the development of this Plan, the FLMs were consulted in accordance with the provisions of 51.308(i)(2). Numerous opportunities were provided by the Western Regional Air Partnership for FLMs to participate fully in the development of technical documents developed by the WRAP and included in this Plan. This included the ability to review and comment on these analyses, reports, and policies. A summary of WRAP-sponsored meetings and conference calls is provided on the WRAP website at: http://www.wrapair.org/cal/calendar.php. The State of New Mexico has provided an opportunity for consultation, in person and at least 60 days prior to holding any public hearing on the SIP. As required by 40 CFR Section 51.308(i)(3), the FLM comments and State responses, as well as email exchanges from the FLM community to NMED explaining their review preferences of the SIP, will be submitted to EPA along with this Plan. 40 CFR Sections 51.308(f)-(h) establish requirements and timeframes for states to submit periodic SIP revisions and reports that evaluate progress toward the reasonable progress goal for each Class I area. As required by 40 CFR Section 51.308(i)(4), New Mexico will continue to coordinate and consult with the FLMs during the development of these future progress reports and Plan revisions, as well as during the implementation of programs having the potential to contribute to visibility impairment in mandatory Class I areas. The progress and Plan reviews are to occur at five-year intervals, with a progress report between each required Plan revision. This consultation process shall provide on-going and timely opportunities to address the status of the control programs identified in this SIP, the development of future assessments of sources and impacts, and the development of additional control programs. The consultation will include the status of the following specific implementation items:
1. Implementation of emissions strategies identified in the SIP as contributing to achieving improvement in the worst-day visibility.
2. Summary of major new permits issued.
3. Status of State actions to meet commitments for completing any future assessments or
rulemakings on sources identified as likely contributors to visibility impairment, but not directly addressed in the most recent SIP revision.
4. Any changes to the monitoring strategy or monitoring stations status that may affect tracking of
reasonable progress.

New Mexico Section 308 Regional Haze SIP 12
5. Work underway for preparing the 5-year review and/or 10-year revision.
6. Items for FLMs to consider or provide support for in preparation for any visibility protection SIP revisions (based on a 5-year review or the 10-year revision schedule under EPA’s RHR).
7. Summary of topics discussion (meetings, emails, other records) covered in ongoing
communications between the State and FLMs regarding implementation of the visibility program. The consultation will be coordinated with the designated visibility protection program coordinators for the National Park Service, U.S. Fish and Wildlife Service, Bureau of Land Management, and the U.S. Forest Service. At a minimum, the State of New Mexico will meet with the Federal Land Managers on an annual basis through the Western Regional Air Partnership or an alternative Regional Planning Organization.
2.2 State Consultation
Pursuant to 40 CFR Section 51.308(d)(iv), the State of New Mexico consulted with other states through a regional planning organization, the Western Regional Air Partnership (WRAP), in developing reasonable progress goals. The WRAP is a collaborative effort of tribal governments, State governments and various Federal agencies to implement the Grand Canyon Visibility Transport Commission's recommendations and to develop the technical and policy tools needed by western states and tribes to comply with the U.S. EPA’s regional haze regulations. WRAP activities are conducted by a network of committees and forums composed of WRAP members and stakeholders who represent a wide range of viewpoints. The WRAP recognizes that residents have the most to gain from improved visibility and that many solutions are best implemented at the local, state, tribal or regional level with public participation. The following western states agreed to work together to address regional haze: Alaska, Arizona, California, Colorado, Idaho, Montana, Nevada, New Mexico, North Dakota, Oregon, South Dakota, Utah, Washington, and Wyoming. The goals, objectives, management and decision making structure used by the WRAP during the development of data and policies incorporated into this plan are described in Work Plans and a Strategic Plan provided in Chapter 5, Technical Information and Data. This consultation effort began with all states in the WRAP region contributing information to a Technical Support System (TSS) which allows all states to better understand the causes of haze and the levels of contribution from all sources to each Class I area. This project involved many hours of consultation between states on regional emission inventories, monitoring and modeling to determine the causes of visibility impairment in each mandatory Class I Federal area in the regional planning area. WRAP forums involved in the technical consultation between states were as follows: Air Pollution Prevention Forum Mobile Sources Forum Dust Emissions Forum Sources In and Near Class I Areas Forum Economic Analysis Forum Stationary Sources Joint Forum Emissions Forum Technical Analysis Forum Fire Emissions Joint Forum The next step in state consultation in the development of reasonable progress goals was through the Implementation Work Group (IWG) of the WRAP. The State of New Mexico participated in the IWG which took the products of the technical consultation process discussed above and developed a process for establishing reasonable progress goals in the Western Class I areas. A description of that process and the determination of reasonable progress goals for each of the Class I areas in the State of New Mexico is described in Chapter 11. The following states agreed to work together through the IWG in the

New Mexico Section 308 Regional Haze SIP 13
development of reasonable progress goals: Alaska, Arizona, California, Colorado, Hawaii, Idaho, Montana, Nevada, New Mexico, North Dakota, Oregon, South Dakota, Utah, Washington, and Wyoming. Opportunities for consultation on development of reasonable progress goals provided through the WRAP Implementation Work Group have been documented in calls listed on the Implementation Work Group section of the WRAP website at: http://www.wrapair.org/forums/iwg/meetings.html. Pursuant to 40 CFR Section 51.308(d)(iv), the State of New Mexico also gave opportunity for neighboring states to comment on the State of New Mexico's reasonable progress goals for each Class I area located within the state. Opportunity for comment from other states was offered through a public hearing on the 2003 Section 309 SIP, held in accordance with 40 CFR Section 51.102. The following states in the WRAP region were notified of the SIP public hearing: Alaska, Arizona, California, Colorado, Idaho, Montana, New Mexico, North Dakota, Oregon, South Dakota, Utah, Washington, Nevada, and Hawaii. The following states in the neighboring Central States Regional Planning Organization (CENRAP) were notified of the SIP public hearing: Iowa, Kansas, Minnesota, Missouri, Nebraska, Oklahoma, and Texas. Pursuant to 40 CFR 51.308(d)(3)(i), the State of New Mexico has participated in regional planning and coordination with other states in developing emission management strategies if emissions from within the state contribute to visibility impairment in a mandatory Class I Federal area outside the state, or if emissions from another state, regional planning organization, country, tribal area, or offshore location contribute to visibility impairment in any Class I Federal area within the state. This participation was through the WRAP. A more detailed description of the goals, objectives, management, and decision-making structure of the WRAP has been included in Chapter 5. The following WRAP forums have provided consultation opportunities between states on emission management strategies: Air Pollution Prevention Forum Mobile Sources Forum Dust Emissions Forum Sources In and Near Class I Areas Forum Economic Analysis Forum Stationary Sources Joint Forum Emissions Forum Technical Analysis Forum Fire Emissions Joint Forum Opportunities for consultation on emission strategies provided through the WRAP have been documented in calls and meetings on the WRAP website at: http://www.wrapair.org/cal/calendar.php. A description of the selected emission management strategies for the State of New Mexico is described in Chapter 12 of this Plan. The State of New Mexico views the development of coordinated emission management strategies to be a long-term commitment, and therefore, the State of New Mexico agrees to continue to participate in the WRAP or an alternative Regional Planning Organization in developing coordinated emission management strategies for SIP revisions in 2013 and 2018. Pursuant to 40 CFR 51.308(h)(2), the State of New Mexico has determined this first State Implementation Plan is adequate to ensure reasonable progress for the first planning period of the regional haze long-term planning effort which extends out to the year 2064. While emissions from sources outside of the State of New Mexico have resulted in a slower rate of improvement in visibility than the rate that would be needed to attain natural conditions by 2064, most of these emissions are beyond the control of any state in the regional planning area of the WRAP. The emission sources include: emissions from outside the WRAP domain; emissions from Mexico; emissions from wildfires and windblown dust; and emissions from CENWRAP and the Eastern U.S. A more detailed description and quantification of these uncontrolled emissions is included in the Source Apportionment and Regional Haze Modeling chapter of

New Mexico Section 308 Regional Haze SIP 14
this SIP. Additional strategies to address emissions beyond the control of any state in the WRAP under the jurisdiction of EPA are discussed in the Long-Term Strategy chapter of this SIP. Through the WRAP consultation process the State of New Mexico has reviewed and analyzed the contributions from other states that reasonably may cause or contribute to visibility impairment in New Mexico's Class I areas. New Mexico acknowledges that the long-term strategies adopted by Colorado, Arizona, Colorado, and Texas in their SIPs and approved by EPA will include emission reductions from a variety of sources that will reduce visibility impairment in New Mexico’s Class I areas.
2.3 Tribal Consultation
Although tribal consultation is not required under the Regional Haze Rule, NMED views this as an important part of the consultation process, and actively pursued this during the development of the Regional Haze Plan.
2.4 Public and Stakeholder Outreach
New Mexico participated in numerous stakeholder meetings during the WRAP process and continues to meet with stakeholders. Additional stakeholder meetings will be held during the public comment period of this SIP proposal.
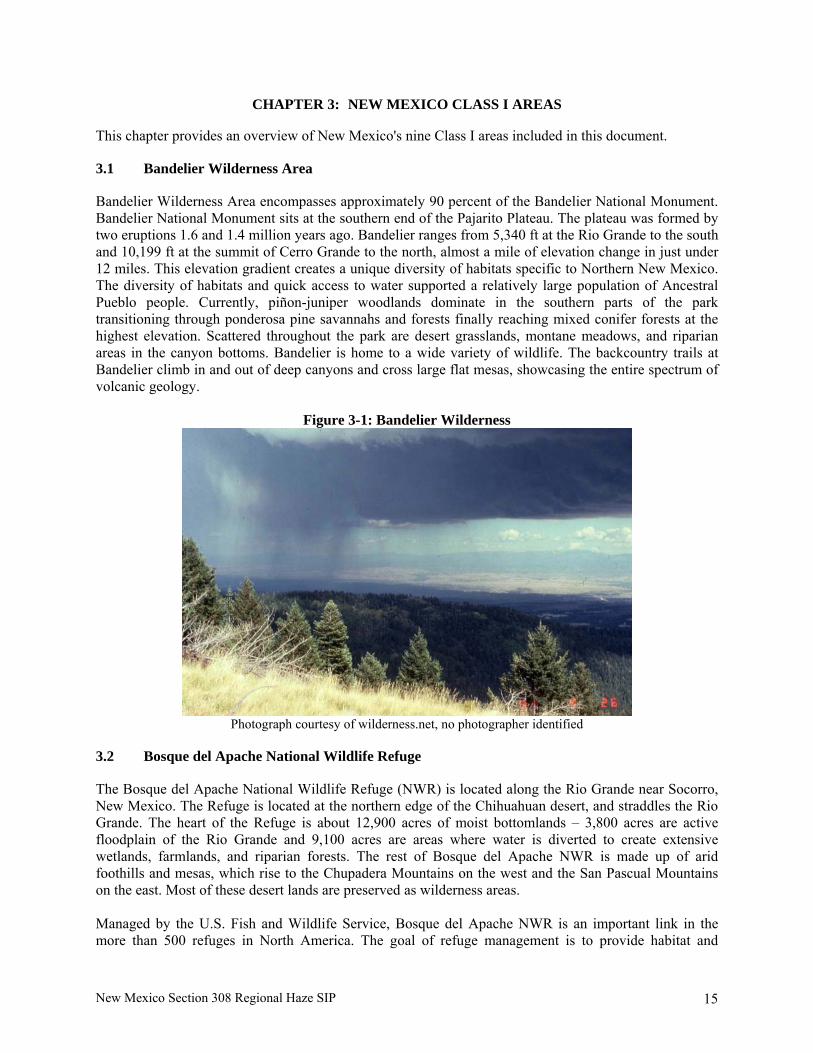
New Mexico Section 308 Regional Haze SIP 15
CHAPTER 3: NEW MEXICO CLASS I AREAS
This chapter provides an overview of New Mexico's nine Class I areas included in this document.
3.1 Bandelier Wilderness Area
Bandelier Wilderness Area encompasses approximately 90 percent of the Bandelier National Monument. Bandelier National Monument sits at the southern end of the Pajarito Plateau. The plateau was formed by two eruptions 1.6 and 1.4 million years ago. Bandelier ranges from 5,340 ft at the Rio Grande to the south and 10,199 ft at the summit of Cerro Grande to the north, almost a mile of elevation change in just under 12 miles. This elevation gradient creates a unique diversity of habitats specific to Northern New Mexico. The diversity of habitats and quick access to water supported a relatively large population of Ancestral Pueblo people. Currently, piñon-juniper woodlands dominate in the southern parts of the park transitioning through ponderosa pine savannahs and forests finally reaching mixed conifer forests at the highest elevation. Scattered throughout the park are desert grasslands, montane meadows, and riparian areas in the canyon bottoms. Bandelier is home to a wide variety of wildlife. The backcountry trails at Bandelier climb in and out of deep canyons and cross large flat mesas, showcasing the entire spectrum of volcanic geology.
Figure 3-1: Bandelier Wilderness
Photograph courtesy of wilderness.net, no photographer identified
3.2 Bosque del Apache National Wildlife Refuge
The Bosque del Apache National Wildlife Refuge (NWR) is located along the Rio Grande near Socorro, New Mexico. The Refuge is located at the northern edge of the Chihuahuan desert, and straddles the Rio Grande. The heart of the Refuge is about 12,900 acres of moist bottomlands – 3,800 acres are active floodplain of the Rio Grande and 9,100 acres are areas where water is diverted to create extensive wetlands, farmlands, and riparian forests. The rest of Bosque del Apache NWR is made up of arid foothills and mesas, which rise to the Chupadera Mountains on the west and the San Pascual Mountains on the east. Most of these desert lands are preserved as wilderness areas. Managed by the U.S. Fish and Wildlife Service, Bosque del Apache NWR is an important link in the more than 500 refuges in North America. The goal of refuge management is to provide habitat and

New Mexico Section 308 Regional Haze SIP 16
protection for migratory birds and endangered species and provide the public with a high quality wildlife and educational experience
Figure 3-2: Bosque del Apache National Wildlife Refuge
Photograph by Rita Bates
3.3 Carlsbad Caverns National Park
Carlsbad Caverns National Park is located in the Guadalupe Mountains, a mountain range that runs from west Texas into southeastern New Mexico. Elevations within the park rise from 3,595 feet in the lowlands to 6,520 feet atop the escarpment. Though there are scattered woodlands in the higher elevations, the park is primarily a variety of grassland and desert shrubland habitats. The park supports a diverse ecosystem, including habitat for many plants and animals that are at the geographic limits of their ranges. For example, the ponderosa pine reaches its extreme eastern limit here and several species of reptiles are at the edges of their distributions. The most famous of all the geologic features in the park are the caves. Carlsbad Caverns National Park contains more than 110 limestone caves, the most famous of which is Carlsbad Cavern. Carlsbad Cavern receives more than 300,000 visitors each year and offers a rare glimpse of the underground worlds preserved under the desert above.

New Mexico Section 308 Regional Haze SIP 17
Figure 3-3: Carlsbad Caverns National Park
Photograph courtesy of wilderness.net, photograph by Renee West
3.4 Gila Wilderness
Many different types of terrain are found in the Gila Wilderness. The northeastern and far eastern sections of the wilderness tend to consist of high mesas and rolling hills, ranging in elevation from approximately 5,000 to 8,000 feet and cut by the deep canyons of the Gila River. The vegetation there consists primarily of mixed junipers and piñon pines, grasses, and at the higher elevations and on northern slopes, ponderosa pines. Vast stands of ponderosas cover the central part of the wilderness in this area. The river canyons offer spectacular cliffs, with mixed hardwoods and ponderosa pine growing along the riparian bottoms. The far western and southwestern sections of the Gila Wilderness consist of high mountains, particularly the Mogollon Range, with the highest elevation reaching 10,895 feet. Steep side canyons are common, and vegetation includes Douglas fir, ponderosa pine, aspens and a variety of ferns. The area includes the drainage basins of both Mogollon Creek and Turkey Creek.

New Mexico Section 308 Regional Haze SIP 18
Figure 3-4: Gila Wilderness
Photograph courtesy of wilderness.net, photograph by Steve Boutcher
3.5 Pecos Wilderness
The Pecos Wilderness extends through two Ranger Districts in the Santa Fe National Forest and into the Carson National Forest to the north. Within the boundaries of this expansive area are several landmarks including Truchas Peak which tops of at 13,103 feet, and the southern stretch of the Rocky Mountains. The terrain varies from open meadows in the Pecos River Valley to the steep canyons of the Sangre de Cristo mountain range. Wildlife ranges from deer and elk to big horn sheep, turkeys and grouse. It is not uncommon to run into cattle in the wilderness either, as some ranchers are permitted to graze their cattle in areas of the wilderness. There are 15 lakes, and eight major streams to sustain both plant and animal habitat, including the native Rio Grande Cutthroat Trout.
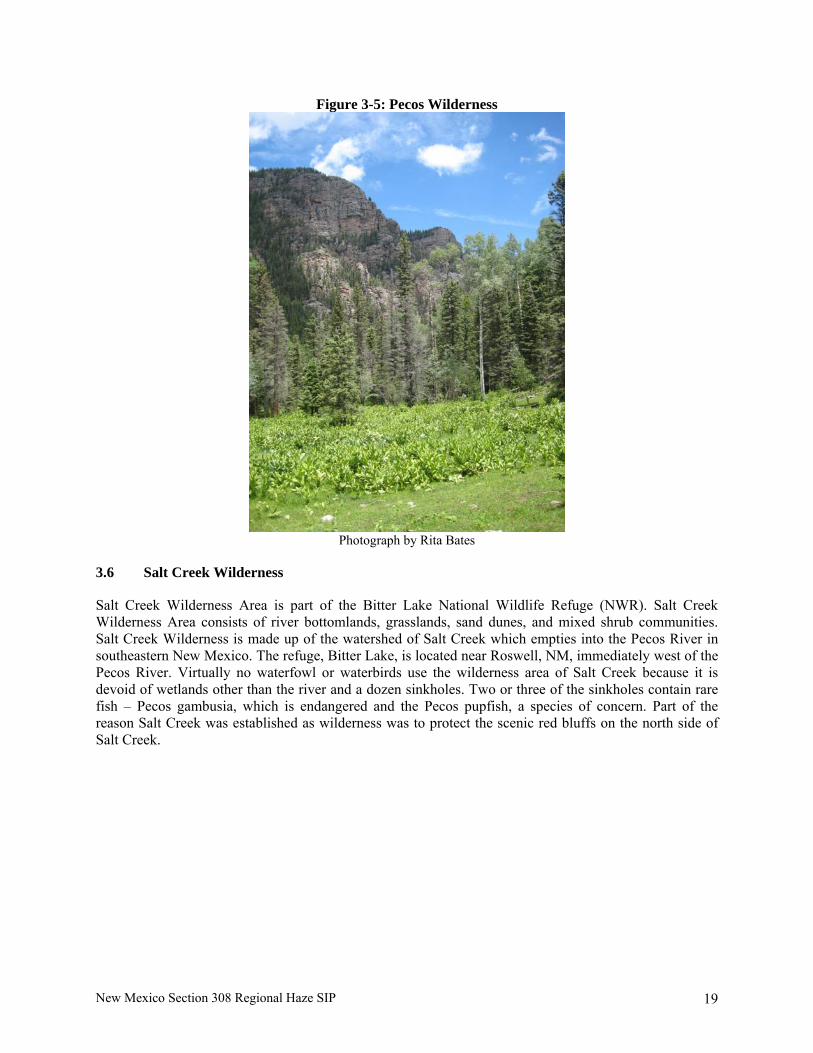
New Mexico Section 308 Regional Haze SIP 19
Figure 3-5: Pecos Wilderness
Photograph by Rita Bates
3.6 Salt Creek Wilderness
Salt Creek Wilderness Area is part of the Bitter Lake National Wildlife Refuge (NWR). Salt Creek Wilderness Area consists of river bottomlands, grasslands, sand dunes, and mixed shrub communities. Salt Creek Wilderness is made up of the watershed of Salt Creek which empties into the Pecos River in southeastern New Mexico. The refuge, Bitter Lake, is located near Roswell, NM, immediately west of the Pecos River. Virtually no waterfowl or waterbirds use the wilderness area of Salt Creek because it is devoid of wetlands other than the river and a dozen sinkholes. Two or three of the sinkholes contain rare fish – Pecos gambusia, which is endangered and the Pecos pupfish, a species of concern. Part of the reason Salt Creek was established as wilderness was to protect the scenic red bluffs on the north side of Salt Creek.
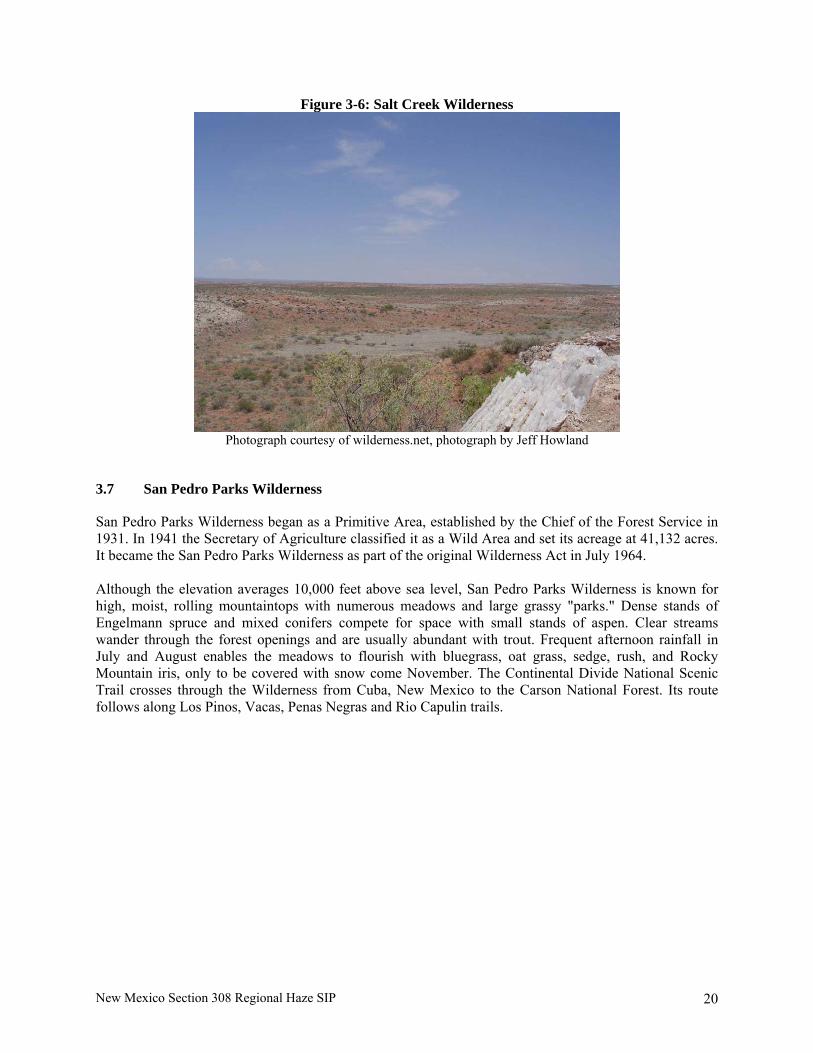
New Mexico Section 308 Regional Haze SIP 20
Figure 3-6: Salt Creek Wilderness
Photograph courtesy of wilderness.net, photograph by Jeff Howland
3.7 San Pedro Parks Wilderness
San Pedro Parks Wilderness began as a Primitive Area, established by the Chief of the Forest Service in 1931. In 1941 the Secretary of Agriculture classified it as a Wild Area and set its acreage at 41,132 acres. It became the San Pedro Parks Wilderness as part of the original Wilderness Act in July 1964. Although the elevation averages 10,000 feet above sea level, San Pedro Parks Wilderness is known for high, moist, rolling mountaintops with numerous meadows and large grassy "parks." Dense stands of Engelmann spruce and mixed conifers compete for space with small stands of aspen. Clear streams wander through the forest openings and are usually abundant with trout. Frequent afternoon rainfall in July and August enables the meadows to flourish with bluegrass, oat grass, sedge, rush, and Rocky Mountain iris, only to be covered with snow come November. The Continental Divide National Scenic Trail crosses through the Wilderness from Cuba, New Mexico to the Carson National Forest. Its route follows along Los Pinos, Vacas, Penas Negras and Rio Capulin trails.

New Mexico Section 308 Regional Haze SIP 21
Figure 3-7: San Pedro Parks Wilderness
Photograph courtesy of Rita Bates
3.8 Wheeler Peak Wilderness
Lying along the top of the Sangre De Cristo mountain range, Wheeler Peak Wilderness is characterized by high rugged terrain. Elevations range from a low of 7,650 feet to a high of 13,161 feet at Wheeler Peak, the highest point in the State of New Mexico. Marmots, pikas, elk, mule deer, and golden eagles are found in the Wheeler Peak Wilderness. Above Taos Ski Valley, the Rio Hondo has a natural population of cutthroat trout as does Sawmill Creek. From the cottonwoods along the Rio Hondo to the Bristlecone pines guarding the peaks, Wheeler Peak Wilderness has almost all of the trees native to Northern New Mexico. Englemann spruce and sub-alpine fir are the predominant tree species. Because Wheeler Peak is so high, it is one of the only places in the State to see a true alpine "mat" as opposed to grasses that grow in other high alpine locales. The "mat" produces beautiful brilliantly colored flowers. The average annual precipitation is 34-40 inches, with about half the total from summer rains and half from winter snows. Average annual temperatures range between 80 degrees in the summer to 20 degrees below zero in the winter.

New Mexico Section 308 Regional Haze SIP 22
Figure 3-8: Wheeler Peak Wilderness
Photograph courtesy of wilderness.net, photograph by Steve Boutcher
3.9 White Mountain Wilderness
The White Mountain Wilderness lies entirely within the Smokey Bear Ranger District of the Lincoln National Forest. The Wilderness is 12.5 miles long and ranges from 4 to 12 miles wide. The Wilderness consists mainly of a long, northerly running ridge and its branches. The west side of the ridge is steep and extremely rugged with many extensive rock outcroppings, while the eastern side is more gentle with broader, forested canyons and a few tiny streams. Elevations range from a low of 6,400 feet at Three River Campground on the west side to a high of 11,580 feet near Lookout Mountain on the south. From Three Rivers to the crest there are four different life zones: piñon-juniper, ponderosa pine, mixed conifer, and sub-alpine forest. Abrupt changes in elevation, escarpments, rock outcrops, and avalanche chutes make for striking contrast and scenery. Interspersed along the crest are several meadows as well as some grass-oak savannahs, which are the result of fires. The weather too, is directly related to elevation. Springtime is usually dry and windy throughout the wilderness. July and August are the rainy months with frequent afternoon showers. In summer, while the desert is sweltering, the high country will likely be cool. Autumn is a beautiful time of year with oaks, maples, and aspens adding splashes of color to the hillsides. The days are usually cool and sunny with little wind. Winter in the wilderness brings a time of quiet beauty. Snowfall usually begins during the mid to latter part of November and can continue on through June. During the winter months, the higher elevations may be under six or more feet of snow while it is comfortably warm at the 6,000 feet level.

New Mexico Section 308 Regional Haze SIP 23
Figure 3-9: White Mountain Wilderness
Photograph courtesy of wilderness.net, photograph by Deidre St. Louis
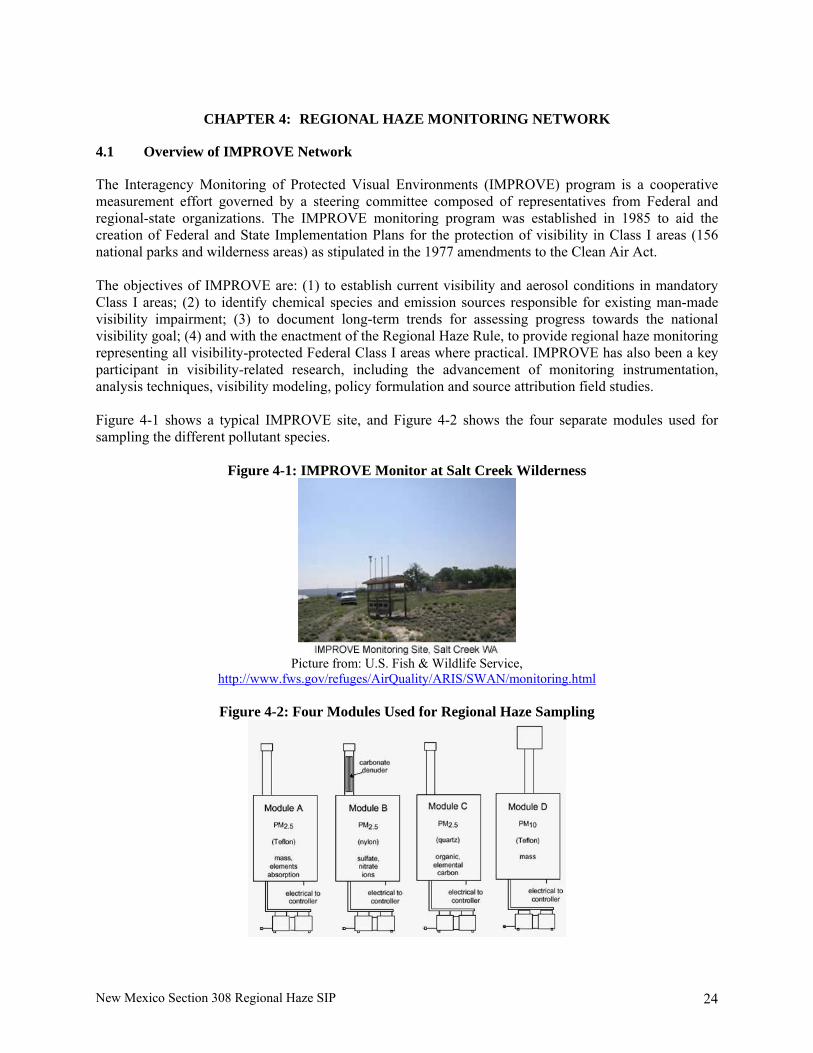
New Mexico Section 308 Regional Haze SIP 24
CHAPTER 4: REGIONAL HAZE MONITORING NETWORK
4.1 Overview of IMPROVE Network
The Interagency Monitoring of Protected Visual Environments (IMPROVE) program is a cooperative measurement effort governed by a steering committee composed of representatives from Federal and regional-state organizations. The IMPROVE monitoring program was established in 1985 to aid the creation of Federal and State Implementation Plans for the protection of visibility in Class I areas (156 national parks and wilderness areas) as stipulated in the 1977 amendments to the Clean Air Act. The objectives of IMPROVE are: (1) to establish current visibility and aerosol conditions in mandatory Class I areas; (2) to identify chemical species and emission sources responsible for existing man-made visibility impairment; (3) to document long-term trends for assessing progress towards the national visibility goal; (4) and with the enactment of the Regional Haze Rule, to provide regional haze monitoring representing all visibility-protected Federal Class I areas where practical. IMPROVE has also been a key participant in visibility-related research, including the advancement of monitoring instrumentation, analysis techniques, visibility modeling, policy formulation and source attribution field studies. Figure 4-1 shows a typical IMPROVE site, and Figure 4-2 shows the four separate modules used for sampling the different pollutant species.
Figure 4-1: IMPROVE Monitor at Salt Creek Wilderness
Picture from: U.S. Fish & Wildlife Service,
http://www.fws.gov/refuges/AirQuality/ARIS/SWAN/monitoring.html
Figure 4-2: Four Modules Used for Regional Haze Sampling
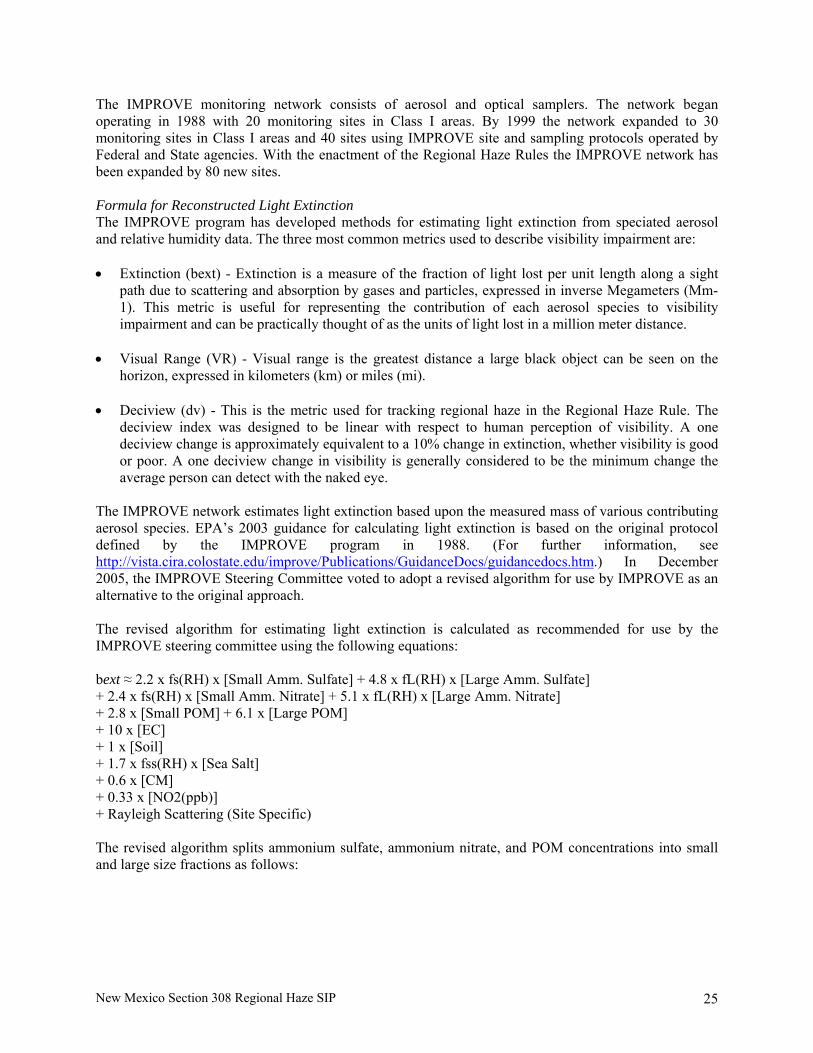
New Mexico Section 308 Regional Haze SIP 25
The IMPROVE monitoring network consists of aerosol and optical samplers. The network began operating in 1988 with 20 monitoring sites in Class I areas. By 1999 the network expanded to 30 monitoring sites in Class I areas and 40 sites using IMPROVE site and sampling protocols operated by Federal and State agencies. With the enactment of the Regional Haze Rules the IMPROVE network has been expanded by 80 new sites. Formula for Reconstructed Light Extinction The IMPROVE program has developed methods for estimating light extinction from speciated aerosol and relative humidity data. The three most common metrics used to describe visibility impairment are: • Extinction (bext) - Extinction is a measure of the fraction of light lost per unit length along a sight
path due to scattering and absorption by gases and particles, expressed in inverse Megameters (Mm-1). This metric is useful for representing the contribution of each aerosol species to visibility impairment and can be practically thought of as the units of light lost in a million meter distance.
• Visual Range (VR) - Visual range is the greatest distance a large black object can be seen on the
horizon, expressed in kilometers (km) or miles (mi). • Deciview (dv) - This is the metric used for tracking regional haze in the Regional Haze Rule. The
deciview index was designed to be linear with respect to human perception of visibility. A one deciview change is approximately equivalent to a 10% change in extinction, whether visibility is good or poor. A one deciview change in visibility is generally considered to be the minimum change the average person can detect with the naked eye.
The IMPROVE network estimates light extinction based upon the measured mass of various contributing aerosol species. EPA’s 2003 guidance for calculating light extinction is based on the original protocol defined by the IMPROVE program in 1988. (For further information, see http://vista.cira.colostate.edu/improve/Publications/GuidanceDocs/guidancedocs.htm.) In December 2005, the IMPROVE Steering Committee voted to adopt a revised algorithm for use by IMPROVE as an alternative to the original approach. The revised algorithm for estimating light extinction is calculated as recommended for use by the IMPROVE steering committee using the following equations: bext ≈ 2.2 x fs(RH) x [Small Amm. Sulfate] + 4.8 x fL(RH) x [Large Amm. Sulfate] + 2.4 x fs(RH) x [Small Amm. Nitrate] + 5.1 x fL(RH) x [Large Amm. Nitrate] + 2.8 x [Small POM] + 6.1 x [Large POM] + 10 x [EC] + 1 x [Soil] + 1.7 x fss(RH) x [Sea Salt] + 0.6 x [CM] + 0.33 x [NO2(ppb)] + Rayleigh Scattering (Site Specific) The revised algorithm splits ammonium sulfate, ammonium nitrate, and POM concentrations into small and large size fractions as follows:

New Mexico Section 308 Regional Haze SIP 26
4.2 New Mexico IMPROVE Monitoring Network
In New Mexico, there are seven IMPROVE monitors listed in Table 4-1, that collect data for regional haze monitoring. There are nine Class I areas in New Mexico. The IMPROVE monitor for Carlsbad Caverns is located in Texas at Guadalupe Mountains National Park. The IMPROVE monitor for the Wheeler Peak Wilderness Area is used to represent visibility conditions at the nearby Pecos Wilderness. Although it is desirable to have one monitor for each Class I area, in most cases one monitor is “representative” of haze conditions in nearby Class I areas. Figure 4-3 shows the locations of the IMPROVE monitors in New Mexico.
Table 4-1: IMPROVE Monitors in New Mexico
Site Name Site Code Class I Area Sponsor Elevation MSL (ft) Start Date
Bandelier NM BAND1 Bandelier Wilderness NPS 6,523 3/2/1988 Bosque del Apache BOAP1 Bosque del Apache NWR FWS 4,560 4/5/2000 Gila Wilderness GICL1 Gila Wilderness USFS 5,825 4/15/1994 Guadalupe Mountains National Park (TX) GUMO1 Carlsbad Caverns NP NPS 5,338 3/2/1988
Salt Creek SACR1 Salt Creek Wilderness FWS 3,518 4/6/2000 San Pedro Parks SAPE1 San Pedro Parks Wilderness USFS 9,629 8/15/2000
Wheeler Peak WHPE1 Wheeler Peak Wilderness, Pecos Wilderness USFS 11,043 8/15/2000
White Mountain WHIT1 White Mountain Wilderness USFS 6,770 1/15/2002

New Mexico Section 308 Regional Haze SIP 27
Figure 4-3: Map of New Mexico IMPROVE Sites
4.2.1 Bandelier Wilderness
The IMPROVE monitoring site representing the Bandelier Wilderness is BAND1, located near a fire tower on a ridge crest just outside of the eastern Wilderness boundary at an elevation of 6,517 feet. The BAND1 IMPROVE site is in an exposed location at an elevation near the middle of the range of Wilderness elevations and about 1,000 feet above the Rio Grande at the bottom of the canyon. Highest Wilderness elevations are typically about 1,000 feet above the monitoring site. BAND1 should be very representative of Wilderness locations, although lower Wilderness canyon bottom elevations, that comprise a very small part of the Wilderness area, may at times be within a lower surface inversion.
Figure 4-4: Bandelier National Monument

New Mexico Section 308 Regional Haze SIP 28
4.2.2 Bosque del Apache National Wildlife Refuge
The IMPROVE monitoring site representing the Bosque del Apache is BOAP1, at the northern boundary near the Rio Grande, at an elevation of 1,383 m (4,536 ft). Given the narrow range of elevations in the Bosque del Apache, the BOAP1 IMPROVE should be very representative of aerosol concentration and composition within the class I area.
Figure 4-5: Bosque del Apache National Wildlife Refuge
4.2.3 Carlsbad Caverns National Park
The IMPROVE monitoring site representing Carlsbad Caverns National Park is GUMO1 (Guadalupe Mountains), located about 25 km (15 mi) southwest in mountainous terrain near the crest of the Delaware Mountain Range at an elevation of 1,674 m (5,492 ft). It has good exposure to regional scale winds and may be influenced by wind blown dust from the dry lake (bare ground) in western Texas, as well as from the Mexican dry/barren region to the southwest. Near the monitoring site ground cover is desert vegetation (shrub land and grassland, etc). Aerosol data collected at the GUMO1 IMPROVE site should be very representative of aerosol characteristics within Carlsbad Caverns NP, especially at higher elevations.
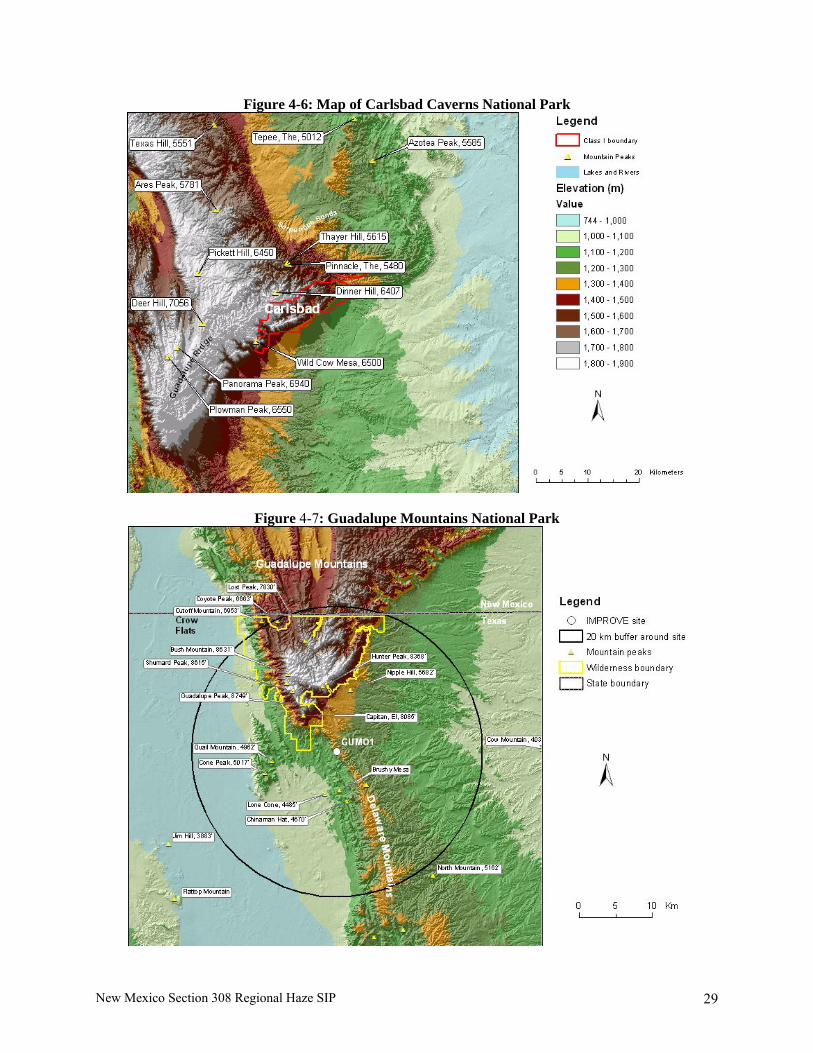
New Mexico Section 308 Regional Haze SIP 29
Figure 4-6: Map of Carlsbad Caverns National Park
Figure 4-7: Guadalupe Mountains National Park

New Mexico Section 308 Regional Haze SIP 30
4.2.4 Gila Wilderness
The IMPROVE monitoring site representing the Gila Wilderness is GICL1, located on a bank just overlooking the Gila River in the east central part of the Wilderness, elevation 1,776 m (5,825 ft). The location of the Gila Wilderness IMPROVE site, GICL1, near the center of the Wilderness should make it representative of Wilderness locations when the atmosphere is well mixed. Its elevation is at the lower end of Wilderness elevations so that there may be times when it is isolated within shallow surface-based inversions that do not extend vertically to higher Wilderness elevations.
Figure 4-8: Gila Wilderness
4.2.5 Pecos Wilderness
The IMPROVE monitoring site representing the Pecos Wilderness is WHPE1 (Wheeler Peak), located about 60 km (~ 40 mi) to the north near the Wheeler Peak Wilderness at an elevation of 3,372 m (11,060 ft). The WHPE1 IMPROVE site is at a high elevation and should be very representative of Wilderness vistas at high elevations of the Sangre de Cristos, including the Pecos Wilderness. At this high elevation it may occasionally be above regional haze, and may also at times be isolated from lower valley bottom Wilderness locations contained within valley inversions.

New Mexico Section 308 Regional Haze SIP 31
Figure 4-9: Pecos Wilderness
4.2.6 Salt Creek Wilderness
The IMPROVE monitoring site representing the Salt Creek Wilderness is SACR1, located about 10 km (6 mi) south of the Wilderness at an elevation of 1,077 m (3,533 ft). The SACR1 IMPROVE should be very representative of aerosol concentration and composition in the Salt Creek Wilderness since it is at the same elevation with no intervening terrain.

New Mexico Section 308 Regional Haze SIP 32
Figure 4-10: Salt Creek Wilderness
4.2.7 San Pedro Parks Wilderness
The IMPROVE monitoring site representing the San Pedro Parks Wilderness is SAPE1, located just outside of the southern Wilderness boundary at an elevation of 2,919 m (9,574 ft). The SAPE1 IMPROVE site, with elevation approximating Wilderness elevations, should be very representative of aerosol composition and concentration at most Wilderness locations, especially higher elevation locations in the main central part of the Wilderness.
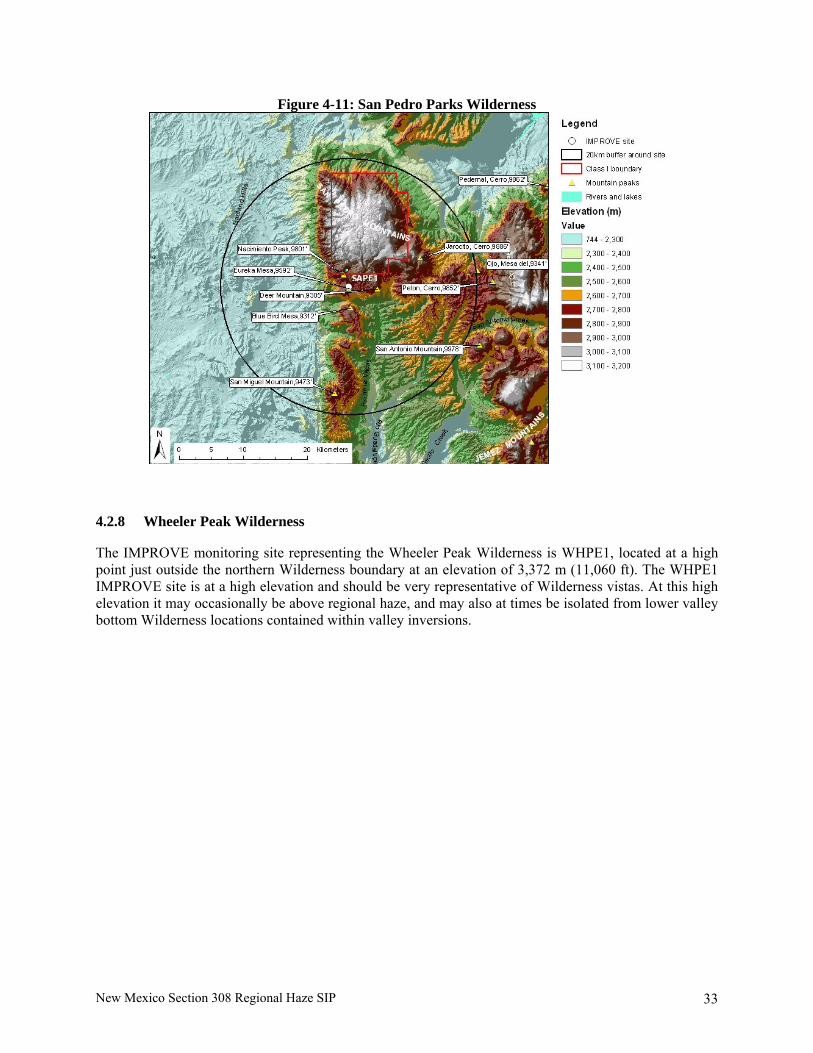
New Mexico Section 308 Regional Haze SIP 33
Figure 4-11: San Pedro Parks Wilderness
4.2.8 Wheeler Peak Wilderness
The IMPROVE monitoring site representing the Wheeler Peak Wilderness is WHPE1, located at a high point just outside the northern Wilderness boundary at an elevation of 3,372 m (11,060 ft). The WHPE1 IMPROVE site is at a high elevation and should be very representative of Wilderness vistas. At this high elevation it may occasionally be above regional haze, and may also at times be isolated from lower valley bottom Wilderness locations contained within valley inversions.

New Mexico Section 308 Regional Haze SIP 34
Figure 4-12: Wheeler Peak Wilderness
4.2.9 White Mountain Wilderness
The IMPROVE monitoring site representing the White Mountain Wilderness is WHIT1, located on a low ridge between Rio Bonito and Little Creek, near the Sierra Blanca regional airport about 15 km east of the Wilderness at an elevation of 2,050 m (6,724 ft). The WHIT1 IMPROVE site is on a well-exposed low ridge at an elevation near lower Wilderness elevations. It should be representative of Wilderness locations, especially during downslope flow conditions that bring Wilderness air towards the monitor via the Rio Bonito and Little Creek drainages.

New Mexico Section 308 Regional Haze SIP 35
Figure 4-13: White Mountain Wilderness
4.3 New Mexico Regional Haze Monitoring Commitments
The State of New Mexico will rely upon a Regional Planning Organization’s provision of adequate technical support to meet its commitment to conduct the analyses necessary to meet the requirements of 51.308(d)(4). The State of New Mexico will depend on the Inter-Agency Monitoring of PROtected Visual Environments (IMPROVE) monitoring program to collect and report aerosol monitoring data for long-term reasonable progress tracking as specified in 40 CFR 51.308(d)(4) of the Regional Haze Rule (RHR). Because the RHR is a long-term tracking program with an implementation period nominally set for 60 years, NMED expects that the IMPROVE program will provide data based on the following goals:
1. Maintain a stable configuration of the individual monitors and sampling sites, and stability in network operations for the purpose of continuity in tracking reasonable progress trends;
2. Assure sufficient data capture at each site of all visibility-impairing species; 3. Comply with EPA quality control and assurance requirements; and 4. Prepare and disseminate periodic reports on IMPROVE program operations.
The State of New Mexico is relying on the IMPROVE program to meet these monitoring operation and data collection goals, with the fundamental assumption that network data collection operations will not change, or if changed, will remain directly comparable to those operated by the IMPROVE program during the 2000-2004 RHR baseline period. Technical analyses and reasonable progress goals in this Implementation Plan for Regional Haze are based on data from these sites. As such, the State will ask that the IMPROVE program identify potential issues affecting RHR implementation trends and/or notify the State before changes in the IMPROVE program affecting a RHR tracking site are made.

New Mexico Section 308 Regional Haze SIP 36
Further, the State of New Mexico notes that the human resources to operate these monitors are provided by Federal Land Management agencies. Beyond that in-kind contribution, resources for operation and sample analysis of a complete and representative monitoring network of these long-term reasonable progress tracking sites by the IMPROVE program are a collaborative responsibility of EPA, states, tribes, and FLMs and the IMPROVE program steering committee. The State of New Mexico will collaborate with the EPA, FLMs, other states, tribes, and the IMPROVE committee to assure adequate and representative data collection and reporting by the IMPROVE program.

New Mexico Section 308 Regional Haze SIP 37
CHAPTER 5: TECHNICAL INFORMATION AND DATA
This chapter describes the information relied upon in developing this plan. It describes the Western Regional Air Partnership (WRAP), committees and workgroups of the WRAP, and work products developed by WRAP that were used to develop this plan.
5.1 WRAP and Technical Support
The WRAP is a voluntary organization of western States, Tribes and federal agencies. It was formed in 1997 as the successor to the Grand Canyon Visibility Transport Commission (GCVTC). It is a regional planning organization that provides assistance to western States to aid in the preparation of regional haze plans. The WRAP also implements regional planning processes to improve visibility in all Western Class I areas by providing the technical and policy tools needed by States and Tribes to implement the federal regional haze rule. The States that have been involved with WRAP include: Alaska, Arizona, California, Colorado, Idaho, Montana, New Mexico, North Dakota, Oregon, South Dakota, Utah, Washington, and Wyoming. Tribal board members included Campo Band of Kumeyaay Indians, Confederated Salish and Kootenai Tribes, Cortina Indian Rancheria, Hopi Tribe, Hualapai Nation of the Grand Canyon, Native Village of Shungnak, Nez Perce Tribe, Northern Cheyenne Tribe, Pueblo of Acoma, Pueblo of San Felipe, and Shoshone-Bannock Tribes of Fort Hall. Representatives of other tribes participate on WRAP forums and committees. Participation is encouraged throughout the Western states and tribes. Federal participants are the Department of the Interior (National Park Service and Fish & Wildlife Service,) the Department of Agriculture (Forest Service), and the Environmental Protection Agency (EPA).
5.1.1 WRAP Committees and Workgroups
The following is a description of WRAP Committees and Workgroups that were operational during the development of the tools and information used in this SIP:
Initiatives Oversight Committee The Initiatives Oversight Committee (IOC) is responsible for establishing and overseeing the work of forums that develop policies and programs to improve and protect our air quality. IOC forums are: The Air Pollution Prevention Forum The Air Pollution Prevention Forum is tasked with developing energy conservation initiatives and programs to expand the use of renewable energy sources, and encourage use of energy sources that minimize air pollution. The Economic Analysis Forum This Forum assisted with studies to evaluate the economic effects of air quality programs developed by the WRAP to diminish haze throughout the West. The Forum on Emissions In/Near Class 1 Areas This Forum looked at pollution sources in and near federally mandated Class 1 areas to determine their impact on visibility in those areas, and at mitigation and outreach options.
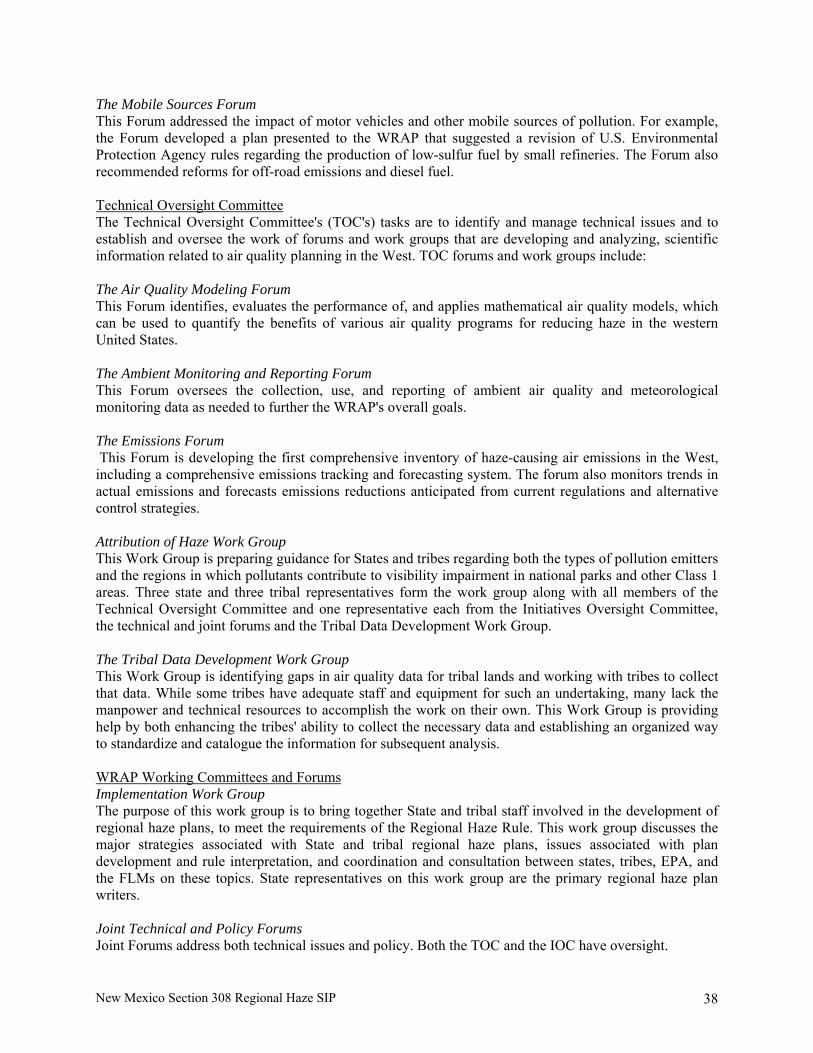
New Mexico Section 308 Regional Haze SIP 38
The Mobile Sources Forum This Forum addressed the impact of motor vehicles and other mobile sources of pollution. For example, the Forum developed a plan presented to the WRAP that suggested a revision of U.S. Environmental Protection Agency rules regarding the production of low-sulfur fuel by small refineries. The Forum also recommended reforms for off-road emissions and diesel fuel. Technical Oversight Committee The Technical Oversight Committee's (TOC's) tasks are to identify and manage technical issues and to establish and oversee the work of forums and work groups that are developing and analyzing, scientific information related to air quality planning in the West. TOC forums and work groups include: The Air Quality Modeling Forum This Forum identifies, evaluates the performance of, and applies mathematical air quality models, which can be used to quantify the benefits of various air quality programs for reducing haze in the western United States. The Ambient Monitoring and Reporting Forum This Forum oversees the collection, use, and reporting of ambient air quality and meteorological monitoring data as needed to further the WRAP's overall goals. The Emissions Forum This Forum is developing the first comprehensive inventory of haze-causing air emissions in the West, including a comprehensive emissions tracking and forecasting system. The forum also monitors trends in actual emissions and forecasts emissions reductions anticipated from current regulations and alternative control strategies. Attribution of Haze Work Group This Work Group is preparing guidance for States and tribes regarding both the types of pollution emitters and the regions in which pollutants contribute to visibility impairment in national parks and other Class 1 areas. Three state and three tribal representatives form the work group along with all members of the Technical Oversight Committee and one representative each from the Initiatives Oversight Committee, the technical and joint forums and the Tribal Data Development Work Group. The Tribal Data Development Work Group This Work Group is identifying gaps in air quality data for tribal lands and working with tribes to collect that data. While some tribes have adequate staff and equipment for such an undertaking, many lack the manpower and technical resources to accomplish the work on their own. This Work Group is providing help by both enhancing the tribes' ability to collect the necessary data and establishing an organized way to standardize and catalogue the information for subsequent analysis. WRAP Working Committees and Forums Implementation Work Group The purpose of this work group is to bring together State and tribal staff involved in the development of regional haze plans, to meet the requirements of the Regional Haze Rule. This work group discusses the major strategies associated with State and tribal regional haze plans, issues associated with plan development and rule interpretation, and coordination and consultation between states, tribes, EPA, and the FLMs on these topics. State representatives on this work group are the primary regional haze plan writers. Joint Technical and Policy Forums Joint Forums address both technical issues and policy. Both the TOC and the IOC have oversight.

New Mexico Section 308 Regional Haze SIP 39
The Dust Emissions Joint Forum This Dust Emissions Joint Forum (DEJF) seeks to improve the methods for estimating dust emissions and their inputs into air quality models. The Forum also is examining the extent of dust impacts and strategies to reduce dust emissions. The Fire Emissions Joint Forum (FEJF) The Grand Canyon Commission confirmed that forest fires contribute significantly to visibility problems and that the use of prescribed fire is expected to increase as a forest management tool. The FEJF is developing measures to reduce the effects of emissions from prescribed fires and is examining emissions from all kinds of fire, whether ignited naturally or by humans. The Forum is considering public health and nuisance effects as well as visibility impacts. It will develop a tracking system for fire emissions and management techniques to minimize emissions. This Forum is working to coordinate with and gain the full cooperation of federal, tribal, State, and local agencies as well as private landowners, forest managers, and the agriculture community. The Stationary Sources Joint Forum The Stationary Sources Joint Forum (SSJF), formerly the Market Trading Forum, developed the details of an emissions trading program to achieve cost-effective reductions from industrial sources of sulfur dioxide. The Forum first set emission milestones for sulfur dioxide between now and 2018 and then designed a trading program to be triggered if these emission targets are exceeded. The Forum is now examining other industrial source emissions, such as oxides of nitrogen and particulate matter, and is assisting WRAP members in compliance with the stationary source provisions of the regional haze rule.
5.1.2 WRAP Technical Support System
The primary purpose of the WRAP TSS is to provide key summary analytical results and methods documentation for the required technical elements of the Regional Haze Rule, to support the preparation, completion, evaluation, and implementation of the Regional Haze Implementation Plans to improve visibility in Class I areas. The TSS provides technical results prepared using a regional approach, to include summaries and analysis of the comprehensive datasets used to identify the sources and regions contributing to regional haze in the WRAP region. The secondary purpose of the TSS is to be the one-stop-shop for access, visualization, analysis, and retrieval of the technical data and regional analytical results prepared by WRAP Forums and Workgroups in support of regional haze planning in the West. The TSS specifically summarizes results and consolidates information about air quality monitoring, meteorological and receptor modeling data analyses, emissions inventories and models, and gridded air quality/visibility regional modeling simulations. These copious and diverse data are integrated for application to air quality planning purposes by prioritizing and refining key information and results into explanatory tools. The WRAP TSS can be found at http://vista.cira.colostate.edu/tss/.

New Mexico Section 308 Regional Haze SIP 40
CHAPTER 6: NEW MEXICO CLASS ONE AREA BASELINE, NATURAL CONDITIONS, AND UNIFORM RATE OF PROGRESS
6.1 Baseline and Current Visibility Conditions
EPA requires the calculation of baseline conditions [40 CFR 51.308(d)(2)(i) and (ii)]. The baseline condition for each New Mexico Class I area is defined as the five year average (annual values for 2000-2004) of IMPROVE monitoring data (expressed in deciviews) for the most impaired (20% worst) days and the least impaired (20% best) days. For this regional haze SIP submittal, the baseline conditions are the reference point against which visibility improvement is tracked. For subsequent regional haze SIP updates (in the year 2018 and every 10 years thereafter), baseline conditions are used to calculate progress from the beginning of the regional haze program. Current conditions for the best and worst days are calculated from a multiyear average, based on the most recent five-year of monitored data available [40 CFR 51.308(f)(1)]. This value will be revised at the time of each periodic SIP revision and will be used to illustrate the following: 1) the amount of progress made since the last SIP revision, and 2) the amount of progress made from the baseline period of the program. New Mexico has established baseline visibility for the best and worst visibility days for each Class I area using on-site data from the IMPROVE monitoring sites. A five-year average (2000-2004) was calculated for each value (both best and worst). The calculations were made in accordance with 40 CFR 51.308(d)(2) and EPA's Guidance for Tracking Progress Under the Regional Haze Rule (EPA-454/B-03-004, September 2003). The IMPROVE II algorithm as described in Section 4.1 has been utilized for the calculation of Uniform Rate of Progress (URP) glide slopes for all Class I areas. Table 6-1 shows the baseline conditions for each IMPROVE monitor site in New Mexico.
Table 6-1: Baseline Conditions for 20% Worst Days
Mandatory Federal Class I Area IMPROVE Monitor
Baseline Conditions for 20% Worst
Visibility Days (dv) Bandelier Wilderness BAND1 12.22 Bosque del Apache NWR BOAP1 13.8 Carlsbad Caverns NP GUMO1 17.19 Gila Wilderness GICL1 13.11 Pecos Wilderness, Wheeler Peak Wilderness WHPE1 10.41 Salt Creek Wilderness SACR1 18.03 San Pedro Parks Wilderness SAPE1 10.17 White Mountain Wilderness WHIT1 13.7

New Mexico Section 308 Regional Haze SIP 41
Table 6-2: Baseline Conditions for 20% Best Days
Mandatory Federal Class I Area IMPROVE Monitor
Baseline Conditions for 20% Best
Visibility Days (dv) Bandelier Wilderness BAND1 4.95 Bosque del Apache NWR BOAP1 6.28 Carlsbad Caverns NP GUMO1 5.95 Gila Wilderness GICL1 3.31 Pecos Wilderness, Wheeler Peak Wilderness WHPE1 1.22 Salt Creek Wilderness SACR1 7.84 San Pedro Parks Wilderness SAPE1 1.45 White Mountain Wilderness WHIT1 3.55
6.3 Monitoring Data
Visibility impairing pollutants both reflect and absorb light in the atmosphere, thereby affecting the clarity of objects viewed at a distance by the human eye. Each haze pollutant has a different light extinction capability. In addition, relative humidity changes the effective light extinction of both nitrates and sulfates. Since haze pollutants can be present in varying amounts at different locations throughout the year, aerosol measurements of each visibility impairing pollutant are made every three days at the IMPROVE monitors located in or near each Class I area. In addition to extinction, the Regional Haze Rule requires another metric for analyzing visibility impairment, known as the "Haze Index", which is based on the smallest unit of uniform visibility changes that can be perceived by the human eye. The unit of measure of the deciview (dv). The haze pollutants reported by the IMPROVE monitoring program are sulfates, nitrates, organic carbon, elemental carbon, fine soil, and coarse mass. Summary data in Chapter 12 are provided for the worst and best days for baseline conditions from the eight IMPROVE monitors for the six haze pollutants.
6.4 Natural Visibility Conditions
The natural condition for each Class I area represents the visibility goal expressed in deciviews for the 20% worst visibility days and the 20% best visibility days that would exist if there were no naturally or anthropogenic impairment. The 20% worst days natural conditions correspond to the visibility goals for each Class I area to be reached by 2064 [40 CFR 51.308(d)(iii)]. Table 6-3 provides the 2064 natural conditions goal in deciviews for each New Mexico Class I area. The natural conditions estimates were calculated consistent with EPA's Guidance for Estimating Natural Visibility Conditions Under the Regional Haze Rule (EPA-454/B-03-005, September 2003). The natural conditions goal can be adjusted as new visibility information becomes available.

New Mexico Section 308 Regional Haze SIP 42
Table 6-3: 2064 Natural Conditions Goal for 20% Worst Days
Mandatory Federal Class I Area IMPROVE Monitor
2064 Natural Conditions for 20% Worst Visibility Days (dv)
Bandelier Wilderness BAND1 6.26 Bosque del Apache NWR BOAP1 6.73 Carlsbad Caverns NP GUMO1 6.65 Gila Wilderness GICL1 6.66 Pecos Wilderness, Wheeler Peak Wilderness WHPE1 6.08 Salt Creek Wilderness SACR1 6.81 San Pedro Parks Wilderness SAPE1 5.72 White Mountain Wilderness WHIT1 6.8
6.5 Uniform Progress
For the 20% worst days, uniform progress for each Class I area is the calculation of a URP goal per year to achieve natural conditions in 60 years [40 CFR 51.308(d)(1)(i)(B)]. In this SIP submittal, the first benchmark is the 2018 deciview level based on the uniform rate of progress (URP) applied to the first fourteen years of the program. This is also shown in Table 6-3 in the column titled "2018 URP Goal". For the 20% worst days, the uniform rate of progress (URP) in deciviews per year (i.e., slope of the glide path) is determined by the following equation: URP = [Baseline Condition – Natural Condition]/60 years Multiplying the URP by the number of years in the first planning period calculates the uniform progress needed by 2018 in order to be on the glidepath towards achieving the 2064 natural conditions goal. 2018 UPG = [URP] x [14 years] The first planning period spans 14 years, which includes the four years between the end of the baseline period and the SIP submittal plus the standard 10 year planning period for the subsequent SIP revisions. More detailed information on the 20% worst visibility days along with the glide slope associated with each Class I area can be found in Chapter 9. The calculations are consistent with EPA's Guidance for Setting Reasonable Progress Goals Under the Regional Haze Rule (June 1, 2007). For the 20% best visibility days at each Class I area, the State must ensure no degradation in visibility for the least impaired days over the same period. Table 6-4 shows the 2018 URP for the 20% worst days and the baseline that must not be exceeded over the years in order to maintain the best days. As with natural conditions, the URP can be adjusted as new visibility information becomes available.
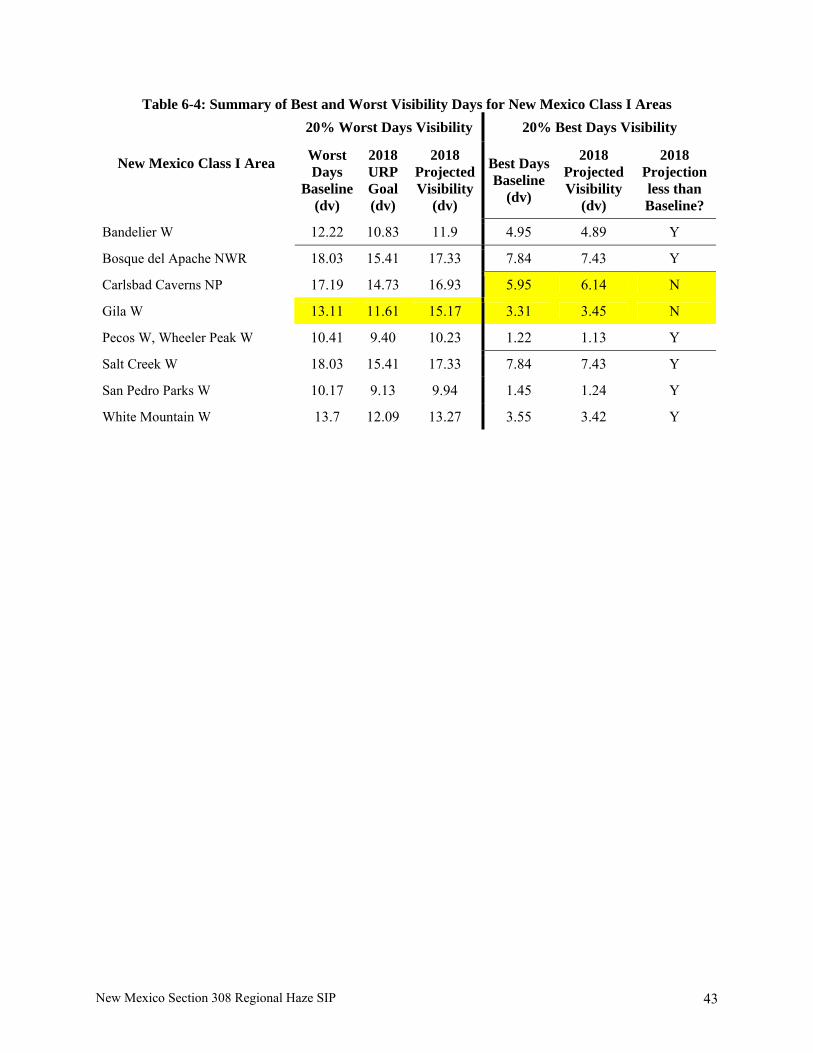
New Mexico Section 308 Regional Haze SIP 43
Table 6-4: Summary of Best and Worst Visibility Days for New Mexico Class I Areas 20% Worst Days Visibility 20% Best Days Visibility
New Mexico Class I Area Worst Days
Baseline (dv)
2018 URP Goal (dv)
2018 Projected Visibility
(dv)
Best Days Baseline
(dv)
2018 Projected Visibility
(dv)
2018 Projection less than Baseline?
Bandelier W 12.22 10.83 11.9 4.95 4.89 Y
Bosque del Apache NWR 18.03 15.41 17.33 7.84 7.43 Y
Carlsbad Caverns NP 17.19 14.73 16.93 5.95 6.14 N
Gila W 13.11 11.61 15.17 3.31 3.45 N
Pecos W, Wheeler Peak W 10.41 9.40 10.23 1.22 1.13 Y
Salt Creek W 18.03 15.41 17.33 7.84 7.43 Y
San Pedro Parks W 10.17 9.13 9.94 1.45 1.24 Y
White Mountain W 13.7 12.09 13.27 3.55 3.42 Y

New Mexico Section 308 Regional Haze SIP 44
CHAPTER 7: VISIBILITY IMPAIRMENT AT NEW MEXICO CLASS I AREAS
This chapter provides a summary of visibility impairment at the Class I areas covered in this plan. Data was gathered from the IMPROVE monitoring sites for each Class I area. Each section includes a summary of the pollutants causing visibility impairment and a summary of the visibility improvement needed from baseline (2000-2004) to the 2018 URP goal, and to the 2064 natural condition goal. The visibility impairing pollutants described in this section include: ammonium nitrate, ammonium sulfate, elemental carbon, organic mass carbon, coarse mass, fine soil, and sea salt. Table 7-1 lists the pollutants, their abbreviations, and associated colors. Figure 7-1 and Figure 7-2 show, for the worst days and best days respectively, the impairment at each of the Class 1 areas during the baseline period due toeach visibility impairing pollutant.
Table 7-1: IMPROVE Monitor Aerosol Composition
Color Pollutant IMPROVE Abbreviation
Ammonium Nitrate (NO3) ammno3f_bext Ammonium Sulfate (SO4) ammso4f_bext EC (Elemental Carbon) ecf_bext OMC (Organic Mass Carbon) omcf_bext CM (Coarse Mass) cm_bext Soil (Fine Soil) soilf_bext Sea Salt seasalt_bext
Figure 7-1: Reconstructed Aerosol Components for 20% Worst Days (2000-2004)
Average Extinction for 20% Worst Days During Baseline Period (2000-2004)
0
10
20
30
40
50
60
BAND BOAP GICL GUMO SACR SAPE WHIT WHPE
Extin
ctio
n 1/
Mm
SeaSalt CM Soil EC OMC NO3 SO4

New Mexico Section 308 Regional Haze SIP 45
Figure 7-2: Reconstructed Aerosol Components for 20% Best Days (2000-2004)
Average Extinction for 20% Best Days During Baseline Period (2000-2004)
0
2
4
6
8
10
12
14
BAND BOAP GICL GUMO SACR SAPE WHPE WHIT
Extin
ctio
n 1/
Mm
SeaSalt CM Soil ECOMC NO3 SO4
7.1 Bandelier Wilderness
The pollutants affecting visibility on the worst days at Bandelier Wilderness (as represented by BAND1 IMPROVE monitor) are primarily sulfate, organic carbon, elemental carbon and coarse mass. Best days are dominated by sulfates, followed by organic carbon then coarse mass and elemental carbon. The average contributions are shown in Figure 7-3 for baseline conditions.
Figure 7-3: Average Species Contribution to 20% Best and Worst Days Baseline
Figure 7-4 shows the light extinction for all haze-impairing pollutants over the baseline period. Extinction due to sulfate varies seasonally, increasing during the summer months. A spike in organic carbon occurred in May of 2000, which correlates with the Cerro Grande Fire which started in the Bandelier

New Mexico Section 308 Regional Haze SIP 46
Wilderness. Sources of coarse mass vary throughout the year while nitrate appear to increase in the winter months (November through February).
Figure 7-4: Monthly Average Species Variation for All Sampled Days During the Baseline Period
Figure 7-5 shows the light extinction for the baseline, the URP, the 2018 projected visibility, and natural conditions for all aerosol pollutants. The projected visibility condition, based on modeling, does not meet the 2018 URP.
Figure 7-5: Baseline Worst Day Aerosol Composition Compared to 2018 URP, 2018 Projected Visibility and 2064 Natural Conditions Goal
Aerosol Composition Bandelier Class I Area
0
5
10
15
20
25
30
35
Base Conditions(2000-2004)
2018 Uniform Rateof Progress
2018 ProjectedVisibility
2064 VisibilityGoal
Extin
ctio
n 1/
Mm
SeaSaltCM Soil EC OMC NO3 SO4

New Mexico Section 308 Regional Haze SIP 47
7.2 Bosque del Apache National Wildlife Refuge
Figure 7-6 shows that over the baseline period for best and worst days, the primary contributors to impairment are sulfate, organic carbon, and coarse mass. The visibility on best days has more impairment due to sulfate, whereas on worst days, organic carbon is the primary pollutant.
Figure 7-6: Average Species Contribution to 20% Best and Worst Days Baseline
Figure 7-7 shows the species variation for all IMPROVE sampled days over the baseline period. Light extinction due to sulfate and organic carbon varies seasonally, increasing during the summer. There is a spike in organic carbon extinction (6/2002), which may be due to fire. The Rodeo/Chediski Fire in Arizona started on June 18, 2002, and the Ponil Fire in New Mexico started on June 2, 2002. Nitrate extinction appears to increase during winter months.
Figure 7-7: Monthly Average Species Variation for All Sampled Days during the Baseline Period
Figure 7-8 shows the light extinction for the baseline, the URP, the 2018 projected visibility, and natural conditions for all aerosol pollutants. The projected visibility condition, based on modeling, does not meet the 2018 URP.

New Mexico Section 308 Regional Haze SIP 48
Figure 7-8: Baseline Worst Day Aerosol Composition Compared to 2018 URP, 2018 Projected Visibility and 2064 Natural Conditions Goal
Aerosol Composition Bosque Del Apache Class I Area
0
5
10
15
20
25
30
35
Base Conditions(2000-2004)
2018 Uniform Rateof Progress
2018 ProjectedVisibility
2064 VisibilityGoal
Extin
ctio
n 1/
Mm
SeaSaltCM Soil EC OMC NO3 SO4
7.3 Carlsbad Caverns National Park
For the 20% best and worst days over the baseline period the primary contributors are sulfate, coarse mass, and organic carbon. Figure 7.9 shows that worst days are dominated by sulfate and coarse mass with a lesser contribution from organic carbon. The percentage contribution changes slightly on best days where the light extinction due to coarse mass is reduced, but sulfate and elemental carbon have a higher percentage.
Figure 7-9: Average Species Contribution to 20% Best and Worst Days Baseline

New Mexico Section 308 Regional Haze SIP 49
Figure 7-10 shows that sulfate and coarse mass increase during the summer. Extinction due to nitrates increased during the winter. Figure 7-10: Monthly Average Species Variation for All Sampled Days during the Baseline Period
Figure 7-11 shows the light extinction for the baseline, the URP, the 2018 projected visibility, and natural conditions for all aerosol pollutants. The projected visibility condition, based on modeling, does not meet the 2018 URP.
Figure 7-11: Baseline Worst Day Aerosol Composition Compared to 2018 URP, 2018 Projected Visibility and 2064 Natural Conditions Goal
Aerosol Composition Carlsbad Caverns Class I Area
0
10
20
30
40
50
60
Base Conditions(2000-2004)
2018 UniformRate of Progress
2018 ProjectedVisibility
2064 VisibilityGoal
Extin
ctio
n 1/
Mm
SeaSalt
CM
Soil
EC
OMC
NO3
SO4

New Mexico Section 308 Regional Haze SIP 50
7.4 Gila Wilderness
Figure 7-12 shows that over the baseline period for best and worst days, the primary contributors to impairment are sulfate, organic carbon, and elemental carbon. The visibility on best days has more impairment due to sulfate, whereas on worst days, organic carbon is the primary pollutant.
Figure 7-12: Average Species Contribution to 20% Best and Worst Days Baseline
The average species variation for all sampled days over the baseline period is shown in Figure 7-13. Sulfates increase during the summer months, while nitrates increase during the winter. There are a couple of spikes in light extinction due to nitrates during December 2000 and January 2001. Organic carbon and coarse mass show a slight increase in light extinction during the summer. Elemental carbon shows a different pattern, increasing in the late fall and early winter. There is a spike in organic carbon extinction (6/2002), which may be due to fire. [must verify] Figure 7-13: Monthly Average Species Variation for All Sampled Days during the Baseline Period
Figure 7-14 shows the light extinction for the baseline, the URP, the 2018 projected visibility, and natural conditions for all aerosol pollutants. The projected visibility condition, based on modeling, does not meet the 2018 URP.

New Mexico Section 308 Regional Haze SIP 51
Figure 7-14: Baseline Worst Day Aerosol Composition Compared to 2018 URP, 2018 Projected Visibility and 2064 Natural Conditions Goal
Aerosol Composition Gila Class I Area
05
1015202530354045
Base Conditions(2000-2004)
2018 Uniform Rateof Progress
2018 ProjectedVisibility
2064 VisibilityGoal
Extin
ctio
n 1/
Mm
SeaSaltCM Soil EC OMC NO3 SO4
7.5 Pecos Wilderness, Wheeler Peak Wilderness
Figure 7-15 shows that over one-third of the light extinction at the Wheeler Peak IMPROVE monitor is due to organic carbon on worst days. Sulfates are also a large contributor on worst days. Best days on dominated by sulfate, with organic carbon and coarse mass also contributing large percentages.
Figure 7-15: Average Species Contribution to 20% Best and Worst Days Baseline

New Mexico Section 308 Regional Haze SIP 52
For all IMPROVE sampled days sulfate, organic carbon, and coarse mass increase during the summer. Organic carbon showed a spike in July 2002. Extinction due to elemental carbon is relatively consistent throughout the year; however there are slight increases during the winter. Fires, especially the Rodeo-Chediski Fire in Arizona, contributed a large spike in extinction in June 2002. Figure 7-16: Monthly Average Species Variation for All Sampled Days during the Baseline Period
Figure 7-17 shows the light extinction for the baseline, the URP, the 2018 projected visibility, and natural conditions for all aerosol pollutants. The projected visibility condition, based on modeling, does not meet the 2018 URP.
Figure 7-17: Baseline Worst Day Aerosol Composition Compared to 2018 URP, 2018 Projected Visibility and 2064 Natural Conditions Goal
Aerosol Composition Wheeler Peak Class I Area
0
5
10
15
20
25
Base Conditions(2000-2004)
2018 UniformRate of Progress
2018 ProjectedVisibility
2064 VisibilityGoal
Extin
ctio
n 1/
Mm
SeaSalt CM SoilEC OMC NO3 SO4

New Mexico Section 308 Regional Haze SIP 53
7.6 Salt Creek Wilderness
Figure 7-18 shows that light extinction at the Salt Creek Wilderness is due to a mix of sulfate, nitrate, and coarse mass. Organic carbon is also a large contributor on worst days. Best days on dominated by sulfate, with organic carbon and coarse mass also contributing large percentages.
Figure 7-18: Average Species Contribution to 20% Best and Worst Days Baseline
For all IMPROVE sampled days sulfate, organic carbon, and coarse mass increase during the summer. Extinction due to elemental carbon is relatively consistent throughout the year; however there are slight increases during the winter. Figure 7-19: Monthly Average Species Variation for All Sampled Days during the Baseline Period
Figure 7-20 shows the light extinction for the baseline, the URP, the 2018 projected visibility, and natural conditions for all aerosol pollutants. The projected visibility condition, based on modeling, does not meet the 2018 URP.

New Mexico Section 308 Regional Haze SIP 54
Figure 7-20: Baseline Worst Day Aerosol Composition Compared to 2018 URP, 2018 Projected Visibility and 2064 Natural Conditions Goal
Aerosol Composition Salt Creek Class I Area
0
10
20
30
40
50
60
Base Conditions(2000-2004)
2018 Uniform Rateof Progress
2018 ProjectedVisibility
2064 Visibility Goal
Extin
ctio
n 1/
Mm
SeaSalt
CM
Soil
EC
OMC
NO3
SO4
7.7 San Pedro Parks Wilderness
Figure 7-21 shows that over the baseline period for best and worst days, the primary contributors to impairment are sulfate and organic carbon. The visibility on best days has more impairment due to sulfate, whereas on worst days, organic carbon is the primary pollutant.
Figure 7-21: Average Species Contribution to 20% Best and Worst Days Baseline
Figure 7-22 shows the species variation for all IMPROVE sampled days over the baseline period. Light extinction due to sulfate and organic carbon varies seasonally, increasing during the summer. There is a spike in organic carbon extinction (6/2002), which may be due to fire. The Rodeo/Chediski Fire in
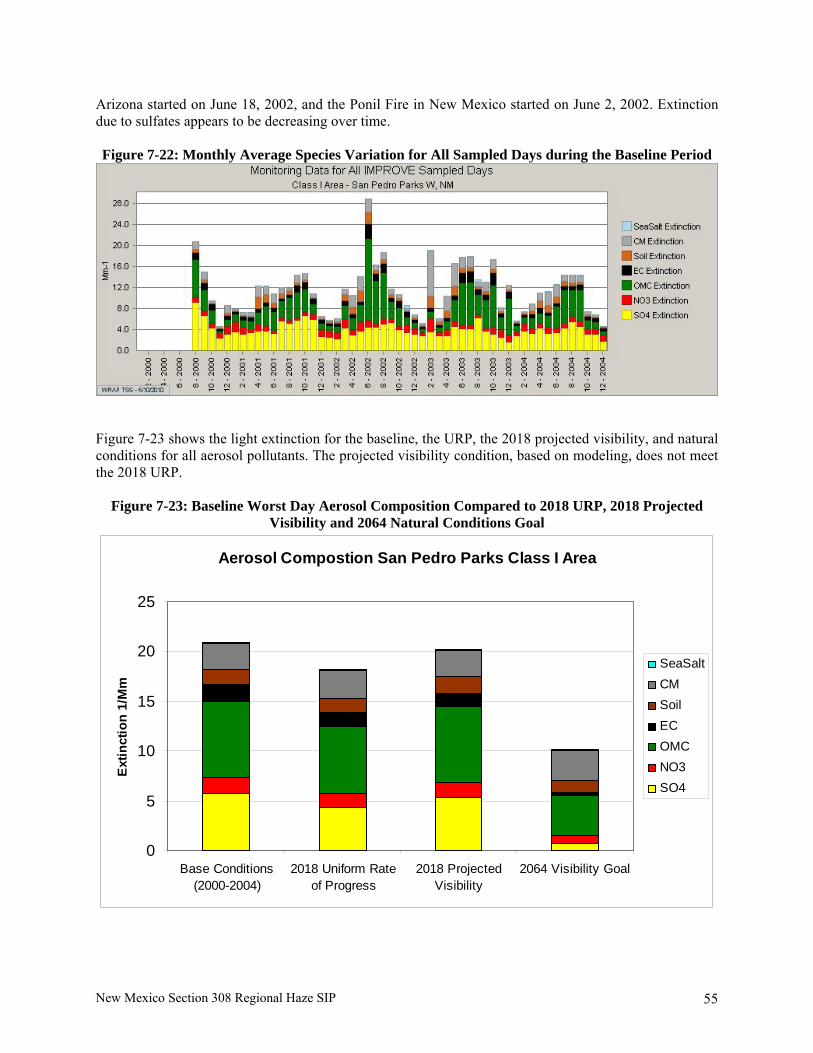
New Mexico Section 308 Regional Haze SIP 55
Arizona started on June 18, 2002, and the Ponil Fire in New Mexico started on June 2, 2002. Extinction due to sulfates appears to be decreasing over time. Figure 7-22: Monthly Average Species Variation for All Sampled Days during the Baseline Period
Figure 7-23 shows the light extinction for the baseline, the URP, the 2018 projected visibility, and natural conditions for all aerosol pollutants. The projected visibility condition, based on modeling, does not meet the 2018 URP.
Figure 7-23: Baseline Worst Day Aerosol Composition Compared to 2018 URP, 2018 Projected Visibility and 2064 Natural Conditions Goal
Aerosol Compostion San Pedro Parks Class I Area
0
5
10
15
20
25
Base Conditions(2000-2004)
2018 Uniform Rateof Progress
2018 ProjectedVisibility
2064 Visibility Goal
Ext
inct
ion
1/M
m
SeaSaltCM Soil EC OMC NO3 SO4

New Mexico Section 308 Regional Haze SIP 56
7.8 White Mountain Wilderness
Figure 7-24 shows that about one-third of the light extinction at the White Mountain Wilderness is due to sulfate on worst days. Organic carbon and coarse mass are also large contributors on worst days. Best days are dominated by sulfate, with organic carbon and coarse mass also contributing large percentages.
Figure 7-24: Average Species Contribution to 20% Best and Worst Days Baseline
For all IMPROVE sampled days sulfate, organic carbon, and coarse mass increase during the summer. Organic carbon showed a spike in July 2002. Extinction due to elemental carbon is relatively consistent throughout the year; however there are slight increases during the winter. Fires, especially the Rodeo-Chediski Fire in Arizona, contributed a large spike in extinction in June 2002. Figure 7-25: Monthly Average Species Variation for All Sampled Days during the Baseline Period
Figure 7-26 shows the light extinction for the baseline, the URP, the 2018 projected visibility, and natural conditions for all aerosol pollutants. The projected visibility condition, based on modeling, does not meet the 2018 URP.

New Mexico Section 308 Regional Haze SIP 57
Figure 7-26: Baseline Worst Day Aerosol Composition Compared to 2018 URP, 2018 Projected Visibility and 2064 Natural Conditions Goal
Aerosol Composition White Mountain Class I Area
0
5
10
15
20
25
30
35
Base Conditions(2000-2004)
2018 UniformRate of Progress
2018 ProjectedVisibility
2064 VisibilityGoal
Extin
ctio
n 1/
Mm
SeaSalt
CM
Soil
EC
OMC
NO3
SO4
New Mexico Section 308 Regional Haze SIP 58
CHAPTER 8: SOURCES OF VISIBILITY IMPAIRMENT
8.1 Anthropogenic Sources
Anthropogenic (human caused) sources of visibility impairment include anything directly attributable to human caused activities that produce emissions of visibility impairing pollutants. Some examples include transportation, agricultural activities, mining operations, and fuel combustion. Anthropogenic visibility conditions are not constant; they vary with changing human activities throughout the years. For purposes of this SIP anthropogenic emissions include those emissions originating within the boundaries of the U.S. but also include international anthropogenic emissions that originate outside of U.S. boundaries and are transported into the country. These include, but are not necessarily limited to, emissions from Canada, Mexico, and maritime shipping emissions from Pacific offshore sources. Although anthropogenic sources contribute to visibility impairment, international emissions cannot be regulated, controlled, or prevented by the states and are therefore beyond the scope of this planning document. Any reductions in international emission would likely fall under the purview of the U.S. EPA.
8.2 Natural Sources
Natural sources of visibility impairment include anything not directly attributed to human-caused emissions of visibility impairing pollutants. Natural events (e.g. windblown dust, wildfire, volcanic activity, biogenic emissions) also introduce pollutants that contribute to haze in the atmosphere. Natural visibility conditions are not constant; they vary with changing natural processes throughout the year. Specific natural events can lead to high short-term concentrations of visibility impairing particulate matter and its precursors. For purposes of this planning document, natural visibility conditions are represented by a long-term average of conditions expected to occur in the absence of emissions normally attributed to human activities. Natural visibility conditions reflect contemporary vegetated landscape, land-use patterns, and meteorological/climatic conditions. The 2064 visibility goal is the natural visibility conditions for the 20% worst natural conditions days. Natural sources contribute to visibility impairment but natural emissions cannot be realistically controlled or prevented by the states and therefore are beyond the scope of this planning document. Current methods of analysis of IMPROVE data do not provide a distinction between natural and anthropogenic emissions.
8.3 Overview of Emission Inventory System – WRAP Technical Support System
The WRAP developed the Technical Support System (TSS) as an internet access portal to all the data and analysis associated with the development of the technical foundations of regional haze plans for Western States. The TSS provides state, county, and grid cell level emissions information for typical criteria pollutants such as SO2, NOX, and other secondary particulate forming pollutants such as VOC and NH3. Eleven different emission inventories were developed comprising the following source categories: point, area, on-road mobile, off-road mobile, oil and gas, anthropogenic fire, natural fire, biogenic, road dust, fugitive dust, and windblown dust. More detailed information on the emission inventory information can be found on the WRAP TSS website at the following link: http://vista.cira.colostate.edu/TSS/Results/Emissions.aspx Additional emission information, including regional emissions, can be found on the WRAP Regional Modeling Center website at the following link: http://pah.cert.ucr.edu/aqm/308/

New Mexico Section 308 Regional Haze SIP 59
During the WRAP process Western states and EPA agreed that the tremendous amount of data collected, analyzed, and maintained by the WRAP would be impracticable and nearly infeasible to include in individual technical support documents for individual states. For purposes of administrative efficiency, WRAP data and analyses that the member states are utilizing to develop their Regional Haze SIPs are available through the WRAP and the TSS website.
8.4 New Mexico Emissions Data
CFR 40.51.308(d)(4)(v) requires a statewide emission inventory of pollutants that are reasonably anticipated to cause or contribute to visibility impairment in any mandatory Class I area. The pollutants inventoried by the WRAP that New Mexico will use include sulfur dioxide (SO2), volatile organic compounds (VOC), primary organic aerosol (POA), elemental carbon (EC), fine particulate matter (Soil-PM2.5), coarse particulate matter (PM2.5 to PM10), and ammonia (NH3). An inventory was developed for the baseline year 2002 and projections of future emissions have been made for 2018. New Mexico will provide updates to WRAP on this inventory on a periodic basis. A summary of the inventory results follows. Emission inventories are developed for all of the species or pollutants known to directly or indirectly impact visibility. Inventories are used with air quality models to predict concentrations of pollutants at future dates. WRAP developed emission inventories with input and data provided by Western states and stakeholders. A description of the development and content of the emission inventories can be found on the WRAP TSS website at the following link: http://vista.cira.colostate.edu/TSS/Results/Emissions.aspx Dispersion modeling predicts daily atmospheric concentrations of pollutants for the baseline year and these modeled results are compared to monitored data taken from the IMPROVE network. A second inventory is created to predict emission in 2018 based on expected controls, growth, or other factors. Additional inventories are created for future years to simulate the impact of different control strategies. The process for inventorying sources is similar for all species of interest. The number and types of sources is identified by various methods. For example, major stationary sources report actual annual emission rates to the EPA national emission database. New Mexico collects annual emission data from both major sources. This information is used as input into the emissions inventory. In other cases, such as mobile sources, an EPA mobile source emissions model is used to develop emission projections. Population, employment, and household data are used in other parts of the emission modeling to characterize emissions from area sources such as home heating. Thus, for each source type, emissions are calculated based on an emission rate and the amount of time the source is operating. Emission rates can be based on actual measurements from the source, or EPA emission factors based on data from tests of similar types of emission sources. In essence all sources go through the same process. The number of sources is identified, emission rates are determined by measurements of those types of sources and the time of operation is determined. By multiplying the emission rate times the hours of operation in a day, a daily emission rate can be calculated. The following tables represent New Mexico emissions posted on the TSS. “Plan02d” means baseline emissions for the years 2000-2004. “Prp18b” means the projected emissions for 2018.

New Mexico Section 308 Regional Haze SIP 60
Table 8-1: New Mexico SO2 Emission Inventory – 2002 & 2018 New Mexico Planning and Baseline Emission Inventories
Source Category New Mexico SOx Plan02d (tpy) Prp18b (tpy) Net Change (%)
Point 36,736 29,640 -19 Anthro Fire 94 72 -24 Natural Fire 2,727 2,727 0 Area 2,383 3,983 67 Wrap Area O&G 250 12 -95 On-Road Mobile 1,643 252 -85 Off-Road Mobile 3,540 228 -94 Road Dust 4 5 34 Fugitive Dust 5 6 21 Total 47,381 36,924 -22
Table 8-2: New Mexico NOX Emission Inventory – 2002 & 2018 New Mexico Planning and Baseline Emission Inventories
Source Category New Mexico NOx Plan02d (tpy) Prp18b (tpy) Net Change (%)
Point 98,115 69,996 -29 Anthro Fire 395 263 -34
Natural Fire 8,608 8,607 0 Biogenic 41,950 41,950 0 Area 13,023 16,781 29 Wrap Area O&G 56,196 74,648 33 On-Road Mobile 51,623 15,360 -70 Off-Road Mobile 42,277 26,606 -37 Road Dust 1 1 0 Fugitive Dust 5 6 0 Total 312,193 254,218 -19

New Mexico Section 308 Regional Haze SIP 61
Table 8-3: New Mexico VOC Emission Inventory – 2002 & 2018 New Mexico Planning and Baseline Emission Inventories
Source Category New Mexico VOC Plan02d (tpy) Prp18b (tpy) Net Change (%)
Point 17,277 25,871 50 Anthro Fire 607 387 -36 Natural Fire 18,834 18,833 0 Biogenic 1,007,457 1,007,457 0 Area 37,106 53,163 43
Wrap Area O&G 224,156 267,846 0 On-Road Mobile 28,897 11,679 -60 Off-Road Mobile 10,462 6,765 -35 Total 1,344,795 1,392,002 4
Table 8-4: New Mexico Primary Organic Aerosol (POA) Emission Inventory – 2002 & 2018 New Mexico Planning and Baseline Emission Inventories
Source Category New Mexico Primary Organic Aerosol Plan02d (tpy) Prp18b (tpy) Net Change (%)
Point 968 240 -75 Anthro Fire 681 441 -35 Natural Fire 16,257 16,256 0 Area 2,023 2,279 13 On-Road Mobile 497 508 2 Off-Road Mobile 471 281 -40 Road Dust 102 136 34 Fugitive Dust 268 275 2 Total 21,268 20,417 -4

New Mexico Section 308 Regional Haze SIP 62
Table 8-5: New Mexico Elemental Carbon (EC) Emission Inventory – 2002 & 2018 New Mexico Planning and Baseline Emission Inventories
Source Category New Mexico Elemental Carbon Plan02d (tpy) Prp18b (tpy) Net Change (%)
Point 12 13 4 Anthro Fire 123 85 -31
Natural Fire 3,291 3,291 0 Area 244 287 17 On-Road Mobile 586 160 -73 Off-Road Mobile 1,355 662 -51 Road Dust 8 11 34 Fugitive Dust 18 19 2 Total 5,638 4,526 -20
Table 8-6: New Mexico Soil (PM Fine/PM2.5) Emission Inventory – 2002 & 2018 New Mexico Planning and Baseline Emission Inventories
Source Category New Mexico Fine PM Plan02d (tpy) Prp18b (tpy) Net Change (%)
Point 1,160 1,126 -3 Anthro Fire 87 44 -49 Natural Fire 1,220 1,220 0 Area 2,318 2,973 28 Road Dust 1,192 1,591 33 Fugitive Dust 5,158 5,446 6 WB Dust 16,305 16,305 0 Total 27,440 28,705 5
Table 8-7: New Mexico Coarse Mass (PM Coarse) Emission Inventory – 2002 & 2018 New Mexico Planning and Baseline Emission Inventories
Source Category New Mexico Coarse PM Plan02d (tpy) Prp18b (tpy) Net Change (%)
Point 1,953 1,731 -11 Anthro Fire 105 63 -41 Natural Fire 5,398 5,398 0 Area 534 723 36 On-Road Mobile 306 357 0 Road Dust 10,206 13,618 33 Fugitive Dust 36,306 41,429 14 WB Dust 146,747 146,747 0 Total 201,555 210,066 4

New Mexico Section 308 Regional Haze SIP 63
Table 8-8: New Mexico Ammonia (NH3) Emission Inventory – 2002 & 2018 New Mexico Planning and Baseline Emission Inventories
Source Category New Mexico Ammonia Plan02d (tpy) Prp18b (tpy) Net Change (%)
Point 51 66 30 Anthro Fire 75 42 -44 Natural Fire 1,873 1,873 0 Area 29,112 29,343 1 On-Road Mobile 1,605 2,139 33 Off-Road Mobile 23 32 38 Total 32,740 33,495 2

New Mexico Section 308 Regional Haze SIP 64
CHAPTER 9: VISIBILITY MODELING AND SOURCE APPORTIONMENT
9.1 Modeling Overview
CMAQ The Regional Modeling Center (RMC) Air Quality Modeling Group is responsible for regional haze modeling for the WRAP. The RMC is located at the University of California – Riverside in the College of Engineering Center for Environmental Research and Technology. The RMC modeling analysis is based on a model domain comprising the continental U.S. using the Community Multi-Scale Air Quality (CMAQ) model. The EPA developed the CMAQ modeling system in the late 1990s. CMAQ was designed as a "one atmosphere" modeling system to encompass modeling of multiple pollutants and issues, including ozone, PM, visibility, and air toxics. This is in contrast to many earlier air quality models that focused on single-pollutant issues (e.g., ozone modeling by the Urban Airshed Model). CMAQ is an Eulerian Model; it is a grid-based model is which the frame of reference is a fixed, three-dimensional (3-D) grid with uniformly sized horizontal grid cells and variable vertical layer thicknesses. The key science processes included in CMAQ are emissions, advection and dispersion, photochemical transformation, aerosol. Thermodynamics and phase transfer, aqueous chemistry, and wet and dry deposition of trace species. The RMC developed air quality modeling inputs including annual meteorology and emissions inventories for a 2002 actual emissions base case (Base02), a planning case to represent the 2000 – 2004 baseline period (Plan02), and a 2018 base case (Base 18) of projected emissions using factors known at the end of 2005. All emission inventories were developed during the Sparse Matrix Operator Kernel Emission (SMOKE) modeling system. These inventories were revised during the development process. The development of these emission scenarios is documented under the emissions inventory sections of the TSS. The 2018 visibility projections (PRP18b) were developed using the Plan02d and Base 18b CMAQ 36-km modeling results. Projections were made using relative response factors (RRFs), which are defined as the ratio of the future-year modeling results to the current year modeling results. The calculated RRFs are applied to the baseline observed visibility conditions to project future year observed visibility. The CMAQ modeling for PRP18b included emissions after reductions from the following programs and regulations:
• Smoke Management Program accounted for using Emissions Reduction Techniques (ERTs) applied to the 2000-2004 average fire emissions.
• New permits and State/EPA consent agreements since 2002 reviewed with each State through 2007.
• Ozone and PM10 SIPs in place within the WRAP region • State Oil and Gas emission control programs. • Mobile sources:
o Heavy Duty Diesel (2007) Engine Standard o Tier 2 Tailpipe o Large Spark Ignition and Recreational Vehicle rule o Nonroad Diesel Rule
• Combustion Turbine and Industrial Boiler/Process Heater/RICE MACT • Known BART control in the WRAP region. • Presumptive SO2 BART for EGUs in the WRAP region.

New Mexico Section 308 Regional Haze SIP 65
Generally, emission inputs were prepared by individual States and Tribes for point, area, and most dust emissions categories. The following WRAP Forums were relied upon to summarize this data and provide it to the RMC.
• Point Source emissions were obtained from a project commissioned by the Stationary Source Joint Forum and the Emission Forum.
• Area Source emissions were obtained from a project commissioned by the Stationary Source Joint Forum and the Emission Forum.
• Mobile Source emissions were from a project commissioned by the Emissions Forum. • Fire (natural and anthropogenic) emissions were from projects commissioned by the Fire
Emissions Joint Forum • Ammonia, Dust, & Biogenic emissions were from projects commissioned by the Dust Emissions
Joint Forum and the Modeling Forum. • Emissions from Pacific Offshore shipping were from a project conducted by the RMC. • Other emissions from North America were from projects commissioned by the Emission Forum
and the Modeling Forum. The Mexico emission are from 1999 and were held constant for 2018. Canada emissions are from 2000 and were held constant for 2018.
• Boundary conditions reaching North America from the rest of the world were from a project commissioned by the VISTAS Regional Planning Organization, on behalf of the five regional planning organizations working on regional haze.
The 2018 Preliminary Reasonable Progress, version B (PRP18b), makes a second revision to the 2018 emissions inventory projections for point and area sources in the WRAP region to provide a more current assessment of the reasonable progress toward visibility goals by the WRAP. The PRP18b addresses changes that occurred since January 2007 in the following areas.
• BART determinations (or expected BART control levels where BART had not been finalized); • Projections of "future" fossil-fuel plants needed to achieve 2018 federal electrical generation
demand forecasts; • New rulemaking, permit limits, and consent decrees; and • Other outstanding issues that were identified by the federal, state, or local agencies within the
WRAP domain as needing to be corrected or updated. PSAT The RMC also developed the Particulate Matter Source Apportionment Technology (PSAT) algorithm in the Comprehensive Air Quality Model with extensions (CAMx) model to assess source attribution. The PSAT analysis is used to attribute particle species, particularly sulfate and nitrate from a specific location within the WRAP modeling domain. The PSAT algorithm applies nitrate-sulfate-ammonia chemistry to a system of tracers or "tags" to track the chemical transformations, transport and removal of emissions. Each state or region (i.e., Mexico, Canada) is assigned a unique number that is used to tag the emissions from each 36-kilometer grid cell within the WRAP modeling domain. Due to time and computational limitations, only point, mobile, area and fire emissions were tagged. The PSAT algorithm was also used, in a limited application (e.g. no state or regional attribution) due to resource constraints, to track natural and anthropogenic species of organic aerosols at each Class 1 Area. The organic aerosol tracer tracked both primary and secondary organic aerosols (POA & SOA).

New Mexico Section 308 Regional Haze SIP 66
Weighted Emissions Potential The Weighted Emissions Potential (WEP) is a screening tool that helps to identify source regions that have the potential to contribute to haze formation at specific Class I areas. Unlike PSAT, this method does not account for chemistry or deposition. The WEP combines emissions inventories, wind patterns, and residence time of air mass over each area where emissions occur, to estimate the percent contribution of different pollutants. Like PSAT, the WEP tool compares baseline (2000-2004) to 2018, to show the improvement expected by the 2018 URP, for sulfate, nitrate, organic carbon, elemental carbon, fine PM, and coarse PM.
9.2 Summary of Modeling Results for CMAQ
This section provides the visibility projections for New Mexico's Class I areas using the CMAQ model. The projections were calculated from modeled results by multiplying a species-specific relative response factor (RRF) with the baseline monitored results, and then converting to extinction and deciview. The RRF is defined as the ratio of future-to-current modeled mass. The projected visibility conditions are used to define the reasonable progress goals found in Chapter 11. Table 9-1 provides the 2018 uniform progress for each Class I area and the visibility modeling projection for 2018 for both 20% worst and 20% best days. None of New Mexico's Class I areas are projected to meet the URP for 2018, although all but one (Gila Wilderness) are projected to be below baseline conditions. The following section provides a breakdown of the visibility impairment for each pollutant. Modeling shows degradation on best days for two of the IMPROVE monitors. This is addressed in the Chapter 12 discussion regarding the Long Term Strategy.
Table 9-1: Summary of CMAQ Modeling Progress Towards 2018 20% Worst Days Visibility 20% Best Days Visibility
New Mexico Class I Area 2000-2004
Baseline (dv)
2018 URP Goal (dv)
2018 Projected Visibility
(dv)
2000-2004 Baseline
(dv)
2018 Projected Visibility
(dv)
2018 Projection less than Baseline?
Bandelier W 12.22 10.83 11.9 4.95 4.89 Y
Bosque del Apache NWR 18.03 15.41 17.33 7.84 7.43 Y
Carlsbad Caverns NP 17.19 14.73 16.93 5.95 6.14 N
Gila W 13.11 11.61 15.17 3.31 3.45 N
Pecos W, Wheeler Peak W 10.41 9.40 10.23 1.22 1.13 Y
Salt Creek W 18.03 15.41 17.33 7.84 7.43 Y
San Pedro Parks W 10.17 9.13 9.94 1.45 1.24 Y
White Mountain W 13.7 12.09 13.27 3.55 3.42 Y
9.2.1 CMAQ Modeling by Pollutant
The following graphs and tables show the breakdown of visibility impairment for each pollutant on 20% worst days. The visibility projections for the individual pollutants at each Class I area shows that most pollutants will not meet their respective 2018 goal for worst days. The tables summarize the impairment of each pollutant and identify the relative impact from anthropogenic or non-anthropogenic pollutants.

New Mexico Section 308 Regional Haze SIP 67
The results of the breakdown show that nitrate (anthropogenic) has greater improvement than the other pollutants. With the exceptions of organic carbon and fine soil, all other pollutants are below the baseline condition. The tables also show that the primary contributors to extinction are organic carbon, sulfate, and coarse mass. The sulfate is likely from industrial sources while the organic carbon can be attributed mostly to fire and coarse mass from natural sources.
Figure 9-1: URP by Pollutant on 20% Worst Days for Bandelier Wilderness
Table 9-2: Pollutant Breakdown on 20% Worst Days for Bandelier Wilderness Bandelier Wilderness
Pollutant 2000-2004 Baseline (Mm-1)
2018 URP Goal
(Mm-1)
2018 Projected Visibility (Mm-1)
2064 Natural Conditions
(Mm-1)
2018 under URP Goal?
Sulfate 6.89 5.17 5.99 0.65 No
Nitrate 2.51 2.09 2.53 0.81 No
Organic Carbon 14.23 11.32 14 4.01 No
Elemental Carbon 3.15 2.43 2.65 0.32 No
Fine Soil 1.12 1.11 1.43 1.07 No
Coarse Mass 2.93 3.09 NA 3.64 NA
Sea Salt 0.24 0.24 NA 0.24 NA NA - Visibility projections not available due to poor model performance.

New Mexico Section 308 Regional Haze SIP 68
Figure 9-2: URP by Pollutant on 20% Worst Days for Bosque del Apache NWR
Table 9-3: Pollutant Breakdown on 20% Worst Days for Bosque del Apache NWR
Bosque del Apache NWR
Pollutant 2000-2004 Baseline (Mm-1)
2018 URP Goal
(Mm-1)
2018 Projected Visibility (Mm-1)
2064 Natural Conditions
(Mm-1)
2018 under URP Goal?
Sulfate 7.51 5.57 7.27 0.58 No
Nitrate 3.24 2.68 3.02 1.01 No
Organic Carbon 8.73 7.24 8.6 3.15 No
Elemental Carbon 2.6 2.02 2.15 0.29 No
Fine Soil 1.94 1.73 2.16 1.06 No
Coarse Mass 6.69 5.90 NA 3.56 NA
Sea Salt 0.19 0.21 NA 0.25 NA NA - Visibility projections not available due to poor model performance.

New Mexico Section 308 Regional Haze SIP 69
Figure 9-3: URP by Pollutant on 20% Worst Days for Carlsbad Caverns NP
Table 9-4: Pollutant Breakdown on 20% Worst Days for Carlsbad Caverns NP
Carlsbad Caverns National Park
Pollutant 2000-2004 Baseline (Mm-1)
2018 URP Goal
(Mm-1)
2018 Projected Visibility (Mm-1)
2064 Natural Conditions
(Mm-1)
2018 under URP Goal?
Sulfate 16.51 11.50 13.92 0.8 No
Nitrate 3.81 3.06 4.27 0.89 No
Organic Carbon 6.73 5.81 6.88 3.13 No
Elemental Carbon 1.34 1.07 1.19 0.23 No
Fine Soil 4.37 3.57 5.26 1.27 No
Coarse Mass 16.02 12.66 NA 4.39 NA
Sea Salt 0.1 0.11 NA 0.14 NA NA - Visibility projections not available due to poor model performance.

New Mexico Section 308 Regional Haze SIP 70
Figure 9-4: URP by Pollutant on 20% Worst Days for Gila Wilderness
Table 9-5: Pollutant Breakdown on 20% Worst Days for Gila Wilderness Gila Wilderness
Pollutant 2000-2004 Baseline (Mm-1)
2018 URP Goal
(Mm-1)
2018 Projected Visibility (Mm-1)
2064 Natural Conditions
(Mm-1)
2018 under URP Goal?
Sulfate 6.87 5.13 7.67 0.58 No
Nitrate 0.91 0.86 0.49 0.7 No
Organic Carbon 16 12.67 23.26 4.46 No
Elemental Carbon 3.17 2.46 5.7 0.41 No
Fine Soil 1.45 1.40 2.14 1.21 No
Coarse Mass 2.85 3.00 NA 3.53 NA
Sea Salt 0.07 0.09 NA 0.16 NA NA - Visibility projections not available due to poor model performance.

New Mexico Section 308 Regional Haze SIP 71
Figure 9-5: URP by Pollutant on 20% Worst Days for Pecos Wilderness, Wheeler Peak Wilderness
Table 9-6: Pollutant Breakdown on 20% Worst Days for Pecos Wilderness, Wheeler Peak Wilderness
Pecos Wilderness, Wheeler Peak Wilderness
Pollutant 2000-2004 Baseline (Mm-1)
2018 URP Goal
(Mm-1)
2018 Projected Visibility (Mm-1)
2064 Natural Conditions
(Mm-1)
2018 under URP Goal?
Sulfate 5.27 4.07 4.68 0.75 No
Nitrate 1.64 1.44 1.61 0.84 No
Organic Carbon 8.37 7.30 8.23 4.2 No
Elemental Carbon 2.18 1.74 2.1 0.4 No
Fine Soil 1.75 1.61 2 1.18 No
Coarse Mass 2.77 2.87 NA 3.21 NA
Sea Salt 0.47 0.48 NA 0.49 NA NA - Visibility projections not available due to poor model performance.

New Mexico Section 308 Regional Haze SIP 72
Figure 9-6: URP by Pollutant on 20% Worst Days for Salt Creek Wilderness
Table 9-7: Pollutant Breakdown on 20% Worst Days for Salt Creek Wilderness
Salt Creek Wilderness
Pollutant 2000- 2004 Baseline (Mm-1)
2018 URP Goal
(Mm-1)
2018 Projected Visibility (Mm-1)
2064 Natural Conditions
(Mm-1)
2018 under URP Goal?
Sulfate 16.75 11.64 13.9 0.78 No
Nitrate 11.15 8.07 11.11 0.77 No
Organic Carbon 7.49 6.31 6.64 2.97 No
Elemental Carbon 2.31 1.79 1.62 0.26 No
Fine Soil 3.34 2.75 3.44 0.98 No
Coarse Mass 11.47 9.46 NA 4.09 NA
Sea Salt 0.2 0.20 NA 0.2 NA NA - Visibility projections not available due to poor model performance.

New Mexico Section 308 Regional Haze SIP 73
Figure 9-7: URP by Pollutant on 20% Worst Days for San Pedro Parks Wilderness
Table 9-8: Pollutant Breakdown on 20% Worst Days for San Pedro Parks Wilderness
San Pedro Parks Wilderness
Pollutant 2000- 2004 Baseline (Mm-1)
2018 URP Goal
(Mm-1)
2018 Projected Visibility (Mm-1)
2064 Natural Conditions
(Mm-1)
2018 under URP Goal?
Sulfate 5.78 4.41 5.38 0.7 N
Nitrate 1.57 1.39 1.48 0.8 N
Organic Carbon 7.66 6.73 7.6 4.02 N
Elemental Carbon 1.63 1.31 1.3 0.34 Y
Fine Soil 1.47 1.40 1.68 1.16 N
Coarse Mass 2.7 2.77 NA 3.02 NA
Sea Salt 0.1 0.10 NA 0.12 NA NA - Visibility projections not available due to poor model performance.

New Mexico Section 308 Regional Haze SIP 74
Figure 9-8: URP by Pollutant on 20% Worst Days for White Mountain Wilderness
Table 9-9: Pollutant Breakdown on 20% Worst Days for White Mountain Wilderness
White Mountain Wilderness
Pollutant 2000- 2004 Baseline (Mm-1)
2018 URP Goal
(Mm-1)
2018 Projected Visibility (Mm-1)
2064 Natural Conditions
(Mm-1)
2018 under URP Goal?
Sulfate 10.51 7.64 9.33 0.74 No
Nitrate 3.05 2.53 2.99 0.98 No
Organic Carbon 8.97 7.59 8.64 3.72 No
Elemental Carbon 1.82 1.45 1.42 0.31 No
Fine Soil 1.89 1.72 2.02 1.19 No
Coarse Mass 6.68 6.10 NA 4.35 NA
Sea Salt 0.17 0.18 NA 0.22 NA NA - Visibility projections not available due to poor model performance.
9.3 Summary of PSAT Modeling Results
This section provides a summary of the PSAT modeling results for the baseline and 2018 projections. The figures and graphs show the relative contribution of in-state versus out-of-state sources that contribute to visibility impairment at New Mexico's Class I areas. Results for both the 20% worst and 20% best days are shown. The PSAT modeling focuses on sulfate and nitrate contribution only and takes into account chemistry and deposition. Modeling shows contribution from all regions including the WRAP States, CENRAP States, the eastern US States, Canada, Mexico, Pacific Offshore (shipping), and "Outside Domain" (global transport). The WEP analysis does not consider sulfate and nitrate chemistry and deposition, but does estimate contributions from Canada, Mexico, and Pacific Offshore regions. Because of these differences, the results show PSAT for sulfate and nitrate contributions (the primary anthropogenic pollutants) and

New Mexico Section 308 Regional Haze SIP 75
WEP results for identifying the contribution from organic carbon, elemental carbon, fine soil, and coarse matter (common non-anthropogenic pollutants). The following sections contain pie charts and graphs showing the State and regional contributions of sulfate and nitrate mass at the IMPROVE monitoring sites for the Class I areas. The pie charts show the regional contributions from the WRAP States, Canada, Mexico, Pacific offshore (PO), and outside the domain (OD). The WRAP States are indicated by the "break-out" slice of the pie chart. The PSAT bar graphs show the breakdown of contribution from the individual WRAP States for organic carbon, elemental carbon, fine PM, and coarse PM. The figures compare the baseline conditions with the projected concentration in 2018 based on PSAT modeling.
9.3.1 Bandelier Wilderness
Sulfate Figure 9-9 shows the concentration of sulfate for the 20% worst days. The overall concentration is projected to remain the same by 2018. Contributions from WRAP States and outside the domain are however, showing increased contributions. CENRAP States and Eastern U.S. States are decreasing. Concentrations from Mexico are increasing, mostly from point sources, which is likely to due to increasing industrial sources within Mexico.
Figure 9-9: PSAT for Sulfate on 20% - Regional Contributions
The breakdown of the contributions from WRAP States and regionally, shows that point sources are the primary source of sulfate. Among the primary regional contributors, modeling shows that sulfate concentrations are decreasing by 2018, except for sulfate from New Mexico, Arizona and Mexico.

New Mexico Section 308 Regional Haze SIP 76
Figure 9-10: PSAT Sulfate on 20% Worst Days – WRAP States and Regional Contributions
Nitrate Figure 9-11 shows the concentration of nitrate for the 20% worst days. The overall concentration is projected to remain the same by 2018.
Figure 9-11: PSAT for Nitrate on 20% Worst Days – Regional Contributions
Figure 9-12 provides the nitrate concentrations from WRAP States in addition to other regional contributors. Among the WRAP States, New Mexico contributes the most to nitrate concentrations followed by CENRAP in both the baseline period and the 2018 projections. Nitrate concentrations are primarily from point and area sources. Area source projections show increases in New Mexico for 2018.

New Mexico Section 308 Regional Haze SIP 77
Figure 9-12: PSAT Nitrate on 20% Worst Days – WRAP States and Regional Contributions
9.3.2 Bosque del Apache National Wildlife Refuge
Sulfate Figure 9-13 shows sulfate concentrations from the baseline period and projection in 2018. The States and regions contributing to most of the sulfate concentrations include WRAP States, Eastern U.S. states, CENRAP states, outside domain, and Mexico. Eastern US contribute at lower percentage for 2018.
Figure 9-13: PSAT for Sulfate on 20% Worst Days – Regional Contributions
In Figure 9-14, the breakdown of sulfate contributions indicates that CENRAP, Eastern U.S. and Mexican sources are the highest contributor, mostly from point sources. New Mexico contributions to sulfate concentrations are mostly from point sources. Area sources in New Mexico are projected to increase in 2018.

New Mexico Section 308 Regional Haze SIP 78
Figure 9-14: PSAT Sulfate on 20% Worst Days – WRAP States and Regional Contributions
Nitrate Regional nitrate concentrations are shown in Figure 9-15. Contributions to nitrate concentrations are mostly from WRAP States, followed by CENRAP states, both of which are projected to decrease by 2018.
Figure 9-15: PSAT for Nitrate on 20% Worst Days – Regional Contributions
As Figure 9-16 shows New Mexico is the primary contributor to nitrate, followed by CENRAP states and Arizona. New Mexico source types contributing to nitrate concentrations include natural mobile, area, and point sources. Most of the concentrations are from mobile sources. Area sources are projected to have increasing concentrations for 2018. CENRAP point and area sources are also projected to increase. However, there is a net decrease from both New Mexico and CENRAP for 2018. Increases are projected in 2018 from Mexico and outside the domain.

New Mexico Section 308 Regional Haze SIP 79
Figure 9-16: PSAT for Nitrate on 20% Worst Days – WRAP States and Regional Contributions
9.3.3 Carlsbad Caverns National Park
Sulfate Source apportionment shows that the Eastern U.S. contributes almost half and CENRAP states contribute approximately one-fourth of the total sulfate concentrations at Carlsbad Caverns National Park for the baseline period. The regional contributions from each of these categories are expected to decrease in 2018, and total concentrations are projected to decrease.
Figure 9-17: PSAT for Sulfate on 20% Worst Days – Regional Contributions
The primary regional contributor to sulfate is the Eastern U.S., followed by CENRAP states and Mexico. It is evident that point sources account for most of the sulfate concentrations from all contributors. Sulfate contributions from Mexico and New Mexico are projected to increase in 2018, with concentrations from the CENRAP and Eastern U.S. states decreasing.

New Mexico Section 308 Regional Haze SIP 80
Figure 9-18: PSAT for Sulfate on 20% Worst Days – WRAP States and Regional Contributions
Nitrate Figure 9-19 shows the regional contribution to nitrate at Carlsbad Caverns National Park. On the 20% worst days, the primary contributors are CENRAP and WRAP states. Regional contributions are projected to remain the same in 2018.
Figure 9-19: PSAT Nitrate on 20% Worst Days – Regional Contributions
Figure 9-20 shows that CENRAP states contribute the most to nitrate followed by outside the domain, then New Mexico. Most of the concentrations are from mobile and point sources. Nitrate concentration from area sources in New Mexico are projected to increase in 2018.

New Mexico Section 308 Regional Haze SIP 81
Figure 9-20: PSAT Nitrate on 20% Worst Days – WRAP States and Regional Contributions
9.3.4 Gila Wilderness
Sulfate Figure 9-21 shows a fairly even distribution of the sulfate concentrations from WRAP States, Mexico, Eastern U.S., CENRAP states, and outside domain sources. The overall concentrations of sulfate in 2018 are projected to decrease.
Figure 9-21: PSAT Sulfate on 20% Worst Days – Regional Contributions
The breakdown of sulfate from WRAP States and other regional contributors shows that Mexico is the primary contributor followed by CENRAP States, and Eastern U.S. States. Sulfate is predominately from point sources, with a small amount from area sources within each regional contributor. Contributions of sulfate from Mexico, Arizona and New Mexico are projected to increase from point sources in 2018.

New Mexico Section 308 Regional Haze SIP 82
Figure 9-22: PSAT Sulfate on 20% Worst Days – WRAP States and Regional Contributions
Nitrate Nitrate concentrations at the East Unit are predominately from WRAP states and outside of the domain. Less than one-quarter of the remaining nitrate is from Mexico, CENRAP states, and Pacific Offshore.
Figure 9-23: PSAT Nitrate on 20% Worst Days – Regional Contributions
On the 20% worst days, California and Arizona are the greatest contributor to nitrate concentrations at Gila Wilderness. The majority of nitrate is from mobile sources, but nitrate from point sources is expected to increase by 2018. Nitrate from mobile sources is projected to decrease by 2018.
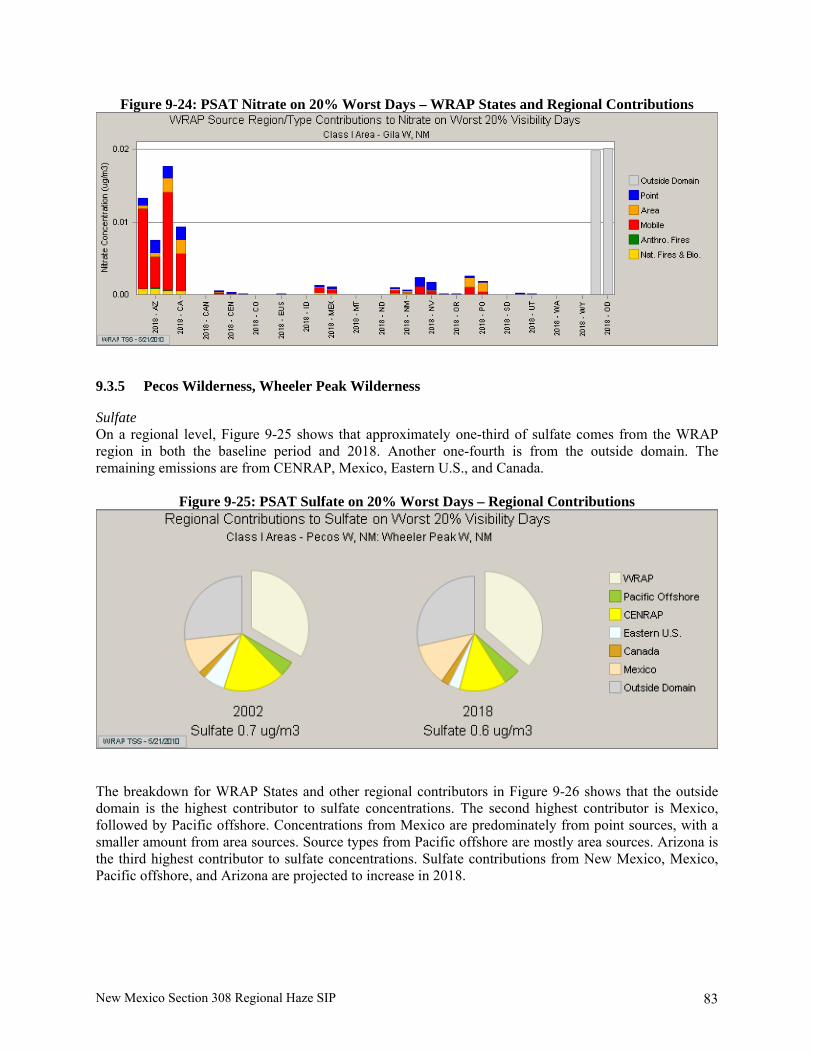
New Mexico Section 308 Regional Haze SIP 83
Figure 9-24: PSAT Nitrate on 20% Worst Days – WRAP States and Regional Contributions
9.3.5 Pecos Wilderness, Wheeler Peak Wilderness
Sulfate On a regional level, Figure 9-25 shows that approximately one-third of sulfate comes from the WRAP region in both the baseline period and 2018. Another one-fourth is from the outside domain. The remaining emissions are from CENRAP, Mexico, Eastern U.S., and Canada.
Figure 9-25: PSAT Sulfate on 20% Worst Days – Regional Contributions
The breakdown for WRAP States and other regional contributors in Figure 9-26 shows that the outside domain is the highest contributor to sulfate concentrations. The second highest contributor is Mexico, followed by Pacific offshore. Concentrations from Mexico are predominately from point sources, with a smaller amount from area sources. Source types from Pacific offshore are mostly area sources. Arizona is the third highest contributor to sulfate concentrations. Sulfate contributions from New Mexico, Mexico, Pacific offshore, and Arizona are projected to increase in 2018.

New Mexico Section 308 Regional Haze SIP 84
Figure 9-26: PSAT Sulfate on 20% Worst Days – WRAP States and Regional Contributions
Nitrate Almost two-thirds of emissions contributing to nitrate concentrations in 2018 are from the WRAP region. The remaining major contributor is CENRAP.
Figure 9-27: PSAT Nitrate on 20% Worst Days – Regional Contributions
Looking at contributors by State/region, the primary contributor to nitrate concentrations is New Mexico, followed by CENRAP states. Figure 9-28 shows the primary source types from New Mexico are area, point and mobile sources. Sources of nitrate from CENRAP are also mostly mobile and point with smaller amounts of nitrate from area sources.
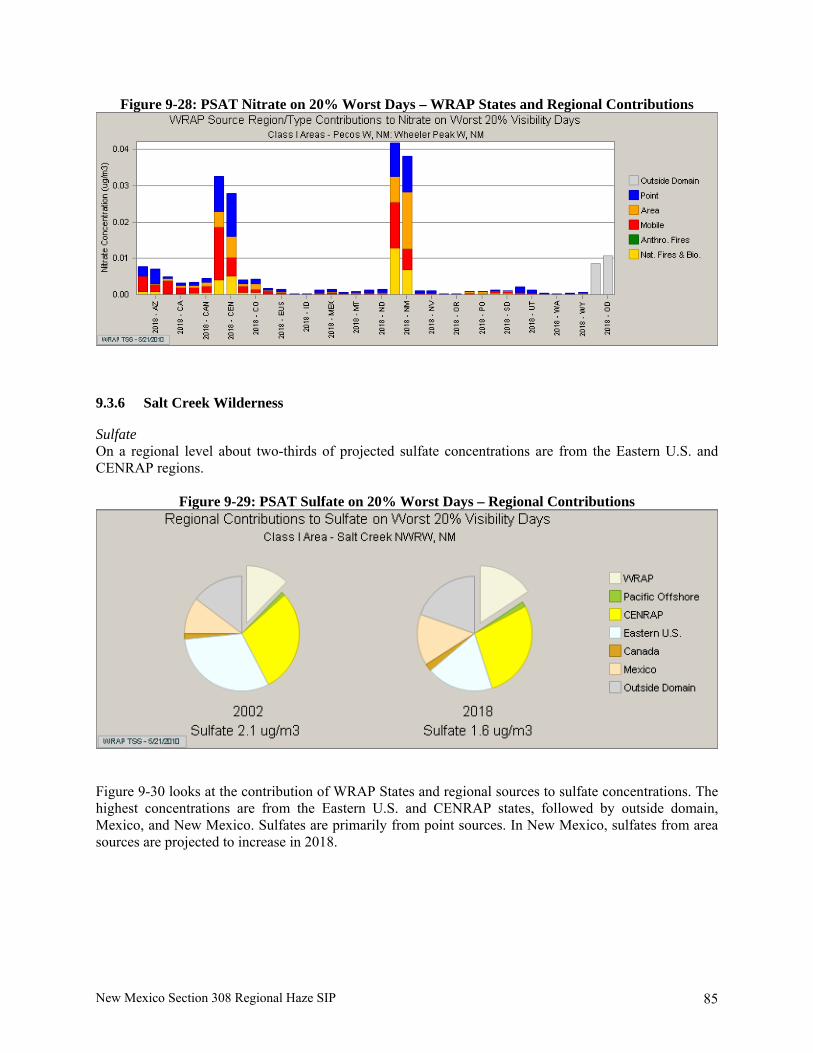
New Mexico Section 308 Regional Haze SIP 85
Figure 9-28: PSAT Nitrate on 20% Worst Days – WRAP States and Regional Contributions
9.3.6 Salt Creek Wilderness
Sulfate On a regional level about two-thirds of projected sulfate concentrations are from the Eastern U.S. and CENRAP regions.
Figure 9-29: PSAT Sulfate on 20% Worst Days – Regional Contributions
Figure 9-30 looks at the contribution of WRAP States and regional sources to sulfate concentrations. The highest concentrations are from the Eastern U.S. and CENRAP states, followed by outside domain, Mexico, and New Mexico. Sulfates are primarily from point sources. In New Mexico, sulfates from area sources are projected to increase in 2018.

New Mexico Section 308 Regional Haze SIP 86
Figure 9-30: PSAT Sulfate on 20% Worst Days – WRAP States and Regional Contributions
Nitrate Figure 9-31 shows that about three-fourths of the nitrate concentrations at the Salt Creek Wilderness are from the WRAP region. The next highest contributor is CENRAP with most of the remaining emissions from outside the domain.
Figure 9-31: PSAT Nitrate on 20% Worst Days – Regional Contributions
Looking at contributions from WRAP States and other regional sources (Figure 9-32), the three highest contributors to nitrates are New Mexico, CENRAP, and outside domain. Point, mobile and area sources are the largest source of nitrate emissions. In New Mexico, nitrates are predicted to increase, generally from area sources.
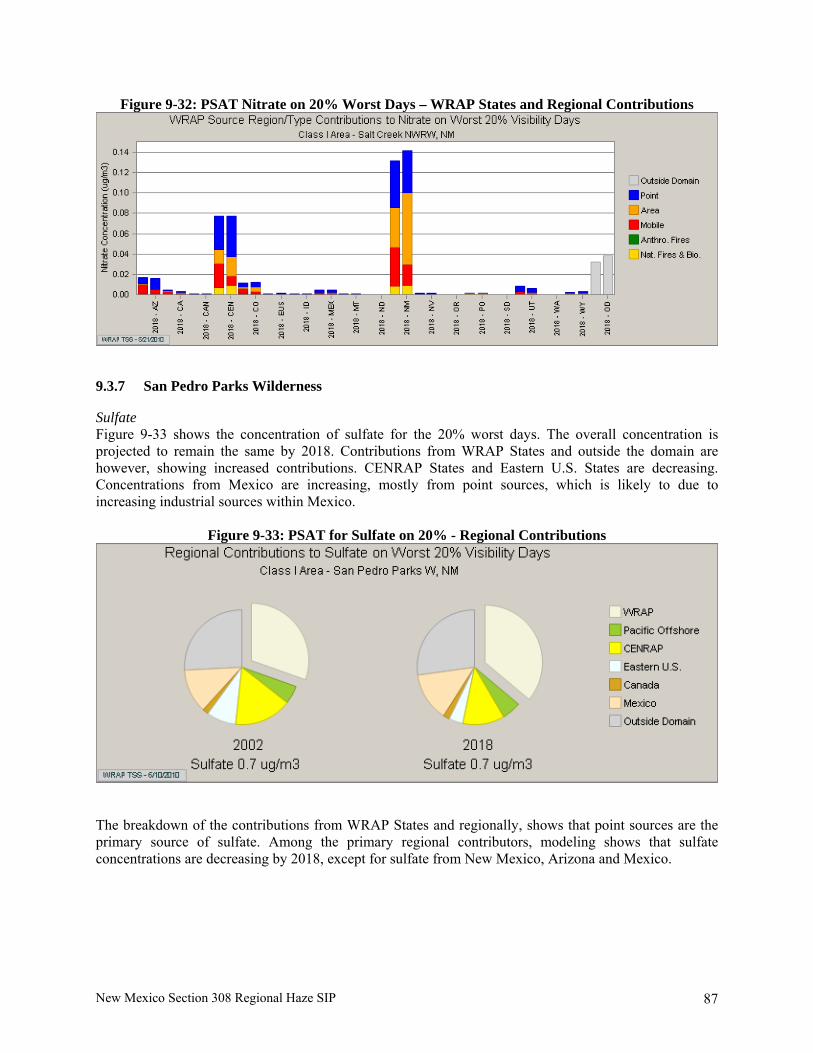
New Mexico Section 308 Regional Haze SIP 87
Figure 9-32: PSAT Nitrate on 20% Worst Days – WRAP States and Regional Contributions
9.3.7 San Pedro Parks Wilderness
Sulfate Figure 9-33 shows the concentration of sulfate for the 20% worst days. The overall concentration is projected to remain the same by 2018. Contributions from WRAP States and outside the domain are however, showing increased contributions. CENRAP States and Eastern U.S. States are decreasing. Concentrations from Mexico are increasing, mostly from point sources, which is likely to due to increasing industrial sources within Mexico.
Figure 9-33: PSAT for Sulfate on 20% - Regional Contributions
The breakdown of the contributions from WRAP States and regionally, shows that point sources are the primary source of sulfate. Among the primary regional contributors, modeling shows that sulfate concentrations are decreasing by 2018, except for sulfate from New Mexico, Arizona and Mexico.

New Mexico Section 308 Regional Haze SIP 88
Figure 9-34: PSAT Sulfate on 20% Worst Days – WRAP States and Regional Contributions
Nitrate Figure 9-35 shows the concentration of nitrate for the 20% worst days. The overall concentration is projected to remain the same by 2018.
Figure 9-35: PSAT for Nitrate on 20% Worst Days – Regional Contributions
Figure 9-36 provides the nitrate concentrations from WRAP States in addition to other regional contributors. Among the WRAP States, New Mexico contributes the most to nitrate concentrations followed by CENRAP in both the baseline period and the 2018 projections. Nitrate concentrations are primarily from point and area sources. Area source projections show increases in New Mexico for 2018.

New Mexico Section 308 Regional Haze SIP 89
Figure 9-36: PSAT Nitrate on 20% Worst Days – WRAP States and Regional Contributions
9.3.8 White Mountain Wilderness
Sulfate On a regional level about two-thirds of projected sulfate concentrations are from the Eastern U.S. and CENRAP regions.
Figure 9-37: PSAT Sulfate on 20% Worst Days – Regional Contributions
Figure 9-38 looks at the contribution of WRAP States and regional sources to sulfate concentrations. The highest concentrations are from the Eastern U.S. and CENRAP states, followed by outside domain, Mexico, and New Mexico. Sulfates are primarily from point sources. In New Mexico, sulfates from area sources are projected to increase in 2018.

New Mexico Section 308 Regional Haze SIP 90
Figure 9-38: PSAT Sulfate on 20% Worst Days – WRAP States and Regional Contributions
Nitrate Figure 9-39 shows that over one-third of the nitrate concentrations at the Salt Creek Wilderness are from the WRAP region, with another third from CENRAP.
Figure 9-39: PSAT Nitrate on 20% Worst Days – Regional Contributions
Looking at contributions from WRAP States and other regional sources (Figure 9-40), the three highest contributors to nitrates are CENRAP, New Mexico, and outside domain. Mobile and point sources are the largest source of nitrate emissions. In New Mexico, nitrates are predicted to increase, generally from area sources.

New Mexico Section 308 Regional Haze SIP 91
Figure 9-40: PSAT Nitrate on 20% Worst Days – WRAP States and Regional Contributions
9.4 Summary of WEP Results
Nitrogen oxides (NOx), sulfur oxides (SOx), organic carbon (primary organic aerosol), elemental carbon, fine soil, and coarse mass were analyzed using the Weighted Emissions Potential (WEP) tool. The WEP analysis was developed as a screening tool for states to decide which source regions have the potential to contribute to haze formation at specific Class I areas, based on both the baseline and 2018 emissions inventories. Unlike the SOx/NOx Tracer analysis, this method does not account for chemistry and removal processes. Instead, the WEP analysis relies on an integration of gridded emissions data, meteorological back trajectory residence time data, a one-over-distance factor to approximate deposition, and a normalization of the final results. Residence time over an area is indicative of general flow patterns, but does not necessarily imply the area contributed significantly to haze at a given receptor. Therefore, users are cautioned to view the WEP analysis as one piece of a larger, more comprehensive weight of evidence analysis. The WEP bar charts display normalized (unitless), residence time- and distance-weighted annual emissions value, by emissions source region. These WEP results are reminiscent of the SOx/NOx Tracer tool results. However, the WEP results are considered less rigorous and should be used only as a screening tool to identify regions with the potential to impact Class I areas. The bar chart presents results for the Baseline and 2018 PRP(b) emissions scenarios. Note that a reported change in regional percent contribution between two scenarios does not necessarily imply a larger or smaller impact on haze formation.
9.4.1 Bandelier Wilderness
Nitrogen Oxides Figure 9-41 shows that New Mexico has the highest potential to contribute to nitrogen oxide emissions. Point and on-road mobile sources decrease from the baseline (2000-2004) to 2018, with area and area oil and gas sources increasing. Overall, New Mexico's contributions to nitrogen oxides decrease from the baseline period to 2018. Contributions from Mexico increase over the planning period.
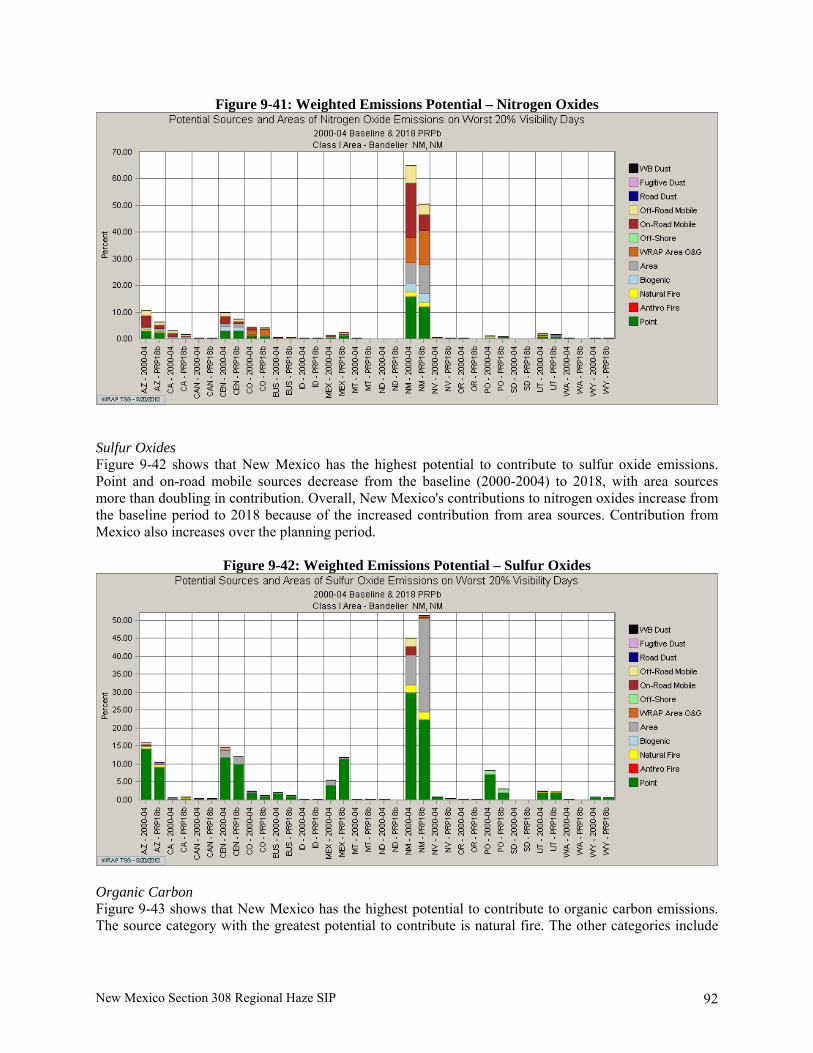
New Mexico Section 308 Regional Haze SIP 92
Figure 9-41: Weighted Emissions Potential – Nitrogen Oxides
Sulfur Oxides Figure 9-42 shows that New Mexico has the highest potential to contribute to sulfur oxide emissions. Point and on-road mobile sources decrease from the baseline (2000-2004) to 2018, with area sources more than doubling in contribution. Overall, New Mexico's contributions to nitrogen oxides increase from the baseline period to 2018 because of the increased contribution from area sources. Contribution from Mexico also increases over the planning period.
Figure 9-42: Weighted Emissions Potential – Sulfur Oxides
Organic Carbon Figure 9-43 shows that New Mexico has the highest potential to contribute to organic carbon emissions. The source category with the greatest potential to contribute is natural fire. The other categories include

New Mexico Section 308 Regional Haze SIP 93
area, on-road and off-road mobile, and fugitive dust sources. Total potential for New Mexico sources to emit organic carbon is projected to increase in 2018, mostly from area sources.
Figure 9-43: Weighted Emissions Potential – Organic Carbon
Elemental Carbon As shown in Figure 9-44, New Mexico has the greatest potential to contribute to elemental carbon. The primary source is natural fire, followed by on- and off-road mobile sources. Elemental carbon from on- and off-road mobile sources is expected to decrease by 2018.
Figure 9-44: Weighted Emissions Potential – Elemental Carbon
Fine Particulate Matter Sources of fine particulate matter from New Mexico have the greatest potential to contribute on the 20% worst days. The potential for fine PM from New Mexico, CENRAP states, Arizona and Mexico is

New Mexico Section 308 Regional Haze SIP 94
expected to increase in 2018. The source categories in New Mexico with the greatest potential to contribute are area and fugitive dust.
Figure 9-45: Weighted Emissions Potential – Fine Particulate Matter
Coarse Particulate Matter Figure 9-46 shows that fugitive dust from New Mexico has the greatest potential to contribute to coarse mass.
Figure 9-46: Weighted Emissions Potential – Coarse Particulate Matter
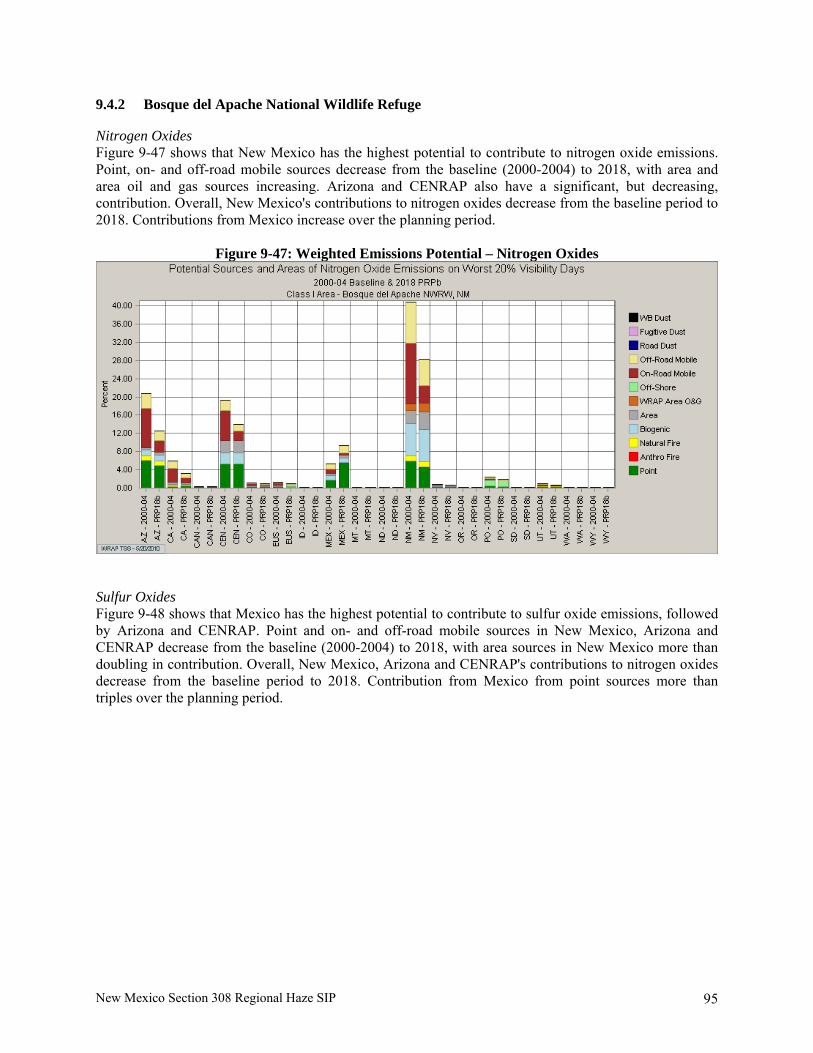
New Mexico Section 308 Regional Haze SIP 95
9.4.2 Bosque del Apache National Wildlife Refuge
Nitrogen Oxides Figure 9-47 shows that New Mexico has the highest potential to contribute to nitrogen oxide emissions. Point, on- and off-road mobile sources decrease from the baseline (2000-2004) to 2018, with area and area oil and gas sources increasing. Arizona and CENRAP also have a significant, but decreasing, contribution. Overall, New Mexico's contributions to nitrogen oxides decrease from the baseline period to 2018. Contributions from Mexico increase over the planning period.
Figure 9-47: Weighted Emissions Potential – Nitrogen Oxides
Sulfur Oxides Figure 9-48 shows that Mexico has the highest potential to contribute to sulfur oxide emissions, followed by Arizona and CENRAP. Point and on- and off-road mobile sources in New Mexico, Arizona and CENRAP decrease from the baseline (2000-2004) to 2018, with area sources in New Mexico more than doubling in contribution. Overall, New Mexico, Arizona and CENRAP's contributions to nitrogen oxides decrease from the baseline period to 2018. Contribution from Mexico from point sources more than triples over the planning period.

New Mexico Section 308 Regional Haze SIP 96
Figure 9-48: Weighted Emissions Potential – Sulfur Oxides
Organic Carbon Figure 9-49 shows that Arizona and New Mexico have the highest potential to contribute to organic carbon emissions. The source category with the greatest potential to contribute is natural fire. Total potential for New Mexico sources to emit organic carbon is projected to decrease in 2018, with contributions from Arizona sources projected to increase, mostly from area sources.
Figure 9-49: Weighted Emissions Potential – Organic Carbon
Elemental Carbon As shown in Figure 9-50, New Mexico has the greatest potential to contribute to elemental carbon, with Arizona also having a large contribution. The primary source is natural fire, followed by on- and off-road mobile sources. Elemental carbon from on- and off-road mobile sources is expected to decrease by 2018.

New Mexico Section 308 Regional Haze SIP 97
Figure 9-50: Weighted Emissions Potential – Elemental Carbon
Fine Particulate Matter Sources of fine particulate matter from New Mexico have the greatest potential to contribute on the 20% worst days. The potential for fine PM from New Mexico, CENRAP states, Arizona and Mexico is expected to increase in 2018. The source category in New Mexico with the greatest potential to contribute is windblown dust.
Figure 9-51: Weighted Emissions Potential – Fine Particulate Matter
Coarse Particulate Matter Figure 9-52 shows that fugitive dust from New Mexico has the greatest potential to contribute to coarse mass, with the greatest contribution from windblown dust.

New Mexico Section 308 Regional Haze SIP 98
Figure 9-52: Weighted Emissions Potential – Coarse Particulate Matter
9.4.3 Carlsbad Caverns National Park
Nitrogen Oxides Figure 9-53 shows that CENRAP states have the highest potential to contribute to nitrogen oxide emissions. On- and off-road mobile sources decrease from the baseline (2000-2004) to 2018, with point sources increasing. Overall, New Mexico's contributions to nitrogen oxides decrease from the baseline period to 2018. Contributions from Mexico increase over the planning period with point sources tripling in contribution.
Figure 9-53: Weighted Emissions Potential – Nitrogen Oxides

New Mexico Section 308 Regional Haze SIP 99
Sulfur Oxides Figure 9-54 shows that Mexico has the highest potential to contribute to sulfur oxide emissions. Point sources almost triple in contribution. Overall, New Mexico's contributions to nitrogen oxides decrease from the baseline period to 2018. CENRAP states' contribution is also significant, but decreases over the planning period.
Figure 9-54: Weighted Emissions Potential – Sulfur Oxides
Organic Carbon Figure 9-55 shows that New Mexico has the highest potential to contribute to organic carbon emissions. The source category with the greatest potential to contribute is natural fire. Contribution from sources in the CENRAP region increase over the planning period, with increases in point and area sources. Contribution from Arizona and Mexico sources also increase over the planning period, with most of the increase coming from area sources. Total potential for New Mexico sources to emit organic carbon is projected to decrease in 2018.

New Mexico Section 308 Regional Haze SIP 100
Figure 9-55: Weighted Emissions Potential – Organic Carbon
Elemental Carbon As shown in Figure 9-56, contribution from CENRAP states is significant for Carlsbad Caverns for elemental carbon. The primary source category is area sources, followed by on- and off-road mobile sources. Elemental carbon from on- and off-road mobile sources is expected to decrease by 2018. Contributions from New Mexico are dominated by fire, and total New Mexico contributions are expected to decrease. Mexico source contributions are expected to increase over the planning period.
Figure 9-56: Weighted Emissions Potential – Elemental Carbon
Fine Particulate Matter Sources of fine particulate matter from the CENRAP region have the greatest potential to contribute on the 20% worst days. The potential for fine PM from CENRAP states and Mexico is expected to increase

New Mexico Section 308 Regional Haze SIP 101
in 2018, with increases in contribution from point sources. The source category in New Mexico with the greatest potential to contribute is windblown dust.
Figure 9-57: Weighted Emissions Potential – Fine Particulate Matter
Coarse Particulate Matter Figure 9-58 shows that windblown dust from the CENRAP region has the greatest potential to contribute to coarse mass. There is also a significant contribution of coarse particulate matter from windblown dust in Mexico and New Mexico.
Figure 9-58: Weighted Emissions Potential – Coarse Particulate Matter

New Mexico Section 308 Regional Haze SIP 102
9.4.4 Gila Wilderness
Nitrogen Oxides Figure 9-59 shows that Arizona, New Mexico and the CENRAP region have the highest potential to contribute to nitrogen oxide emissions. Overall, these contributions decrease from the baseline period to 2018 with the decreases attributable to on- and off-road mobile sources. Contributions from Mexico increase over the planning period.
Figure 9-59: Weighted Emissions Potential – Nitrogen Oxides
Sulfur Oxides Figure 9-60 shows that Mexico has the highest potential to contribute to sulfur oxide emissions in 2018, with Arizona being the largest contributor in the baseline period (2000-2004). Mexico's contribution from point sources more than doubles from the baseline period to 2018. Overall, Arizona's and New Mexico's contributions to nitrogen oxides decrease from the baseline period to 2018.

New Mexico Section 308 Regional Haze SIP 103
Figure 9-60: Weighted Emissions Potential – Sulfur Oxides
Organic Carbon Figure 9-61 shows that New Mexico has the highest potential to contribute to organic carbon emissions. The source category with the greatest potential to contribute is natural fire. The other categories include area, on-road and off-road mobile, and fugitive dust sources. Total potential for Arizona sources to emit organic carbon is projected to increase in 2018, mostly from area sources. New Mexico sources decrease slightly in 2018.
Figure 9-61: Weighted Emissions Potential – Organic Carbon
Elemental Carbon As shown in Figure 9-62, New Mexico has the greatest potential to contribute to elemental carbon. The primary source is natural fire, followed by on- and off-road mobile sources. Arizona sources also have a significant contribution. Elemental carbon from on- and off-road mobile sources is expected to decrease by 2018.

New Mexico Section 308 Regional Haze SIP 104
Figure 9-62: Weighted Emissions Potential – Elemental Carbon
Fine Particulate Matter Sources of fine particulate matter from New Mexico have the greatest potential to contribute on the 20% worst days. The potential for fine PM from New Mexico, CENRAP states, Arizona and Mexico is expected to increase in 2018. The source categories in New Mexico with the greatest potential to contribute are natural fire, fugitive dust and windblown dust. Point sources in Mexico are shown to double in contribution by 2018.
Figure 9-63: Weighted Emissions Potential – Fine Particulate Matter
Coarse Particulate Matter Figure 9-64 shows that windblown dust from New Mexico has the greatest potential to contribute to coarse mass. Point and road dust contribution is expected to increase over the planning period. Arizona and Mexico contributions are also expected to increase over the planning period. The CENRAP region contribution is also significant.

New Mexico Section 308 Regional Haze SIP 105
Figure 9-64: Weighted Emissions Potential – Coarse Particulate Matter
9.4.5 Pecos Wilderness, Wheeler Peak Wilderness
Nitrogen Oxides Figure 9-65 shows that New Mexico has the highest potential to contribute to nitrogen oxide emissions. Point and on-road mobile sources decrease from the baseline (2000-2004) to 2018, with area oil and gas sources increasing. Overall, New Mexico's contributions to nitrogen oxides decrease from the baseline period to 2018.
Figure 9-65: Weighted Emissions Potential – Nitrogen Oxides

New Mexico Section 308 Regional Haze SIP 106
Sulfur Oxides Figure 9-66 shows that New Mexico has the highest potential to contribute to sulfur oxide emissions. Point and on- and off-road mobile sources decrease from the baseline (2000-2004) to 2018, with area sources more than doubling in contribution. Overall, New Mexico's contributions to nitrogen oxides decrease from the baseline period to 2018. Contribution from Mexico increases over the planning period.
Figure 9-66: Weighted Emissions Potential – Sulfur Oxides
Organic Carbon Figure 9-67 shows that New Mexico has the highest potential to contribute to organic carbon emissions. The source category with the greatest potential to contribute is natural fire. The other categories include area and on- and off-road mobile sources. Total potential for New Mexico sources to emit organic carbon is projected to either increase or decrease significantly in 2018.
Figure 9-67: Weighted Emissions Potential – Organic Carbon

New Mexico Section 308 Regional Haze SIP 107
Elemental Carbon As shown in Figure 9-68, New Mexico has the greatest potential to contribute to elemental carbon. The primary source is natural fire, followed by on- and off-road mobile sources. Elemental carbon from on- and off-road mobile sources is expected to decrease by 2018.
Figure 9-68: Weighted Emissions Potential – Elemental Carbon
Fine Particulate Matter Sources of fine particulate matter from New Mexico have the greatest potential to contribute on the 20% worst days. The potential for fine PM from New Mexico, CENRAP states, Arizona and Mexico is expected to increase in 2018. The source categories in New Mexico with the greatest potential to contribute are area and fugitive dust.
Figure 9-69: Weighted Emissions Potential – Fine Particulate Matter
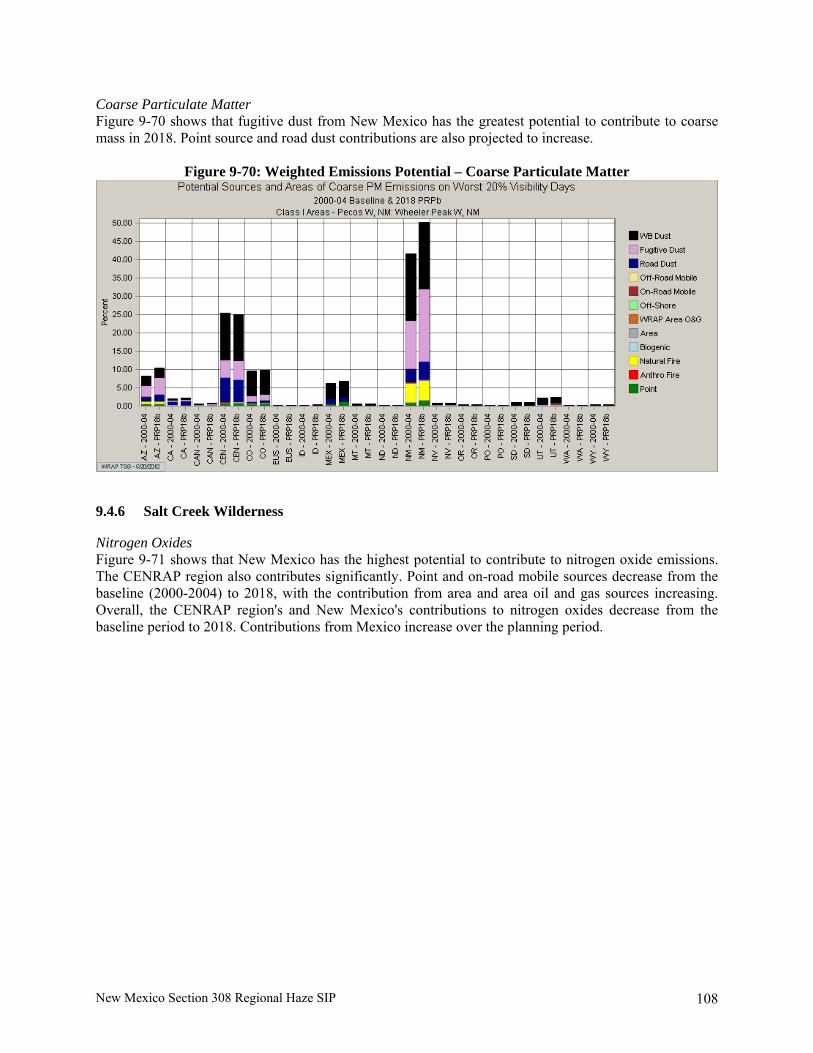
New Mexico Section 308 Regional Haze SIP 108
Coarse Particulate Matter Figure 9-70 shows that fugitive dust from New Mexico has the greatest potential to contribute to coarse mass in 2018. Point source and road dust contributions are also projected to increase.
Figure 9-70: Weighted Emissions Potential – Coarse Particulate Matter
9.4.6 Salt Creek Wilderness
Nitrogen Oxides Figure 9-71 shows that New Mexico has the highest potential to contribute to nitrogen oxide emissions. The CENRAP region also contributes significantly. Point and on-road mobile sources decrease from the baseline (2000-2004) to 2018, with the contribution from area and area oil and gas sources increasing. Overall, the CENRAP region's and New Mexico's contributions to nitrogen oxides decrease from the baseline period to 2018. Contributions from Mexico increase over the planning period.
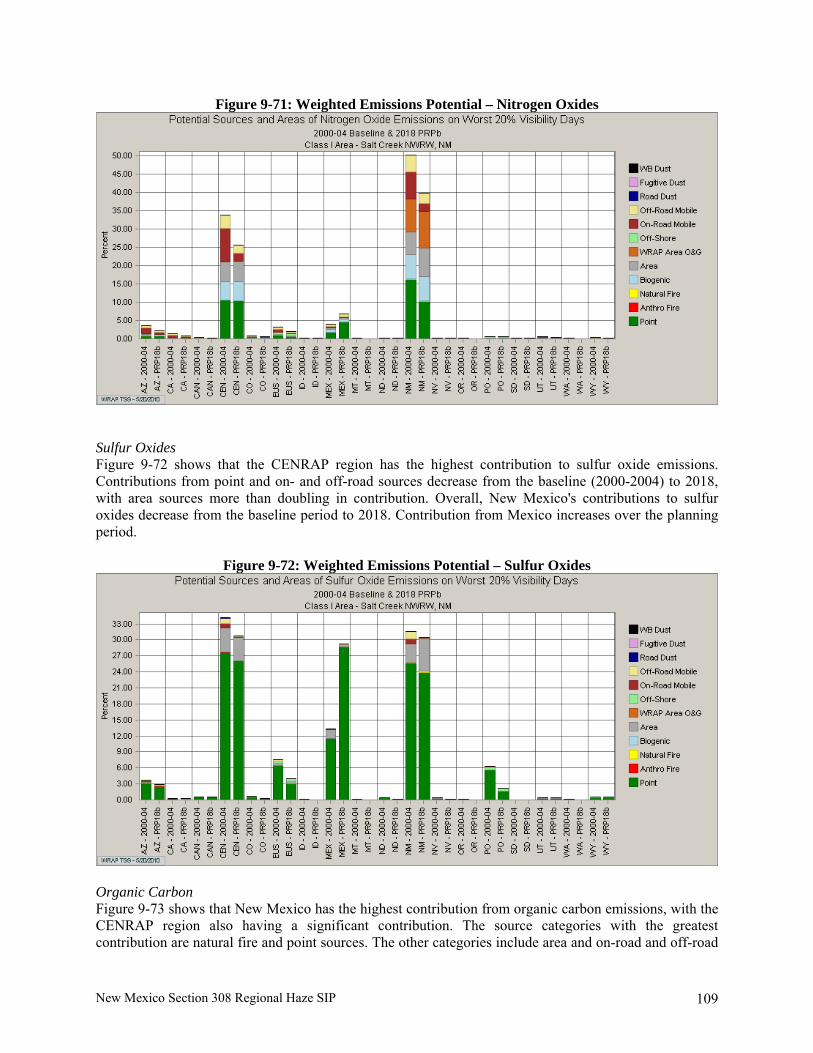
New Mexico Section 308 Regional Haze SIP 109
Figure 9-71: Weighted Emissions Potential – Nitrogen Oxides
Sulfur Oxides Figure 9-72 shows that the CENRAP region has the highest contribution to sulfur oxide emissions. Contributions from point and on- and off-road sources decrease from the baseline (2000-2004) to 2018, with area sources more than doubling in contribution. Overall, New Mexico's contributions to sulfur oxides decrease from the baseline period to 2018. Contribution from Mexico increases over the planning period.
Figure 9-72: Weighted Emissions Potential – Sulfur Oxides
Organic Carbon Figure 9-73 shows that New Mexico has the highest contribution from organic carbon emissions, with the CENRAP region also having a significant contribution. The source categories with the greatest contribution are natural fire and point sources. The other categories include area and on-road and off-road

New Mexico Section 308 Regional Haze SIP 110
mobile sources. Total potential for New Mexico sources to emit organic carbon is projected to decrease in 2018.
Figure 9-73: Weighted Emissions Potential – Organic Carbon
Elemental Carbon As shown in Figure 9-74, the CENRAP region and New Mexico have the greatest contribution to elemental carbon. For CENRAP, the primary source is area, followed by on- and off-road mobile sources. Off-road mobile sources in New Mexico are the highest contribution. Elemental carbon from on- and off-road mobile sources is expected to decrease by 2018.
Figure 9-74: Weighted Emissions Potential – Elemental Carbon

New Mexico Section 308 Regional Haze SIP 111
Fine Particulate Matter Sources of fine particulate matter from CENRAP have the greatest contribution on the 20% worst days. The contribution of fine PM from CENRAP states and Mexico is expected to increase in 2018. The source categories in New Mexico with the greatest potential to contribute are windblown and fugitive dust.
Figure 9-75: Weighted Emissions Potential – Fine Particulate Matter
Coarse Particulate Matter Figure 9-76 shows that windblown dust from the CENRAP region has the greatest potential to contribute to coarse mass.
Figure 9-76: Weighted Emissions Potential – Coarse Particulate Matter

New Mexico Section 308 Regional Haze SIP 112
9.4.7 San Pedro Parks Wilderness
Nitrogen Oxides Figure 9-77 shows that New Mexico has the highest potential to contribute to nitrogen oxide emissions. Point and on-road mobile sources decrease from the baseline (2000-2004) to 2018, with area and area oil and gas sources increasing. Overall, New Mexico's contributions to nitrogen oxides decrease from the baseline period to 2018.
Figure 9-77: Weighted Emissions Potential – Nitrogen Oxides
Sulfur Oxides Figure 9-78 shows that New Mexico has the highest potential to contribute to sulfur oxide emissions. Point and on-road mobile sources decrease from the baseline (2000-2004) to 2018, with area sources more than doubling in contribution. Contribution from Mexico increases over the planning period.
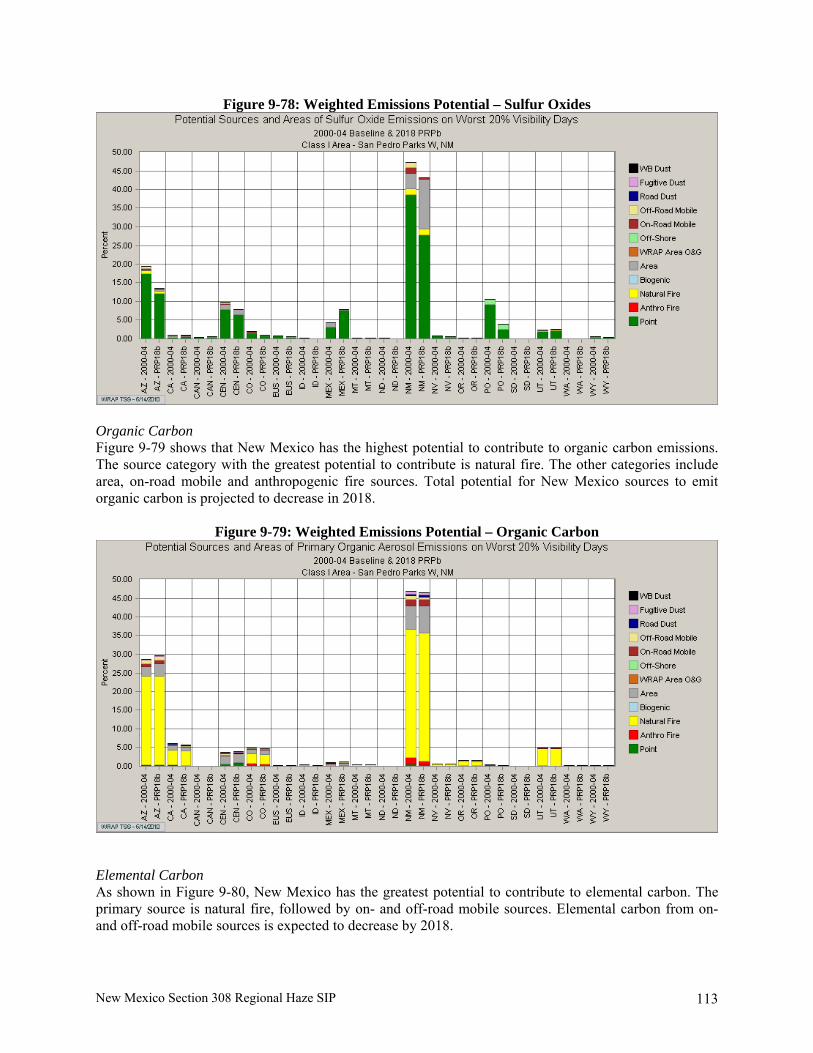
New Mexico Section 308 Regional Haze SIP 113
Figure 9-78: Weighted Emissions Potential – Sulfur Oxides
Organic Carbon Figure 9-79 shows that New Mexico has the highest potential to contribute to organic carbon emissions. The source category with the greatest potential to contribute is natural fire. The other categories include area, on-road mobile and anthropogenic fire sources. Total potential for New Mexico sources to emit organic carbon is projected to decrease in 2018.
Figure 9-79: Weighted Emissions Potential – Organic Carbon
Elemental Carbon As shown in Figure 9-80, New Mexico has the greatest potential to contribute to elemental carbon. The primary source is natural fire, followed by on- and off-road mobile sources. Elemental carbon from on- and off-road mobile sources is expected to decrease by 2018.

New Mexico Section 308 Regional Haze SIP 114
Figure 9-80: Weighted Emissions Potential – Elemental Carbon
Fine Particulate Matter Sources of fine particulate matter from New Mexico have the greatest potential to contribute on the 20% worst days. The potential for fine PM from New Mexico, CENRAP states, Arizona and Mexico is projected to increase in 2018. The source categories in New Mexico with the greatest potential to contribute are windblown and fugitive dust.
Figure 9-81: Weighted Emissions Potential – Fine Particulate Matter
Coarse Particulate Matter Figure 9-82 shows that fugitive dust from New Mexico has the greatest potential to contribute to coarse mass.

New Mexico Section 308 Regional Haze SIP 115
Figure 9-82: Weighted Emissions Potential – Coarse Particulate Matter
9.4.8 White Mountain Wilderness
Nitrogen Oxides Figure 9-83 shows that CENRAP and New Mexico have the highest contribution of nitrogen oxide. On- and off-road mobile source contribution decreases from the baseline (2000-2004) to 2018. Overall, New Mexico's contributions to nitrogen oxides decrease from the baseline period to 2018. Contributions from Mexico increase over the planning period.
Figure 9-83: Weighted Emissions Potential – Nitrogen Oxides

New Mexico Section 308 Regional Haze SIP 116
Sulfur Oxides Figure 9-84 shows that the CENRAP region has highest contribution to sulfur oxide emissions, with New Mexico also having a large contribution. Contribution from Mexico point sources increases significantly over the planning period.
Figure 9-84: Weighted Emissions Potential – Sulfur Oxides
Organic Carbon Figure 9-85 shows that New Mexico has the highest contribution of organic carbon emissions. The source category with the greatest contribution in New Mexico is natural fire. The other categories include area, on-road and off-road mobile, and fugitive dust sources. Contribution from the CENRAP region Arizona is projected to increase. Total potential for New Mexico sources to emit organic carbon is projected to decrease in 2018.
Figure 9-85: Weighted Emissions Potential – Organic Carbon

New Mexico Section 308 Regional Haze SIP 117
Elemental Carbon As shown in Figure 9-86, New Mexico sources have the greatest contribution of elemental carbon. The primary source for New Mexico is fire, followed by on- and off-road mobile sources. Contribution from elemental carbon from on- and off-road mobile sources is expected to decrease by 2018.
Figure 9-86: Weighted Emissions Potential – Elemental Carbon
Fine Particulate Matter Sources of fine particulate matter from the CENRAP region have the greatest contribution on the 20% worst days. The source categories in New Mexico with the greatest potential to contribute are fugitive and windblown dust.
Figure 9-87: Weighted Emissions Potential – Fine Particulate Matter

New Mexico Section 308 Regional Haze SIP 118
Coarse Particulate Matter Figure 9-88 shows that the CENRAP region has the greatest contribution to coarse mass. Road, fugitive, and windblown dust are large contributors in CENRAP, with fugitive and windblown dust being the largest contributors from New Mexico.
Figure 9-88: Weighted Emissions Potential – Coarse Particulate Matter

New Mexico Section 308 Regional Haze SIP 119
CHAPTER 10: BEST AVAILABLE RETROFIT TECHNOLOGY (BART) EVALUATION
10.1 Introduction
In 1999, the EPA published a final rule to address a type of visibility impairment known as regional haze (64 FR 35714, July 1, 1999). The regional haze rule requires States to submit state implementation plans (SIPs) to address regional haze visibility impairment in 156 Federally-protected parks and wilderness areas. The 1999 rule was issued to fulfill a long-standing EPA commitment to address regional haze under the authority and requirements of sections 169A and 169B of the Clean Air Act (CAA).1 As required by the CAA, the EPA included in the final regional haze rule a requirement for Best Available Retrofit Technology (BART) for certain large stationary sources. The regulatory requirements for BART were codified at 40 CFR 50.308(e) and in definitions that appear in 40 CFR 50.301.
The BART-eligible sources are those sources which have the potential to emit 250 tons per year or more of a visibility impairing air pollutant, were put in place between August 7, 1962 and August 7, 1977, and whose operations fall within one or more of 26 specifically listed source categories. Under the CAA, BART is required for any BART-eligible source which a State determines “emits any air pollutant which may reasonably be anticipated to cause or contribute to any impairment of visibility in any such area.” Accordingly, for stationary sources meeting these criteria, States must address the BART requirement when they develop their regional haze SIPs. The EPA published a second rulemaking on June 6, 2005 that made changes to the Final Rule published July 1, 1999. The second rulemaking was in response to a U.S. District Court of Appeals ruling that vacated part of the regional haze rule. The June 6, 2005 Final Rule required the BART analysis to include an analysis of the degree of visibility improvement resulting from the use of control technology at BART-subject sources; revised the BART provisions; included new BART Guidelines contained in a new Appendix Y to Part 51; and added the requirement that States use Appendix Y for determining BART at certain large electrical generating units (EGUs). The Guidelines also contained specific presumptive limits for SO2 and NOx for certain large EGUs based on fuel type, unit size, cost effectiveness, and presence or absence of pre-existing controls. For NOx emissions, the EPA directs states to generally require owners and operators to meet the presumptive limits at coal-fired EGUs greater than 200 MW at power plants with a total generating capacity greater than 750 MW. The presumptive limits for NOx are based on coal type, boiler type and whether SCR or SNCR are already installed at the source.
10.2 SO2: Regional SO2 Milestone and Backstop Trading Program
New Mexico was a §309 state participating in the Regional SO2 Milestone and Backstop Trading Program from 2003 through 2010. Section 308(e)(2) provides states with the option to implement or require participation in an emissions trading program or other alternative measure rather than to require sources subject to BART to install, operate, and maintain additional control technology to meet an established emission limit on a continuous basis. However, the alternate program must achieve greater reasonable progress than would be accomplished by installing BART. A demonstration that the alternate program can achieve greater reasonable progress is prescribed by §308(e)(2)(i). As part of the §309 program, participating states, including New Mexico, submitted an annual Regional Sulfur Dioxide Emissions and Milestone Report that compares actual emissions to pre-established milestones. Participating states have been filing these reports since 2003. Each year, states have been able

New Mexico Section 308 Regional Haze SIP 120
to demonstrate that actual SO2 emissions are well below the milestones. The actual emissions and their respective milestones are shown below:
Table 10-1 Regional Sulfur Dioxide Emissions and Milestone Report Summary Year Reported SO2 Emissions (tons) 3-year Milestone Average (tons) 2003 330,679 447,383 2004 337,970 448,259 2005 304,591 446,903 2006 279,134 420,194 2007 273,663 420,637 2008 244,189 378,398
10.3 Summary of BART Modeling Results (Visibility Impact Analysis)
After determining BART-eligibility, the State must then determine whether the air pollution emission unit is potentially-subject-to-BART. EPA finalized several options that allowed States flexibility when making the determination of whether a source "emits any pollutants which may reasonably be anticipated to cause or contribute to any visibility impairment." Option 1: All BART-eligible sources are Subject to BART EPA provided the States with the discretion to consider all BART-eligible sources within the State to be "reasonably anticipated to cause or contribute" to some degree of visibility impairment in a Class I area. EPA held that this option is consistent with the American Corn Growers court's decision, as it would be an impermissible constraint of State authority for the EPA to force States to conduct individualized analyses in order to determine that a BART-eligible source "emits any air pollutant which may reasonably anticipated to cause or contribute to any impairment of visibility in any [Class I] area." Option 2: All BART-Eligible Sources Do Not Cause or Contribute to Regional Haze EPA also provided States with the option of performing an analysis to show that the full group of BART-eligible sources in a State may not, as a whole, be reasonably anticipated to cause or contribute to any visibility impairment in Class I areas. Although the option was provided, EPA did also state that it anticipated that in most, if not all States, BART eligible-sources are likely to cause or contribute to some level of visibility impairment in at least one Class I area. Option 3: Case-by-Case BART Analysis The final option that was provided to the States was to consider the individual contributions of a BART-eligible source to determine whether the facility is subject-to-BART. Specifically, EPA allowed States to choose to undertake an analysis of each BART-eligible source in the State in considering whether each such source "emit[s] any air pollutant which may reasonably be anticipated to cause or contribute to any impairment of visibility in any [Class I] area." Alternatively, States may choose to presume that all BART-eligible sources within the State meet this applicability test, but provide sources with the ability to demonstrate on a case-by-case basis that this is not the case.
10.3.1 New Mexico Process
When considering the options provided by EPA, NMED determined that the third option is the most consistent with the American Corn Growers case, as this option provides a rebuttable method for the

New Mexico Section 308 Regional Haze SIP 121
evaluation of the visibility impact from a single source. If the air dispersion modeling analysis shows that a facility causes or contributes to Regional Haze, then it is required to address BART. A State is also provided with flexibility under this option, as it may exempt from BART any source that is not reasonably anticipated to cause or contribute to visibility degradation in a Class I area. In May 2006, the New Mexico Environment Department Air Quality Bureau (Department) conducted an internal review of sources potentially subject to the BART rule. Section II of the Guidelines prescribes how to identify BART-eligible sources. States are required to identify those sources that satisfy the following criteria: sources that fall within the 26 listed source categories as listed in the CAA, sources that were “in existence” on August 7, 1977 but were not “in operation” before August 7, 1962, and sources that have a current potential to emit that is greater than 250 tons per year of any single visibility impairing pollutant. New Mexico identified 11 sources as BART-eligible sources as part of this review. The Guidelines then prescribe to the states how to identify those sources that are subject to BART. At this point, states are directed to either (1) make BART determinations for all BART-eligible sources, or (2) to consider exempting some of the sources from BART because they may not reasonably be anticipated to cause or contribute to any visibility impairment in a Class I area. New Mexico opted to perform an initial screening model on the BART-eligible sources to determine whether a source did cause or contribute to any visibility impairment. The Guidelines direct States that if the analysis shows that an individual source or group of sources is not reasonably anticipated to cause or contribute to any visibility impairment in a Class I area, then the States do not need to make a BART determination for that source or group of sources. The Western Regional Air Partnership (WRAP) performed the initial BART modeling for the state of New Mexico. The procedures used are outlined in the WRAP Regional Modeling Center (RMC) BART Modeling Protocol that is available at: http://pah.cert.ucr.edu/aqm/308/bart/WRAP_RMC_BART_Protocol_Aug15_2006.pdf The basic assumptions in the WRAP BART CALMET/CALPUFF modeling used for New Mexico are as follows: • Use of three years of modeling of 2001, 2002, and 2003. • Visibility impacts due to emissions of SO2, NOx and primary PM emissions were calculated. PM
emissions were modeled as PM2.5. • Visibility was calculated using the Original IMPROVE equation and Annual Average Natural
Conditions. Initial modeling was performed for the 11 source complexes in New Mexico with visibility estimated from the sources’ SO2, NOx, and PM emissions. Then for those sources whose 98th percentile visibility impacts at any Class I area due to their combined SO2, NOx, and PM emissions exceeded the 0.5 dv significance threshold, the separate contribution to visibility at Class I areas was assessed for SO2 alone (SO4), NOx alone (NO3), PM alone (PMF) and combined NOx plus PM emissions (NO3 + PMF). Of the 11 source complexes analyzed, only one source complex’s visibility impacts at any Class I area due to combined SO2, NOx, and PM emissions exceeded the 0.5 dv threshold (PNM San Juan Generating Station Boilers #1-4). Of the 10 other source complexes, none exceed a 0.33 dv impact. Consequently, only the PNM San Juan Boilers #1-4 were subjected to a BART determination.

New Mexico Section 308 Regional Haze SIP 122
On November 9, 2006, the New Mexico Environment Department informed PNM that the modeling performed by the WRAP indicated the visibility impairment from the San Juan Generating Station (SJGS) was over the 0.5 dv threshold, and was therefore subject to a BART determination. In response, Black & Veatch (B&V), on behalf of PNM, submitted the BART Modeling Protocol document which described the CALPUFF modeling methodology to be used as part of the BART engineering evaluation for Units 1-4 at the SJGS. The results are presented in Table 10-2 below.
Table 10-2: Visibility Impact Analysis of PNM's San Juan Generating Station NM SRC02 Unit # 350450902, PNM SJ #1-4: SO2 = 35,735 TPY; NOx = 38,763 TPY; PM = 3,884 TPY Annual Average Natural Conditions Class I Area with at least 1 receptor within 300 km of source
Minimum Distance 98th Percentile for Each Year 98th
Class I Area (km) 2001 2002 2003 3 year AVG
Mesa Verde NP 40 5.54 5.34 5.30 5.40 Weminuche Wilderness 98 2.24 2.99 2.41 2.55 San Pedro Parks Wilderness 155 3.80 4.07 4.14 4.01 La Garita Wilderness 169 1.63 1.82 1.77 1.74 Canyonlands NP 170 6.21 4.33 4.44 4.99 Black Canyon Gunnison NM 203 2.38 2.27 2.43 2.36 Bandelier NM 210 2.47 2.90 3.08 2.82 Petrified Forest NP 213 1.62 1.27 1.03 1.31 West Elk Wilderness 216 2.14 1.90 2.20 2.08 Arches NP 222 4.06 3.71 3.59 3.79 Capitol Reef NP 232 4.00 2.02 2.35 2.79 Pecos Wilderness 248 2.17 2.63 2.81 2.53 Wheeler Peak Wilderness 258 1.94 1.73 1.97 1.88 Great Sand Dunes NM 269 1.47 1.59 1.74 1.60 Maroon Bells-Snowmass WA 271 1.19 1.27 1.15 1.21 Grand Canyon NP 285 2.12 1.50 1.18 1.60
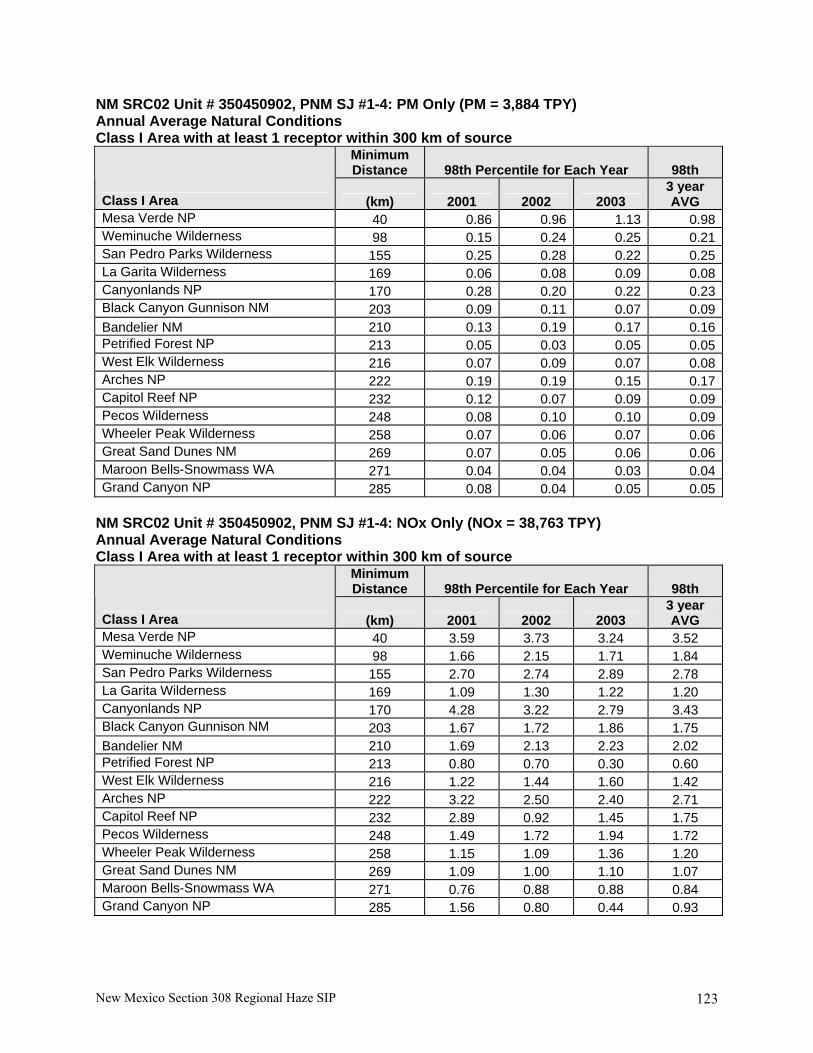
New Mexico Section 308 Regional Haze SIP 123
NM SRC02 Unit # 350450902, PNM SJ #1-4: PM Only (PM = 3,884 TPY) Annual Average Natural Conditions Class I Area with at least 1 receptor within 300 km of source
Minimum Distance 98th Percentile for Each Year 98th
Class I Area (km) 2001 2002 2003 3 year AVG
Mesa Verde NP 40 0.86 0.96 1.13 0.98Weminuche Wilderness 98 0.15 0.24 0.25 0.21San Pedro Parks Wilderness 155 0.25 0.28 0.22 0.25La Garita Wilderness 169 0.06 0.08 0.09 0.08Canyonlands NP 170 0.28 0.20 0.22 0.23Black Canyon Gunnison NM 203 0.09 0.11 0.07 0.09Bandelier NM 210 0.13 0.19 0.17 0.16Petrified Forest NP 213 0.05 0.03 0.05 0.05West Elk Wilderness 216 0.07 0.09 0.07 0.08Arches NP 222 0.19 0.19 0.15 0.17Capitol Reef NP 232 0.12 0.07 0.09 0.09Pecos Wilderness 248 0.08 0.10 0.10 0.09Wheeler Peak Wilderness 258 0.07 0.06 0.07 0.06Great Sand Dunes NM 269 0.07 0.05 0.06 0.06Maroon Bells-Snowmass WA 271 0.04 0.04 0.03 0.04Grand Canyon NP 285 0.08 0.04 0.05 0.05
NM SRC02 Unit # 350450902, PNM SJ #1-4: NOx Only (NOx = 38,763 TPY) Annual Average Natural Conditions Class I Area with at least 1 receptor within 300 km of source
Minimum Distance 98th Percentile for Each Year 98th
Class I Area (km) 2001 2002 2003 3 year AVG
Mesa Verde NP 40 3.59 3.73 3.24 3.52 Weminuche Wilderness 98 1.66 2.15 1.71 1.84 San Pedro Parks Wilderness 155 2.70 2.74 2.89 2.78 La Garita Wilderness 169 1.09 1.30 1.22 1.20 Canyonlands NP 170 4.28 3.22 2.79 3.43 Black Canyon Gunnison NM 203 1.67 1.72 1.86 1.75 Bandelier NM 210 1.69 2.13 2.23 2.02 Petrified Forest NP 213 0.80 0.70 0.30 0.60 West Elk Wilderness 216 1.22 1.44 1.60 1.42 Arches NP 222 3.22 2.50 2.40 2.71 Capitol Reef NP 232 2.89 0.92 1.45 1.75 Pecos Wilderness 248 1.49 1.72 1.94 1.72 Wheeler Peak Wilderness 258 1.15 1.09 1.36 1.20 Great Sand Dunes NM 269 1.09 1.00 1.10 1.07 Maroon Bells-Snowmass WA 271 0.76 0.88 0.88 0.84 Grand Canyon NP 285 1.56 0.80 0.44 0.93

New Mexico Section 308 Regional Haze SIP 124
NM SRC02 Unit # 350450902, PNM SJ #1-4: SO2 Only (SO2 = 35,735 TPY) Annual Average Natural Conditions Class I Area with at least 1 receptor within 300 km of source
Minimum Distance 98th Percentile for Each Year 98th
Class I Area (km) 2001 2002 2003 3 year AVG
Mesa Verde NP 40 2.78 3.17 3.14 3.03 Weminuche Wilderness 98 1.28 1.23 0.89 1.13 San Pedro Parks Wilderness 155 1.77 2.13 1.72 1.87 La Garita Wilderness 169 0.81 0.89 0.70 0.80 Canyonlands NP 170 2.65 1.79 2.06 2.17 Black Canyon Gunnison NM 203 0.92 1.03 0.89 0.95 Bandelier NM 210 1.17 1.62 1.24 1.34 Petrified Forest NP 213 0.94 0.83 0.94 0.91 West Elk Wilderness 216 0.75 0.79 0.59 0.71 Arches NP 222 1.74 1.22 1.33 1.43 Capitol Reef NP 232 1.68 1.47 1.32 1.49 Pecos Wilderness 248 1.09 1.16 1.24 1.16 Wheeler Peak Wilderness 258 1.00 0.86 1.06 0.97 Great Sand Dunes NM 269 0.64 0.69 0.68 0.67 Maroon Bells-Snowmass WA 271 0.54 0.62 0.36 0.51 Grand Canyon NP 285 1.18 0.78 0.73 0.90
NM SRC02 Unit # 350450902, PNM SJ #1-4: PM plus NOx (NOx = 38,763 TPY; PM = 3,884 TPY) Annual Average Natural Conditions Class I Area with at least 1 receptor within 300 km of source
Minimum Distance 98th Percentile for Each Year 98th
Class I Area (km) 2001 2002 2003 3 year AVG
Mesa Verde NP 40 4.27 4.06 3.46 3.93 Weminuche Wilderness 98 1.74 2.28 1.76 1.93 San Pedro Parks Wilderness 155 2.85 2.87 3.07 2.93 La Garita Wilderness 169 1.15 1.36 1.30 1.27 Canyonlands NP 170 4.39 3.33 2.91 3.54 Black Canyon Gunnison NM 203 1.73 1.84 1.90 1.82 Bandelier NM 210 1.77 2.29 2.31 2.12 Petrified Forest NP 213 0.83 0.72 0.31 0.62 West Elk Wilderness 216 1.26 1.50 1.64 1.47 Arches NP 222 3.30 2.65 2.50 2.82 Capitol Reef NP 232 3.06 0.95 1.50 1.83 Pecos Wilderness 248 1.55 1.77 2.04 1.79 Wheeler Peak Wilderness 258 1.20 1.12 1.40 1.24 Great Sand Dunes NM 269 1.14 1.05 1.15 1.11 Maroon Bells-Snowmass WA 271 0.78 0.91 0.91 0.87 Grand Canyon NP 285 1.60 0.82 0.45 0.96

New Mexico Section 308 Regional Haze SIP 125
10.3.2 Subject-to-BART Determination
Once the "universe" of potentially-BART-eligible sources has been set, the State must make a determination about which of these sources are truly subject-to-BART. In order for a source to be subject-to-BART, a State must conclude that emissions of visibility impairing pollution from a BART-eligible source may reasonably be anticipated to cause or contribute to any visibility impairment in a mandatory Class I area. As noted in Section 10.3.1 above, NMED's process resulted in the determination that San Juan Generating Station is subject-to-BART.
10.3.3 Determining BART
Clean Air Act § 169A(g)(7) directs States to consider five factors in making BART determinations. The regional haze rule codified these factors in 40 CFR § 51.308(e)(1)(ii)(B), which directs States to identify the "best system of continuous emissions control technology" taking into account "the technology available, the costs of compliance, the energy and non-air quality environmental impacts of compliance, any pollution control equipment in use at the source, and the remaining useful life of the source." The BART regulations define BART as meaning "…an emission limitation based on the degree of reduction achievable through the application of the best system of continuous emission reduction for each pollutant which is emitted by … [a BART-eligible source]. In its guidance, EPA was clear that each State must determine the appropriate level of BART control for each source that is determined to be subject-to-BART. In making a BART determination, a State must consider the following factors:
(1) The costs of compliance; (2) The energy and non-air quality environmental impacts of compliance; (3) Any existing pollution control technology in use at the source; (4) The remaining useful life of the source; and (5) The degree of improvement in visibility which may reasonably be anticipated to result from the
use of such technology. To consider these factors, New Mexico applied the following 5 step processs as specified in the BART Guidelines at Appendix Y to 40 CFR Part 51: Step 1 – Identify All Available Retrofit Control Technologies Step 2 – Eliminate Technically Infeasible Options Step 3 – Evaluate Control Effectiveness of Remaining Control Technologies Step 4 – Evaluate Impacts and Document the Results
a) Costs of Compliance b) Energy Impacts c) Air quality environmental impacts d) Non-air environmental impacts e) Remaining useful life
Step 5 – Evaluate Visibility Impacts

New Mexico Section 308 Regional Haze SIP 126
10.4 Summary of BART Control Analysis for PNM San Juan
Based on the five factor analysis, the Department has determined that BART for Units 1-4 for PM is existing pulse jet fabric filter control technology and an existing emission rate of 0.015 lb/MMbtu. The Department’s determination of BART was based on the following results of the full five factor analysis:
1. Each of Units 1-4 is equipped with a pulse jet fabric filter (PJFF) and is subject to a federally-enforceable emission limit of 0.015 lb PM/MMbtu.
2. The Department reviewed both the cost-effectiveness and incremental cost-effectiveness of additional control technology (WESP) and found these costs to be excessive. See Table 3.0.
3. There are no non-air impacts associated with the WESP technology. 4. There are additional energy impacts associated with the WESP technology and the Department
considers these costs to be reasonable. 5. The Department reviewed the visibility improvement that resulted from the installation of the
consent decree technology (PJFF and LNB/OFA) and that would result from the addition of WESP technology. The Department determined that on a facility-wide basis the visibility improved by 1.06 deciviews (dv) from the installation of the consent decree technology at Mesa Verde National Park (Mesa Verde). The installation of WESP would result in a facility-wide improvement of 0.62 dv at Mesa Verde.
Based on the five factor analysis, the Department has determined that BART for Units 1-4 for NOx is SCR plus sorbent injection and an emission rate of 0.07 lb/MMbtu. The Department’s determination of BART was based on the following results of the five factor analysis, and additional information submitted in the BART analysis:
1. The cost-effectiveness of SCR + sorbent technology ranges from $5,946/ton for Unit 4 to $7,398/ton for Unit 2, and the incremental cost-effectiveness of SCR + sorbent ranges from $1,691/ton for Unit 4 to $4,431/ton for Unit 2.
2. The cost-effectiveness and incremental cost-effectiveness of SCR + sorbent technology is considered reasonable by the Department. These costs are in line with acceptable cost-effectiveness values for BACT determinations, which involve a similar control technology evaluation process.
3. Annual NOx emissions from the facility will be reduced by 16,100 tons from SCR + sorbent. 4. The Department reviewed the visibility improvement that resulted from the installation of the
SCR + sorbent technology. The Department determined that on a facility-wide basis the visibility improved by 1.34 deciviews (dv) from the installation of SCR + sorbent technology at Mesa Verde, 0.88 dv at San Pedro, 0.75 dv at Bandalier, 0.73 dv at Capital Reef, 0.67 dv at Canyonlands, 0.59 dv at Arches, 0.59 dv at Weminuche, 0.52 dv at Black Canyon, 0.49 dv at La Garita, 0.49 dv at West Elk, 0.44 dv at Grand Canyon, 0.43 dv at Pecos, 0.40 dv at Wheeler Peak, 0.34 dv at Petrified Forest, 0.31 at Great Sand Dunes, and 0.28 dv at Maroon Bells.
5. SCR + sorbent technology reduced the number of days that each Unit exceeded a 0.5 dv impact. For Unit 1, the number of days exceeding 0.5 dv was reduced from 46 days to 16 days; Unit 2’s impact decreased from 46 days to 16 days; Unit 3’s impact decreased from 68 days to 31 days; and Unit 4’s impact decreased from 67 days to 29 days.
6. The installation of SCR + sorbent technology will result in additional energy impacts, no non-air environmental impacts, and the remaining useful life of 20 years did not further impact costs. None of the additional energy impacts prohibit selection of this technology.

New Mexico Section 308 Regional Haze SIP 127
10.5 Visibility Improvement Resulting from BART Evaluation in New Mexico
The visibility improvement resulting from the installation of BART that will be achieved in each Class I area as a result of the emission reduction achievable from San Juan Generating Station is shown in Figure 10-1. The BART determination, including visibility modeling analysis, is included as Appendix A.
Figure 10-1: Visibility Improvement from BART Controls at San Juan Generating Station

New Mexico Section 308 Regional Haze SIP 128
CHAPTER 11: REASONABLE PROGRESS GOAL DEMONSTRATION
11.1 Reasonable Progress Requirements
Several steps for establishing reasonable progress goals were outlined in the RHR and are discussed in the following subsections. Calculate/Estimate Baseline and Natural Visibility Conditions Baseline visibility conditions were determined by the Western Regional Air Partnership (WRAP) Technical Support System (TSS) using the Interagency Monitoring of Protected Visual Environments (IMPROVE) algorithm. The IMPROVE algorithm followed the established guidelines presented in the RHR. To determine baseline visibility conditions, the average degree of visibility (expressed as dv) for the 20% least impaired days and the 20% worst impaired days was calculated, using IMPROVE air quality monitoring data, for each calendar year from 2000 to 2004. The IMPROVE monitoring program collects speciated PM2.5, and PM2.5 and PM10 mass. IMPROVE is a nationwide network which began in 1988 and expanded significantly in 2000 in response to the EPA’s Regional Haze Rule (RHR). The Regional Haze Rule specifically requires data from this program to be used by states and tribes to track progress in reducing haze. The annual values were then averaged over five years to determine the baseline visibility condition values. Baseline visibility is discussed in detail in Chapter 7. Natural conditions are an estimate of the amount of visibility impairment that would occur if no human-caused visibility impairment existed. Natural conditions were determined by the WRAP through the Natural Haze Levels II Committee for the 20% worst visibility days and the 20% best visibility days using available monitoring data and the IMPROVE algorithm. The Natural Haze Levels II Committee was established in 2006 to review and refine the default approach. The committee included representatives from NOAA, NPS, Cooperative Institute for Research in the Atmosphere (CIRA), Regional Planning Organizations (RPOs) and industry representatives, and other participants. The final report of the committee can be found at: http://wrapair.org/forums/aoh/meetings/060726den/NaturalHazeLevelsIIReport.pdf. Additional information about the baseline and natural visibility impairment calculations can be found in Chapter 6. Determine the Uniform Rate of Progress (URP) The URP (also known as the glide slope), which was determined by the State of New Mexico for all mandatory Class I areas within the state, is the rate of visibility change necessary to achieve natural visibility conditions by the year 2064. The URP represents the slope between baseline visibility conditions in 2004 and natural visibility conditions in 2064. Using interpolation, the improvement necessary by 2018 to achieve natural visibility conditions in 2064 can be calculated. The URP is discussed in greater detail in Chapters 6 and 9.

New Mexico Section 308 Regional Haze SIP 129
Table 11-1: 20% Best and Worst Days Baseline, Natural Conditions, and Uniform Rate of Progress Goal for New Mexico Class I Areas
20% Worst Days 20% Best Days
IMPROVE Monitor Name
New Mexico Class I Area
2000-04 Baseline
(dv)
2018 URP
Goal (dv)
2018
Reduction Needed
2064 Natural Conditions
(dv)
2000-04 Baseline
(dv)
2064 Natural Conditions
(dv)
BAND1 Bandelier Wilderness 12.22 10.83 1.39 6.26 4.95 1.28
BOAP1 Bosque del
Apache National Wildlife Refuge
13.8 12.15 1.65 6.73 6.28 2.15
GUMO1 Carlsbad Caverns National Park 17.19 14.73 2.46 6.65 5.95 0.99
GILA1 Gila Wilderness 13.11 11.61 1.50 6.66 3.31 0.52
WHPE1 Pecos/Wheeler Peak Wilderness 10.41 9.40 1.01 6.08 1.22 -0.56
SACR1 Salt Creek Wilderness 18.03 15.41 2.62 6.81 7.84 2.12
SAPE1 San Pedro Parks Wilderness 10.17 9.13 1.04 5.72 1.45 -0.72
WHIT1 White Mountain Wilderness 13.7 12.09 1.61 6.8 3.55 0.66
Four Factor Analysis In an effort to reduce visibility impairing air pollutants, emission control measures had to be evaluated. The four factor analysis process was established in the RHR and is discussed in detail in Section 11.2 of this chapter. Each emission control strategy, as required by the four factor analysis guidelines, was evaluated based on 1) the cost of compliance, 2) time necessary for compliance, 3) the energy and non-air quality environmental impacts of compliance, and 4) the remaining useful life of any existing source subject to such emission controls. Consultation With Other States According to the RHR, the State of New Mexico must consult with other states that may cause or contribute to visibility impairment in New Mexico Class I areas. For the State of New Mexico, consultations with other states contributing to visibility impairment in Class I areas were conducted through the WRAP. Additional information on the state consultations can be found in Chapter 2. Determination of Reasonable Progress Goals Reasonable progress goals, when established, demonstrate the amount of visibility improvement the State of New Mexico believes to be feasible, based on the four factor analysis and Clean Air Act (CAA) requirements, during the first planning period. The reasonable progress goal may be the same, less stringent, or more stringent than the visibility improvement based on the URP. The reasonable progress goals, and the logic used to determine the goals, are discussed in Section 11.3 of this chapter.
11.2 Four Factor Analysis Performed for New Mexico Sources
The four factor analysis, which is provided in the RHR, is a method for evaluating potential control strategies for facilities that are not eligible for Best Available Retrofit Technology (BART). The analysis considers 1) the cost of compliance, 2) the time necessary for compliance, 3) environmental impacts of compliance, and 4) the remaining useful life of the facility. The WRAP hired EC/R Incorporated (EC/R), headquartered in Chapel Hill, North Carolina, to complete the four factor analysis for specific source types throughout the WRAP region (Appendix B). In addition, EC/R completed a four factor analysis for specific sources in New Mexico (Appendix C). Control measures for SO2 and NOx were evaluated for selected sources in New Mexico. Data on emissions of

New Mexico Section 308 Regional Haze SIP 130
volatile organic compounds (VOC) were also collected. In addition, although VOC emission control measures were not explicitly evaluated in the four factor analysis study by EC/R, the impacts of NOx and SO2 controls on VOC were calculated where co-control benefits would occur.
11.2.1 Detailed Description of the Four Factors
Cost of Compliance Both control costs and net annual costs were analyzed for all control measures identified by EC/R. Control costs cover direct and indirect capital costs. Examples of direct capital expenses includes the costs associated with purchased equipment, construction, installation, instrumentation and process controls, ductwork and piping, electrical components, and structural and foundation components. Indirect capital expenses include costs such as engineering and design, contractor fees, startup and performance testing, contingency costs, and process modifications. Net annual costs include the expenses associated with the typical operation of the control equipment over a year. Annual costs include items such as the utility expenses, labor, waste disposal expenses, and amortized costs of the capital investment. All cost estimates calculated by EC/R were updated to 2007 dollars using the Marshall and Swift Equipment Cost Index or the Chemical Engineering Plant Cost Index, which are both published in the journal Chemical Engineering. Time Necessary for Compliance The time necessary for compliance includes the time needed for the State of New Mexico to develop and implement regulations for emissions controls, as well as the time the sources require to procure the capital to purchase the emission control equipment, design and fabricate the equipment, and to install the emission controls. Energy and Other Non-Air Quality Environmental Impacts Emission control devices often require some form of energy input to operate. To determine the energy requirements for a particular control device, the electricity needs, steam requirements, increased fuel requirements, and any additional energy inputs required were quantified. Only the direct energy requirements were considered; indirect energy needs, such as the amount of energy required to produce the fuel for the control device, were not analyzed. In addition, any impacts the control technologies had on other source processes, such as boiler efficiency, were not evaluated. Remaining Equipment Life at Source The remaining equipment life of the source will impact the cost of emission control technologies if the expected life of the source is less than the lifetime of the pollution control device being considered. Therefore, if the remaining equipment life is less than the lifetime of the pollution control device, the capital cost of the pollution control device is amortized for the remaining life of the emission source. The ages of major pieces of equipment were determined where possible, and compared with the service life of pollution control equipment. The impact of a limited useful life on the amortization period for control equipment was then evaluated, along with the impact on annualized cost-effectiveness.
11.2.2 Source Selection Process for Four Factor Analysis
To select the sources that would undergo the required four factor analysis, emission data for sources in New Mexico had to first be collected. Emissions assessments were initially based on 2002 emissions inventory in the WRAP Emissions Data Management System (EDMS) which consists of data submitted by the WRAP states in 2004. New Mexico then reviewed the emissions data and parameters from the EDMS used for this analysis and provided updated data when applicable. In some cases, detailed data on PM10 and PM2.5 emissions were not available from the WRAP inventory. Therefore, PM10 and PM2.5 data

New Mexico Section 308 Regional Haze SIP 131
from the U.S. Environmental Protection Agency’s (EPA) 2002 National Emissions Inventory (NEI) were used to supplement the WRAP inventory where necessary. Once the important emission sources were identified within a given emission source category, a list of potential additional control technologies was compiled from a variety of sources, including control techniques guidelines published by the EPA, emission control cost models such as AirControlNET and CUECost, Best Available Retrofit Technology (BART) analyses, White Papers prepared by the Midwest Regional Planning Organization (MRPO), and a menu of control options developed by the National Association of Clean Air Agencies (NACAA). The options for each source category were then narrowed to a set of technologies that would achieve the emission reduction target under consideration. From this evaluation the following sources were identified as major emission sources for the WRAP states:
• Reciprocal Internal Combustion Engines and Turbines; • Oil and Gas Exploration and Production Field Operations; • Natural Gas Processing Operations; • Industrial Boilers; • Cement Kilns; • Sulfuric Acid Manufacturing Plants; • Pulp and Paper Lime Kilns; and • Oil Refineries.
Information regarding each of these sources is outlined in ER/C's analysis report, Supplementary Information for Four Factor Analyses by WRAP States in Appendix B.
11.2.3 Four Factor Analyses for New Mexico
A separate Four-factor analysis was conducted by ER/C for selected emission sources at three New Mexico petroleum refineries (Appendix C). The following facilities and emission sources were evaluated:
• Navajo Refining Co., Artesia Refinery – Fluid Catalytic Cracking Unit (FCCU) #1, catalyst regeneration and process heater;
• Western Refining Southwest, Bloomfield Refinery – FCCU #1, catalyst regeneration and process heater; and
• Western Refining Southwest, Gallup Refinery – CO Boiler Unit #1 Navajo Refining Co., Artesia Refinery One unit, the Fluid Catalytic Cracking Unit (FCCU) #1, catalyst regeneration and process heater, at the Navajo Refining Co. was selected for the four factor analysis in New Mexico. The Navajo Artesia refinery FCCU has a capacity of 27,000 barrels per day (bbl/day). In catalytic cracking, the heavier fractions of crude petroleum are treated with a catalyst which breaks the petroleum molecules into lighter compounds. The catalyst is continuously cycled between the cracking and a separate regeneration reactor in order to burn off coke build-up. Six possible emission control devices were identified and analyzed for the FCCU regenerator and heater using the four factor analysis process: optimization of NOx reduction catalyst, selective catalytic reduction (SCR), low NOx burners (LNB), selective non-catalytic reduction (SNCR), flue gas recirculation (FGR), and ultra low NOx burners (ULNB). LNB technology reduces the amount of NOx produced by reducing the flame temperature. The flame temperature is reduced by controlling the fuel and air mixing, which creates a larger, branched flame. FRG entails re-circulating a portion of relatively cool exhaust gases back into the combustion process in order to lower the flame temperature and reduce NOx formation. With SNCR, an aqueous reagent, typically either ammonia or urea, is injected into the hot flue

New Mexico Section 308 Regional Haze SIP 132
gas. The reagent reacts with the NOx in the gas to form N2 and water vapor. Similar to the SNCR technology, SCR technology uses ammonia to reduce NOx to N2 and H2O. However, with SCR the NOx in the flue gas reacts with the ammonia within a catalyst bed. The optimization of NOx reduction catalyst has already been completed and analyzed for the Navajo Refinery. Cost The estimated capital costs, annual costs, and the cost effectiveness for the possible emission control devices at the Navajo Refinery are shown in Table 11-2. For each option, the table gives an estimate of the capital cost to install the necessary equipment, and the total annual cost of control, including the amortized cost associated with the capital equipment cost. The table also shows the estimated cost effectiveness for each control measure, in terms of the cost per ton of emission reduction. While SCR is expected to be far more efficient in controlling NOx emissions than LNB or LNB and FRG, the estimated capital and annual costs are far higher than the costs associated with LNB or LNB and FRG. As shown in Table 11-2, NOx reductions using LNB or LNB and FRG technology are far more cost effective than the SNCR and SCR technologies. Table 11-2: Estimated Costs of Potential Emission Control Devices for FCCU #1 at Navajo Refining
Co., Artesia Refinery Cost Estimates
Unit
Control Technology
Pollutant
Controlled
Estimated Control
Efficiency (%)
Estimate Capital Cost
($1000)
Annual Cost ($1000/year)
Cost Efficiency ($/ton)
FCCU Regenerator #22
Optimization NOx reduction catalyst SCR
NOx
NOx
47-59
67-84
Not Available
260-320
2,500 FCCU Heater
LNB ULNB LNB and FGR SNCR SCR LNB and SCR
NOx NOx NOx NOx NOx NOx
40 75-85
48 60
70-90 70-90
76 131 161 221 483 553
8.1 13 17 24 56 63
5,100 3,800-4,400
9,000 10,100
15,600-20,100 17,600-22,600
Time Necessary for Compliance EC/R estimated that it would take nearly 6½ years for reduction strategies to become effective. It was determined that up to 2 years will be needed for the state to develop the necessary rules to implement the strategy. EC/R estimated that sources may then require up to a year to procure the necessary capital to purchase control equipment. The Institute of Clean Air Companies (ICAC) has estimated that approximately 13 months is required to design, fabricate, and install SCR or SNCR technology for NOx control. However, the time necessary will depend on the type and size of the unit being controlled. For instance, state regulators’ experience indicates that closer to 18 months is required to install this technology. In the CAIR analysis, EPA estimated that approximately 30 months is required to design, build, and install SO2 scrubbing technology for a single emission source. The analysis by EC/R also estimated that up to an additional 12 months may be required for staging the installation process if multiple sources are to be controlled at a single facility. Energy and Non-Air Quality Environmental Impacts The energy required to operate the emission control devices, including additional fuel, electricity and steam, and the waste produced by the emission control devices, such as solid waste and wastewater, are shown in Table 11-3. As illustrated by the values in Table 11-2, none of the six technologies are expected to produce a significant amount of solid waste or any wastewater. The solid waste produced by the SCR technology would occur when the catalyst is changed. None of the technologies are expected to increase fuel consumption, though LNB may reduce the fuel consumption due to optimized fuel combustion.

New Mexico Section 308 Regional Haze SIP 133
Table 11-3: Estimated Energy and Non-Air Environmental Impacts of Potential Emission Control
Devices for FCCU #1 at Navajo Refining Co. Energy and Non-Air Pollution Impacts
Unit
Control Technology
Pollutant
Controlled
Potential Emission Reduction (tons/year)
Electricity Requirement
(kW)
Solid Waste Generated
(ton/hr)
Waste Water Produced (gal/min)
FCCU Regenerator #21
optimization NOx reduction catalyst SCR
NOx
NOx
72-90
103-129
8,400
~0.03
0.073
FCCU Heater
LNB ULNB LNB and FGR SNCR SCR LNB and SCR
NOx NOx NOx NOx NOx NOx
1.6 3-3.4 1.9 2.4
2.8-3.6 2.8-3.6
3,300 460
8,400 8,400
0.073 0.073
A blank indicts that no impact is expected Remaining Equipment Life Information was not available on the age of the FCCU processes at the time of EC/R's analysis. However, industrial processes are often refurbished to extend their lifetimes. Therefore, the remaining lifetime of most equipment is expected to be longer than the projected lifetime of pollution control technologies which have been analyzed for these sources. Navajo Refining Co., Artesia Refinery FCCU #1 Four Factor Analysis Conclusion The process heater at Artesia Refinery is rated at 35 MMBtu/hr, has no controls, limits of SO2 - 2.2 tpy; NOx - 20.2 tpy; CO - 13.9 tpy; PM - 1.3 tpy. The FCCU Regenerator #21 exhaust is controlled by a wet scrubber to control SO2 and PM. Controls currently operated include Tertiary Cyclones & Caustic Scrubber, EMTROL CYTROL, and Monsanto Dynawave® Scrubber. After control emissions vented to atmosphere from FCCU-REGEN are: SO2 - 61.0 tpy; NOx - 101.9 tpy; CO - 106.8 tpy; PM - 109.5 tpy. Based on these relatively low levels of emissions and the factors discussed above, , NMED considers additional controls on the Artesia Refinery to be unnecessary at this time for the purposes of the visibility program. Western Refining Southwest, Bloomfield Refinery One unit, the Fluid Catalytic Cracking Unit (FCCU) #1 catalyst regeneration and process heater at the Western Refining Southwest, Bloomfield Refinery was selected for the four factor analysis in New Mexico. Western Refining Southwest Bloomfield refinery FCCU has a capacity of 7,200 bbl/day. The Western Refining Bloomfield refinery FCCU regenerator is well controlled for particulate matter, with an electrostatic precipitation (ESP). No baseline controls have been identified for NOx or SO2 from the regenerator vent. As discussed above, a number of options are available for reducing NOx and SO2. Ten possible emission control devices for SO2 and NOx were identified and analyzed for the FCCU regenerator and heater using the four factor analysis process: catalyst additives for NOx reduction, low temperature oxidation technology (LoTOx™), SCR, SNCR, catalyst additives for SO2 absorption, desulfurization of catalytic cracker feed, and wet scrubbing. Information regarding SCR, SNCR, LNB, ULNB, and FGR are discussed above. The LoTOxTM process has been developed to control NOx emissions in the catalytic cracking regenerator offgas. In this system, ozone is injected into the offgas to convert the nitrogen oxide (NO) and nitrogen dioxide (NO2) which comprise NOx into more highly oxidized forms of nitrogen such as

New Mexico Section 308 Regional Haze SIP 134
dinitrogen pentoxide (N2O5). These more highly oxygenated compounds are more soluble in water, and are removed from the offgas stream in a wet scrubber. SO2 catalyst additives adsorb sulfur oxide compounds produced in the catalyst regenerator. These compounds are then converted to H2S in the catalytic cracking reactor, and exit this reactor with the cracked hydrocarbon stream. The H2S is eventually removed from the hydrocarbon stream in an amine treatment process, and then recovered in the sulfur recovery process. NOx catalyst additives promote the reduction of NOx formed to nitrogen and water. These catalysts promote the reduction reaction between carbon or carbon monoxide and nitrogen oxides inside the regenerator. Wet scrubbing brings polluted gas stream into contact with a scrubbing liquid, by spraying it with the liquid, by forcing it through a pool of liquid, or by some other contact method, so as to remove the pollutants. Cost The estimated capital costs, annual costs, and the cost effectiveness for the possible emission control devices at the Bloomfield Refinery are shown in Table 11-4. For each option, the table gives an estimate of the capital cost to install the necessary equipment, and the total annual cost of control, including the amortized cost associated with the capital equipment cost. The table also shows the estimated cost effectiveness for each control measure, in terms of the cost per ton of emission reduction. Table 11-4: Estimated Costs of Potential Emission Control Devices for FCCU at Western Refining
Southwest, Bloomfield Refinery Cost Estimates
Unit
Control Technology
Pollutant
Controlled
Estimated Control
Efficiency (%)
Estimate Capital Cost
($1000)
Annual Cost
($1000/ year)
Cost Efficiency
($/ton)
FCCU Regenerator A-201
Catalyst additives for NOx reductions LoTOx™ SNCR SCR Catalyst additives for SO2 absorption Desulfurization of catalytic cracker feed Wet scrubbing
NOx
NOx NOx NOx SO2
SO2
SO2
75-81
85 40-80 85-92
98
98
98
Not Available
Not Available Not Available Not Available Not Available
Not Available
Not Available
Not Available
80-100 60-120 120-130
Not Available
Not Available 180-660
Not Available
1,700-2,000 2,500 2,500
Not Available
Not Available
1,500-1,800 FCCU Heater
LNB ULNB LNB and FGR SNCR SCR LNB and SCR
NOx NOx NOx NOx NOx NOx
40 75-85
48 60
70-90 70-90
117 199 245 337 736 843
12 20 26 37 86 97
5,200 3,800-4,300
9,000 9,900
15,600-20,000 17,600-22,500
Time Necessary for Compliance As with Navajo Refinery, EC/R estimated that it would take nearly 6½ years for reduction strategies to become effective. This includes 2 years for regulatory development, 1 year for capital acquisition, and 2½ years for designing, building and installing a scrubber, if this option is selected. If catalyst additives are used, time will be required to select and test the appropriate additives, and to determine the optimum feed rate for the additive. Energy and Non-Air Quality Environmental Impacts The energy required to operate the emission control devices, including additional fuel, electricity and steam, and the waste produced by the emission control devices, such as solid waste and wastewater, are shown in Table 11-5.
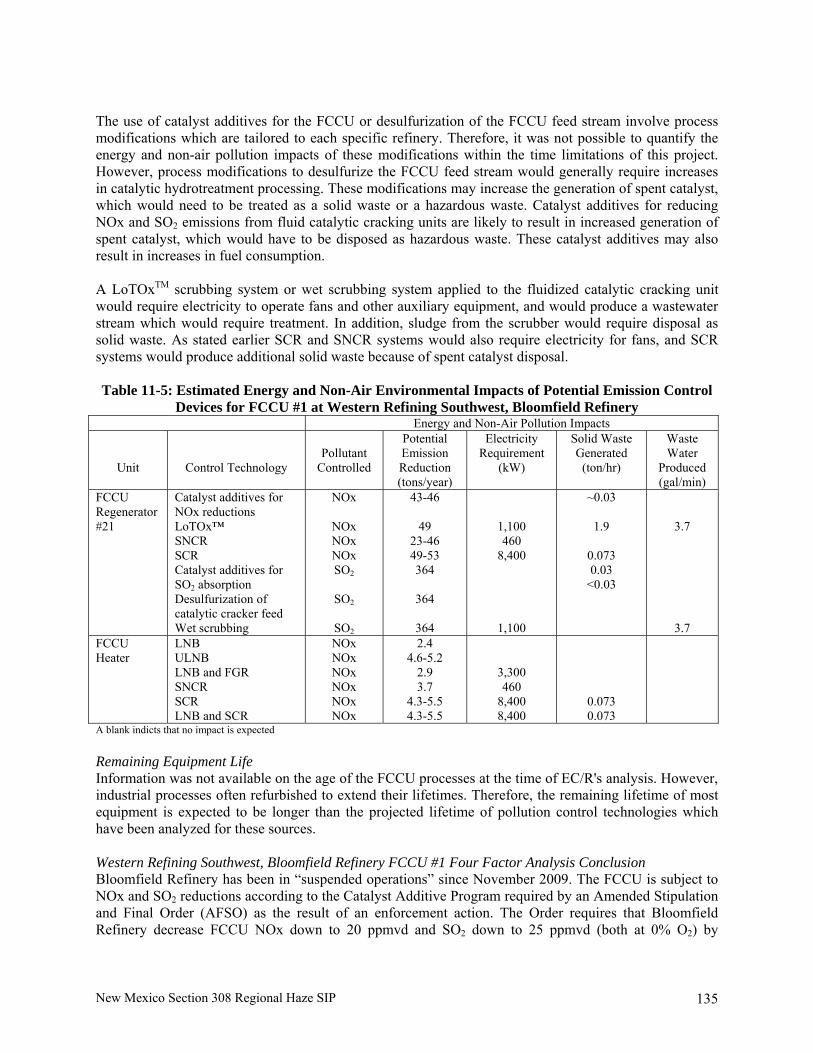
New Mexico Section 308 Regional Haze SIP 135
The use of catalyst additives for the FCCU or desulfurization of the FCCU feed stream involve process modifications which are tailored to each specific refinery. Therefore, it was not possible to quantify the energy and non-air pollution impacts of these modifications within the time limitations of this project. However, process modifications to desulfurize the FCCU feed stream would generally require increases in catalytic hydrotreatment processing. These modifications may increase the generation of spent catalyst, which would need to be treated as a solid waste or a hazardous waste. Catalyst additives for reducing NOx and SO2 emissions from fluid catalytic cracking units are likely to result in increased generation of spent catalyst, which would have to be disposed as hazardous waste. These catalyst additives may also result in increases in fuel consumption. A LoTOxTM scrubbing system or wet scrubbing system applied to the fluidized catalytic cracking unit would require electricity to operate fans and other auxiliary equipment, and would produce a wastewater stream which would require treatment. In addition, sludge from the scrubber would require disposal as solid waste. As stated earlier SCR and SNCR systems would also require electricity for fans, and SCR systems would produce additional solid waste because of spent catalyst disposal. Table 11-5: Estimated Energy and Non-Air Environmental Impacts of Potential Emission Control
Devices for FCCU #1 at Western Refining Southwest, Bloomfield Refinery Energy and Non-Air Pollution Impacts
Unit
Control Technology
Pollutant
Controlled
Potential Emission Reduction (tons/year)
Electricity Requirement
(kW)
Solid Waste Generated
(ton/hr)
Waste Water
Produced (gal/min)
FCCU Regenerator #21
Catalyst additives for NOx reductions LoTOx™ SNCR SCR Catalyst additives for SO2 absorption Desulfurization of catalytic cracker feed Wet scrubbing
NOx
NOx NOx NOx SO2
SO2
SO2
43-46
49 23-46 49-53 364
364
364
1,100 460
8,400
1,100
~0.03
1.9
0.073 0.03
<0.03
3.7
3.7 FCCU Heater
LNB ULNB LNB and FGR SNCR SCR LNB and SCR
NOx NOx NOx NOx NOx NOx
2.4 4.6-5.2
2.9 3.7
4.3-5.5 4.3-5.5
3,300 460
8,400 8,400
0.073 0.073
A blank indicts that no impact is expected Remaining Equipment Life Information was not available on the age of the FCCU processes at the time of EC/R's analysis. However, industrial processes often refurbished to extend their lifetimes. Therefore, the remaining lifetime of most equipment is expected to be longer than the projected lifetime of pollution control technologies which have been analyzed for these sources. Western Refining Southwest, Bloomfield Refinery FCCU #1 Four Factor Analysis Conclusion Bloomfield Refinery has been in “suspended operations” since November 2009. The FCCU is subject to NOx and SO2 reductions according to the Catalyst Additive Program required by an Amended Stipulation and Final Order (AFSO) as the result of an enforcement action. The Order requires that Bloomfield Refinery decrease FCCU NOx down to 20 ppmvd and SO2 down to 25 ppmvd (both at 0% O2) by

New Mexico Section 308 Regional Haze SIP 136
December 31, 2010. If these emissions limits are not met, the ASFO has complex emissions offset requirements. NMED has determined that additional controls for regional haze are not required. Western Refining Southwest, Gallup Refinery One unit, CO Boiler Unit #1, at the Western Refining Southwest, Gallup Refinery was selected for the four factor analysis in New Mexico. The Western Refining Gallup refinery FCCU has a capacity of 8,500 bbl/day. The Gallup Refinery uses a CO boiler to combust CO and volatile organic compound (VOC) off-gases produced by the refinery. The steam generated by the boiler is used as process steam at the refinery. The CO boiler is uncontrolled. Eight possible emission control devices for SO2 and NOx were identified and analyzed for the CO boiler using the four factor analysis process: LNB with overfire air (OFA); LNB, OFA, and FGR; SCR; SNCR; dust sorbent injection (DSI), spry dryer absorber (SDA); and flue gas desulfurization. NOx emissions from a CO boiler can be controlled using a variety of combustion modifications including overfire air (OFA), LNB, FGR, and combinations of these technologies. Add-on control systems such as SCR and SNCR can also be used to reduce NOx emissions from boilers. In SCR, the flue gas is treated with a small quantity of ammonia (NH3) in a catalyst bed. The ammonia reacts with NOx to produce nitrogen gas (N2). Alternatively, urea [(NH3)2CO] can be added instead of ammonia. In this case, the urea decomposes to produce ammonia, which reacts with NOx. SNCR also involves the addition of ammonia or urea to reduce NOx, but without a catalyst. SNCR is less efficient at reducing NOx than SCR, but is also generally less expensive. SNCR can also be used in situations where flue gas contaminants would poison the SCR catalyst. It should be noted that SCR and SNCR for controlling NOx require injection of ammonia (NH3), urea [(NH3)2CO], or other nitrogen compounds into the exhaust stream. These chemicals react with NOx to chemically convert the pollutant to elemental nitrogen (N2). However, the use of these chemicals generally results in ammonia emissions, termed ammonia slip. Emissions of SO2 can be reduced by using DSI, spray dryer absorber SDA, or flue gas desulfurization FGD. DSI uses dry limestone to react with the SO2 in the flue gas. The reacted limestone is then collected in a particulate control device, The SDA process is similar to the DSI process, except that a limestone slurry is injected into the flue gas where it reacts with the SO2 and is removed in a particulate control device. FGD involves the flue being passed through a vessel where it is contacted with an alkaline solution which reacts with the flue gas SO2 to form a sulfate particulate. The sulfate particulate is removed in the system and the used alkaline solution is recycled through the process. Cost The estimated capital costs, annual costs, and the cost effectiveness for the possible emission control devices at the Bloomfield Refinery are shown in Table 11-6. For each option, the table gives an estimate of the capital cost to install the necessary equipment, and the total annual cost of control, including the amortized cost associated with the capital equipment cost. The table also shows the estimated cost effectiveness for each control measure, in terms of the cost per ton of emission reduction.
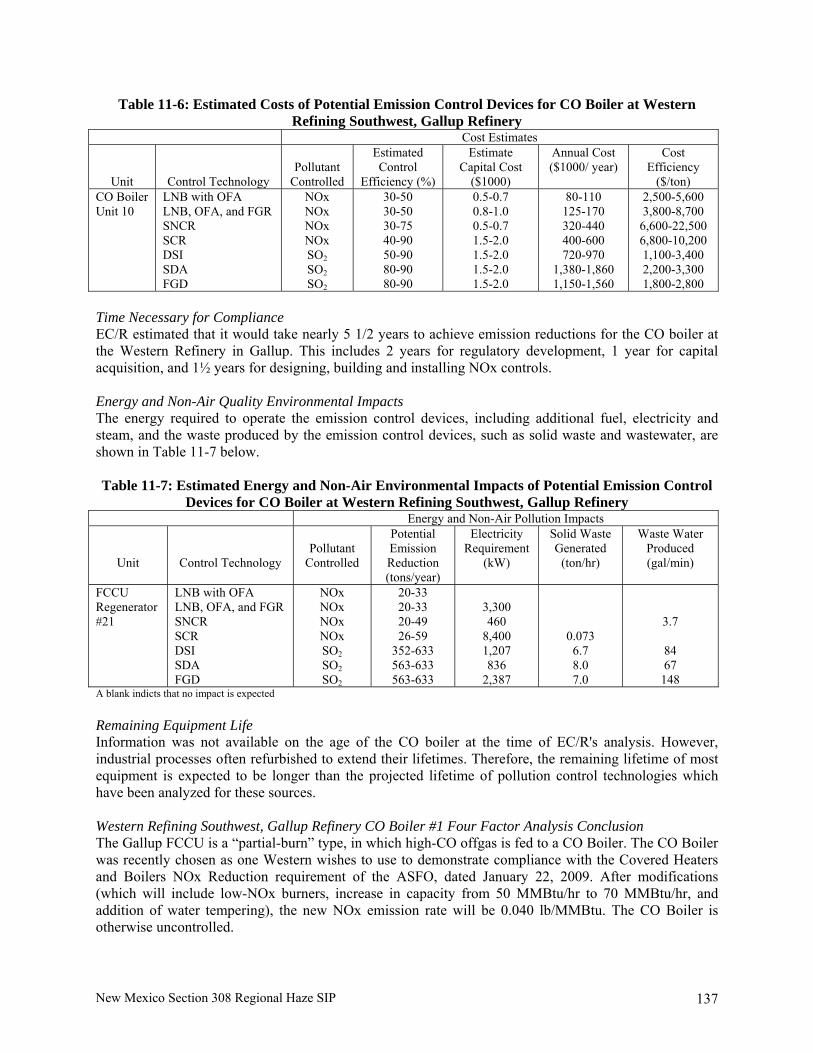
New Mexico Section 308 Regional Haze SIP 137
Table 11-6: Estimated Costs of Potential Emission Control Devices for CO Boiler at Western Refining Southwest, Gallup Refinery
Cost Estimates
Unit
Control Technology
Pollutant
Controlled
Estimated Control
Efficiency (%)
Estimate Capital Cost
($1000)
Annual Cost ($1000/ year)
Cost Efficiency
($/ton) CO Boiler Unit 10
LNB with OFA LNB, OFA, and FGR SNCR SCR DSI SDA FGD
NOx NOx NOx NOx SO2 SO2 SO2
30-50 30-50 30-75 40-90 50-90 80-90 80-90
0.5-0.7 0.8-1.0 0.5-0.7 1.5-2.0 1.5-2.0 1.5-2.0 1.5-2.0
80-110 125-170 320-440 400-600 720-970
1,380-1,860 1,150-1,560
2,500-5,600 3,800-8,700
6,600-22,500 6,800-10,200 1,100-3,400 2,200-3,300 1,800-2,800
Time Necessary for Compliance EC/R estimated that it would take nearly 5 1/2 years to achieve emission reductions for the CO boiler at the Western Refinery in Gallup. This includes 2 years for regulatory development, 1 year for capital acquisition, and 1½ years for designing, building and installing NOx controls. Energy and Non-Air Quality Environmental Impacts The energy required to operate the emission control devices, including additional fuel, electricity and steam, and the waste produced by the emission control devices, such as solid waste and wastewater, are shown in Table 11-7 below. Table 11-7: Estimated Energy and Non-Air Environmental Impacts of Potential Emission Control
Devices for CO Boiler at Western Refining Southwest, Gallup Refinery Energy and Non-Air Pollution Impacts
Unit
Control Technology
Pollutant
Controlled
Potential Emission Reduction (tons/year)
Electricity Requirement
(kW)
Solid Waste Generated
(ton/hr)
Waste Water Produced (gal/min)
FCCU Regenerator #21
LNB with OFA LNB, OFA, and FGR SNCR SCR DSI SDA FGD
NOx NOx NOx NOx SO2 SO2 SO2
20-33 20-33 20-49 26-59
352-633 563-633 563-633
3,300 460
8,400 1,207 836
2,387
0.073 6.7 8.0 7.0
3.7
84 67
148 A blank indicts that no impact is expected Remaining Equipment Life Information was not available on the age of the CO boiler at the time of EC/R's analysis. However, industrial processes often refurbished to extend their lifetimes. Therefore, the remaining lifetime of most equipment is expected to be longer than the projected lifetime of pollution control technologies which have been analyzed for these sources. Western Refining Southwest, Gallup Refinery CO Boiler #1 Four Factor Analysis Conclusion The Gallup FCCU is a “partial-burn” type, in which high-CO offgas is fed to a CO Boiler. The CO Boiler was recently chosen as one Western wishes to use to demonstrate compliance with the Covered Heaters and Boilers NOx Reduction requirement of the ASFO, dated January 22, 2009. After modifications (which will include low-NOx burners, increase in capacity from 50 MMBtu/hr to 70 MMBtu/hr, and addition of water tempering), the new NOx emission rate will be 0.040 lb/MMBtu. The CO Boiler is otherwise uncontrolled.

New Mexico Section 308 Regional Haze SIP 138
The FCCU is subject to NOx and SO2 reductions according to the Catalyst Additive Program required by the ASFO. The Order requires that Gallup decrease FCCU NOx to 20 ppmvd and SO2 to 25 ppmvd (both at 0% O2) by December 31, 2010. If these emissions limits are not met, the ASFO has complex emissions offset requirements. NMED has determined that additional controls for the visibility program are not required.
11.3 Setting Reasonable Progress Goals
Under Section 308(d)(1) of the Regional Haze Rule, states must “establish goals (expressed in deciviews) that provide for reasonable progress towards achieving natural visibility conditions” for each Class I area of the state. These RPGs must provide for an improvement in visibility for the most impaired visibility days, and ensure no degradation for the least impaired visibility days over the same period. The RPGs are interim goals that represent incremental visibility improvement over time, in this case out to the year 2018, to be compared to the 2018 Uniform Rate of Progress (URP) glide slope. Based on the steps outlined in Section 11.1 and the Four-Factor Analysis in Section 11.2, NMED has established RPGs for each of New Mexico’s seven Class I areas, as described below. These RPGs are based primarily on results of the CMAQ modeling described in Section 9.2, and on the four-factor analysis on major source categories. Table 11-8 shows that for the 20% best days, the RPGs show an improvement over baseline conditions for most of New Mexico's Class I areas. For the 20% worst days, the RPGs are short of the 2018 URP, but are justified based on the demonstration provided below.
Table 11-8: Reasonable Progress Goals for 20% Worst Days and 20% Best Days for New Mexico Class I Areas
20% Worst Days 20% Best Days New Mexico Class I Areas
Baseline Condition
(dv)
2018 Uniform Progress Goal
(dv)
2018 Reasonable Progress Goal
(dv)
Baseline Conditions
(dv)
2018 Reasonable Progress Goal
(dv) Bandelier Wilderness 12.22 10.83 11.9 4.95 4.89
Bosque del Apache National Wildlife Refuge
13.8 12.15 13.59 6.28 6.1
Carlsbad Caverns National Park
17.19 14.73 16.92 5.95 6.12
Gila Wilderness 13.11 11.61 15.14 3.31 3.44 Salt Creek Wilderness 18.03 15.41 17.07 7.84 7.43
San Pedro Parks Wilderness 10 9.13 9.94 1.45 1.24
White Mountain Wilderness 13.7 12.09 13.26 3.55 3.41
Wheeler Peak Wilderness 10.41 9.40 10.23 1.22 1.12
Demonstration That the RPGs for 20 Percent Best and Worst Days are Reasonable EPA guidance indicates that “States may establish an RPG that provides for greater, lesser or equivalent visibility improvement as that described by the glidepath.” The 2018 RPGs identified in Figure 11-8 for 20 percent worst days show an improvement in visibility, although less than the 2018 URP, except for the

New Mexico Section 308 Regional Haze SIP 139
Gila Wilderness. NMED believes that RPGs are reasonable for all seven of the New Mexico's mandatory Class I areas, as follows
11.3.1 Bandelier Wilderness Area
There is an improvement in visibility for Bandelier from baseline conditions to the modeled projected visibility in 2018. This improvement is less than the URG for Bandelier, but this is primarily due to OMC (Figure 11-1). As Figure 9-43 shows, this high level of OMC for BAND is primarily due to natural fires locally and regionally. Emissions from natural sources greatly affect the State’s ability to meet the 2018 deciview URP goal. The State has little or no control over OC, EC, and PM2.5 associated with natural fire. Prolonged droughts in the West have resulted in extensive wildfires. The idea of setting deciview URP goals was developed before the causes of haze in the West were well understood. The extensive technical analysis of the causes of haze conducted by the WRAP has led to a better understanding of the role of wildfire. As long as there are wildfires in the Western United States, there will be significant impact to visibility in Class I areas and there is little states can do about it.
Figure 11-1: Uniform Rate of Progress Comparison to Reasonable Progress Goals for Bandelier
Uniform Rate of Progress Vs. Reasonable Progress Goal for BAND
0
2
4
6
8
10
12
14
16
SO4 NO3 OMC EC Soil CM SeaSalt
Extin
ctio
n 1/
Mm
2018 Uniform Rate of Progress 2018 Projected Visibility
11.3.2 Bosque del Apache National Wildlife Refuge
There is some improvement in visibility from baseline to 2018 projected for BOAP. Although less than URP, the State believes this lesser improvement is once again due to natural sources. Two of the primary sources of emissions at BOAP are OMC and CM. Wildfires in this region are common, causing increases in OMC. High winds are also very common across the state particularly during the spring months (March-May) increasing CM and SOIL emissions. Due to the limited amount of control that the State has over these natural occurrences, the State believes that the progress projected for BOAP is reasonable. Sulfate is also a factor in visibility impairment in BOAP.

New Mexico Section 308 Regional Haze SIP 140
Figure 11-2: Uniform Rate of Progress Comparison to Reasonable Progress Goals for Bosque del Apache
Uniform Rate of Progress Vs. Reasonable Progress Goal for BOAP
0
2
4
6
8
10
SO4 NO3 OMC EC Soil CM SeaSalt
Extin
ctio
n 1/
Mm
2018 Uniform Rate of Progress 2018 Projected Visibility
11.3.3 Carlsbad Caverns National Park
The monitor for Carlsbad Caverns National Park is the closest one to Mexico in the VISTAS network for New Mexico's Class I areas. New Mexico has historically received pollution from international sources affecting air quality as well as visibility in the state. GUMO is showing some improvement in visibility from baseline to 2018 projected, but is hindered by international and interstate contributions. As Section 9.4.3 shows, international and interstate emissions are a significant contributor to SO4, CM, and OMC in New Mexico. Although New Mexico continues to work with Mexico and Texas on air quality issues within the southern region of the state, New Mexico has no control or jurisdiction over emissions coming from Mexico or Texas. Future work is needed on the federal level to determine the extent of emission contributions from Mexico on bordering states for regional haze and the National Ambient Air Quality Standards. Due to the lack of information available on emissions from Mexico and the jurisdiction to control a majority of the emissions affecting GUMO, New Mexico believes the improvement projected for 2018 is reasonable.

New Mexico Section 308 Regional Haze SIP 141
Figure 11-3: Uniform Rate of Progress Comparison to Reasonable Progress Goals for Carlsbad Caverns
Uniform Rate Of Progress Vs. Reasonable Progress Goals GUMO
0
2
4
6
8
10
12
14
16
18
SO4 NO3 OMC EC Soil CM SeaSalt
Extin
ctio
n 1/
Mm
2018 Uniform Rate of Progress 2018 Projected Visibility
11.3.4 Gila Wilderness
The Gila Wilderness is the only Class I area in New Mexico that showed an increase in visibility impairment from baseline to 2018 projected rather than a decrease. As Figure 11-4 below shows, organic matter is the primary source of visibility impairment within GILA, but the area is also affected by SO4 and EC emissions. Contributions of OMC and EC, as shown in Section 9.4.4, to visibility impairment in GILA are primarily from wildfires both locally and regionally. Controlled burns conducted under New Mexico's Smoke Management Program are often used as a forest management tool in this area, but the emissions from wildfires affecting visibility in GILA are more than ten times greater than the emissions from controlled burns. Wildfires are a common occurrence throughout the state and regardless of where they occur, New Mexico has little to no control over the emissions that are generated from them. Gila Wilderness is affected by SO2 emissions from New Mexico as well as interstate and international source, as shown in Section 9.4.4. BART Implementation will assist in reducing SO2 emissions generated in New Mexico, but will not have any affected on interstate or international sources of SO2. Due to the limited control that New Mexico has for a majority of these emissions, New Mexico believes that the progress projected for GILA is reasonable.
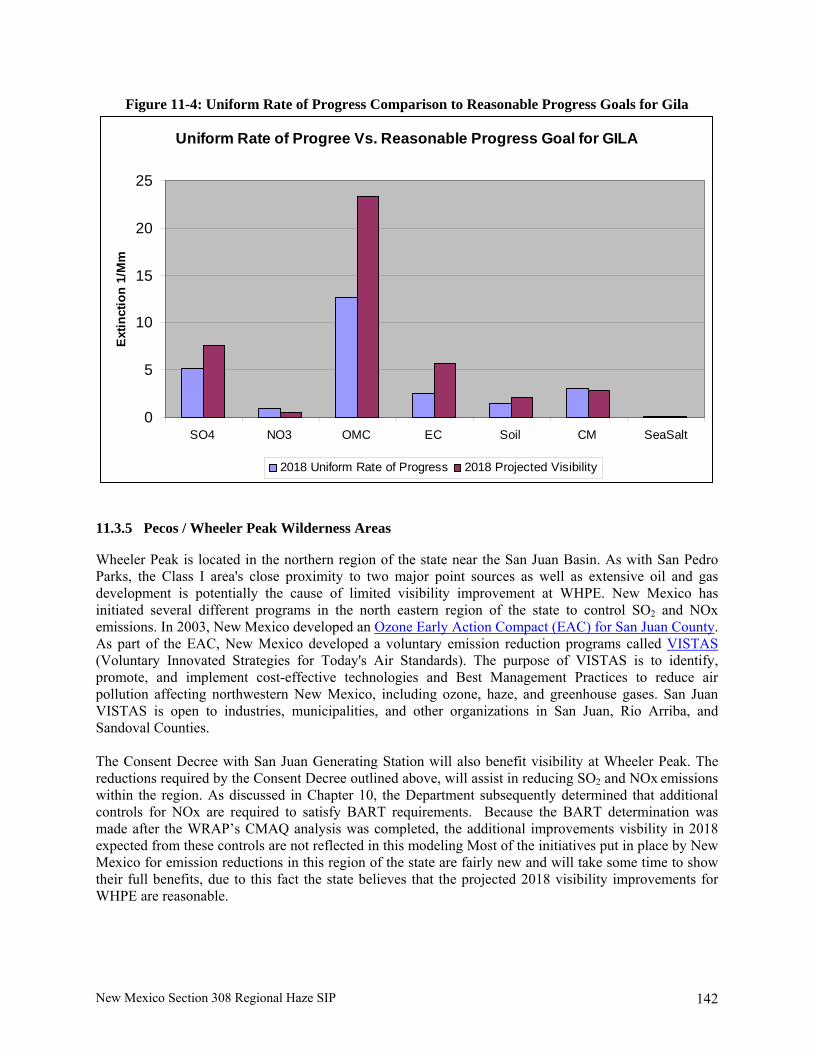
New Mexico Section 308 Regional Haze SIP 142
Figure 11-4: Uniform Rate of Progress Comparison to Reasonable Progress Goals for Gila
Uniform Rate of Progree Vs. Reasonable Progress Goal for GILA
0
5
10
15
20
25
SO4 NO3 OMC EC Soil CM SeaSalt
Extin
ctio
n 1/
Mm
2018 Uniform Rate of Progress 2018 Projected Visibility
11.3.5 Pecos / Wheeler Peak Wilderness Areas
Wheeler Peak is located in the northern region of the state near the San Juan Basin. As with San Pedro Parks, the Class I area's close proximity to two major point sources as well as extensive oil and gas development is potentially the cause of limited visibility improvement at WHPE. New Mexico has initiated several different programs in the north eastern region of the state to control SO2 and NOx emissions. In 2003, New Mexico developed an Ozone Early Action Compact (EAC) for San Juan County. As part of the EAC, New Mexico developed a voluntary emission reduction programs called VISTAS (Voluntary Innovated Strategies for Today's Air Standards). The purpose of VISTAS is to identify, promote, and implement cost-effective technologies and Best Management Practices to reduce air pollution affecting northwestern New Mexico, including ozone, haze, and greenhouse gases. San Juan VISTAS is open to industries, municipalities, and other organizations in San Juan, Rio Arriba, and Sandoval Counties. The Consent Decree with San Juan Generating Station will also benefit visibility at Wheeler Peak. The reductions required by the Consent Decree outlined above, will assist in reducing SO2 and NOx emissions within the region. As discussed in Chapter 10, the Department subsequently determined that additional controls for NOx are required to satisfy BART requirements. Because the BART determination was made after the WRAP’s CMAQ analysis was completed, the additional improvements visbility in 2018 expected from these controls are not reflected in this modeling Most of the initiatives put in place by New Mexico for emission reductions in this region of the state are fairly new and will take some time to show their full benefits, due to this fact the state believes that the projected 2018 visibility improvements for WHPE are reasonable.
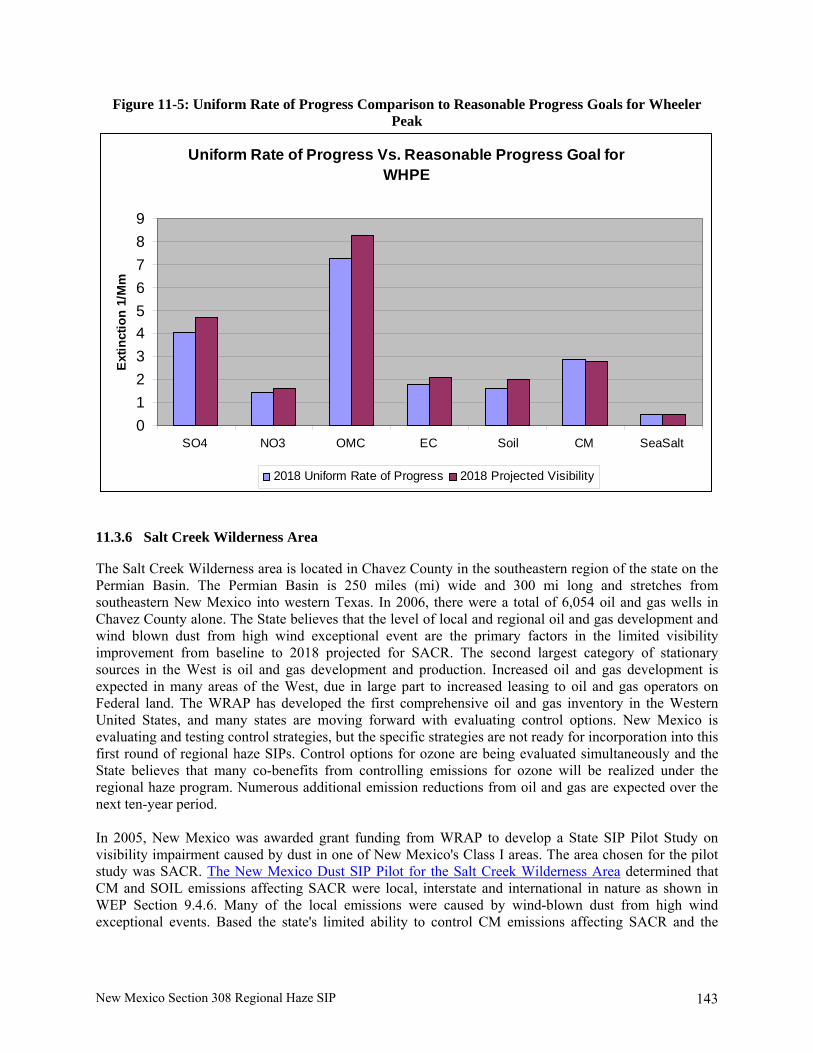
New Mexico Section 308 Regional Haze SIP 143
Figure 11-5: Uniform Rate of Progress Comparison to Reasonable Progress Goals for Wheeler Peak
Uniform Rate of Progress Vs. Reasonable Progress Goal for WHPE
0123456789
SO4 NO3 OMC EC Soil CM SeaSalt
Ext
inct
ion
1/M
m
2018 Uniform Rate of Progress 2018 Projected Visibility
11.3.6 Salt Creek Wilderness Area
The Salt Creek Wilderness area is located in Chavez County in the southeastern region of the state on the Permian Basin. The Permian Basin is 250 miles (mi) wide and 300 mi long and stretches from southeastern New Mexico into western Texas. In 2006, there were a total of 6,054 oil and gas wells in Chavez County alone. The State believes that the level of local and regional oil and gas development and wind blown dust from high wind exceptional event are the primary factors in the limited visibility improvement from baseline to 2018 projected for SACR. The second largest category of stationary sources in the West is oil and gas development and production. Increased oil and gas development is expected in many areas of the West, due in large part to increased leasing to oil and gas operators on Federal land. The WRAP has developed the first comprehensive oil and gas inventory in the Western United States, and many states are moving forward with evaluating control options. New Mexico is evaluating and testing control strategies, but the specific strategies are not ready for incorporation into this first round of regional haze SIPs. Control options for ozone are being evaluated simultaneously and the State believes that many co-benefits from controlling emissions for ozone will be realized under the regional haze program. Numerous additional emission reductions from oil and gas are expected over the next ten-year period. In 2005, New Mexico was awarded grant funding from WRAP to develop a State SIP Pilot Study on visibility impairment caused by dust in one of New Mexico's Class I areas. The area chosen for the pilot study was SACR. The New Mexico Dust SIP Pilot for the Salt Creek Wilderness Area determined that CM and SOIL emissions affecting SACR were local, interstate and international in nature as shown in WEP Section 9.4.6. Many of the local emissions were caused by wind-blown dust from high wind exceptional events. Based the state's limited ability to control CM emissions affecting SACR and the
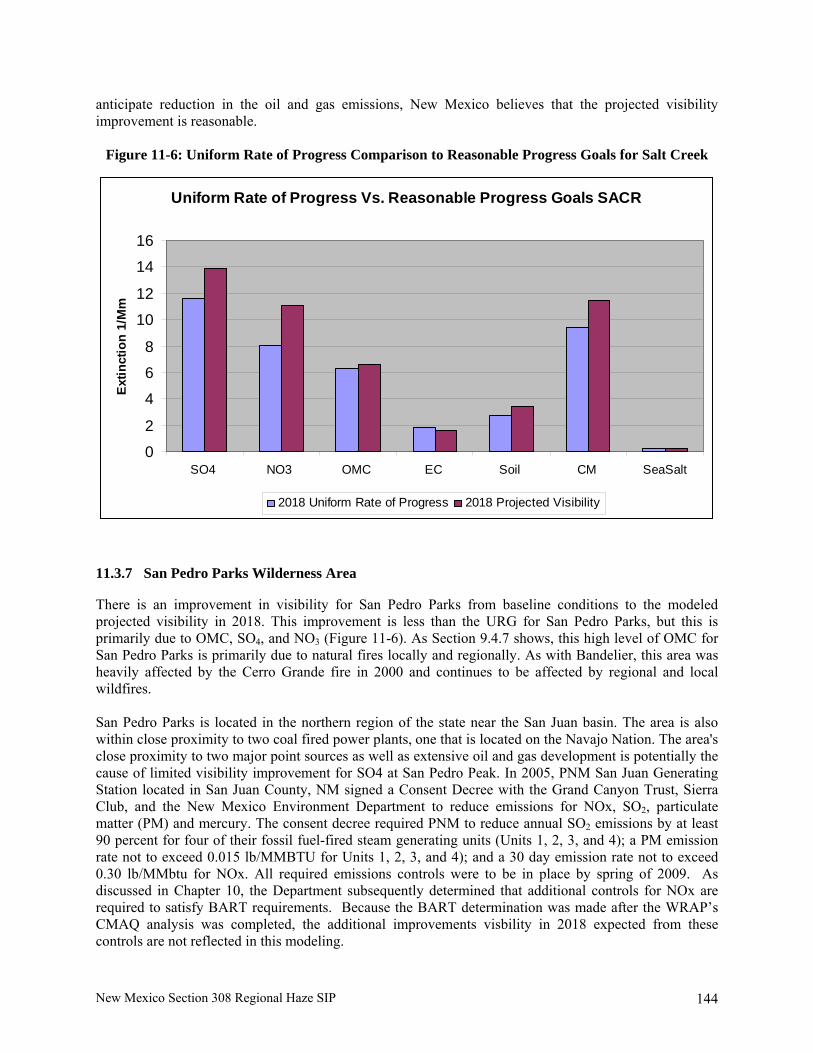
New Mexico Section 308 Regional Haze SIP 144
Uniform Rate of Progress Vs. Reasonable Progress Goals SACR
0
2
4
6
8
10
12
14
16
SO4 NO3 OMC EC Soil CM SeaSalt
Ext
inct
ion
1/M
m
2018 Uniform Rate of Progress 2018 Projected Visibility
anticipate reduction in the oil and gas emissions, New Mexico believes that the projected visibility improvement is reasonable.
Figure 11-6: Uniform Rate of Progress Comparison to Reasonable Progress Goals for Salt Creek
11.3.7 San Pedro Parks Wilderness Area
There is an improvement in visibility for San Pedro Parks from baseline conditions to the modeled projected visibility in 2018. This improvement is less than the URG for San Pedro Parks, but this is primarily due to OMC, SO4, and NO3 (Figure 11-6). As Section 9.4.7 shows, this high level of OMC for San Pedro Parks is primarily due to natural fires locally and regionally. As with Bandelier, this area was heavily affected by the Cerro Grande fire in 2000 and continues to be affected by regional and local wildfires. San Pedro Parks is located in the northern region of the state near the San Juan basin. The area is also within close proximity to two coal fired power plants, one that is located on the Navajo Nation. The area's close proximity to two major point sources as well as extensive oil and gas development is potentially the cause of limited visibility improvement for SO4 at San Pedro Peak. In 2005, PNM San Juan Generating Station located in San Juan County, NM signed a Consent Decree with the Grand Canyon Trust, Sierra Club, and the New Mexico Environment Department to reduce emissions for NOx, SO2, particulate matter (PM) and mercury. The consent decree required PNM to reduce annual SO2 emissions by at least 90 percent for four of their fossil fuel-fired steam generating units (Units 1, 2, 3, and 4); a PM emission rate not to exceed 0.015 lb/MMBTU for Units 1, 2, 3, and 4); and a 30 day emission rate not to exceed 0.30 lb/MMbtu for NOx. All required emissions controls were to be in place by spring of 2009. As discussed in Chapter 10, the Department subsequently determined that additional controls for NOx are required to satisfy BART requirements. Because the BART determination was made after the WRAP’s CMAQ analysis was completed, the additional improvements visbility in 2018 expected from these controls are not reflected in this modeling.

New Mexico Section 308 Regional Haze SIP 145
Figure 11-7: Uniform Rate of Progress Comparison to Reasonable Progress Goals for San Pedro
Parks
Uniform Rate of Progress Vs Reasonable Progress Goals SAPE
0
1
2
3
4
5
6
7
8
SO4 NO3 OMC EC Soil CM SeaSalt
Ext
inct
ion
1/M
m
2018 Uniform Rate of Progress 2018 Projected Visibility
11.3.8 White Mountain Wilderness Area
There is some improvement in visibility from baseline to 2018 projected for WHIT. The primary emissions affecting visibility in WHIT are SO4, OMC, and CM. The White Mountain Wilderness area is within close proximity to the Permian Basin and is thus potentially impacted by oil and gas development in the region. This area is also affected by natural emissions from wild fires and wind blown dust from high wind exceptional events. A WRAP study conducted in 2006 by the Desert Research Institute (DRI) for the New Mexico Dust SIP Pilot for the Salt Creek Wilderness Area determined that CM emissions affecting WHIT are from local and international sources. White Mountain is located just to the east of White Sands National Monument, which includes 275 square mi of gypsum sand dunes. The study developed by DRI indicates that White Sands is one of the major sources of CM emissions affecting WHIT, particularly during high wind events. The area is also heavily affected by CM emissions from interstate sources (see Section 9.4.8). The high level of OMC at WHIT is primarily due to local wildfires and interstate emissions. SO4 levels at WHIT are affected heavily by international emissions, as shown in Section 9.4.8. The SO2 cap and trade program initiate by New Mexico under the 309 program will assist in reducing SO2 emissions generated in New Mexico, but will not have any affect on international sources of SO2. Due to the limited control that New Mexico has over a majority of these emissions, New Mexico believes that the progress projected for WHIT is reasonable.

New Mexico Section 308 Regional Haze SIP 146
Figure 11-8: Uniform Rate of Progress Comparison to Reasonable Progress Goals for White Mountain
Uniform Rate of Progress Vs. Reasonable Progress Goal for WHIT
0123456789
10
SO4 NO3 OMC EC Soil CM SeaSalt
Extin
ctio
n 1/
Mm
2018 Uniform Rate of Progress 2018 Projected Visibility
11.4 Conclusions for State-Wide Reasonable Progress
Overall for New Mexico the predominate pollutants affecting the state's ability to meet URP goals at our Class I areas are OMC, CM and SO4. Much if not all of the source contributions for OMC and CM are natural. Much of the west is affected by wildfire and windblown dust from high wind exceptional events, particularly during droughts. These naturally occurring events are prevalent throughout the state and affect all of the Class I areas in New Mexico. The State has developed a Smoke Management Program for controlled burns and Natural Event Action Plans for anthropogenic sources of windblown dust, but the effect that these types of emissions have on visibility in New Mexico's Class I area is minimal compared to the naturally generated emissions. As Figure 11-9 below shows, over 70 percent of OMC emissions that affect New Mexico's Class I areas are due to wildfires and over 65% of CM emissions are from wind-blown dust. At present, the State has initiated programs to control sources of these pollutants where they are controllable; unfortunately the state has no control now or in the future over natural events that may affect visibility impairment within the State's Class I areas.
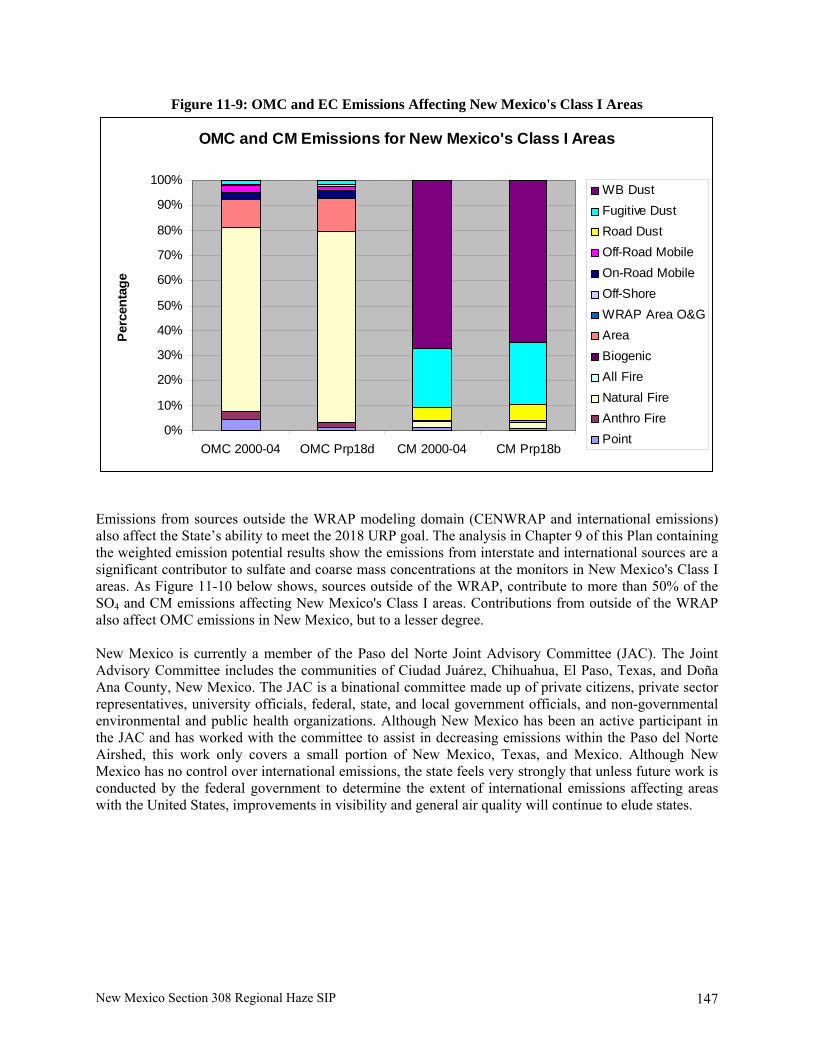
New Mexico Section 308 Regional Haze SIP 147
Figure 11-9: OMC and EC Emissions Affecting New Mexico's Class I Areas
OMC and CM Emissions for New Mexico's Class I Areas
0%
10%
20%
30%
40%
50%
60%
70%
80%
90%
100%
OMC 2000-04 OMC Prp18d CM 2000-04 CM Prp18b
Perc
enta
ge
WB DustFugitive DustRoad DustOff-Road MobileOn-Road MobileOff-ShoreWRAP Area O&GAreaBiogenicAll FireNatural FireAnthro FirePoint
Emissions from sources outside the WRAP modeling domain (CENWRAP and international emissions) also affect the State’s ability to meet the 2018 URP goal. The analysis in Chapter 9 of this Plan containing the weighted emission potential results show the emissions from interstate and international sources are a significant contributor to sulfate and coarse mass concentrations at the monitors in New Mexico's Class I areas. As Figure 11-10 below shows, sources outside of the WRAP, contribute to more than 50% of the SO4 and CM emissions affecting New Mexico's Class I areas. Contributions from outside of the WRAP also affect OMC emissions in New Mexico, but to a lesser degree. New Mexico is currently a member of the Paso del Norte Joint Advisory Committee (JAC). The Joint Advisory Committee includes the communities of Ciudad Juárez, Chihuahua, El Paso, Texas, and Doña Ana County, New Mexico. The JAC is a binational committee made up of private citizens, private sector representatives, university officials, federal, state, and local government officials, and non-governmental environmental and public health organizations. Although New Mexico has been an active participant in the JAC and has worked with the committee to assist in decreasing emissions within the Paso del Norte Airshed, this work only covers a small portion of New Mexico, Texas, and Mexico. Although New Mexico has no control over international emissions, the state feels very strongly that unless future work is conducted by the federal government to determine the extent of international emissions affecting areas with the United States, improvements in visibility and general air quality will continue to elude states.

New Mexico Section 308 Regional Haze SIP 148
Figure 11-10: Impacts from Sources Outside of WRAP on New Mexico
Impact from Interstate/International Sources
0%
10%
20%
30%
40%
50%
60%
70%
80%
90%
100%
SO4 OMC CM
Per
cent
age NM
Mex CEN

New Mexico Section 308 Regional Haze SIP 149
CHAPTER 12: LONG-TERM STRATEGY (LTS)
12.1 Overview
The Regional Haze Rule requires states to submit a 10-15 year long-term strategy (LTS) to address regional haze visibility impairment in each Class I area in the state, and for each Class I area outside the state which may be affected by emissions from the state. The LTS must include enforceable measures necessary to achieve reasonable progress goals, and identify all anthropogenic sources of visibility impairment considered by the state in developing the long-term strategy. Where the state contributes to Class I visibility impairment in other states it must consult with those states and develop coordinated emission management strategies, and demonstrate it has included all measures necessary to obtain its share of the emission reductions. If the state has participated in a regional planning process, the state must include measures needed to achieve its obligations agreed upon through that process. Summary of all Anthropogenic Sources of Visibility Impairment Considered in Developing the Long-Term Strategy Section 51.308(d)(3)(iv) of the Regional Haze Rule requires the identification of “all anthropogenic sources of visibility impairment considered by the State when developing its long-term strategy.” Chapter 8 of this Plan describes New Mexico's statewide emissions, including projections of emissions reductions from anthropogenic sources from 2002 to 2018. Section 9.3 of this Plan provides source apportionment results, including projected reductions from anthropogenic sources during the same period. Chapter 9 addresses anthropogenic sources from all potential sources in the world. Together, these chapters show the major anthropogenic sources affecting regional haze in New Mexico and in the West. Chapter 11 further describes the major anthropogenic source categories evaluated through the four-factor analysis. Summary of Interstate Transport and Contribution Sections 51.308(d)(3)(i) and (ii) of the Regional Haze Rule requires that the Long-Term Strategy address the contribution of interstate transport of haze pollutants between states. Chapter 8 of this Plan illustrated New Mexico's statewide emissions, while Chapter 9 identified interstate transport of pollutants and larger source categories based on source apportionment results.
12.2 Other States’ Class I Areas Affected by New Mexico Emissions
New Mexico used baseline period visibility data from the IMPROVE monitors along with the WRAP baseline modeling results to estimate New Mexico's emissions impact on neighboring states’ Class I areas (see Figure 12-1 through Figure 12-12). New Mexico focused on anthropogenic emissions transported to other states, primarily sulfates and nitrates. The charts and tables below, show the contribution of particle mass calculated from the modeled concentrations of nitrates and sulfates for the baseline years. The charts and tables illustrate the probable share of New Mexico's emissions contributing to the pollutant species in surrounding states.
12.2.1 Nitrate Contributions from New Mexico on Surrounding States' Class I Areas
New Mexico's NOx emissions contribute up to 24% percent of the nitrate concentrations at some neighboring states on the worst 20% days according to modeling. As shown in the table below, however, nitrate contributes only up to 19 percent of the visibility impairment in neighboring states. By 2018, NOx emissions from New Mexico are projected by the WRAP to decrease by 57,975 tons, which will help reduce New Mexico's impact to out of state Class I areas. Actual decreases are

New Mexico Section 308 Regional Haze SIP 150
expected to be higher due to the BART determination of 0.03 to 0.07 lb/mmBtu for San Juan Generating Station.
Table 12-1: Nitrate Contribution to Haze in Baseline Years for Worst 20% Days
State 2000-2004
Average Annual Nitrate Share of Particle Light
Extinction (measured values)
2000-2004 New Mexico’s Average
Annual Share of Nitrate Concentration
(based on modeling) Arizona 13.5% 2.7% Colorado 10.0% 24.7% Nevada 19.1% 0.1% Utah 15.9% 6.0% Texas 6.0% 11.2% Wyoming 9.9% 0.3%
Figure 12-1: Nitrate Contributions from New Mexico on Arizona Class I Areas
WRAP State Nitrate Contributions on Arizona's Class I Areas
AZ75%
ND0%
NM4%
CA16%
CO0%
ID0%
NV2%
MT0%
OR0%
SD0% UT
3% WA0% WY
0%

New Mexico Section 308 Regional Haze SIP 151
Figure 12-2: Nitrate Contributions from New Mexico on Colorado Class I Areas
WRAP State Nitrate Contributions on Colorado's Class I Areas
AZ8% CA
10%
CO32%
ID3%
MT1%
NV1%
NM24%
ND1%
OR1%
SD1%
UT10%
WA1%
WY7%
Figure 12-3: Nitrate Contributions from New Mexico on Nevada Class I Areas
WRAP States Nitrate Contributions on Nevada's Class I Areas
AZ0%
CA17%
CO0%
ID36%
MT1%
NV15%
NM0%
ND0%
OR7%
SD0%
UT15%
WA8%
WY1%

New Mexico Section 308 Regional Haze SIP 152
Figure 12-4: Nitrate Contributions from New Mexico on Utah Class I Areas
WRAP State Nitrate Contributions on Utah's Class I Areas
AZ6%
CA25%
CO3%
ID3%
MT1%
NV8%NM
6%ND0%
OR2%
UT42%
WA2%
WY2%
SD0%
Figure 12-5: Nitrate Contributions from New Mexico on Texas Class I Areas
WRAP State (Including CENWRAP and Mexico) Nitrate Contributions on Texas' Class I Areas
CEN61%
CO2%
ID0%
MEX12%
NM11%
NV0%MT
1%
UT0%SD
2%WA0%
CA5%
WY1% AZ
3%
OR0%ND2%

New Mexico Section 308 Regional Haze SIP 153
Figure 12-6: Nitrate Contributions from New Mexico on Wyoming Class I Areas
WRAP State Nitrate Contributions on Wyoming's Class I Areas
AZ1%
CA6%
CO2%
ID29%
MT13%
NM0%
ND2%
OR7%
SD1%
UT12%
WA10%
WY15%
NV2%
12.2.2 Sulfate Contributions from New Mexico on Surrounding State's Class I Areas
According to modeling, New Mexico sulfate emissions contribute up to 16.9 percent of the sulfate concentrations at some neighboring states on the worst 20% days. As shown in Table 12-2 below, sulfate contributes up to 44 percent of the visibility impairment at the nearest Class I areas in neighboring states. By 2018, SO2 emissions from New Mexico are projected by the WRAP to decrease by 10,457 tons, which will help reduce New Mexico’s impact on out of state Class I areas.
Table 12-2: Sulfate Contribution to Haze in Baseline Years for Worst 20% Days
State 2000-2004
Average Annual Sulfate Share of Particle Light
Extinction (measured values)
2000-2004 New Mexico’s Average Annual Share of Sulfate
Concentration (based on modeling)
Arizona 18.9% 6.7% Colorado 21.7% 16.9% Nevada 17.1% 1.7% Utah 23.3% 6.9% Texas 44.0% 1.9% Wyoming 23.3% 2.5%

New Mexico Section 308 Regional Haze SIP 154
Figure 12-7: Sulfate Contributions from New Mexico on Arizona Class I Areas
WRAP State Sulfate Contributions on Arizona's Class I Areas
AZ50%
CA17%
CO3%
ID1%
MT0%
NV10%
NM7%
ND0%
OR3%
SD0%
UT4%
WA2%
WY3%
Figure 12-8: Sulfate Contributions from New Mexico on Colorado Class I Areas
WRAP State Sulfate Contributions on Colorado's Class I Areas
AZ10% CA
7%
CO33%
ID3%
MT1%
NV6%
NM17%
ND2%
OR2%
SD0%
UT9%
WA2%
WY8%

New Mexico Section 308 Regional Haze SIP 155
Figure 12-9: Sulfate Contributions from New Mexico on Nevada Class I Areas
WRAP State Sulfate Contributions on Nevada's Class I Areas
AZ4%
CA21%
CO2%
ID15%
MT1%
NV16%
NM2%
ND0%
OR15%
SD0%
UT5%
WA15%
WY4%
Figure 12-10: Sulfate Contributions from New Mexico on Utah Class I Areas
WRAP State Sulfate Contributions on Utah's Class I Areas
AZ8%
CA20%
CO5%
ID2%
MT0%
NV19%
NM7%
ND1%
OR6%
SD0%
UT24%
WA3%
WY5%

New Mexico Section 308 Regional Haze SIP 156
Figure 12-11: Sulfate Contributions from New Mexico on Texas Class I Areas
WRAP State Sulfate Contributions on Texas' Class I Areas
CEN56%
MEX37%
UT0%
OR0%
NV0%
WA0%
WY1% AZ
1%CA1%
SD0%NM
2%
MT0%
ND1%
CO1%
ID0%
Figure 12-12: Sulfate Contributions from New Mexico on Wyoming Class I Areas
WRAP State Sulfate Contributions on Wyoming's Class I Areas
AZ3%
CA7%
CO13%
ID13%
MT6%NV
6%NM3%
ND2%
OR7%
SD0%
UT9%
WA6%
WY25%

New Mexico Section 308 Regional Haze SIP 157
12.3 New Mexico Class I Areas Affected by Other States, Nations and Areas of the World
The contribution of WRAP, CENRAP, Canada, Eastern U.S., Mexico, Pacific Offshore, and Outside of Domain to New Mexico Class I areas were examined below in Table 12-3 through Table 12-6 to determine where significant emissions of nitrates and sulfates might be coming from. This review focused on nitrates and sulfates since those emissions tend to focus on anthropogenic sources. Data for this impact analysis comes from the PSAT runs performed by the WRAP and documented in the TSS.
12.3.1 Nitrate Emissions
For nitrates on the worst 20% days in the baseline years, the most significant impacts on New Mexico Class I areas came from sources within WRAP, CENRAP and outside the modeling domain (emissions from other parts of the world). Within the WRAP region, the sources within New Mexico, Arizona, California, and Colorado had the most significant impact on New Mexico Class I areas. New Mexico has worked with Arizona, California and Colorado through the WRAP process and believes all three states are working to reduce nitrate impacts to New Mexico's Class I areas. Arizona is projected by the WRAP to reduce nitrate causing emissions by 242,136 tons by 2018; California is projected to reduce nitrates by 661,661 tons by 2018; and Colorado is project to reduce emissions by 215,036 tons by 2018. New Mexico is committed to reducing projected WRAP emissions of at least 57,975 tons by 2018.
Table 12-3: Nitrate Contribution to New Mexico Haze in Baseline Years for 20% Worst Days NM Class
I Area WRAP Canada Eastern
U.S. Mexico Pacific
Offshore Outside
of Domain
CENRAP
Bandelier 17% 2% 0% 1% 1% 15% 10% Bosque del Apache
61% 3% 0% 1% 1% 8% 26%
Carlsbad 30% 5% 0% 5% 2% 14% 44% Gila 58% 0% 0% 2% 5% 33% 2% Salt Creek 61% 0% 0% 2% 0% 11% 26% San Pedro Parks
69% 3% 0% 1% 1% 10% 16%
Pecos / Wheeler Peak
57% 3% 2% 1% 1% 8% 28%
White Mountain
40% 4% 0% 2% 2% 16% 36%

New Mexico Section 308 Regional Haze SIP 158
Table 12-4: WRAP Nitrate Contribution to New Mexico Haze Baseline Years for Worst 20% Days NM Class I
Area AZ CA CO ID MT NV NM ND OR SD UT WA WY
Bandelier 13% 9% 6% 0% 1% 2% 58% 1% 0% 1% 8% 0% 1% Bosque del Apache 15% 5% 7% 0% 1% 1% 61% 2% 0% 2% 3% 0% 3%
Carlsbad 12% 19% 7% 0% 3% 1% 42% 6% 0% 5% 1% 1% 3% Gila 38% 51% 0% 0% 0% 7% 3% 0% 0% 0% 1% 0% 0% Salt Creek 9% 2% 7% 0% 0% 1% 75% 0% 0% 0% 5% 0% 1% San Pedro Parks 19% 10% 4% 0% 1% 3% 53% 1% 1% 1% 5% 1% 1%
Pecos / Wheeler Peak 13% 7% 6% 0% 1% 1% 64% 2% 0% 2% 3% 0% 1%
White Mountain 14% 17% 13% 1% 2% 1% 38% 3% 0% 3% 2% 1% 5%
12.3.2 Sulfate Emissions
For the 20% worst days in the baseline years, New Mexico's Class I areas are predominately impacted by sulfate emissions from WRAP, CENRAP, Eastern U.S., and sources outside of the modeling domain. Within WRAP, the largest contributions of sulfates come from New Mexico, Arizona, California, and Colorado, contributing up to 88 percent of the sulfate emissions in the baseline years from the WRAP region. New Mexico has worked with Arizona, California and Colorado through the WRAP process and believes all three states are working to reduce sulfate impacts to New Mexico's Class I areas. Arizona is projected by the WRAP to reduce sulfate causing emissions by 33,475 tons by 2018; California is projected to reduce sulfate by 5,340 tons by 2018; and Colorado is project to reduce emissions by 59,442 tons by 2018. New Mexico is committed to reducing projected WRAP emissions of at least 10,457 tons by 2018.
Table 12-5: Sulfate Contribution to New Mexico Haze in Baseline Years for Worst 20% Days NM Class I
Area WRAP Canada Eastern
U.S. Mexico Pacific
Offshore Outside Domain
CENRAP
Bandelier 32% 1% 12% 9% 3% 27% 16% Bosque del Apache 21% 1% 20% 14% 2% 19% 23%
Carlsbad 5% 2% 43% 10% 1% 11% 28% Gila 18% 1% 18% 20% 4% 20% 19% Salt Creek 12% 2% 31% 10% 1% 15% 29% San Pedro Parks 31% 2% 8% 12% 5% 26% 16%
Pecos / Wheeler Peak 34% 2% 6% 10% 4% 27% 17%
White Mountain 11% 2% 34% 10% 1% 12% 30%

New Mexico Section 308 Regional Haze SIP 159
Table 12-6: WRAP Sulfate Contribution to New Mexico Haze Baseline Years for Worst 20% Days NM Class I
Area AZ CA
CO ID MT NV NM ND OR SD UT WA WY
Bandelier 25% 7% 4% 1% 0% 5% 48% 1% 0% 0% 5% 1% 2% Bosque del Apache 29% 7% 8% 1% 1% 6% 32% 2% 1% 0% 6% 1% 6%
Carlsbad 15% 7% 10% 2% 3% 4% 29% 10% 2% 2% 4% 2% 10% Gila 36% 12% 6% 1% 1% 9% 23% 1% 2% 0% 4% 1% 4% Salt Creek 17% 3% 5% 1% 1% 3% 54% 5% 1% 1% 4% 1% 4% San Pedro Parks 28% 11% 5% 1% 1% 8% 32% 1% 2% 0% 5% 2% 4%
Pecos / Wheeler Peak 12% 7% 9% 1% 1% 5% 42% 2% 1% 1% 5% 1% 4%
White Mountain 26% 5% 10% 1% 1% 4% 33% 7% 1% 1% 4% 1% 6%
12.4 Summary of Interstate Consultation
In addition to evaluating interstate transport, the affected states are required to consult with each other under Section 51.308(d)(3)(i), in order to develop coordinated emission management strategies. See Chapter 2 for information on the state-to-state consultation process.
12.5 Estimated Contributions from CENRAP and Eastern U.S.
As shown above in Table 12-4 and Table 12-6, many of New Mexico's Class I areas are affected by sulfate emissions from the eastern region of the U.S and sulfate and nitrate emissions from CENRAP. New Mexico has no regulatory authority for emissions outside of our jurisdiction, so we are depending on current and future federal standards to assist in reducing the extent that New Mexico's Class I areas are affected by sulfate and nitrate emissions from the eastern portion of the U.S. and CENRAP. Some of these federal programs include:
• Regional Haze/BART; • 2010 Final Primary National Ambient Air Quality Standard for Sulfur Dioxide; • 2010 Final Primary National Ambient Air Quality Standard for Oxides of Nitrogen; • 2010 Final Primary National Ambient Air Quality Standard for Ozone; • Clean Air Interstate Replacement Rule/Transport Rule; • MACT Standards for Industrial, Commercial & Institutional (ICI) Boilers - Phase I & II; • NSPS and MACT Standards for Cement Kilns - Phase I & II; and • MACT Standards for Electric Generating Units (Utility MACT).
12.6 Estimated International Contribution to New Mexico's Class I Areas
Although not specifically addressed under the Regional Haze Rule in terms of interstate transport, it is important to identify the contribution to visibility impairment in New Mexico from international sources, such as Mexico. The PSAT and WEP results in Chapter 9 describe the amount of contribution to visibility impairment in New Mexico from sources in Mexico. New Mexico has historically been affected by international emissions from Mexico. As Table 12-5 above shows, Mexico is a major contributor to sulfate emissions at many of New Mexico's Class I areas.

New Mexico Section 308 Regional Haze SIP 160
New Mexico has been an active member of the Paso del Norte Joint Advisory Committee (JAC). The JAC was established in 1996 for the improvement of air quality in the Paso del Norte region, that includes the communities of Ciudad Juárez, Chihuahua, El Paso, Texas, and Doña Ana County, New Mexico. The JAC is a binational committee made up of private citizens, private sector representatives, university officials, federal, state, and local government officials, and non-governmental environmental and public health organizations. The JAC is charged with the development and recommendation of air quality improvement projects and programs to the Air Work Group established under the 1983 U.S.- Mexico La Paz Agreement. As a long term strategy for international emissions, New Mexico will continue to be an active member on the JAC. Unfortunately, the Paso del Norte covers only a small area of the Mexico/New Mexico borders region. Current emission inventories and modeling of Mexico sources are needed by states to help differentiate between local and international contributions for regional haze and general air quality planning purposes. Until these types of resources are available, particularly for border states, it will be difficult to meet regional haze progress goals. Because the State of New Mexico does not have any authority over any international sources, the state is not pursuing any new strategy for haze impacts due to these sources.
12.7 Required Factors for the Long-Term Strategy
As required in Section 51.308(d)(3)(v) of the Regional Haze Rule, the State must consider, at a minimum, the following factors: 1) emission reductions due to ongoing air pollution control programs; 2) measures to mitigate the impacts of construction activities; 3) emission limitations and schedules for compliance; 4) source retirement and replacement schedules; 5) smoke management techniques for agricultural and forestry burning; 6) the enforceability of emission limitations and control measures; and 7) the anticipated net effect on visibility over the period of the long-term strategy. These factors are discussed in the following pages along with all measures to mitigate the impacts of anthropogenic sources. The seventh factor is discussed at the end of the Long-Term Strategy Chapter.
12.7.1 Emission Reductions Due to Ongoing Air Pollution Control Programs
The following summary describes ongoing programs and regulations in New Mexico that directly protect visibility, or can be expected to improve visibility in New Mexico Class I areas, by reducing emissions in general. This summary does not attempt to estimate the actual improvements in visibility that will occur, as many of the benefits are secondary to the primary air pollution objective of these programs/rules, and consequently would be extremely difficult to quantify due to the technical complexity and limitations in current assessment techniques.
12.7.2 New Source Review Program
The New Source Review (NSR) Program is a permit program for the construction of new sources and modification of existing sources as established by 20.2.72 NMAC - Construction Permits and 20.2.74 NMAC - Permits - Prevention of Significant Deterioration. The primary purpose of the NSR Program is to assure compliance with ambient standards set to protect public health, assure that Best Available Control Technology (BACT) is utilized to reduce and eliminate air pollution emissions, and to prevent deterioration of clean air areas. Any amount of air contaminant emissions from a facility subjects it to New Mexico’s NSR Program.
12.7.3 Prevention of Significant Deterioration (PSD) Program
New Mexico considers its Prevention of Significant Deterioration (PSD) program as being protective of visibility impairment from proposed major stationary sources or major modifications to existing facilities.

New Mexico Section 308 Regional Haze SIP 161
New Mexico has a fully-approved PSD program, and has successfully implemented this program for many years.
12.7.4 Minor Source BACT Program
The BACT process is most appropriately defined as the elimination of emissions whenever technically and economically feasible to do so. New Mexico takes the State-required BACT review in minor source permitting actions very seriously, as the bulk of the New Mexico's workload is made up of minor sources. New Mexico will continue to review BACT considerations on each source type and size on a case-by-case basis with consideration to the technical practicability and economic reasonableness of eliminating or reducing the emissions from the proposed facility. The application of BACT in the minor source permitting program has resulted in minimized emissions in the state as a whole and will continue to do so as the New Mexico continues to receive NSR permit applications for new and modified sources.
12.7.5 Title V Operating Permit Program
As required by Title V of the Clean Air Act Amendments of 1990 and the implementing regulations in 40 CFR part 70, New Mexico established an Operating Permit Program under 20.2.70 NMAC - Operating Permits. A Title V Operating Permit consolidates all air quality regulatory requirements in a single document, so a permittee can clearly determine compliance with the air quality requirements applicable to its operation. The Title V Operating Permit also establishes appropriate compliance assurance monitoring on a pollutant-by-pollutant basis for large emission sources with add-on pollution control equipment, and establishes periodic monitoring for other regulated pollutants. The process of issuing the Operating Permit is designed to allow participation by the public, the EPA and nearby states to avoid misinterpretation of air quality regulatory requirements. This permitting is done to enhance enforceability by clearly defining the playing field for all concerned parties, so that all regulated industry is governed by the same rules. These permits are issued for a term of five years and must be renewed and updated to incorporate current regulatory requirements. Nationally, this program is intended to set minimum standards for all states to implement, in an attempt to foster consistency in air quality permitting from state to state. The Operating Permit Program is intended to be self supporting, and states are required under the Clean Air Act to charge regulated industry fees based upon their actual air pollutant emissions on an annual basis; thus, Title V permittees pay for the operation of the regulating program. The Operating Permit Program affects only major sources of air pollution operating in the State. A major source is defined as a source which emits, or has the potential to emit, 100 tons per year of an air pollutant, or any source which emits, or has the potential to emit, 10 tons per year of an individual hazardous air pollutant (or 25 tons per year of any combination of hazardous air pollutants) which has been listed pursuant to section 112(b) of the Clean Air Act. The number of Title V sources within the State is variable but has typically ranged from 150 to 160 sources at any given time.
12.7.6 New Source Performance Standards (NSPS)
NMED periodically incorporates by reference the Federal New Source Performance Standards (NSPS). These standards were first incorporated into New Mexico Administrative Code under 20.2.77 NMAC - New Source Performance Standards in July 1985, with the latest revision becoming effective in August 2009.

New Mexico Section 308 Regional Haze SIP 162
12.7.7 National Emission Standards for Hazardous Air Pollutants
The New Mexico Environment Department periodically incorporates by reference the Federal National Emission Standards for Hazardous Air Pollutants (NESHAPs). To the extent that NESHAPs regulate visibility impairing pollutants through surrogates, these programs may prove helpful in reducing visibility impairment. These standards are incorporated under 20.2.78 NMAC - Emission Standards for Hazardous Air Pollutants. 20.2.78 NMAC first became an effective State rule in July 1984, with the latest revision becoming effective in August 2009. The New Mexico Environment Department determines case-by-case MACT determinations under 20.2.82 NMAC - Maximum Achievable Control Technology Standards for Source Categories of Hazardous Air Pollutants.
12.7.8 New Mexico Reasonably Attributable Visibility Impairment Rules
In response to EPA’s Phase I visibility rules, New Mexico adopted the New Mexico Visibility Protection Plan for Phase I in August of 1986. It was approved by the U.S. EPA by notice in the Federal Register on January 27, 2006. A revision to the 1986 Phase I SIP was submitted to EPA in August of 1992. This revision was also approved by EPA in January of 2006. This visibility rule contains short and long-term strategies for making reasonable progress toward the national goal, related to addressing reasonably attributable impairment in the State’s Class I areas through visibility monitoring and control strategies. This rule incorporates PSD requirements for visibility protection from new or modified major stationary sources, and if necessary applying BART to existing stationary sources if certified as causing reasonably attributable visibility impairment.
12.7.9 Ongoing Implementation of Federal Mobile Source Regulations
The Federal Motor Vehicle Control Program (FMVCP) has produced and is continuing to produce large reductions in motor vehicle emissions of NOx, PM, and VOCs. Beginning in 2006, EPA mandated new standards for on-road (highway) diesel fuel, known as ultra-low sulfur diesel (ULSD). This regulation dropped the sulfur content of diesel fuel from 500 ppm to 15 ppm. ULSD fuel enables the use of cleaner technology diesel engines and vehicles with advanced emissions control devices, resulting in significantly lower emissions. Diesel fuel intended for locomotive, marine and non-road (farming and construction) engines and equipment was required to meet the low sulfur diesel fuel maximum specification of 500 ppm sulfur in 2007 (down from 5,000 ppm). By 2010, the ULSD fuel standard of 15-ppm sulfur will apply to all non-road diesel fuel. Locomotive and marine diesel fuel will be required to meet the ULSD standard beginning in 2012, resulting in further reductions of diesel emissions. These rules not only reduce SO2 emissions, but also NOx and PM emissions. In addition to the ULSD standard, listed below are several other significant Federal programs. Federal On-Road Measures: • Tier 2 vehicle emission standards and Federal low-sulfur gasoline • National low emissions vehicle standards (NLEV) • Heavy-duty diesel standards Federal Non-Road Measures: • Lawn and garden equipment • Tier 2 heavy-duty diesel equipment • Locomotive engine standards • Compression ignition standards for vehicles and equipment • Recreational marine engine standards
New Mexico Section 308 Regional Haze SIP 163
In addition, the Renewable Fuel Standard Under Section 211(o) of the Clean Air Act as Amended by the Energy Policy Act of 2005, is determined annually (must be published in the Federal Register by November 30 of each year) by EPA and is applicable to refiners, importers and blenders of gasoline.
12.7.10 Ongoing Implementation of State Mobile Source Regulations
In December of 2007, the New Mexico Environment Department adopted 20.2.88 NMAC - Emission Standards for New Motor Vehicles, which established emissions standards for new passenger cars, light duty trucks, and medium duty vehicles sold in New Mexico beginning with model year 2011. These standards, commonly known as "clean car standards" or "California standards", actually consist of three separate sets of standards: (1) standards applicable to air pollutants, including non-methane organic gases, known as phase two of the Low Emission Vehicle program, or "LEV II"; (2) standards requiring a percentage of total sales for each manufacturer to consist of zero emission vehicles, or "ZEV"; and (3) standards for carbon dioxide, measured in grams per mile, or "greenhouse gas standards". The standards strengthen the emission standards for conventional air pollutants, including non-methane organic gases ("NMOG"), carbon monoxide, oxides of nitrogen, formaldehyde, and particulates. These pollutants aggravate asthma and contribute to lung diseases, cancer, and heart disease. NOx and particulate emissions contribute to regional haze as well. Based on aanalysis of States that already have the LEV II standards on the books, the LEV II standards are expected to reduce VOCs by five (5) percent over federal standards and NOx by eleven (11) percent.
12.7.11 Ongoing Implementation of Programs to Meet PM10 NAAQS
Currently, only one community in New Mexico, Anthony, is designated as a nonattainment area under the PM10 National Ambient Air Quality Standard (NAAQS). Anthony is located in the southern region of Doña Ana County. This area was designated nonattainment for PM10 in 1991. Anthony was designated nonattainment due to wind blown dust from high wind exceptional events. Natural Events On May 30, 1996, EPA issued a Natural Events Policy (NEP) which recognized that certain uncontrollable natural events, such as high winds, wildland fires, and volcanic/seismic activity can result in adverse consequences for the National Ambient Air Quality Standard (NAAQS). The NEP set forth procedures for protecting public health through the development of a Natural Events Action Plan (NEAP) which implements Best Available Control Measures (BACM) for human-generated particulate emissions in areas where the PM10 standard may be violated due to these uncontrolled natural events. The NEP also provides that if an approved NEAP is implemented, future air quality exceedances due to uncontrollable natural events may be flagged, and, if demonstrated to be a natural event, not be considered when determining the region’s air quality designation if BACM measures are being implemented. In 2000, a Natural Events Action Plan was submitted for Doña Ana County, which included the Anthony PM10 Nonattainment area was submitted to EPA. Doña Ana County is 3,804-square-miles in the south-central section of New Mexico with a population of 174,682. Doña Ana County borders El Paso, Texas and Ciudad Juarez, Mexico. This area is considered part of the Paso del Norte air shed, which includes El Paso County, Texas and Ciudad Juarez, Mexico. This region of the state has historically had air quality problems, including particulate matter and ozone pollution. The Natural Events Action plan for Doña Ana County outlines specific procedures to be taken in response to future high wind events. These procedures include: • Techniques to educate the public about the problem;

New Mexico Section 308 Regional Haze SIP 164
• Mitigation of health impacts on exposed populations during future events; and • Best Available Control Measures (BACM) for significant, anthropogenic sources of windblown dust. For any NEAP under the Natural Events Policy, a reevaluation of the plan must be conducted every five (5) years to determine if any changes are necessary to protect public health and control anthropogenic sources that may contribute to exceedances of the PM10 NAAQS. A reevaluation of Doña Ana County's Natural Events Action Plan was submitted to EPA in 2005. The reevaluation reviewed the conditions causing violations of the PM10 NAAQS in Doña Ana County; the status of the implementation of the plan; and the adequacy of the actions being implemented. A Natural Events Action Plan was submitted to EPA for Luna County, NM in 2004. Luna County is 2,965 square miles in southwestern New Mexico with a total population of near 27,000, of which approximately 14,000 are in Deming. In 2003, violations of the federal standard for particulate matter occurred, requiring the creation of this Luna County Natural Events Action Plan to avoid nonattainment. The Natural Events Action plan for Luna County outlines specific procedures to be taken in response to future high wind events. These procedures include: • Techniques to educate the public about the problem; • Mitigation of health impacts on exposed populations during future events; and • Best Available Control Measures (BACM) for significant, anthropogenic sources of windblown dust. In March of 2007, EPA adopted the Exceptional Events rule (EER). The Exceptional Events rule replaced the NEP. The EER established procedures and criteria related to the identification, evaluation, interpretation, and use of air quality monitoring data related to any NAAQS where States petition EPA to exclude data that are affected by exceptional events.
12.7.12 Measures to Mitigate the Impacts of Construction Activities
Currently, NMED is developing a rule concerning the control of fugitive dust emissions in the state of New Mexico outside of Bernalillo County and tribal lands. A review of the complaints received by NMED over the past five years shows that fifteen percent concern fugitive dust from sources that are not required to obtain an air quality construction or operating permit. The industries receiving the most complaints include construction and development sites, bulk material processing and handling, and confined animal feeding operations (CAFOs). The rule will initially apply to emission sources having a disturbed surface area greater than two (2) acres in size as well as bulk material handling, transport, and storage. Activities addressed in the rule include but are not limited to construction, demolition, grading, excavation, clearing, grubbing, and track out of material. As scheduled, the rule is set to be adopted in early 2011.
12.7.13 Emission Limitations and Schedules of Compliance
The implementation of BART, as described in Chapter 10, will contain emission limits and schedules of compliance for those sources either installing BART controls or taking federally enforceable permit limitations. The four-factor analysis identifies some additional measures that are appropriate for this first Regional Haze Plan. The evaluation of non-BART sources as part of the LTS identifies additional emission reductions and improves visibility by 2018.
New Mexico Section 308 Regional Haze SIP 165
12.7.14 Source Retirement and Replacement Schedules
The New Mexico Environment Department is not currently aware of any specific scheduled shutdowns, retirements in upcoming years, or replacement schedules, such as planned installation of new control equipment to meet other regulations or routine equipment replacement or modernization. As NMED becomes aware of such actions, they will be factored into upcoming reviews.
12.7.15 Agricultural and Forestry Smoke Management Techniques
In December of 2003, NMED adopted 20.2.65 NMAC - Smoke Management. The New Mexico Environment Department developed the state Smoke Management Program (SMP) to protect the health and welfare of New Mexicans from the impacts of smoke from all sources of fire. In addition, this SMP meets the requirements of the Clean Air Act and the Regional Haze Rule (40 CFR 51.309). The SMP is applicable in all of New Mexico, except for tribal lands and Bernalillo County, which are separate air quality jurisdictions. Burners must also comply with all city and county ordinances relating to smoke management and vegetation burning. The regulation was submitted to EPA in December 2003 as part of the Regional Haze Section 309 SIP submittal. It is included in this Section 308 submittal as Appendix D. The SMP requirements of burners are based on those required by EPA, and fall under two categories of burners. SMP I is primarily an information gathering level, with registration and tracking requirements for all burners at this level of emissions. SMP II has more stringent requirements related to smoke management and emissions reduction, in keeping with the higher level of emissions produced by these larger burns. These requirements make up the Smoke Management Regulation that provides the enforcement mechanism for the SMP. A Smoke Management Program Guidance Document was revised in May of 2005, to assist burners in understanding the requirements and aid in the implementation of 20.2.65 NMAC. The intent of this process was to create a SMP that is equitable, reasonable, and implementable; is based on the best available science; and that provides all burners with the tools and information they need to manage impacts from smoke. Clarity, flexibility and ease of application were also fundamental principles of the SMP development process. The SMP is dynamic, and will be evaluated and revised as necessary, involving stakeholder review and input. Topics for evaluation could include SMP thresholds and requirements, time frames, fees, airshed boundaries, and other aspects of the program as appropriate. NMED staff has actively participated in the WRAP Fire Emissions Joint Forum (FEJF), formed to address both policy and technical issues concerning smoke effects that are caused by wildland and agricultural fires on public, tribal, and private lands. The FEJF is guided by the recommendations contained in the GCVTC Final Report and the requirements of the Regional Haze Rule regarding fire emissions and visibility. The FEJF has developed several policies for the WRAP through a stakeholder-based consensus process to assist the WRAP states and tribes in addressing emissions from fire sources. In these policies, the WRAP seeks to provide a consistent framework that states and tribes can use to efficiently develop their individual regional haze implementation plans, long-term strategies, and periodic progress reports. The WRAP has advanced the following policies developed by the FEJF as viable tools for states to meet the requirements of the Rule. • The WRAP Policy for Categorizing Fire Emissions was developed to clarify the complex relationship
between what is considered a natural source of fire and what is considered a human-caused source, as acknowledged in the Rule. A methodology to categorize fire emissions as either “natural” or

New Mexico Section 308 Regional Haze SIP 166
“anthropogenic” is the basis of the Policy; thus providing the foundation for fire’s inclusion in natural background condition values and ultimately, the tracking of reasonable progress.
• The WRAP Policy on Enhanced Smoke Management Programs for Visibility defines the enhanced
smoke management program as smoke management efforts that specifically address visibility, thereby going beyond the EPA Interim Policy and the AAQTF Air Quality Policy specific guidance provided for smoke management programs that address public health and nuisance concerns. The Policy identifies for states/tribes in the WRAP region the elements of an enhanced smoke management program to address visibility effects from all types of fire that contribute to visibility impairment in mandatory Federal Class I areas.
• The WRAP defines the annual emission goal as a quantifiable value that is used to measure progress
each year toward the desired outcome of achieving the minimum emission increase from fire. In the WRAP Policy on Annual Emissions Goals for Fire, the WRAP outlines a process by which states/tribes may establish annual emission goals, based on the utilization of currently available emission reduction techniques, to include in their Regional Haze SIPs.
• It is the position of the WRAP Policy on Fire Tracking Systems that it is necessary to track fire
activity information in the WRAP region using a fire tracking system, which will also provide the information essential to create a fire emissions inventory. The Policy identifies seven essential components of a fire tracking system that represent the minimum spatial and temporal fire activity information necessary to consistently calculate emissions and to meet the requirements of the Rule.
12.7.16 Enforceability of New Mexico’s Measures
Section 51.308(d)(3)(v)(F) of the Regional Haze Rule requires states to ensure that emission limitations and control measures used to meet reasonable progress goals are enforceable. New Mexico has ensured that all existing emission limitations and control measures, for which the State of New Mexico is responsible, used to meet reasonable progress goals are enforceable either through New Mexico Administrative Code (NMAC), or SIP measures previously approved by EPA. Enforceability of future emission limitations and control measures, for which the State of New Mexico is responsible, will be enforceable through permit conditions (BART) or SIP measures to be approved in the future by EPA.
12.8 Additional Measures in the Long-Term Strategy
This section of the LTS identifies new measures being proposed by NMED for achieving reasonable progress. These reasonable progress measures will be evaluated and discussed in the next Plan update in 2013.
12.8.1 Future Federal Mobile Programs
A new rule, “Control of Emissions of Air Pollution from Locomotives and Marine Compression-Ignition Engines Less Than 30 Liters per Cylinder”, was signed on March 14, 2008. EPA estimates that by 2030, this program will reduce annual emissions of NOx by about 800,000 tons and PM emissions by 27,000 tons. Emission reductions are expected to continue as fleet turnover is completed. These standards are intended to achieve these large reductions in emissions through the use of technologies such as in-cylinder controls, aftertreatment, and low sulfur fuel, perhaps as early as 2011.

New Mexico Section 308 Regional Haze SIP 167
In June 2009, EPA announced a rule (Control of Emissions from New Marine Compression-Ignition Engines at or Above 30 Liters per Cylinder) proposing more stringent exhaust emission standards for the largest marine diesel engines used for propulsion on oceangoing vessels (called Category 3 engines). The proposed engine standards are equivalent to the nitrogen oxides limits recently adopted in amendments to Annex VI to the International Convention for the Prevention of Pollution from Ships (MARPOL). The near-term standards for newly-built engines would apply beginning in 2011. Long-term standards would begin in 2016, and are based on the application of high-efficiency aftertreatment technology. By 2030, this strategy to address emissions from oceangoing vessels is expected to reduce annual emissions of NOx in the U.S. by approximately 1.2 million tons and particulate matter emissions by about 143,000 tons. When fully implemented, the coordinated strategy is anticipated to reduce NOx emissions by 80 percent and PM emissions by 85 percent, compared to the current limits applicable to these engines. A proposed rule, the Renewable Fuel Standard (RFS2), was signed by Administrator Jackson on May 5, 2009. This rule took effect on March 26, 2010. The rule addresses changes to the Renewable Fuel Standard program as required by the Energy Independence and Security Act of 2007 (EISA). The revised statutory requirements establish new specific volume standards for cellulosic biofuel, biomass-based diesel, advanced biofuel, and total renewable fuel that must be used in transportation fuel each year. The revised statutory requirements also include new definitions and criteria for both renewable fuels and the feedstocks used to produce them, including new greenhouse gas emission (GHG) thresholds for renewable fuels. The regulatory requirements for RFS will apply to domestic and foreign producers and importers of renewable fuel. It is estimated that annual GHG emissions from transportation will be reduced by approximately 160 million tons, the equivalent of the removal of 24 million vehicles from the highways. In addition, 36 billion gallons of renewable fuel will displace approximately 11% of gasoline and diesel consumption in 2022. The majority of the reductions are expected to come from reduced petroleum imports.
12.8.2 Efforts to Address Offshore Shipping
As depicted by PSAT results in Chapter 9, offshore marine vessel emissions contribute marginally to New Mexico Class I areas. New Mexico has no authority to regulate offshore shipping emissions and must rely upon the EPA and coastal states such as California for adoption of regulations. EPA adopted emission standards for new marine diesel engines installed on vessels flagged or registered in the United States with displacement at or above 30 liters per cylinder. Also adopted in this rulemaking were additional standards for new engines with displacement at or above 2.5 liters per cylinder but less than 30 liters per cylinder. This rule established a deadline of April 27, 2007 for EPA to promulgate a second set of emission standards for these engines. Because much of the information necessary to develop more stringent Category 3 marine diesel engines standards has become available only recently, a new deadline for the rulemaking to consider the next tier of Category 3 marine diesel engine standards has been set for December 17, 2009. On December 7, 2007, EPA announced an advance notice of proposed rulemaking regarding the above-referenced standards, first set in 2003. The advanced notice of proposed rulemaking stated that EPA was considering standards for achieving large reductions in NOx and PM through the use of technologies such as in-cylinder controls, aftertreatment, and low sulfur fuel, starting as early as 2011. On July 24, 2008, the State of California adopted new strict regulations for marine vessels within 24 miles of shore. NMED expects that implementation of these new regulations for marine vessels will have benefits in New Mexico.

New Mexico Section 308 Regional Haze SIP 168
In October 2008, Member States of the International Maritime Organization (IMO) adopted new international standards for marine diesel engines and their fuels (2008 Amendments to MARPOL Annex VI) that apply globally, and establishes additional, more stringent emission requirements for ships that operate in specially-designated coastal areas where air quality problems are acute. Under the new global standards, NOx emissions will be reduced, and the fuel sulfur cap will drop to 5,000 ppm in 2020 (pending a fuel availability review in 2018). Under the new geographic standards, ships operating in designated areas will be required to use engines that meet the most advanced technology-forcing standards for NOx emissions, and to use fuel with sulfur content at or below 1,000 ppm. On March 27, 2009, the United States submitted a joint proposal with Canada to the IMO to designate specific areas of our coastal waters as an Emission Control Area (ECA). Compared to fuels used in ships today, ECA standards will lead to a 96 percent reduction in sulfur in ships’ fuels, as well as a cut in emissions of PM by 85 percent and NOx by 80 percent. To achieve these reductions, ships must use fuel with no more than 1,000 parts per million sulfur beginning in 2015, and new ships will have to use advanced emission control technologies beginning in 2016.
12.8.3 Long-Term Control Strategies for BART Facilities
Chapter 10 and Appendix A outline the BART determination and requirements for San Juan Generating Station.
12.8.4 Evaluation of Control Strategies for Sources Identified in the Reasonable Progress - Four-Factor Analysis
The Reasonable Progress Goals section evaluated certain non-BART sources through a four-factor analysis for additional controls, as was required by the Federal Regional Haze Rule. This evaluation was limited, in that no guidance was provided for identifying “significant sources”, and no contribution to visibility impairment thresholds were established. The New Mexico Environment Department will conduct further research to evaluate non-BART sources for possible emission controls and retrofits.
12.8.5 Oil and Gas
Oil and gas production, which is not limited to just one area of New Mexico, is a large, important, and critical component of the State economy. However, the sources associated with oil and gas production emit NOx, and to a lesser extent, PM. An extensive fleet of field equipment and an array of processing plants operate continuously conducting exploration, production, and gathering activities. Exploration and drilling includes seismic studies, engineering, well testing, drilling operations, and transportation of personnel or equipment to and from sites. Oil and gas production includes operation, maintenance, and servicing of production properties, including transportation to and from sites. Sources include turbines, drill rig engines, glycol dehydrators, amine treatment units, flares and incinerators. Understanding the sources and volume of emissions at oil and gas production sites is key to recognizing the impact that these emissions have on visibility. To better understand the emissions from these sources, the WRAP instituted a three-phase project. One of the issues was to quantify emission inventories from stationary and mobile equipment operated as part of oil and gas field operations. Phase I, which was completed in 2005, was an emission inventory project that estimated regional emissions from oil and gas field operations. Phase II, completed in late 2007, was an effort to more fully characterize the oil and gas field operations emissions. Phase III which began in late 2007 with the
New Mexico Section 308 Regional Haze SIP 169
Independent Petroleum Association of Mountain States (IPAMS) in conjunction with WRAP initiating a regional oil and gas emission inventory project is underway.
A component of New Mexico’s long-term strategy for reducing oil and gas emissions that affect visibility is the State’s ongoing efforts to reduce emissions that contribute to ozone formation. In 2009, legislation was passed (House Bill 195) that allows the state to be to be more stringent than federal rule for areas that are violating or within 95% of violating a federal air quality standard. This allows the state to be more proactive for those areas that are violating or in jeopardy of violating a federal air quality standard. EPA has also adopted emissions standard for the oil and gas industry that will assist the state in reducing NOx emissions. These emissions standards include: • 40 CFR. pts. 63.160-.183 (Subpart H) – National Emission Standards for Organic Hazardous Air
Pollutants for Equipment Leaks – This applies to pumps, compressors, agitators, pressure relief devices, and other pieces of equipment that are intended to operate in organic hazardous air pollutant service 300 hours or more per year within a source subject to part 63 that references subpart H. Pt. 63.160(a);
• 40 C.F.R. pts. 63.760-.777 (Subpart HH) – National Emission Standards for Hazardous Air Pollutants
from Oil and Natural Gas Production Facilities – This applies to emission points of hazardous air pollutants located at oil and natural gas production facilities that are major or area sources of hazardous air pollutants, as well as facilities that process, upgrade, or store hydrocarbon liquids prior to the point of custody transfer, and facilities that process, upgrade, or store natural gas prior to the point at which natural gas enters the natural gas transmission and storage source category or is delivered to a final end user;
• 40 C.F.R. pts. 63.1100-.1114 (Subpart YY) – National Emission Standards for Hazardous Air
Pollutants for Source Categories: Generic Maximum Achievable Control Technology (MACT) Standards – Subpart YY applies MACT standards to eight different source categories and affected sources, including ethylene production emission points located at major sources;
• 40 C.F.R. pts. 63.6080-.6175 (Subpart YYYY) – National Emission Standards for Hazardous Air
Pollutants for Stationary Combustion Turbines – This subpart applies to stationary combustion turbines located at major sources of hazardous air pollutant emissions, including turbines located at oil and gas production facilities. Pt. 63.6085(a)-(b).
• 40 C.F.R. pts. 63.6580-.6675 (Subpart ZZZZ) – National Emissions Standards for Hazardous Air
Pollutants for Stationary Reciprocating Internal Combustion Engines (RICE) – This applies to RICE located at major sources of hazardous air pollutant emissions, including oil and gas production facilities. Pt. 63.6585(a)-(b).
12.9 Projection of the Net Effect on Visibility
The WRAP has projected the net effect on visibility from emission reductions by point, area and mobile sources throughout the WRAP region through 2018. The first emission projection inventory was compiled in 2006. The inventory was revised in 2007 to make preliminary evaluations of reasonable progress towards Class I areas visibility goals. The 2007 inventory focused on the most significant point and area sources of visibility impairing pollution in states and Indian Reservations. This effort included updating projections of electric generating units and incorporating known and presumed BART emission levels. Then, in the spring of 2009, the WRAP once again updated emission inventory projections for

New Mexico Section 308 Regional Haze SIP 170
point and area sources in the WRAP region to give the most current assessment of reasonable progress towards visibility goals. Again, the updated projection inventory reflected new information about BART determinations and projection of future fossil fuel plants needed to achieve 2018 Federal electrical generation demands. Chapter 9 of this Plan shows the specific results of the CMAQ modeling which was used to make all projections of visibility. Those results show anthropogenic emissions sources generally declining across the West through 2018. However, natural sources such as wildfires and dust and international sources in Mexico appear to offset improvements in visibility from controls on manmade sources in the U.S. In spite of the large number of growing uncontrollable sources in the WRAP region, however, New Mexico does see a net visibility improvement at the New Mexico's Class I areas through 2018. The net effect of all of the reductions in the WRAP region, known at the time of the most recent model run is demonstrated in the WRAP Class I Summary Tables shown below for each of the Class I areas in New Mexico.

New Mexico Section 308 Regional Haze SIP 171
Table 12-7: Class I Area Visibility Summary for BAND1 on 20% Worst Days Class I Area Visibility Summary: Bandelier NM, NM
Visibility Conditions: Worst 20% Days RRF Calculation Method: Specific Days (EPA)
Emissions Scenarios: 2000-04 Baseline (plan02d) & 2018 PRPb (prp18b)
Monitored Estimated Projected
2000-04 Baseline
Conditions (Mm-1)
2064 Natural
Conditions (Mm-1)
2018
Uniform Rate of
Progress Target
(Mm-1)1
2018 Projected Visibility
Conditions (Mm-1)
Baseline to 2018 Change In Statewide Emissions (tons / %)
Baseline to
2018 Change In Upwind Weighted
Emissions2 (%)
Baseline to 2018 Change In
Anthropogenic Upwind
Weighted Emissions2
(%)
Sulfate 6.89 0.65 5.17 5.99 -1,320 -3% -4% -4%
Nitrate 2.51 0.81 2.09 2.53 -64,814 -19% -24% -26%
Organic Carbon 14.23 4.01 11.32 14 -813
-4% 1% 3%
Elemental Carbon 3.15 0.32 2.43 2.65 -1,296
-21% -21% -41%
Fine Soil 1.12 1.07 1.11 1.43 1,470 11% 18% 27%
Coarse Material3 2.93 3.64 3.09 9,193
13% 17% 30%
Sea Salt3 0.24 0.24 0.24
Not Applicable
Total Light Extinction 40.07 19.74 34.02 38.77
Deciview 12.22 6.26 10.83 11.9
Not Applicable
1) 2018 Uniform Rate of Progress Target for Best 20% Days is not defined. 2) Results based on Weighted Emissions Potential analysis using the 2000-04 Baseline (plan02d) & 2018 PRPb (prp18b) emissions scenarios. 3) Visibility projections not available due to model performance issues. WRAP TSS - http://vista.cira.colostate.edu/tss/

New Mexico Section 308 Regional Haze SIP 172
Table 12-8: Class I Area Visibility Summary for BOAP1 on 20% Worst Days Class I Area Visibility Summary: Bosque del Apache NWRW, NM
Visibility Conditions: Worst 20% Days RRF Calculation Method: Specific Days (EPA)
Emissions Scenarios: 2000-04 Baseline (plan02d) & 2018 PRPb (prp18b)
Monitored Estimated Projected
2000-04 Baseline
Conditions (Mm-1)
2064 Natural
Conditions (Mm-1)
2018
Uniform Rate of
Progress Target
(Mm-1)1
2018 Projected Visibility
Conditions (Mm-1)
Baseline to 2018 Change In Statewide Emissions (tons / %)
Baseline to
2018 Change In Upwind Weighted
Emissions2 (%)
Baseline to 2018Change In
Anthropogenic Upwind
Weighted Emissions2
(%)
Sulfate 7.51 0.58 5.57 7.27 -1,320 -3% -2% -2%
Nitrate 3.24 1.01 2.68 3.02 -64,814 -19% -26% -31%
Organic Carbon 8.73 3.15 7.24 8.6 -813
-4% 1% 3%
Elemental Carbon 2.6 0.29 2.02 2.15 -1,296
-21% -18% -33%
Fine Soil 1.94 1.06 1.73 2.16 1,470 11% 11% 23%
Coarse Material3 6.69 3.56 5.90 9,193
13% 4% 12%
Sea Salt3 0.19 0.25 0.21
Not Applicable
Total Light Extinction 40.90 19.89 34.57 40.09
Deciview 13.8 6.73 12.15 13.59
Not Applicable
1) 2018 Uniform Rate of Progress Target for Best 20% Days is not defined. 2) Results based on Weighted Emissions Potential analysis using the 2000-04 Baseline (plan02d) & 2018 PRPb (prp18b) emissions scenarios. 3) Visibility projections not available due to model performance issues. WRAP TSS - http://vista.cira.colostate.edu/tss/
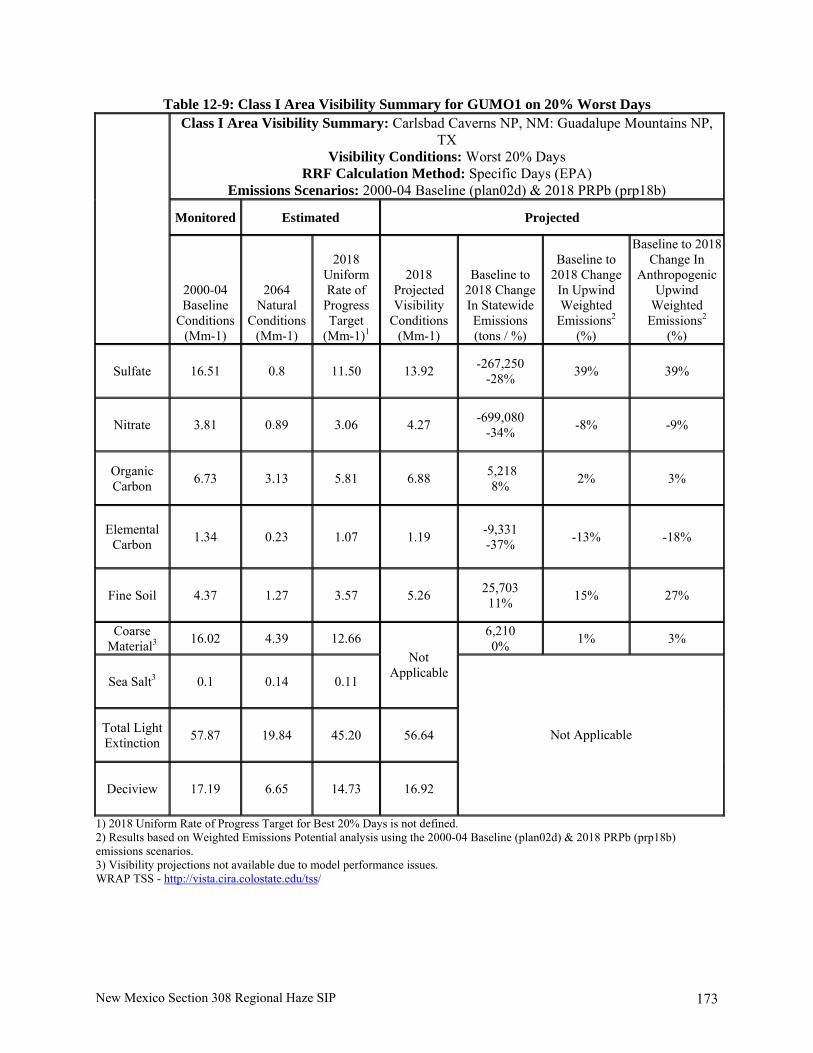
New Mexico Section 308 Regional Haze SIP 173
Table 12-9: Class I Area Visibility Summary for GUMO1 on 20% Worst Days Class I Area Visibility Summary: Carlsbad Caverns NP, NM: Guadalupe Mountains NP,
TX Visibility Conditions: Worst 20% Days
RRF Calculation Method: Specific Days (EPA) Emissions Scenarios: 2000-04 Baseline (plan02d) & 2018 PRPb (prp18b)
Monitored Estimated Projected
2000-04 Baseline
Conditions (Mm-1)
2064 Natural
Conditions (Mm-1)
2018
Uniform Rate of
Progress Target
(Mm-1)1
2018 Projected Visibility
Conditions (Mm-1)
Baseline to 2018 Change In Statewide Emissions (tons / %)
Baseline to
2018 Change In Upwind Weighted
Emissions2 (%)
Baseline to 2018 Change In
Anthropogenic Upwind
Weighted Emissions2
(%)
Sulfate 16.51 0.8 11.50 13.92 -267,250 -28% 39% 39%
Nitrate 3.81 0.89 3.06 4.27 -699,080 -34% -8% -9%
Organic Carbon 6.73 3.13 5.81 6.88 5,218
8% 2% 3%
Elemental Carbon 1.34 0.23 1.07 1.19 -9,331
-37% -13% -18%
Fine Soil 4.37 1.27 3.57 5.26 25,703 11% 15% 27%
Coarse Material3 16.02 4.39 12.66 6,210
0% 1% 3%
Sea Salt3 0.1 0.14 0.11
Not Applicable
Total Light Extinction 57.87 19.84 45.20 56.64
Deciview 17.19 6.65 14.73 16.92
Not Applicable
1) 2018 Uniform Rate of Progress Target for Best 20% Days is not defined. 2) Results based on Weighted Emissions Potential analysis using the 2000-04 Baseline (plan02d) & 2018 PRPb (prp18b) emissions scenarios. 3) Visibility projections not available due to model performance issues. WRAP TSS - http://vista.cira.colostate.edu/tss/

New Mexico Section 308 Regional Haze SIP 174
Table 12-10: Class I Area Visibility Summary for GILA1 on 20% Worst Days Class I Area Visibility Summary: Gila W, NM
Visibility Conditions: Worst 20% Days RRF Calculation Method: Specific Days (EPA)
Emissions Scenarios: 2000-04 Baseline (plan02d) & 2018 PRPb (prp18b)
Monitored Estimated Projected
2000-04 Baseline
Conditions (Mm-1)
2064 Natural Conditions
(Mm-1)
2018 Uniform Rate of
Progress Target
(Mm-1)1
2018 Projected Visibility
Conditions (Mm-1)
Baseline to 2018 Change In Statewide Emissions (tons / %)
Baseline to
2018 Change In Upwind Weighted
Emissions2 (%)
Baseline to 2018 Change In Anthropogenic
Upwind Weighted
Emissions2 (%)
Sulfate 6.87 0.58 5.13 7.67 -1,320 -3% -2% -2%
Nitrate 0.91 0.7 0.86 0.49 -64,814 -19% -23% -29%
Organic Carbon 16 4.46 12.67 23.26 -813
-4% 1% 7%
Elemental Carbon 3.17 0.41 2.46 5.7 -1,296
-21% -8% -31%
Fine Soil 1.45 1.21 1.40 2.14 1,470 11% 14% 27%
Coarse Material3 2.85 3.53 3.00 9,193
13% 7% 17%
Sea Salt3 0.07 0.16 0.09
Not Applicable
Total Light Extinction 40.31 20.05 34.30 51.16
Deciview 13.11 6.66 11.61 15.14
Not Applicable
1) 2018 Uniform Rate of Progress Target for Best 20% Days is not defined. 2) Results based on Weighted Emissions Potential analysis using the 2000-04 Baseline (plan02d) & 2018 PRPb (prp18b) emissions scenarios. 3) Visibility projections not available due to model performance issues. WRAP TSS - http://vista.cira.colostate.edu/tss/

New Mexico Section 308 Regional Haze SIP 175
Table 12-11: Class I Area Visibility Summary for SACR1 on 20% Worst Days Class I Area Visibility Summary: Salt Creek NWRW, NM
Visibility Conditions: Worst 20% Days RRF Calculation Method: Specific Days (EPA)
Emissions Scenarios: 2000-04 Baseline (plan02d) & 2018 PRPb (prp18b)
Monitored Estimated Projected
2000-04 Baseline
Conditions (Mm-1)
2064 Natural
Conditions (Mm-1)
2018 Uniform Rate of
Progress Target
(Mm-1)1
2018 Projected Visibility
Conditions (Mm-1)
Baseline to 2018 Change In Statewide Emissions (tons / %)
Baseline to
2018 Change In Upwind
Weighted Emissions2
(%)
Baseline to 2018 Change In Anthropogenic
Upwind Weighted
Emissions2 (%)
Sulfate 16.75 0.78 11.64 13.9 -1,320 -3% 2% 2%
Nitrate 11.15 0.77 8.07 11.11 -64,814 -19% -20% -23%
Organic Carbon 7.49 2.97 6.31 6.64 -813
-4% -12% -17%
Elemental Carbon 2.31 0.26 1.79 1.62 -1,296
-21% -30% -36%
Fine Soil 3.34 0.98 2.75 3.44 1,470 11% 5% 7%
Coarse Material3 11.47 4.09 9.46 9,193
13% -1% -1%
Sea Salt3 0.2 0.2 0.20
Not Applicable
Total Light Extinction 62.70 20.04 48.05 58.37
Deciview 18.03 6.81 15.41 17.31
Not Applicable
1) 2018 Uniform Rate of Progress Target for Best 20% Days is not defined. 2) Results based on Weighted Emissions Potential analysis using the 2000-04 Baseline (plan02d) & 2018 PRPb (prp18b) emissions scenarios. 3) Visibility projections not available due to model performance issues. WRAP TSS - http://vista.cira.colostate.edu/tss/

New Mexico Section 308 Regional Haze SIP 176
Table 12-12: Class I Area Visibility Summary for SAPE1 on 20% Worst Days Class I Area Visibility Summary: San Pedro Parks W, NM
Visibility Conditions: Worst 20% Days RRF Calculation Method: Specific Days (EPA)
Emissions Scenarios: 2000-04 Baseline (plan02d) & 2018 PRPb (prp18b)
Monitored Estimated Projected
2000-04 Baseline
Conditions (Mm-1)
2064 Natural
Conditions (Mm-1)
2018
Uniform Rate of
Progress Target
(Mm-1)1
2018 Projected Visibility
Conditions (Mm-1)
Baseline to 2018 Change In Statewide Emissions (tons / %)
Baseline to
2018 Change In Upwind Weighted
Emissions2 (%)
Baseline to 2018 Change In
Anthropogenic Upwind
Weighted Emissions2
(%)
Sulfate 5.78 0.7 4.41 5.38 -1,320 -3% -17% -17%
Nitrate 1.57 0.8 1.39 1.48 -64,814 -19% -16% -17%
Organic Carbon 7.66 4.02 6.73 7.6 -813
-4% 0% 1%
Elemental Carbon 1.63 0.34 1.31 1.3 -1,296
-21% -19% -41%
Fine Soil 1.47 1.16 1.40 1.68 1,470 11% 14% 22%
Coarse Material3 2.7 3.02 2.77 9,193
13% 12% 23%
Sea Salt3 0.1 0.12 0.10
Not Applicable
Total Light Extinction 28.92 18.16 25.98 28.24
Deciview 10.17 5.72 9.13 9.94
Not Applicable
1) 2018 Uniform Rate of Progress Target for Best 20% Days is not defined. 2) Results based on Weighted Emissions Potential analysis using the 2000-04 Baseline (plan02d) & 2018 PRPb (prp18b) emissions scenarios. 3) Visibility projections not available due to model performance issues. WRAP TSS - http://vista.cira.colostate.edu/tss/

New Mexico Section 308 Regional Haze SIP 177
Table 12-13: Class I Area Visibility Summary for WHIT1 on 20% Worst DaysClass I Area Visibility Summary: White Mountain W, NM
Visibility Conditions: Worst 20% Days RRF Calculation Method: Specific Days (EPA)
Emissions Scenarios: 2000-04 Baseline (plan02d) & 2018 PRPb (prp18b)
Monitored Estimated Projected
2000-04 Baseline
Conditions (Mm-1)
2064 Natural
Conditions (Mm-1)
2018
Uniform Rate of
Progress Target
(Mm-1)1
2018 Projected Visibility
Conditions (Mm-1)
Baseline to 2018 Change In Statewide Emissions (tons / %)
Baseline to
2018 Change In Upwind Weighted
Emissions2 (%)
Baseline to 2018 Change In Anthropogenic
Upwind Weighted
Emissions2 (%)
Sulfate 10.51 0.74 7.64 9.33 -1,320 -3% 0% 0%
Nitrate 3.05 0.98 2.53 2.99 -64,814 -19% -23% -27%
Organic Carbon 8.97 3.72 7.59 8.64 -813
-4% -3% -6%
Elemental Carbon 1.82 0.31 1.45 1.42 -1,296
-21% -20% -32%
Fine Soil 1.89 1.19 1.72 2.02 1,470 11% 7% 11%
Coarse Material3 6.68 4.35 6.10 9,193
13% 0% 1%
Sea Salt3 0.17 0.22 0.18
Not Applicable
Total Light Extinction 42.08 20.51 35.64 40.24
Deciview 13.7 6.8 12.09 13.26
Not Applicable
1) 2018 Uniform Rate of Progress Target for Best 20% Days is not defined. 2) Results based on Weighted Emissions Potential analysis using the 2000-04 Baseline (plan02d) & 2018 PRPb (prp18b) emissions scenarios. 3) Visibility projections not available due to model performance issues. WRAP TSS - http://vista.cira.colostate.edu/tss/
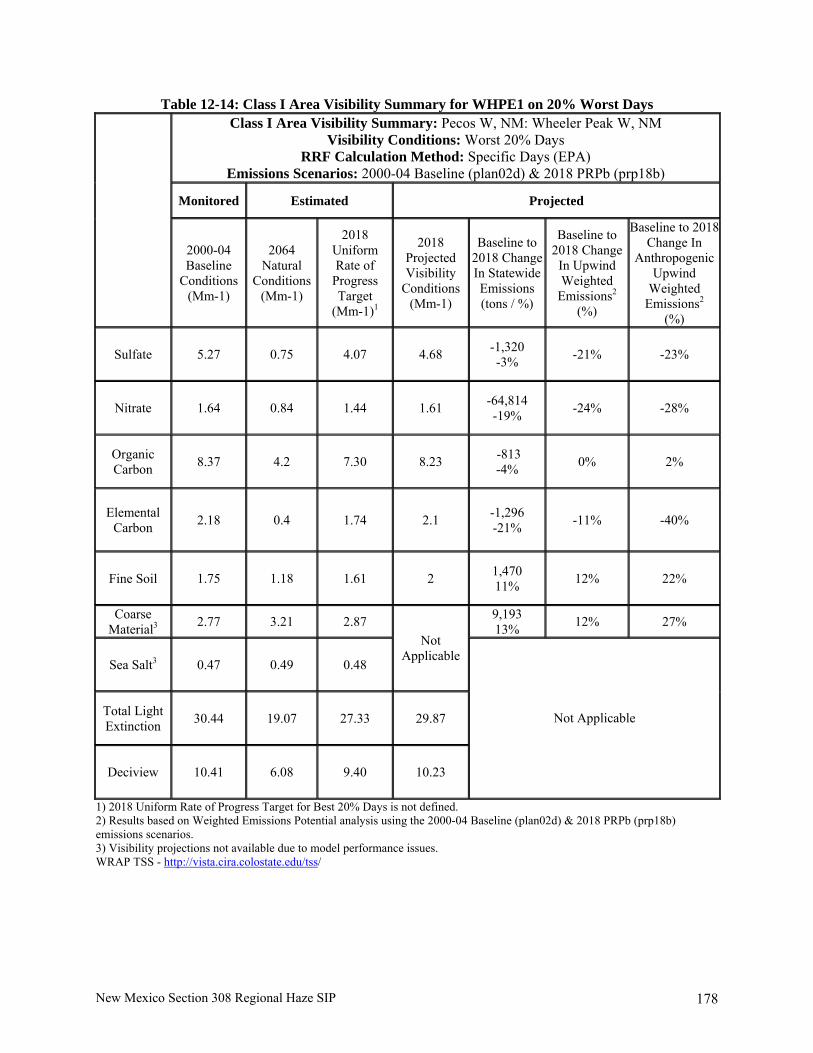
New Mexico Section 308 Regional Haze SIP 178
Table 12-14: Class I Area Visibility Summary for WHPE1 on 20% Worst Days Class I Area Visibility Summary: Pecos W, NM: Wheeler Peak W, NM
Visibility Conditions: Worst 20% Days RRF Calculation Method: Specific Days (EPA)
Emissions Scenarios: 2000-04 Baseline (plan02d) & 2018 PRPb (prp18b)
Monitored Estimated Projected
2000-04 Baseline
Conditions (Mm-1)
2064 Natural
Conditions (Mm-1)
2018 Uniform Rate of
Progress Target
(Mm-1)1
2018 Projected Visibility
Conditions (Mm-1)
Baseline to 2018 Change In Statewide Emissions (tons / %)
Baseline to 2018 Change
In Upwind Weighted
Emissions2 (%)
Baseline to 2018 Change In
Anthropogenic Upwind
Weighted Emissions2
(%)
Sulfate 5.27 0.75 4.07 4.68 -1,320 -3% -21% -23%
Nitrate 1.64 0.84 1.44 1.61 -64,814 -19% -24% -28%
Organic Carbon 8.37 4.2 7.30 8.23 -813
-4% 0% 2%
Elemental Carbon 2.18 0.4 1.74 2.1 -1,296
-21% -11% -40%
Fine Soil 1.75 1.18 1.61 2 1,470 11% 12% 22%
Coarse Material3 2.77 3.21 2.87 9,193
13% 12% 27%
Sea Salt3 0.47 0.49 0.48
Not Applicable
Total Light Extinction 30.44 19.07 27.33 29.87
Deciview 10.41 6.08 9.40 10.23
Not Applicable
1) 2018 Uniform Rate of Progress Target for Best 20% Days is not defined. 2) Results based on Weighted Emissions Potential analysis using the 2000-04 Baseline (plan02d) & 2018 PRPb (prp18b) emissions scenarios. 3) Visibility projections not available due to model performance issues. WRAP TSS - http://vista.cira.colostate.edu/tss/

New Mexico Section 308 Regional Haze SIP 179
CHAPTER 13: OTHER SIP REQUIREMENTS AND COMMITMENTS
13.1 Enforceability of Emission Limitations and Control Measures
Section 51.308(d)(3)(v)(F) requires States to ensure that emission limitations and control measures used to meet reasonable progress goals are enforceable. New Mexico has ensured that all emission limitations and control measures used to meet reasonable progress goals are enforceable. New Mexico requests EPA approval of these measures.
13.2 Commitment to Future 308 SIP Revisions
40 CFR 51.308(f) requires NMED to revise its Regional Haze Implementation Plan and submit a Plan revision to the USEPA by July 31, 2018 and every ten years thereafter. In accordance with the requirements listed in Section 51.308(f) of the Federal rule for regional haze, New Mexico commits to revising and submitting this Regional Haze Implementation Plan by July 31, 2018 and every ten years thereafter. In addition, 51.308(g) requires periodic reports evaluating progress towards the reasonable progress goals established for each mandatory Class I area. In accordance with the requirements listed in 51.308(g) of the Federal rule for regional haze, NMED commits to submitting a report on reasonable progress to the USEPA every five years following the initial submittal of the SIP. The report will be in the form of a SIP revision. The reasonable progress report will evaluate the progress made towards the reasonable progress goal for each mandatory Class I area located within New Mexico and in each mandatory Class I area located outside New Mexico which may be affected by emissions from within New Mexico. The requirements listed in 51.308(g) include the following: A description of the status of implementation of all measures included in the implementation plan for achieving reasonable progress goals for mandatory Class I Federal areas both within and outside the state;
1. Summary of emission reductions achieved thus far;
2. Assessment of changes in visibility conditions at each Class I area (current vs. baseline), expressed as 5-year averages of annual values for least impaired and most impaired days;
3. Analysis of emissions changes over the 5-year period, identified by source or activity, using the
most recent updated emissions inventory;
4. Analysis of any significant changes in anthropogenic emissions in or out of the state which have impeded progress;
5. Assessment of the sufficiency of the implementation plan to meet reasonable progress goals;
6. Review of the State’s visibility monitoring strategy and any modifications to the strategy as
necessary.
New Mexico Section 308 Regional Haze SIP 180
13.3 Commitment to Periodic Progress Reports
40 CFR 51.308(g), requires a State/Tribe to submit a progress report to EPA every five years evaluating progress towards the reasonable progress goals(s). The first progress report is due five years from the submittal of the initial implementation plan and must be in the form of an implementation plan revision that complies with Sections 51.102 and 51.103. at a minimum, the progress reports must contain the elements in paragraphs 51.308(g)(1) through (7) for each Class I area as summarized below.
1) Implementation status of the current SIP measures; 2) Summary of emissions reductions; 3) Assessment of most/least impaired days; 4) Analysis of emission reductions by pollutant; 5) Significant changes in anthropogenic emissions; 6) Assessment of the current SIP sufficiency to meet reasonable progress goals; and 7) Assessment of visibility monitoring strategy.
In accordance with the requirements listed in Section 51.308(g) of the federal regional haze rule, New Mexico commits to submitting a report on reasonable progress report will evaluate the progress made towards the reasonable progress goal for each mandatory Class I area located within New Mexico and in each mandatory Class I area located outside New Mexico, which may be affected by emissions from New Mexico.
13.4 Determination of Plan Adequacy
Depending on the findings of the five-year progress report, New Mexico commits to taking one of the actions listed in 40 CFR 51.308(h). The findings of the five-year progress report will determine which action is appropriate and necessary. List of Possible Actions (40 CFR 51.308(h))
1. NMED determines that the existing SIP requires no further substantive revision in order to achieve established goals. NMED provides to the EPA Administrator a negative declaration that further revision of the SIP is not needed at this time.
2. NMED determines that the existing SIP may be inadequate to ensure reasonable progress due to
emissions from other states, which participated in the regional planning process. NMED provides notification to the EPA Administrator and the states that participated in regional planning. NMED collaborates with states and FLMs through the regional planning process to address the SIP’s deficiencies.
3. NMED determines that the current SIP may be inadequate to ensure reasonable progress due to
emissions from another country. NMED provides notification, along with available information, to the EPA Administrator.
4. NMED determines that the existing SIP is inadequate to ensure reasonable progress due to
emissions within the state. NMED will consult with FLMs and revise its SIP to address the Plan’s deficiencies within one year.

New Mexico Section 308 Regional Haze SIP 181
APPENDICES AND TECHNICAL SUPPORT DOCUMENTATION
Appendix A: Best Available Retrofit Technology Determination for San Juan Generating Station Appendix B: Supplementary Information for Four Factor Analyses by WRAP States, EC/R
Incorporated, May 4, 2009 (corrected April 20, 2010) Appendix C: Supplementary Information for Four-Factor Analyses for Selected Individual Facilities in
New Mexico, May 5, 2009 Appendix D: 20.2.65 NMAC – Smoke Management