ARRANGING THICKNESSES AND SPANS OF … under today' s valid wheel loads and design category for...
12
International Journal of Advances in Engineering & Technology, Sept. 2013. ©IJAET ISSN: 22311963 1512 Vol. 6, Issue 4, pp. 1512-1523 ARRANGING THICKNESSES AND SPANS OF ORTHOTROPIC DECK FOR DESIRED FATIGUE LIFE AND DESIGN CATEGORY Abdullah Fettahoglu Department of Civil Engineering, Yildiz Technical University, Istanbul, Turkey ABSTRACT Orthotropic steel highway bridges are subject to variable traffic loads, which differ in type and magnitude. Most of these bridges were built in 1960’s under design traffic load, which reflects the traffic conditions of those times. However, the number and weight of vehicles in traffic have increased since then too much in comparison to today. As a result these bridges are loaded more than their designed traffic loads and hence bridges' fatigue lives are shorten. As a remedy for this issue, thicknesses of fatigue sensitive structural parts of bridge shall be determined under today' s valid wheel loads and design category for desired fatigue life. In the scope of this study the traditional steel orthotropic highway bridge is analyzed using a FE- model, which encompasses bridge' s entire geometry. The traffic load is selected so conservatively, that it is composed of static wheel loads and wheel load area, which comply with the wheels of vehicles used today in traffic. Subsequently, fatigue lives of four fatigue sensitive structural parts of bridge are calculated. These are critical section in web of cross girder due to cut outs, weld connecting deck plate to trapezoidal rib, continuous longitudinal stringer and deck plate. Finally, required thicknesses and spans of these structural parts depending on their fatigue lives and design categories are given. KEYWORDS: Deck plate, Longitudinal stringer, Cross beam, Fatigue, FEM, Steel Bridge I. INTRODUCTION Construction of orthotropic decks with deck plate, cross- beams and trapezoidal ribs going through the cut- outs in cross beam webs started approximately in 1965 and is still used widely in industry [1]. Orthotropic deck structure is a common design, which is used worldwide in fixed, movable, suspension, cable- stayed, girder, etc. bridge types. In Japan, Akashi Kaikyo suspension bridge, Tatara cable stayed bridge [2], Trans-Tokyo Bay Crossing steel box-girder bridge [3], which are among the longest bridges in the world, have orthotropic deck structure. In France Millau viaduct has a box girder with an orthotropic deck using trapezoidal stiffeners [4]. In England, Germany and Netherlands there are a lot of steel highway bridges having orthotropic decks [1]. The traditional orthotropic deck is composed of deck plate, longitudinal stringer and cross beams. The distance between longitudinal stringers and between cross beams are in general 300 mm and 3 m to 5 m respectively. In addition to deck structure, wearing course lying on deck plate and main girders transmitting load to supports are two important components of orthotropic bridges. While wearing course might be of asphalt or concrete, main girder might be of a girder, a truss, a cable stayed or a tied arch system. Wheel loads are first dispersed by wearing course and introduced in deck plate. Then longitudinal stringers transmit wheel loads to cross beams. Finally wheel loads are transferred from cross beams over main girders to the bridge's supports. When the orthotropic deck structure design was developed in 1960s, fatigue calculations were not considered in design principles [5]. In addition, fatigue strengths of structural parts forming orthotropic deck were also not known at that time. In time cracks have appeared and developed continuously in orthotropic decks, which shall not have been emerged in orthotropic deck according to design principles foreseen at that time. These cracks and improved fatigue theory of fluctuating variable loads reminded to calculate orthotropic decks as per fatigue strengths [6]. Afterwards, several research facilities have been started to obtain fatigue strengths of structural details of orthotropic decks [7,8 ,9 10, 11]. Finally, prEN 1993- 1- 9 [12] collects fatigue
Transcript of ARRANGING THICKNESSES AND SPANS OF … under today' s valid wheel loads and design category for...
International Journal of Advances in Engineering & Technology, Sept. 2013.
©IJAET ISSN: 22311963
1512 Vol. 6, Issue 4, pp. 1512-1523
ARRANGING THICKNESSES AND SPANS OF ORTHOTROPIC
DECK FOR DESIRED FATIGUE LIFE AND DESIGN CATEGORY
Abdullah Fettahoglu
Department of Civil Engineering, Yildiz Technical University, Istanbul, Turkey
ABSTRACT
Orthotropic steel highway bridges are subject to variable traffic loads, which differ in type and magnitude. Most
of these bridges were built in 1960’s under design traffic load, which reflects the traffic conditions of those
times. However, the number and weight of vehicles in traffic have increased since then too much in comparison
to today. As a result these bridges are loaded more than their designed traffic loads and hence bridges' fatigue
lives are shorten. As a remedy for this issue, thicknesses of fatigue sensitive structural parts of bridge shall be
determined under today' s valid wheel loads and design category for desired fatigue life. In the scope of this
study the traditional steel orthotropic highway bridge is analyzed using a FE- model, which encompasses
bridge' s entire geometry. The traffic load is selected so conservatively, that it is composed of static wheel loads
and wheel load area, which comply with the wheels of vehicles used today in traffic. Subsequently, fatigue lives
of four fatigue sensitive structural parts of bridge are calculated. These are critical section in web of cross
girder due to cut outs, weld connecting deck plate to trapezoidal rib, continuous longitudinal stringer and deck
plate. Finally, required thicknesses and spans of these structural parts depending on their fatigue lives and
design categories are given.
KEYWORDS: Deck plate, Longitudinal stringer, Cross beam, Fatigue, FEM, Steel Bridge
I. INTRODUCTION
Construction of orthotropic decks with deck plate, cross- beams and trapezoidal ribs going through the
cut- outs in cross beam webs started approximately in 1965 and is still used widely in industry [1].
Orthotropic deck structure is a common design, which is used worldwide in fixed, movable,
suspension, cable- stayed, girder, etc. bridge types. In Japan, Akashi Kaikyo suspension bridge, Tatara
cable stayed bridge [2], Trans-Tokyo Bay Crossing steel box-girder bridge [3], which are among the
longest bridges in the world, have orthotropic deck structure. In France Millau viaduct has a box
girder with an orthotropic deck using trapezoidal stiffeners [4]. In England, Germany and Netherlands
there are a lot of steel highway bridges having orthotropic decks [1]. The traditional orthotropic deck
is composed of deck plate, longitudinal stringer and cross beams. The distance between longitudinal
stringers and between cross beams are in general 300 mm and 3 m to 5 m respectively. In addition to
deck structure, wearing course lying on deck plate and main girders transmitting load to supports are
two important components of orthotropic bridges. While wearing course might be of asphalt or
concrete, main girder might be of a girder, a truss, a cable stayed or a tied arch system. Wheel loads
are first dispersed by wearing course and introduced in deck plate. Then longitudinal stringers
transmit wheel loads to cross beams. Finally wheel loads are transferred from cross beams over main
girders to the bridge's supports. When the orthotropic deck structure design was developed in 1960s,
fatigue calculations were not considered in design principles [5]. In addition, fatigue strengths of
structural parts forming orthotropic deck were also not known at that time. In time cracks have
appeared and developed continuously in orthotropic decks, which shall not have been emerged in
orthotropic deck according to design principles foreseen at that time. These cracks and improved
fatigue theory of fluctuating variable loads reminded to calculate orthotropic decks as per fatigue
strengths [6]. Afterwards, several research facilities have been started to obtain fatigue strengths of
structural details of orthotropic decks [7,8 ,9 10, 11]. Finally, prEN 1993- 1- 9 [12] collects fatigue

International Journal of Advances in Engineering & Technology, Sept. 2013.
©IJAET ISSN: 22311963
1513 Vol. 6, Issue 4, pp. 1512-1523
strengths of orthotropic deck details and is used throughout this study for the fatigue calculations. To
simulate vehicle loads in traffic, static wheel loads and wheel load area, which comply with the
wheels of vehicles used today in traffic, are selected. To calculate the stresses developed under wheel
loads, a FE- model of traditional steel orthotropic highway bridge is established using ANSYS [13].
This FE- model encompasses bridge' s entire geometry, which conforms to recommendations of DIN
FB 103 [14] and presented in the next section. Since the number and weight of vehicles in traffic are
increased in time since 1960's up to now, the frequency of wheel loads on the bridges, hence the
design traffic category of many existing bridges changed. As a solution to this problem, thicknesses
and spans of fatigue sensitive structural parts of bridge are determined under today' s valid wheel
loads and design traffic category for desired fatigue life in section III. These fatigue sensitive
structural parts are the critical section in web of cross girder due to cut outs, weld connecting deck
plate to trapezoidal rib, continuous longitudinal stringer and deck plate. Subsequently, results are
assessed in section IV and finally, conclusions of this study together with future work are given in
section V.
II. FE- MODEL OF THE BRIDGE
So as to compare the stresses developed for different structural thicknesses and spans, all dimensions
of the bridge shall be defined as variables in ANSYS [13]. Therefore an algorithm to provide this
condition is written by means of APDL (Ansys Parametric Design Language). Afterwards thicknesses
and spans of structural parts, which are of interest, are entered in ANSYS using this algorithm.
Stresses developed for different thicknesses and spans are given in the next section. The FE- model of
the bridge is generated using SHELL 181, which is given in Figure 2.
The FE model of Huurman et al. [15] inspired the researchers to create FE- model of the bridge used
in this research [16, 17]. However, in the FE- model, which is generated using ANSYS [13] and used
in this study stiffened main girder and pedestrian road are also generated, which are not included in
the FE- model of Huurman et. al. [15] (See Figure 3). Because of the excessive number of nodal
unknowns, dimensions of the bridge used in this research are chosen as short as possible. To decrease
further the number of nodal unknowns solely the quarter of the bridge shown in Figure 4 is modeled
Figure 1. Traditional load bearing parts of steel orthotropic bridge.
main girder
in field main girder
at support
assembly joint drainage
deck plate
longitudinal
stiffener (rib) cross beam
Figure 2. Shell 181 finite element, which is used in this study [13].
xo = Element x- axis , if x is not defined by user.
x = Element x-axis, which is defined by user.

International Journal of Advances in Engineering & Technology, Sept. 2013.
©IJAET ISSN: 22311963
1514 Vol. 6, Issue 4, pp. 1512-1523
by applying the necessary boundary conditions. As a result, number of elements and nodes in the FE-
model of the bridge are 284 010 and 293 491 respectively. However, element and node numbers vary
slightly, when cross- beam span and / or rib span is / are changed, which is the situation handled in
section 3.5. of this article. Actually cross- beam span is always taken as 3 m in all FE- analyses except
the FE- analysis named as Redesign- 2. Width of pedestrian road and deck plate in transverse
direction are 1.1 m and 6.3 m respectively, while width of deck plate changes, when rip span changes.
Nevertheless, length of deck plate is always equal to 6 m (bridge span distance), when cross- beam
span changes. That is, number of cross beams differs for cross beam span of 3 m (3 cross- beams) and
2 m (4 cross- beams).
The bridge analyzed spans 6 m in longitudinal direction and has stiffened main girders at supports,
normal main girders at field (outside support areas), 2 exterior- 5 interior ribs, 1 rib in main girder and
1 rib in pedestrian road. The initial height, width and span of the ribs used in orthotropic deck are 275
mm, 300 mm and 300 mm respectively. However, rip span changes in some FE- analyses to evaluate
its effect on results, while number of ribs and other dimensions are kept constant.
According to Capital II of DIN FB 103 [14] the yield stress and strength values of the selected steel
material (S 355) are given in Table 1. Table 1. Material properties.
Yield
strength of
steel (fy)
355 N/mm2 Shear module (G) 81,000 N/mm2
Ultimate
strength (fu) 510 N/mm2 Poisson ratio (υ) 0,3
Elasticity
module (E)
210,000
N/mm2 Density (ρsteel) 78.5 kN/m3
Figure 3. Left, connection of cross-beam to main girder. Right, connection of deck plate to pedestrian
road.
Figure 4. FE- model and boundary conditions of bridge quarter.
Support, movable in x- and y directions
Symmetry conditions
acc. to x- axis
Symmetry
conditions acc.
to y- axis

International Journal of Advances in Engineering & Technology, Sept. 2013.
©IJAET ISSN: 22311963
1515 Vol. 6, Issue 4, pp. 1512-1523
The wheel loads and wheel areas on FE- model of the bridge are given in Figure 5.
III. RESULTS & DISCUSSION
3.1. Critical Section in Web of Cross Girder due to Cut Outs
In this structural part stresses because of Vierendeel effect play the distinctive role, when designing
for desired fatigue life. Stress range at this part is calculated by means of the stress results of FE-
analysis. Fatigue strength of this part is given in detail category 71 as per prEN 1993- 1- 9: 2003 (D)
Table 8.8 [12]. Stress distribution in this critical part is depicted in Figure 6, in which web tickness of
the cross girder is determined by stresses due to Vierendeel effect. Because entire bridge geometry is
incorporated in the FE- model, stress concenrations develop at the edge of cut outs, even though the
material does not yield. If the concentration of stresses at cut out edge is ignored and the distribution
of stresses are assumed linear, the traditional stresses due to Vierendeel effect result in the values
given in Figure 7. Since stress ranges given in S- N curves are based on stresses calculated according
to linear elasticity theory, the linear distributed stresses in Figure 7 are taken into account for fatigue
calculations.
First, the stress range of this structural part for its fatigue calculation is simply the double of max.
absolute stress at the edge of cut out. Second, the endurance of this structural part is calculated using
fatigue strength (S- N curve), which is fatigue detail category 71 given in Figure 8. Third, the fatigue
life of structural part is calculated using Table 4.5 in ENV 1991- 3: 1995 [18] as per different web
thicknesses of cross girder. Table 2 shows Table 4.5 in ENV 1991- 3: 1995 [18], which shows the
occurance of stress range in a year according to bridge design traffic category.
Figure 5. wheel loads and wheel areas on FE- model of the bridge.
55 kN
207 mm
375 mm
1300 mm
Figure 7. Stresses due to Vierendeel effect with and without
concentration at edges. Simulation "BB"
Figure 6. Stress distribution in cross
girder in vicinity of cut outs.
Simulation "BB".
209.374 MPa
22.494 MPa
24.165
MPa
10.717 MPa
376 mm
260.61 mm 115.39 mm

International Journal of Advances in Engineering & Technology, Sept. 2013.
©IJAET ISSN: 22311963
1516 Vol. 6, Issue 4, pp. 1512-1523
Table 2. Number of vehicle passing per year for one traffic lane.
Design Traffic Category Occurance of stress range per
year for one traffic lane
1: Motorways and streets with 2 or more traffic lanes in every traffic
direction and with high passing of trucks 2x10⁶
2: Motorways and streets with average passing of trucks 0.5x10⁶
3: Main streets with low passing of trucks 0.125x10⁶
4: Local streets with low passing of trucks 0.05x10⁶
ΔE,2= 2x24.165 = 48.33 MPa
Ff = 1.00
Mf = 1.15 (According to prEN 1993- 1- 9: 2003 (D) Table 3.1: Damage tolerant assessment method
with high consequence of failure [12] )
Ff x ΔE,2 = 48.33 < 61.74 = 71 / 1.15 = ΔC/ Mf
The fatigue calculation done above is repeated for increased web thicknesses of cross girder. There
are totally 4 conditions; web thickness of 14 mm (simulation BB), 16 mm (simulation QSD16), 18
mm (simulation QSD18) and 20 mm (simulation QSD20). Table 3 summarizes the results of fatigue
calculation, namely fatigue lives as per chosen cross- beam web thickness and design traffic category.
Table 3. Fatigue life calculation of web of cross girder as per its thickness
Simulation’s
name Δ E,2
(MPa) Ni
Fatigue life (year) as per
Design
Traffic
Category 1
Design
Traffic
Category 2
Design
Traffic
Category 3
Design
Traffic
Category 4
BB 48.330 4 094 832 2.05 8.19 32.76 81.90
QSD16 42.808 6 574 653 3.29 13.15 52.60 131.49
QSD18 38.390 11 334 620 5.67 22.67 90.68 226.69
QSD20 34.770 18 598 335 9.30 37.20 148.79 371.97
Figure 8. Fatigue strength curve 71.

International Journal of Advances in Engineering & Technology, Sept. 2013.
©IJAET ISSN: 22311963
1517 Vol. 6, Issue 4, pp. 1512-1523
According to Capital 4.6.1 General Issues 2(c) of DIN ENV- 1991- 3 [18] service life of bridges shall
be 100 years for all design traffic categories. Fatigue lives depending on design traffic categories are
calculated for cross- beam web thicknesses of 14 mm, 16 mm, 18 mm and 20 mm respectively. Figure
9 shows that increasing cross- beam web thickness leads increasing of its fatigue life. As design
category number of bridge increases, slope of the curve given in Figure 16 increases also. However,
required service life of bridge (100 years) is obtained only for design traffic categories of 3 and 4. As
a result, recommended cross- beam web thicknesses for bridges of design traffic category 3 and 4 are
20 mm and 16 mm respectively.
3.2. Continuous Longitudinal Stringer, with Additional Cut-out in Cross Girder The fatigue assessment of this structural part is based on the direct stress in the longitudinal stringer
(see Figure 10). The fatigue strength of this structural part is determined by Fatigue Strength Curve 71
according to prEN 1993- 1- 9: 2003 (D) Table 8.8 [12]. Here Fatigue Strength Curve 71 is selected
instead of Curve 80, since the thickness of cross beam web is 14 mm (higher than 12 mm).
ΔE,2= 2x82.162 = 164.324 MPa (See Figure 11)
Ff = 1.00
Mf = 1.00 (According to prEN 1993- 1- 9: 2003 (D) Table 3.1: Damage tolerant assessment method
with low consequence of failure [12] ).
Ff x ΔE,2 164.324 > 71= ΔC/ Mf
The fatigue life of this structural part is very short even for design traffic category 4. Now 4 scenarios
will be assessed, in which rib thicknesses are increased. These are the results of simulations having
names of RD8NRV1, RD8NRV2, RD10NRV1 and RD10NRV2. In RD8NRV1, the thickness of one
rib at both sides of main girder is increased from 6 mm to 8 mm. . In RD8NRV2, the thickness of two
ribs at both sides of main girder is increased from 6 mm to 8 mm. In RD10NRV1, the thickness of
one rib at both sides of main girder is increased from 6 mm to 10 mm. In RD10NRV2, the thickness
of two ribs at both sides of main girder is increased from 6 mm to 10 mm. Increasing rib thickness
leads lengthening of structure' s fatigue life as seen in Table 4, nevertheless none of the fatigue lives
provides a meaningful lifespan for structure.
Figure 10. Fatigue sensitive structural part.
Figure 9. Fatigue lives of cross- beam web as to thickness and design traffic category.
cross- beam web thickness (mm)
Fat
igu
e li
fe (
yea
r)

International Journal of Advances in Engineering & Technology, Sept. 2013.
©IJAET ISSN: 22311963
1518 Vol. 6, Issue 4, pp. 1512-1523
Table 4. Fatigue life calculation of rib as per its thickness.
Simulation’s
name Δ E,2
(Mpa) Ni
Fatigue life (year) as per
Design Traffic
Category 1
Design Traffic
Category 2
Design Traffic
Category 3
Design Traffic
Category 4
BB 164.324 158 444 0.08 0.32 1.27 3.17
RD8NRV1 122.860 379 095 0.19 0.76 3.03 7.58
RD8NRV2 120.638 400 431 0.20 0.80 3.20 8.01
RD10NRV1 97.620 755 725 0.38 1.51 6.05 15.11
RD10NRV2 94.682 828 281 0.41 1.66 6.63 16.57
Figure 12 illustrates the variation of fatigue life of continuous longitudinal stringer. Neither traditional
rib web thickness of 6 mm nor increased rib web thickness values of 8 mm and 10 mm provides
required bridge' s service life, 100 years. The max. fatigue life of this structural part even for design
traffic category 4 and using 10 mm rib web thickness is very low, 16.57 years. So, not increasing rib
web thickness, but may be decreasing rib span and / or cross- beam span can supply required fatigue
stiffness to this structural detail.
3.3. Weld connecting deck plate to rib Weld connecting deck plate to rib is of importance as per fatigue strength on the basis of practical
findings. Calculation of stress range depends on the moment in rib web (see Figure 13).
Figure 11. Extreme values of direct stresses in ribs. Simulation "BB"
Stress concentration
at contact point to
cross girder.
y = 82.162 Mpa
Stress concentration at
contact point to cross girder.
Fat
igu
e li
fe (
yea
r)
rib web thickness (mm)
Figure 12. Fatigue lives of rib web as to thickness and design traffic category.

International Journal of Advances in Engineering & Technology, Sept. 2013.
©IJAET ISSN: 22311963
1519 Vol. 6, Issue 4, pp. 1512-1523
According to prEN 1993- 1- 9: 2003 (E) Table 8.8 [12] assessment of fatigue life is based on direct
stresses from bending of rib web. This direct stress is taken from the results of FE- analysis given in
Table 5 (See also Figure 14).
ΔE,2= 2x67.469 = 134.938 MPa
Ff = 1.00
Mf = 1.15 (According to prEN 1993- 1- 9: 2003 (D) Table 3.1: Damage tolerant assessment method
with high consequence of failure [12] )
Ff x ΔE,2 134.938 > 61.74= ΔC/ Mf
If it is assumed that the contact area between deck plate and rib carries the traffic load in case of
pressure stresses, the max. tension stress is equal to the stress range for the fatigue calculation of
weld.
Ff x ΔE,2 52.26 < 61.74= ΔC/ Mf
The fatigue lives of weld are given in Table 5. Unfortunately, according to the results given in Table 5
any increase of rib web has almost no effect on the fatigue life of weld.
Table 5. Fatigue life calculation of weld between rib and deck plate as per rib thickness
Simulation's
name Δ E,2
(MPa) Ni
Fatigue life (year) as per
Design Traffic
Category 1
Design Traffic
Category 2
Design Traffic
Category 3
Design Traffic
Category 4
BB 52.260 3 238 757 1.62 6.48 25.91 64.78
RD8NRV1 52.732 3 152 563 1.58 6.31 25.22 63.05
RD8NRV2 52.597 3 176 900 1.59 6.35 25.42 63.54
RD10NRV1 51.444 3 395 333 1.70 6.79 27.16 67.91
RD10NRV2 51.605 3 363 653 1.68 6.73 26.91 67.27
Figure 13. Weld connecting deck plate to rib.
Figure 14. Direct stress values for fatigue assessment of weld. Simulation "BB"
w = Mw / t
International Journal of Advances in Engineering & Technology, Sept. 2013.
©IJAET ISSN: 22311963
1520 Vol. 6, Issue 4, pp. 1512-1523
As given in Table 5 weld connecting deck plate to rib has not a fatigue life equals or higher than 100
years, when the thickness of rib 6 mm, 8 mm or 10 mm is. In addition, changing rib web thickness has
almost no influence on fatigue life of weld connecting deck plate to rib.
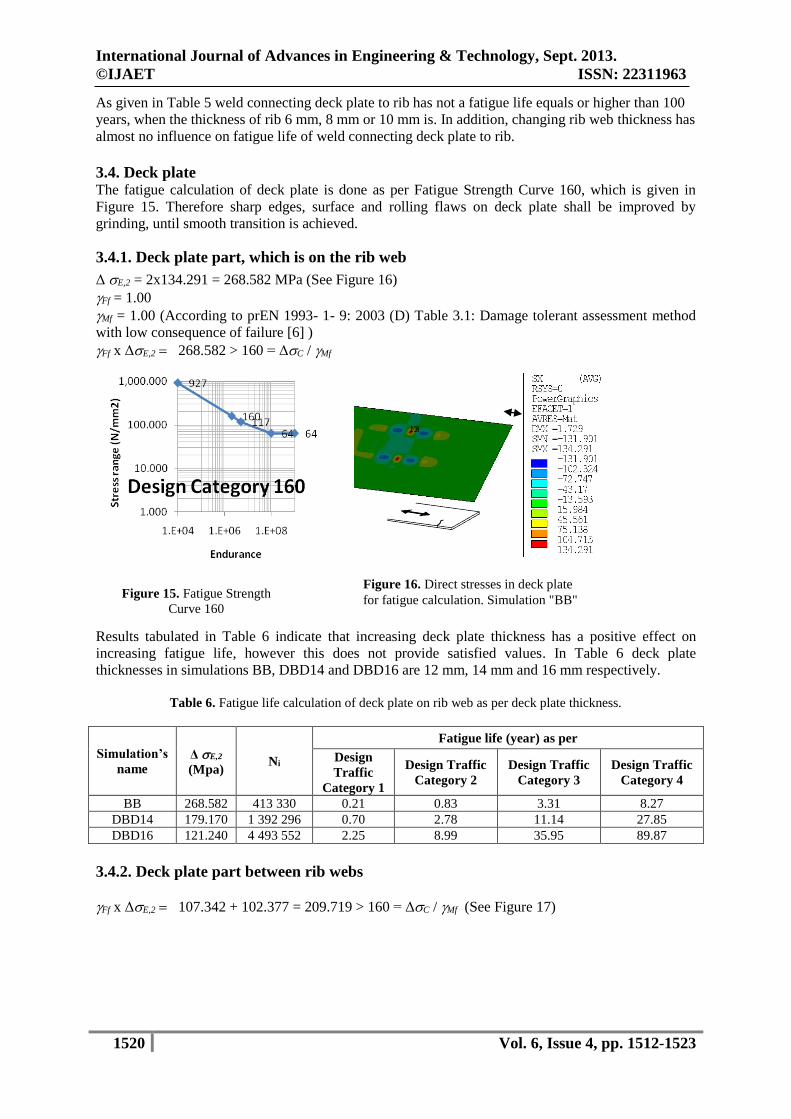
3.4. Deck plate The fatigue calculation of deck plate is done as per Fatigue Strength Curve 160, which is given in
Figure 15. Therefore sharp edges, surface and rolling flaws on deck plate shall be improved by
grinding, until smooth transition is achieved.
3.4.1. Deck plate part, which is on the rib web
ΔE,2= 2x134.291 = 268.582 MPa (See Figure 16)
Ff = 1.00
Mf = 1.00 (According to prEN 1993- 1- 9: 2003 (D) Table 3.1: Damage tolerant assessment method
with low consequence of failure [6] )
Ff x ΔE,2 268.582 > 160= ΔC/ Mf
Results tabulated in Table 6 indicate that increasing deck plate thickness has a positive effect on
increasing fatigue life, however this does not provide satisfied values. In Table 6 deck plate
thicknesses in simulations BB, DBD14 and DBD16 are 12 mm, 14 mm and 16 mm respectively.
Table 6. Fatigue life calculation of deck plate on rib web as per deck plate thickness.
Simulation’s
name Δ E,2
(Mpa) Ni
Fatigue life (year) as per
Design
Traffic
Category 1
Design Traffic
Category 2
Design Traffic
Category 3
Design Traffic
Category 4
BB 268.582 413 330 0.21 0.83 3.31 8.27
DBD14 179.170 1 392 296 0.70 2.78 11.14 27.85
DBD16 121.240 4 493 552 2.25 8.99 35.95 89.87
3.4.2. Deck plate part between rib webs
Ff x ΔE,2 107.342 + 102.377 = 209.719 > 160= ΔC/ Mf (See Figure 17)
Figure 16. Direct stresses in deck plate
for fatigue calculation. Simulation "BB" Figure 15. Fatigue Strength
Curve 160

International Journal of Advances in Engineering & Technology, Sept. 2013.
©IJAET ISSN: 22311963
1521 Vol. 6, Issue 4, pp. 1512-1523
Table 7 tabulates the fatigue results , when deck plate thickness 12 mm (BB), 14 mm (DBD14) and 16
mm (DBD16) is.
Table 7. Fatigue lives of deck plate between rib webs as per deck plate thickness.
Simulation's
name
Max.
Stress
Min.
Stress Δ E,2
(MPa) Ni
Fatigue life (year) as per
Design
Traffic
Category
1
Design
Traffic
Category
2
Design
Traffic
Category
3
Design
Traffic
Category
4 BB 107.342 102.377 209.719 868 189 0.43 1.74 6.95 17.36
DBD14 84.322 80.74 165.062 1 780 682 0.89 3.56 14.25 35.61
DBD16 69.226 66.492 135.718 3 203 430 1.60 6.41 25.63 64.07
It is seen from Figure 18 and Figure 19 that increasing deck plate thickness results in higher fatigue
lives of this structural part, nevertheless never supplies the required service life, 100 years. Reducing
rib span shall be a remedy for supplying the required service life of 100 years.
Figure 17. Stresses considered for fatigue calculation of deck plate between rib webs.
Rib webs, which behave as supports of deck plate
Max. x between rib webs is 107.342 MPa, whereas min. x
-102.377 is. Both of them develop direct under wheel area.
Fat
igu
e li
fe (
yea
r)
deck plate thickness (mm)
Figure 19. Fatigue lives of deck plate part on rib
web as to thickness and design traffic category. Figure 18. Fatigue lives of deck plate part between
rib webs as to thickness and design traffic category.
deck plate thickness (mm)
Fat
igu
e li
fe (
yea
r)

International Journal of Advances in Engineering & Technology, Sept. 2013.
©IJAET ISSN: 22311963
1522 Vol. 6, Issue 4, pp. 1512-1523
3.5. Redesign of Bridge Providing Necessary Fatigue Life Because all of the structural parts of bridge do not simultaneously provide 100 years even for design
traffic category 4, new designs of orthotropic bridge are required to be evaluated. Subsequently, two
redesigns are considered according to the dimensions given in Table 8. Fatigue calculations of
redesigned orthotropic deck structure are given in Table 9.
Table 8. Changed dimensions in FE- analyses, Redesign- 1 and -2.
Dimension definition Redesign- 1 Redesign- 2
Cross- beam span (m) 3 2
Rib span (mm) 100 150
Deck plate thickness (mm) 18 18
Cross- beam web thickness (mm) 16 16
Table 9. Fatigue lives of redesigned bridge structures.
Simulation
Name
Structural
Part Δ E,2
(MPa) Ni
Fatigue Life (year) as per
Design
Traffic
Category
1
Design
Traffic
Category
2
Design
Traffic
Category
3
Design
Traffic
Category
4
Redesign
1
Cross-
beam 10.774
∞
Rib 16.616
Weld 9.251
Deck plate
between
rib webs
34.225
Deck plate
on rib webs 77.04 40 388 858 20.19 80.78 323.11 807.78
Redesign
2
Cross-
beam 6.951 ∞
Rib 51.162 5 423 119 2.71 10.85 43.38 108.46
Weld 16.373 ∞
Deck plate
between
rib webs
105.94 8 214 847 4.11 16.43 65.72 164.30
Deck plate
on rib webs 65.492 90 982 538 45.49 181.97 727.86 1 819.65
In the first redesign of the bridge stress ranges appeared in cross- beam web, longitudinal stringer and
weld connecting deck plate to rib are below cut- off limit. However stress range developed in deck
plate part resting on rib web enforced bridge to be classified in design traffic category 3. If deck plate
thickness is increased, design traffic category of bridge can be increased to 2 and 1 without changing
other dimensions of bridge. Second redesign of bridge has a fatigue life of 108.46 years, when it is
used as to design traffic category 4. The comparison of dimensions and fatigue lives of separate
structural parts between Redesign- 1 and -2 indicates that decreasing rib span is more effective than
decreasing cross- beam span to increase fatigue life of structure.
IV. CONCLUSION & FUTURE SCOPE
It is numerically proven in this study that, there exists an important dimensional change, whether a
bridge is designed only as to yield stress or as to desired fatigue life under foreseen design traffic
category. It is recommended to determine first rib span and then cross- beam span, when a bridge is
designed for a desired fatigue life under foreseen design traffic category. Subsequently, thicknesses of
deck plate and cross- beam web shall be chosen appropriately. The height of longitudinal stringer may

International Journal of Advances in Engineering & Technology, Sept. 2013.
©IJAET ISSN: 22311963
1523 Vol. 6, Issue 4, pp. 1512-1523
be a parameter to reduce the stress range in ribs and weld connecting deck plate to rib. Types and
thickness of the wearing courses, which disperse wheel load on deck plate, might be a solution to
reduce stress ranges developed in structural parts. These will be the research subjects of the author in
the future work.
REFERENCES [1]. Jong, F.B.P. de (2007) Renovation Techniques for Fatigue Cracked Orthotropic Steel Bridge Decks,
Dissertation, Technical University Delft.
[2]. Honshu Shikoku Bridge Authority (2005) www.hsba.go.jp, 17-01-2005
[3]. Fujino, Y. & Yoshida, Y., (2002) "Wind-Induced Vibration and Control of Trans-Tokyo Bay Crossing
Bridge", Journal of Structural Engineering, pp1012-1025.
[4]. Virlogeux, M. (2004) "The Viaduct over the River Tarn", Conference Proceedings Steelbridge 2004
OTUA Paris, pp145-164.
[5]. Klöppel, K. & Roos, E., (1960) "Statische Versuche und Dauerversuche zur Frage der Bemessung von
Flachblechen in orthotropen Platten", Der Stahlbau, Vol. 29
[6]. Troitsky, M.S. (1967) Orthotropic Bridges - Theory and Design, The James Lincoln Arc Welding
Foundation, Cleveland, Ohio, United States of America.
[7]. Dowling, P.J., (1971) "The Behaviour of Orthotropic Steel Deck Bridges", Conference, University of
Cardiff, United Kingdom.
[8]. Beales, C, (1979) "Severn/Wye Bridge Project - Tests on Crossbeam Joints", Working paper WP/BD
44, Transport Research Laboratory, Crowthorne, Berkshire, United Kingdom. (Confidential)
[9]. Fisher, J.W. (1977) Bridge Fatigue Guide, Design and Details, American Institute of Steel Construction
Inc., New York, United States of America.
[10]. Kolstein, M.H. & Back, J.de (1989) Measurement and Interpretation of Dynamic Loads on Bridges,
Phase 3, Fatigue Strength of Orthotropic Steel Decks, Part 2, Trough to Crossbeam Connections,
Research sponsored by European Community of Steel and Coal, Delft University of Technology,
Faculty of Civil Engineering, The Netherlands
[11]. Bruls, A., Caramelli, S., Cuninghame, J.R., Jacob, B., Kolstein, M.H., Lehrke, H.P., Pautremat, E. Le
(1997) Measurement and Interpretation of Dynamic Loads on Bridges, Phase 4, Fatigue Strength of
Orthotropic Steel Decks, Research sponsored by European Community of Steel and Coal, Report Delft
University of Technology, Faculty of Civil Engineering, The Netherlands.
[12]. European Committee for Standardization , prEN 1993- 1- 9 Design of Steel Structures: Fatigue,
Brussel, 2003
[13]. Swanson Analysis System, ANSYS: User Manuals, USA, 2010.
[14]. Deutsches Institut für Normung, DIN FB 103: Stahlbrücken, Beuth Press, Berlin, 2003.
[15]. Huurman et.al., "3D-FEM for the estimation of the behaviour of asphaltic surfacings on orthotropic
steel deck bridges", 3rd International Symposium on 3D Finite Element for Pavement Analysis, Design
& Research, Amsterdam, 2002.
[16]. Fettahoglu Abdullah & Bekiroglu, Serkan, "Effect of Kinematic Hardening in Stress Calculations",
Advanced in Civil Engineering, Ankara, Turkey, 2012.
[17]. Fettahoglu Abdullah, "Effect of Deck Plate Thickness on the Structural Behaviour of Steel Orthotropic
Highway Bridges", Advanced in Civil Engineering, Ankara, Turkey, 2012.
[18]. Deutsches Institut für Normung, ENV 1991- 3 Grundlagen der Tragwerksplanung und Einwirkungen
auf Tragwerke, Teil 3: Verkehrslasten auf Brücken, Berlin, 1995.
AUTHOR Abdullah Fettahoğlu is a Deputy Site Chief at the construction of 51 MW POLAT- 1
Coal Fired Thermal Power Plant Construction, Kutahya, Turkey. He worked in
Trabzon Chamber of Commerce & Industry as a project coordinator, in ENKA and
Saudi Arabian Baytur as QA/ QC engineer, in Ferchau (Airbus first supplier) as stress
engineer, in Istanbul University as teaching and research assistant. He now makes his
Ph.D. in Yildiz Technical University. He obtained his M.Sc. and B.Sc. from Istanbul
Technical University Civil Engineering Department. His keen area is modelling
structures using FEM, especially ANSYS, steel structures, quality control &
assurance, tunnelling methods and construction techniques. He is a member of Turkish
Civil Engineering Chamber and Turkish Tunnelling Society.