Acquisition of Tactile Information by Vision-Based Tactile ...

FluxMarker: Enhancing Tactile Graphicswith Dynamic Tactile Markers
Ryo Suzuki1, Abigale Stangl2, Mark D. Gross2, Tom Yeh1
1Department of Computer Science, 2ATLAS InstituteUniversity of Colorado Boulder
Boulder, CO, USA{ryo.suzuki, abigale.stangl, mdgross, tom.yeh}@colorado.edu
ABSTRACTFor people with visual impairments, tactile graphics are an impor-tant means to learn and explore information. However, raised linetactile graphics created with traditional materials such as emboss-ing are static. While available refreshable displays can dynamicallychange the content, they are still too expensive for many users, andare limited in size. These factors limit wide-spread adoption andthe representation of large graphics or data sets. In this paper, wepresent FluxMaker, an inexpensive scalable system that renders dy-namic information on top of static tactile graphics with movabletactile markers. These dynamic tactile markers can be easily re-configured and used to annotate static raised line tactile graphics,including maps, graphs, and diagrams. We developed a hardwareprototype that actuates magnetic tactile markers driven by low-costand scalable electromagnetic coil arrays, which can be fabricatedwith standard printed circuit board manufacturing. We evaluate ourprototype with six participants with visual impairments and foundpositive results across four application areas: location finding ornavigating on tactile maps, data analysis, and physicalization, fea-ture identification for tactile graphics, and drawing support. Theuser study confirms advantages in application domains such as ed-ucation and data exploration.
CCS Concepts•Human-centered computing→ Accessibility technologies;
Keywordsvisual impairment; interactive tactile graphics; tangible interfaces;dynamic tactile markers
1. INTRODUCTIONFor people who are blind or visually impaired, tactile graphics
are essential resources to learn and explore non-textual informa-tion such as maps, graphs, and pictorial diagrams. Students withvisual impairments often use tactile graphics to understand an ab-stract concept in physics, the structure of molecules in chemistry,or a human brain model in biology classes. Although such tactile
Permission to make digital or hard copies of all or part of this work for personal orclassroom use is granted without fee provided that copies are not made or distributedfor profit or commercial advantage and that copies bear this notice and the full cita-tion on the first page. Copyrights for components of this work owned by others thanACM must be honored. Abstracting with credit is permitted. To copy otherwise, or re-publish, to post on servers or to redistribute to lists, requires prior specific permissionand/or a fee. Request permissions from [email protected].
ASSETS ’17 October 29–November 1, 2017, Baltimore, MD, USA© 2017 ACM. ISBN 123-4567-24-567/08/06. . . $15.00
DOI: 10.475/123_4
Figure 1: FluxMarker User Interaction with Dynamic Markers
representations are useful in presenting spatial and visual informa-tion, the form to associate the visual and textual information hasbeen limited; tactile graphics can only present a fixed and limitedamount of information to tactile readers [6]. Braille labels and keysare often used to annotate the content [1], but this annotation isnot accessible for many blind users, as approximately 90 percent ofblind people in the United States cannot read braille [3, 4].
To overcome these limitations, recent work has focused on en-hancing traditional tactile graphics with interactive tactile graphics,which leverage multimodal interaction to provide more accessibleand adaptable information associated with the visual information.These interactive graphics can detect touch input and annotate con-tent with an audio description [5, 26] or haptic feedback [45], whichallows readers to explore the tactile content more efficiently thanclassical tactile maps or diagrams [6, 20]. However, the tactile rep-resentations of these systems are still static and they cannot renderdynamic content in tactile form [16]. Through our formative study,we found that the current way to present dynamic tactile represen-tations is largely limited with small-size and expensive refreshablebraille displays, which can significantly limit both potential appli-cations and wide-spread adoption.
This paper proposes dynamic tactile markers, a new approach toenhancing tactile graphics with reconfigurable multiple tactile ele-ments. Dynamic tactile markers are movable, self-adjusting phys-ical elements that can render the dynamic information on top ofa traditional tactile graphic such as swell paper or thermoformedplastic. In contrast to prior approaches, which utilize audio or hap-tic feedback, our approach aims to enhance tactile feedback whichcan provide the real-time affordances and the physical guides forblind or low visions users to explore the spatial information.
We explore four application scenarios where the dynamic tac-tile markers assist blind users accomplish the following tasks: (1)find locations on a map, (2) read and analyze dynamic data, (3) lo-cate and identify specific features on tactile graphics, and (4) drawthrough dynamic assistance. In these scenarios, the dynamic tactilemarkers can be used as a tangible data point for data visualization, alocation or navigating path on a map (Figure 1), or spatial referencepoints for guided drawings.
arX
iv:1
708.
0378
3v1
[cs
.HC
] 1
2 A
ug 2
017

This approach is motivated by a formative study in which weasked four blind participants the needs and challenges of the cur-rent tactile representations. From the study we learned that highcost and small working space size are the major limitations for ac-cessing the technology, which suggests an opportunity for a newtype of interaction with tactile graphics. Based on these findingsand the consideration of different actuation techniques, we explorean electromagnetic actuation as a low-cost and scalable design forenhancing existing tactile graphics with dynamic tactile markers.
To demonstrate this concept, we present FluxMarker, a softwareand hardware prototype that actuates magnetic elements on top of astatic tactile graphic. FluxMarker can move multiple small magnetsto a grid of possible locations by using an array of electromagneticcoils. The coils are fabricated with standard printed circuit board(PCB) manufacturing techniques, which can enable the low-costfabrication (40 USD for a 16x16 grid and 15cm x 15cm dimension,and 500 USD for a 160x160 grid and 150cm x 150cm dimension).With modular design, the size of the display easily scales up with-out significant increase of cost and fabrication complexity, whileallowing independent multiple magnets control.
We evaluated our prototype with six people with visual impair-ments to investigate the plausibility of the application scenariosidentified during our formative work. We found that all partici-pants were able to use the FluxMarker to identify specific featureson the tactile graphics faster than when they did not have a ref-erence point, albeit they wanted to have the markers move alongpaths to guide them between landmarks. They were also interestedin using the markers to create raised lines around specific tactileelements so that they could feel the boundaries and the containedtactile information. Our participants also noted the possibility forthe system to annotate graphics in real-time, which would help un-derstand their data sets, interpret tactile graphics at the same timeas teachers present the same information visually during lectures,and with building in situ ways to navigate. Finally, our participantsconfirmed that the FluxMarker would help people learn to draw, inparticular, young students.
In summary, our contributions are as follows:
• An approach to enhancing the tactile graphics with dynamictactile markers
• A design of low-cost, scalable actuated tangible markers, in-formed by a formative study with four blind people.
• A hardware prototype of the PCB manufactured electromag-netic coils and its technical evaluation.
• A user evaluation study with four blind participants and twolow vision participants, which illustrates the potential bene-fits of dynamic tactile markers in four application scenarios.
2. RELATED WORK
2.1 Interactive Tactile GraphicsAlthough the benefits of tactile graphics are well documented,
there are several limitations. The first limitation of a tactile graphicis its finite capacity to hold information [6]. It is difficult to addinformation, such as captions or annotations, without making a tac-tile graphic overly complicated [40]. Take for example a tactilemap with roads, intersections, and several landmarks. It would notbe feasible to add a tactile label to every map feature. Researchershave been exploring the use of other modalities to augment a tac-tile graphic with additional information. Two of the most promis-ing modalities are sound [5, 26] and haptics [45]. Sound has been
applied to annotate the content of a tactile graphic to give a text-to-speech description based on QR code [5], object recognition [12],or touch input [26]. Haptic-tactile maps [32, 46] can generate forcefeedback based on the user interaction. Compared with traditionaltactile graphics these interactive tactile graphics can improve theefficiency in exploring content and facilitate learning [6, 20]. How-ever, sound and haptics have their own limitations: they limit users’ability to obtain quick overviews of spatial information with twohanded interaction [25] and using the hands as a marking or refer-ence points to compare different parts of the graphic spatially [32].In contrast, our proposed dynamic markers are designed to improvetactile feedback by providing physical guides and affordances di-rectly on a tactile graphic for blind users to explore and compre-hend spatial information.
2.2 Dynamic Tactile GraphicsAnother limitation of a tactile graphic is its static content and the
high cost of production [16]. Although recent work has demon-strated tools to automate the design of tactile graphics [7, 18, 37],once it is created a static tactile graphic cannot be easily modified.A dynamic tactile graphic can enable updating of its content in re-sponse to users’ inputs. HyperBraille [31] is a commercially avail-able refreshable braille display that has one of the largest touch-sensitive pin-matrix display (7200 pins arranged in 60 rows). Re-searchers have demonstrated interactive systems that leverage suchcommercially available refreshable displays to produce a dynamictactile map with geographic annotation [35, 47]. However, the costof a dynamic tactile display like HyperBraille is prohibitive, rang-ing from 2,000 USD for an 18-character display to 50,000 USD fora half page of braille.
Recently, a wide variety of novel actuator technologies has beenproposed, including electromagnetic actuators [44], piezo-electricactuators [9, 43], electroactive polymers [8], hydraulic and pneu-matic actuation [22, 34], and shape memory alloy [41]. How-ever, piezo-electric actuators are still the only technology foundin commercially available devices [34], and the cost of a singlepiezo-powered braille cell is approximately 100 USD, bringing thecost of even a single line refreshable braille display to over 1,000USD [33]. To enable dynamic updating of tactile content, we ex-plore an alternative approach where instead of developing an al-ternative refreshable braille display we augment a tactile graphic.Our hybrid approach allows a blind user to interact with the tactilecontent dynamically, while allowing size and resolution to scalewithout a significant increase in cost and fabrication complexity.
2.3 Tangible InteractionOne emerging form of dynamic tactile graphics are those enabled
by a tabletop tangible user interface. Tabletop tangible user inter-faces were first created to allow users to interact with digital infor-mation by moving or actuating physical objects [15, 27, 28], andthese systems have been applied to many domains, including urbanplanning [42], remote collaboration [11], education [14], and datavisualization [21]. Recently, researchers have investigated ways touse tangible interfaces for assistive applications [25, 36]. For ex-ample, Tangible Graph Builder [25] is specifically designed for vi-sually impaired users to allow them to access graph and chart-baseddata through tangible interface. Tangible Reels [10] helps visuallyimpaired users to construct a tangible map by their own with suckerpads and retractable reels. These devices allow visually impairedpeople to dynamically create tactile maps and retrieve specific in-formation related to points and links. Inspired from these work, weexplore how actuated tangible objects can enhance the explorationand interaction with tactile graphics for visually impaired users.

3. FORMATIVE STUDYWe conducted a formative study with four blind individuals (male:
2, female: 2) to understand their current uses of tactile graphics,challenges they encounter, and opportunities where dynamic tac-tile markers may be helpful for them. The age of the participantsranged from 22 to 28 (Mean=25.75, SD=2.6). All participants werestudents (one undergraduate and three graduate students) in vari-ous fields (biology and neuroscience, astrophysics, and computerscience) at a local university. We chose students as main targetusers because tactile graphics are heavily used in education, par-ticularly in STEM fields. Throughout a 30-minute semi-structuredinterview, we focused on three aspects: (1) current use of tactilegraphics, (2) challenges and limitations in the current use of tac-tile graphics, and (3) opportunities for an alternative approach toenhancing tactile representations. Next we present our findings.
3.1 Current UsesWe first asked the participants when and why they use tactile
graphics. All participants have used tactile graphics for their course-work or research. For example, P2 said that she uses tactile graph-ics to access visual material in the textbooks of her biology andneuroscience classes. She uses a tactile representation of the brainmodel to spatially understand the functionality of each anatomicalregion. A particularly important use scenario is data explorationand analysis. P4 was involved in a space grant project that sends aballoon with instruments to high attitude to collect data. P4 men-tioned that a tactile graphic would be a good medium to representthe data in an accessible way for analysis.
3.2 ChallengesParticipants reported several challenges in using a static tactile
graphic for data analysis and learning resources. First, they foundit difficult to understand changes in data. P4 pointed out that thisdifficulty is due to the lack of dynamicness in tactile representation.In addition, when there is too much information, a graphic can betoo complex to interpret [6, 40]. P2 commented that “P2: Whenyou try to add all the information on a single tactile graphic, thiscan be too complex.”
Participants also reported several limitations in the current formof a dynamic tactile representation. First, the current devices fordisplaying dynamic tactile graphics are very costly. All participantscommented on this cost issue as a hindrance for wider adoption.P2 said that “P2: I don’t have any of these [refreshable brailledisplays]. I want, but the cost of thousands of dollar is just tooexpensive for me.” Second, the size is too small [39]. P1 men-tioned that the small size of these displays makes it difficult to usefor data analysis applications: “P1: braille display can show the40 characters or maybe 80. That’s about it. [...] I know there isan effort to make 4 lines or 5 lines of the braille display, but I’mnot sure how successful they are. These can be very expensive.”P3 mentioned that these [refreshable braille displays] are only de-signed for reading text, not showing data. “P3: It’s too small andcan’t express, for example, weather map, or complicated graph of5000 data point.”
In summary, a static tactile graphic lacks the ability to repre-sent changes and can be overly complex, whereas a dynamic tactilegraphic is costly and too small. Neither is ideal for supporting dataanalysis and interactive information retrieval.
3.3 OpportunitiesThe key opportunity we identified from the formative study is to
consider a hybrid method that combines both static and dynamictactile graphics. P2, who did not own a refreshable display, men-
tioned that “It would be cool if it can dynamically label the partor change the texture, so that it can keep the tactile graphic simplebut as accurate as possible.” In other words, only a part or a fewparts of a graphic need to be dynamic, while the rest of the contentremains static.
Another opportunity worth noting is a common desire to under-stand changes in data analysis. P1 mentioned that “I’m actuallymore talking about the dynamics over time, say, ... how much snowfalls over time, earthquake data, or global warming data, anythingthat are changing over time. I don’t know what any of these looklike in the real world.”
3.4 Design RequirementsOur formative study inspired us to develop FluxMarker, a tech-
nique for controlling a set of dynamic tactile makers to move arounda static tactile graphic to support data exploration and analysis. In-formed by our findings, we identified the following design require-ments for FluxMarker:
1. Support: It needs to support a range of traditional static tac-tile graphics.
2. Dynamic Update: It needs to dynamically update its loca-tion in response to user inputs.
3. Multiple Markers: It needs to be capable of controllingmultiple markers independently.
4. Perceptibility: Its location as well as changes in locationneed to be perceivable by users via hands.
5. Scalability: Its cost needs scale well as the display area in-creases, preferably linearly.
4. DYNAMIC TACTILE MARKERSTo address the limitations of the current tactile graphics, we pro-
pose dynamic tactile markers, a new approach that uses movableself-adjusting physical elements to dynamically render points ofinformation on top of a traditional tactile graphic. The markersare magnets that are manipulated above a bed of electromagneticcoils, whose movements are controlled by software. The magnetic,dynamic tactile markers create real-time and adjustable tactile ref-erence points, which can easily reconfigure the tactile content andenrich the spatial information. While dynamic tactile markers canbe applied more generally in any tangible user interface, we specif-ically explore the design space of augmented tactile graphics forpeople with visual impairments. This section describes the interac-tion design and use scenarios that led us to investigate the design ofa system to render dynamic markers.
4.1 Interaction and Application ScenariosThe main goal of dynamic tactile markers is to provide real-time
tactile affordances on an otherwise static tactile graphic in orderto direct a user’s attention to specific features of the graphic. Thistype of interaction is especially important when users explore spa-tial content. In contrast to the refreshable braille display, the hy-brid approach using the combination of a static tactile diagram anddynamic markers makes the display content persistent without los-ing the user’s spatial memory [39]. This enables users to easilyrecognize the position of the marker by referring the static outlineas a constant reference, while allowing update context-dependentcontents based on the user’s needs, such as a location in a map ordata points of a graph. Here we describe four application scenarioswhere dynamic tactile markers can be useful for people with visualimpairments.

4.1.1 Location Finding and Feature IdentificationTactile maps provide blind people a means to explore geograph-
ical information. For example, a tactile map of a campus will dis-play a layout of buildings and braille labels associated with eachbuilding. However, finding a particular location is often a tedioustask; unlike a sighted person’s ability to scan a map and quicklyidentify a specific location, blind users usually explore the map se-quentially and must orient themselves to the whole graphic beforefinding a specific location. Moreover, although the information isoften labeled with braille, reading braille takes time and is inacces-sible for those who cannot read braille. Audio feedback can helpto orient users to the name or feature of the current location, how-ever, this technique makes it difficult to orient oneself to specificlocations on the page.
Dynamic tactile markers can help to identify a spatial locationquickly. For example, responding to “Where is the nearest coffeeshops?” in a local area map or “Where is the Black Sea?” in a geo-graphical world map, the dynamic tactile markers can move aroundon the tactile map, and the blind user can use their hands to quicklyskim the map to identify the location of the marker (Figure 2). Theycan quickly find the marker position relative to their current loca-tion or an outline of surrounding areas on an existing tactile map.In this way, they do not lose contact with spatial reference points orthe spatial memory they have developed. In addition, respondingto the query, “How can I get to this place?”, other markers can in-stantly draw the tactile path by aligning dots on the map. Once theuser is satisfied by finding the location or route, the dynamic tactilemarkers can be reset, and cleared from the tactile graphic.
Figure 2: FluxMarker’s Location Finding and Feature Identi-fication Application
Similar to location finding, the dynamic tactile marker can beused to locate a specific feature on a tactile map based on a user’squestion. For example, a student with visual impairments is givena brain model to use in her biology class. She can ask “whichregion of the brain has a memory function?”, the dynamic tactilemarker can point out the domain of a hippocampus by positioningthe marker within that region of the organ. This is a similar, but dif-ferent interaction from existing interactive tactile graphics, whichexplains the feature of each region triggered by the user’s pointing,while the dynamic tactile marker can point out the location trig-gered by the user’s question. In another scenario, a student is in alecture, and the professor is presenting a graphical representationof a cell via PowerPoint, and uses a laser pointer to identify the cellnucleus for the sighted students. The student with visual impair-ment, who has a tactile version of the graphic, can ask the dynamictactile marker to move to the corresponding location.
4.1.2 Data Analysis and PhysicalizationData analysis is one of the most challenging tasks for people
with visual impairments. As the visualized data is not accessiblefor blind users, they often find it difficult to interact with the data.Dynamic tactile markers can help blind users make sense of datathrough data physicalization [17].
One advantage of using dynamic tactile markers is the ability toupdate the data for a different context. For example, a blind userwho wants to analyze the temperature of a city over time mightwant to know the pattern throughout the year, maximum tempera-ture, and minimum temperature of the city. Twelve dynamic tactilemarkers can position themselves to display a plot graph to representthe temperature data of each month. By touching the data pointand referring to the scale, which can be given by a static embossedpaper, the user can find the maximum and minimum temperatureof the city. While understanding the pattern of the data can bechallenging with audio representation alone, with dynamic tactilemarkers, she can also comprehend the pattern of the graph by rec-ognizing spatial positions. If she wants to analyze the temperaturedata a different city, she can just ask “render the data point” with thecity name. Then, the dynamic tactile markers can be repositionedto render the requested data point.
4.1.3 Guided Drawing AssistantIn addition to supporting an interpretation of a content or analyz-
ing the data, the dynamic tactile marker can also support studentsto create their own tactile graphic representations. Many studentswith visual impairment have limited exposure to drawing or mak-ing their own representations of information due in part to the lackof educational practices and materials [13]. The dynamic tactilemarker can help blind users to make their own tactile representa-tions by guiding them with reference points of the drawing. Forexample, when a blind user is trying to draw a hexagon, six dy-namic tactile markers would appear, marking the reference pointsof each corner of the shape. The user can touch the markers toposition themselves with the nondominate hand, and guide them todraw the line to the next point (Figure 3). Or, the tactile markers canform a nearly solid edge that the user could mark alongside. Thisguided drawing can be particularly useful when creating their owntactile graphics when used in conjunction with inexpensive physi-cal tactile drawing boards such as the Sensational Art Board 1, theinTact Sketchboard 2 and 3D printing Doodle Pens 3.
Figure 3: FluxMarker’s "Guided Drawing Assistant" Applica-tion.
5. DESIGN CONSIDERATIONSMany different actuation techniques can enable dynamic tactile
markers, but an appropriate design should meet the design require-ments that we identified through our formative study. In order toensure that our design meets these requirements, we evaluated avariety of actuation approaches that have been proposed in differ-ent areas such as tangible user interface, robotics, and accessibil-ity. These actuation methods include mechanical actuators (e.g.,DC motors, servo motors, stepper motors), piezoelectric actuators(e.g., piezo-elastomer, piezo-electric linear motor, ultrasonic mo-tor), electrostatic actuation, magnetic actuation, electromagnetic1http://www.sensationalbooks.com/products.htmlblackboard2http://www.easytactilegraphics.com/3http://the3doodler.com/

actuation, pneumatic and hydraulic actuation, and material-basedactuation (e.g. shape memory alloy). Given the technical consid-erations, we decided to explore electromagnetic coils to actuate apassive magnet as a marker. Three primary considerations rose tothe surface while conducting this evaluation: cost, scalability, fab-rication complexity, and compliance. This section describes thedesign rationale behind our decision.
5.1 CostOne of the most important considerations is the cost of fabri-
cation. Although mechanical actuation such as motors and lin-ear actuators is the straightforward design choice, these parts areexpensive. For example, coordinated self-positioning robots likeZooids system [21] can be used as dynamic tactile markers, butparts and assembly costs 50 USD for each robot so it is costly toincrease the number of markers. In contrast, components that canbe fabricated with existing PCB manufacturing technique are inex-pensive [38], for example, electromagnetic [29, 38] or electrostaticactuation [19]. Piezo-electric actuation such as ultrasonic motorsand piezo-electric linear actuators can be also integrated with PCBboard 4, but the fabrication process requires piezoceramic materi-als and specialized manufacturing process, which increases the costof fabrication. Another low-cost actuation method is pneumatic orhydraulic actuation as the parts are relatively inexpensive.
5.2 Size and ScalabilityAs we found through the formative interviews, display size is
another important consideration. Existing approaches that use oneactuator for each pixel of a dynamic tactile display, including refre-shable braille [2] or raised-pin displays [11, 23, 30], do not scalewell. For example, a 10x10 pin size raised-pin display that uses ei-ther mechanical or piezo-electric linear actuation requires only 100actuators. However, a 100x100 display size requires 10,000 indi-vidually actuated pins. Even with relatively low-cost actuators, costincreases exponentially with display size (e.g., using a 5 USD servomotor, a 100x100 pixel display will cost at least 50,000 USD).
In contrast, PCB manufactured electromagnetic actuation scalesrelatively well because many coils can be aligned on a PCB. For ex-ample, in our design an 8x8 array of coils can be aligned on a 10cmx 10cm PCB, costing only 0.50 USD. While the cost of printed cir-cuit board increasees with the size of the board, the cost increase istrivial, and the cost of transistors to drive a high current for electro-magnetic actuation is also inexpensive compared to mechanical orpiezo-electric components.
5.3 Fabrication ComplexityIn addition to cost and scalability, we value the simplicity of fab-
rication and control mechanism which allows the larger accessibil-ity community to quickly adapt, replicate, and test. As mentionedabove, pneumatic and hydraulic actuation methods are also promis-ing approaches. Researchers have proposed using a fluidic logiccircuit to switch the pressure of pneumatic actuators and controlthe state of each pixel in a refreshable braille display [34]. Thecomplexity of design and fabrication of hydraulic actuation can bealleviated with advanced 3D printing technology [24], but it is stilldifficult to design complex fluidic circuits that can control the mul-tiple pixels individually. In short, the fabrication and control mech-anisms of such pnuematic actuated devices are a challenge.
In contrast, using electromagnetic coils leverages commerciallyavailable PCB manufacturing for fabrication, and a standard circuitdesign for the control mechanism. Thus, we chose to develop an
4http://pcbmotor.com/
electromagnetic actuation technique that meets all the considera-tions we identified previously, while allowing the simple controland fabrication process.
6. SYSTEM DESIGN & IMPLEMENTATIONTo instantiate the concept of the dynamic tactile marker, we present
FluxMarker, a software and hardware system that actuates mag-netic markers with low-cost, scalable electromagnetic coil arrays(Figure 4). The hardware system is comprised of markers, coils,circuits, a controller, and a corresponding GUI. In the followingsection, we describe the specifications of the elements we used toconstruct the system.
Figure 4: Overview of PCB Coil Board
6.1 Hardware
6.1.1 System DesignCoil Design: FluxMarker consists of magnetic passive markers
and arrays of electromagnetic coils. The electromagnetic coil ar-rays can be fabricated with standard PCB manufacturing technique.We use a two-layer printed circuit board and each layer contains aset of micro-coils with horizontal and vertical offsets. Each coil hasan identical rectangular shape and is arranged in the shape of a tile(see Figure 4).
Running current through the circuit coils generates a local mag-netic field within the area of the coil such that each coil can onlyattract a single magnet located within its area. If the PCB had onlyone layer, there would be no way to move the magnet from the cen-ter of one coil to the next because the magnet is located beyond therange of the second coil. Thus, the pattern of coils on the top andbottom layers are offset so that their effective areas overlap. Fig-ure 6 illustrates the movement of the magnet. The microcontrollerswitches a sequence of coils on and off to move the magnet acrossthe coils. As the top layer and bottom layer are offset both horizon-tally and vertically, the magnet travels in a zig-zag path from onecoil (on the top layer) to the next (on the bottom layer) rather thanin a straight line.
The coil arrays are fabricated with standard PCB manufacturingso the size of each array is limited by the capability of the PCB fac-tory. To address this, we designed our electromagnetic coil arraysas a scalable module. Each 16 x 16 magnetic coil array board is amodule of a certain size (e.g., 15cm x 15cm). Modular boards canbe soldered together side to side as tiles, allowing the overall sizeof the coil array to be as large as desired (Figure 5).
Circuit Design: Switching current to each coil turns on and offits magnetic field. The standard approach to switching the current isto use a single MOSFET transistor for each coil, but this increases

Figure 5: Modular and Scalable Design
Figure 6: Diagram of the Dynamic Marker’s Movement Acrossthe Coil Board
the complexity of the circuit design as it requires several of I/O linesto drive each MOSFET transistor. Instead, we use a multiplexingtechnique with a diode array to moreefficiently control and drivemany coils in an array. Consider a 4x4 array of coils where eachcoil is connected to a diode (Figure 7). Similar to a LED matrixdisplay, only one row of coils can be on at any time. By switchingthrough each row quickly (e.g., 10-100ms), a coil at any positioncan be activated. For example, setting only row A as HIGH and theother rows (B, C, and D) as LOW, while setting column 1 and 3 asLOW and the other columns (2 and 4) as HIGH will turn on onlycoils (A, 1) and (A, 3). Next, if we set row B as HIGH and the otherrows (A, C, and D) as LOW, and set column 1 and 4 as LOW andthe other columns (2 and 3) as HIGH, we can turn on (B, 1) and(B, 4). In this way we can control 16 coils using only 8 (4 + 4) I/Opins on the microcontroller. This design decreases the complexityof the circuit and reduces the required number of microcontrollerI/O pins as well as MOSFETs, which cost more than diodes.
Figure 7: Multiplex Coil Matrix
While LEDs can be switched with relatively low current (e.g.,20mA) directly supplied by the microcontroller, the electromag-
netic coil requires higher current (e.g., 0.5-1A). Thus, we use half-bridge MOSFET transistor switches to amplify and control the cur-rent to each coil. The half-bridges are made from a push-pull pairof P-channel and N-channel power MOSFET transistors. One ter-minal from each coil is tied to a P-channel MOSFET transistor, andanother terminal is tied to an N-channel MOSFET transistor. Thegate of both MOSFET transistors are controlled by an I/O line fromthe microcontroller, and the source voltage comes from an external9V power supply.
Controller Design: In this scheme, each half-bridge transistoruses two I/O pins of the microcontroller, so the number of I/Opins on the microcontroller limits the number of available transistorswitches (e.g., the Arduino microcontroller has only 14 digital I/Opins). To further reduce the required number of I/O pins, we usedaisy-chained shift registers. Each shift register switches multipleMOSFET transistors with serial-in/parallel-out data transmission.By using a chain of shift registers any number of transistors arecontrolled using only a few microcontroller pins.
By generating a local magnetic field, each coil attracts a mag-netic marker located in its range. To move the marker from onepoint to another, the program analyzes the shortest path, and thenswitches coils on and off sequentially along this path to move themagnet. As a blind or low vision user interacts with a marker, thesystem keeps the coil charged so that the marker cannot acciden-tally be pushed aside.
Figure 8: GUI Software
6.1.2 ImplementationMarkers: We use N50 neodymium disc magnets (2mm diameter
and 3mm thickness) to act as tactile markers that are dynamicallyactuated by electromagnetic forces. We added a laser-cut squarecap to stabilize the orientation so that the magnets do not flip over.In our prototype, each magnetic marker costs approximately 0.20USD.
Coils: Our current prototype comprises 16x16 grid coils andis 15cm x 15cm in size. Each coil has 22 turns and the size is15.85mm width and height. The width and spacing of each linein the coils is 0.1524mm (0.006 inches), the minimum trace widthand separation of our PCB manufacturer, to maximize the numberof turns in each coil.
Circuits and Microcontrollers: We use an ESP8266 microcon-troller, which switches the current to the coils using 8-bit HC595Nshift registers. Each shift register can drive 8 coils which are switchedusing a half-bridge MOSFET transistor. An N4001 diode attachedto each coil prevents reverse current flow in the diode array. Weuse FQP27P06 and IRF740 for P-channel and N-channel MOS-FETs, respectively. A 9V AC-DC line voltage adapter powers theMOSFETs.
Fabrication Cost: Our prototype costs approximately 40 USD,including the cost of 32 MOSFETs, 128 diodes, 4 shift registers, a

printed circuit board, and a microcontroller. We estimate the cost of160x160 grid coils will be 500 USD for the total parts cost (MOS-FETs: 128 USD, diodes: 147 USD, shift registers: 20 USD, PCB:200 USD, and microcontroller: 15 USD). In the production of ourprototype hardware system, we manually assemble these parts, butthis process can automate with PCB assembly machines.
6.2 SoftwareWe developed software to support the task of specifying the loca-
tions of dynamic tactile markers and controlling their movements.This software consists of a web-based graphical user interface (GUI)and a web server that communicates with the display hardware.Using our GUI, the task of creating a hybrid tactile graphic is asfollows. First, a sighted tactile graphic designer will specify thestatic elements of the graphic by drawing lines and polygons orby importing an existing graphical file. Second, the designer willspecify a spatial configuration of markers (e.g., the locations of cof-fee shops on a local tactile map, or the position of hippocampus inthe human brain model). Third, the designer will specify the in-put commands associated with this particular configuration (e.g.,voice command of “show me the nearest coffee shops” or “whichregion of the brain is the hippocampus?”). Finally, if the designerwants to specify a sequence of such spatial configurations, the sys-tem supports the creation of a step-by-step guide or a drawing aid(Figure 8).
The main functions of the web server component of our softwareare to compute the display logic given a particular marker configu-ration and to communicate this logic to the display hardware. Thecommunication is through a wireless HTTP (HyperText TransferProtocol) connection. On the hardware side, an ESP8266 micro-controller enables wireless communication with a built-in Wifi chipmodule. Each coil in the display matrix has a unique ID. The webserver can send messages to individual coils to turn them on oroff. The display logic specifies the sequence and timing of thesemessages in order to move markers to desired locations and thesoftware tracks the history of each marker position. Once the taskis finished, the system moves the markers to the corner of the dis-play away from the tactile graphic. The microcontroller program iswritten in C++ and the control GUI is written in JavaScript.
7. USER STUDYThe goal of the user study was to use the prototype to assess the
use case scenarios we identified during our formative research andbackground research, and to probe users about other possible ap-plications of the FluxMarker. In particular we observed how thetool supported participants’ ability to find specific locations withina tactile graphic, supported participants ability to relate contentknowledge to elements on a tactile graphic; engaged participantsin drawing tasks; and affected participants perceptions of how in-formation can be communicated with tactile graphics and their in-teractions with assistive technologies.
7.1 ParticipantsSix people with visual impairments participated in the user study
(3 male, 3 female); three participants were also part of the earlierformative study. P1 (male) P2 (male) P3 (female) identified as be-ing totally blind. One female participant identified as being legallyblind with a little bit of light perception (P4). One male (P5) andone female (P6) participant identified as having a visual impair-ment, but had functional vision through the use of assistive tech-nologies. Figure 1 summarizes the characteristics of participantsin terms of frequency of use of tactile graphics, familiarity withscience graphics, familiarity with tactile maps, and braille fluency.
7.2 MethodWe conducted a 45-minute session with each participant. During
each session we presented an overview of the research, introducedthe prototype and described how it worked in conjunction with thegraphics, and then showed the participant two embossed tactilegraphics from the local university’s accessible media lab so thatthey would have basic familiarity with the graphics. The graphicsincluded (A) an embossed tactile map of Eastern Europe and Russiaand (B) an embossed tactile graphic representing a sectional viewof a human brain. At the beginning of the session we provided theparticipants with the context in which these graphics might be usedand provided time for them to explore the graphics. We then askedthe participants to (C) draw a hexagon on a piece of trace paper,in order to observe their familiarity with drawing without any aids.Figure 9 shows examples of user study sessions.
To observe how the participants used the FluxMarker we laid theembossed tactile graphics on top of the display and asked the par-ticipants to read graphics A and B, and perform a series of taskswith the aid of the dynamic markers. When evaluating FluxMarkerwith Graphic A, we asked participants to first find a region on themap without the aid of the marker, and then find a specific pointon the graphic as marked with the FluxMarker. Subsequent to find-ing the marker, we asked participants to identify other geographicfeatures. This allowed us to observe how each participant used themarker as a reference point throughout their search. We performedthe same order of operations with Graphic B, albeit the graphic wasmore detailed and the representation of the brain had less "regions"and more features represented. We asked participants to identifythese features in relation to each other.We also asked participantsto follow a moving marker to draw a hexagon on a piece of trace pa-per. While the participants were performing the task, we answeredany questions that arose. We observed their actions, recorded theircommentary. After these activities we conducted 10-minute semi-structured interview where we asked about their experience withthe FluxMarker in relation to their first and third experience withthe graphics. We also asked for feedback about the prototype andtheir view of its current and future application. To analyze the datawe reviewed the video of the sessions and captured questions andcomments that arose during the testing, and identified themes thatarose from the interview questions.
7.3 Findings & Discussion
7.3.1 ApplicationsIn order to assess the application of FluxMarker we asked par-
ticipants to use the tactile map, tactile graphic, and drawing paperto preform a task with the tool. Each participant performed thosetasks in slightly different ways, and provided unique feedback andnew ideas about the effectiveness of the tool.
Spatial Navigation: When viewing the tactile map, P1 rapidlyscanned the display area with two hands and found the boundariesof the countries represented on the map without guidance; he saidthat he loves geography and is good at geometry. He immediatelystarted looking for the Black Sea, at which point we used the Flux-Marker to help him locate the sea. He found the marker within sec-onds and noticed that it was positioned in the middle of the sea. P1compared his experience with this tool as being similar to workingwith a teacher of the visually impaired (TVI), who might manuallyplace a simple magnet or sticker on the map to mark a location.He suggests that we use the FluxMarker to guide someone to fol-low a path in order to discover a landmark, in this case “the YangtzeRiver” if this map also included China. At the end of the user studyhe said “The best application I could see this being used for is to
Participant P1 P2 P3 P4 P5 P6Gender Male Male Female Female Male Female
Age 22 28 26 36 23 26Visual Impairment Status Blind Blind Blind Blind Low Vision Low Vision
Frequency of Tactile Graphic Medium Medium High Medium None NoneFamiliarity with Science Graphics None Medium Medium Medium None None
Familiarity with Tactile Maps High High Low High Low LowBraille Fluency High High High Medium Low Low
Table 1: Characteristics and Experience of Participants in Our User Study
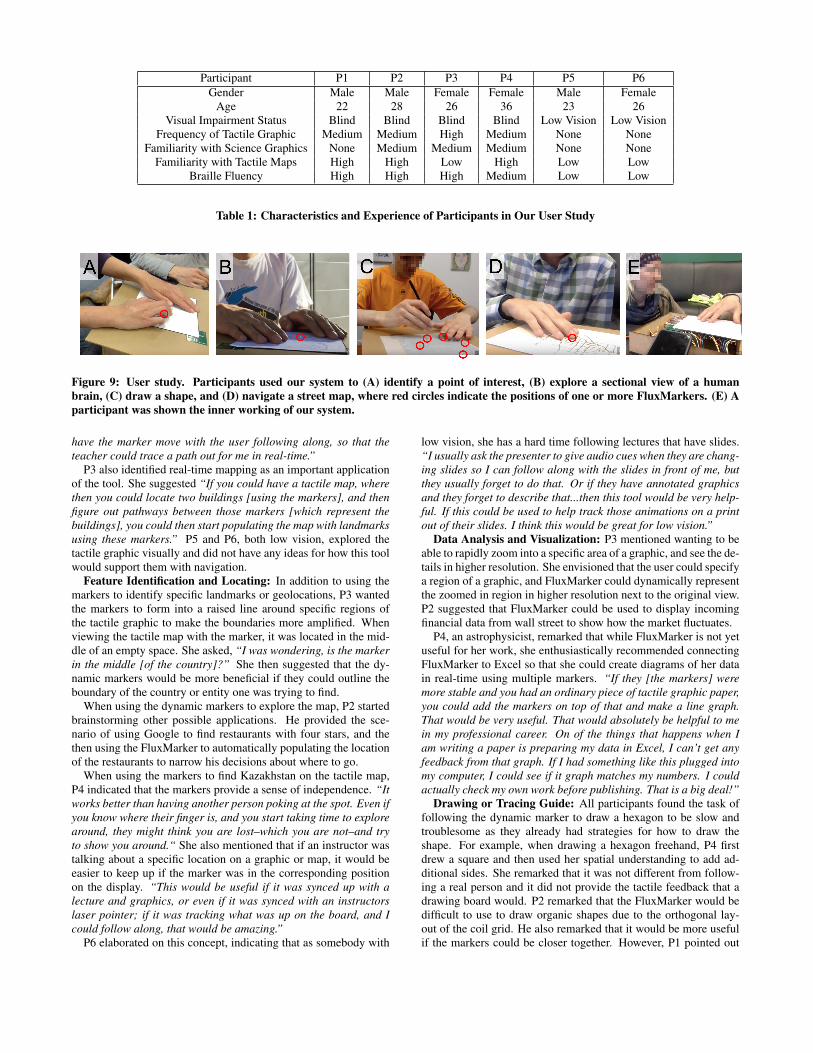
Figure 9: User study. Participants used our system to (A) identify a point of interest, (B) explore a sectional view of a humanbrain, (C) draw a shape, and (D) navigate a street map, where red circles indicate the positions of one or more FluxMarkers. (E) Aparticipant was shown the inner working of our system.
have the marker move with the user following along, so that theteacher could trace a path out for me in real-time.”
P3 also identified real-time mapping as an important applicationof the tool. She suggested “If you could have a tactile map, wherethen you could locate two buildings [using the markers], and thenfigure out pathways between those markers [which represent thebuildings], you could then start populating the map with landmarksusing these markers.” P5 and P6, both low vision, explored thetactile graphic visually and did not have any ideas for how this toolwould support them with navigation.
Feature Identification and Locating: In addition to using themarkers to identify specific landmarks or geolocations, P3 wantedthe markers to form into a raised line around specific regions ofthe tactile graphic to make the boundaries more amplified. Whenviewing the tactile map with the marker, it was located in the mid-dle of an empty space. She asked, “I was wondering, is the markerin the middle [of the country]?” She then suggested that the dy-namic markers would be more beneficial if they could outline theboundary of the country or entity one was trying to find.
When using the dynamic markers to explore the map, P2 startedbrainstorming other possible applications. He provided the sce-nario of using Google to find restaurants with four stars, and thethen using the FluxMarker to automatically populating the locationof the restaurants to narrow his decisions about where to go.
When using the markers to find Kazakhstan on the tactile map,P4 indicated that the markers provide a sense of independence. “Itworks better than having another person poking at the spot. Even ifyou know where their finger is, and you start taking time to explorearound, they might think you are lost–which you are not–and tryto show you around.“ She also mentioned that if an instructor wastalking about a specific location on a graphic or map, it would beeasier to keep up if the marker was in the corresponding positionon the display. “This would be useful if it was synced up with alecture and graphics, or even if it was synced with an instructorslaser pointer; if it was tracking what was up on the board, and Icould follow along, that would be amazing.”
P6 elaborated on this concept, indicating that as somebody with
low vision, she has a hard time following lectures that have slides.“I usually ask the presenter to give audio cues when they are chang-ing slides so I can follow along with the slides in front of me, butthey usually forget to do that. Or if they have annotated graphicsand they forget to describe that...then this tool would be very help-ful. If this could be used to help track those animations on a printout of their slides. I think this would be great for low vision.”
Data Analysis and Visualization: P3 mentioned wanting to beable to rapidly zoom into a specific area of a graphic, and see the de-tails in higher resolution. She envisioned that the user could specifya region of a graphic, and FluxMarker could dynamically representthe zoomed in region in higher resolution next to the original view.P2 suggested that FluxMarker could be used to display incomingfinancial data from wall street to show how the market fluctuates.
P4, an astrophysicist, remarked that while FluxMarker is not yetuseful for her work, she enthusiastically recommended connectingFluxMarker to Excel so that she could create diagrams of her datain real-time using multiple markers. “If they [the markers] weremore stable and you had an ordinary piece of tactile graphic paper,you could add the markers on top of that and make a line graph.That would be very useful. That would absolutely be helpful to mein my professional career. On of the things that happens when Iam writing a paper is preparing my data in Excel, I can’t get anyfeedback from that graph. If I had something like this plugged intomy computer, I could see if it graph matches my numbers. I couldactually check my own work before publishing. That is a big deal!”
Drawing or Tracing Guide: All participants found the task offollowing the dynamic marker to draw a hexagon to be slow andtroublesome as they already had strategies for how to draw theshape. For example, when drawing a hexagon freehand, P4 firstdrew a square and then used her spatial understanding to add ad-ditional sides. She remarked that it was not different from follow-ing a real person and it did not provide the tactile feedback that adrawing board would. P2 remarked that the FluxMarker would bedifficult to use to draw organic shapes due to the orthogonal lay-out of the coil grid. He also remarked that it would be more usefulif the markers could be closer together. However, P1 pointed out

that it could provide a sense of independence for people who wantto practice drawing on their own; P3 thought that the FluxMarkerwould be a good resource for young children learning to draw.
7.3.2 Technical EvaluationThe user study provided us an opportunity to evaluate the techni-
cal characteristics of the FluxMarker. Here we discuss users’ com-ments with respect to support, perceptibility, and scalability:
Support: The design of the physical prototype enabled the userto directly place embossed tactile graphics on the PCB display.During the user study, we found that the markers moved well alongembossed paper graphics, but Swell paper was too thick for thecurrent level of magnetization to maintain contact with the dis-play. Throughout the user study the participants remarked that themarkers felt loose and that they moved too easily when touched;they wanted them to have a stronger magnetic connection to thePCB display. P4 remarked “ If I was taking a test and was in ahurry looking around, and moved the marker, it would slow medown.“ We noted that in some cases this made participants hesi-tant to freely explore the graphics.”
Perceptibility: P4 and P5 explicitly said something about themarkers. P4 noted that the marker stands out in comparison to therest of the page. P5 wanted to make sure that they would not coverany important graphic content. P1, P3, and P4 each remarked onthe heat of the magnets and underlying PCB display. When lookingfor the marker P4 said, “In some ways I think the heat is a goodindicator of where the marker is going to be...because the markeris a very specific spot, but the heat is a region.” The heat she wasreferring to is the result of current flowing through the coil, whichturns out to be a useful side-effect for P4. In contrast, P2 found theheat less favorable and noted that if we increase resolution of themarkers, the heating problem would need to be addressed.
Scalability: All participants were impressed by the low cost ofthe prototype and the prospect of a larger display size. P1 men-tioned that if the resolution were lower (the markers more spreadout), a mechanism would be needed to help users find their start-ing reference point. Without this it would be laborious to find themarker. P3 was satisfied with the current size of the display sinceshe could explore the whole display in a short amount of time.
8. LIMITATIONS & FUTURE WORKOur system, while promising, has several limitations that require
future research. First, our user study is largely based on qual-itative findings, rather than quantitative measures from controlledexperiments. Although the focus of our study was to explore theapplication space with a proof-of-concept prototype, we acknowl-edge the importance of more in-depth and rigorous user study aboutthe various aspects of the system. For example, our system hasa GUI component to enable designers to specify dynamic markerconfigurations, but we have not tested this formally. For the futurework, we will recruit other stakeholders including family members,teachers of visual impairments, and professional tactile transcribersto gain insight into content creation involving dynamic markers.
Second, our system currently does not detect the positions of themarkers. Instead, it assumes the initial positions of the markers areknown and tracks their movements based on users’ commands. Weare interested in developing a closed-loop system which can detectmarkers’ locations by using camera-based tracking or reed switcharrays, and then feed location information back to the system inreal-time. Such system can improve the accuracy and robustness ofmarker movement.
Finally, the current system uses dynamic markers as output ofinformation, but the markers can be also used by users to provide
input. For example, one participant was excited about the poten-tial use scenarios where he can use tactile markers to find nearbyrestaurants, and then he can ask context-aware questions such asopen hours, ratings, or a menu of the restaurant by touching themarker, just like Google Maps. In these scenarios, tactile markersshould be enhanced to respond to real-time information requests.For the future work, we are interested in integrating touch sens-ing or gesture tracking mechanisms into the system to open up anew interaction model for visually impaired users and explore thepossible design space of dynamic tactile markers.
9. ACKNOWLEDGMENTSWe would like to thank the participants for their time and help-
ful feedback. We also would like to thank Shohei Aoki and RonPelrine for their technical advice and feedback. This research wassupported by the NSF CAREER award 1453771 and the NakajimaFoundation.
10. REFERENCES[1] Braille authority of north america,
http://www.brailleauthority.org/tg/.[2] Hyperbraille, http://www.hyperbraille.de.[3] The braille literacy crisis in america, 2009.[4] Blindness statistics, 2015.[5] C. M. Baker, L. R. Milne, J. Scofield, C. L. Bennett, and
R. E. Ladner. Tactile graphics with a voice: using qr codes toaccess text in tactile graphics. In Proceedings of ASSETS,pages 75–82. ACM, 2014.
[6] A. M. Brock, P. Truillet, B. Oriola, D. Picard, andC. Jouffrais. Interactivity improves usability of geographicmaps for visually impaired people. Human–ComputerInteraction, 30(2):156–194, 2015.
[7] C. Brown and A. Hurst. Viztouch: automatically generatedtactile visualizations of coordinate spaces. In Proceedings ofTEI, pages 131–138. ACM, 2012.
[8] P. Chakraborti, H. K. Toprakci, P. Yang, N. Di Spigna,P. Franzon, and T. Ghosh. A compact dielectric elastomertubular actuator for refreshable braille displays. Sensors andActuators A: Physical, 179:151–157, 2012.
[9] H.-C. Cho, B.-S. Kim, J.-J. Park, and J.-B. Song.Development of a braille display using piezoelectric linearmotors. In SICE-ICASE, 2006. International JointConference, pages 1917–1921. IEEE, 2006.
[10] J. Ducasse, M. J. Macé, M. Serrano, and C. Jouffrais.Tangible reels: construction and exploration of tangible mapsby visually impaired users. In Proceedings of CHI, pages2186–2197. ACM, 2016.
[11] S. Follmer, D. Leithinger, A. Olwal, A. Hogge, and H. Ishii.inform: dynamic physical affordances and constraintsthrough shape and object actuation. In Proceedings of UIST,volume 13, pages 417–426, 2013.
[12] G. Fusco and V. S. Morash. The tactile graphics helper:providing audio clarification for tactile graphics usingmachine vision. In Proceedings of ASSETS, pages 97–106.ACM, 2015.
[13] S. Hayhoe. Reducing passive cultural exclusion of peoplewith disabilities, an epistemological approach. 2014.
[14] M. S. Horn, E. T. Solovey, R. J. Crouser, and R. J. Jacob.Comparing the use of tangible and graphical programminglanguages for informal science education. In Proceedings ofCHI, pages 975–984. ACM, 2009.

[15] H. Ishii and B. Ullmer. Tangible bits: towards seamlessinterfaces between people, bits and atoms. In Proceedings ofCHI, pages 234–241. ACM, 1997.
[16] R. D. Jacobson. Navigating maps with little or no sight: Anaudio-tactile approach. Proceedings of Content Visualizationand Intermedia Representations, pages 95–102, 1998.
[17] Y. Jansen, P. Dragicevic, P. Isenberg, J. Alexander,A. Karnik, J. Kildal, S. Subramanian, and K. Hornbæk.Opportunities and challenges for data physicalization. InProceedings of CHI, pages 3227–3236. ACM, 2015.
[18] C. Jayant, M. Renzelmann, D. Wen, S. Krisnandi, R. Ladner,and D. Comden. Automated tactile graphics translation: inthe field. In Proceedings of CHI, pages 75–82. ACM, 2007.
[19] M. E. Karagozler, S. C. Goldstein, and J. R. Reid.Stress-driven mems assembly+ electrostatic forces= 1mmdiameter robot. In Proceedings of IROS, pages 2763–2769.IEEE, 2009.
[20] S. Landau and L. Wells. Merging tactile sensory input andaudio data by means of the talking tactile tablet. InProceedings Eurohaptics, volume 3, 2003.
[21] M. Le Goc, L. H. Kim, A. Parsaei, J.-D. Fekete,P. Dragicevic, and S. Follmer. Zooids: Building blocks forswarm user interfaces. In Proceedings of UIST, pages97–109. ACM, 2016.
[22] J. S. Lee and S. Lucyszyn. A micromachined refreshablebraille cell. journal of microelectromechanical systems,14(4):673–682, 2005.
[23] D. Leithinger and H. Ishii. Relief: a scalable actuated shapedisplay. In Proceedings of TEI, pages 221–222. ACM, 2010.
[24] R. MacCurdy, R. Katzschmann, Y. Kim, and D. Rus.Printable hydraulics: a method for fabricating robots by 3dco-printing solids and liquids. In Proceedings of ICRA, pages3878–3885. IEEE, 2016.
[25] D. McGookin, E. Robertson, and S. Brewster. Clutching atstraws: using tangible interaction to provide non-visualaccess to graphs. In Proceedings of CHI, pages 1715–1724.ACM, 2010.
[26] J. A. Miele, S. Landau, and D. Gilden. Talking tmap:Automated generation of audio-tactile maps usingsmith-kettlewell’s tmap software. British Journal of VisualImpairment, 24(2):93–100, 2006.
[27] G. Pangaro, D. Maynes-Aminzade, and H. Ishii. Theactuated workbench: computer-controlled actuation intabletop tangible interfaces. In Proceedings of UIST, pages181–190. ACM, 2002.
[28] J. Patten and H. Ishii. Mechanical constraints ascomputational constraints in tabletop tangible interfaces. InProceedings of CHI, pages 809–818. ACM, 2007.
[29] R. Pelrine, A. Wong-Foy, B. McCoy, D. Holeman,R. Mahoney, G. Myers, J. Herson, and T. Low.Diamagnetically levitated robots: An approach to massivelyparallel robotic systems with unusual motion properties. InProceedings of ICRA, pages 739–744. IEEE, 2012.
[30] I. Poupyrev, T. Nashida, S. Maruyama, J. Rekimoto, andY. Yamaji. Lumen: interactive visual and shape display forcalm computing. In ACM SIGGRAPH 2004 Emergingtechnologies, page 17. ACM, 2004.
[31] D. Prescher, G. Weber, and M. Spindler. A tactile windowing
system for blind users. In Proceedings of ASSETS, pages91–98. ACM, 2010.
[32] M. Rice, R. D. Jacobson, R. G. Golledge, and D. Jones.Design considerations for haptic and auditory mapinterfaces. Cartography and Geographic InformationScience, 32(4):381–391, 2005.
[33] N. Runyan and D. Blazie. Eap actuators aid the quest forthe’holy braille’of tactile displays. In SPIE Smart Structuresand Materials+ Nondestructive Evaluation and HealthMonitoring, pages 764207–764207. International Society forOptics and Photonics, 2010.
[34] A. Russomanno, R. B. Gillespie, S. O’Modhrain, andM. Burns. The design of pressure-controlled valves for arefreshable tactile display. In World Haptics Conference(WHC), 2015 IEEE, pages 177–182. IEEE, 2015.
[35] B. Schmitz and T. Ertl. Interactively displaying maps on atactile graphics display. In Proceedings 2012 Workshop onSpatial Knowledge Acquisition with Limited InformationDisplays, pages 13–18, 2012.
[36] J. Schneider and T. Strothotte. Constructive exploration ofspatial information by blind users. In Proceedings ofASSETS, pages 188–192. ACM, 2000.
[37] R. Štampach and E. Mulícková. Automated generation oftactile maps. Journal of Maps, 12(sup1):532–540, 2016.
[38] E. Strasnick, J. Yang, K. Tanner, A. Olwal, and S. Follmer.shiftio: Reconfigurable tactile elements for dynamicaffordances and mobile interaction. In Proceedings of CHI.ACM, 2017.
[39] S. Swaminathan, T. Roumen, R. Kovacs, D. Stangl,S. Mueller, and P. Baudisch. Linespace: A sensemakingplatform for the blind. In Proceedings of CHI, pages2175–2185. ACM, 2016.
[40] A. Tatham. The design of tactile maps: theoretical andpractical considerations. Proceedings of internationalcartographic association: mapping the nations, pages157–166, 1991.
[41] P. Taylor, A. Moser, and A. Creed. A sixty-four elementtactile display using shape memory alloy wires. Displays,18(3):163–168, 1998.
[42] J. Underkoffler and H. Ishii. Urp: a luminous-tangibleworkbench for urban planning and design. In Proceedings ofCHI, pages 386–393. ACM, 1999.
[43] T. Völkel, G. Weber, and U. Baumann. Tactile graphicsrevised: the novel brailledis 9000 pin-matrix device withmultitouch input. Computers Helping People with SpecialNeeds, pages 835–842, 2008.
[44] F.-H. Yeh and S.-H. Liang. Mechanism design of the flapperactuator in chinese braille display. Sensors and Actuators A:Physical, 135(2):680–689, 2007.
[45] W. Yu, R. Ramloll, and S. Brewster. Haptic graphs for blindcomputer users. In Haptic human-computer interaction,pages 41–51. Springer, 2001.
[46] L. Zeng and G. Weber. Audio-haptic browser for ageographical information system. Computers Helping Peoplewith Special Needs, pages 466–473, 2010.
[47] L. Zeng and G. Weber. Atmap: annotated tactile maps for thevisually impaired. In Cognitive Behavioural Systems, pages290–298. Springer, 2012.