PDF - arXiv.org e-Print archive · Swimming with ShARCS: Comparison of On-sky Sensitivity With...
13
Swimming with ShARCS: Comparison of On-sky Sensitivity With Model Predictions for ShaneAO on the Lick Observatory 3-meter Telescope Srikar Srinath a , Rosalie McGurk a , Constance Rockosi a , Renate Kupke b , Donald Gavel b , Gerald Cabak b , David Cowley b , Michael Peck b , Christopher Ratliff b , Elinor Gates b , Michael Peck b , Daren Dillon b , Andrew Norton b , Marc Reining b a Department of Astronomy & Astrophysics, University of California, Santa Cruz, CA 95064, USA b U.C. Observatories Laboratory for Adaptive Optics, 1156 High St. Santa Cruz, CA 95064 ABSTRACT The Lick Observatory’s Shane 3-meter telescope has been upgraded with a new infrared instrument (ShARCS - Shane Adaptive optics infraRed Camera and Spectrograph) and dual-deformable mirror adaptive optics (AO) system (ShaneAO). We present first-light measurements of imaging sensitivity in the Ks band. We compare mea- sured results to predicted signal-to-noise ratio and magnitude limits from modeling the emissivity and throughput of ShaneAO and ShARCS. The model was validated by comparing its results to the Keck telescope adaptive optics system model and then by estimating the sky background and limiting magnitudes for IRCAL, the pre- vious infra-red detector on the Shane telescope, and comparing to measured, published results. We predict that the ShaneAO system will measure lower sky backgrounds and achieve 20% higher throughput across the JHK bands despite having more optical surfaces than the current system. It will enable imaging of fainter objects (by 1-2 magnitudes) and will be faster to reach a fiducial signal-to-noise ratio by a factor of 10-13. We highlight the improvements in performance over the previous AO system and its camera, IRCAL. Keywords: Adaptive Optics, sensitivity, on-sky performance, ShARCS, ShaneAO, Lick Observatory, Shane telescope, Mt. Hamilton 1. INTRODUCTION The use of laser guide star (LGS) adaptive optics (AO) for astronomical observations was pioneered at Lick Observatory in the mid-90s 1 on the Shane 3-meter telescope. The previous infrared camera, IRCAL, was installed and characterized in 2000. 2 A major system upgrade, called ShaneAO, has been installed, tested 3 and has seen first light on the Shane telescope. 4 This upgrade comprises: • A new infra-red camera (called ShARCS – Shane Ao infraRed Camera and Spectrograph) based on the Teledyne HAWAII-2RG detector that has higher resolution, higher quantum efficiency and lower noise than the PICNIC array used in IRCAL. 6 The change in detector alone enables longer exposure times before detector limits are reached (where night sky lines are not dominant). • A dual-deformable mirror AO pipeline with a 52-actuator, high-stroke, low-frequency (spatial and temporal) ALPAO DM-52 mirror (the “woofer”) and a 1024-actuator, low-stroke, high-frequency MEMS Boston Micromachines Kilo-DM mirror (the “tweeter”). 5 The Shack-Hartmann wavefront sensor camera has been upgraded to allow use of a 30×30 lenslet array. • A more efficient solid-state laser 7 (replacing the current dye laser) with projected improvements to the launch system geared towards increasing return flux so that the AO system can use more subapertures (not yet installed). Further author information: (Send correspondence to S.S.) S.S.: e-mail: [email protected], telephone: 1 831 459 3068 1 arXiv:1407.8206v1 [astro-ph.IM] 30 Jul 2014
Transcript of PDF - arXiv.org e-Print archive · Swimming with ShARCS: Comparison of On-sky Sensitivity With...
Swimming with ShARCS: Comparison of On-sky SensitivityWith Model Predictions for ShaneAO on the Lick
Observatory 3-meter Telescope
Srikar Srinatha, Rosalie McGurka, Constance Rockosia, Renate Kupkeb, Donald Gavelb,Gerald Cabakb, David Cowleyb, Michael Peckb, Christopher Ratliffb, Elinor Gatesb, Michael
Peckb, Daren Dillonb, Andrew Nortonb, Marc Reiningb
aDepartment of Astronomy & Astrophysics, University of California, Santa Cruz, CA 95064,USA
bU.C. Observatories Laboratory for Adaptive Optics, 1156 High St. Santa Cruz, CA 95064
ABSTRACT
The Lick Observatory’s Shane 3-meter telescope has been upgraded with a new infrared instrument (ShARCS- Shane Adaptive optics infraRed Camera and Spectrograph) and dual-deformable mirror adaptive optics (AO)system (ShaneAO). We present first-light measurements of imaging sensitivity in the Ks band. We compare mea-sured results to predicted signal-to-noise ratio and magnitude limits from modeling the emissivity and throughputof ShaneAO and ShARCS. The model was validated by comparing its results to the Keck telescope adaptiveoptics system model and then by estimating the sky background and limiting magnitudes for IRCAL, the pre-vious infra-red detector on the Shane telescope, and comparing to measured, published results. We predict thatthe ShaneAO system will measure lower sky backgrounds and achieve 20% higher throughput across the JHKbands despite having more optical surfaces than the current system. It will enable imaging of fainter objects (by1-2 magnitudes) and will be faster to reach a fiducial signal-to-noise ratio by a factor of 10-13. We highlight theimprovements in performance over the previous AO system and its camera, IRCAL.
Keywords: Adaptive Optics, sensitivity, on-sky performance, ShARCS, ShaneAO, Lick Observatory, Shanetelescope, Mt. Hamilton
1. INTRODUCTION
The use of laser guide star (LGS) adaptive optics (AO) for astronomical observations was pioneered at LickObservatory in the mid-90s1 on the Shane 3-meter telescope. The previous infrared camera, IRCAL, was installedand characterized in 2000.2 A major system upgrade, called ShaneAO, has been installed, tested3 and has seenfirst light on the Shane telescope.4 This upgrade comprises:
• A new infra-red camera (called ShARCS – Shane Ao infraRed Camera and Spectrograph) based on theTeledyne HAWAII-2RG detector that has higher resolution, higher quantum efficiency and lower noisethan the PICNIC array used in IRCAL.6 The change in detector alone enables longer exposure timesbefore detector limits are reached (where night sky lines are not dominant).
• A dual-deformable mirror AO pipeline with a 52-actuator, high-stroke, low-frequency (spatial and temporal)ALPAO DM-52 mirror (the “woofer”) and a 1024-actuator, low-stroke, high-frequency MEMS BostonMicromachines Kilo-DM mirror (the “tweeter”).5 The Shack-Hartmann wavefront sensor camera has beenupgraded to allow use of a 30×30 lenslet array.
• A more efficient solid-state laser7 (replacing the current dye laser) with projected improvements to thelaunch system geared towards increasing return flux so that the AO system can use more subapertures(not yet installed).
Further author information: (Send correspondence to S.S.)S.S.: e-mail: [email protected], telephone: 1 831 459 3068
1
arX
iv:1
407.
8206
v1 [
astr
o-ph
.IM
] 3
0 Ju
l 201
4
• A new support structure for the AO system and camera designed to reduce flexure and improve long-exposure stability.8 The assembly is also designed to be rotated with precision to allow for long-exposure,long-slit spectroscopy.
The cumulative effect of the upgrades is diffraction-limited imaging and Nyquist-sampled point-spread func-tions in the J , H and K bands6 at nearly double the Strehl ratio of the current system.9 Nyquist-samplingin all bands is particularly desirable to measure and reconstruct the PSF reliably. The PSF varies because ofatmospheric turbulence and the changing gravity vector as the telescope moves – the AO bench is mounted atthe Cassegrain focus.
The new laser with a pulse format designed to couple better to the Sodium atoms in the upper atmosphere isexpected to allow routine use of more subapertures, making better use of the tweeter’s spatial frequency samplingability. Hence, any turbulence will be better measured and corrected because subaperture spacing will be 10cm for a 30×30 lenslet array, which is a much better match to measured conditions at Lick Observatory.10 Inaddition, the telescope will be usable over a greater range of the nightly and seasonal variations in mesosphericSodium levels.
Spectroscopy will also be much improved because of the aforementioned improvements in stability. The abilityto reliably rotate the instrument structure and the slit will allow stable object tracking over a longer course of time.Less object wander enables reliable co-adding to raise signal-to-noise ratio (SNR), better tracking of variabilityin night sky lines and minimizes the impact of hot pixels. The intent of these upgrades was to investigate fainterobjects at the diffraction limit of the telescope in all bands and achieve target SNRs in less time. We present theresult of modeling the emissivity and throughput of ShaneAO and conservatively predict that the new systemwill achieve its targets based on first-light measurements. We start by defining and justifying our choice of skyand telescope model in Section 2. The model is validated by reproducing predicted sensitivity for the NIRC2instrument on the Keck telescope and then by checking whether it can account for observed sky backgroundsand throughput for the earlier IRCAL system on the Shane telescope in Section 3. We present a comparisonof expected photons received as predicted by the model and as measured by observing a spectrophotometricstandard in Section 5.
2. SKY MODEL
In the near infrared (NIR) band (1-2.3 µm), the main source of emission in the night sky is from OH− linesin the mesosphere.11 Beyond 2.3 µm, O2 and H2O lines situated at lower altitudes dominate. However, atthese wavelengths thermal emission from the telescope and optics overwhelms any atmospheric emission.12 Non-thermal emission from the NIR sky varies on timescales of 10-15 minutes by 10% or more making it difficult toestimate a nominal value for the background.
The water column above a site is another variable in the sky spectrum. Weather data from the San Jose, CA,airport weather station for the first half of 2013∗ is plotted in Figure 1. The mean and median precipitable watervapor for that site is ∼11 mm. Lick Observatory is situated on Mt. Hamilton at an altitude of 1284 m. This isa higher and drier site than the airport so assuming a water column value of 10 mm is a reasonable estimate.
For our purposes we chose sky emission and transmission models available on the Gemini Observatory website†
for Cerro Pachon (altitude 2700 m) with an airmass of 1.0, water column of 10 mm and with a spectral resolutionof R ∼ 2000. The spectra are constructed with high-resolution sky transmission data generated by ATRAN13 towhich a 280 K blackbody spectrum for sky emission, OH and O2 lines, and zodiacal light have been added. Theeffects of moonlight (which would be strongest in the J band) have not been accounted for. Water column andairmass make a difference in the K band as seen is Fig 2, where telescope emission dominates so the predictedmagnitude limits for ShaneAO should hold for water columns up to 20 mm or an airmass of 2.0 for a 10 mmwater column.
The telescope mirrors, AO and instrument optics are modeled as a series of gray bodies, each with emissivityε = 1 − τ , where τ is the transmissivity/reflectivity of a surface. Transmission and reflection curves were either
∗available from http://www.suominet.ucar.edu/index.html†at http://www.gemini.edu/?q=node/10787
2
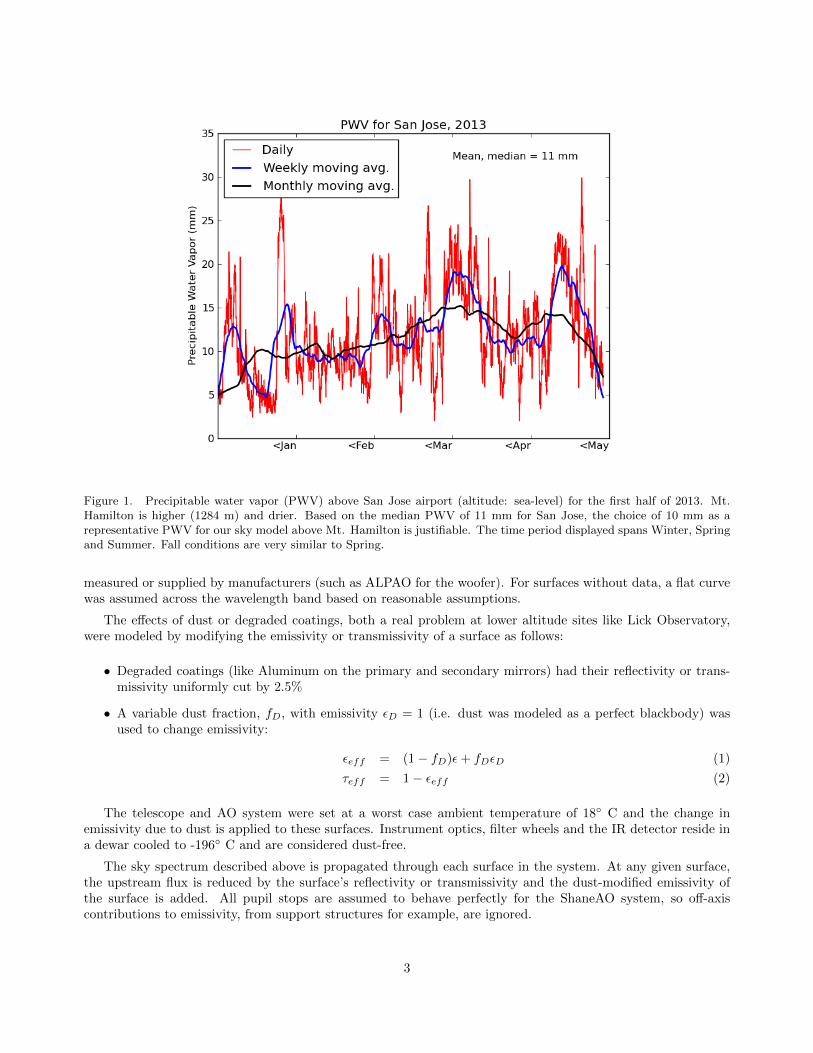
Figure 1. Precipitable water vapor (PWV) above San Jose airport (altitude: sea-level) for the first half of 2013. Mt.Hamilton is higher (1284 m) and drier. Based on the median PWV of 11 mm for San Jose, the choice of 10 mm as arepresentative PWV for our sky model above Mt. Hamilton is justifiable. The time period displayed spans Winter, Springand Summer. Fall conditions are very similar to Spring.
measured or supplied by manufacturers (such as ALPAO for the woofer). For surfaces without data, a flat curvewas assumed across the wavelength band based on reasonable assumptions.
The effects of dust or degraded coatings, both a real problem at lower altitude sites like Lick Observatory,were modeled by modifying the emissivity or transmissivity of a surface as follows:
• Degraded coatings (like Aluminum on the primary and secondary mirrors) had their reflectivity or trans-missivity uniformly cut by 2.5%
• A variable dust fraction, fD, with emissivity εD = 1 (i.e. dust was modeled as a perfect blackbody) wasused to change emissivity:
εeff = (1 − fD)ε+ fDεD (1)
τeff = 1 − εeff (2)
The telescope and AO system were set at a worst case ambient temperature of 18◦ C and the change inemissivity due to dust is applied to these surfaces. Instrument optics, filter wheels and the IR detector reside ina dewar cooled to -196◦ C and are considered dust-free.
The sky spectrum described above is propagated through each surface in the system. At any given surface,the upstream flux is reduced by the surface’s reflectivity or transmissivity and the dust-modified emissivity ofthe surface is added. All pupil stops are assumed to behave perfectly for the ShaneAO system, so off-axiscontributions to emissivity, from support structures for example, are ignored.
3
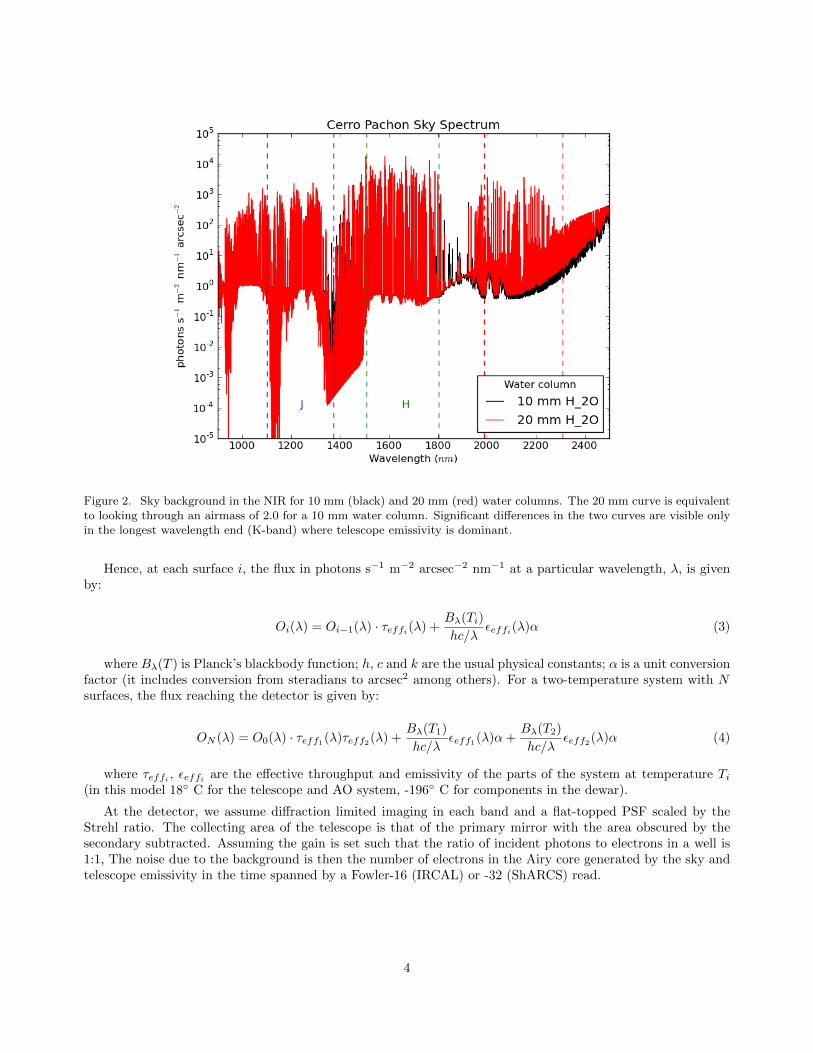
Figure 2. Sky background in the NIR for 10 mm (black) and 20 mm (red) water columns. The 20 mm curve is equivalentto looking through an airmass of 2.0 for a 10 mm water column. Significant differences in the two curves are visible onlyin the longest wavelength end (K-band) where telescope emissivity is dominant.
Hence, at each surface i, the flux in photons s−1 m−2 arcsec−2 nm−1 at a particular wavelength, λ, is givenby:
Oi(λ) = Oi−1(λ) · τeffi(λ) +Bλ(Ti)
hc/λεeffi(λ)α (3)
where Bλ(T ) is Planck’s blackbody function; h, c and k are the usual physical constants; α is a unit conversionfactor (it includes conversion from steradians to arcsec2 among others). For a two-temperature system with Nsurfaces, the flux reaching the detector is given by:
ON (λ) = O0(λ) · τeff1(λ)τeff2(λ) +Bλ(T1)
hc/λεeff1(λ)α+
Bλ(T2)
hc/λεeff2(λ)α (4)
where τeffi , εeffi are the effective throughput and emissivity of the parts of the system at temperature Ti(in this model 18◦ C for the telescope and AO system, -196◦ C for components in the dewar).
At the detector, we assume diffraction limited imaging in each band and a flat-topped PSF scaled by theStrehl ratio. The collecting area of the telescope is that of the primary mirror with the area obscured by thesecondary subtracted. Assuming the gain is set such that the ratio of incident photons to electrons in a well is1:1, The noise due to the background is then the number of electrons in the Airy core generated by the sky andtelescope emissivity in the time spanned by a Fowler-16 (IRCAL) or -32 (ShARCS) read.
4
3. VALIDATION
3.1 Comparison with the Keck model
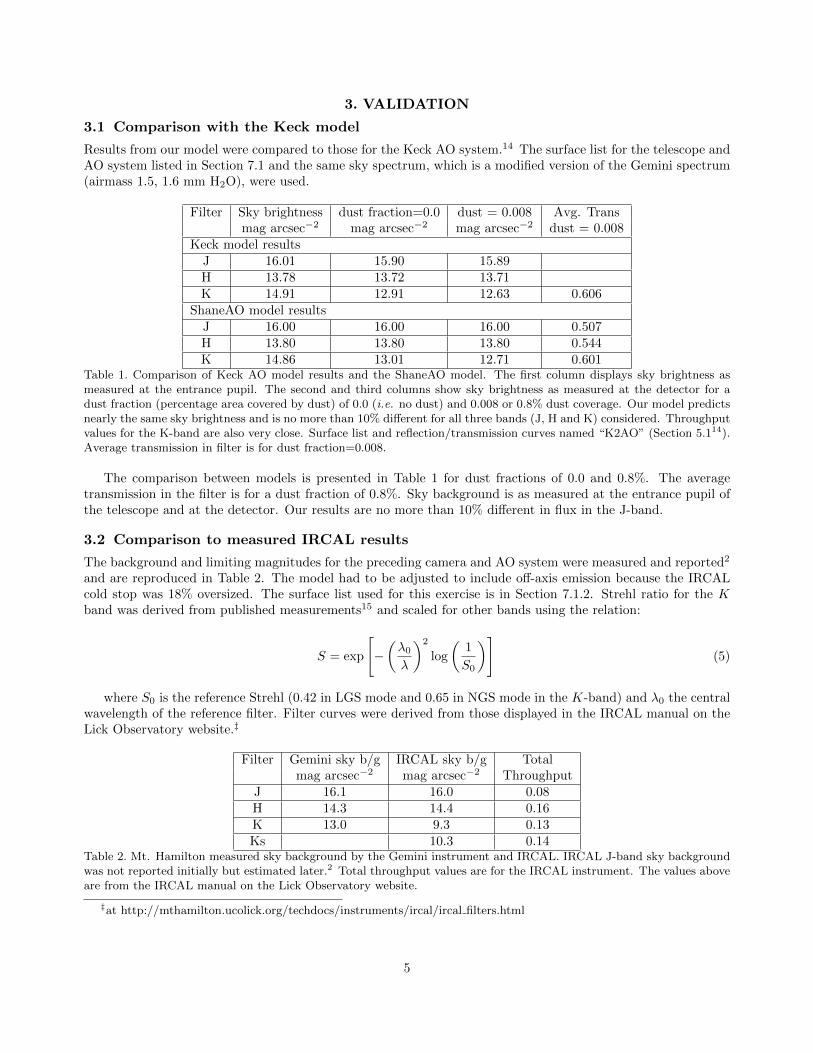
Results from our model were compared to those for the Keck AO system.14 The surface list for the telescope andAO system listed in Section 7.1 and the same sky spectrum, which is a modified version of the Gemini spectrum(airmass 1.5, 1.6 mm H2O), were used.
Filter Sky brightness dust fraction=0.0 dust = 0.008 Avg. Transmag arcsec−2 mag arcsec−2 mag arcsec−2 dust = 0.008
Keck model resultsJ 16.01 15.90 15.89H 13.78 13.72 13.71K 14.91 12.91 12.63 0.606
ShaneAO model resultsJ 16.00 16.00 16.00 0.507H 13.80 13.80 13.80 0.544K 14.86 13.01 12.71 0.601
Table 1. Comparison of Keck AO model results and the ShaneAO model. The first column displays sky brightness asmeasured at the entrance pupil. The second and third columns show sky brightness as measured at the detector for adust fraction (percentage area covered by dust) of 0.0 (i.e. no dust) and 0.008 or 0.8% dust coverage. Our model predictsnearly the same sky brightness and is no more than 10% different for all three bands (J, H and K) considered. Throughputvalues for the K-band are also very close. Surface list and reflection/transmission curves named “K2AO” (Section 5.114).Average transmission in filter is for dust fraction=0.008.
The comparison between models is presented in Table 1 for dust fractions of 0.0 and 0.8%. The averagetransmission in the filter is for a dust fraction of 0.8%. Sky background is as measured at the entrance pupil ofthe telescope and at the detector. Our results are no more than 10% different in flux in the J-band.
3.2 Comparison to measured IRCAL results
The background and limiting magnitudes for the preceding camera and AO system were measured and reported2
and are reproduced in Table 2. The model had to be adjusted to include off-axis emission because the IRCALcold stop was 18% oversized. The surface list used for this exercise is in Section 7.1.2. Strehl ratio for the Kband was derived from published measurements15 and scaled for other bands using the relation:
S = exp
[−(λ0λ
)2
log
(1
S0
)](5)
where S0 is the reference Strehl (0.42 in LGS mode and 0.65 in NGS mode in the K-band) and λ0 the centralwavelength of the reference filter. Filter curves were derived from those displayed in the IRCAL manual on theLick Observatory website.‡
Filter Gemini sky b/g IRCAL sky b/g Totalmag arcsec−2 mag arcsec−2 Throughput
J 16.1 16.0 0.08H 14.3 14.4 0.16K 13.0 9.3 0.13Ks 10.3 0.14
Table 2. Mt. Hamilton measured sky background by the Gemini instrument and IRCAL. IRCAL J-band sky backgroundwas not reported initially but estimated later.2 Total throughput values are for the IRCAL instrument. The values aboveare from the IRCAL manual on the Lick Observatory website.
‡at http://mthamilton.ucolick.org/techdocs/instruments/ircal/ircal filters.html
5
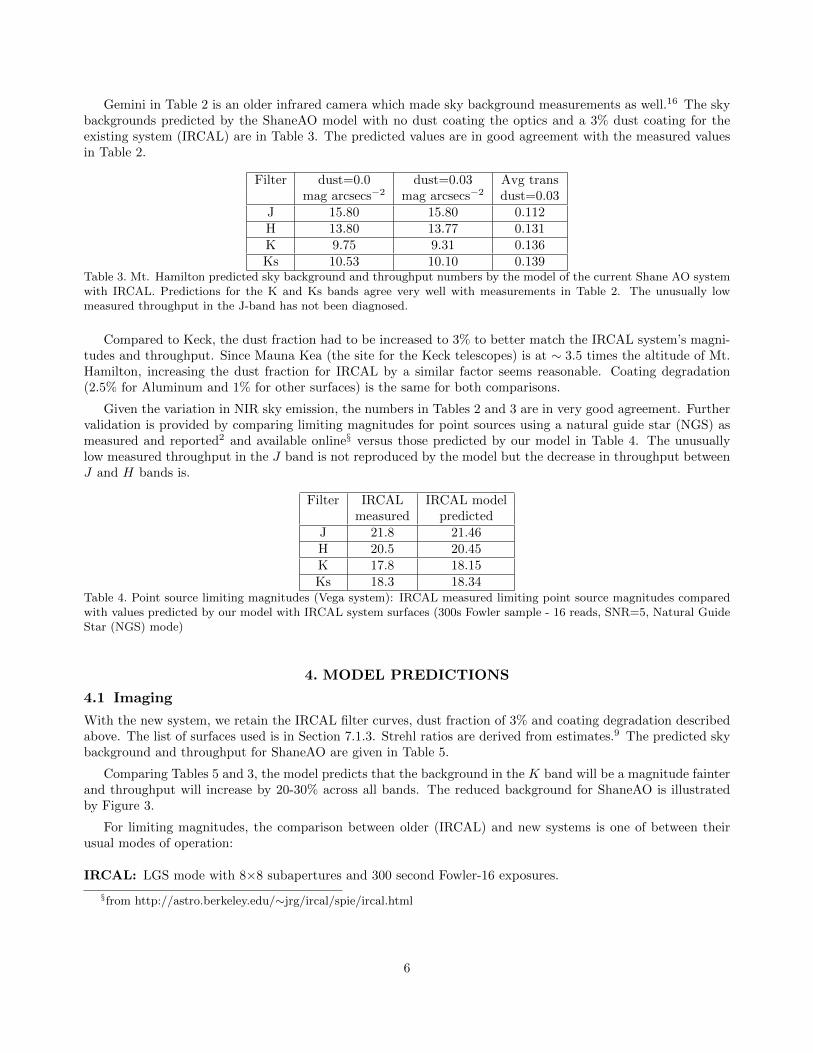
Gemini in Table 2 is an older infrared camera which made sky background measurements as well.16 The skybackgrounds predicted by the ShaneAO model with no dust coating the optics and a 3% dust coating for theexisting system (IRCAL) are in Table 3. The predicted values are in good agreement with the measured valuesin Table 2.
Filter dust=0.0 dust=0.03 Avg transmag arcsecs−2 mag arcsecs−2 dust=0.03
J 15.80 15.80 0.112H 13.80 13.77 0.131K 9.75 9.31 0.136Ks 10.53 10.10 0.139
Table 3. Mt. Hamilton predicted sky background and throughput numbers by the model of the current Shane AO systemwith IRCAL. Predictions for the K and Ks bands agree very well with measurements in Table 2. The unusually lowmeasured throughput in the J-band has not been diagnosed.
Compared to Keck, the dust fraction had to be increased to 3% to better match the IRCAL system’s magni-tudes and throughput. Since Mauna Kea (the site for the Keck telescopes) is at ∼ 3.5 times the altitude of Mt.Hamilton, increasing the dust fraction for IRCAL by a similar factor seems reasonable. Coating degradation(2.5% for Aluminum and 1% for other surfaces) is the same for both comparisons.
Given the variation in NIR sky emission, the numbers in Tables 2 and 3 are in very good agreement. Furthervalidation is provided by comparing limiting magnitudes for point sources using a natural guide star (NGS) asmeasured and reported2 and available online§ versus those predicted by our model in Table 4. The unusuallylow measured throughput in the J band is not reproduced by the model but the decrease in throughput betweenJ and H bands is.
Filter IRCAL IRCAL modelmeasured predicted
J 21.8 21.46H 20.5 20.45K 17.8 18.15Ks 18.3 18.34
Table 4. Point source limiting magnitudes (Vega system): IRCAL measured limiting point source magnitudes comparedwith values predicted by our model with IRCAL system surfaces (300s Fowler sample - 16 reads, SNR=5, Natural GuideStar (NGS) mode)
4. MODEL PREDICTIONS
4.1 Imaging
With the new system, we retain the IRCAL filter curves, dust fraction of 3% and coating degradation describedabove. The list of surfaces used is in Section 7.1.3. Strehl ratios are derived from estimates.9 The predicted skybackground and throughput for ShaneAO are given in Table 5.
Comparing Tables 5 and 3, the model predicts that the background in the K band will be a magnitude fainterand throughput will increase by 20-30% across all bands. The reduced background for ShaneAO is illustratedby Figure 3.
For limiting magnitudes, the comparison between older (IRCAL) and new systems is one of between theirusual modes of operation:
IRCAL: LGS mode with 8×8 subapertures and 300 second Fowler-16 exposures.
§from http://astro.berkeley.edu/∼jrg/ircal/spie/ircal.html
6
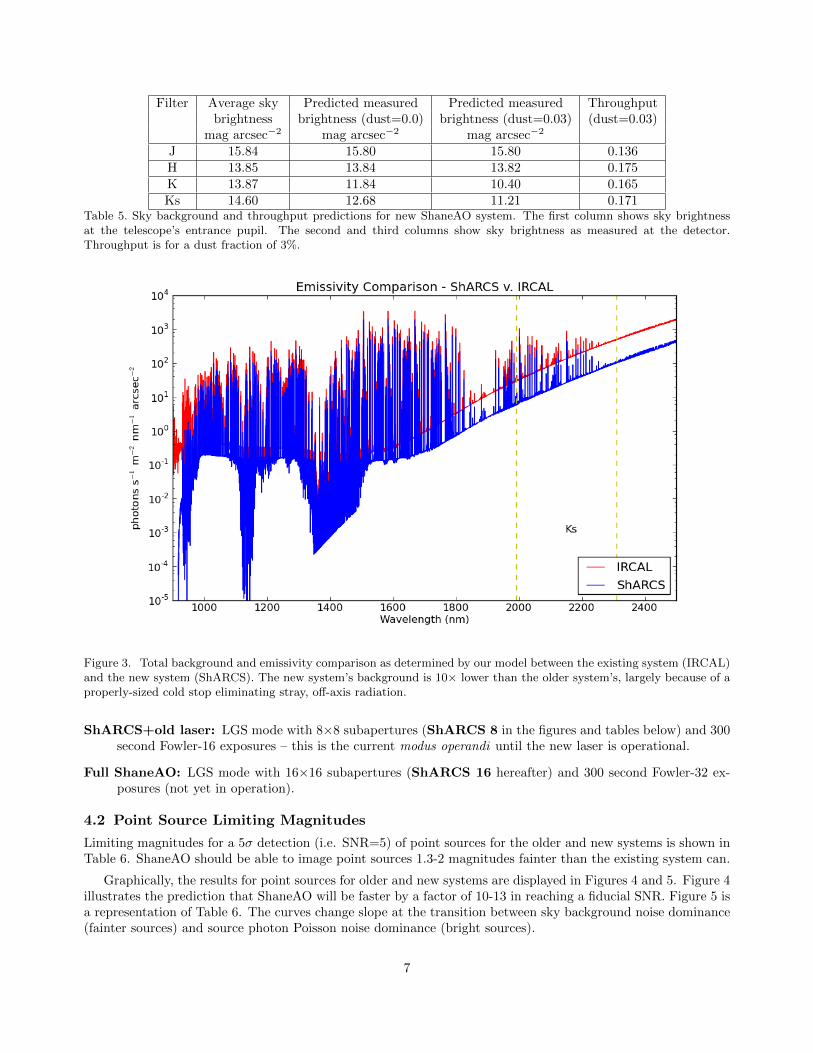
Filter Average sky Predicted measured Predicted measured Throughputbrightness brightness (dust=0.0) brightness (dust=0.03) (dust=0.03)
mag arcsec−2 mag arcsec−2 mag arcsec−2
J 15.84 15.80 15.80 0.136H 13.85 13.84 13.82 0.175K 13.87 11.84 10.40 0.165Ks 14.60 12.68 11.21 0.171
Table 5. Sky background and throughput predictions for new ShaneAO system. The first column shows sky brightnessat the telescope’s entrance pupil. The second and third columns show sky brightness as measured at the detector.Throughput is for a dust fraction of 3%.
Figure 3. Total background and emissivity comparison as determined by our model between the existing system (IRCAL)and the new system (ShARCS). The new system’s background is 10× lower than the older system’s, largely because of aproperly-sized cold stop eliminating stray, off-axis radiation.
ShARCS+old laser: LGS mode with 8×8 subapertures (ShARCS 8 in the figures and tables below) and 300second Fowler-16 exposures – this is the current modus operandi until the new laser is operational.
Full ShaneAO: LGS mode with 16×16 subapertures (ShARCS 16 hereafter) and 300 second Fowler-32 ex-posures (not yet in operation).
4.2 Point Source Limiting Magnitudes
Limiting magnitudes for a 5σ detection (i.e. SNR=5) of point sources for the older and new systems is shown inTable 6. ShaneAO should be able to image point sources 1.3-2 magnitudes fainter than the existing system can.
Graphically, the results for point sources for older and new systems are displayed in Figures 4 and 5. Figure 4illustrates the prediction that ShaneAO will be faster by a factor of 10-13 in reaching a fiducial SNR. Figure 5 isa representation of Table 6. The curves change slope at the transition between sky background noise dominance(fainter sources) and source photon Poisson noise dominance (bright sources).
7

Filter IRCAL ShARCS 8 ShARCS 16predicted predicted predicted
K strehl 0.42 (LGS) 0.6 (LGS) 0.8 (LGS)J 19.97 21.30 22.28H 19.62 20.48 21.03K 17.67 18.71 19.02Ks 17.84 18.92 19.24
Table 6. Point source limiting magnitudes (Vega system) in LGS mode: IRCAL predicted (300s Fowler sample - 16 reads)and ShARCS (8 or 16 subapertures) predicted (300s Fowler sample - 32 reads). Higher predicted magnitude numbersfor ShARCS means greater sensitivity. The values in column 2 for IRCAL differ from those in Table 4 because these arelimiting magnitudes for LGS mode versus NGS mode in the earlier table.
Figure 4. Point sources - Exposure time required to reach SNR=5 vs. magnitude (Vega system) in different filters forIRCAL, ShARCS 8 (ShARCS + old laser) and full ShaneAO (ShARCS 16). ShARCS is faster by 10 (ShARCS8) - 13×(SHARCS16) to reach a fiducial SNR of 5σ.
5. FIRST LIGHT
A spectrophotometric standard star, BD+26 2606, chosen from the Hubble Space Telescope’s (HST) calibra-tion database system¶ was imaged in the Ks band and reduced in one of the earliest commissioning runs forShaneAO/ShARCS. The star’s published spectrum (as measured by HST at the top of the atmosphere) waspropagated through the ShaneAO sky and system model and the expected number of photons at the detectorwas compared with measurements.
Ambient conditions such as a system temperature of 10◦ C and a Shack-Hartmann subaperture configurationof 16 × 16 were fed into the model, whereas indeterminate parameters such as coating degradation were held atnominal model values described earlier. System gain has been measured to be 2.25 electrons per Analog/DigitalUnit (ADU)4 and we assume an incident photon-electron ratio of 1:1 in the detector. Model-reported photon
¶http://www.stsci.edu/hst/observatory/crds/calspec.html
8
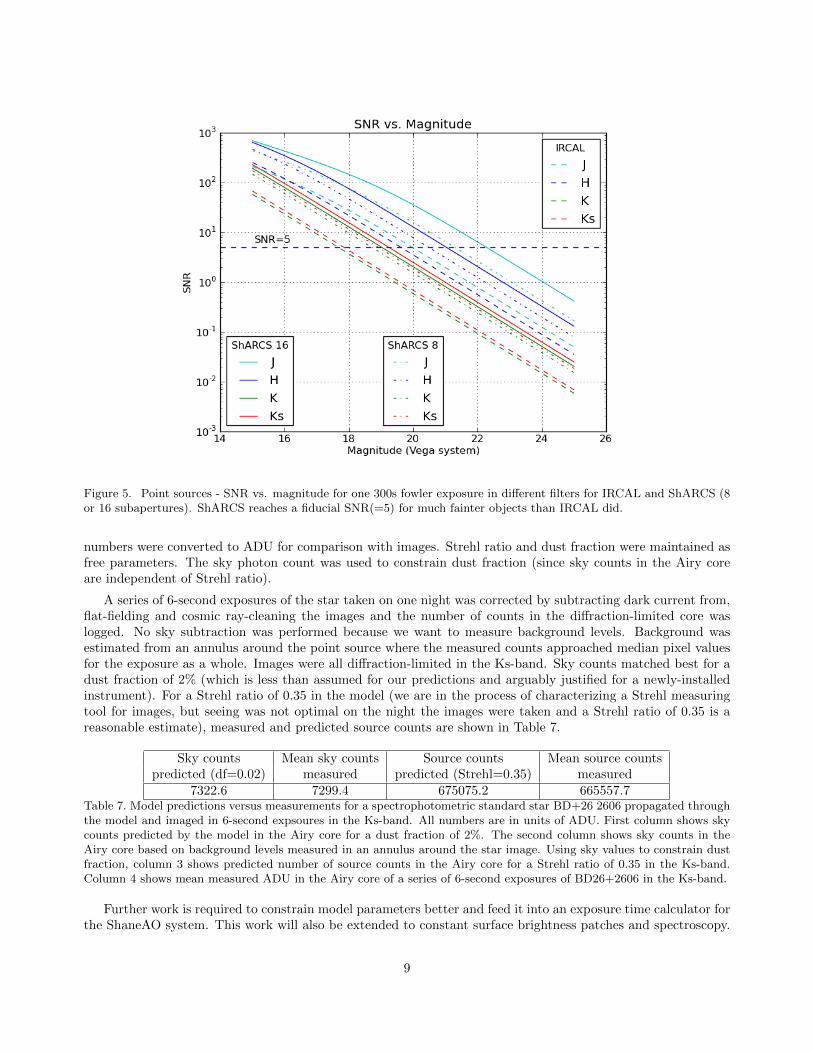
Figure 5. Point sources - SNR vs. magnitude for one 300s fowler exposure in different filters for IRCAL and ShARCS (8or 16 subapertures). ShARCS reaches a fiducial SNR(=5) for much fainter objects than IRCAL did.
numbers were converted to ADU for comparison with images. Strehl ratio and dust fraction were maintained asfree parameters. The sky photon count was used to constrain dust fraction (since sky counts in the Airy coreare independent of Strehl ratio).
A series of 6-second exposures of the star taken on one night was corrected by subtracting dark current from,flat-fielding and cosmic ray-cleaning the images and the number of counts in the diffraction-limited core waslogged. No sky subtraction was performed because we want to measure background levels. Background wasestimated from an annulus around the point source where the measured counts approached median pixel valuesfor the exposure as a whole. Images were all diffraction-limited in the Ks-band. Sky counts matched best for adust fraction of 2% (which is less than assumed for our predictions and arguably justified for a newly-installedinstrument). For a Strehl ratio of 0.35 in the model (we are in the process of characterizing a Strehl measuringtool for images, but seeing was not optimal on the night the images were taken and a Strehl ratio of 0.35 is areasonable estimate), measured and predicted source counts are shown in Table 7.
Sky counts Mean sky counts Source counts Mean source countspredicted (df=0.02) measured predicted (Strehl=0.35) measured
7322.6 7299.4 675075.2 665557.7Table 7. Model predictions versus measurements for a spectrophotometric standard star BD+26 2606 propagated throughthe model and imaged in 6-second expsoures in the Ks-band. All numbers are in units of ADU. First column shows skycounts predicted by the model in the Airy core for a dust fraction of 2%. The second column shows sky counts in theAiry core based on background levels measured in an annulus around the star image. Using sky values to constrain dustfraction, column 3 shows predicted number of source counts in the Airy core for a Strehl ratio of 0.35 in the Ks-band.Column 4 shows mean measured ADU in the Airy core of a series of 6-second exposures of BD26+2606 in the Ks-band.
Further work is required to constrain model parameters better and feed it into an exposure time calculator forthe ShaneAO system. This work will also be extended to constant surface brightness patches and spectroscopy.
9
Model predictions exist for both types of objects and data is being collected to check those predictions as well.
6. CONCLUSION AND FUTURE WORK
We have modeled the emissivity and throughput of the new AO system and IR camera installed on the Shane3-meter telescope at Lick Observatory. The model’s predictions fare well when compared with those of the KeckAO system model and the measured background and magnitude limits of the previous AO system and IRCALdetector on the Shane telescope. We conservatively predict that the new system will be able to study fainterobjects and reach target SNRs 10-13 times faster than the current system. Analysis of first light images of aspectrophotometric standard star from the new detector show that we are receiving the expected number ofphotons predicted by the model. Future work will validate model predictions for constant surface brightnesspatches and for spectroscopy. The model’s predictions are predicated on worst-case summertime temperatures,dusty optics (3% dust fraction) and degraded coatings. On a night with median temperature and seeing, ifthe optics are kept clean and the primary mirror is re-coated (late 2014), we expect the telescope to performbetter than predicted. In addition, we have not yet factored in the longer exposures that should be possible withthe stability and tracking improvements afforded by the new instrument assembly. We are confident that theShaneAO system in conjunction with ShARCS will enable the 3-meter telescope to continue to operate at thefrontier of Astronomy as it has done for more than 50 years.
ACKNOWLEDGMENTS
The authors wish to thank Dick Joyce at NOAO for pointers about the near-IR sky, Dr. James Graham of U.C.Berkeley for information about IRCAL.
ShaneAO is made possible through an National Science Foundation Major Research Instrumentation grant,#0923585.
REFERENCES
1. Max, C. E., Olivier, S. S., Friedman, H. W., An, J., Avicola, K., Beeman, B. V., Bissinger, H. D., Brase,J. M., Erbert, G. V., Gavel, D. T., Kanz, K., Liu, M. C., Macintosh, B., Neeb, K. P., Patience, J.,and Waltjen, K. E., “Image improvement from a sodium-layer laser guide star adaptive optics system,”Science 277(5332), 1649–1652 (1997).
2. Lloyd, J. P., Liu, M. C., Macintosh, B. A., Severson, S. A., Deich, W. T. S., and Graham, J. R., “Ircal: Theinfrared camera for adaptive optics at lick observatory,” in [Optical and IR Telescope Instrumentation andDetectors 814 ], Proc. SPIE 4008 (2000).
3. Gavel, D., Kupke, R., Dillon, D., Norton, A. P., Ratliff, C. T., Cabak, G., Phillips, A., Rockosi, C.,McGurk, R. C., Srinath, S., Peck, M., Saylor, M., Ward, J., Deich, W. T. S., and Lanclos, K., “Shaneao:wide science spectrum adaptive optics system for the lick observatory,” in [SPIE Astronomical Telescopes+ Instrumentation ], Proc. SPIE 9148(76) (2014).
4. McGurk, R. C., Rockosi, C., Gavel, D., Kupke, R., Peck, M., Pfister, T., Ward, J., Deich, W., Gates, J.,Gates, E. L., Alcott, B., Cowley, D., Dillon, D., Lanclos, K., Sandford, D., Saylor, M., Srinath, S., Weiss,J. L., and Norton, A. P., “Commissioning sharcs: the shane adaptive optics infrared camera-spectrographfor the lick observatory shane 3-m telescope,” in [SPIE Astronomical Telescopes + Instrumentation ], Proc.SPIE 9148(118) (2014).
5. Norton, A., Gavel, D., Kupke, R., Reinig, M., Srinath, S., and Dillon, D., “Performance assessment ofa candidate architecture for real-time woofer-tweeter controllers: simulation and experimental results,” in[MEMS Adaptive Optics VII ], Olivier, S. S., Bifano, T. G., and Kubby, J., eds., Proc. SPIE 8617(86170A)(2013).
6. Kupke, R., Gavel, D., Roskosi, C., Cabak, G., Cowley, D., Dillon, D., Gates, E. L., McGurk, R., Norton,A., Peck, M., Ratliff, C., and Reinig, M., “Shaneao: an enhanced adaptive optics and ir imaging system forthe lick observatory 3-meter telescope,” in [Adaptive Optics Systems III ], Ellerbroek, B. L., Marchetti, E.,and Veran, J.-P., eds., Proc. SPIE 8447(84473G) (2012).
10
7. Dawson, J. W., Drobshoff, A. D., Beach, R. J., Messerly, M. J., Payne, S. A., Brown, A., Pennington, D. M.,Bamford, D. J., Sharpe, S. J., and Cook, D. J., “Multi-watt 589nm fiber laser source,” in [Fiber Lasers III:Technology, Systems, and Applications ], Proc. SPIE 6102(61021F) (2006).
8. Ratliff, C. T., Cabak, G., Gavel, D., Kupke, R., Dillon, D., Gates, E., Deich, W., Ward, J., Cowley, D.,Pfister, T., and Saylor, M., “Opto-mechanical design of shaneao: the adaptive optics system for the 3-metershane telescope,” in [SPIE Astronomical Telescopes + Instrumentation ], Proc. SPIE 9148(119) (2014).
9. Gavel, D., “Development of an enhanced adaptive optics system for the lick observatory shane 3-metertelescope,” in [MEMS Adaptive Optics V ], Olivier, S. S., Bifano, T. G., and Kubby, J. A., eds., Proc. SPIE7931(793103) (2011).
10. Gavel, D. T., Gates, E. L., Max, C. E., Olivier, S. S., Bauman, B. J., Pennington, D. M., Macintosh, B. A.,Patience, J., Brown, C. G., Danforth, P. M., Hurd, R. L., Severson, S. A., and Lloyd, J. P., “Recent scienceand engineering results with the laser guidestar adaptive optic system at lick observatory,” in [AdaptiveOptical System Technologies II ], Proc. SPIE 4839(354) (2003).
11. Meinel, A. B., “Oh emission bands in the spectrum of the night sky i,” Ap. J. 111, 555–564 (1950).
12. Ramsay, S. K., Mountain, C. M., and Geballe, T. R., “Non-thermal emission in the atmosphere abovemauna kea,” MNRAS 259(4), 751–760 (1992).
13. Lord, S. D., “A new software tool for computing earth’s atmospheric transmission of near- and far-infraredradiation,” NASA Technical Memorandum (103957) (1992).
14. Bouchez, A., “Keck next generation adaptive optics background and transmission budgets,” KAON (501)(2007).
15. Olivier, S. S., Gavel, D. T., Friedman, H. W., Max, C. E., An, J. R., Avicola, K., Bauman, B. J., Brase,J. M., Campbell, E. W., Carrano, C. J., Cooke, J. B., Freeze, G. J., Gates, E. L., Kanz, V. K., Kuklo,T. C., Macintosh, B. A., Newman, M. J., Pierce, E. L., Waltjen, K. E., and Watson, J. A., “Improvedperformance of the laser guide star adaptive optics system at lick observatory,” in [Adaptive Optics Systemsand Technology, 2 ], Tyson, R. K. and Fugate, R. Q., eds., Proc. SPIE 3762 (1999).
16. McLean, I. S., Macintosh, B. A., Liu, W. T., Casement, S., Figer, D. F., Lacayanga, F., Larson, S. B.,Teplitz, H. I., Silverstone, M. D., and Becklin, E. E., “Performance and results with a double-beam infraredcamera,” in [Instrumentation in Astronomy VIII ], Crawford, D. L. and Craine, E. R., eds., Proc. SPIE2198(457) (1994).
7. APPENDICES
7.1 Surface lists
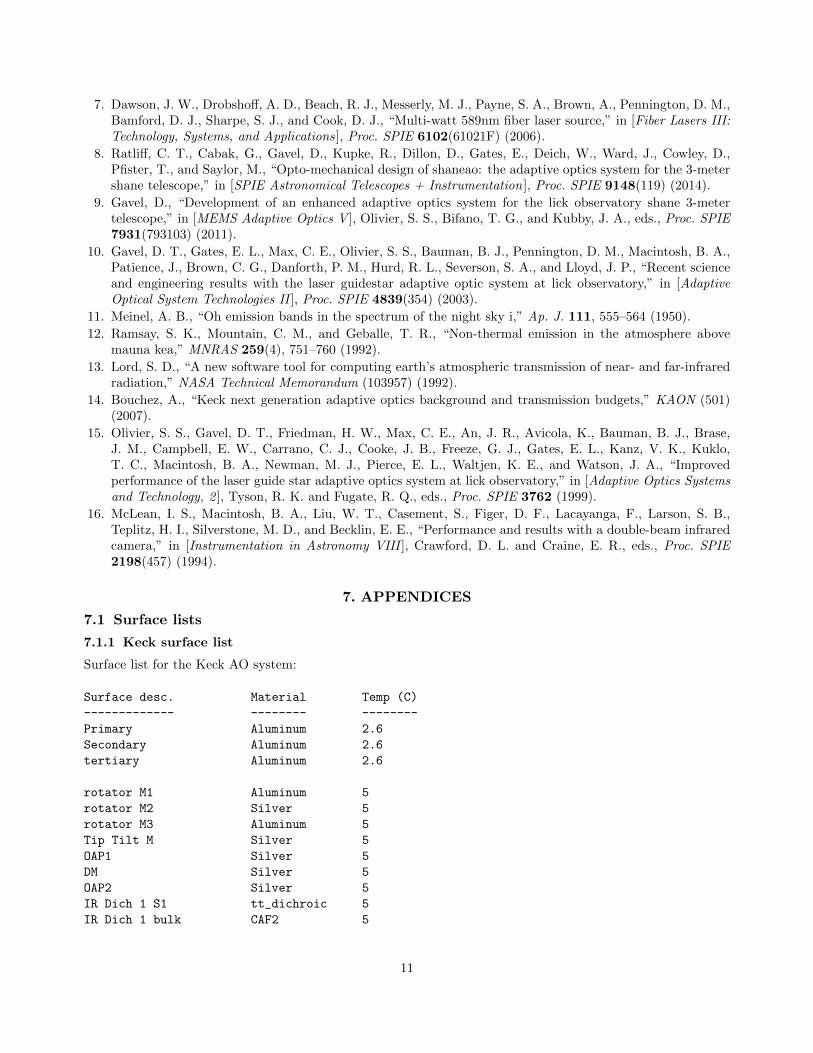
7.1.1 Keck surface list
Surface list for the Keck AO system:
Surface desc. Material Temp (C)
------------- -------- --------
Primary Aluminum 2.6
Secondary Aluminum 2.6
tertiary Aluminum 2.6
rotator M1 Aluminum 5
rotator M2 Silver 5
rotator M3 Aluminum 5
Tip Tilt M Silver 5
OAP1 Silver 5
DM Silver 5
OAP2 Silver 5
IR Dich 1 S1 tt_dichroic 5
IR Dich 1 bulk CAF2 5
11

IR Dich 1 S2 NIR_AR 5
Instr Window S1 NIR_AR 5
Instr Window Bulk CAF2 5
7.1.2 Earlier Shane/IRCAL surface list
Surface list for the existing Shane AO system with the IRCAL camera. Surfaces after the dashed line are withinthe dewar that contains the IRCAL camera, filter wheels etc.:
Surface desc. Material Temp (C)
------------- -------- --------
Primary Aluminum 10
Secondary Aluminum 10
1st Turning Mirror Measured 10
Tip/Tilt Mirror Measured 10
OAP 1 Measured 10
DM Measured 10
OAP 2 Measured 10
NaDichroicSciencePath NaR_splitter 10
IR Mirror 1 Silver 10
IR Mirror 2 Silver 10
IRCAL window Silver 10
--------------------------------------------
Window Silver -196
Turn Mirror Silver -196
OAP1 Silver -196
Filter Silver -196
Cold Stop Cold Stop -196
OAP2 Silver -196
Turn Mirror Silver -196
PICNIC PICNIC_QE -196
7.1.3 ShaneAO surface list
Surface list for the new ShaneAO system. Surfaces after the dashed line are within the dewar that contains theShARCS camera, filter wheels etc.:
Surface desc. Material Temp (C)
------------- -------- --------
Primary Aluminum 10
Secondary Aluminum 10
Fold Mirror 1 Lick coating 10
OAP 1 Lick coating 10
DM1 Prot. Silver 10
OAP 2 Lick coating 10
[TT dichroic TT Dichroic 10 or (LGS)
Fold Mirror 2 Lick coating 10] (NGS
OAP 3 Lick coating 10
MEMs window MEMs_Window 10
MEMs window MEMs_Window 10
MEMs DM Bare Gold 10
MEMs window MEMs_Window 10
12
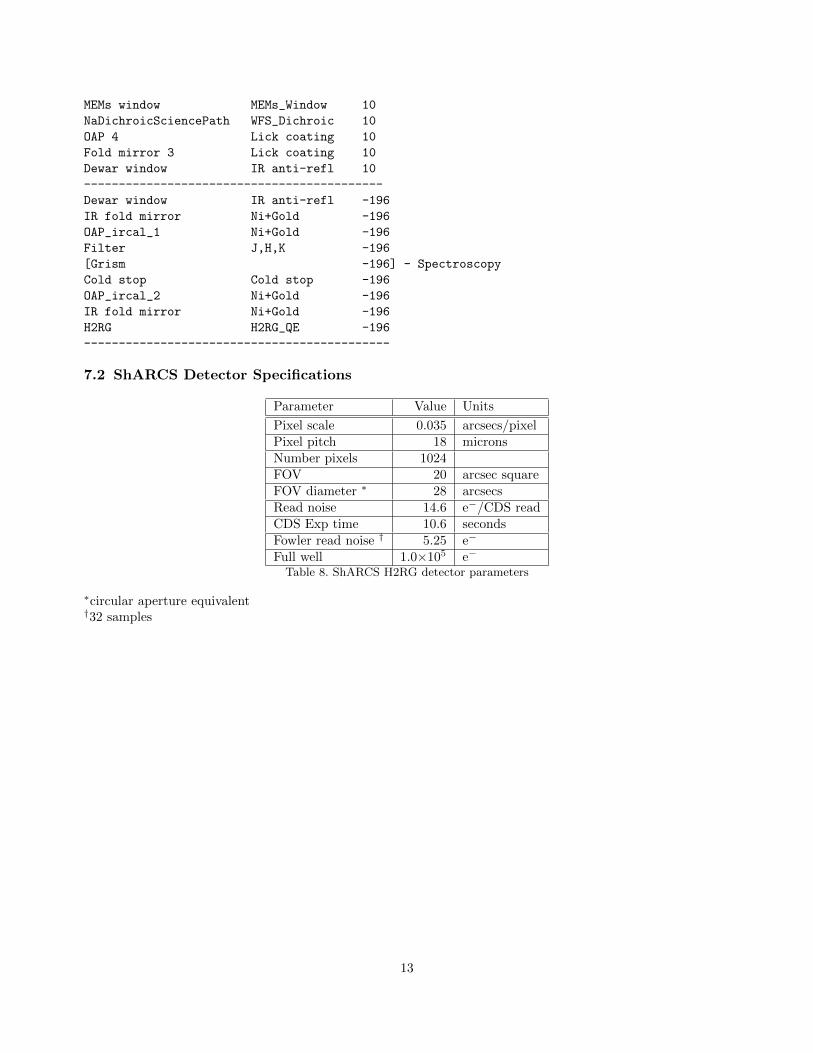
MEMs window MEMs_Window 10
NaDichroicSciencePath WFS_Dichroic 10
OAP 4 Lick coating 10
Fold mirror 3 Lick coating 10
Dewar window IR anti-refl 10
-------------------------------------------
Dewar window IR anti-refl -196
IR fold mirror Ni+Gold -196
OAP_ircal_1 Ni+Gold -196
Filter J,H,K -196
[Grism -196] - Spectroscopy
Cold stop Cold stop -196
OAP_ircal_2 Ni+Gold -196
IR fold mirror Ni+Gold -196
H2RG H2RG_QE -196
--------------------------------------------
7.2 ShARCS Detector Specifications
Parameter Value Units
Pixel scale 0.035 arcsecs/pixelPixel pitch 18 micronsNumber pixels 1024FOV 20 arcsec squareFOV diameter ∗ 28 arcsecsRead noise 14.6 e−/CDS readCDS Exp time 10.6 secondsFowler read noise † 5.25 e−
Full well 1.0×10⁵ e−
Table 8. ShARCS H2RG detector parameters
∗circular aperture equivalent†32 samples
13


![REFERENCES [1] AA Shirwaikar and Srinatha, A Sustained release ...](https://static.fdocuments.us/doc/165x107/58a01ebd1a28abb84a8c44cf/references-1-aa-shirwaikar-and-srinatha-a-sustained-release-.jpg)