2013 C&MS Pavements Specification Updates Craig Landefeld, P.E. Construction Pavements Engineer.
2010 Concrete Sustainability Conference 1 © National Ready Mixed Concrete Association
Pavements Materials and the Urban ClimateUrban Climate
Kamil Kaloush, Ph.D., P.E.Arizona State University
2010 Concrete Sustainability Conference 2 © National Ready Mixed Concrete Association
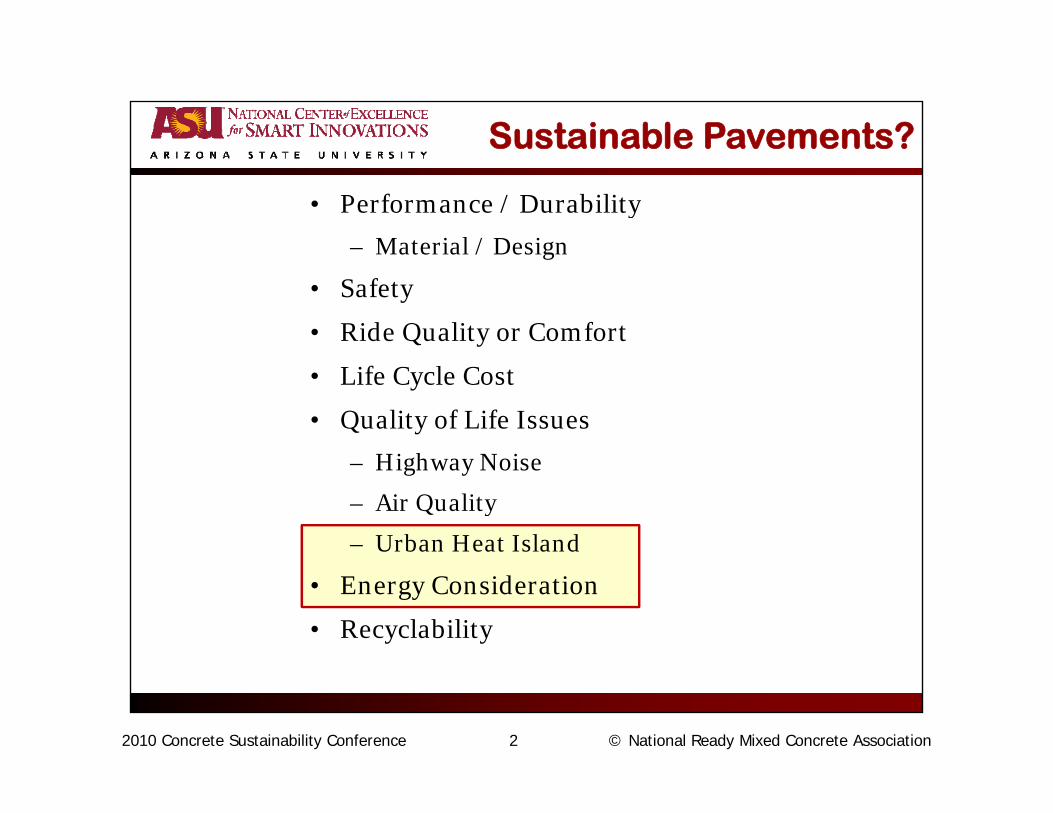
Sustainable Pavements?
• Performance / Durability• Performance / Durability
– Material / Design
• Safety
• Ride Quality or Comfort
• Life Cycle Cost
• Quality of Life Issues
– Highway Noise
– Air QualityAir Quality
– Urban Heat Island
• Energy Consideration
• Recyclability

2010 Concrete Sustainability Conference 3 © National Ready Mixed Concrete Association
Urban Heat Island
2010 Concrete Sustainability Conference 4 © National Ready Mixed Concrete Association
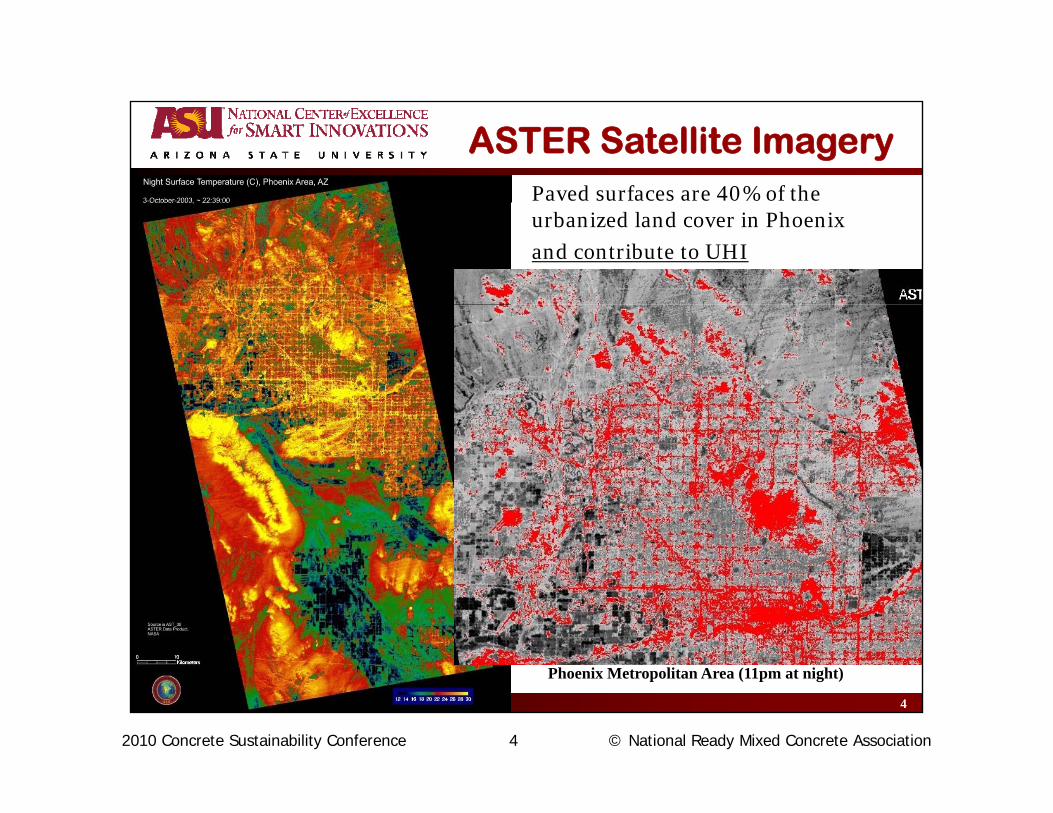
ASTER Satellite ImageryINTRODUCTION
Paved surfaces are 40% of the 4urbanized land cover in Phoenix
and contribute to UHI
4
Phoenix Metropolitan Area (11pm at night)

2010 Concrete Sustainability Conference 5 © National Ready Mixed Concrete Association
How Much?
l i ( l )Average Hourly Air Temperatures (July 2005) for Sky Harbor Airport (Urbanized), Encanto Park (Green Space), and the City of Maricopa (Rural)
similar peak temperatures
10oF difference at 5am
5
Source: Otanicar et al. 2007
2010 Concrete Sustainability Conference 6 © National Ready Mixed Concrete Association
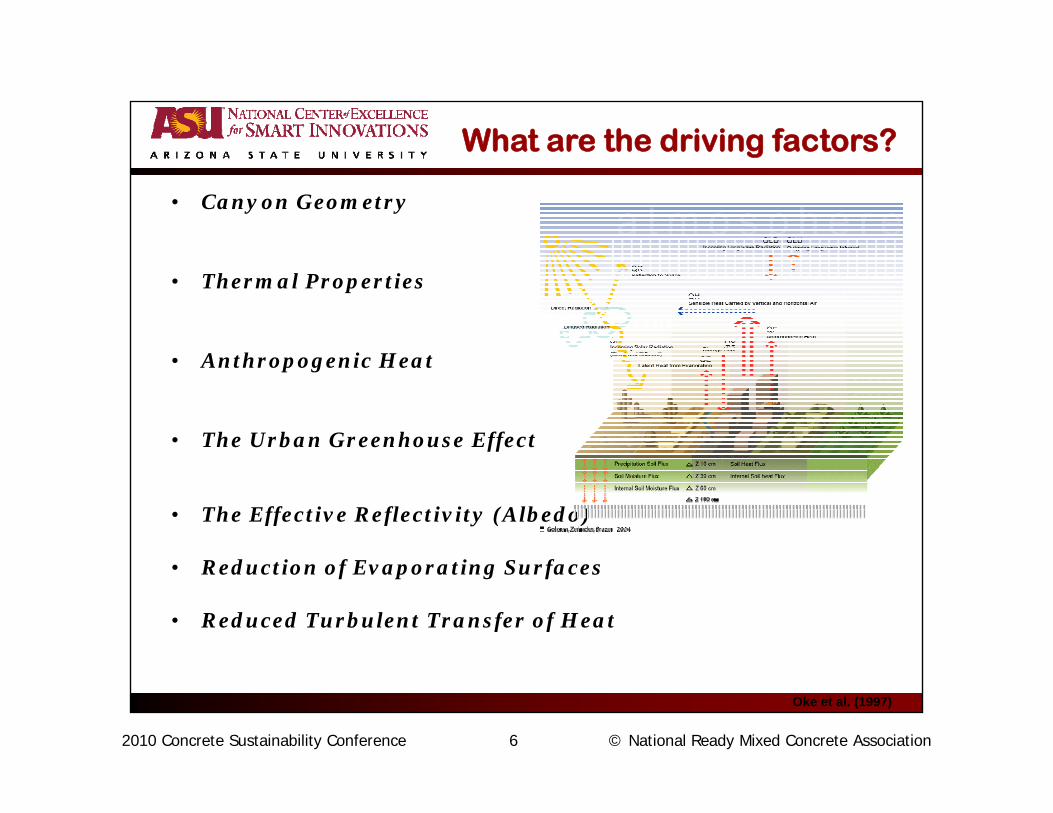
• Canyon Geometry
What are the driving factors?
• Canyon Geometry
• Thermal Properties
• Anthropogenic Heat
• The Urban Greenhouse Effect
Th Eff ti R fl ti it (Alb d )• The Effective Reflectivity (Albedo)
• Reduction of Evaporating Surfaces
d d b l f f
Oke et al. (1997)
• Reduced Turbulent Transfer of Heat
2010 Concrete Sustainability Conference 7 © National Ready Mixed Concrete Association
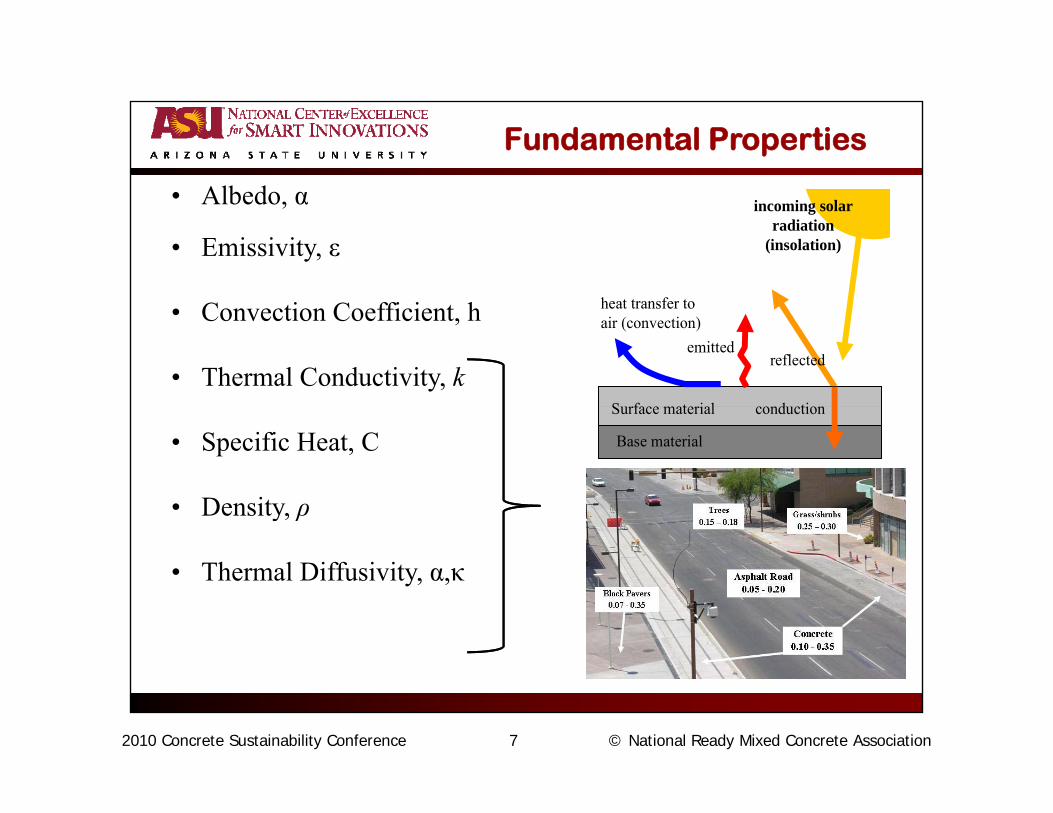
Fundamental Properties
• Albedo, α i i li i lAlbedo, α
• Emissivity, ε
C i C ffi i h heat transfer to
incoming solar radiation
(insolation)
heat transfer to
incoming solar radiation
(insolation)
• Convection Coefficient, h
• Thermal Conductivity, kreflected
emitted
heat transfer to air (convection)
Surface material conduction
reflectedemitted
heat transfer to air (convection)
Surface material conduction
• Specific Heat, C
• Density ρ
Base material
Surface material conduction
Base material
Surface material conduction
• Density, ρ
• Thermal Diffusivity, α,κ

2010 Concrete Sustainability Conference 8 © National Ready Mixed Concrete Association
UHI Pavement Mitigation Strategies
• Increase Albedo– Use pigments, light colored aggregates, resin binders
– Surface coatings with nanoparticles
P t (HMA d PCC)• Porous pavements (HMA and PCC)
• Whitetopping strategies
• Reflective Asphalt Pavements Techniques
• Thermal resistant materials• Thermal resistant materials– Aggregates, admixtures, crumb rubber
• Provide cover: trees, solar panels (parking structures)
• To pave or not to pave?p p

2010 Concrete Sustainability Conference 9 © National Ready Mixed Concrete Association
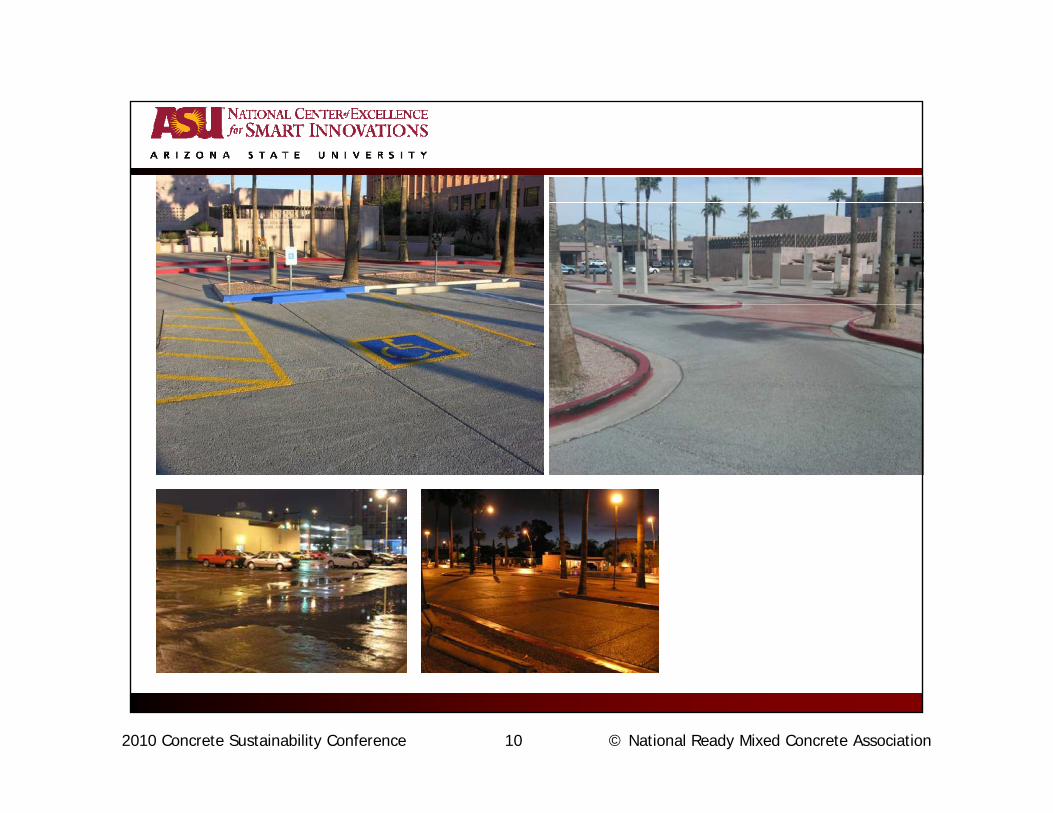
Thin and Ultra Thin Whitetopping
Pavement Design Characteristics
Thin and Ultra-Thin WhitetoppingPCC
9December 2, 2008 9
2010 Concrete Sustainability Conference 10 © National Ready Mixed Concrete Association
2010 Concrete Sustainability Conference 11 © National Ready Mixed Concrete Association
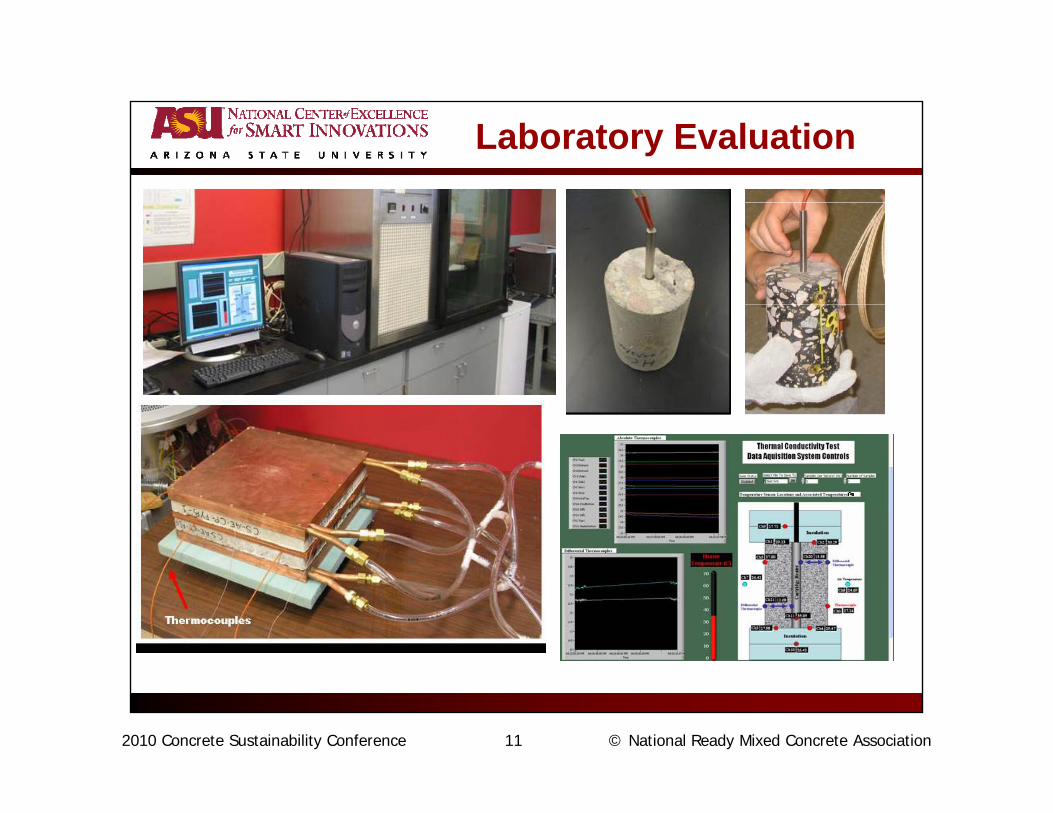
Laboratory Evaluation

2010 Concrete Sustainability Conference 12 © National Ready Mixed Concrete Association
2010 Concrete Sustainability Conference 13 © National Ready Mixed Concrete Association
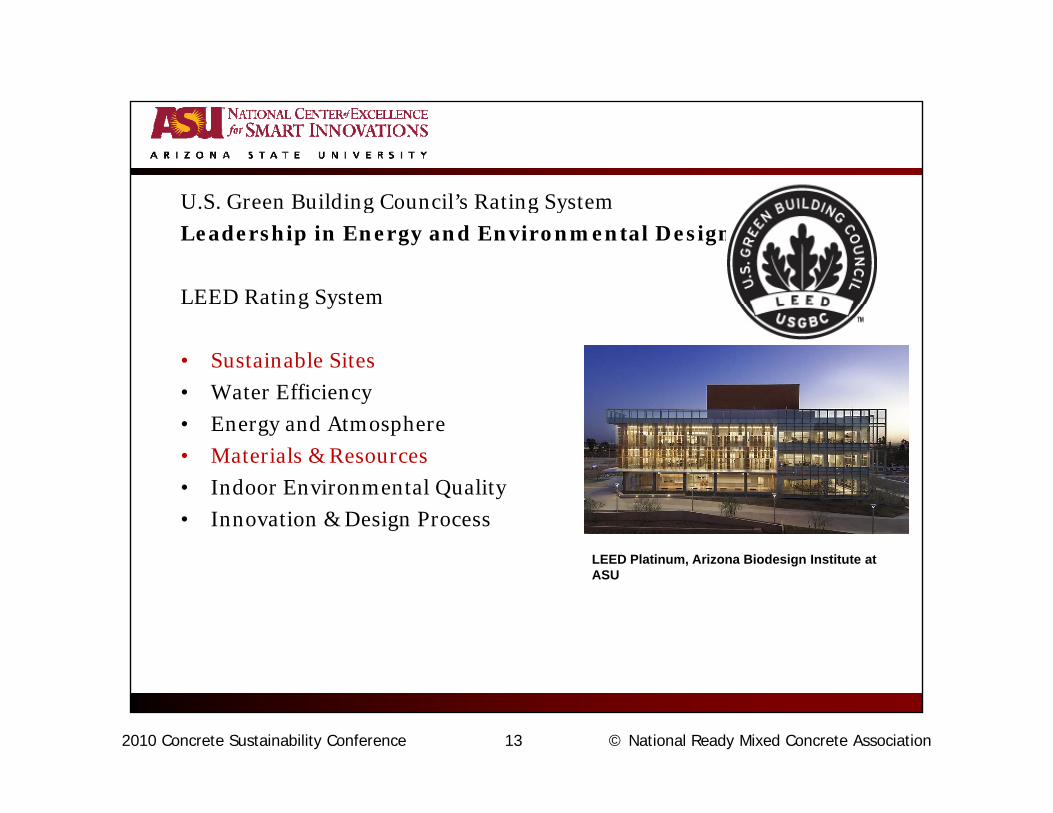
U S Green Building Council’s Rating SystemU.S. Green Building Council s Rating System
Leadership in Energy and Environmental Design (LEED™)
LEED Rating Systemg y
• Sustainable Sites
• Water Efficiency
• Energy and Atmosphere
• Materials & Resources
• Indoor Environmental Quality
• Innovation & Design Process
LEED Platinum, Arizona Biodesign Institute at ASU
13

2010 Concrete Sustainability Conference 14 © National Ready Mixed Concrete Association
LEED™ and Concrete Pavements
Concrete Pavement may contribute in the following categories…• Sustainable Sites
– Credit 7: Landscape and Exterior Design to Reduce UHI (2 points)Intent – Reduce heat islands to minimize impact on microclimateIntent Reduce heat islands to minimize impact on microclimate7.1 NON-ROOF SURFACES (1 point)• Provide Shade – (<5years) on at least 30% of non-roof impervious surfaces
OR use light colored (reflectance >0.30) for 30% of non-roof– TECH/STRATEGY – PORTLAND CEMENT CONCRETE
OR place a minimum of 50% of parking underground OR open-grid for minimum of 50% of parking lot area
– TECH/STRATEGY – PORTLAND CEMENT OPEN CELLED CONCRETE PAVERS
Other non UHI related creditsOther non UHI related credits…
• Materials and Resources– Credit 2: Construction Waste Management (1-2 points)– Credit 3: Resource Reuse (1-2 points)
C dit R l d C t t ( i t )– Credit 4: Recycled Content (1-2 points)– Credit 5: Local/Regional Materials ( 1-2 points)

2010 Concrete Sustainability Conference 15 © National Ready Mixed Concrete Association
Heat Transfer between Pavement and its SurroundingsHeat Transfer between Pavement and its Surroundings
Tools - Modelsf gf g
Solar Radiation,(1−α)q”sol
Convection,h∞(To-T∞)
Irradiation,
Air @T∞
- No. of Pavement Layers- Density- Specific Heat Capacity- Thermal Conductivity- Pavement Layer Thickness
Pavement Layer Interfaceεσ(To4 –T4
sky)
To
- Pavement Layer InterfaceThermal Contact Resistance
- Albedo of Top Layer- Emissivity of Top Layer- Deep Ground Properties
- TemperatureDepth
Pavement
G d (N t l S il)
Conduction to Deep Earth, kgrd ∂T(t)
∂x
Tm
Ti
L- Depth
- Sky View Factor- Solar View Factor
Ground (Natural Soil) Ground)
Initial Condition: @t = 0s, T(0) = TinitialBoundary Condition: @x → ∞ T(t) → T
Tn
Boundary Condition: @x → ∞, T(t) → Tinitial
2010 Concrete Sustainability Conference 16 © National Ready Mixed Concrete Association
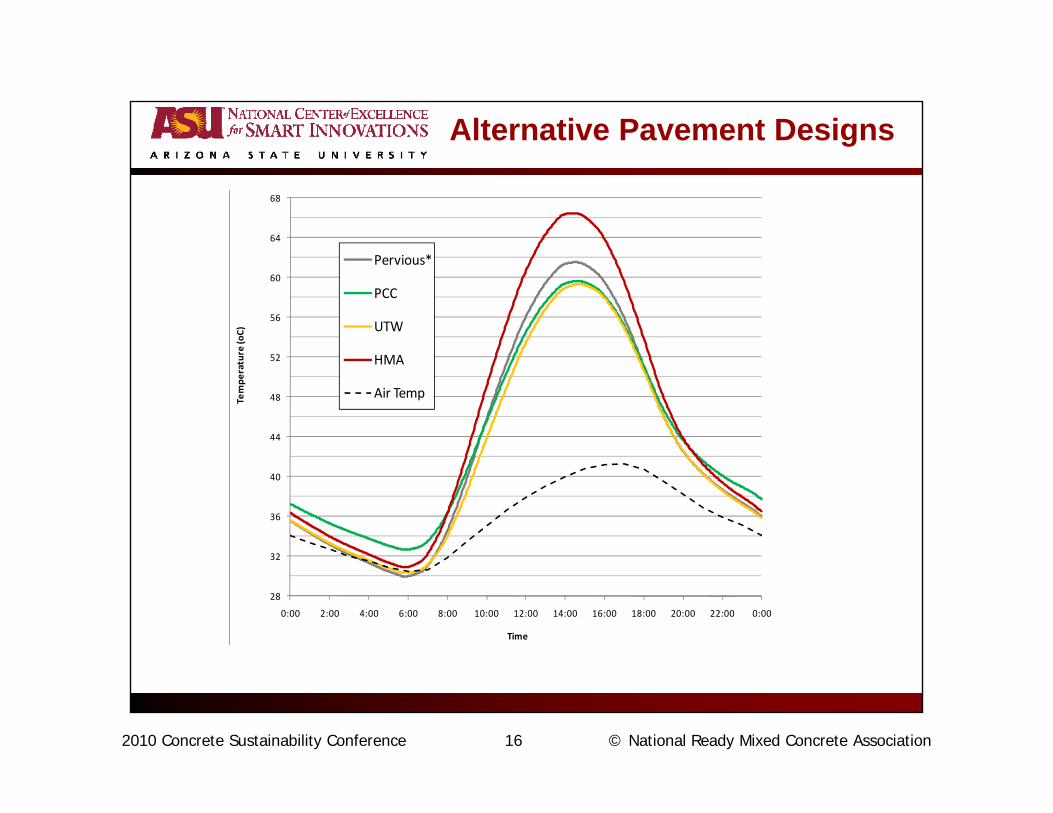
Alternative Pavement Designs
68
60
64
Pervious*
PCC
48
52
56
Tem
pera
ture
(oC) UTW
HMA
Air Temp
40
44
28
32
36
0 00 2 00 4 00 6 00 8 00 10 00 12 00 14 00 16 00 18 00 20 00 22 00 0 000:00 2:00 4:00 6:00 8:00 10:00 12:00 14:00 16:00 18:00 20:00 22:00 0:00
Time

2010 Concrete Sustainability Conference 17 © National Ready Mixed Concrete Association
City – Wide Analysis
2010 Concrete Sustainability Conference 18 © National Ready Mixed Concrete Association
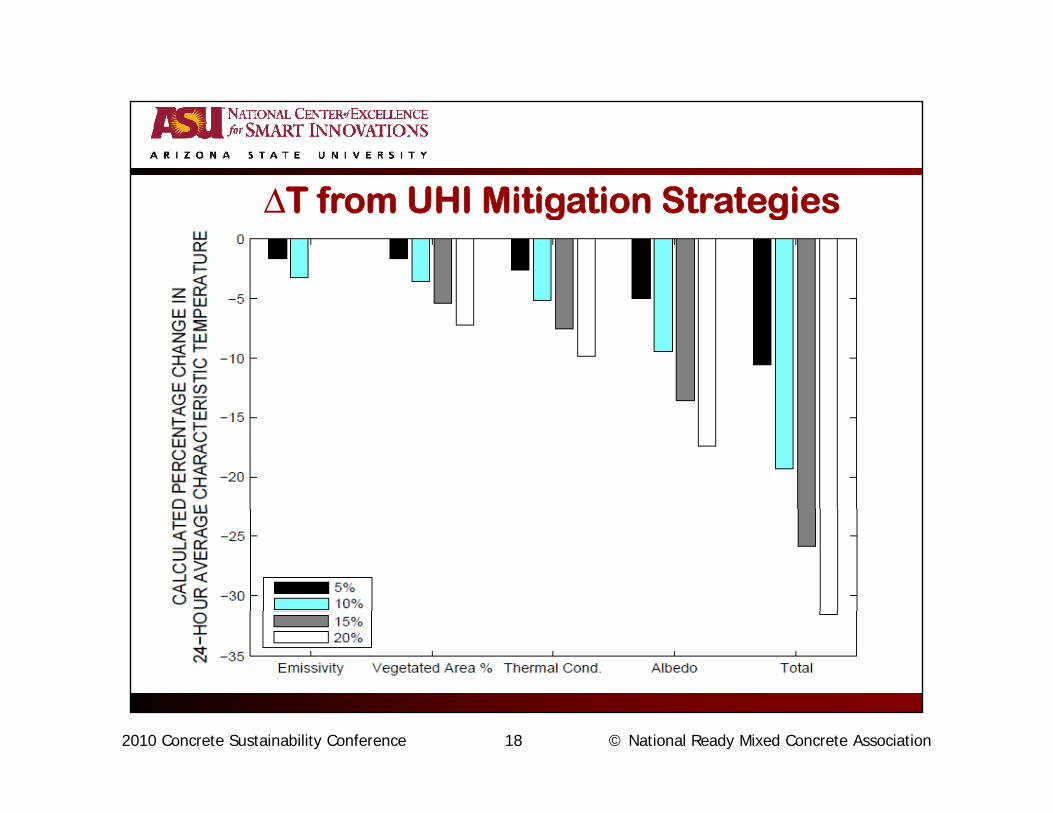
ΔT from UHI Mitigation StrategiesΔT from UHI Mitigation Strategies
2010 Concrete Sustainability Conference 19 © National Ready Mixed Concrete Association
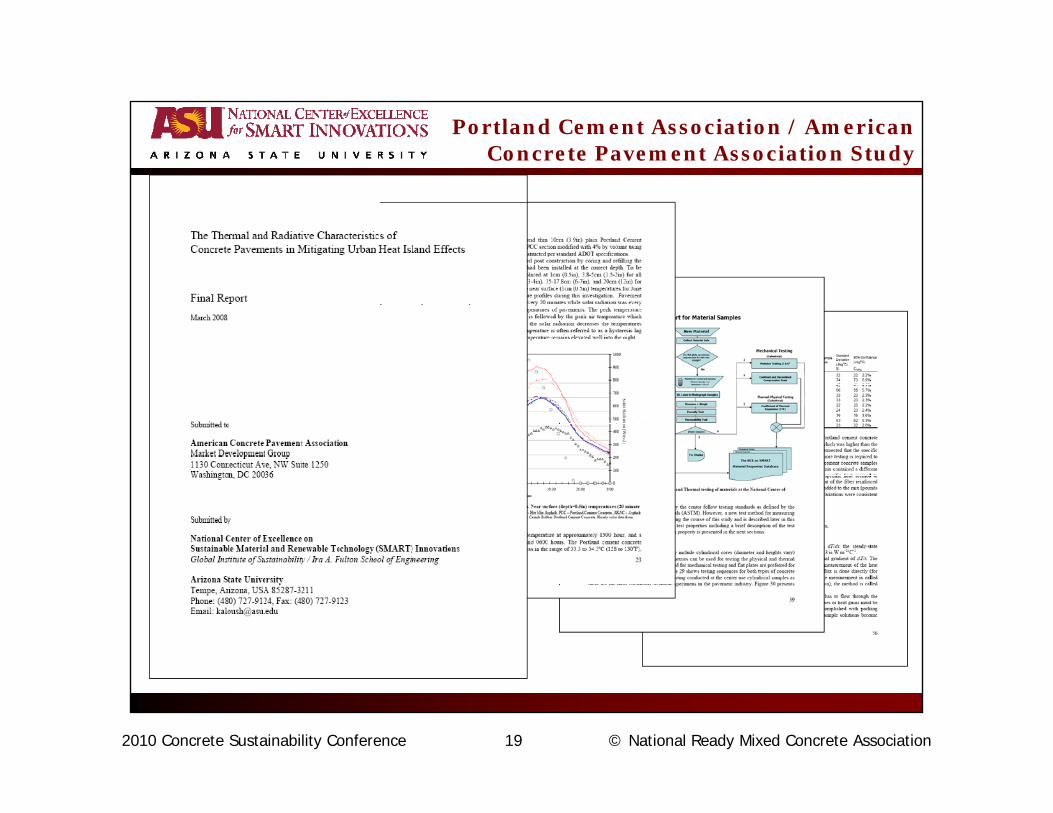
Portland Cement Association / American Concrete Pavement Association Study
19

2010 Concrete Sustainability Conference 20 © National Ready Mixed Concrete Association
Transportation Research Board
20
2010 Concrete Sustainability Conference 21 © National Ready Mixed Concrete Association
TRB on Climate Change
“Reducing transportation-related emissions of carbon dioxide--the primary greenhouse gas--that contribute to climate change and adaptingthat contribute to climate change and adapting to the consequences of climate change will be among the biggest public policy challenges f i th t t ti f i thfacing the transportation profession over the coming decades. “
2010 Concrete Sustainability Conference 22 © National Ready Mixed Concrete Association
US GHG Estimates
• Fact: coal is the primary generator of electricity (~50%) in the US
• Electric power generation: ~80% of total GHG p gemissions , EPA 2006
• Transportation Sector: 15-30%
• Pavements???• Pavements???
2010 Concrete Sustainability Conference 23 © National Ready Mixed Concrete Association
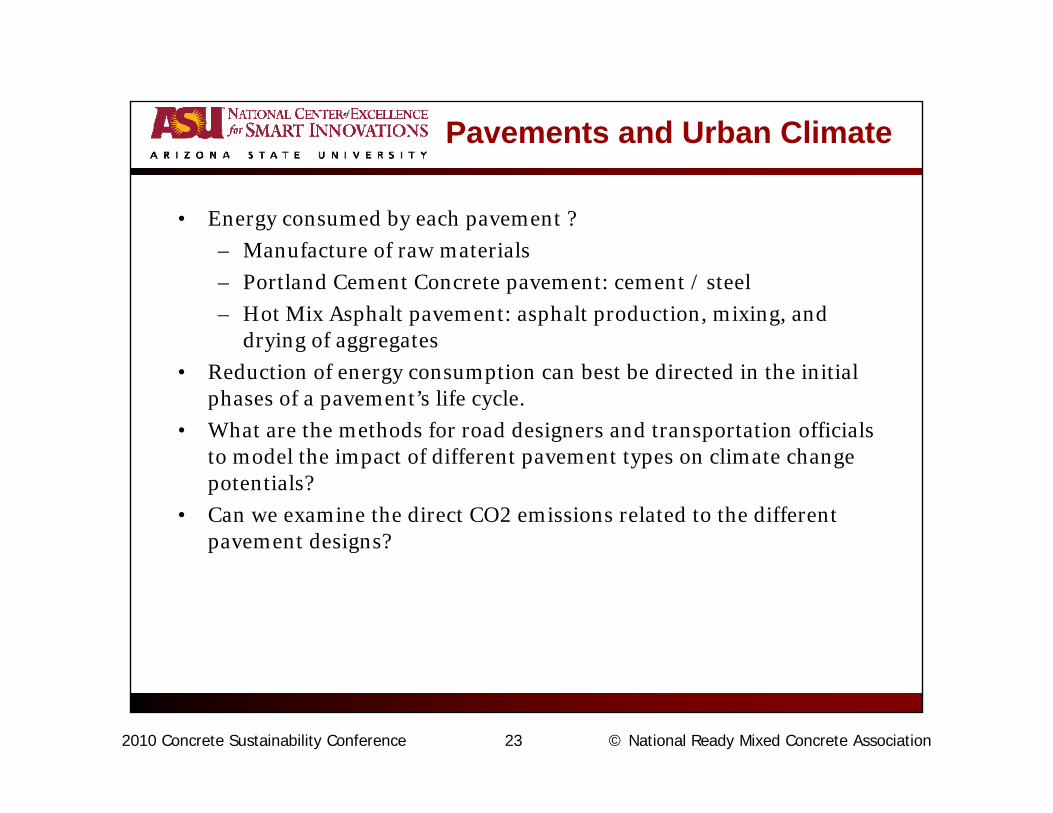
Pavements and Urban Climate
• Energy consumed by each pavement ?
– Manufacture of raw materials
– Portland Cement Concrete pavement: cement / steel
i h l h l d i i i d– Hot Mix Asphalt pavement: asphalt production, mixing, and drying of aggregates
• Reduction of energy consumption can best be directed in the initial phases of a pavement’s life cycle.p p y
• What are the methods for road designers and transportation officials to model the impact of different pavement types on climate change potentials?
C i th di t CO i i l t d t th diff t• Can we examine the direct CO2 emissions related to the different pavement designs?
2010 Concrete Sustainability Conference 24 © National Ready Mixed Concrete Association
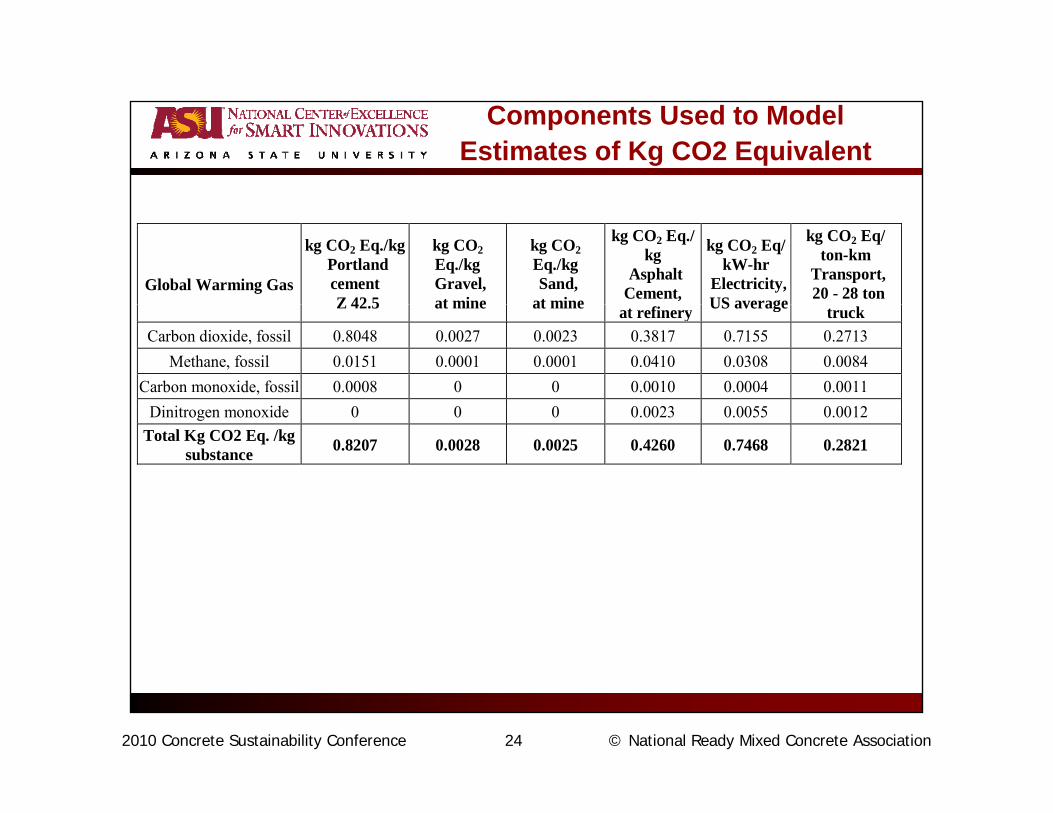
Components Used to Model Estimates of Kg CO2 Equivalent
Global Warming Gas
kg CO2 Eq./kgPortland cement Z 42 5
kg CO2 Eq./kg Gravel, at mine
kg CO2 Eq./kg Sand,
at mine
kg CO2 Eq./ kg
Asphalt Cement,
kg CO2 Eq/ kW-hr
Electricity,US average
kg CO2 Eq/ ton-km
Transport, 20 - 28 ton Z 42.5 at mine at mine at refinery US average truck
Carbon dioxide, fossil 0.8048 0.0027 0.0023 0.3817 0.7155 0.2713 Methane, fossil 0.0151 0.0001 0.0001 0.0410 0.0308 0.0084
Carbon monoxide, fossil 0.0008 0 0 0.0010 0.0004 0.0011 Di i id 0 0 0 0 0023 0 0055 0 0012Dinitrogen monoxide 0 0 0 0.0023 0.0055 0.0012
Total Kg CO2 Eq. /kg substance 0.8207 0.0028 0.0025 0.4260 0.7468 0.2821

2010 Concrete Sustainability Conference 25 © National Ready Mixed Concrete Association
Model
( ) ( )( )[ ]Y
TpDiMnPnDnWTkmEqkgCOannualTotal ∑ ++
=⋅⋅***1000**
/.2
Where,T = thickness of pavement layer, metersW = width of road, metersDn = density of pavement material, kg/m3Dn density of pavement material, kg/mPn = material production value, kg CO2 Eq. /kg Mn = material mixing value, kg CO2 Eq. /kg Di = distance from material production site to application site kmapplication site, kmTp = transport from production site to application site value, kg CO2 Eq. /kg material-kmY = road life yearsY = road life, years

2010 Concrete Sustainability Conference 26 © National Ready Mixed Concrete Association
Kg CO2 Eq. for Production
PCC Production % weight
Kg CO2 Eq./kg
Kg CO2 Eq./Kg
Gravel 0.400 0.0028 0.0011
Sand 0.394 0.0025 0.0010
Portland Cement 0.126 0.8207 0.1034
Total 0.1055
HMA Production
Aggregate 0.950 0.0026 0.0025gg g
Asphalt Cement 0.050 0.4260 0.0213
Total 0.0238
AR Production
Aggregate 0.920 0.0026 0.0024
Crumb rubber 0.016 0.0126 0.0002
Asphalt Cement 0.064 0.4260 0.0273
Total 0.0299

2010 Concrete Sustainability Conference 27 © National Ready Mixed Concrete Association
Mixing
• Mixing values (Mn) calculated utilizing CO2 Eq. for the fuels utilized for each of the pavement structures.
• PCC Concrete mixing assumes:g– 355 kilowatt diesel truck running 36 minutes/batch, with 0.76
m3/ batch, which is equivalent to 18420 kilograms /batch.
• HMA mixing: g– for a two-ton asphalt /hr capacity system
– requires 24.6 liters #2 fuel oil and 0.269 cubic meters of natural gas per hour.
• Crumb Rubber:– Shredding of automobile tires consume 950 kW/hr for 2 tons/hr
output of crumb (950 kw/909 kg = 1.045 kW/kg crumb rubber).

2010 Concrete Sustainability Conference 28 © National Ready Mixed Concrete Association
Natural gasEmission kg CO2 Eq. kg gas /kjoule kg CO2 Eq./kjoule
CO 1.57 1.12E-07 1.76 E-07CO 1 1 93 E 05 1 93 E 05
Portland Cement Concrete (PCC) Mixing CO2 Eq.
CO2 1 1.93 E-05 1.93 E-051.95 E-05/ kJoule
563745 kJ/ 18371 kg 0.0065Total kg.CO2 Eq. / kg PCC
Hot Mixed Asphalt (HMA) Mixing CO2 Eq.
Mixing Values for PCC and
Natural GasGas kg CO2 Eq. kg gas /106 m3 kg CO2 Eq/106 m3
CO 1.57 288.3 450CO2 1 192200 192200CH4 21 36.8 774
HMA 4
N2O 310 22.7 7050
207436 kgCO2 eq./106m3
2.56 m3 nat. gas/2000 kg
0.00027#2 F l Oil
kg.CO2 Eq. / kg #2 Fuel Oil
Gas kg CO2 Eq. kg gas /103 liter kg CO2 Eq/103 literCO 1.57 0.599 0.9CO2 1 2624.5 2624.5CH4 21 0.0062 0.1N2O 310 0.19 58.9
2684.4 kg CO2 Eq. / 103 liter24.6 liters fuel oil/ 1000 kg
0.0663Total kg.CO2 Eq. / kg HMA

2010 Concrete Sustainability Conference 29 © National Ready Mixed Concrete Association
Summary
Pavement CO2
equivalencyDn
Kg / m3
PnKg CO2
TpKg CO2
MnKg CO2equivalency
valuesKg / m Eq./kg Eq./kg - km Eq./kg
Sand 1600 0.0028 0.0002821 0G l 1800 0 0025 0 0002821 0Gravel 1800 0.0025 0.0002821 0
Aggregate 1700 0.0026 0.0002821 0PCC 2403 0 1055 0 0002821 0 00650PCC 2403 0.1055 0.0002821 0.00650HMA 2275 0.0238 0.0002821 0.06630AR 2035 0.0299 0.0002821 0.07230

2010 Concrete Sustainability Conference 30 © National Ready Mixed Concrete Association
ExampleRoad Life (years)Road Life (years)
AR 2.5-in, Base 6-in 10UTW 2-in, HMA 2-in, Base 6-in 15
HMA 4-in, Base 6-in 10

2010 Concrete Sustainability Conference 31 © National Ready Mixed Concrete Association
Road Life (years)
Example
AR 2.5-in, Base 6-in 10UTW 2-in, HMA 2-in, Base 6-in 20
HMA 4-in, Base 6-in 10
31
2010 Concrete Sustainability Conference 32 © National Ready Mixed Concrete Association
Concluding Remarks
• Pavements play a role / have impact on the urban climate.
• Appreciate the complexity of various designs.
U d d d d i d• Understand your data sources and input needs.
• There is no one pavement design and type that fits all!
• We need more user’s tools

2010 Concrete Sustainability Conference 33 © National Ready Mixed Concrete Association
Thank You!
[email protected]@asu.edu