Paul Spellman , and Bahram Parvin Author Manuscript NIH ...
19
Classification of Tumor Histology via Morphometric Context * Hang Chang 1,* , Alexander Borowsky 2 , Paul Spellman 3 , and Bahram Parvin 1,* Alexander Borowsky: [email protected]; Paul Spellman: [email protected] 1 Life Sciences Division, Lawrence Berkeley National Laboratory, Berkeley, California, U.S.A 2 Center for Comparative Medicine, UC Davis, Davis, California, USA 3 Center for Spatial Systems Biomedicine, Oregon Health Sciences University, Portland, Oregon, U.S.A Abstract Image-based classification of tissue histology, in terms of different components (e.g., normal signature, categories of aberrant signatures), provides a series of indices for tumor composition. Subsequently, aggregation of these indices in each whole slide image (WSI) from a large cohort can provide predictive models of clinical outcome. However, the performance of the existing techniques is hindered as a result of large technical and biological variations that are always present in a large cohort. In this paper, we propose two algorithms for classification of tissue histology based on robust representations of morphometric context, which are built upon nuclear level morphometric features at various locations and scales within the spatial pyramid matching (SPM) framework. These methods have been evaluated on two distinct datasets of different tumor types collected from The Cancer Genome Atlas (TCGA), and the experimental results indicate that our methods are (i) extensible to different tumor types; (ii) robust in the presence of wide technical and biological variations; (iii) invariant to different nuclear segmentation strategies; and (iv) scalable with varying training sample size. In addition, our experiments suggest that enforcing sparsity, during the construction of morphometric context, further improves the performance of the system. 1. Introduction Histology sections provide a wealth of information about the tissue architecture that contains multiple cell types at different states of cell cycles. These sections are often stained with hematoxylin and eosin (H&E) stains, which label DNA (e.g., nuclei) and protein contents, respectively, in various shades of color. Abberations in the histology architecture often lead * This work was supported by NIH U24 CA1437991 carried out at Lawrence Berkeley National Laboratory under Contract No. DE- AC02-05CH11231. * Corresponding authors {[email protected], [email protected]}. Disclaimer This document was prepared as an account of work sponsored by the United States Government. While this document is believed to contain correct information, neither the United States Government nor any agency thereof, nor the Regents of the University of California, nor any of their employees, makes any warranty, express or implied, or assumes any legal responsibility for the accuracy, completeness, or usefulness of any information, apparatus, product, or process disclosed, or represents that its use would not infringe privately owned rights. Reference herein to any specific commercial product, process, or service by its trade name, trademark, manufacturer, or otherwise, does not necessarily constitute or imply its endorsement, recommendation, or favoring by the United States Government or any agency thereof, or the Regents of the University of California. The views and opinions of authors expressed herein do not necessarily state or reflect those of the United States Government or any agency thereof or the Regents of the University of California. NIH Public Access Author Manuscript Proc IEEE Comput Soc Conf Comput Vis Pattern Recognit. Author manuscript; available in PMC 2013 December 04. Published in final edited form as: Proc IEEE Comput Soc Conf Comput Vis Pattern Recognit. 2013 June 23; 2013: . doi:10.1109/CVPR. 2013.286. NIH-PA Author Manuscript NIH-PA Author Manuscript NIH-PA Author Manuscript
Transcript of Paul Spellman , and Bahram Parvin Author Manuscript NIH ...
Classification of Tumor Histology via Morphometric Context *
Hang Chang1,*, Alexander Borowsky2, Paul Spellman3, and Bahram Parvin1,*
Alexander Borowsky: [email protected]; Paul Spellman: [email protected] Sciences Division, Lawrence Berkeley National Laboratory, Berkeley, California, U.S.A2Center for Comparative Medicine, UC Davis, Davis, California, USA3Center for Spatial Systems Biomedicine, Oregon Health Sciences University, Portland, Oregon,U.S.A
AbstractImage-based classification of tissue histology, in terms of different components (e.g., normalsignature, categories of aberrant signatures), provides a series of indices for tumor composition.Subsequently, aggregation of these indices in each whole slide image (WSI) from a large cohortcan provide predictive models of clinical outcome. However, the performance of the existingtechniques is hindered as a result of large technical and biological variations that are alwayspresent in a large cohort. In this paper, we propose two algorithms for classification of tissuehistology based on robust representations of morphometric context, which are built upon nuclearlevel morphometric features at various locations and scales within the spatial pyramid matching(SPM) framework. These methods have been evaluated on two distinct datasets of different tumortypes collected from The Cancer Genome Atlas (TCGA), and the experimental results indicatethat our methods are (i) extensible to different tumor types; (ii) robust in the presence of widetechnical and biological variations; (iii) invariant to different nuclear segmentation strategies; and(iv) scalable with varying training sample size. In addition, our experiments suggest that enforcingsparsity, during the construction of morphometric context, further improves the performance ofthe system.
1. IntroductionHistology sections provide a wealth of information about the tissue architecture that containsmultiple cell types at different states of cell cycles. These sections are often stained withhematoxylin and eosin (H&E) stains, which label DNA (e.g., nuclei) and protein contents,respectively, in various shades of color. Abberations in the histology architecture often lead
*This work was supported by NIH U24 CA1437991 carried out at Lawrence Berkeley National Laboratory under Contract No. DE-AC02-05CH11231.*Corresponding authors {[email protected], [email protected]}.
DisclaimerThis document was prepared as an account of work sponsored by the United States Government. While this document is believed tocontain correct information, neither the United States Government nor any agency thereof, nor the Regents of the University ofCalifornia, nor any of their employees, makes any warranty, express or implied, or assumes any legal responsibility for the accuracy,completeness, or usefulness of any information, apparatus, product, or process disclosed, or represents that its use would not infringeprivately owned rights. Reference herein to any specific commercial product, process, or service by its trade name, trademark,manufacturer, or otherwise, does not necessarily constitute or imply its endorsement, recommendation, or favoring by the UnitedStates Government or any agency thereof, or the Regents of the University of California. The views and opinions of authors expressedherein do not necessarily state or reflect those of the United States Government or any agency thereof or the Regents of the Universityof California.
NIH Public AccessAuthor ManuscriptProc IEEE Comput Soc Conf Comput Vis Pattern Recognit. Author manuscript; available inPMC 2013 December 04.
Published in final edited form as:Proc IEEE Comput Soc Conf Comput Vis Pattern Recognit. 2013 June 23; 2013: . doi:10.1109/CVPR.2013.286.
NIH
-PA Author Manuscript
NIH
-PA Author Manuscript
NIH
-PA Author Manuscript
to disease progression. It is desirable to quantify indices associated with these abberationssince they can be tested against the clinical outcome, e.g., survival, response to therapy.Even though there are inter- and intra- observer variations [7], a trained pathologist alwaysuses rich content (e.g., various cell types, cellular organization, cell state and health), incontext, to characterize tumor architecture.
In this paper, we propose two tissue classification methods based on representations ofmorphometric context, which are constructed from nuclear morphometric statistics ofvarious locations and scales based on spatial pyramid matching (SPM) [18] and linearspatial pyramid matching (Linear SPM) [28]. Due to the effectiveness of ourrepresentations, our methods achieve excellent performance even with small number oftraining samples across different segmentation strategies and independent datasets oftumors. The performance is further complemented by the fact that one of the methods has asuperior result with linear classifiers. These characteristics dramatically improve the (i)effectiveness of our techniques when applied to a large cohort, and (ii) extensibility to othercell-based assays.
Organization of this paper is as follows: Section 2 reviews related works. Sections 3 and 4describes the details of our proposed mehods and experimental validation. Lastly, section 5concludes the paper.
2. Related WorkFor the analysis of the H&E stained sections, several excellent reviews can be found in [13,8]. Fundamentally, the trend has been based either on nuclear segmentation andcorresponding morphometric representaion, or patch-based representation of the histologysections that aids in clinical association. For example, a recent study indicates that detailedsegmentation and multivariate representation of nuclear features from H&E stained sectionscan predict DCIS recurrence [1] in patients with more than one nuclear grade.
The major challenge for tissue classification is the large amounts of technical and biologicalvariations in the data, which typically results in techniques that are tumor type specific. Toovercome this problem, recent studies have focused on either fine tuning human engineeredfeatures [2, 16, 17], or applying automatic feature learning [19, 14], for robustrepresentation.
In the context of image categorization research, the traditional bag of features (BoF) modelhas been widely studied and improved through different variations, e.g., modeling of co-occurrence of descriptors based on generative methods [4, 3, 20, 24], improving dictionaryconstruction through discriminative learning [9, 22], modeling the spatial layout of localdescriptors based on spatial pyramid matching kernel (SPM) [18]. It is clear that SPM hasbecome the major component of the state-of-art systems [10] for its effectiveness in practice.
Pathologists often use “context” to assess the disease state. At the same time, SPM partiallycaptures context because of its hierarchical nature. Motivated by the works of [18, 28], weencode morphometric signatures, at different locations and scales, within the SPMframework. The end results are highly robust and effective systems across multiple tumortypes with limited number of training samples.
Chang et al. Page 2
Proc IEEE Comput Soc Conf Comput Vis Pattern Recognit. Author manuscript; available in PMC 2013 December 04.
NIH
-PA Author Manuscript
NIH
-PA Author Manuscript
NIH
-PA Author Manuscript
3. ApproachesThe computational workflows for the proposed methods are shown in Figure 1, where thenuclear segmentation can be based on any of the existing methods for delineating nucleifrom background. For some tissue images and their corresponding nuclear segmentation, let:
1. M be the total number of segmented nuclei;
2. N be the number of morphometric descriptors extracted from each segmentednucleus, e.g. nuclear size, and nuclear intensity;
3. X be the set of morphometric descriptors for all segmented nuclei, where X = [x1,…, xM]⊤ ∈ ℝM × N.
Our proposed methods are described in detail as follows.
3.1. Morphometric nonlinear kernel SPM (MKSPM)In this approach, we utilize the nuclear morphometric information within the SPMframework to construct the morphometric context at various locations and scales for tissueimage representation and classification. It consists of the following steps:
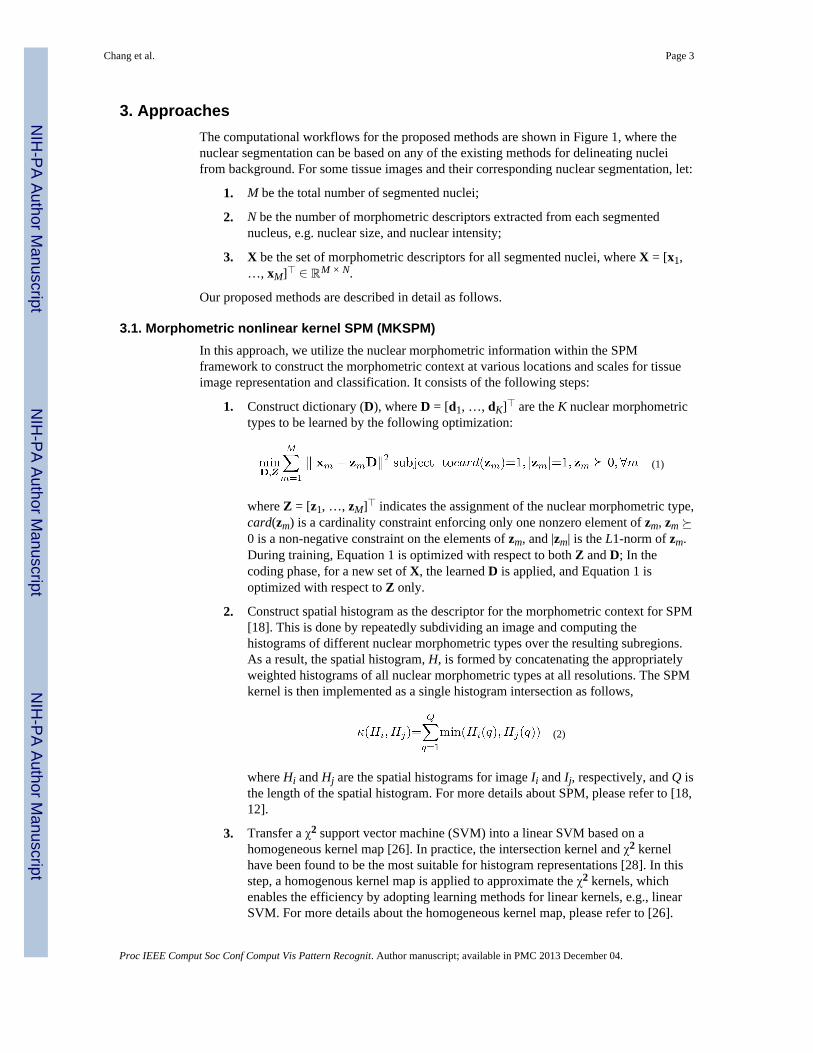
1. Construct dictionary (D), where D = [d1, …, dK]⊤ are the K nuclear morphometrictypes to be learned by the following optimization:
(1)
where Z = [z1, …, zM]⊤ indicates the assignment of the nuclear morphometric type,card(zm) is a cardinality constraint enforcing only one nonzero element of zm, zm ⪰0 is a non-negative constraint on the elements of zm, and |zm| is the L1-norm of zm.During training, Equation 1 is optimized with respect to both Z and D; In thecoding phase, for a new set of X, the learned D is applied, and Equation 1 isoptimized with respect to Z only.
2. Construct spatial histogram as the descriptor for the morphometric context for SPM[18]. This is done by repeatedly subdividing an image and computing thehistograms of different nuclear morphometric types over the resulting subregions.As a result, the spatial histogram, H, is formed by concatenating the appropriatelyweighted histograms of all nuclear morphometric types at all resolutions. The SPMkernel is then implemented as a single histogram intersection as follows,
(2)
where Hi and Hj are the spatial histograms for image Ii and Ij, respectively, and Q isthe length of the spatial histogram. For more details about SPM, please refer to [18,12].
3. Transfer a χ2 support vector machine (SVM) into a linear SVM based on ahomogeneous kernel map [26]. In practice, the intersection kernel and χ2 kernelhave been found to be the most suitable for histogram representations [28]. In thisstep, a homogenous kernel map is applied to approximate the χ2 kernels, whichenables the efficiency by adopting learning methods for linear kernels, e.g., linearSVM. For more details about the homogeneous kernel map, please refer to [26].
Chang et al. Page 3
Proc IEEE Comput Soc Conf Comput Vis Pattern Recognit. Author manuscript; available in PMC 2013 December 04.
NIH
-PA Author Manuscript
NIH
-PA Author Manuscript
NIH
-PA Author Manuscript
4. Construct multi-class linear SVM for classification. In our implementation, theclassifier is trained using the LIBLINEAR [11] package.
3.2. Sparse Morphometric Linear SPM (SMLSPM)Inspired by the work in [28], which indicates that the sparse coding of the SIFT features mayserve as a better local descriptor in general image processing tasks, we propose to utilize thesparse coding of the nuclear morphometric information within a linear SPM framework toconstruct the morphometric context at various locations and scales for tissue imagerepresentation and classification. It consists of the following steps:
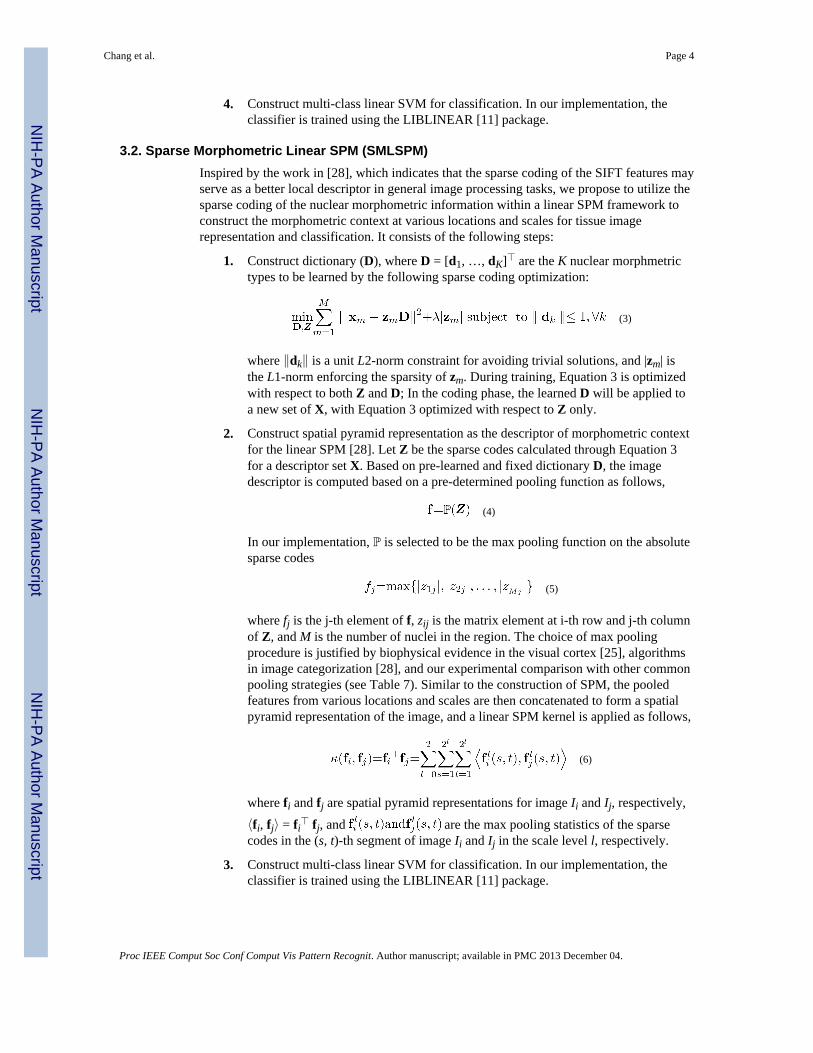
1. Construct dictionary (D), where D = [d1, …, dK]⊤ are the K nuclear morphmetrictypes to be learned by the following sparse coding optimization:
(3)
where ∥dk∥ is a unit L2-norm constraint for avoiding trivial solutions, and |zm| isthe L1-norm enforcing the sparsity of zm. During training, Equation 3 is optimizedwith respect to both Z and D; In the coding phase, the learned D will be applied toa new set of X, with Equation 3 optimized with respect to Z only.
2. Construct spatial pyramid representation as the descriptor of morphometric contextfor the linear SPM [28]. Let Z be the sparse codes calculated through Equation 3for a descriptor set X. Based on pre-learned and fixed dictionary D, the imagedescriptor is computed based on a pre-determined pooling function as follows,
(4)
In our implementation, ℙ is selected to be the max pooling function on the absolutesparse codes
(5)
where fj is the j-th element of f, zij is the matrix element at i-th row and j-th columnof Z, and M is the number of nuclei in the region. The choice of max poolingprocedure is justified by biophysical evidence in the visual cortex [25], algorithmsin image categorization [28], and our experimental comparison with other commonpooling strategies (see Table 7). Similar to the construction of SPM, the pooledfeatures from various locations and scales are then concatenated to form a spatialpyramid representation of the image, and a linear SPM kernel is applied as follows,
(6)
where fi and fj are spatial pyramid representations for image Ii and Ij, respectively,
⟨fi, fj⟩ = fi⊤ fj, and are the max pooling statistics of the sparse
codes in the (s, t)-th segment of image Ii and Ij in the scale level l, respectively.
3. Construct multi-class linear SVM for classification. In our implementation, theclassifier is trained using the LIBLINEAR [11] package.
Chang et al. Page 4
Proc IEEE Comput Soc Conf Comput Vis Pattern Recognit. Author manuscript; available in PMC 2013 December 04.
NIH
-PA Author Manuscript
NIH
-PA Author Manuscript
NIH
-PA Author Manuscript
4. Experiments And ResultsWe have evaluated five classification methods on two distinct datasets, curated from (i)Glioblastoma Multiforme (GBM) and (ii) Kidney Renal Clear Cell Carcinoma (KIRC) fromThe Cancer Genome Atlas (TCGA), which are publicly available from the NIH (NationalInstitute of Health) repository. The five methods are:
1. SMLSPM: the linear SPM that uses linear kernel on spatial-pyramid pooling ofmorphometric sparse codes;
2. MKSPM: the nonlinear kernel SPM that uses spatial-pyramid histograms ofmorphometric features and χ2 kernels;
3. ScSPM [28]: the linear SPM that uses linear kernel on spatial-pyramid pooling ofSIFT sparse codes;
4. KSPM [18]: the nonlinear kernel SPM that uses spatial-pyramid histograms ofSIFT features and χ2 kernels;
5. CTSPM: the nonlinear kernel SPM that uses spatial-pyramid histograms of colorand texture features and χ2 kernels;
In the implementations of SMLSPM and MKSPM, morphometric features were extractedand normalized independently with zero mean and unit variance based on three differentsegmentation strategies:
1. MRGC [6]: A multi-reference graph cut approach for nuclear segmentation inhistology tissue sections;
2. SRCD [5]: A single-reference color decomposition approach for nuclearsegmentation in histology tissue sections;
3. OTGR: A simple Otsu thresholding [23] approach for nuclear segmentation inhistology tissue sections. In our implementation, nuclear mask was generated byapplying Otsu thresholding on gray-scale image, and refined by geometricreasoning [27]. The same refinement was also used in the MRGC and SRCDapproaches.
A comparison of the segmentation performance, for the above methods, is quoted from [6],and listed in Table 1, and the computed morphometric features are listed in Table 2.
In the implementation of ScSPM and KSPM, the dense SIFT features were extracted on 16× 16 patches sampled from each image on a grid with stepsize 8 pixels. In theimplementation of CTSPM, color features were extracted in the RGB color space; texturefeatures were extracted via steerable filters [29] with 4 directions and 5 scales (σ ∈ {1, 2, 3,4, 5}) on the grayscale image; and the feature vector was a concatenation of texture andmean color on 20 × 20 patches.
For both SMLSPM and ScSPM, we fixed the sparse constraint parameter γ to be 0.15,empirically, to achieve the best performance. For MKSPM, KSPM and CTSPM, we usedstandard K-means clustering for the construction of dictionaries. Additionally, for all fivemethods, we fixed the level of pyramid to be 3, and used linear SVM for classification. Allexperimental processes were repeated 10 times with randomly selected training and testingimages. The final results were reported as the mean and standard deviation of theclassification rates.
Chang et al. Page 5
Proc IEEE Comput Soc Conf Comput Vis Pattern Recognit. Author manuscript; available in PMC 2013 December 04.
NIH
-PA Author Manuscript
NIH
-PA Author Manuscript
NIH
-PA Author Manuscript
4.1. GBM DatasetThe GBM dataset contains 3 classes: Tumor, Necrosis, and Transition to Necrosis, whichwere curated from whole slide images (WSI) scanned with a 20X objective (0.502 micron/pixel). Examples can be found in Figure 2. The number of images per category are 628, 428and 324, respectively. Most images are 1000 × 1000 pixels. In this experiment, we trainedon 40, 80 and 160 images per category and tested on the rest, with three different dictionarysizes: 256, 512 and 1024. Detailed comparisons are shown in Table 3. For SMLSPM andMKSPM, we also evaluated the performance based on three different segmentationstrategies: MRGC, SRCD and OTGR. Detailed comparisons are shown in Table 4.
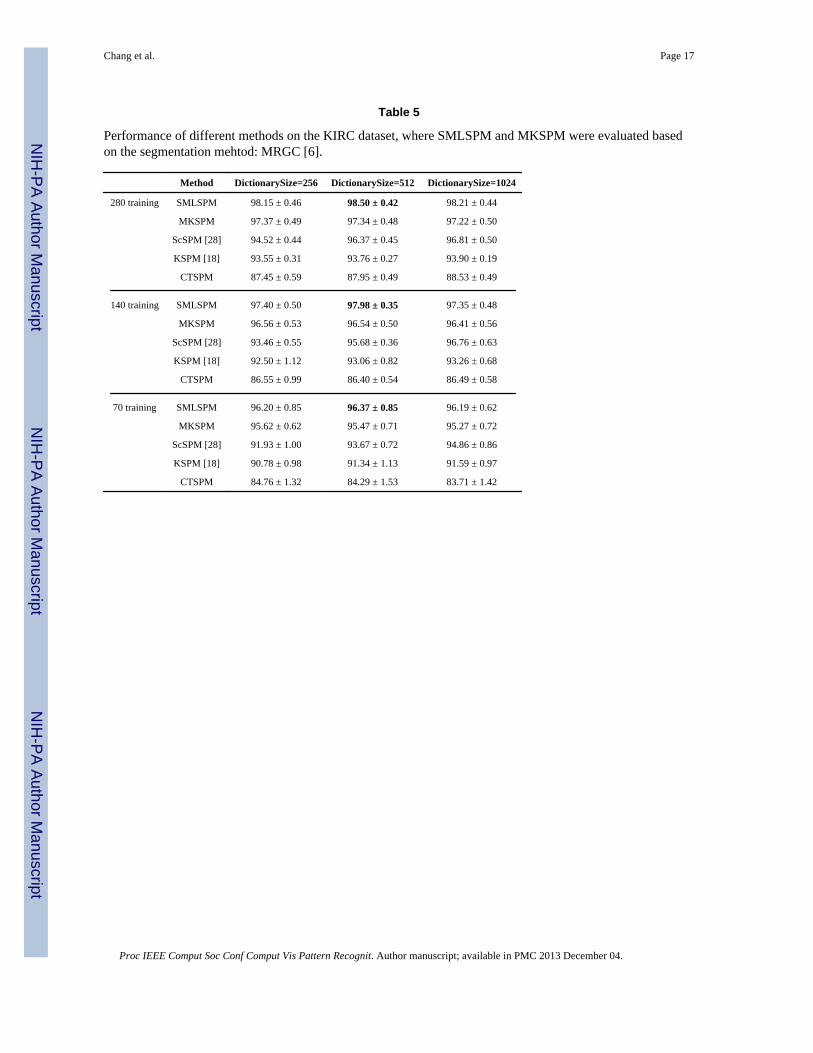
4.2. KIRC DatasetThe KIRC dataset contains 3 classes: Tumor, Normal, and Stromal, which were curatedfrom whole slide images (WSI) scanned with a 40X objective (0.252 micron/pixel).Examples can be found in Figure 3. The number of images per category are 568, 796 and784, respectively. Most images are 1000 × 1000 pixels. In this experiment, we trained on 70,140 and 280 images per category and tested on the rest, with three different dictionary sizes:256, 512 and 1024. Detailed comparisons are shown in Table 5. For SMLSPM andMKSPM, we also evaluated the performance based on three different segmentationstrategies: MRGC, SRCD and OTGR. Detailed comparisons are shown in Table 6
The experiments, conducted on two distinct datasets, demonstrate the following merits ofour approach,
1. Extensibility to different tumor types. Tables 3 and 5 indicate that, with theexception of (KIRC; 140 training; Dictionary size 1024), our methods consistentlyoutperform ScSPM, KSPM and CTSPM with different combinations ofexperimental factors (e.g., training sample size, dictionary size). However, KSPMand ScSPM appear to be tumor-type dependent, as KSPM outperforms ScSPM onGBM while ScSPM outperforms KSPM on KIRC. Since GBM and KIRC are twovastly different tumor types with significantly different signatures, we suggest thatthe consistency in performance assures extensibility to different tumor types.
2. Robustness in the presence of large amounts of technical and biological variations.With respect to the GBM dataset, shown in Table 3, the performance of ourmethods, based on 40 training samples per category, is better than the performanceof ScSPM, KSPM and CTSPM based on 160 training samples per category. Withrespect to the KIRC dataset, shown in Table 5, the performance of our methods,based on 70 training samples per category, is comparable to the performance ofScSPM, KSPM and CTSPM based on 280 training samples per category. Given thefact that TCGA datasets contain large amount of technical and biological variations[17, 19], these results clearly indicate the robustness of our morphometric contextrepresentation, which dramatically improved the reliability of our approaches.
3. Invariance to different segmentation algorithms. Tables 4 and 6 indicate that theperformance of our approaches are almost invariant to different segmentationalgorithms, given the fact that the segmentation performance itself varies a lot, asshown in Table 1. More importantly, even with the simplest segmentation strategyOTGR, SMLSPM outperforms the methods in [28, 18] on both datasets, andMRSPM outperforms the methods in [28, 18] on the GBM dataset, whilegenerating comparable results on the KIRC dataset. Given the fact that, in a lot ofstudies, both nuclear segmentation and tissue classification are necessarycomponents, the use of pre-computed morphometric features dramatically improvethe efficiency by avoiding extra feature extraction steps. For example, in our
Chang et al. Page 6
Proc IEEE Comput Soc Conf Comput Vis Pattern Recognit. Author manuscript; available in PMC 2013 December 04.
NIH
-PA Author Manuscript
NIH
-PA Author Manuscript
NIH
-PA Author Manuscript
implementation, SIFT costs 1.5 sec/block ( a block is a 1000 × 1000 imagedecomposed from a whole slide tissue section). For the whole GBM dataset(~600,000 blocks), by avoiding SIFT operation, it saves ~10 days for processing.
4. Scalability of training and high speed testing for SMLSPM. Our experiments showthat the morphometric context representation in SMLSPM works well with linearSVMs, which dramatically improves the scalability of training and the speed oftesting. This is very important for the analyzing large cohort of whole slide images.
To study the impact of pooling strategies on the SMLSPM method, we also provide anexperimental comparison among max pooling and two other common pooling methods,which are defined as follows,
(7)
where the meaning of the notations are the same as in Equation 5. As shown in Table 7, themax pooling strategy outperforms the other two, which is probably due to its robustness tolocal translations.
The experiments above also indicate a slightly improved performance of SMLSPM overMKSPM; this is probably due to the following factors: i) sparse coding has much lessquantization errors than vector quantization; ii) the statistics derived by max pooling aremore robust to local translations compared with the average pooling in the histogramrepresentation.
5. Conclusion and Future WorkIn this paper, we proposed two spatial pyramid matching approaches based on morphometricfeatures and morphometric sparse code, respectively, for tissue image classification. Bymodeling the context of the morphometric information, these methods outperform traditionalones which were typically based on pixel- or patch-level features. The most encouragingresults of this paper are that, our methods are highly i) extensible to different tumor types; ii)robust in the presence of large amounts of technical and biological variations; iii) invariantto different segmentation algorithms; and iv) scalable to extremely large training and testingsample sizes. Due to i) the effectiveness of our morphometric context representations; andii) the important role of cellular context for the study of different cell assays, proposedmethods are suggested to be extendable to image classification tasks for different cellassays. Future work will be focused on accelerating the sparse coding through the sparseauto encoder [15], utilizing supervised dictionary learning [21] for possible improvement,and further validating our methods on other tissue types and other cell assays.
References1. Axelrod D, Miller N, Lickley H, Qian J, Christens-Barry W, Yuan Y, Fu Y, Chapman J. Effect of
quantitative nuclear features on recurrence of ductal carcinoma in situ (dcis) of breast. In CancerInformatics. 2008; 4:99–109. 2.
2. Bhagavatula R, Fickus M, Kelly W, Guo C, Ozolek J, Castro C, Kovacevic J. Automaticidentification and delineation of germ layer components in h&e stained images of teratomas derivedfrom human and nonhuman primate embryonic stem cells. ISBI. 2010:1041–1044. 2.
3. Boiman O, Shechtman E, Irani M. In defense of nearest-neighbor based image classification.Proceedings of the Conference on Computer Vision and Pattern Recognition. 2008:1–8. 2.
Chang et al. Page 7
Proc IEEE Comput Soc Conf Comput Vis Pattern Recognit. Author manuscript; available in PMC 2013 December 04.
NIH
-PA Author Manuscript
NIH
-PA Author Manuscript
NIH
-PA Author Manuscript
4. Bosch A, Zisserman A, Muñoz X. Scene classification using a hybrid generative/discriminativeapproach. IEEE Transactions on Pattern Analysis and Machine Intelligence. 30(4):712–727. Apr.2008. 2. [PubMed: 18276975]
5. Chang H, Fontenay G, Han J, Cong G, Baehner F, Gray J, Spellman P, Parvin B. Morphometricanalysis of TCGA Gliobastoma Multiforme. BMC Bioinformatics. 2011; 12(1) 4, 5.
6. Chang H, Loss L, Spellman P, Borowsky A, Parvin B. Batch-invariant nuclear segmentation inwhole mount histology sections. ISBI. 2012:856–859. 4, 5, 6.
7. Dalton L, Pinder S, Elston C, Ellis I, Page D, Dupont W, Blamey R. Histolgical gradings of breastcancer: linkage of patient outcome with level of pathologist agreements. Modern Pathology. 2000;13(7):730–735. 1. [PubMed: 10912931]
8. Demir C, Yener B. Automated cancer diagnosis based on histopathological images: A systematicsurvey. 2009 2.
9. Elad M, Aharon M. Image denoising via sparse and redundant representations over learneddictionaries. IEEE Transactions on Image Processing. 15(12):3736–3745. Dec. 2006. 2. [PubMed:17153947]
10. Everingham, M.; Van Gool, L.; Williams, CKI.; Winn, J.; Zisserman, A. The PASCAL VisualObject Classes Challenge 2012 (VOC2012) Results. http://www.pascal-network.org/challenges/VOC/voc2012/workshop/index.html. 2
11. Fan R-E, Chang K-W, Hsieh C-J, Wang X-R, Lin C-J. LIBLINEAR: A library for large linearclassification. Journal of Machine Learning Research. 2008; 9:1871–1874. 3, 4.
12. Grauman K, Darrell T. The pyramid match kernel: discriminative classification with sets of imagefeatures. Proceedings of the IEEE International Conference on Computer Vision. 2005; volume2:1458–1465. 3.
13. Gurcan M, Boucheron L, Can A, Madabhushi A, Rajpoot N, Bulent Y. Histopathological imageanalysis: a review. IEEE Transactions on Biomedical Engineering. 2009; 2:147–171. 2.
14. Huang C, Veillard A, Lomeine N, Racoceanu D, Roux L. Time efficient sparse analysis ofhistopathological whole slide images. Computerized medical imaging and graphics. 2011; 35(7–8):579–591. 2. [PubMed: 21145705]
15. Kavukcuoglu, K.; Ranzato, M.; LeCun, Y. Technical Report CBLL-TR-2008-12-01.Computational and Biological Learning Lab, Courant Institute, NYU; 2008. Fast inference insparse coding algorithms with applications to object recognition. 8
16. Kong J, Cooper L, Sharma A, Kurk T, Brat D, Saltz J. Texture based image recognition inmicroscopy images of diffuse gliomas with multi-class gentle boosting mechanism. ICASSAP.2010:457–460. 2.
17. Kothari S, Phan J, Osunkoya A, Wang M. Biological interpretation of morphological patterns inhistopathological whole slide images. ACM Conference on Bioinformatics, ComputationalBiology and Biomedicine. 2012 2, 8.
18. Lazebnik S, Schmid C, Ponce J. Beyond bags of features: Spatial pyramid matching forrecognizing natural scene categories. Proceedings of the Conference on Computer Vision andPattern Recognition. 2006:2169–2178. 1, 2, 3, 4, 6, 8.
19. Le Q, Han J, Gray J, Spellman P, Borowsky A, Parvin B. Learning invariant features from tumorsignature. ISBI. 2012:302–305. 2, 8.
20. Li, F-F.; Perona, P. Proceedings of the Conference on Computer Vision and Pattern Recognition.Washington, DC, USA: IEEE Computer Society; 2005. A bayesian hierarchical model for learningnatural scene categories; p. 524-531.2
21. Mairal J, Bach F, Ponce J, Sapiro G, Zisserman A. Supervised dictionary learning. NIPS. 2008 8.
22. Moosmann F, Triggs B, Jurie F. Randomized clustering forests for building fast and discriminativevisual vocabularies. NIPS. 2006 2.
23. Otsu N. A threshold selection method from gray-level histograms. IEEE Transactions on Systems,Man and Cybernetics. 1979; 9(1):62–66. 4.
24. Quelhas, P.; Monay, F.; Odobez, J-M.; Gatica-Perez, D.; Tuytelaars, T.; Van Gool, L. Proceedingsof the IEEE International Conference on Computer Vision, ICCV ’05. Washington, DC, USA:
Chang et al. Page 8
Proc IEEE Comput Soc Conf Comput Vis Pattern Recognit. Author manuscript; available in PMC 2013 December 04.
NIH
-PA Author Manuscript
NIH
-PA Author Manuscript
NIH
-PA Author Manuscript

IEEE Computer Society; 2005. Modeling scenes with local descriptors and latent aspects; p.883-890.2
25. Serre T, Wolf L, Poggio T. Object recognition with features inspired by visual cortex. Proceedingsof the Conference on Computer Vision and Pattern Recognition. 2005; volume 2:994–1000. 4.
26. Vedaldi A, Zisserman A. Efficient additive kernels via explicit feature maps. IEEE Transactions onPattern Analysis and Machine Intelligence. 2012; 34(3):480–492. 3. [PubMed: 21808094]
27. Wen Q, Chang H, Parvin B. A Delaunay triangulation approach for segmenting clumps of nuclei.ISBI. 2009:9–12. 4.
28. Yang J, Yu K, Gong Y, Huang T. Linear spatial pyramid matching using sparse coding for imageclassification. Proceedings of the Conference on Computer Vision and Pattern Recognition.2009:1794–1801. 1, 2, 3, 4, 6, 8.
29. Young RA, Lesperance RM. The gaussian derivative model for spatial-temporal vision. I. CorticalModel. Spatial Vision. 2001; 2001:3–4. 4.
Chang et al. Page 9
Proc IEEE Comput Soc Conf Comput Vis Pattern Recognit. Author manuscript; available in PMC 2013 December 04.
NIH
-PA Author Manuscript
NIH
-PA Author Manuscript
NIH
-PA Author Manuscript
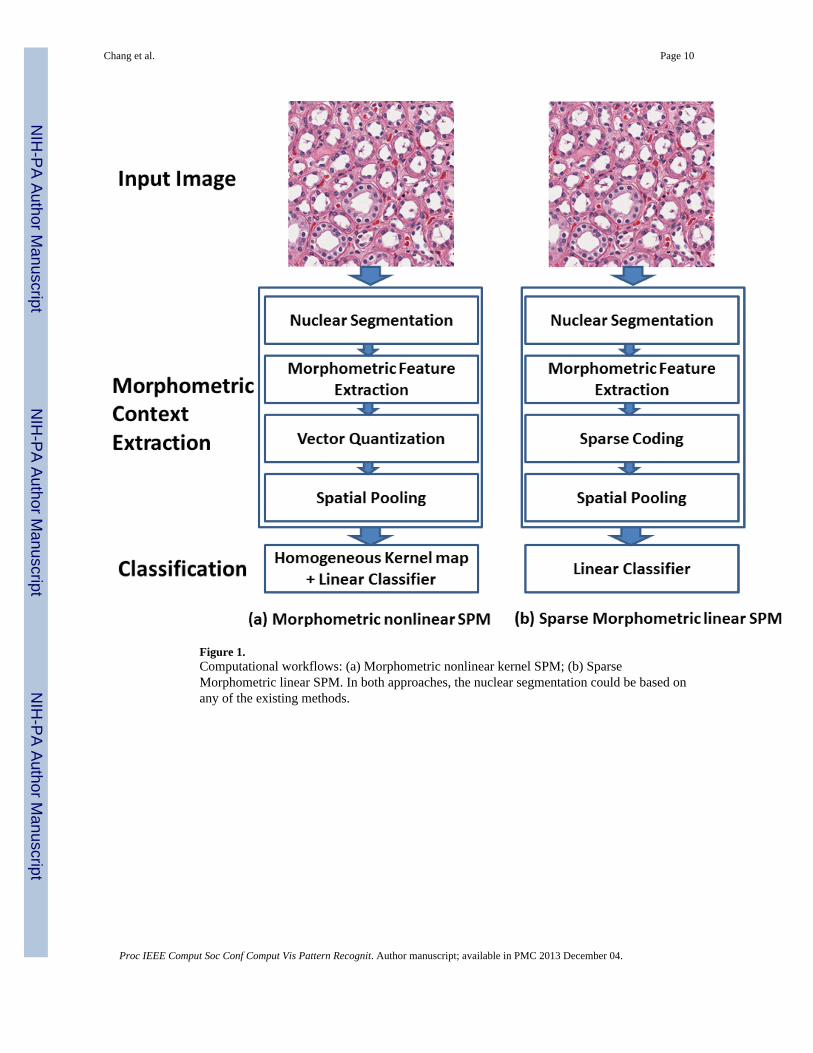
Figure 1.Computational workflows: (a) Morphometric nonlinear kernel SPM; (b) SparseMorphometric linear SPM. In both approaches, the nuclear segmentation could be based onany of the existing methods.
Chang et al. Page 10
Proc IEEE Comput Soc Conf Comput Vis Pattern Recognit. Author manuscript; available in PMC 2013 December 04.
NIH
-PA Author Manuscript
NIH
-PA Author Manuscript
NIH
-PA Author Manuscript
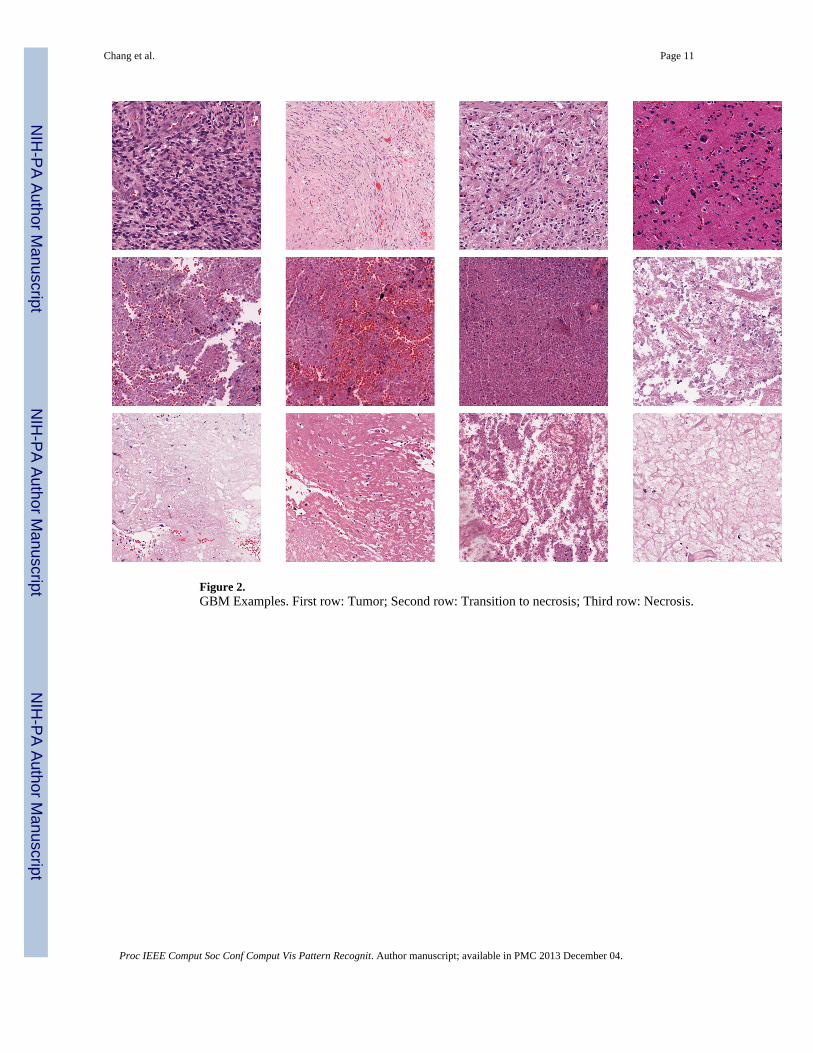
Figure 2.GBM Examples. First row: Tumor; Second row: Transition to necrosis; Third row: Necrosis.
Chang et al. Page 11
Proc IEEE Comput Soc Conf Comput Vis Pattern Recognit. Author manuscript; available in PMC 2013 December 04.
NIH
-PA Author Manuscript
NIH
-PA Author Manuscript
NIH
-PA Author Manuscript
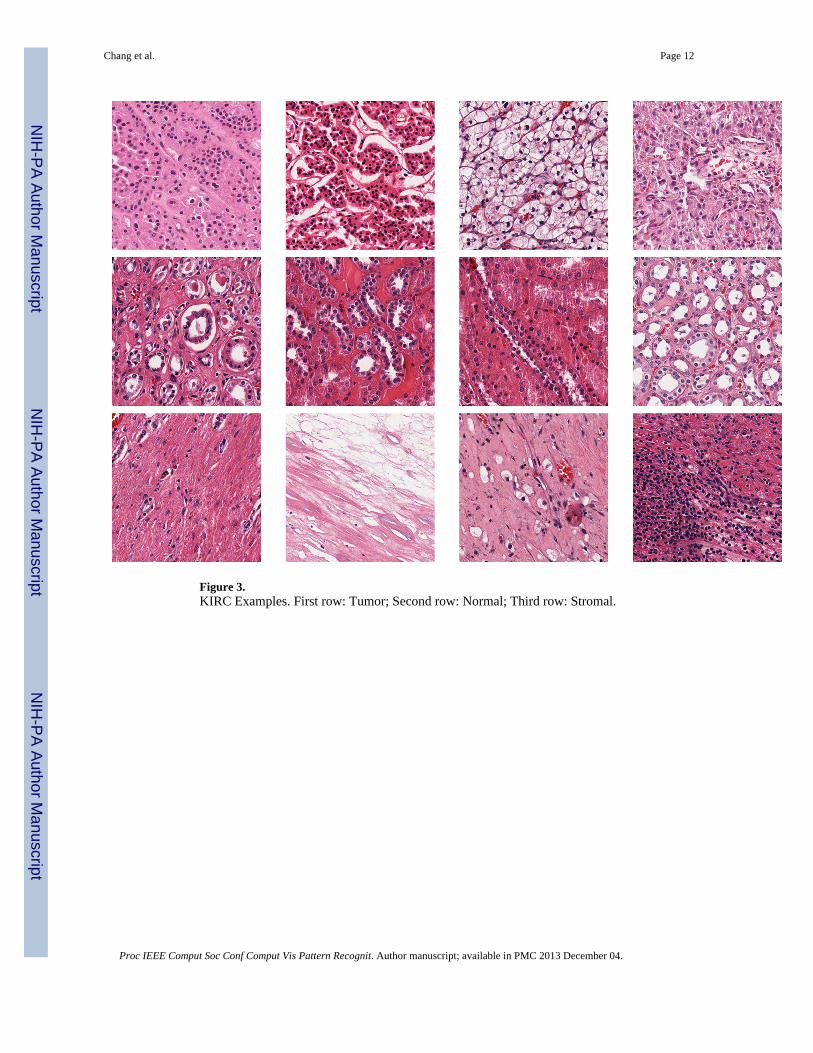
Figure 3.KIRC Examples. First row: Tumor; Second row: Normal; Third row: Stromal.
Chang et al. Page 12
Proc IEEE Comput Soc Conf Comput Vis Pattern Recognit. Author manuscript; available in PMC 2013 December 04.
NIH
-PA Author Manuscript
NIH
-PA Author Manuscript
NIH
-PA Author Manuscript

NIH
-PA Author Manuscript
NIH
-PA Author Manuscript
NIH
-PA Author Manuscript
Chang et al. Page 13
Table 1
Comparison of average segmentation performance among MRGC [6], SRCD [5], and OTGR.
Approach Precision Recall F-Measure
MRGC 0.75 0.85 0.797
SRCD 0.63 0.75 0.685
OTGR NA NA NA
Note: 1) the information above is quoted from [6]; 2) the OTGR performance is not listed due to the unavailability of the data used in [6], however,based on our experience with histological sections, simple thresholding methods typically generate less favorable results than sophisticated ones.
Proc IEEE Comput Soc Conf Comput Vis Pattern Recognit. Author manuscript; available in PMC 2013 December 04.
NIH
-PA Author Manuscript
NIH
-PA Author Manuscript
NIH
-PA Author Manuscript
Chang et al. Page 14
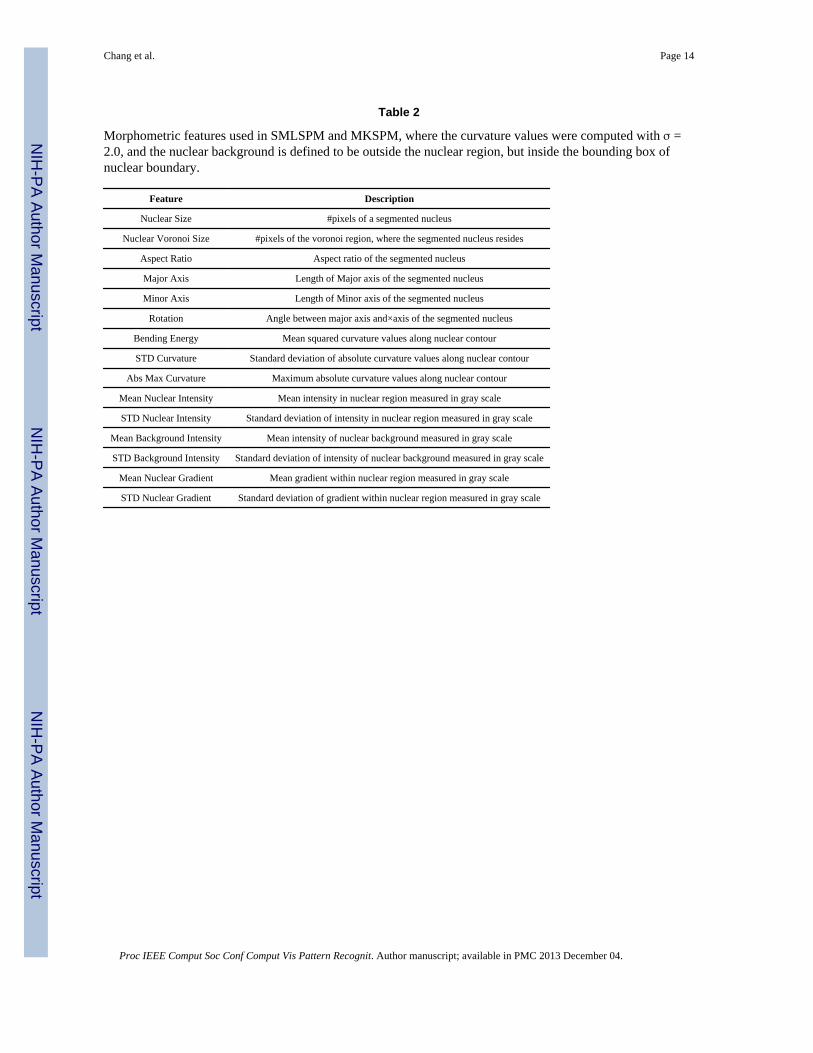
Table 2
Morphometric features used in SMLSPM and MKSPM, where the curvature values were computed with σ =2.0, and the nuclear background is defined to be outside the nuclear region, but inside the bounding box ofnuclear boundary.
Feature Description
Nuclear Size #pixels of a segmented nucleus
Nuclear Voronoi Size #pixels of the voronoi region, where the segmented nucleus resides
Aspect Ratio Aspect ratio of the segmented nucleus
Major Axis Length of Major axis of the segmented nucleus
Minor Axis Length of Minor axis of the segmented nucleus
Rotation Angle between major axis and×axis of the segmented nucleus
Bending Energy Mean squared curvature values along nuclear contour
STD Curvature Standard deviation of absolute curvature values along nuclear contour
Abs Max Curvature Maximum absolute curvature values along nuclear contour
Mean Nuclear Intensity Mean intensity in nuclear region measured in gray scale
STD Nuclear Intensity Standard deviation of intensity in nuclear region measured in gray scale
Mean Background Intensity Mean intensity of nuclear background measured in gray scale
STD Background Intensity Standard deviation of intensity of nuclear background measured in gray scale
Mean Nuclear Gradient Mean gradient within nuclear region measured in gray scale
STD Nuclear Gradient Standard deviation of gradient within nuclear region measured in gray scale
Proc IEEE Comput Soc Conf Comput Vis Pattern Recognit. Author manuscript; available in PMC 2013 December 04.

NIH
-PA Author Manuscript
NIH
-PA Author Manuscript
NIH
-PA Author Manuscript
Chang et al. Page 15
Table 3
Performance of different methods on the GBM dataset, where SMLSPM and MKSPM were evaluated basedon the segmentation method: MRGC [6].
Method DictionarySize=256 DictionarySize=512 DictionarySize=1024
160 training SMLSPM 92.35 ± 0.83 92.57 ± 0.91 92.91 ± 0.84
MKSPM 91.85 ± 0.98 91.95 ± 0.83 91.76 ± 0.97
ScSPM [28] 79.58 ± 0.61 81.29 ± 0.86 82.36 ± 1.10
KSPM [18] 85.00 ± 0.79 86.47 ± 0.55 86.81 ± 0.45
CTSPM 78.61 ± 1.33 78.71 ± 1.18 78.69 ± 0.81
80 training SMLSPM 90.82 ± 1.28 90.29 ± 0.68 91.08 ± 0.69
MKSPM 89.83 ± 1.15 89.78 ± 1.09 89.44 ± 1.20
ScSPM [28] 77.65 ± 1.43 78.31 ± 1.13 81.00 ± 0.98
KSPM [18] 83.81 ± 1.22 84.32 ± 0.67 84.49 ± 0.34
CTSPM 75.93 ± 1.18 76.06 ± 1.52 76.19 ± 1.33
40 training SMLSPM 88.05 ± 1.38 87.88 ± 1.04 88.54 ± 1.42
MKSPM 87.38 ± 1.38 87.06 ± 1.52 86.37 ± 1.73
ScSPM [28] 73.60 ± 1.68 75.58 ± 1.29 76.24 ± 3.05
KSPM [18] 80.54 ± 1.21 80.56 ± 1.24 80.46 ± 0.56
CTSPM 73.10 ± 1.51 72.90 ± 1.09 72.65 ± 1.41
Proc IEEE Comput Soc Conf Comput Vis Pattern Recognit. Author manuscript; available in PMC 2013 December 04.

NIH
-PA Author Manuscript
NIH
-PA Author Manuscript
NIH
-PA Author Manuscript
Chang et al. Page 16
Table 4
Performance of SMLSPM and MKSPM on the GBM dataset based on three different segmentationapproaches, where the number of training images per category was fixed to be 160, and the dictionary sizes forSMLSPM and MKSPM were fixed to be 1024 and 512, respectively, to achieve optimal performance.
MRGC SRCD OTGR
SMLSPM 92.91 ± 0.84 93.56 ± 0.91 91.03 ± 1.15
MKSPM 91.95 ± 0.83 93.33 ± 0.90 90.94 ± 0.87
Proc IEEE Comput Soc Conf Comput Vis Pattern Recognit. Author manuscript; available in PMC 2013 December 04.
NIH
-PA Author Manuscript
NIH
-PA Author Manuscript
NIH
-PA Author Manuscript
Chang et al. Page 17
Table 5
Performance of different methods on the KIRC dataset, where SMLSPM and MKSPM were evaluated basedon the segmentation mehtod: MRGC [6].
Method DictionarySize=256 DictionarySize=512 DictionarySize=1024
280 training SMLSPM 98.15 ± 0.46 98.50 ± 0.42 98.21 ± 0.44
MKSPM 97.37 ± 0.49 97.34 ± 0.48 97.22 ± 0.50
ScSPM [28] 94.52 ± 0.44 96.37 ± 0.45 96.81 ± 0.50
KSPM [18] 93.55 ± 0.31 93.76 ± 0.27 93.90 ± 0.19
CTSPM 87.45 ± 0.59 87.95 ± 0.49 88.53 ± 0.49
140 training SMLSPM 97.40 ± 0.50 97.98 ± 0.35 97.35 ± 0.48
MKSPM 96.56 ± 0.53 96.54 ± 0.50 96.41 ± 0.56
ScSPM [28] 93.46 ± 0.55 95.68 ± 0.36 96.76 ± 0.63
KSPM [18] 92.50 ± 1.12 93.06 ± 0.82 93.26 ± 0.68
CTSPM 86.55 ± 0.99 86.40 ± 0.54 86.49 ± 0.58
70 training SMLSPM 96.20 ± 0.85 96.37 ± 0.85 96.19 ± 0.62
MKSPM 95.62 ± 0.62 95.47 ± 0.71 95.27 ± 0.72
ScSPM [28] 91.93 ± 1.00 93.67 ± 0.72 94.86 ± 0.86
KSPM [18] 90.78 ± 0.98 91.34 ± 1.13 91.59 ± 0.97
CTSPM 84.76 ± 1.32 84.29 ± 1.53 83.71 ± 1.42
Proc IEEE Comput Soc Conf Comput Vis Pattern Recognit. Author manuscript; available in PMC 2013 December 04.

NIH
-PA Author Manuscript
NIH
-PA Author Manuscript
NIH
-PA Author Manuscript
Chang et al. Page 18
Table 6
Performance of SMLSPM and MKSPM on the KIRC dataset based on three different segmentationapproaches, where the number of training images per category was fixed to be 280, and the dictionary sizes forboth SMLSPM and MKSPM were fixed to be 512, to achieve the optimal performance.
MRGC SRCD OTGR
SMLSPM 98.50 ± 0.42 98.30 ± 0.34 97.66 ± 0.49
MKSPM 97.34 ± 0.48 97.66 ± 0.45 95.90 ± 0.54
Proc IEEE Comput Soc Conf Comput Vis Pattern Recognit. Author manuscript; available in PMC 2013 December 04.

NIH
-PA Author Manuscript
NIH
-PA Author Manuscript
NIH
-PA Author Manuscript
Chang et al. Page 19
Table 7
Comparison of performance for SMLSPM using different pooling strategies on the GBM and KIRC datasets.For GBM, the number of training images per category was fixed to be 160, and the dictionary size was fixedto be 1024; for KIRC, the number of training images per category was fixed to be 280, and the dictionary sizewas fixed to be 512.
Sqrt Abs Max
GBM 92.85 ± 0.94 90.90 ± 1.11 92.91 ± 0.84
KIRC 97.60 ± 0.49 97.49 ± 0.38 98.50 ± 0.42
Proc IEEE Comput Soc Conf Comput Vis Pattern Recognit. Author manuscript; available in PMC 2013 December 04.